abundances in photoionized nebulae of the local …maciel/research/articles/art167.pdf · and...
TRANSCRIPT

Revista Mexicana de Astronomıa y Astrofısica, 53, 1–16 (2017)
ABUNDANCES IN PHOTOIONIZED NEBULAE OF THE LOCAL GROUP
AND NUCLEOSYNTHESIS OF INTERMEDIATE MASS STARS
W. J. Maciel,1 R. D. D. Costa,1 and O. Cavichia2
Received December 13 2016; accepted January 27 2017
RESUMEN
Las nebulosas fotoionizadas, incluyendo regiones HII y nebulosas planetarias,son excelentes laboratorios para investigar la nucleosıntesis y la evolucion quımicade varios elementos, en nuestra galaxia y en galaxias del Grupo Local. En este tra-bajo: (i) comparamos las abundancias en regiones HII y nebulosas planetarias parainvestigar las diferencias que se derivan de las edades y el origen de estos objetos;(ii) comparamos la evolucion quımica en distintos sistemas, como la Vıa Lactea, lasNubes de Magallanes y otras galaxias del Grupo Local; (iii) investigamos que tantola contribucion de las estrellas progenitoras a la nucleosıntesis afecta las abundan-cias observadas en las nebulosas planetarias, lo cual constrine la nucleosıntesis deestrellas de masa intermedia. Mostramos que todos los objetos estudiados presentantendencias similares en cuanto a las correlaciones independientes de las distancias, yencontramos que pueden definirse lımites a la produccion de He y N en las estrellasprogenitoras de las nebulosas planetarias.
ABSTRACT
Photoionized nebulae, comprising HII regions and planetary nebulae, are ex-cellent laboratories to investigate the nucleosynthesis and chemical evolution ofseveral elements in the Galaxy and other galaxies of the Local Group. Our purposein this investigation is threefold: (i) compare the abundances of HII regions andplanetary nebulae in each system in order to investigate the differences derived fromthe age and origin of these objects, (ii) compare the chemical evolution in differ-ent systems, such as the Milky Way, the Magellanic Clouds, and other galaxies ofthe Local Group, and (iii) investigate to what extent the nucleosynthesis contribu-tions from the progenitor stars affect the observed abundances in planetary nebulae,which constrains the nucleosynthesis of intermediate mass stars. We show that allobjects in the samples present similar trends concerning distance-independent cor-relations, and some constraints can be defined on the production of He and N bythe PN progenitor stars.
Key Words: galaxies: abundances — Galaxy: disk — ISM: abundances — plane-tary nebulae: general
1. INTRODUCTION
Planetary nebulae (PN) have strong emissionlines of H, He, O, N, Ne, S, and Ar, including for-bidden lines and recombination lines. The analysisof these lines gives abundances accurate to about0.2 to 0.3 dex. The abundances include elementsthat are probably not significantly produced by theprogenitor stars (O, S, Ne, Ar), and therefore con-
1Instituto de Astronomia, Geofısica e Ciencias At-mosfericas, Universidade de Sao Paulo, Brazil.
2Instituto de Fısica e Quımica, Universidade Federal deItajuba, Brazil.
tribute to the study of the chemical evolution of thehost galaxies. The abundances of these elements inplanetary nebulae are not expected to be affected ina signficant way by the evolution of their progeni-tor stars. In fact, the average abundances of theseelements are not very different from the observedabundances in HII regions. The same is true for thecorrelations of the ratios Ne/H, Ne/O, etc. with themetallicity, as measured by the O/H ratio. There-fore, the measured abundances of these elements inPN reflect the interstellar abundances at the time the
1
2 MACIEL, COSTA & CAVICHIA
progenitor stars were formed, and can be comparedwith the abundances of red giants, AGB stars, andyounger objects, such as HII regions and Blue Com-pact Galaxies (BCG), provided the age-metalliciticyrelation and the presence of abundance gradients,both radial and vertical, are taken into account.
Planetary nebulae also provide accurate abun-dances of some elements that are produced by theprogenitor stars (He, N, C), so that the analysisof these abundances and their distance independentcorrelations can be used to test nucleosynthesis pre-dictions of theoretical models for intermediate massstars.
Some of these elements are difficult to study instars, and are better observed in photoionized nebu-lae. In fact, in recent years there has been an impor-tant advance in the determination of accurate abun-dances in PN and in HII regions, both in the MilkyWay and in several external galaxies, particularly inthe Local Group. Blue Compact Galaxies (BCG)and Emission Line Galaxies (ELG) can also be in-cluded as low metallicity HII regions, as we will see inthe following sections. In this work, we consider theabundances of several chemical elements in PN basedon our own results and on some recent data from theliterature, and compare these results with the abun-dances of HII regions, Blue Compact Galaxies, andEmission Line Galaxies both in the Galaxy and inother objects of the Local Group. Our purpose inthis investigation is threefold: (i) compare the abun-dances of HII regions and PN in each system in orderto investigate the differences derived from the ageand origin of these objects, (ii) compare the chemi-cal evolution in different systems, such as the MilkyWay, the Magellanic Clouds, and other galaxies ofthe Local Group, and (iii) investigate to what extentthe nucleosynthesis contributions from the progeni-tor stars affect the observed abundances in planetarynebulae, which constrains the nucleosynthesis of in-termediate mass stars.
2. THE DATA
The data used in this investigation include a largesample of PN and HII regions in the following galax-ies: The Milky Way (MW), the Large MagellanicCloud (LMC), the Small Magellanic Cloud (SMC),M31, M32, M33, M51, M81, M101, NGC 185,NGC 205, NGC 300, NGC 628, NGC 3109, and theSextans galaxy. Typical uncertainties in the abun-dances are 0.2 to 0.3 dex for PN and 0.1 to 0.2 dex forHII regions, especially for the elements with largerabundances, such as oxygen and nitrogen. The totalPN sample includes over 1300 objects, while the HII
region sample has over 900 objects, so that a reason-ably large sample of Local Group objects is consid-ered, amounting to over 2200 photoionized nebulae.Although not a complete sample, it is large enoughto compensate for the inevitable degree of inhomo-geneity, so that some interesting conclusions on thechemical evolution of the systems considered can beobtained. The data sources are partially listed byMaciel et al. (2014), with the addition of some re-cent data as discussed below.
New data on the chemical abundances of plan-etary nebulae (PN) in different systems have beenobtained by our group. This sample is hereafterreferred to as the IAG sample, and has importantconsequences for the nucleosynthesis of the PN pro-genitor stars and for the chemical evolution of theGalaxy (see for example Idiart et al. 2007, Costaet al. 2008, Maciel et al. 2009, 2010a, 2010b, Ma-ciel & Costa 2009, Cavichia et al. 2010, 2011, 2017).These systems include the solar neighbourhood, thegalactic disk, the galactic bulge and the MagellanicClouds. Abundances of the main chemical elementshave been determined, namely, He, N, O, Ne, S andAr, and the derived abundances are expected to becorrect to 0.2 to 0.3 dex on average. Most PN abun-dances considered here have been derived by theanalysis of forbidden lines with the use of ionizationcorrection factors (ICFs), and the reader is referredto the papers cited above for details on the adoptedprocedures.
Apart from our own data, we have consideredsome recent abundance determinations from the lit-erature, particularly from sources using a proceduresimilar to that of our group, so that a direct com-parison can be made for the objects in common.
Girard et al. (2007) analyzed a sample of 48galactic PN with [WR] central stars, comprising[WC], [WO] and wels (weak emission line stars). Inagreement with their own conclusions, we find noimportant differences between these objects and the“normal” PN, at least concerning the chemical abun-dances of the elements considered.
In a series of papers, Henry and collaborators(2000, 2004, 2010, 2012) and Milingo et al. (2010),established accurate abundances for a large sampleof galactic PN, comprising objects in the galacticdisk and anticenter, forming an extremely homoge-neous sample. The methods used to determine theabundances were similar to ours, so that it is possi-ble to compare the results of our group with thesedata, especially in view of our intended comparisonwith Local Group objects. Particularly importanthere is the discussion on the “sulphur anomaly”, as

ABUNDANCES IN PHOTOIONIZED NEBULAE 3
we will see in detail in the following section. We havealso included the results of the very recent surveysby Garcıa-Hernandez & Gorny (2014) and Delgado-Inglada et al. (2015), based on Spitzer data. Com-parisons of infrared data with optical spectroscopicdata produce a particularly accurate set of abun-dances, as also discussed by Garcıa-Hernandez etal. (2016). These investigations (see also Delgado-Inglada et al. 2014) have considerably improved thedetermination of the ICFs, which are an essentialpart of the abundance determinations in PN fromforbidden lines. The uncertainties are then, in prin-ciple, smaller than in previous investigations, but infact the derived abundances are comparable, so thatwe feel safe to include these results in the presentinvestigation.
Apart from our own data on the MagellanicClouds, we have included samples from Stasinska etal. (1998, SRM) and Leisy & Dennefeld (2006, LD).In agreement with some conclusions by Henry et al.(2010), part of the results by Leisy & Dennefeld(2006) are upper limits or overestimates, and havenot been included in our sample. Our results canthen be considered as an update and improvementover the results by Stasinska et al. (1998), where anattempt was made to compare the PN populationin five galaxies: Milky Way, LMC, SMC, M31, andM32.
Abundances of a large sample of PN in theGalaxy (disk, bulge, and halo) and in the Magel-lanic Clouds were analyzed by Milanova & Kholty-gin (2009). The similarity of the elemental abun-dances in these objects was pointed out, in agree-ment with our present results, taking into accountthe lower metallicities of the LMC and SMC. Theaverage uncertainties in these abundance determina-tions are similar as in our data, typically of 0.1 dexfor helium and 0.2 dex for the other elements. Fi-nally, we have also used the compilation of PN databy Chiappini et al. (2009), who included objects inthe galactic bulge and disk, as well as in the LargeMagellanic Cloud. This is a particularly large sam-ple, so that we could use it as a check of the consisi-tency of the abundances of the sources considered,in order to minimize the effects of the inhomogeneityof these sources.
The comparison samples of HII regions for theMilky Way and Magellanic Clouds are from Affler-bach et al. (1997), Guseva et al. (2007), Rudolphet al. (2006), Tsamis et al. (2003), and Delgado-Inglada et al. (2015). We have preferably adoptedabundances determined from detailed electron tem-peratures, which are usually more accurate than the
results from the strong line method. Some recent re-sults by Reyes et al. (2015) for both clouds have alsobeen taken into account. Additional data for HII re-gions in the Magellanic Clouds come from Peimbertet al. (2000), who presented chemical abundancesfor the HII region NGC 346 in the SMC based onspectrophotometric data obtained at the CTIO 4mtelescope. We have here adopted the results for thepreferred value of the fluctuation temperature pa-rameter t2, as given in their table 9. Also, Pena-Guerrero et al. (2012) presented chemical abun-dances of two HII regions in the SMC, NGC 456and NGC 460, based on long-slit spectrophotometrytaking into account the presence of thermal inhomo-geneities. We have adopted here the average of thepositions reported in the paper. Selier & Heydari-Malayeri (2012) presented chemical abundances ofHe, O, N, and Ne for two outer HII regions in theMagellanic Clouds, LMC N191 and SMC N77. Thedata were obtained by optical imaging and spectro-scopic ESO NTT observations along with archivedata. Finally, by combining optical and infrareddata, Vermeij & van der Hulst (2002) determinedelement abundances for a sample of HII regions inthe Large and Small Magellanic Cloud. We haveconsidered 15 HII regions from their sample, withabundances of He, O, N, Ne, S, and Ar.
We have also included data on PN and HII re-gions in several external galaxies apart from theMagellanic Clouds, in order to compare them withthe local data. Of course, as pointed out by Richerand McCall (2016), PN that are far away are selectedamong the brightest objects, so that it remains to beinvestigated whether or not these objects are repre-sentative of the PN population.
Kwitter et al. (2012) analyzed a sample of 16 PNin the outer disk of M31, for which they could deriveelectron temperatures and abundances. As we willsee in the next section, our results agree with theirconclusions, in the sense that the M31 PN displaythe same correlations as type II PN in the Galaxy.These results have been complemented with data on2 PN by Balick et al. (2013). HII regions in this ob-ject have been analyzed by Zurita & Bresolin (2012),Sanders et al. (2012) and Esteban et al. (2009), usu-ally by the direct method involving the determina-tion of the electron temperature.
Richer & McCall (2008) studied a sample of14 PN in M32, 4 PN in NGC 185 and 10 PN inNGC 205. Some enrichment was observed especiallyfor N in the bright PN, suggesting that the main se-quence mass of the PN progenitors was about 1.5M⊙
or less.

4 MACIEL, COSTA & CAVICHIA
TABLE 1
DATA FOR PLANETARY NEBULAE
System Number Reference
1 MW disk 230 IAG
2 MW bulge 179 IAG
3 MW disk 22 Chiappini et al. (2009)
4 MW bulge 88 Chiappini et al. (2009)
5 MW 19 Girard et al. (2007)
6 MW 4 Henry et al. (2004)
7 MW 20 Henry et al. (2010)
8 MW 2 Milingo et al. (2010)
9 MW 6 Milanova & Kholtygin (2009)
10 MW 44 Garcıa-Hernandez & Gorny (2014)
11 LMC 251 IAG, SRM, LD
12 LMC 110 Chiappini et al. (2009)
13 LMC 14 Milanova & Kholtygin (2009)
14 SMC 129 IAG, SRM, LD
15 SMC 7 Milanova & Kholtygin (2009)
16 M31 1 Balick et al. (2013)
17 M31 16 Kwitter et al. (2012)
18 M32 14 Richer & McCall (2008)
19 M33 16 Bresolin et al. (2010)
20 M33 93 Magrini et al. (2009)
21 NGC 185 5 Richer & McCall (2008)
22 NGC 205 10 Richer & McCall (2008)
23 NGC 300 25 Stasinska et al. (2013)
24 NGC 3109 7 Pena et al. (2007)
25 Sextans 6 Magrini et al. (2005)
For M33, Bresolin et al. (2010) obtained accu-rate abundances for 16 PN and 3 HII regions nearthe central parts of the galaxy. They found trendssimilar to those shown in section 3, including a com-parison with BCG/ELG from Izotov et al. (2006).For this object, data from Magrini et al. (2009) for alarge sample of PN were also considered. Also for HIIregions, Magrini et al. (2007) presented data for 14objects; two more objects come from the sample byEsteban et al. (2009), while Rosolowsky & Simon(2008) analyzed a larger sample of 60 HII regionswith known oxygen abundances.
For M51, Bresolin et al (2004) presented a sam-ple of 10 HII regions, and recent results by Croxallet al. (2015) have been taken into account. For M81we have used HII region data by Stanghellini et al.(2014), and for M101 the HII region data by Kenni-cutt et al. (2003) and Esteban et al. (2009).
For NGC 300, Stasinska et al. (2013) analyzed asample of PN and compact HII regions, and a similarsample of HII regions was taken from Bresolin et al.(2009) for this galaxy. For NGC 628 we have usedrecent data for a large sample of HII regions by Berget al. (2015).
TABLE 2
DATA FOR HII REGIONS, BCG, AND ELG
System Number Reference
1 MW 34 Afflerbach et al. (1997)
2 MW 53 Guseva et al. (2007)
3 MW 123 Rudolph et al. (2006)
4 MW 2 Tsamis et al. (2003)
5 MW 4 Delgado-Inglada et al. (2015)
6 MC 3 Tsamis et al. (2003)
7 MC 12 Reyes et al. (2015)
8 MC 1 Peimbert et al. (2000)
9 MC 2 Pena-Guerrero et al. (2012)
10 MC 2 Selier & Heydari-Malayeri (2012)
11 MC 15 Vermeij & van der Hulst (2002)
12 M31 1 Esteban et al. (2009)
13 M31 52 Sanders et al. (2012)
14 M31 9 Zurita & Bresolin (2012)
15 M33 3 Bresolin et al. (2010)
16 M33 2 Esteban et al. (2009)
17 M33 14 Magrini et al. (2007)
18 M33 60 Rosolowsky & Simon (2008)
19 M51 10 Bresolin et al. (2004)
20 M51 29 Croxall et al. (2015)
21 M81 12 Stanghellini et al. (2014)
22 M101 4 Esteban et al. (2009)
23 M101 20 Kennicutt et al. (2003)
24 NGC 300 28 Bresolin et al. (2009)
25 NGC 300 9 Stasinska et al. (2013)
26 NGC 628 45 Berg et al. (2015)
27 NGC 3109 10 Pena et al. (2007)
28 Sextans 17 Magrini et al. (2005)
29 BCG 54 Izotov & Thuan (1999)
30 ELG 306 Izotov et al. (2006)
In the case of NGC 3109, Pena et al. (2007) stud-ied a sample of PN and HII regions and concludedthat the O and Ne abundances could be affectedby the evolution of the PN central stars, althoughthe size of the sample and the intrinsic uncertaintiesmade this conclusion controversial. Finally, for theSextans A and B galaxies, we used data by Magriniet al. (2005), who analyzed samples of PN and HIIregions in these objects.
We also included in our analysis a sample of BlueCompact Galaxies and Emission Line Galaxies fromIzotov and Thuan (1999) and Izotov et al. (2006), asthey are equivalent of HII regions at relatively lowmetallicities (cf. Bresolin et al. 2010), as will beconfirmed in the next section. These objects are es-sentially giant metal-poor HII regions, and fit nicelyin the correlations obtained, but concentrate towardslower metallicities, log (O/H) + 12 ≤ 8.2.
ABUNDANCES IN PHOTOIONIZED NEBULAE 5
TABLE 3
TOTAL SAMPLES
PLANETARY NEBULAE Number HII REGIONS Number
Milky Way Disk 347 Milky Way 216
Milky Way Bulge 267 Magellanic Clouds 35
Milky Way 614 Other Galaxies 325
Magellanic Clouds 511 BCG, ELG 360
Total External Galaxies 704 Total External Galaxies 720
TOTAL 1318 TOTAL 936
Tables 1 and 2 summarize the data for PN andHII regions, respectively, and Table 3 shows the totalnumber of objects in each class.
3. RESULTS
3.1. Elements not produced by the PN progenitor
stars
The abundances of the elements O, Ne, S, and Arare probably not significantly affected by the evolu-tion of the PN progenitor stars, and the correspond-ing distance-independent correlations are well deter-mined. The measured abundances therefore reflectthe interstellar abundances at the time the progen-itor stars were born and can be compared with thedata for the younger objects, such as HII regions.
3.1.1. Oxygen
Oxygen can be used as a metallicity proxy, andan accurate relation between O and Fe can be de-termined (see for example Ramırez et al. 2013).This is important, since in photoionized nebulae Feis mostly locked up in grains. The average slope ofthe Fe - O correlation is approximately of 1.11 forthe thin disk and 1.31 for the thick disk.
Figure 1 shows histograms of the oxygen abun-dance O/H for planetary nebulae and HII regionsin three representative cases: The Mllky Way (topfigures), the Milky Way and the Magellanic Clouds(middle figures) and all objects considered here,namely the Milky Way, the Magellanic Cloudsand the remaining external galaxies (bottom fig-ures). It can be seen that both PN and HII re-gions have similar distributions, peaking aroundlog (O/H) + 12 = 8.4 to 8.8, although the HII re-gion distributions are generally broader than inthe case of planetary nebulae. Also, it can benoted that a larger fraction of HII regions havelog (O/H) + 12 ≥ 9, which reflects the fact that these
younger objects are formed by more enriched mate-rial. Similar plots can be obtained for Ne, S, and Ar,although the samples are smaller than in the case ofoxygen, since the abundances of these elements areusually more difficult to obtain. For the S/H ratiosimilar peaks are also observed for PN and HII re-gions in the three cases considered, but for Ne/H andAr/H the total number of HII regions is relativelysmall, so that a comparison is difficult. An excep-tion is the Ar/H histograms for all objects, which issimilar to the results of Figure 1 (bottom).
In this paper we concentrate on distance-independent correlations, to avoid distance deter-mination problems, which affect processes such asthe abundance gradients observed in the Milky Wayand other spirals. The main results are shownin Figures 2 to 10 for neon, sulphur, and argon,as functions of the oxygen abundance by numberof atomos, O/H. The top figures show the abun-dances of these elements relative to hydrogen (Ne/H,S/H, and Ar/H), while the bottom figures showthe abundances relative to oxygen (Ne/O, S/O, andAr/O). In these figures, PN are always representedby empty symbols (squares and circles), while HIIregions, BCG, and ELG are represented by trianglesor crosses.
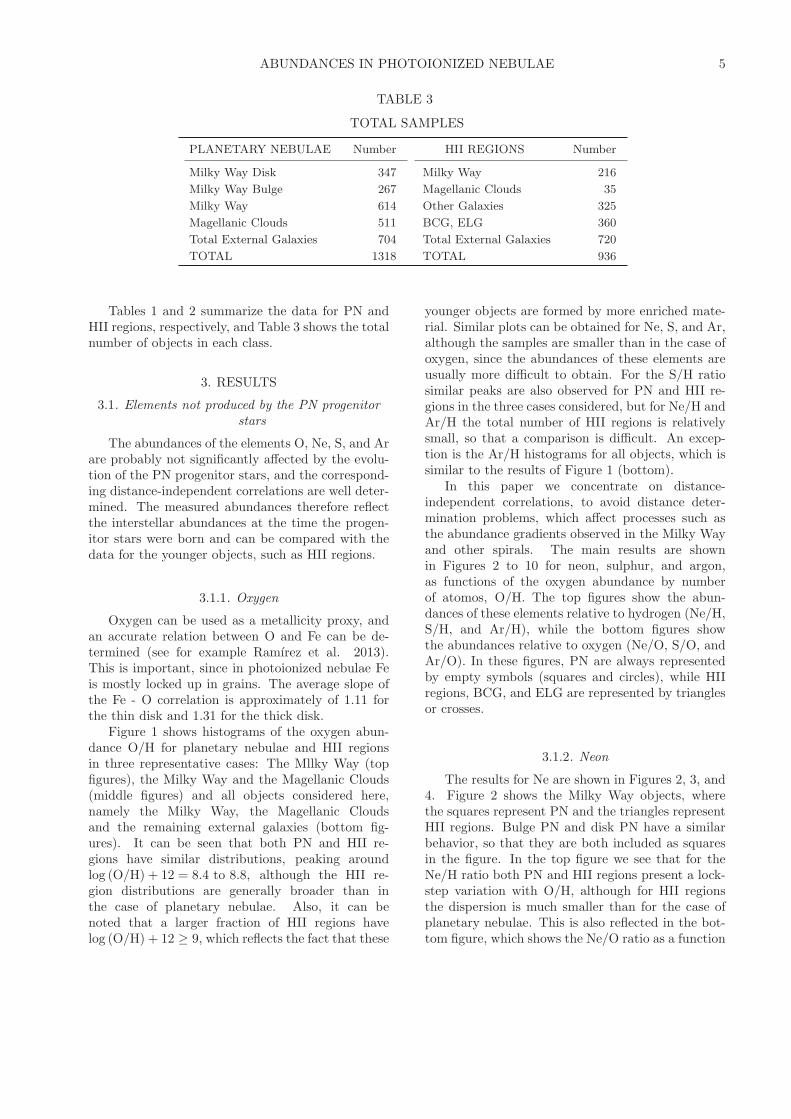
3.1.2. Neon
The results for Ne are shown in Figures 2, 3, and4. Figure 2 shows the Milky Way objects, wherethe squares represent PN and the triangles representHII regions. Bulge PN and disk PN have a similarbehavior, so that they are both included as squaresin the figure. In the top figure we see that for theNe/H ratio both PN and HII regions present a lock-step variation with O/H, although for HII regionsthe dispersion is much smaller than for the case ofplanetary nebulae. This is also reflected in the bot-tom figure, which shows the Ne/O ratio as a function

6 MACIEL, COSTA & CAVICHIA
Fig. 1. Histograms of the O/H abundances in PN and HII regions. top: Milky Way; middle: Milky Way and MagellanicClouds; bottom: Milky Way and all external galaxies.
of O/H, indicating that the Ne/O ratio is essentiallyconstant with a higher dispersion for planetary neb-ulae. The estimated dispersions are given in Table 4for the correlations of the abundances relative to hy-drogen as functions of the O/H ratio.
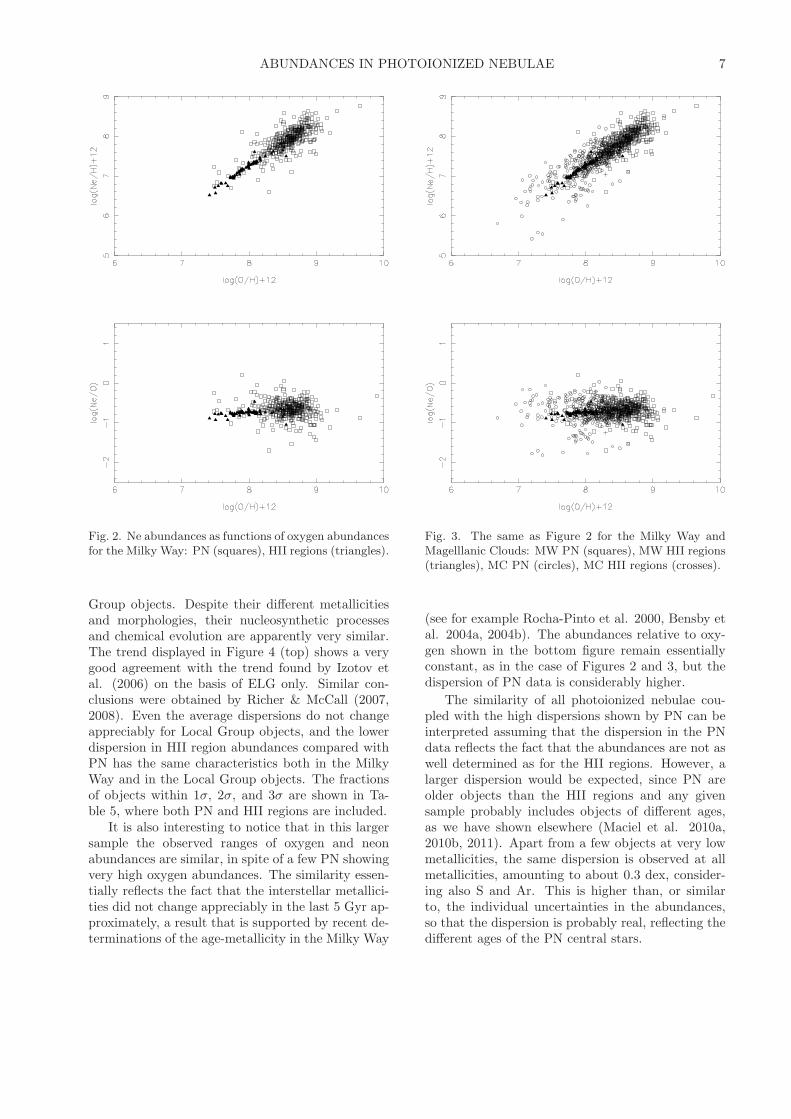
Data for the Magellanic Clouds are included inFigure 3, where the squares are again PN in theMilky Way, the circles are PN in the MagellanicClouds, the triangles represent HII regions in theMilky Way and the crosses are HII regions in theMagellanic Clouds. There is a well known metal-licity difference between the LMC and SMC in thesense that the LMC has a higher average metallicitythan the SMC, which is not shown in the figure, asboth Clouds are represented by the same symbols.We can see that the same trend of Figure 2 is alsoapparent here, in the sense that the Ne abundances
vary in lockstep with oxygen. A similar dispersion isobserved for PN in both Figures 2 and 3. The MCdata show a rather smooth transition to the Galaxytowards lower metallicities, which is especially no-ticeable in the PN data, where the separation of theMW PN and MC PN is more evident. The Mag-ellanic Cloud PN are displaced towards lower Neabundances, which reflects the lower metallicity ofthe Clouds relative to the Milky Way.
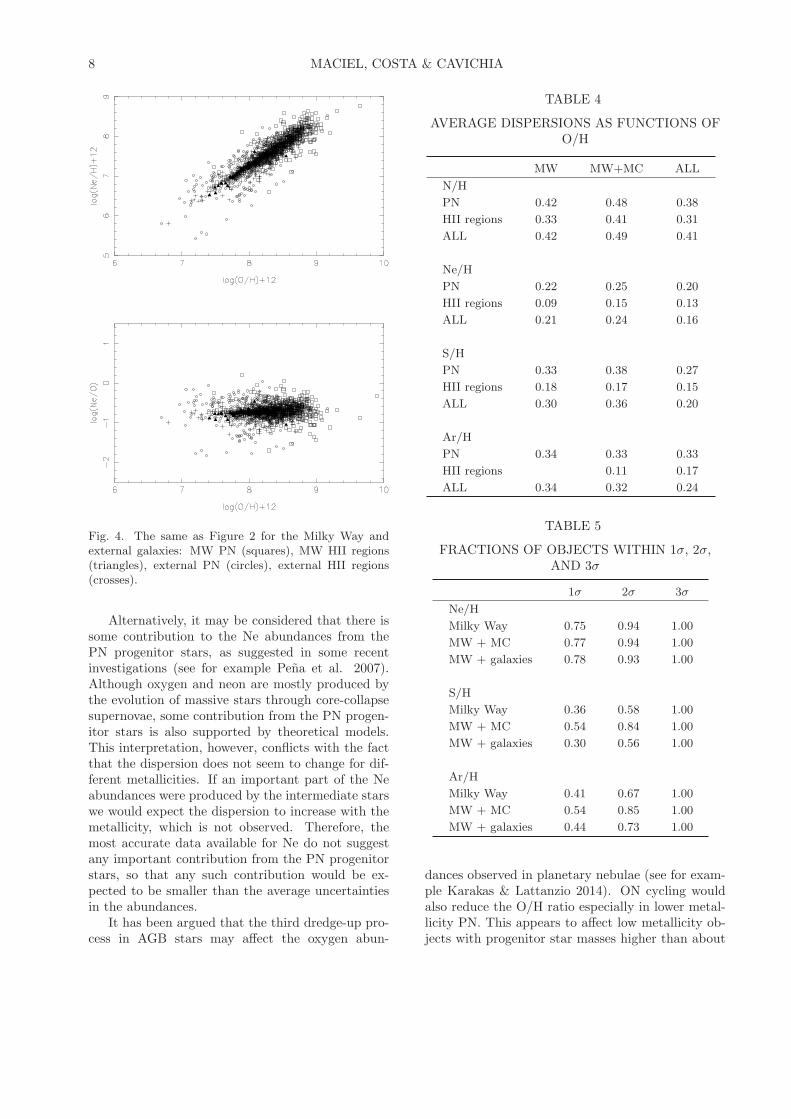
Data for the remaining external galaxies, com-prising all galaxies in the Local Group, BCG, andELG, are included in Figure 4. Here again MW PNare shown as squares, PN in external galaxies areshown as circles, MW HII regions are representedby triangles, and external HII regions are shown ascrosses. It is remarkable that the same behaviorobserved in the Galaxy also holds in other Local
ABUNDANCES IN PHOTOIONIZED NEBULAE 7
Fig. 2. Ne abundances as functions of oxygen abundancesfor the Milky Way: PN (squares), HII regions (triangles).
Group objects. Despite their different metallicitiesand morphologies, their nucleosynthetic processesand chemical evolution are apparently very similar.The trend displayed in Figure 4 (top) shows a verygood agreement with the trend found by Izotov etal. (2006) on the basis of ELG only. Similar con-clusions were obtained by Richer & McCall (2007,2008). Even the average dispersions do not changeappreciably for Local Group objects, and the lowerdispersion in HII region abundances compared withPN has the same characteristics both in the MilkyWay and in the Local Group objects. The fractionsof objects within 1σ, 2σ, and 3σ are shown in Ta-ble 5, where both PN and HII regions are included.
It is also interesting to notice that in this largersample the observed ranges of oxygen and neonabundances are similar, in spite of a few PN showingvery high oxygen abundances. The similarity essen-tially reflects the fact that the interstellar metallici-ties did not change appreciably in the last 5 Gyr ap-proximately, a result that is supported by recent de-terminations of the age-metallicity in the Milky Way
Fig. 3. The same as Figure 2 for the Milky Way andMagelllanic Clouds: MW PN (squares), MW HII regions(triangles), MC PN (circles), MC HII regions (crosses).
(see for example Rocha-Pinto et al. 2000, Bensby etal. 2004a, 2004b). The abundances relative to oxy-gen shown in the bottom figure remain essentiallyconstant, as in the case of Figures 2 and 3, but thedispersion of PN data is considerably higher.
The similarity of all photoionized nebulae cou-pled with the high dispersions shown by PN can beinterpreted assuming that the dispersion in the PNdata reflects the fact that the abundances are not aswell determined as for the HII regions. However, alarger dispersion would be expected, since PN areolder objects than the HII regions and any givensample probably includes objects of different ages,as we have shown elsewhere (Maciel et al. 2010a,2010b, 2011). Apart from a few objects at very lowmetallicities, the same dispersion is observed at allmetallicities, amounting to about 0.3 dex, consider-ing also S and Ar. This is higher than, or similarto, the individual uncertainties in the abundances,so that the dispersion is probably real, reflecting thedifferent ages of the PN central stars.
8 MACIEL, COSTA & CAVICHIA
Fig. 4. The same as Figure 2 for the Milky Way andexternal galaxies: MW PN (squares), MW HII regions(triangles), external PN (circles), external HII regions(crosses).
Alternatively, it may be considered that there issome contribution to the Ne abundances from thePN progenitor stars, as suggested in some recentinvestigations (see for example Pena et al. 2007).Although oxygen and neon are mostly produced bythe evolution of massive stars through core-collapsesupernovae, some contribution from the PN progen-itor stars is also supported by theoretical models.This interpretation, however, conflicts with the factthat the dispersion does not seem to change for dif-ferent metallicities. If an important part of the Neabundances were produced by the intermediate starswe would expect the dispersion to increase with themetallicity, which is not observed. Therefore, themost accurate data available for Ne do not suggestany important contribution from the PN progenitorstars, so that any such contribution would be ex-pected to be smaller than the average uncertaintiesin the abundances.
It has been argued that the third dredge-up pro-cess in AGB stars may affect the oxygen abun-
TABLE 4
AVERAGE DISPERSIONS AS FUNCTIONS OFO/H
MW MW+MC ALL
N/H
PN 0.42 0.48 0.38
HII regions 0.33 0.41 0.31
ALL 0.42 0.49 0.41
Ne/H
PN 0.22 0.25 0.20
HII regions 0.09 0.15 0.13
ALL 0.21 0.24 0.16
S/H
PN 0.33 0.38 0.27
HII regions 0.18 0.17 0.15
ALL 0.30 0.36 0.20
Ar/H
PN 0.34 0.33 0.33
HII regions 0.11 0.17
ALL 0.34 0.32 0.24
TABLE 5
FRACTIONS OF OBJECTS WITHIN 1σ, 2σ,AND 3σ
1σ 2σ 3σ
Ne/H
Milky Way 0.75 0.94 1.00
MW + MC 0.77 0.94 1.00
MW + galaxies 0.78 0.93 1.00
S/H
Milky Way 0.36 0.58 1.00
MW + MC 0.54 0.84 1.00
MW + galaxies 0.30 0.56 1.00
Ar/H
Milky Way 0.41 0.67 1.00
MW + MC 0.54 0.85 1.00
MW + galaxies 0.44 0.73 1.00
dances observed in planetary nebulae (see for exam-ple Karakas & Lattanzio 2014). ON cycling wouldalso reduce the O/H ratio especially in lower metal-licity PN. This appears to affect low metallicity ob-jects with progenitor star masses higher than about

ABUNDANCES IN PHOTOIONIZED NEBULAE 9
2M⊙ (see for example Karakas & Lattanzio 2007,Herwig 2005). Our results show that, if present,such contribution should be small compared with theaverage uncertainties in the PN abundances. Fig-ures 2 to 4 show some evidence of this effect forlog (O/H) + 12 ≤ 8, but the number of PN at suchlow metallicities is a small fraction of the sampleconsidered. It can be concluded that this effect, ifpresent, is masked by the uncertainties in the abun-dance determinations, as well as by the different av-erage metallicities of the objects considered here.
Taking into account the expected uncertainties inthese abundances, an average contribution of about0.1 dex cannot be ruled out. On the other hand, if wecompare the expected contributions both to oxygenand neon, it is unlikely that they are equal, which isneeded in order to explain the similarity of the PNand HII region trends shown in Figures 2 to 4 (cf.Karakas and Lattanzio 2003).
3.1.3. Sulphur
In the case of sulphur, as shown in Figures 5, 6,and 7, the general trends with oxygen are similar toneon, but some differences arise. The symbols are asin Figures 2, 3, and 4. For the Milky Way disk, theHII regions present a very good correlation, and thedata extend to higher and lower metallicities com-pared with neon. The galactic PN already displaywhat is usually called the “sulphur anomaly”, thatis, many PN apparently have somewhat lower S/Habundances than expected for their metallicity (seefor example the detailed discussions by Henry et al.2004, 2012); this can be observed in Figure 5 (topand bottom). The sulphur anomaly has been at-tributed to a deficiency in the calculation of the sul-phur ICFs, particularly due to the abundance of theS+3 ion, to lack of accurate atomic constants, as aneffect of the nucleosynthesis in the progenitor stars,and to a different chemical evolution of the systemsconsidered. In Figure 5 it is clearly seen that moreobjects lie below the line defined by the HII regions,especially in the range 8.0 < log (O/H) + 12 < 9.0.
Considering now the Milky Way and the Magel-lanic Clouds, we see in Figure 6, in which the sym-bols are as in Figure 3, that a new effect is apparent,in the sense that the S abundances in the Magel-lanic Clouds present a much wider dispersion thanthe galactic objects, showing many PN with highersulphur abundances than the HII regions. There isstill a reasonable number of objects below the HIIregion curve, but there is a large number of PN onthe opposite side, so that the sulphur anomaly is notparticularly noticeable, and in fact the data could be
Fig. 5. The same as Figure 2 for sulphur.
attributed simply to the higher uncertainty for theMC abundances, suggesting that these abundancesare not as well known as in the galactic PN.
Taking into account all objects in the LocalGroup, as shown in Figure 7, where the symbols areas in Figure 4, we see that the same general trendsare maintained, with a higher dispersion comparedwith Ne for PN. It is noteworthy that for all HIIregions, galactic as well as extragalactic, the lock-step variation with oxygen is very well defined, de-spite the fact that the objects considered are verydifferent. Another consequence is that the sulphuranomaly becomes less important as additional sam-ples are considered. This suggests that this problemis very probably related to the calculation techniquesused to derive the sulphur abundances in galacticand possibly in Magellanic Cloud PN.
It can also be seen in Table 4 and Figures 5 to7 that the average dispersion of the sulphur abun-dances is higher compared to Ne, and similar to thecase of Ar, as we will see later on. For HII regions,essentially the same average dispersion is obtained inall cases. The inclusion of BCG and ELG maintains

10 MACIEL, COSTA & CAVICHIA
Fig. 6. The same as Figure 3 for sulphur.
these conclusions, that is, the sulphur abundancesof HII apparently do not show the sulphur anomaly,which is then a characteristic of the empirical deter-mination of sulphur abundances in planetary neb-ulae. In other words, the problem of the sulphurdeterminations affects basically the planetary neb-ulae, but not the HII regions or the blue compactgalaxies.
As a conclusion, we see that the HII region trendis always well defined, while the PN data presentat least three different problems: (i) the sulphuranomaly, apparent in galactic objects, (ii) a largenumber of objects with higher sulphur abundancescompared with HII regions, especially in the Mag-ellanic Clouds, and (iii) a higher dispersion in thePN data, compared to neon. Based on the estimatesof the discrepancy in the sulphur abundances in theClouds and in the Milky Way we suggest that thesulphur abundances of PN in the Clouds are prob-ably overestimated up to a factor of the order of 3.Of course, the overestimate may be different for indi-vidual nebulae, so that this applies only to the bulkof the nebulae.
Fig. 7. The same as Figure 4 for sulphur.
3.1.4. Argon
For argon the results are similar to those of neon,but the dispersion is higher, comparable to S/H, ascan be seen in Table 4 and Figures 8, 9, and 10, againwith the same symbols as in Figures 2 to 4. Thecomparison with HII regions suffers from the lack ofdata for this element, especially for the Milky Way,except when external galaxies are included, as shownin Figure 10. The inclusion of BCG and ELG clearlyimproves the correlation, showing that the correla-tion defined at higher metallicities for the Milky Waystill holds for lower and intermediate oxygen abun-dances (logO/H + 12 < 8.5). It should be noticedhere that although the Ar/H dispersion is higher forPN compared to the Ne abundances, in the case ofHII regions it is essentially the same as for Ne/Hand S/H, up to 0.2 dex, similar to the value of theuncertainty. Therefore, the HII regions are clearlymore homogeneous than the PN, which reflects theirvery small ages, roughly a few million years. Clearly,within such a short time bracket the average inter-stellar abundances are not expected to change ap-preciably. The relatively small dispersion of the HII

ABUNDANCES IN PHOTOIONIZED NEBULAE 11
Fig. 8. The same as Figure 2 for argon.
region data for external galaxies can be understoodin terms of the different metallicities of the LocalGroup objects. For PN, the dispersion in the datais considerably higher. As in the case of Ne, thereis some evidence of a reduced oxygen abundance atlower metallicities.
3.2. Elements produced by the PN progenitor stars
In this work, we have stressed the elements thatare not expected to be substantially produced by thePN progenitor stars, and we will present only a gen-eral outline of the elements that are strongly affectedby the progenitor star evolution, such as He and N.Carbon abundances are also modified by the stellarevolution, but very few reliable carbon abundancesfor photoionized nebulae are presently available, sowe will not consider this element here. The abun-dances of these elements are particularly modifiedby the dredge-up processes that occur in intermedi-ate mass stars.
Histograms of the N/H abundances for PN andHII regions in our sample are shown in Figure 11,which can be directly compared with Figure 1. The
Fig. 9. The same as Figure 3 for argon.
PN distribution is similar in the three cases shown,and peaks around log(N/H) = 7.6 to 8.4, while forHII regions the same behavior is observed for theMilky Way and the Magellanic Clouds, but the inclu-sion of external galaxies (as well as BCG and ELG)shifts the maximum downwards by about 0.5 dex.The main difference between O/H and N/H, asshown in Figures 1 and 11, is that the nitrogen abun-dances extend to lower metallicities for HII regionscompared with planetary nebulae, which reflects theN production during the evolution of the PN pro-genitor stars.
The main elements that are produced by the PNprogenitor stars are He and N, for which there aregenerally good quality data for planetary nebulaeand, to a lesser extent, for HII regions. Also, Hedeterminations in HII regions are frequently affectedby the presence of neutral helium, so that in thiscase the derived abundances are usually lower lim-its, which makes their analysis more difficult. In thiswork we have adopted a lower limit of He/H = 0.03in order to avoid objects with an important fractionof neutral He.

12 MACIEL, COSTA & CAVICHIA
Fig. 10. The same as Figure 4 for argon.
Figure 12 shows the N/H and N/O ratios as func-tions of O/H and He/H, respectively, for the casewhere all objects are considered, namely, the MilkyWay, the Magellanic Clouds, and external galaxies,keeping the same symbols as in Figure 4. This figurecan be compared with the bottom Figures 4, 7, and10 for Ne, S, and Ar, respectively. The most strikingresult is that, as expected, PN show an increase inboth N and He compared to most HII regions in thesample. The average dispersions of the nitrogen dataare also shown in Table 4, and it can be seen thatthey are much larger than in the case of Ne, S, andAr, both for PN and HII regions. In other words,a larger dispersion is also observed for HII regions,so that part of their nitrogen is probably secondary.The excess nitrogen in PN is essentially produced bytheir progenitor stars, in a strong contrast with theremaining elements studied so far. The N/H ratio isroughly correlated with O/H in HII regions (Figure12 top), but most PN are located above the averagecurve defined by the HII regions, again confirmingthe excess of N in planetary nebulae.
Considering now Figure 12 (bottom), it can beseen that there is a general trend for N/O with He/Hin galactic as well as external planetary nebulae, butthe dispersion is much higher than in the case of theprevious plots, so that no definite correlation canbe obtained, in agreement with similar conclusionsby Richer & McCall (2008). Such a result clearlyreflects the fact that the nitrogen abundances mea-sured in planetary nebulae include both the pristinenitrogen plus the contribution from the dredge upprocesses that affect the red giant progenitor stars.Similar trends have also been recently discussed byGarcıa-Hernandez et al. (2016), in a comparison ofdouble-chemistry and oxygen-chemistry PN. It canalso be seen in Figure 12 (bottom) that there areno important differences between galactic and ex-ternal objects, and that the majority of PN haveabundances close to solar, a result similar to the oneobtained by Pottasch & Bernard-Salas (2010) for asmaller sample.
The N/O ratio shows some tendency to increasewith the He abundances, indicating that both ele-ments are produced in previous phases of the stellarevolution. Adopting a pregalactic He abundance bymass of about Y = 0.255 (cf. Izotov et al. 2014)which corresponds to approximately He/H = 0.09,we see in Figure 12 (bottom) that the PN enrich-ment is considerably larger than for HII regions, andthat the difference between local and external PN isnegligible. The cumulative distribution of the PN asa function of the He/H abundance is shown in Figure13 (top). It can be seen that about 80% of the PNwith He excess have abundances up to He/H≃ 0.141,a value about 57% higher than the pregalactic value.This can be compared with the value of 50% derivedby Richer & McCall (2008) from a smaller sample.More recently, Lattanzio & Karakas (2016, see alsoKarakas & Lattanzio 2014) suggested an increase ofabout 38% in the helium content by mass from thesecond dredge-up process in AGB stars, which wouldlead to an increase of about 60% in the He abundanceby number of atoms, in excellent agreement with theresults shown in Figure 13.
Also from Figure 12 we can gain an idea ofthe amount of nitrogen produced by the progenitorstars. Adopting as limit for the primary nitrogenthe amount produced by type II supernovae (Izo-tov et al. 2006), corresponding to approximatelylogN/O = −1.6, it can be seen that practically allPN are located way above this threshold. Consid-ering the expected secondary nitrogen enrichment,which corresponds to about logN/O = −1.2, Fig-ure 13 (bottom) shows that about 80% of the PN

ABUNDANCES IN PHOTOIONIZED NEBULAE 13
Fig. 11. Histograms of the N/H abudances in PN and HII regions. top: Milky Way, middle: Milky Way and MagellanicClouds, bottom: Milky Way and all external galaxies.
present an enrichment ratio up to factor of 13.3,comparable with the factor of 10 found by Richer& McCall (2016).
In Figure 12 (bottom) we include a compar-ison with some recent theoretical models. Thethick solid lines are taken from theoretical modelsby Karakas (2010, see also Karakas & Lattanzio2007 and Garcıa-Hernandez & Gorny 2014), withZ = 0.004, 0.008, and 0.02, while the thick inter-rupted lines represent models by Marigo et al. (2003)with Z = 0.019. We have used straight lines tolink the model results effectively obtained by Marigoet al. (2003) and Karakas (2010). These are syn-thetic evolutionary models for thermally-pulsatingAGB stars with initial masses of 1 to 6 M⊙, in whichup to three dredge-up episodes occur, apart from
hot-bottom processes (HBB) for the most massiveobjects. According to these models, progenitors hav-ing 0.9 to 4 M⊙ and solar composition can explainthe “normal” abundances, He/H < 0.15, while forobjects with higher enhancements (He/H > 0.15),masses of 4 to 5 M⊙ are needed, plus an efficientHBB. For intermediate mass stars, the agreementwith theoretical models is fair, but abundance de-terminations should be improved and expanded. Re-cent models by Pignatari et al. (2016) with Z = 0.01and 0.02 are also consistent with these results, as canbe seen in the discussion by Delgado-Inglada et al.(2015). This paper also includes a discussion on theeffects of different ICFs on the N and He productionin the PN progenitor stars, as applied to a samplesmaller than that considered here.

14 MACIEL, COSTA & CAVICHIA
Fig. 12. Nitrogen abundances as functions of O/H (top)and He/H (bottom) for the Milky Way and externalgalaxies. MW PN (squares), MW HII regions (triangles),external PN (circles), external HII regions (crosses). Inthe bottom figure the thick solid lines represent mod-els by Karakas (2010) for thermally pulsating AGB starswith Z = 0.004, as indicated at the top of the figure,and also for Z = 0.008 and Z = 0.02. The lower thickinterrupted lines are models by Marigo et al. (2003) forZ = 0.019.
4. CONCLUSIONS
The main conclusions of this paper are as follows:
• PN abundances of O, Ne, S, and Ar show goodcorrelations, indicating that Ne, S, and Ar vary inlockstep with O. The correlations also apply to HIIregions, BCG and ELG, but the dispersion is con-siderably lower for these objects.
• No important contribution to the Ne abun-dances from their progenitor stars is found in PN,so that any such contribution is probably lower thanthe current uncertainties in the abundance determi-nation.
Fig. 13. Top: Cumulative distribution of PN as a func-tion of the He/H abundance. About 80% of the nebulaehave He/H lower than 0.141, as indicated by the dashedlines, which corresponds to a 57% enrichment relative tothe reference value (He/H = 0.09). Bottom: Cumula-tive distribution of PN as a function of the N/O enrich-ment ratio. About 80% of the nebulae have an enrich-ment ratio of a factor 13.3 relative to the reference value(log N/O = –1.2), as indicated by the dashed lines.
• For argon similar results as for neon are found,with a somewhat higher dispersion, probably due tothe weakness of the Ar lines.
• Sulphur abundances in Milky Way PN maypresent the sulphur anomaly, that is, lower abun-dances than expected at a given metallicity. Thisanomaly is probably due to incorrect ICFs (ioniza-tion correction factors), but it is not apparent inthe bulk of Local Group objects, for which a partic-ularly extended metallicity range can be observed.The anomaly is not observed in MC PN, which showinstead a larger dispersion than Milky Way objects.The dispersion observed in PN is probably real, andpartially reflects the different ages of the progeni-tor stars. The variety of the sources considered may

ABUNDANCES IN PHOTOIONIZED NEBULAE 15
also contribute to the observed dispersion, althoughan effort has been made to consider only works withsimilar approaches in the abundance determination.
• All correlations for HII regions show smallerdispersions, as expected, a result that is not affectedby the inclusion of either BCG or ELG. The sametrends are observed in both types of photoionizednebulae.
• Concerning planetary nebulae, it is interestingto notice that the average dispersion of the relationsinvolving Ne, Ar, and S with oxygen is similar tothat of the more homogeneous sample by Henry andco-workers, as can be seen for example in Milingoet al. (2010) (Here the remarks made on sulphurdata are also applicable). This is very interesting,considering the fact that the Local Group galax-ies have somewhat different metallicities, and possi-bly some differences in their chemical evolution pro-cesses. A similar result was obtained by Richer &McCall (2008) for neon. Also for neon and sulphur,results by Magrini et al. (2009) for M33 agree withthe conclusions above. More recently, Richer & Mc-Call (2016) pointed out that the relation of oxygenand neon abundances is similar to that of the star-forming galaxies, which again suggests that the PNprogenitor stars either do not appreciably change theNe abundances or the possible changes keep the orig-inal abundance ratio, implying progenitor masses ofabout 2 solar masses or less.
• The same mass interval is obtained from thecomparison of the nitrogen abundances in PN withtheoretical models of AGB stars, as PN have higherN and He abundances, and are located at the topright corner of the N/O vs. He/H plot. There-fore, these objects have originated from intermediatemass stars with masses typically under 2 M⊙, exceptfor the high He nebulae, whose progenitor stars arecloser to the high mass bracket, around 4 M⊙.
• A comparison of the N and He abundances inPN and HII regions shows that the former presentan enrichment of these elements up to a factor of 13for nitrogen and up to 57% for He, which agrees withsome recent observational determinations as well aswith theoretical models.
This work was partially supported by FAPESPand CNPq.
REFERENCES
Afflerbach, A., Churchwell, E., & Werner, M. W. 1997,ApJ, 478, 190
Balick, B., Kwitter, K. B., Corradi, R. L. M., & Henry,R. B. C. 2013, ApJ, 774, 3
Bensby, T., Feltzing, S., & Lundstrom, I. 2004a, A&A,415, 155
. 2004b, A&A, 421, 969Berg D. A., Croxall, K. V., Skillman, D. E., et al. 2015,
ApJ, 806, 16Bresolin, F., Garnett, D. R., & Kennicutt, R. C. 2004,
ApJ, 615, 228Bresolin, F., Gieren, W., Kudritzki, R. P., et al. 2009,
ApJ, 700, 309Bresolin, F., Stasinska, G., Vılchez, J. M., Simon, J. D.,
& Rosolowsky, E. 2010, MNRAS, 404, 1679Cavichia, O., Costa, R. D. D., & Maciel, W. J. 2010,
RMxAA, 46, 159. 2011, RMxAA, 47, 49
Cavichia, O., Costa, R. D. D., Maciel, W. J., & Molla,M. 2017, MNRAS (submitted)
Chiappini, C., Gorny, S. K., Stasinska, G., & Barbuy, B.2009, A&A, 494, 591
Costa, R. D. D., Maciel, W. J., & Escudero, A. V. 2008,BaltA, 17, 321
Croxall, K. V., Pogge, R. W., Berg D. A., Skillman, D.E., & Moustakas, J. 2015, ApJ, 808, 42
Delgado-Inglada, G., Rodrıguez, M., Peimbert, M.,Stasinska, G., & Morisset, C. 2015, MNRAS, 449,1797
Delgado-Inglada, G., Morisset, C., & Stasinska, G. 2014,MNRAS, 440, 536
Esteban, C., Bresolin, F., Peimbert, M., et al. 2009, ApJ,700, 654
Garcıa Hernandez, D. A. & Gorny, S. K. 2014, A&A, 567,A12
Garcıa Hernandez, D. A., Ventura, P., Delgado-Inglada,G., et al. 2016, MNRAS, 461, 542
Girard, P., Koppen, J., & Acker, A. 2007, A&A, 463, 265Guseva, N. G., Izotov, Y. I., Papaderos, P., & Fricke, K.
J. 2007, A&A, 464, 885Henry, R. B. C., Kwitter, K. B., & Balick, B. 2004, AJ,
127, 2284Henry, R. B. C., Kwitter, K. B., & Bates, J. A. 2000,
ApJ, 531, 928Henry, R. B. C., Kwitter, K. B., Jaskot, A. E., et al.
2010, ApJ 724, 748Henry, R. B. C., Speck, A., Karakas, A., Ferland, G. I.,
& Maguire, M. 2012, ApJ, 749, 61Herwig, F. 2005, ARA&A, 43, 435Idiart, T. E. P., Maciel, W. J., & Costa, R. D. D. 2007,
A&A, 472, 101Izotov, Y. I. & Thuan, T. X. 1999, ApJ, 511, 639Izotov, Y. I., Stasinska, G., Meynet, G., Guseva, N. G.,
& Thuan, T. X. 2006, A&A, 448, 955Izotov, Y. I, Thuan, T. X., & Guseva, N. G. 2014, MN-
RAS, 445, 778Karakas, A. 2010, MNRAS, 403, 1413
16 MACIEL, COSTA & CAVICHIA
Karakas, A. & Lattanzio, J. C. 2003, PASA, 20, 293. 2007, PASA, 24, 103. 2014, PASA, 31, 30
Kennicutt, R. C., Bresolin, F., & Garnett, D. R. 2003,ApJ, 591, 801
Kwitter, K. B., Lehman, E. M. M., Balick, B., & Henry,R. B. C. 2012, ApJ, 753, 12
Lattanzio, J. & Karakas, A. 2016, JPhCS, 728, 022002Leisy, P., & Dennefeld, M. (LD) 2006, A&A, 456, 451Maciel, W. J. & Costa, R. D. D. 2009, IAU Symp., 265,
ed. K. Cunha, M. Spite, B. BarbuyMaciel W. J., Costa, R. D. D., & Cavichia. O. 2014, PoS
(NIC XIII), 030Maciel, W. J., Costa, R. D. D., & Idiart, T. E. P. 2009,
RMxAA, 45, 127. 2010a, A&A, 512, A19. 2010b, Nuclei in the Cosmos XI, PoS
Maciel, W. J., Rodrigues, T. S., & Costa, R. D. D. 2011,RMxAA, 47, 401
Magrini, L., Leisy, P., Corradi, R. L. M., et al. 2005,A&A, 443, 115
Magrini, L., Stanghellini, L., & Villaver, E. 2009, ApJ,696, 729
Magrini, L., Vılchez, J., Mampaso, A., Corradi, R. L. M.,& Leisy, P. 2007, A&A, 470, 865
Marigo, P., Bernard-Salas, J., Pottasch, S. R., Tielens,A. G. G. M., & Wesselius, P. R. 2003, A&A, 409, 619
Milanova, Yu. V. & Kholtygin, A. F. 2009, AstL, 35, 518Milingo, J. B., Kwitter, K. B., Henry, R. B. C., & Souza,
S. P. 2010, ApJ, 711, 619Peimbert, M., Peimbert, A., & Ruiz, M. T. 2000, ApJ,
541, 688Pena, M., Stasinska, G., & Richer, M. G. 2007, A&A,
476, 745
W. J. Maciel and R. D. D. Costa: Instituto de Astronomia, Geofısica e Ciencias Atmosfericas, Universidade deSao Paulo - Rua do Matao 1226, CEP 05508-090, Sao Paulo SP, Brazil (wjmaciel, [email protected]).
O. Cavichia: Instituto de Fısica e Quımica, Universidade Federal de Itajuba, Av. BPS 1303, Pinheirinho, CEP37500-903, Itajuba, MG, Brazil ([email protected]).
Pena-Guerrero, M. A., Peimbert, A., Peimbert, M., &Ruiz, M. T. 2012, ApJ, 746, 115
Pignatari, M., Herwig, F., Hirschi, R., et al. 2016, ApJS,225, 24
Pottasch, S. R. & Bernard-Salas, J. 2010, A&A, 517, A95
Ramırez, I., Allende-Prieto, C., & Lambert, D. L. 2013,ApJ, 764, 78
Reyes, R. E. C., Navarro, A. R., Melendez, J., Steiner,J., & Elizalde, F. 2015, RMxAA, 51, 133
Richer, M. G. & McCall, M. L. 2007, ApJ, 658, 328
. 2008, ApJ, 684, 1190
. 2016, Focus Meeting 4, XXIX IAU GeneralAssembly, ed. P. Benvenuti (arXiv:1509.08537)
Rocha-Pinto, H. J., Maciel, W. J., Scalo, J., & Flynn, C.2000, A&A, 358, 850
Rosolowsky, E. & Simon, J. D. 2008, ApJ, 675, 1213
Rudolph, A. L., Fich, M., Bell, G. R., et al. 2006, ApJS,162, 346
Sanders, N. E., Caldwell, N., McDowell, J., & Harding,P. 2012, ApJ, 758, 133
Selier, R. & Heydari-Malayeri, M. 2012, A&A, 545, A29
Stanghellini L., Magrini, L., Cassola, V., & Villaver. E.2014, A&A, 567, A88
Stasinska, G., Pena, M., Bresolin, F., & Tsamis, Y. G.2013, A&A, 552, A12
Stasinska, G., Richer, M. G., & McCall, M. L. 1998,A&A, 336, 667
Tsamis, Y. G., Barlow, M. .J., Liu, X.-W., Danziger, I.J., & Storey, P. J. 2003, MNRAS, 338, 687
Vermeij, R. & van der Hulst, J. M. 2002, A&A, 391, 1081
Zurita, A. & Bresolin, F. 2012, MNRAS, 427, 1463