ac 2012-4747: deciphering student ideas on · pdf fileac 2012-4747: deciphering student ideas...
TRANSCRIPT

AC 2012-4747: DECIPHERING STUDENT IDEAS ON THERMODYNAM-ICS USING COMPUTERIZED LEXICAL ANALYSIS OF STUDENT WRIT-ING
Dr. Luanna B. Prevost, Michigan State University
Luanna Prevost is a Postdoctoral Research Associate at the Center for Engineering Education Research(CEER) at Michigan State University. She is a member of the Automated Analysis of ConstructedResponses program, an NSF-funded cross-institutional collaboration of interdisciplinary science, tech-nology, engineering, and mathematics (STEM) education researchers interested in exploring the use ofautomated text analysis to evaluate constructed-response assessments. Her research activities focus oninstructional material development, learning assessment, and investigating student cognition STEM dis-ciplines.
Dr. Kevin C. Haudek, Michigan State UniversityDr. John E. Merrill, Michigan State University
Biological Sciences
Dr. Mark Urban-Lurain, Michigan State University
c©American Society for Engineering Education, 2012
Page 25.379.1

Deciphering student ideas on thermodynamics using
computerized lexical analysis of student writing
Abstract
Constructed responses, in which students describe their understanding in their own language,
provide better insight into their thinking than do multiple-choice assessments. However,
constructed responses are not often employed in large enrollment courses due to the time and
resource constraints involved in grading these assessments. In this study, we examined student
understanding of thermodynamics using computerized lexical analysis of constructed responses
in a large enrollment course (N=294). Students were asked to interpret a graph depicting changes
in free energy during the course of a reaction using both multiple-choice and constructed
responses. Constructed responses were analyzed using SPSS Text Analytics for Surveys (TAFS).
The software extracts scientific terms from the students’ writing and places them into categories
using custom dictionaries of science terms. We validated the automated lexical analysis by using
the categories created by TAFS as independent variables in discriminant analysis to predict
expert scoring of the students’ writing. Our findings reveal i) that students hold a heterogeneous
mix of correct and incorrect ideas about thermodynamics, and ii) that this heterogeneity is
undetected by multiple-choice testing. Almost 50% of the students answering multiple-choice
correctly displayed incorrect, or both correct and incorrect conceptualizations in their written
responses. Our results support previous studies that have revealed students’ heterogeneous ideas
about matter and energy conservation and acid-base chemistry using lexical analysis. These
findings suggest that computerized lexical analysis can improve instructors’ understanding of the
heterogeneity of ideas that student harbor about key concepts in STEM disciplines and inform
assessment practices
Introduction
Over the past twenty years, there has been increasing focus on the development of initiatives to
improve STEM education 1–3
.The use of formative assessment can help instructors gain better
understanding of student learning in STEM disciplines 4–6
. Authentic and effective assessment
provides students with the opportunity to demonstrate their understanding and allows instructors
to give feedback on students learning. However, the prevalence of large-enrollment STEM
courses, particularly at the introductory level, has led to the use of multiple-choice assessments,
which are cheaper and less time-consuming to implement and grade.
Multiple-choice assessments may not elicit student conceptualization of the subject material 7.The format encourages students to select from a list of options and may encourage the use of
elimination to arrive at their final choice 8. Yet research has shown that instructors need a clear
perception of students’ current knowledge to confront misconceptions or incorrect ideas and
foster the creation of scientific constructions 9,10
. Constructed responses, sometimes referred to as
open-ended or free-response, allow students to demonstrate their own understanding of the
subject matter, and are more effective for diagnosing student misconceptions compared to
multiple-choice testing 11
. However, one obstacle to the use of constructed-response assessments
has been the time investment and expense involved in grading these assessments.
Page 25.379.2

The Automated Analysis of Constructed Responses (AACR) research group at Michigan State
University explores student understanding expressed in constructed responses using
computerized lexical and statistical analyses. Lexical analysis of constructed responses can
minimize the time and costs involved in scoring constructed responses assessments, and facilitate
timely teaching interventions. This approach allows students ideas to be extracted from their
responses and categorized automatically giving instructors an insight into student thinking, thus
making formative assessment and feedback feasible even in large-enrollment courses.
A fundamental understanding of thermodynamics is necessary in many STEM discipline
including physics, engineering, chemistry and biology, and it is frequently taught in many large-
enrollment introductory courses. Students often harbor misconceptions about or have problems
understanding thermodynamics 12,13
, including the relationship between exothermic, endothermic
and spontaneous process and distinguishing between the system and surrounding, which can be
uncovered using written assessments 14
. In this study, we demonstrate the use of automated text
analytics software to investigate students’ understanding of thermodynamics in an introductory
biology course. We examine the relationship between students’ multiple-choice and constructed
responses to a thermodynamics question pre and post instruction. We further investigate the
heterogeneity of and connections among ideas presented by students written responses using text
analytics.
Study Methods
Study Question
Our study was conducted in an introductory cell and molecular biology course during the fall
semester 2008 at a large state university. At least one semester of chemistry is required as a
prerequisite for this course and students were expected to have a basic understanding of
thermodynamics. Students were given online homework assignments including a question on
free energy consisting of a multiple-choice and constructed response component (Figure 1).
Figure 1. Questions and supporting diagram given in pre- and post-instruction online assignment.
The assignment was administered pre- and post- instruction. Students were given credit for
completion of the assignment regardless of the accuracy of their answer. 294 responses (168 pre-
instruction and 125 post-instruction) were collected using the online learning management
system. Post-instruction responses were independently scored by two raters with expertise in
biology and chemistry. Correct and complete responses described the components of the system
Question (correct answer in bold).
Study the graph that illustrates the chemical
reaction A +B C + D. Does this graph
represent an exergonic or endergonic reaction?
A. Endergonic
B. Exergonic
C. Either
How can you tell?
Page 25.379.3

and the change in free energy (see examples in Results section below). The raters scored
responses that had only correct ideas as 1. Responses with incorrect, incomplete or mixed (both
right and wrong) ideas were scored 0. Demographic data was also collected to characterize the
student population.
Text Analysis
We used IBM SPSS Text Analytics for Surveys 4.0 software15
to analyze constructed responses.
The software identifies terms from custom-built libraries 16,17, similar to dictionaries. (For more
details on the operation of the software see references 15 and 16). Terms are classified into
categories by predefined computer algorithms which are subsequently modified by the
researcher. Each response can contain multiple terms, with each term belonging to one or more
categories. The software also displays web diagrams, similar to those in Figure 4, illustrating the
connections among categories within groups of responses. Appendix I summarizes the
approaches used in this study in the form of a flow chart.
Statistical analysis
We used IBM SPSS Statistics 1918
to conduct independent t-tests to compare the distribution of
categories pre- and post- instruction and categories for correct and incorrect/incomplete
responses, with Bonferroni corrections for multiple comparisons (p<0.003). We conducted
discriminant analyses to determine categories that predict correct and incorrect post-instruction
responses. The discriminant analysis used a stepwise-forward, Wilk's method with an F-in of
3.84 and F-out of 2.71. We used group sizes for prior classification probabilities and a leave-one-
out cross validation.
Discriminant analysis is similar to linear regression and determines a linear function that
expresses the relationship between dependent and independent variables. However, in the case of
discriminant analysis, the dependent variables are categorical instead of interval. For this
analysis, we have a series of binary independent variables (presence or absence of a student’s
response in a lexical category) which are combined to predict categorical dependent variables
(expert rating). In this analysis the dependent variables has two categories (correct and incorrect)
which results in a single linear function. Discriminant analysis analyzes the covariance between
independent variables, or whether the variables change together or not. Because of this, it is not
the values of independent variables but the relationship among them that is critical in
determining the discriminant functions.
Results
Our student population was 60% female with an average GPA of 2.98 on a 4.0 scale. The class
was composed of 59% sophomores, 26%juniors, 9% seniors and 6% freshmen from mostly
STEM disciplines (Table 1.)
Page 25.379.4

Table 1. Distribution of majors of study student population
Major Percent of
Respondents (%)
Pre Med/Dental/Nursing/Vet 30
Human Biology 17
Natural and Animal Science 10
Social Science 8
Nutrition 7
Zoology 7
Biochem/Microbiology/Genetics 3
Kinesiology 2
Engineering 2
Physics 1
Chemistry 1
Other 5
Undeclared majors 7
In the pre-instruction assignment 76.8% of the student chose the correct multiple-choice answer.
Post-instruction this percentage increased to 84.9%. However, 49% of students selecting the
correct multiple-choice response had incorrect explanations for the type of reaction in the post
test. Raters demonstrated high scoring agreement (Cronbach’s alpha = 0.88) and scoring
disagreements were resolved by consensus. Correct and complete responses compared the free
energy of the reactants and products or referred to the net negative change in free energy for the
reaction. The following are examples of correct responses:
Correct response 1: ―energy is released as the reaction proceeds, with the products having
less energy than the reactants‖
Correct response 2 ―The change in G is negative which implies the reaction is giving off
energy‖
Incorrect responses were either incomplete, completely wrong, or contained both wrong and
correct ideas. The following are examples of responses scored as incorrect:
Incorrect Response 1 - Incomplete response: ―releases energy‖ (This was the entire
explanation submitted.)
Incorrect Response 2 - Only wrong ideas: ―The energy is transferred from the reactants to the
products‖
Incorrect Response 3: Both correct and incorrect ideas, ―You can tell because the reactants
have more potential energy than the products. Also because there is a
loss of free energy this reaction gives off heat.‖
Page 25.379.5
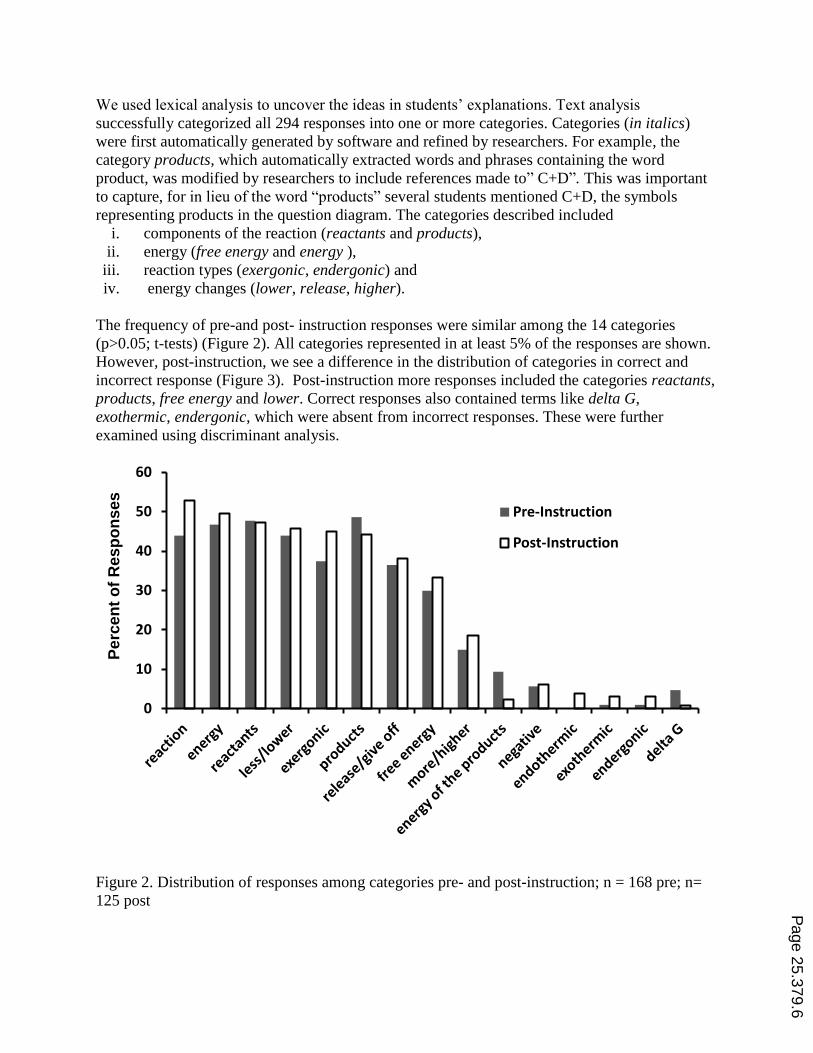
We used lexical analysis to uncover the ideas in students’ explanations. Text analysis
successfully categorized all 294 responses into one or more categories. Categories (in italics)
were first automatically generated by software and refined by researchers. For example, the
category products, which automatically extracted words and phrases containing the word
product, was modified by researchers to include references made to‖ C+D‖. This was important
to capture, for in lieu of the word ―products‖ several students mentioned C+D, the symbols
representing products in the question diagram. The categories described included
i. components of the reaction (reactants and products),
ii. energy (free energy and energy ),
iii. reaction types (exergonic, endergonic) and
iv. energy changes (lower, release, higher).
The frequency of pre-and post- instruction responses were similar among the 14 categories
(p>0.05; t-tests) (Figure 2). All categories represented in at least 5% of the responses are shown.
However, post-instruction, we see a difference in the distribution of categories in correct and
incorrect response (Figure 3). Post-instruction more responses included the categories reactants,
products, free energy and lower. Correct responses also contained terms like delta G,
exothermic, endergonic, which were absent from incorrect responses. These were further
examined using discriminant analysis.
Figure 2. Distribution of responses among categories pre- and post-instruction; n = 168 pre; n=
125 post
0
10
20
30
40
50
60
Pre-Instruction
Post-Instruction
Pe
rce
nt
of
Res
po
nses
Page 25.379.6

We used discriminant analysis to validate the categories from lexical analysis as the independent
variables and expert scores (correct or incorrect) as the dependent variables. The use of stepwise
model allows only categories that are significant to the model to be included. We used a leave-
one-out classification for cross-validation. The resulting discriminant function was significant
(Wilks Lambda = .629, Chi-square 47.111, df = 5, p <0.000). Discriminant analysis of post-
instruction responses identified 5 categories that significantly predicted correct and incorrect
responses (Table 2). These categories were used to construct web diagrams illustrating the
frequency of responses and connections among the categories (Figure 4).
Table 2. Standardized canonical discriminant function coefficients.
Category Coefficient
Delta G 0.525
Energy of the products 0.502
Products 0.492
Lower 0.469
Reactants 0.360
Computer- Human Scoring
Inter-rater reliability
Cronbach’s Alpha = 0.75
0
20
40
60
80
Incorrect
Correct
Pe
rce
nt
of
Res
po
nses
Figure 3. Distribution of correct and incorrect responses among categories; n=125
Page 25.379.7
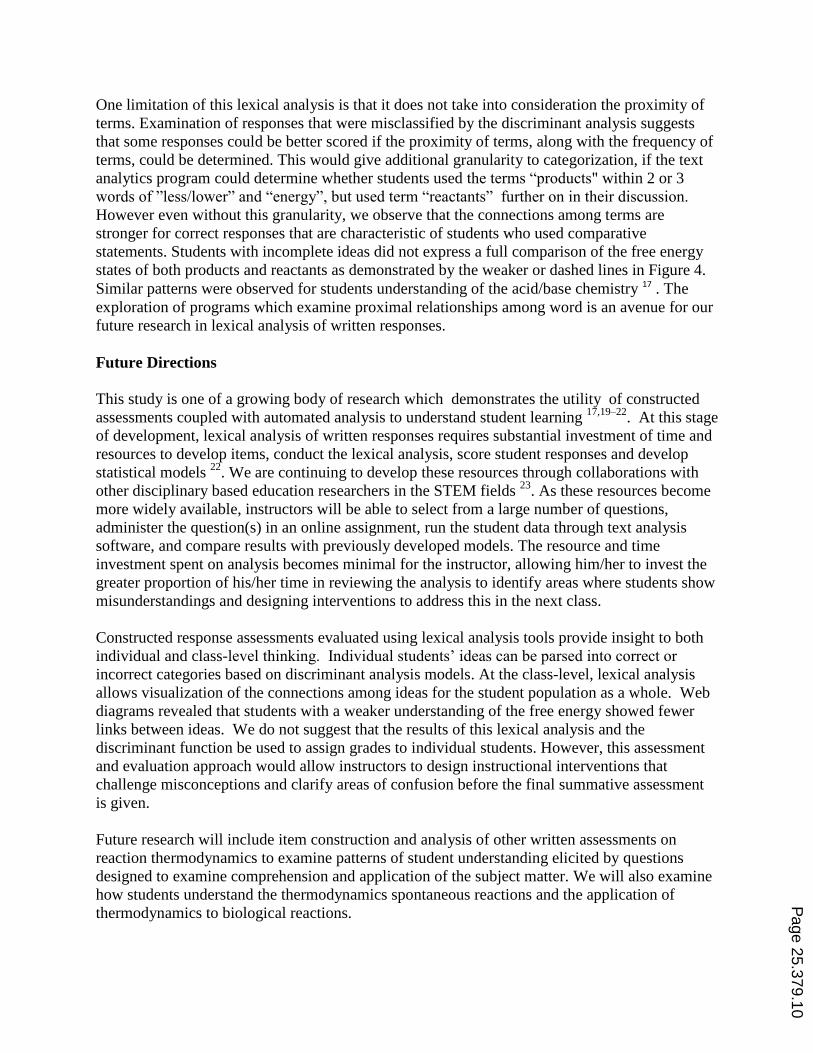
Web diagrams illustrated distinct differences between correct and incorrect responses (Figure 4 a
and b, respectively). Correct responses had considerably larger node sizes indicating the more
correct responses contained these predictive ideas (i.e. reactants, products, energy of products,
lower (energy). Correct responses also contained terms in the category delta G while incorrect
responses did not.
We also observed more co-occurrences among categories in the correct responses than among
categories in the incorrect responses web diagram. These co-occurrences are also more frequent
as represented by the solid line between the nodes reactants and lower in the correct response
web diagram. These connections reflect the comparisons made by students giving correct
responses, such as the response ―…with the products having less energy than the reactants‖
which contained 3 ideas. In contrast, the fewer or weaker connections among incorrect responses
were indicative of several incomplete responses such as ―the products have less free energy‖, in
which students expressed fewer ideas.
Discussion
Lexical analysis of student responses to the thermodynamics question demonstrated patterns in
student thinking and can indicate whether students have appropriate conceptualizations of the
material. Although most students in our study could select the correct multiple-choice option
post-instruction, only half of these provided complete and correct explanations for their choice.
Problems understanding endothermic and exothermic process can be prevalent among students
learning thermodynamics12,14
. Additionally, the large number of students who were unable to
describe the change in free energy in the system may harbor difficulty indistinguishing between
the system and surroundings , another common misconception held my students12
. Our results
demonstrate that this gap in student understanding could be undetected with only multiple-choice
testing, but was revealed through written assessment, as has been observed in other fields 7,8.Our
findings support previous studies in which lexical analysis of constructed responses revealed
heterogeneous conceptualization in photosynthesis 19,20 and acid-base chemistry 17
Page 25.379.8

16%
67%62%
64%
Reactants
Products
Delta G9%
Lower
Energy of products
25%25%
30%
Reactants
Products
Delta G0%
Lower
Energy of products2%
Figure 4. Web diagram of categories and links for a) Correct and b) Incorrect responses. Each
category is represented by a node. The size of the node corresponds to the frequency of
responses containing a category. Lines indicate the percentage of shared responses.
Solid lines indicate that 75% shared responses; dashed lines 50-74%, dotted
lines 25-49%. Nodes with fewer than 25%share responses were not linked.
a) Correct Responses
b) Incorrect Responses
Page 25.379.9
One limitation of this lexical analysis is that it does not take into consideration the proximity of
terms. Examination of responses that were misclassified by the discriminant analysis suggests
that some responses could be better scored if the proximity of terms, along with the frequency of
terms, could be determined. This would give additional granularity to categorization, if the text
analytics program could determine whether students used the terms ―products" within 2 or 3
words of ‖less/lower‖ and ―energy‖, but used term ―reactants‖ further on in their discussion.
However even without this granularity, we observe that the connections among terms are
stronger for correct responses that are characteristic of students who used comparative
statements. Students with incomplete ideas did not express a full comparison of the free energy
states of both products and reactants as demonstrated by the weaker or dashed lines in Figure 4.
Similar patterns were observed for students understanding of the acid/base chemistry 17 . The
exploration of programs which examine proximal relationships among word is an avenue for our
future research in lexical analysis of written responses.
Future Directions
This study is one of a growing body of research which demonstrates the utility of constructed
assessments coupled with automated analysis to understand student learning 17,19–22
. At this stage
of development, lexical analysis of written responses requires substantial investment of time and
resources to develop items, conduct the lexical analysis, score student responses and develop
statistical models 22
. We are continuing to develop these resources through collaborations with
other disciplinary based education researchers in the STEM fields 23
. As these resources become
more widely available, instructors will be able to select from a large number of questions,
administer the question(s) in an online assignment, run the student data through text analysis
software, and compare results with previously developed models. The resource and time
investment spent on analysis becomes minimal for the instructor, allowing him/her to invest the
greater proportion of his/her time in reviewing the analysis to identify areas where students show
misunderstandings and designing interventions to address this in the next class.
Constructed response assessments evaluated using lexical analysis tools provide insight to both
individual and class-level thinking. Individual students’ ideas can be parsed into correct or
incorrect categories based on discriminant analysis models. At the class-level, lexical analysis
allows visualization of the connections among ideas for the student population as a whole. Web
diagrams revealed that students with a weaker understanding of the free energy showed fewer
links between ideas. We do not suggest that the results of this lexical analysis and the
discriminant function be used to assign grades to individual students. However, this assessment
and evaluation approach would allow instructors to design instructional interventions that
challenge misconceptions and clarify areas of confusion before the final summative assessment
is given.
Future research will include item construction and analysis of other written assessments on
reaction thermodynamics to examine patterns of student understanding elicited by questions
designed to examine comprehension and application of the subject matter. We will also examine
how students understand the thermodynamics spontaneous reactions and the application of
thermodynamics to biological reactions.
Page 25.379.10

This study demonstrates that written assessments coupled with computerized lexical analysis can
be used to uncover students’ thinking about scientific concepts in large-enrollment courses. The
combined use of lexical and statistical analysis provides a map of the complexity of ideas that
students hold. In the future, this approach can provide a mechanism for instructors to obtain
rapid feedback on their teaching and student learning which can drive the next phase of
instruction, especially in large-enrollment courses.
Acknowledgements
We thank three reviewers for helpful comments on the manuscript. This work was funded
through a grant from the National Science Foundation (DUE 0736952 and DUE 1022653). Any
opinions, findings and conclusions or recommendations expressed in this manuscript are those of
the author(s) and do not necessarily reflect the views of the NSF.
References
1. Seymour, E. Tracking the processes of change in US undergraduate education in science, mathematics,
engineering, and technology. Science Education 86, 79–105 (2002).
2. AAAS Science for all Americans. (Oxford University Press, USA: 1990).
3. NRC -CUSE Transforming undergraduate education in science, mathematics, engineering, and technology.
(National Academies Press: 1999).
4. How People Learn: Brain, Mind, Experience, and School: Expanded Edition. (National Academies Press:
2000).
5. Von Glasersfeld, E. A constructivist approach to teaching. Constructivism in education 3, 15 (1995).
6. Pellegrino, J. W., Chudowsky, N. & Glaser, R. Knowing what students know: The science and design of
educational assessment. (National Academies Press: 2001).
7. Nehm, R. H. & Schonfeld, I. S. Measuring knowledge of natural selection: A comparison of the CINS, an open-
response instrument, and an oral interview. Journal of Research in Science Teaching 45, 1131–1160 (2008).
8. Kuechler, W. L. & Simkin, M. G. Why Is Performance on Multiple‐Choice Tests and Constructed‐Response
Tests Not More Closely Related? Theory and an Empirical Test*. Decision Sciences Journal of Innovative
Education 8, 55–73 (2010).
9. Chi, M. T. H., Feltovich, P. J. & Glaser, R. Categorization and representation of physics problems by experts
and novices. Cognitive science 5, 121–152 (1981).
10. Wood, T. From alternative epistemologies to practice in education: Rethinking what it means to teach and
learn. Constructivism in education 331–339 (1995).
11. Birenbaum, M. & Tatsuoka, K. K. Open-Ended Versus Multiple-Choice Response Formats—It Does Make a
Difference for Diagnostic Purposes. Applied Psychological Measurement 11, 385 –395 (1987).
12. Johnstone, A. H., Macdonald, J. J. & Webb, G. Misconceptions in school thermodynamics. Physics Education
12, 248–251 (1977).
13. Carson, E. & Watson, J. Undergraduate students’ understandings of entropy and Gibbs free energy. University
Chemistry Education 6, 4–12 (2002).
14. Beall, H. Probing Student Misconceptions in Thermodynamics with in-Class Writing. Journal of Chemical
Education 71, 1056 (1994).
15. IBM SPSS Text Analytics for Surveys. (2010).
16. Moscarella, R. A., Urban-Lurain, M., Merritt, B.W., Long, T., Richmond, G., Merrill, J. E., Parker, J. M.,
Patterson, R. & Wilson, C. Understanding undergraduate students’ conceptions in science: Using lexical
analysis software to analyze students’ constructed responses in biology. NARST 2008 Annual International
Conference, National Association for Research in Science Teaching. Baltimore, MD. (2008).
Page 25.379.11

17. Haudek, K. C., Prevost, L.B., Moscarella, R. A., Merrill, J. & Urban-Lurain, M. What are they thinking?
Automated analysis of student writing about acid/base chemistry in introductory biology. CBE Life Sciences
Education. (In Review)
18. IBM SPSS Statistics Version 19. (2010).
19. Urban-Lurain, M., Moscarella, R. A., Giese, E., Merrill, J. E. & Sibley, D. F. Insight into student thinking in
STEM: Lessons learned from lexical analysis of student writing. NARST 2008 Annual International
Conference, National Association for Research in Science Teaching. Philadelphia, PA. (2010).
20. Lyons, C., Jones, S., Urban-Lurain, M. & Haudek, K. C. Moving Across Scales: Using Lexical Analysis to
Reveal Student Reasoning about Photosynthesis. NARST 2008 Annual International Conference, National
Association for Research in Science Teaching. Orlando, FL. (2011).
21. Ha, M., Nehm, R. H., Urban-Lurain, M. & Merrill, J. E. Applying Computerized-Scoring Models of Written
Biological Explanations across Courses and Colleges: Prospects and Limitations. CBE-Life Sciences Education
10, 379 –393 (2011).
22. Nehm, R. H. & Haertig, H. Human vs. Computer Diagnosis of Students’ Natural Selection Knowledge: Testing
the Efficacy of Text Analytic Software. Journal of science education and technology 21, 56–73 (2012).
23. Haudek, K. C., Kaplan, J. K., Knight. J., Long, T., Merrill J., Munn, A., Nehm R., Smith, M., & Urban-Lurain,
M. Harnessing Technology to Improve Formative Assessment of Student Conceptions in STEM: Forging a
National Network. CBE-Life Sciences Education 10, 149–155 (2011).
Appendix I: Methods Flow chart
Page 25.379.12