acacia mining plc · profit forecast or estimate and no statement made should ... bank of america...
TRANSCRIPT

Acacia Mining plc
Bank of America Merrill Lynch
Global Metals and Mining
Conference
May 2017

Important Notice
This presentation includes “forward-looking statements” that express or imply expectations of future events or results as opposed to historical facts. These
statements include, financial projections and estimates and their underlying
assumptions, statements regarding plans, objectives and expectations with respect to future production, operations, costs, projects, and statements
regarding future performance. Forward-looking statements are generally
identified by the words “plans,” “expects,” “anticipates,” “believes,” “intends,” “estimates” and other similar expressions.
All forward-looking statements involve a number of risks, uncertainties and
other factors, many of which are beyond the control of Acacia, which could cause actual results and developments to differ materially from those expressed in, or
implied by, the forward-looking statements contained herein. Factors that could
cause or contribute to differences between the actual results, performance and achievements of Acacia include, but are not limited to, changes or developments
in political, economic or business conditions or national or local legislation or
regulation in countries in which Acacia conducts - or may in the future conduct -business, industry trends, competition, fluctuations in the spot and forward price
of gold or certain other commodity prices (such as copper and diesel), currency
fluctuations (including the US dollar, South African rand, Kenyan shilling and Tanzanian shilling exchange rates), Acacia’s ability to successfully integrate
acquisitions, Acacia’s ability to recover its reserves or develop new reserves,
including its ability to convert its resources into reserves and its mineral potential into resources or reserves, and to process its mineral reserves
successfully and in a timely manner, Acacia’s ability to complete land
acquisitions required to support its mining activities, operational or technical difficulties which may occur in the context of mining activities, delays and
technical challenges associated with the completion of projects, risk of trespass,
theft and vandalism, changes in Acacia’s business strategy and ongoing implementation of operational reviews, as well as risks and hazards associated
with the business of mineral exploration, development, mining and production
and risks and factors affecting the gold mining industry in general.
Although Acacia’s management believes that the expectations reflected in such forward-looking statements are reasonable, Acacia cannot give assurances that
such statements will prove to be correct. Accordingly, investors should not place
reliance on forward-looking statements contained in this presentation.
Any forward-looking statements in this presentation only reflect information
available at the time of preparation. Subject to the requirements of the Disclosure
and Transparency Rules and the Listing Rules or applicable law, Acacia explicitly disclaims any obligation or undertaking publicly to update or revise any forward-
looking statements in this presentation, whether as a result of new information,
future events or otherwise. Nothing in this presentation should be construed as a profit forecast or estimate and no statement made should be interpreted to mean
that Acacia’s profits or earnings per share for any future period will necessarily
match or exceed its historical published profits or earnings per share. Mineral reserves and mineral resources estimates contained in this presentation have
been calculated as at 31 December 2016 in accordance with National Instrument
43-101 as required by Canadian securities regulatory authorities. Canadian Institute of Mining, Metallurgy and Petroleum (CIM) definitions were followed
for mineral reserves and resources. The reserves and resources figures stated are
estimates. No assurances whatsoever can be given that the indicated quantities of metal will be produced and totals stated may not add up due to rounding.
You are reminded that you have received this presentation on the basis that you
are a person to whom this presentation may be lawfully made and delivered. You may not and are not authorised to: (i) reproduce or publish this presentation; or
(ii) distribute, disclose or pass on this presentation to any other person, in whole
or in part, by any medium or in any form, in breach of any applicable securities laws. BY ACCEPTING THIS PRESENTATION, YOU ACKNOWLEDGE AND
AGREE TO THE CONTENTS OF THIS DISCLAIMER AND YOU AGREE TO BE
BOUND BY THE FOREGOING LIMITATIONS.
May 2017Bank of America Merrill Lynch Global Metals and Mining Conference 2

Company Overview
A leading African asset portfolio with a high-grade R&R of 27.5Moz
Our Assets Business Overview
North MaraHigh-grade open pit / UG mine
At least 10 year mine life
Bulyanhulu
High grade U/G mine nearing
geological potential
At least 18 year mine life
Buzwagi
Low-grade open pit which
completes mining at end of 2017
Will process stockpiles until 2020
Exploration
Maiden high-grade resource
declared in West Kenya
Built a pan-African portfolioProducing mines Exploration properties
Kenieba Belt JVsMali
West Kenya ProjectKenya
BulyanhuluTanzaniaHoundé Belt JVs
Burkina Faso
North MaraTanzania
BuzwagiTanzania
3
Nyanzaga ProjectTanzania
May 2017Bank of America Merrill Lynch Global Metals and Mining Conference

Our Operating Philosophy
We run de-centralised operations and outsource any function where we can’t
be a world leader
Four areas we will never outsource:
Technical prowess
Discovery
Leadership
Government and Community relationship
Capital allocation is centralised and led by the CEO
May 2017Bank of America Merrill Lynch Global Metals and Mining Conference 4
Operational focus on creating sustainable free cash flow
Creating a sustainable competitive advantage based on core
competencies

We have transformed our business
At this stage, despite current concentrate ban, we continue to expect
further production and AISC improvement in 2017
5May 2017Bank of America Merrill Lynch Global Metals and Mining Conference
1,561
1,346
1,105 1,112
958 880-920
626
642
719
732
830
850-900
600
650
700
750
800
850
900
0
300
600
900
1,200
1,500
1,800
2012 2013 2014 2015 2016 2017E
Pr
od
uc
tio
n (
ko
z)
AIS
C (
US
$/o
z)
AISC Progression vs Production
AISC Gold production
(1) 2017 chart represents mid-point of guidance range

Q1 2017 Performance
Gold production of 220koz, 15% higher than Q1 2016
Gold sales were 35koz lower than production
Primarily as a result of the Tanzanian Government’s directive stopping the export of metallic mineral concentrate
AISC was below previous quarter at US$934/oz
EBITDA of US$82 million, 25% higher than Q1 2016
Due to sales lagging production and indirect tax outflows net cash decreased to US$196 million
Continuing strong operational performance, financials impacted by ban
May 2017Bank of America Merrill Lynch Global Metals and Mining Conference 6
959 926 998 958 934 938
854 901 921 878
0
200
400
600
800
1,000
1,200
Q1 16 Q2 16 Q3 16 Q4 16 Q1 17
$ /
ou
nc
e
All In Sustaining Cost per Ounce
AISC AISC ex RSU
37 43 40 42 60
78 7953
80 63
75100
11391 97
0
50
100
150
200
250
Q1 16 Q2 16 Q3 16 Q4 16 Q1 17
Pr
od
uc
tio
n (
ko
z)
Production
Buzwagi Bulyanhulu North Mara
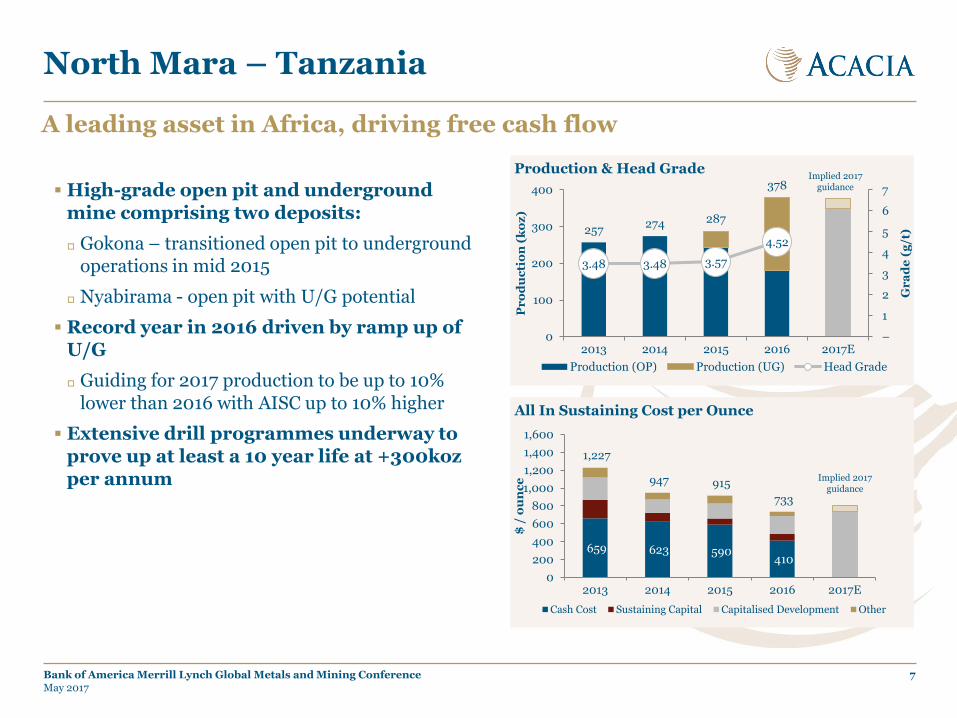
North Mara – Tanzania
High-grade open pit and underground mine comprising two deposits:
Gokona – transitioned open pit to underground operations in mid 2015
Nyabirama - open pit with U/G potential
Record year in 2016 driven by ramp up of U/G
Guiding for 2017 production to be up to 10% lower than 2016 with AISC up to 10% higher
Extensive drill programmes underway to prove up at least a 10 year life at +300koz per annum
A leading asset in Africa, driving free cash flow
7May 2017Bank of America Merrill Lynch Global Metals and Mining Conference
659 623 590 410
1,227
947 915
733
0
200
400
600
800
1,000
1,200
1,400
1,600
2013 2014 2015 2016 2017E
$ /
ou
nc
e
All In Sustaining Cost per Ounce
Cash Cost Sustaining Capital Capitalised Development Other
257274 287
378
3.48 3.48 3.57
4.52
–
1
2
3
4
5
6
7
0
100
200
300
400
2013 2014 2015 2016 2017E
Gr
ad
e (
g/t
)
Pr
od
uc
tio
n (
ko
z)
Production & Head Grade
Production (OP) Production (UG) Head Grade
Implied 2017 guidance
Implied 2017 guidance
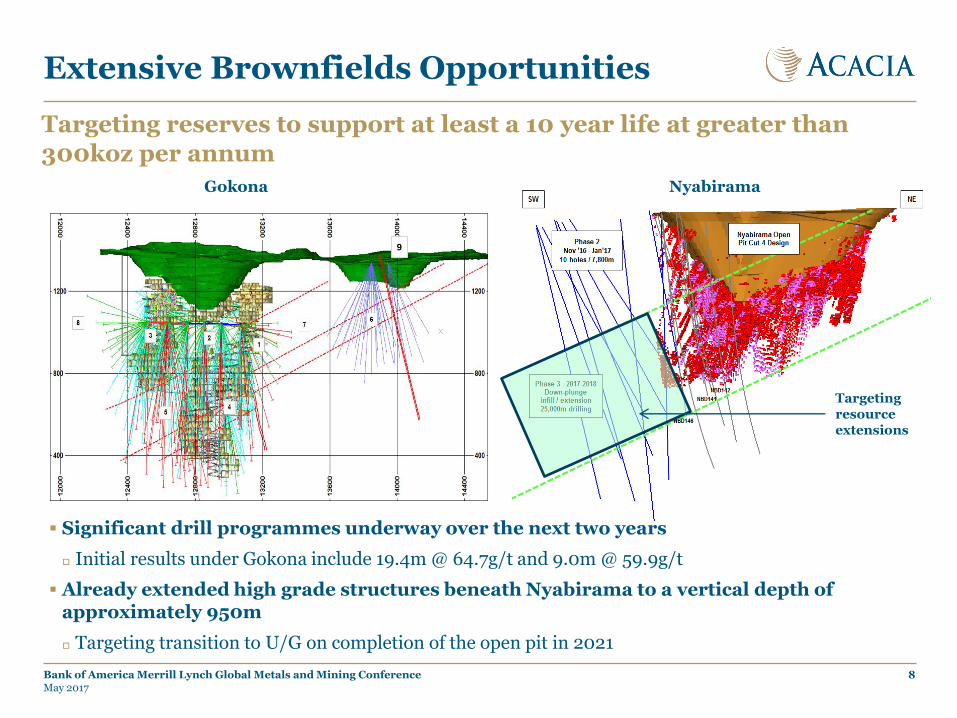
Extensive Brownfields Opportunities
8May 2017Bank of America Merrill Lynch Global Metals and Mining Conference
9
Gokona Nyabirama
Targeting resource extensions
Targeting reserves to support at least a 10 year life at greater than
300koz per annum
Significant drill programmes underway over the next two years
Initial results under Gokona include 19.4m @ 64.7g/t and 9.0m @ 59.9g/t
Already extended high grade structures beneath Nyabirama to a vertical depth of approximately 950m
Targeting transition to U/G on completion of the open pit in 2021

Bulyanhulu - Tanzania
High grade narrow vein deposit
Geological endowment of over 20 million ounces*
History of under-delivery and lack of free cash generation
Undertaken re-engineering of the mine to ensure delivers to its geologic potential
2016 was the highest production since 2006 as mine starts to deliver on potential
AISC has fallen significantly as changes to mine take effect
Ramping production to +300kozpa over the coming years
Continuing to operate normally and stockpiling concentrate production
Represents ~45% of mine production
Continuing the transformation
9
* Including produced ounces
May 2017Bank of America Merrill Lynch Global Metals and Mining Conference
198 222 240 255
–12
34 35
198
235
274289
7.808.70 8.58
9.28
4.0
6.0
8.0
10.0
12.0
14.0
0
50
100
150
200
250
300
350
2013 2014 2015 2016 2017E
Gr
ad
e (
g/t
)
Pr
od
uc
tio
n (
ko
z)
Production & Head Grade
Production (UG) Production (Tails) Head Grade (ROM)
889 812 797 722
1,344 1,266 1,253
1,058
0
200
400
600
800
1,000
1,200
1,400
1,600
2013 2014 2015 2016 2017E
$ /
ou
nc
e
All In Sustaining Cost per Ounce
Cash Cost Sustaining Capital Capitalised Development Other
Implied 2017 guidance
Implied 2017 guidance

Buzwagi - Tanzania
Set up to deliver additional cash flow from re-sequencing open pit
Bulk tonnage open pit mine
Q1 17 production of 60koz , 62% higher than Q1 2016, at an AISC of US$773/oz
Driven by a 64% increase in head grade
Extended mining by six months until the end of 2017
Will process stockpiles until 2020
Adds 150koz of production over the LOM
Expect a 40% increase in production and up to 30% reduction in AISC in 2017
Continuing to operate normally and stockpiling concentrate production
Represents ~55% of mine production
10May 2017Bank of America Merrill Lynch Global Metals and Mining Conference
945 791
1,046 1,031
1,507
1,055 1,187
1,095
–
200
400
600
800
1,000
1,200
1,400
1,600
1,800
2013 2014 2015 2016 2017E
$/o
un
ce
All In Sustaining Cost per Ounce
Cash Cost Sustaining Capital Capitalised Development Other
182 210
171 162
1.46
1.73
1.39
1.21
0.6
0.8
1.0
1.2
1.4
1.6
1.8
-
50
100
150
200
250
300
2013 2014 2015 2016 2017E
Gr
ad
e (
g/t
)
Pr
od
uc
tio
n (
ko
z)
Production & Head Grade
Production (OP) Production (UG) Head Grade
Implied 2017 guidance
Implied 2017 guidance

Major contributor to host economies
Tanzania continues to received increased benefits from our operations
Over time we have agreed to follow a number of the 2010 Mining Code regulations
Despite the terms of the stabilisation agreements signed with the Government
Contributes to the Tanzanian Government’s aim of self-funding the national budget
The voluntary concessions include:
Local service levies at each mine increased from US$200k to 0.3% of revenues (~US$1mpa per mine)
Increasing royalty payments to 4% in 2012, which has increased the royalty paid to the Government by US$50 million in last 4 years
Led to total local tax contribution of US$164 million in 2016
Incurred a corporate tax charge amounting to US$55 million
Royalties of US$47 million
Payroll taxes of US$40 million
Other taxes of approximately US$22 million
May 2017Bank of America Merrill Lynch Global Metals and Mining Conference 11

Metallic Mineral Concentrate Ban
In March 2017, the Ministry of Energy and Minerals announced a ban on the export of metallic mineral concentrates
In order to promote the creation of a domestic smelting industry
Impacts approximately 45% of Bulyanhulu’s revenues and 55% of Buzwagi’s revenues
North Mara is not impacted as it only produces doré
Continuing to engage with Government to achieve a resolution
Operating Bulyanhulu and Buzwagi as normal and stockpiling concentrate at each of the sites
Taken a range of actions to help manage the significant financial impact of the deferral of sales
During Q1 this negatively impacted cashflow by US$33 million due to loss of sales
Will re-assess the operational plans of the two mines if we cannot reach a resolution in the coming weeks
May 2017Bank of America Merrill Lynch Global Metals and Mining Conference 12
Impacting approximately 30% of group revenues

Local listing requirements
Focus from the Government to increase transparency of business in Tanzania
Enacting regulation on a sector by sector basis, to make companies list on the local stock exchange
First sector to be impacted was Telecommunications followed by mining
Mining regulations impose two main obligations
30% local shareholding obligation through listing on the local stock exchange
Obligation for each of the entities that own Bulyanhulu, Buzwagi and North Mara to individually list
Deadline for listing is 23 August 2017
Acacia Mining plc cross-listed on the DSE in 2011, to promote Tanzanian ownership
Engaging with the relevant authorities in Tanzania
To find a route forward that is both beneficial and practical for all stakeholders
May 2017Bank of America Merrill Lynch Global Metals and Mining Conference 13
Sector wide legislation to promote local ownership

Investing in Our Future
Systematically created a pan-African
greenfield exploration footprint
Exploration pipeline with over 60 targets
12 rigs drilling greenfields projects across
the portfolio
135,000 metres drilled in 2016
190,000 metres budgeted for 2017
2017 greenfield budget increased by 15% to
US$25m
Key projects for 2017:
West Kenya
Houndé Belt
North Mara (Gokona UG & Nyabirama UG)
We believe in exploration as a key driver of value and our approach is
beginning to deliver results
14
Brownfield projects Greenfield projects
Kenieba JVsMali
West Kenya ProjectKenya
Houndé Belt JVsBurkina Faso
BulyanhuluTanzania
Nyanzaga ProjectTanzania
North MaraTanzania
May 2017Bank of America Merrill Lynch Global Metals and Mining Conference
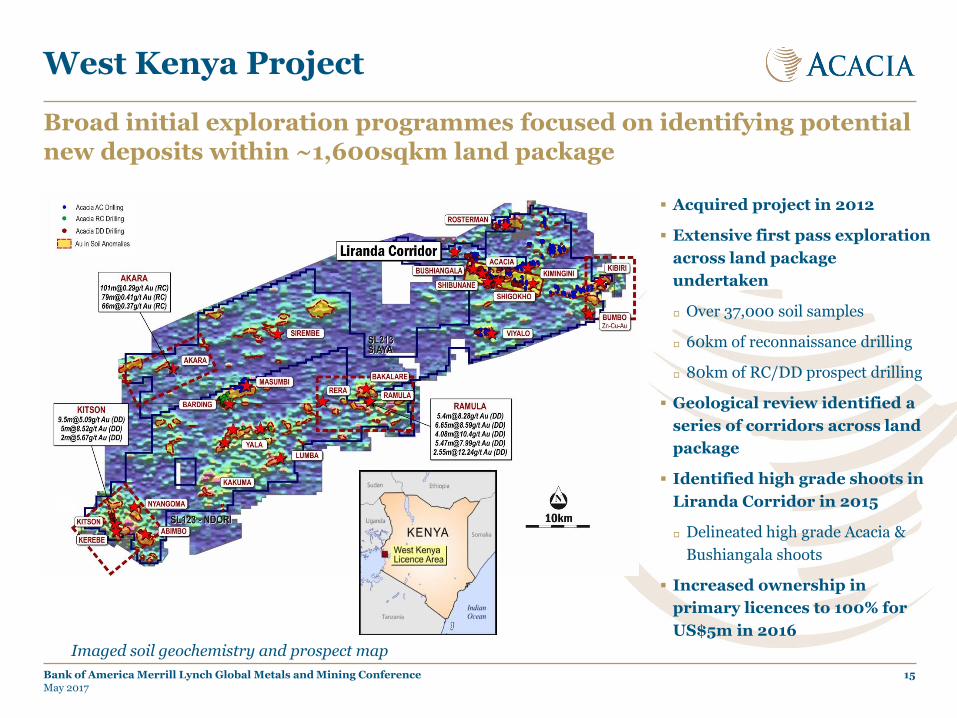
West Kenya Project
May 2017
Broad initial exploration programmes focused on identifying potential
new deposits within ~1,600sqkm land package
Bank of America Merrill Lynch Global Metals and Mining Conference 15
Acquired project in 2012
Extensive first pass exploration
across land package
undertaken
Over 37,000 soil samples
60km of reconnaissance drilling
80km of RC/DD prospect drilling
Geological review identified a
series of corridors across land
package
Identified high grade shoots in
Liranda Corridor in 2015
Delineated high grade Acacia &
Bushiangala shoots
Increased ownership in
primary licences to 100% for
US$5m in 2016
Imaged soil geochemistry and prospect map
Maiden Resource on Liranda Corridor
One of the highest grade projects in Africa
16
Declared NI43-101 compliant Inferred Resource 1.31 million ounces of gold at 12.1 grams per tonne
All of the resource is located on the Acacia prospect (one of five prospects on the Liranda Corridor) which remains open laterally and at depth
Mineralisation associated with shear zones averaging 3 metreswide, dependent on the zone, hosted by a mafic volcanic sequence
Strike lengths vary between 200m and 600m
Resource is currently defined down to a vertical depth of 750m
Near term upside from Bushiangala prospect
First step in the delineation of a multi-million ounce high-grade corridor
May 2017Bank of America Merrill Lynch Global Metals and Mining Conference
Tonnes Grade (Au g/t) Ounces
Inferred Resource1 3,461,000 12.1 1,305,700
1 The Mineral Resource has been estimated by Ms C Pitman, P.Geo.(Ontario) of AdiuvareGE. in conformity with the CIM Mineral Resources and Mineral Reserves Estimation Best Practice Guidelines (CIM, 2003) and are classified according to the CIM Standard Definition for Mineral Resources and Mineral Reserves (CIM, 2014).
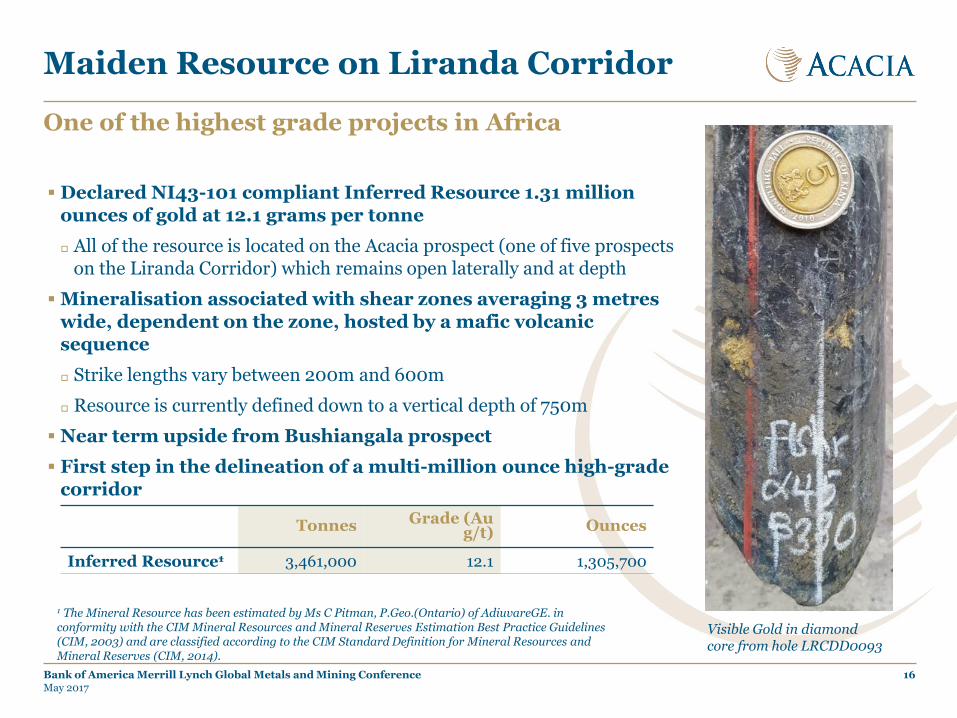
Visible Gold in diamond core from hole LRCDD0093

Liranda Corridor – New targets evolving
May 2017Bank of America Merrill Lynch Global Metals and Mining Conference 17
Potential for a multi-million ounce gold camp emerging
Bushiangala Acacia Shigokho-Shibunane
1km
Focus of 2016 drilling
Primary focus of 2017 drilling
Potential further upside being tested in 2017

Investment Case
Continue to expect a fifth consecutive year of increased production
Will represent a 40%(1) uplift from 2012
Further reduction in costs across the business
AISC will have fallen by US$775(1) per ounce since Q4 2012
Portfolio of assets set up to deliver free cash flow with a strong balance sheet to withstand impact of concentrate ban
Net cash position of US$196 million
Delivering success through the drill bit across Africa
West Kenya Project on the cusp of delivering high grade resource ounces
Engaging with Government to build long-term partnership that provides mutual success and stakeholder value
Focused on long term value creation for all of our stakeholders
(1) Mid point of 2017 guidance ranges
May 2017Bank of America Merrill Lynch Global Metals and Mining Conference 18