academic research - cloud object storage | store ...s3.amazonaws.com/zanran_storage/ · the...
TRANSCRIPT

Caption here
AcAdemicreseArchNorDan, naturally
3
Introduction 5
The sustainable approach 9
Energy supply, security and costs 11
Life cycle assessment of multi-glazed windows 15
Life cycle assessment of aluminium-clad timber windows 21
Carbon costing 29
The importance of U-values 33
NTech U-value calculations 35
NTech life cycle cost comparison 37
Whole life analysis 43
Conclusion 53
copyright © 2008, Nordan As
Printed on FSC Greencoat Plus Velvetusing Ecotricity
90%
Cert no. TT-COC-1977
Contents
Although the material presented in this booklet has been prepared with great care, neither the authors nor NorDan AS warrant the product performance or the results of any kind that may be obtained from the information presented herein.
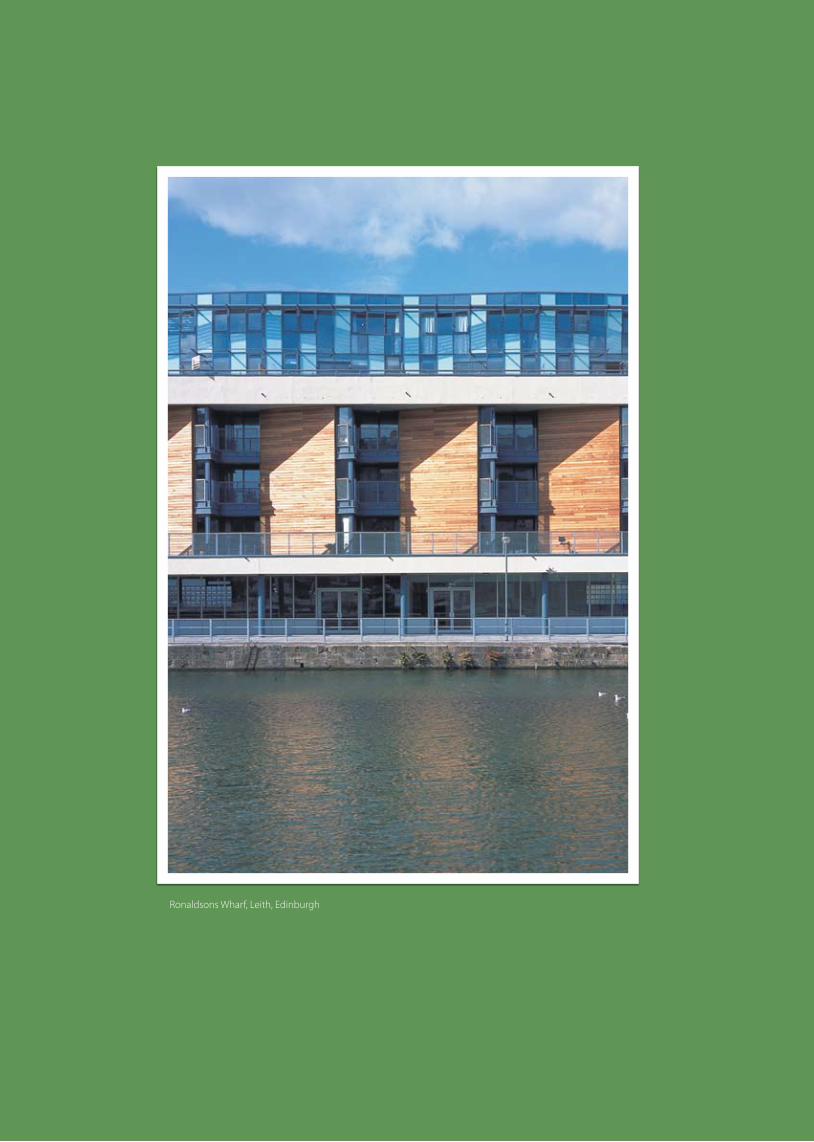
Ronaldsons Wharf, Leith, Edinburgh
introduction 5
In today’s fast-moving world, where commercial interests are pursued with vigour and at an ever increasing pace, concern is being raised that
with such rapid progress, little to no responsibility is being accepted for the environmental impact to our planet.
Some countries and companies are now paying heed to these warnings, others have been quietly observing a genuine respect for the environment for decades in the way they have developed their industries.
As one of Europe’s leading manufacturers of high performance timber windows and doors, NorDan has always placed great importance on technological progress whilst being mindful of its environmental responsibilities. Headquartered in the picturesque village of Moi in southern Norway, where the company was formed over eighty years ago, NorDan has always had a philosophy rooted in the Scandinavian values of respect for the natural environment allied to a centuries-old tradition in the use of timber, nature’s own sustainable and renewable resource.
Research and DevelopmentResearch and development has always been a major part of the company ethos and, in addition to having its own sophisticated in-house facility for testing and proving new designs and materials, the company has co-operated with scientific and educational establishments throughout Europe in advancing the science of window design and usage. In this publication NorDan illustrates how the joint ventures in research and development have influenced such topics as: Life Cycle Assessment and cost analysis, acoustic performance, Embodied Energy, environmental impact, sustainability and thermal efficiency. The latter resulted in the production of the NTech Passive window, with the astonishingly low whole window U-value of 0.7 W/m2K.
As the price of oil rises inexorably, people have become increasingly aware that they face a future without oil. Despite the discovery of further oil reserves, the supply is not infinite. This has given added impetus to the research of energy conservation of the dwindling amount of
energy reserves and alternative forms of energy generation. Reducing oil levies and/or increasing production are short term measures which will only delay the inevitable.
The challenge is now to reduce consumption and waste even further. To this end, NorDan is looking to take the NTech Passive technology to the next level, where windows will not only be totally resistant to the outward passage of heat from buildings, but will contribute significantly to the intake of heat from the external environment.
The research in this publication is meant not only to illustrate NorDan’s commitment to ongoing research, but also to provide useful data and information to everyone interested in the growing environmental issues and science of LCA and WLA. In particular NorDan hope the information will be useful for educational purposes, housing associations, and all professionals engaged in building design, construction and their professional services.
Introduction
6 introduction
Academic StudiesThe academic reports and scientific findings which appear in the ensuing pages are independent and unbiased.
energy supply, security and costs (2008),Page 11Professor Muneer’s report introduces the current energy supply problems along with increasing energy costs for consumers. A solution is offered to help reduce costs and conserve energy.
Life cycle assessment of multi-glazed windows (1998), Page 15The study was the result of 7 years of in-depth research, partly funded by NorDan AS and their daughter company NorDan UK Ltd. In the study, Doctor Menzies introduces the concepts of Sustainability and Life Cycle Assessments. Following detailed measurement of the factory’s manufacturing processes and energy use, an analysis was then carried out relating to multi-glazed windows by comparing different glazing types.
Life cycle assessment of aluminium-clad timber windows (2003), Page 21Doctor Asif’s research, based upon Life Cycle Assessment techniques, was applied specifically to aluminium clad timber windows. The study follows from Doctor Menzies’ work and compares not just glazing specifications but also the materials of various window types produced in; aluminium, PVC-U, timber and aluminium clad timber.
carbon costing (2008), Page 29In 2007 Doctor Menzies was asked by NorDan to update her previous Life Cycle Assessment work to incorporate NorDan’s new NTech window into the conclusions. The report examines carbon costing and zero carbon targets along with energy efficiency.
NTech life cycle cost comparison (2008),Page 37Professor Muneer and Doctor Asif were similarly asked by NorDan to update their previous studies to incorporate the new NTech range of windows. The study provides a detailed review of energy costs and carbon emissions comparing various window types.
Whole life analysis (2008), Page 43In 2005 NorDan asked Cyril Sweett to complete a Whole Life Analysis based on the previously completed academic Life Cycle Assessment reports. Cyril Sweett’s revised study, as detailed in this publication, continues from the initial report with the inclusion of environmental manufacturing costs (embedded energy) in conjunction with product running costs. The conclusion of the report provides detailed analysis of energy usage from manufacture to end of product life.
BiographiesProfessor Tariq muneer,Beng(hons), msc(hons), Phd, dsc, ceng, mimeche, FciBse, millennium Fellow
Tariq Muneer is presently a Professor in Energy
Engineering at Napier University. He chairs a large research program in the measurement and utilisation of solar energy in buildings. Professor Muneer is an international authority on the subject of solar radiation, daylight illumination modelling and solar energy utilisation. He has over twenty five years experience in the development of the relevant mathematical models, their incorporation in building energy simulation packages and development of innovative solar energy utilisation equipment. Professor Muneer has written over two hundred articles and four major books. He has been credited with several prestigious awards including the Royal Academy of Engineering ESO, the Leverhulme Trust and the University College, Oxford/General Electric Company fellowships. He is also the recipient of the Osmania University’s Karamat Jung Gold Medal, the CIBSE Carter Bronze Medal and the Napier Shaw Bronze Medals.
Professor Tariq Muneer, Professor in Energy Engineering & Director of Research, School of Engineering and the Built Environment, Napier University, 10 Colinton Road, Edinburgh, EH10 5DTScotland, UKEmail: [email protected]
ian miller,Bsc, msc, ceng, mBcscyril sweett Associate(Whole Life team)
NorDan appointed Cyril Sweett to carry out a product whole life cost assessment
in early 2005 following a number of discussions between the two companies about PFI and the drivers for product specification. Cyril Sweett was voted “Best Technical Adviser” in the 2004 and 2001 PFI/PPP Awards and has been recognised as market leading for its work in durability, whole life costing and risk management. Their specialist Whole Life Performance team is the largest in the industry and combines expertise in capital and operating cost modelling, durability and maintenance planning, supported by robust modelling software and data. Cyril Sweett are currently providing life cycle cost input for £3 billion of projects, primarily in the PFI/PPP and public sectors. They have advised on a vast range of PFI transactions in almost every sector including leisure, schools, accommodation, health, prisons and infrastructure.
Cyril Sweett Group plc, 60 Gray’s Inn Road, London, WC1X 8AQ, England, UKEmail: [email protected]
doctor Gillian menzies(née Weir) Beng, ceng, Phd, mei, mBiFm, miLT, ciBse Low carbon consultant
Dr. Gillian Menzies is a lecturer in the School of the Built
Environment at Heriot-Watt University. She has a track record of research in life cycle assessment (LCA) and sustainability, and has 11 publications in this field since 1996. Gillian is a Chartered Engineer and a member of the Energy Institute. She has an academic background in energy engineering and an ongoing interest in the indoor environment and facilities management for sustainability.
Doctor Menzies has a first class honours degree in Energy Engineering, post-graduate studies in Technology Management and a PhD in Life Cycle Assessment of multi-glazed windows. Her current research looks at low carbon footprint design for buildings. She has been principal investigator to two funded research programmes in this area in the last 4 years and has developed particular expertise in the Life Cycle Carbon Assessment of building design, materials and components. Dr. Menzies is also a registered Low Carbon Consultant with the CIBSE.
Dr. Gillian Menzies, Heriot-Watt University, School of the Built Environment, Sir Edwin Chadwick Building, Riccarton, Edinburgh, EH14 4AS, Scotland, UKEmail: [email protected]
doctor muhammad Asif, Beng(hons), msc, Phd, ceng, mei
Doctor Asif is presently working as a lecturer at the School of the Built and Natural Environment within
Glasgow Caledonian University. Previously he worked as a Research Assistant within the Applied Energy Engineering Group at Napier University, Edinburgh. In collaboration with industry, government agencies and other academic institutes he has worked on a range of projects related to sustainability issues. He is the principal author of four journals and two conference articles. He completed a BSc in Mechanical Engineering in 1997 and was awarded the ‘University Merit Scholarship’ by the Government of Pakistan. Subsequently, in 1998, he was awarded the Association of Commonwealth Countries Universities International Development Shared Scholarship to undertake an MSc at the University of Liverpool. In the year 2000 he joined Napier to undertake a PhD programme on life cycle assessment of aluminium clad timber windows. He successfully completed the PhD in the year 2002.
Dr Muhammad Asif, School of Built and Natural Environment, Glasgow Caledonian University, Cowcaddens Road, Glasgow, G4 0BA, Scotland, UKEmail: [email protected]
introduction 7
BackgroundIn early 1997, NorDan arranged for Napier University to carry out an environmental study of the company’s manufacturing and sales organisations in their Moi headquarters in Southern Norway. Professor Tariq Muneer of Napier University subsequently established a PhD programme entitled, ‘Life Cycle Assessment’ (LCA) and his then student Gillian Weir (now Dr. Gillian Menzies) undertook the research. In her papers Dr. Menzies states, “The Embodied Energy of finished windows must consider the energy required for manufacturing and the services required to sustain a workforce and to market and sell the product”. Her successful PhD research was published in 1998.
NorDan was pleased with the outcome of the research and appointed the Norwegian Institute of Wood Technology to carry out further environmental ‘housekeeping’, making use of Dr. Menzies’ work. The result was the publication of NorDan’s first ‘Environmental Declaration’ in 2001.
Although highly satisfied with the first LCA, NorDan considered there was room for further research and met again with Dr. Muneer to ask if the LCA could be extended by comparing the results obtained from NorDan products with those manufactured from other materials. Dr. Muneer initiated a new PhD programme entitled ‘Life Cycle Comparison Assessment’ (LCCA). The research, in this instance, was carried out by his student Muhammad Asif.
Asif began his research by visiting projects, some almost 40 years old, where NorDan timber and aluminium-clad timber windows had been installed. During the following months, NorDan AS (Norway) and their daughter company NorDan UK Ltd, provided many samples of different window types being replaced under major refurbishment projects. As NorDan UK Ltd specialises in contracting refurbishment works for Local Authorities, a large amount of samples were supplied from London ranging from
approximately 30 year old aluminium and steel, and notably, plastic windows apparently installed from only 4 years previous. All samples were sent to Napier University for detailed analysis.
At the same time, Muhammad Asif circulated a questionnaire to a number of Housing Associations and Local Authorities in order to gather additional information. A considerable amount of useful data was accumulated in this way and was combined with the results of the laboratory analysis to enhance the research project. The entire assessment process was completed in 2002 and Asif’s PhD paper was published soon after.
Whilst Asif was still involved in his PhD research, NorDan met again with Napier University to establish if a Life Cycle Cost Comparison Assessment (LCCCA) should be the logical next step in the research process. Agreement was reached in principal on its inclusion in the research; however its implementation proved to be impossible as no other manufacturer had produced an LCA with which comparisons could be made. Nevertheless, Muhammad Asif did succeed in incorporating some LCCCA data within his PhD.
It was not until late 2004 that NorDan contacted Cyril Sweett, construction consultants based in London. An existing platform to further explore the potential of LCCCA was developed, in the form of a Whole Life Analysis. In 2005 Cyril Sweet were commissioned and the first NorDan whole life costing was produced.
Simultaneously, with the evidence of global warming becoming increasingly more apparent and with the need for more sustainable products becoming more urgent, NorDan were occupied in research and development of a new product to deliver windows with the lowest achievable EE together with the most commercially viable energy saving U-value. The culmination of this research has been the introduction of the NorDan ‘NTech Passive’ window with its remarkably low U-value of 0.7 W/m2K.
Further WorkNorDan encourage customers and clients to contact them direct on technical matters and have, over the years, benefited from information shared with, and obtained from, end-users of their products. NorDan would like the process to continue; together, making a common cause in the drive to improve the environment for future generations. Contact details can be found on the back cover.
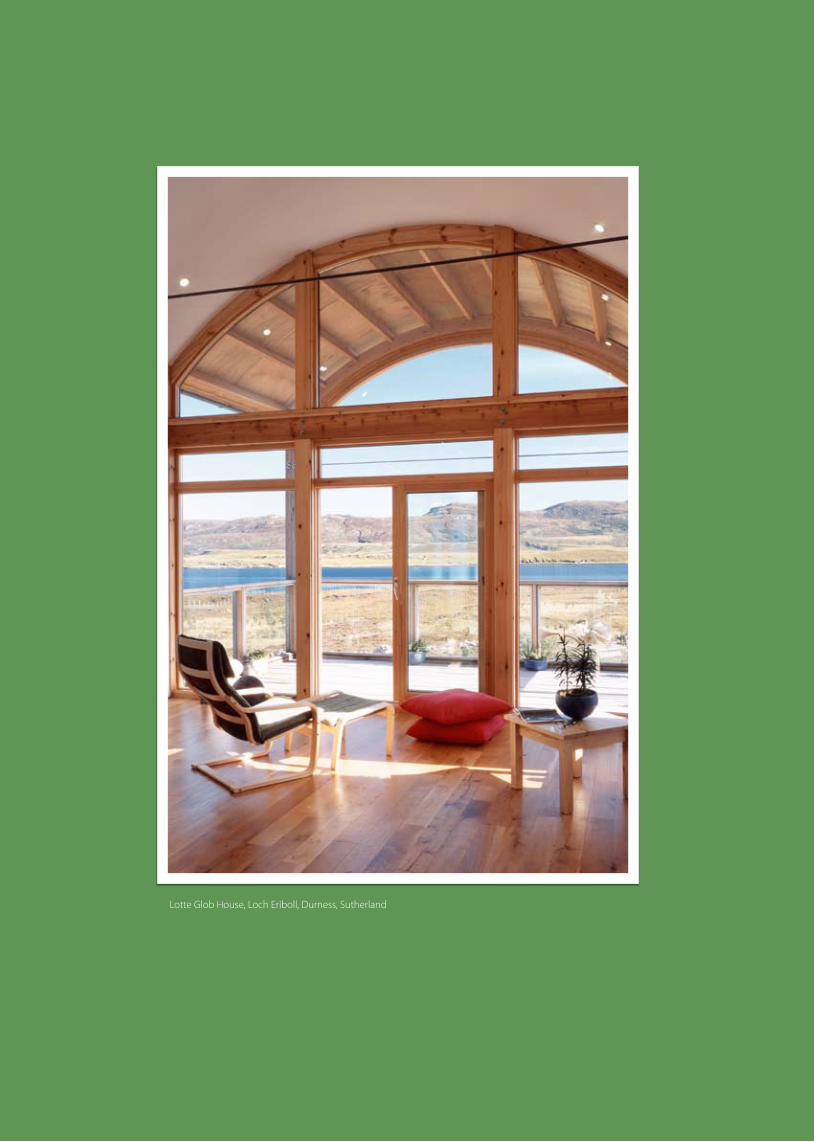
Lotte Glob House, Loch Eriboll, Durness, Sutherland
The sustainable approach 9
Increased environmental awareness has urged specifiers to take greater responsibility in their selection of building components.
Manufactured products with a high Embodied Energy (EE) or Carbon Footprint are now being abandoned in favour of products with well researched low Embodied Energy (EE), Life Cycle Assessment (LCA) and Whole Life Analysis (WLA) documentation to validate their environmental credentials. NorDan high performance windows and doors fall into this category.
The previous widespread use of PVC-U products, based on the assumption that they were ‘maintenance free’, has long been contested and disputed. PVC-U products are generally cheaper to replace than they are to repair. What is of much more concern is the energy consumed in their manufacture, together with the toxic by-products of that process, and the difficulty in recycling, with it’s consequent land-fill problems. These aspects are now widely effecting the selection of PVC-U, even if it is still one of the cheapest options.
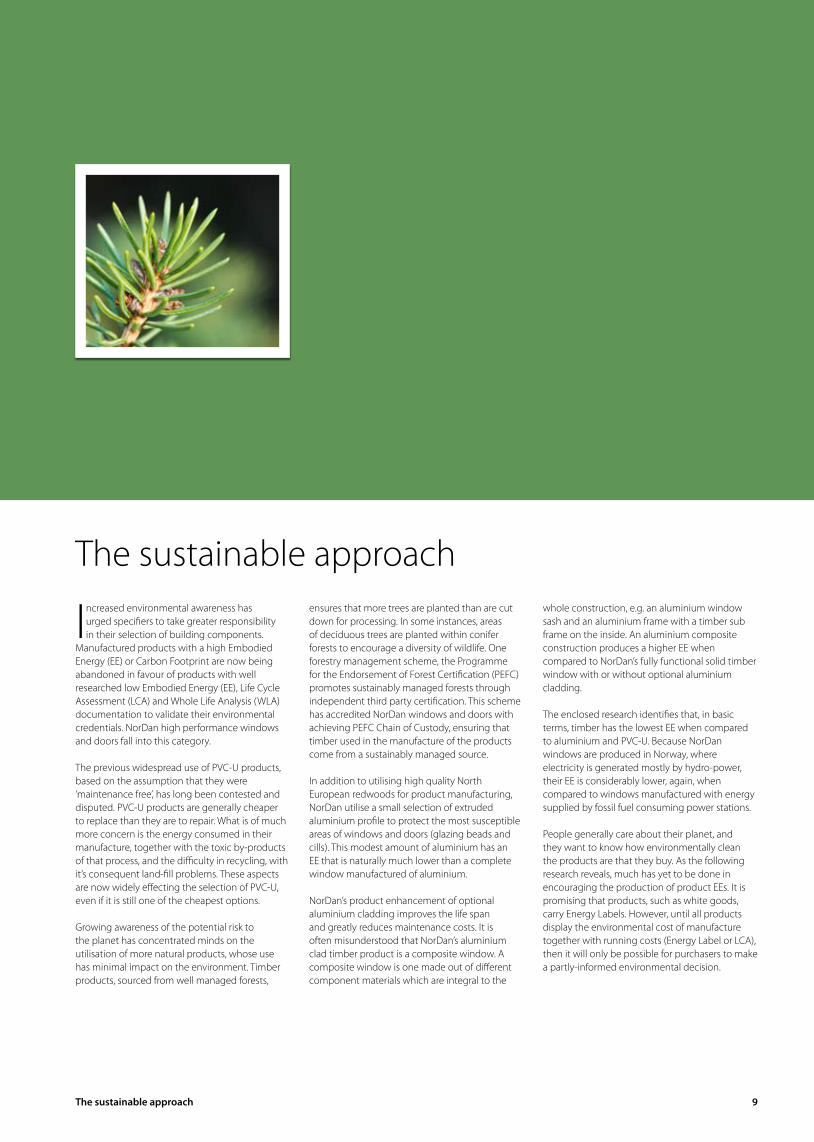
Growing awareness of the potential risk to the planet has concentrated minds on the utilisation of more natural products, whose use has minimal impact on the environment. Timber products, sourced from well managed forests,
ensures that more trees are planted than are cut down for processing. In some instances, areas of deciduous trees are planted within conifer forests to encourage a diversity of wildlife. One forestry management scheme, the Programme for the Endorsement of Forest Certification (PEFC) promotes sustainably managed forests through independent third party certification. This scheme has accredited NorDan windows and doors with achieving PEFC Chain of Custody, ensuring that timber used in the manufacture of the products come from a sustainably managed source.
In addition to utilising high quality North European redwoods for product manufacturing, NorDan utilise a small selection of extruded aluminium profile to protect the most susceptible areas of windows and doors (glazing beads and cills). This modest amount of aluminium has an EE that is naturally much lower than a complete window manufactured of aluminium.
NorDan’s product enhancement of optional aluminium cladding improves the life span and greatly reduces maintenance costs. It is often misunderstood that NorDan’s aluminium clad timber product is a composite window. A composite window is one made out of different component materials which are integral to the
whole construction, e.g. an aluminium window sash and an aluminium frame with a timber sub frame on the inside. An aluminium composite construction produces a higher EE when compared to NorDan’s fully functional solid timber window with or without optional aluminium cladding.
The enclosed research identifies that, in basic terms, timber has the lowest EE when compared to aluminium and PVC-U. Because NorDan windows are produced in Norway, where electricity is generated mostly by hydro-power, their EE is considerably lower, again, when compared to windows manufactured with energy supplied by fossil fuel consuming power stations.
People generally care about their planet, and they want to know how environmentally clean the products are that they buy. As the following research reveals, much has yet to be done in encouraging the production of product EEs. It is promising that products, such as white goods, carry Energy Labels. However, until all products display the environmental cost of manufacture together with running costs (Energy Label or LCA), then it will only be possible for purchasers to make a partly-informed environmental decision.
The sustainable approach
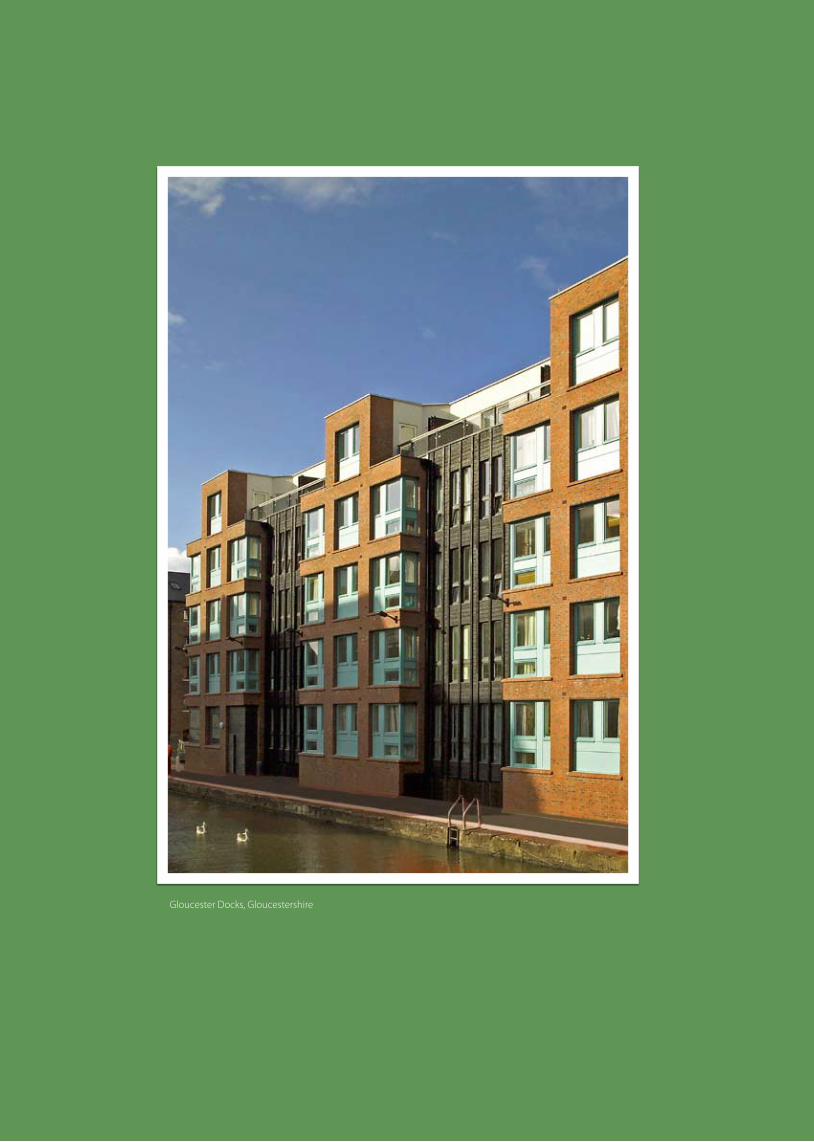
Gloucester Docks, Gloucestershire
energy supply, security and costs 11
Professor Tariq muneermay 2008
The world relies heavily on fossil fuels to meet its energy requirements – fossil fuels such as oil, gas and coal are providing
almost 80% of the global energy demands. On the other hand, presently renewable energy and nuclear power are, respectively, only contributing 13.5 and 6.5% of the total energy needs (IEA, 2004). The global demand for energy is rapidly increasing with increasing human population, urbanisation and modernisation. The growth in global energy demand is projected to rise sharply over the coming years. The International Energy Outlook (2005) projects strong growth for worldwide energy demand up to 2025. Total world consumption of marketed energy is expected to expand by 57% over the 2002 to 2025 time period.
Although the popular media and scientific research journals are awash of stories related to: (a) depletion of fossil fuels, (b) the ever-increasing fossil energy costs, (c) the West’s increasing dependence on importation of oil and gas from politically unstable regions of the world, (d) an increasing trend towards start-up of new build nuclear power plants, and (e) lack of infrastructure for uptake of renewable energy, two well researched books have been recently published that sum up the starkness of approaching energy bankruptcy in an authoritative manner.
The single global marketplace we all inhabit is built on the notion of a solid, growing supply of cheap oil and gas for decades to come. But the bedrock is about to crack and crumble [2]. Thus runs the opening paragraph of the book written by Jeremy Legget ‘Half Gone: Oil, Gas, Hot Air and the Global Energy Crisis’ (Portobello Books, 2005). Quoting senior geologists, civil servants and energy industry pundits, this hard-hitting book informs us of the looming threat of oil wells running dry is fast approaching.
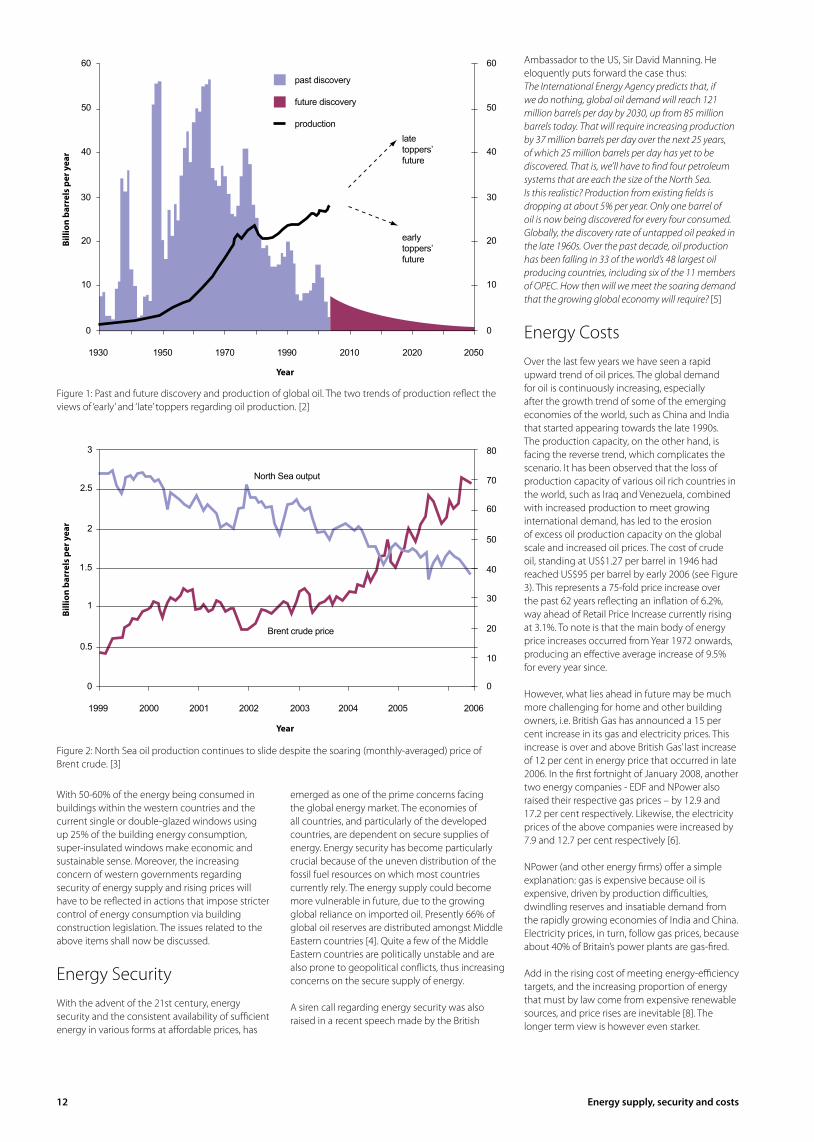
The other book that is worthy of mention is David Strahan’s ‘The Last Oil Shock’ (John Murray Publishers, London, 2007). Both of these authors have discussed at length the ‘topping point’, which is the date by which global oil production will reach its maximum point, with the years to follow being described as the period of exhaustion. From a security of supply point of view, that date is very important. Both authors – Legget and Strahan argue that the western oil reserves have crossed that topping point, while the date for global reserves is fast approaching. Table 1 provides a comprehensive summary of results published on the global topping point. Figures 1 and 2 (see overleaf ) respectively present the stark picture of the likely drop in production of oil in future years.
Author Affiliation Peak year
Hubert Shell 2000
Bookout Shell 2010
Mackenzie Researcher 2007-2019
Appleby BP 2010
Invanhoe Consultant 2010
Edwards Colorado University 2020
Campbell Consultant 2010
Bernaby ENI 2005
Schollenberger Amoco 2015-2035
IEA OECD 2010-2020
EIA DOE 2030
Laherrere Consultant 2010
Salameh Consultant 2004-2005
Deffeyes Princeton University 2004
Table 1: Various peak year projections for global oil production [1]
Energy SupplyIt is estimated that, globally speaking, some 1000 billion barrels have already been consumed and 1000 billion barrels of proven oil reserves are left in the world. Declining oil production will cause a global energy gap that will have to be met partly via very stringent energy efficiency measures.
Energy supply, security and costs
12 energy supply, security and costs
With 50-60% of the energy being consumed in buildings within the western countries and the current single or double-glazed windows using up 25% of the building energy consumption, super-insulated windows make economic and sustainable sense. Moreover, the increasing concern of western governments regarding security of energy supply and rising prices will have to be reflected in actions that impose stricter control of energy consumption via building construction legislation. The issues related to the above items shall now be discussed.
Energy SecurityWith the advent of the 21st century, energy security and the consistent availability of sufficient energy in various forms at affordable prices, has
emerged as one of the prime concerns facing the global energy market. The economies of all countries, and particularly of the developed countries, are dependent on secure supplies of energy. Energy security has become particularly crucial because of the uneven distribution of the fossil fuel resources on which most countries currently rely. The energy supply could become more vulnerable in future, due to the growing global reliance on imported oil. Presently 66% of global oil reserves are distributed amongst Middle Eastern countries [4]. Quite a few of the Middle Eastern countries are politically unstable and are also prone to geopolitical conflicts, thus increasing concerns on the secure supply of energy.
A siren call regarding energy security was also raised in a recent speech made by the British
Ambassador to the US, Sir David Manning. He eloquently puts forward the case thus:The International Energy Agency predicts that, if we do nothing, global oil demand will reach 121 million barrels per day by 2030, up from 85 million barrels today. That will require increasing production by 37 million barrels per day over the next 25 years, of which 25 million barrels per day has yet to be discovered. That is, we’ll have to find four petroleum systems that are each the size of the North Sea.Is this realistic? Production from existing fields is dropping at about 5% per year. Only one barrel of oil is now being discovered for every four consumed. Globally, the discovery rate of untapped oil peaked in the late 1960s. Over the past decade, oil production has been falling in 33 of the world’s 48 largest oil producing countries, including six of the 11 members of OPEC. How then will we meet the soaring demand that the growing global economy will require? [5]
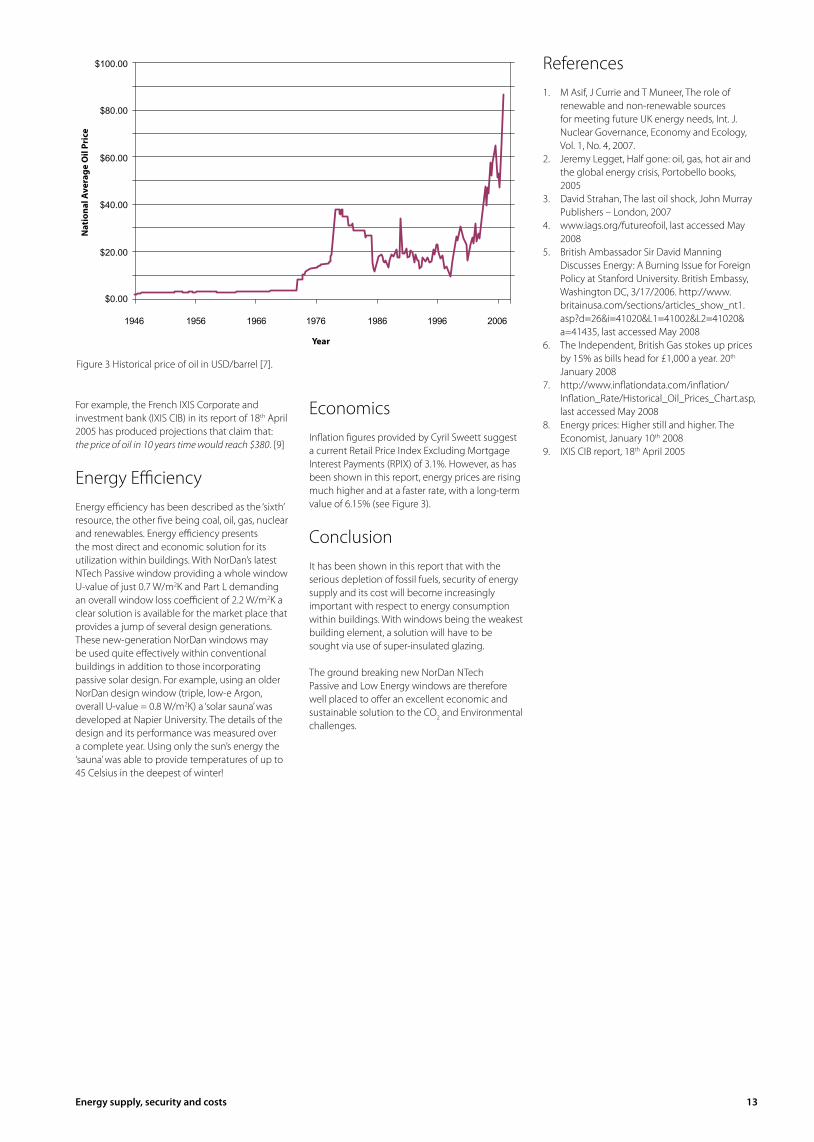
Energy CostsOver the last few years we have seen a rapid upward trend of oil prices. The global demand for oil is continuously increasing, especially after the growth trend of some of the emerging economies of the world, such as China and India that started appearing towards the late 1990s. The production capacity, on the other hand, is facing the reverse trend, which complicates the scenario. It has been observed that the loss of production capacity of various oil rich countries in the world, such as Iraq and Venezuela, combined with increased production to meet growing international demand, has led to the erosion of excess oil production capacity on the global scale and increased oil prices. The cost of crude oil, standing at US$1.27 per barrel in 1946 had reached US$95 per barrel by early 2006 (see Figure 3). This represents a 75-fold price increase over the past 62 years reflecting an inflation of 6.2%, way ahead of Retail Price Increase currently rising at 3.1%. To note is that the main body of energy price increases occurred from Year 1972 onwards, producing an effective average increase of 9.5% for every year since.
However, what lies ahead in future may be much more challenging for home and other building owners, i.e. British Gas has announced a 15 per cent increase in its gas and electricity prices. This increase is over and above British Gas’ last increase of 12 per cent in energy price that occurred in late 2006. In the first fortnight of January 2008, another two energy companies - EDF and NPower also raised their respective gas prices – by 12.9 and 17.2 per cent respectively. Likewise, the electricity prices of the above companies were increased by 7.9 and 12.7 per cent respectively [6].
NPower (and other energy firms) offer a simple explanation: gas is expensive because oil is expensive, driven by production difficulties, dwindling reserves and insatiable demand from the rapidly growing economies of India and China. Electricity prices, in turn, follow gas prices, because about 40% of Britain’s power plants are gas-fired.
Add in the rising cost of meeting energy-efficiency targets, and the increasing proportion of energy that must by law come from expensive renewable sources, and price rises are inevitable [8]. The longer term view is however even starker.
0
10
20
30
40
50
60
1930 1950 1970 1990 2010 2020
latetoppers’future
earlytoppers’future
past discovery
future discovery
production
2050
0
10
20
30
40
50
60B
illio
n ba
rrel
s pe
r yea
r
YearYear
Billi
on b
arre
ls p
er y
ear
Figure 1: Past and future discovery and production of global oil. The two trends of production reflect the views of ‘early’ and ‘late’ toppers regarding oil production. [2]
0
0.5
1
1.5
2
2.5
3
1999 2000 2001 2002 2003 2004 2005
North Sea output
Brent crude price
2006
0
10
20
30
40
50
60
70
80
Bill
ion
barr
els
per y
ear
YearYear
Billi
on b
arre
ls p
er y
ear
Figure 2: North Sea oil production continues to slide despite the soaring (monthly-averaged) price of Brent crude. [3]
energy supply, security and costs 13
For example, the French IXIS Corporate and investment bank (IXIS CIB) in its report of 18th April 2005 has produced projections that claim that:the price of oil in 10 years time would reach $380. [9]
Energy EfficiencyEnergy efficiency has been described as the ‘sixth’ resource, the other five being coal, oil, gas, nuclear and renewables. Energy efficiency presents the most direct and economic solution for its utilization within buildings. With NorDan’s latest NTech Passive window providing a whole window U-value of just 0.7 W/m2K and Part L demanding an overall window loss coefficient of 2.2 W/m2K a clear solution is available for the market place that provides a jump of several design generations. These new-generation NorDan windows may be used quite effectively within conventional buildings in addition to those incorporating passive solar design. For example, using an older NorDan design window (triple, low-e Argon, overall U-value = 0.8 W/m2K) a ‘solar sauna’ was developed at Napier University. The details of the design and its performance was measured over a complete year. Using only the sun’s energy the ‘sauna’ was able to provide temperatures of up to 45 Celsius in the deepest of winter!
EconomicsInflation figures provided by Cyril Sweett suggest a current Retail Price Index Excluding Mortgage Interest Payments (RPIX) of 3.1%. However, as has been shown in this report, energy prices are rising much higher and at a faster rate, with a long-term value of 6.15% (see Figure 3).
ConclusionIt has been shown in this report that with the serious depletion of fossil fuels, security of energy supply and its cost will become increasingly important with respect to energy consumption within buildings. With windows being the weakest building element, a solution will have to be sought via use of super-insulated glazing.
The ground breaking new NorDan NTech Passive and Low Energy windows are therefore well placed to offer an excellent economic and sustainable solution to the CO2 and Environmental challenges.
References1. M Asif, J Currie and T Muneer, The role of
renewable and non-renewable sources for meeting future UK energy needs, Int. J. Nuclear Governance, Economy and Ecology, Vol. 1, No. 4, 2007.
2. Jeremy Legget, Half gone: oil, gas, hot air and the global energy crisis, Portobello books, 2005
3. David Strahan, The last oil shock, John Murray Publishers – London, 2007
4. www.iags.org/futureofoil, last accessed May 2008
5. British Ambassador Sir David Manning Discusses Energy: A Burning Issue for Foreign Policy at Stanford University. British Embassy, Washington DC, 3/17/2006. http://www.britainusa.com/sections/articles_show_nt1.asp?d=26&i=41020&L1=41002&L2=41020&a=41435, last accessed May 2008
6. The Independent, British Gas stokes up prices by 15% as bills head for £1,000 a year. 20th January 2008
7. http://www.inflationdata.com/inflation/Inflation_Rate/Historical_Oil_Prices_Chart.asp, last accessed May 2008
8. Energy prices: Higher still and higher. The Economist, January 10th 2008
9. IXIS CIB report, 18th April 2005
Figure 3 Historical price of oil in USD/barrel [7].
$0.00
$20.00
$40.00
$60.00
$80.00
$100.00
1946 1956 1966 1976 1986 1996 2006
Nom
inal
Ave
rage
Oil
Pric
e
YearYear
Nat
iona
l Ave
rage
Oil
Pric
e
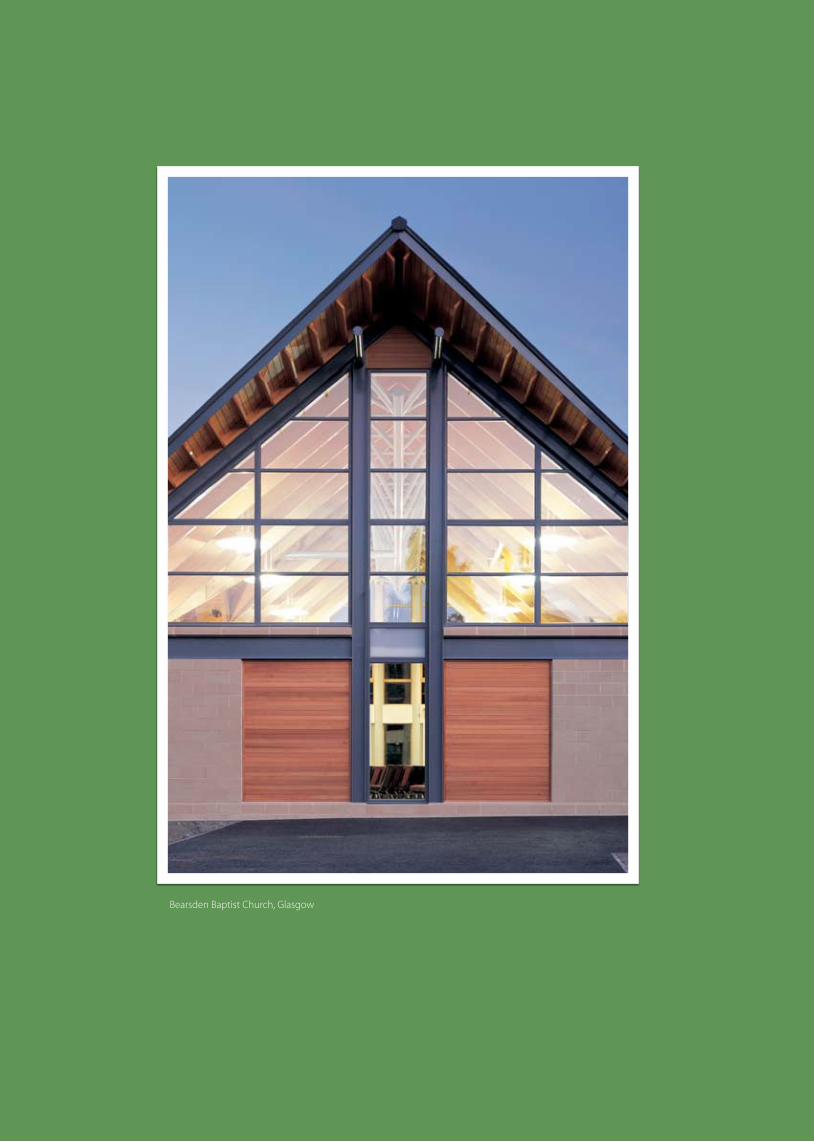
Bearsden Baptist Church, Glasgow
Life cycle assessment of multi-glazed windows 15
dr. Gillian menzies, Professor Tariq muneer1998
Introduction
A million billion kilojoules of energy in the form of fuel is combusted daily, equivalent to eight billion tonnes of oil annually.
Almost 90% of our energy comes from burning fossil fuels, which will eventually be exhausted [1].
In developed countries, energy consumption in residential sectors accounts for between 20% and 30% of the total energy used (30% in the UK) [2]. Windows in dwellings alone account for 6% of the total UK energy consumption. There is a clear need to address an ongoing requirement to focus on sustainable development. Life Cycle Assessment (LCA) can help to develop a greater understanding of the life cycle of multi-glazed windows, and highlight improvements which are required to limit environmental damage.
To perform a successful Life Cycle Assessment on any building component calls for the demands of modern day living, and the comfort conditions expected, be incorporated into design criteria, whilst ensuring that the needs of future
generations are not compromised by today’s activities. The first objective for building in the 21st Century is to significantly reduce annual energy needs, driven by a whole-life or cradle-to-grave analysis. There is a need to switch our activities towards redressing the harm that our past and present activities impose upon the global environment.
A Life Cycle Assessment of windows is performed to quantify the energy consumption throughout the life of a window and the burden this places on the environment.
The aim is to design and select windows which create the pleasant and comfortable interiors expected in modern-day buildings but also have as little detrimental impact on the environment as possible. This approach demands that the energy associated with sourcing materials, manufacturing products, transportation, use and disposal be researched, and the environmental impact of these activities quantified. The design and use of windows also impacts heavily on energy and the environment. They should be designed to have good insulative properties, efficient light transmission, and to provide sufficient noise insulation in order that building users are satisfied with their indoor environment.
The optimal window design to meet this set of criteria was found to be of triple glazed construction employing glass of 4mm thickness and having two low-emissivity glazing coatings and two Argon gas filled cavities (4e-16Ar-4-16Ar-e4). Selection was made from a number of single, double and triple glazed options, with and without low-emissivity glazing coatings and employing air, Argon, Krypton or Xenon filled cavities.
What is a Life Cycle Assessment?Impacts on the environment are varied. Damage to the atmosphere, depletion of the world’s natural resources, human health factors, animal habitat changes, noise pollution, and the availability of raw materials and primary fuel for future generations are just a few ways in which the environment is affected by daily activities. Life Cycle Assessment takes a holistic view of a product life cycle and aims to identify those stages which are most damaging to the environment.
It is necessary to consider the impact which raw material extraction, energy production, manufacturing processes, transportation needs
Life cycle assessment of multi-glazed windows
16 Life cycle assessment of multi-glazed windows
and waste disposal requirements have on both social and natural environments.
MATERIALS ENERGY
TRANSPORT
FRESH WATER
WASTE
RAWMATERIALS
MANUFACTURERECYCLE /DISPOSE
USE RETAIL
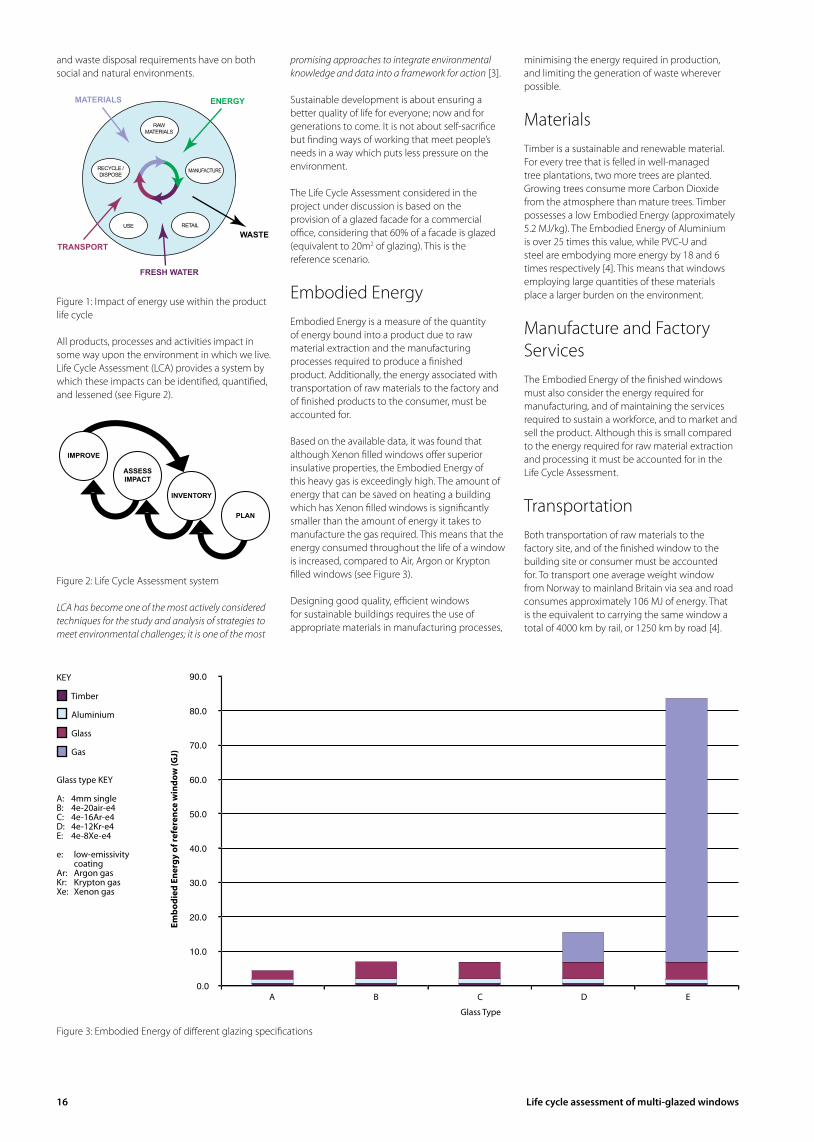
Figure 1: Impact of energy use within the product life cycle
All products, processes and activities impact in some way upon the environment in which we live. Life Cycle Assessment (LCA) provides a system by which these impacts can be identified, quantified, and lessened (see Figure 2).
PLAN
INVENTORY
ASSESSIMPACT
IMPROVE
Figure 2: Life Cycle Assessment system
LCA has become one of the most actively considered techniques for the study and analysis of strategies to meet environmental challenges; it is one of the most
promising approaches to integrate environmental knowledge and data into a framework for action [3].
Sustainable development is about ensuring a better quality of life for everyone; now and for generations to come. It is not about self-sacrifice but finding ways of working that meet people’s needs in a way which puts less pressure on the environment.
The Life Cycle Assessment considered in the project under discussion is based on the provision of a glazed facade for a commercial office, considering that 60% of a facade is glazed (equivalent to 20m2 of glazing). This is the reference scenario.
Embodied EnergyEmbodied Energy is a measure of the quantity of energy bound into a product due to raw material extraction and the manufacturing processes required to produce a finished product. Additionally, the energy associated with transportation of raw materials to the factory and of finished products to the consumer, must be accounted for.
Based on the available data, it was found that although Xenon filled windows offer superior insulative properties, the Embodied Energy of this heavy gas is exceedingly high. The amount of energy that can be saved on heating a building which has Xenon filled windows is significantly smaller than the amount of energy it takes to manufacture the gas required. This means that the energy consumed throughout the life of a window is increased, compared to Air, Argon or Krypton filled windows (see Figure 3).
Designing good quality, efficient windows for sustainable buildings requires the use of appropriate materials in manufacturing processes,
minimising the energy required in production, and limiting the generation of waste wherever possible.
MaterialsTimber is a sustainable and renewable material. For every tree that is felled in well-managed tree plantations, two more trees are planted. Growing trees consume more Carbon Dioxide from the atmosphere than mature trees. Timber possesses a low Embodied Energy (approximately 5.2 MJ/kg). The Embodied Energy of Aluminium is over 25 times this value, while PVC-U and steel are embodying more energy by 18 and 6 times respectively [4]. This means that windows employing large quantities of these materials place a larger burden on the environment.
Manufacture and Factory ServicesThe Embodied Energy of the finished windows must also consider the energy required for manufacturing, and of maintaining the services required to sustain a workforce, and to market and sell the product. Although this is small compared to the energy required for raw material extraction and processing it must be accounted for in the Life Cycle Assessment.
TransportationBoth transportation of raw materials to the factory site, and of the finished window to the building site or consumer must be accounted for. To transport one average weight window from Norway to mainland Britain via sea and road consumes approximately 106 MJ of energy. That is the equivalent to carrying the same window a total of 4000 km by rail, or 1250 km by road [4].
KEY
Timber
Aluminium
Glass
Gas
Glass type KEY
A: 4mm singleB: 4e-20air-e4C: 4e-16Ar-e4D: 4e-12Kr-e4E: 4e-8Xe-e4
e: low-emissivity coating
Ar: Argon gasKr: Krypton gasXe: Xenon gas
Figure 3: Embodied Energy of different glazing specifications
A B C D E
Glass Type
Embo
died
Ene
rgy
of re
fere
nce
win
dow
(GJ)
Life cycle assessment of multi-glazed windows 17
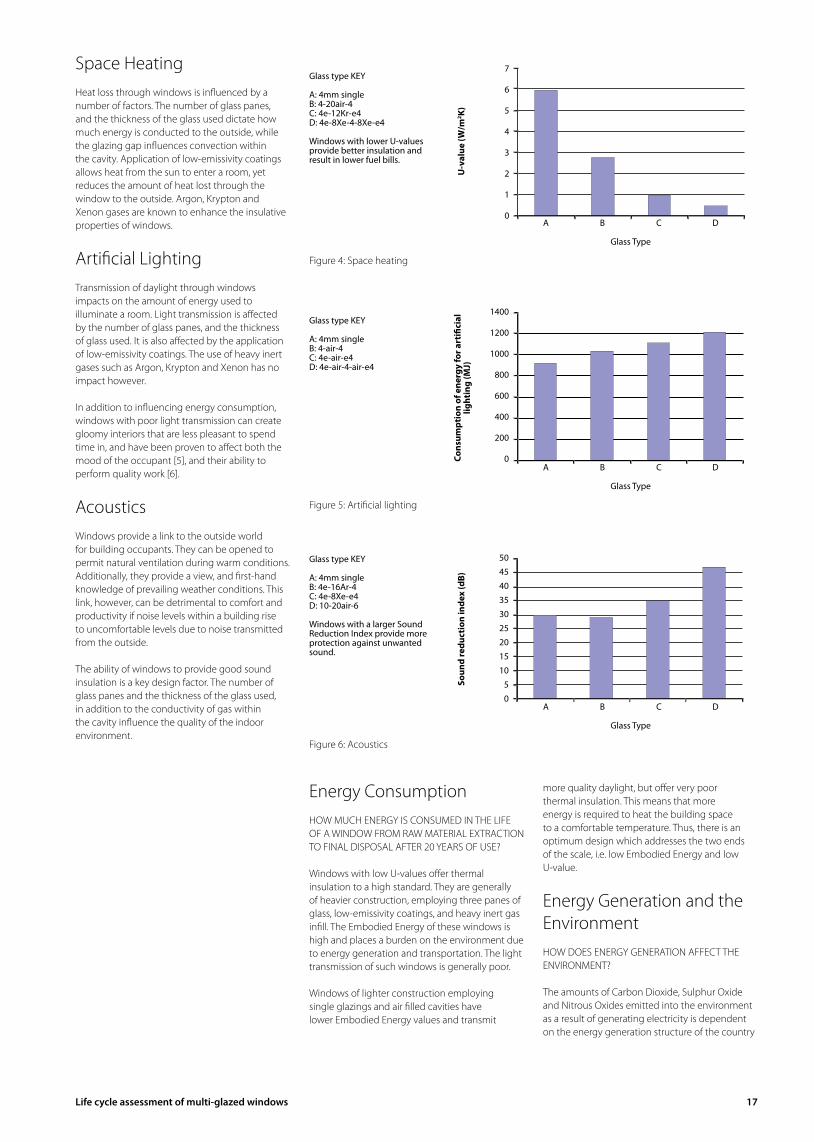
Space HeatingHeat loss through windows is influenced by a number of factors. The number of glass panes, and the thickness of the glass used dictate how much energy is conducted to the outside, while the glazing gap influences convection within the cavity. Application of low-emissivity coatings allows heat from the sun to enter a room, yet reduces the amount of heat lost through the window to the outside. Argon, Krypton and Xenon gases are known to enhance the insulative properties of windows.
Artificial LightingTransmission of daylight through windows impacts on the amount of energy used to illuminate a room. Light transmission is affected by the number of glass panes, and the thickness of glass used. It is also affected by the application of low-emissivity coatings. The use of heavy inert gases such as Argon, Krypton and Xenon has no impact however.
In addition to influencing energy consumption, windows with poor light transmission can create gloomy interiors that are less pleasant to spend time in, and have been proven to affect both the mood of the occupant [5], and their ability to perform quality work [6].
AcousticsWindows provide a link to the outside world for building occupants. They can be opened to permit natural ventilation during warm conditions. Additionally, they provide a view, and first-hand knowledge of prevailing weather conditions. This link, however, can be detrimental to comfort and productivity if noise levels within a building rise to uncomfortable levels due to noise transmitted from the outside.
The ability of windows to provide good sound insulation is a key design factor. The number of glass panes and the thickness of the glass used, in addition to the conductivity of gas within the cavity influence the quality of the indoor environment.
Energy ConsumptionHOW MUCH ENERGY IS CONSUMED IN THE LIFE OF A WINDOW FROM RAW MATERIAL EXTRACTION TO FINAL DISPOSAL AFTER 20 YEARS OF USE?
Windows with low U-values offer thermal insulation to a high standard. They are generally of heavier construction, employing three panes of glass, low-emissivity coatings, and heavy inert gas infill. The Embodied Energy of these windows is high and places a burden on the environment due to energy generation and transportation. The light transmission of such windows is generally poor.
Windows of lighter construction employing single glazings and air filled cavities have lower Embodied Energy values and transmit
more quality daylight, but offer very poor thermal insulation. This means that more energy is required to heat the building space to a comfortable temperature. Thus, there is an optimum design which addresses the two ends of the scale, i.e. low Embodied Energy and low U-value.
Energy Generation and the EnvironmentHOW DOES ENERGY GENERATION AFFECT THE ENVIRONMENT?
The amounts of Carbon Dioxide, Sulphur Oxide and Nitrous Oxides emitted into the environment as a result of generating electricity is dependent on the energy generation structure of the country
Figure 4: Space heating
Glass type KEY
A: 4mm singleB: 4-20air-4C: 4e-12Kr-e4D: 4e-8Xe-4-8Xe-e4
Windows with lower U-values provide better insulation and result in lower fuel bills.
A B C D
Glass Type
U-v
alue
(W/m
2 K)
7
6
5
4
3
2
1
0
Figure 5: Artificial lighting
Cons
umpt
ion
of e
nerg
y fo
r art
ifici
al
light
ing
(MJ)
Glass type KEY
A: 4mm singleB: 4-air-4C: 4e-air-e4D: 4e-air-4-air-e4
A B C D
Glass Type
1400
1200
1000
800
600
400
200
0
Figure 6: Acoustics
Soun
d re
duct
ion
inde
x (d
B)
A B C D
Glass Type
Glass type KEY
A: 4mm singleB: 4e-16Ar-4C: 4e-8Xe-e4D: 10-20air-6
Windows with a larger Sound Reduction Index provide more protection against unwanted sound.
50
45
40
35
30
25
20
15
10
5
0
18 Life cycle assessment of multi-glazed windows
in question. Countries which use more sustainable and renewable methods of electricity generation emit less pollution into the atmosphere. Norway generates nearly 100% of its energy from Hydro-electric power schemes and therefore emits very little pollution into the atmosphere. In the UK, every megajoule of energy generated produces the emissions illustrated in Figure 7.
Designing sustainable buildings using sustainable building components can help reduce energy demand and lessen environmental impact from such pollutants.
Which Windows?WHICH WINDOWS OFFER GOOD THERMAL INSULATION AND LIGHT TRANSMISSION PROPERTIES, BUT MINIMISE THE DAMAGE TO THE ENVIRONMENT FROM EMBODIED ENERGY AND ELECTRICITY CONSUMPTION?
To answer this we need to add the Embodied Energy of materials, manufacturing and transportation together with the energy required to heat the space within a building, and the
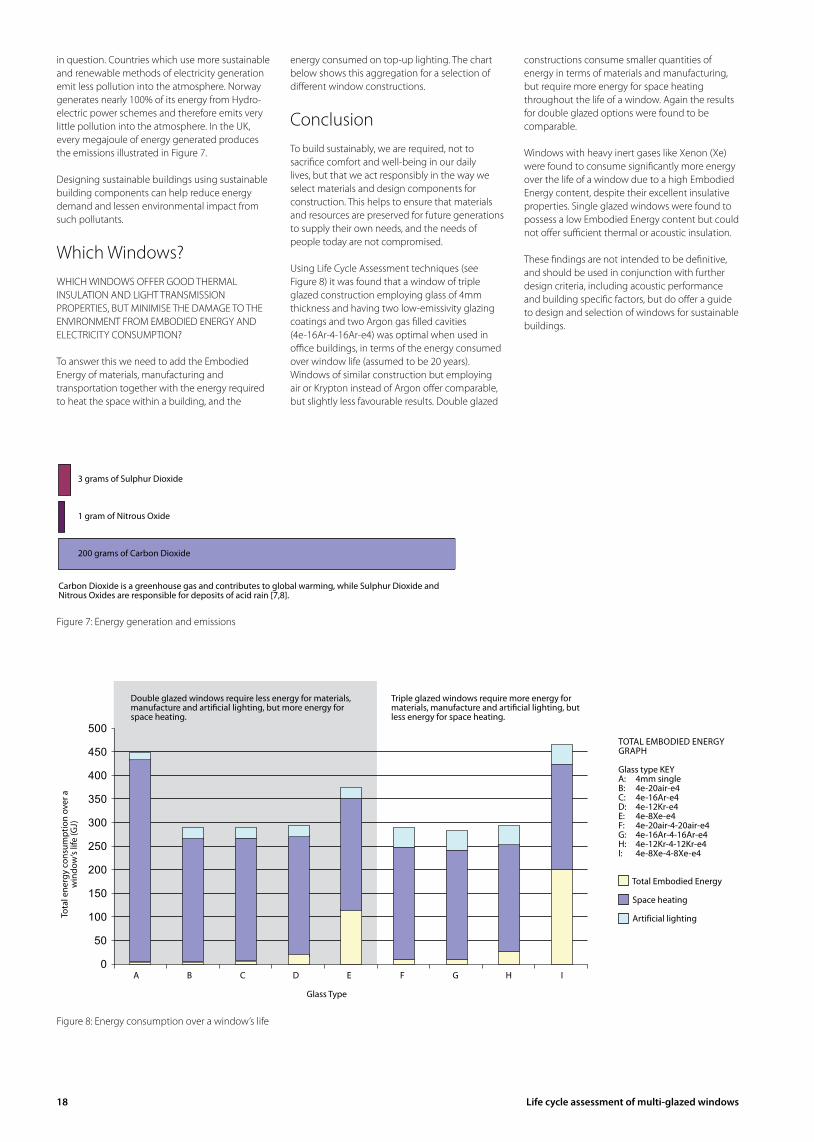
energy consumed on top-up lighting. The chart below shows this aggregation for a selection of different window constructions.
ConclusionTo build sustainably, we are required, not to sacrifice comfort and well-being in our daily lives, but that we act responsibly in the way we select materials and design components for construction. This helps to ensure that materials and resources are preserved for future generations to supply their own needs, and the needs of people today are not compromised.
Using Life Cycle Assessment techniques (see Figure 8) it was found that a window of triple glazed construction employing glass of 4mm thickness and having two low-emissivity glazing coatings and two Argon gas filled cavities (4e-16Ar-4-16Ar-e4) was optimal when used in office buildings, in terms of the energy consumed over window life (assumed to be 20 years). Windows of similar construction but employing air or Krypton instead of Argon offer comparable, but slightly less favourable results. Double glazed
constructions consume smaller quantities of energy in terms of materials and manufacturing, but require more energy for space heating throughout the life of a window. Again the results for double glazed options were found to be comparable.
Windows with heavy inert gases like Xenon (Xe) were found to consume significantly more energy over the life of a window due to a high Embodied Energy content, despite their excellent insulative properties. Single glazed windows were found to possess a low Embodied Energy content but could not offer sufficient thermal or acoustic insulation.
These findings are not intended to be definitive, and should be used in conjunction with further design criteria, including acoustic performance and building specific factors, but do offer a guide to design and selection of windows for sustainable buildings.
Figure 7: Energy generation and emissions
Carbon Dioxide is a greenhouse gas and contributes to global warming, while Sulphur Dioxide and Nitrous Oxides are responsible for deposits of acid rain [7,8].
3 grams of Sulphur Dioxide
1 gram of Nitrous Oxide
200 grams of Carbon Dioxide
0
50
100
150
200
250
300
350
400
450
500
Double glazed windows require less energy for materials, manufacture and artificial lighting, but more energy for space heating.
Triple glazed windows require more energy for materials, manufacture and artificial lighting, but less energy for space heating.
A B C D E F G H I
Glass Type
TOTAL EMBODIED ENERGY GRAPH
Glass type KEYA: 4mm singleB: 4e-20air-e4C: 4e-16Ar-e4D: 4e-12Kr-e4E: 4e-8Xe-e4F: 4e-20air-4-20air-e4G: 4e-16Ar-4-16Ar-e4H: 4e-12Kr-4-12Kr-e4I: 4e-8Xe-4-8Xe-e4
Total Embodied Energy
Space heating
Artificial lightingTota
l ene
rgy
cons
umpt
ion
over
a
win
dow
’s lif
e (G
J)
Figure 8: Energy consumption over a window’s life
Life cycle assessment of multi-glazed windows 19
References
1. Emsley, J., Energy and fuels, New Scientist, Inside Science, 68 January (1994)
2. Department of Trade and Industry, Digest of the United Kingdom Energy Statistics, HMSO, London, (1997)
3. Field, F.R. III, J.A. Isaacs, and J.P.Clark, Life-Cycle Analysis of automobiles: a critical review of methodologies, Journal of Minerals, Metals and Materials Society, 46 (4), (1994), pp 12-16
4. Buchanan, A. and Honey, B., Energy and carbon dioxide implications of building construction, Energy and Buildings, (20), 205-217, (1994)
5. Cawthorne, D., Buildings, lighting and the biological clock, The Martin Centre for Architectural and Urban Studies, University of Cambridge (1991)
6. Wyon, D.P. and Nilsson, I., Human experience of windowless environments in factories, offices, shops and colleges in Sweden, Building Resources Worldwide, Proceedings of the 8th CIB conference, 234-239 (1980)
7. CCW, Countryside Council for Wales, Energy policy and perspectives for the Welsh Countryside, (1992)
8. Shorrock L.D. and Henderson, G., Energy use in buildings and carbon dioxide emissions, Building Research Establishment Report (L7)(R3), (1990)
9. Weir, G., Life Cycle Assessment of multi-glazed windows, Ph.D. Thesis, Napier University, (1998)
10. Han, B., Thermal transmission characteristics of multi-glazed windows, Ph.D. thesis, Napier University, (1996)
11. Abodahab, N., Temperature stratification in double-glazed windows and its effect on condensation, Ph.D. thesis, Napier University, (1998)
12. Weir, G. and Muneer, T., Low-emissivity coatings in high-performance double-
glazed windows: Energy, monetary and environmental costs, Building Services Engineering Research and Technology, 18 (2), 125-127, (1997)
13. Fernie, D. and Muneer, T., Monetary, energy and environmental cost of infill gases for double glazings, Building Services Engineering Research and Technology, 17 (1) 43-46 (1996)
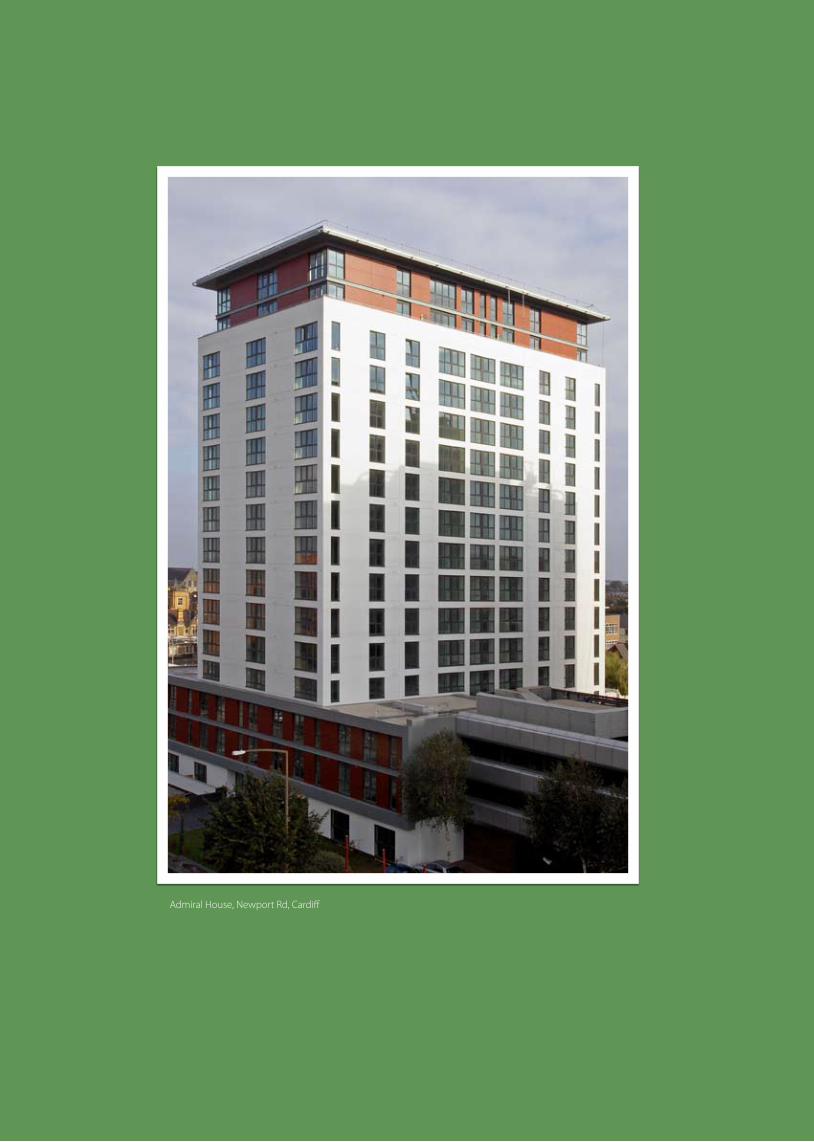
Admiral House, Newport Rd, Cardiff
Life cycle assessment of aluminium-clad timber windows 21
dr muhammad Asif, Professor Tariq muneerJune 2003
Over the last century a rise in the global temperature of 0.6oC, and the associated greenhouse effects, have had enormous
impact on such things as natural catastrophes, seasonal disorder, economic losses and health problems. If human activities continue apace, a further temperature rise of 2.5oC is predicted in the course of the next one hundred years with potentially disastrous consequences on the ecology and population of the planet [1].
In such a prevailing global environmental scenario, sustainability becomes a critical issue in all facets of our lives in order to secure the planet for succeeding generations. Sustainability is defined as:Development that meets the needs of the present without compromising the ability of future generations to meet their own needs.
The significance of sustainability is being highlighted in all national and international forums. ‘Agenda 21’, for instance, states that all countries should;Adopt standards and other regulatory measures which promote the increased use of energy-efficient
designs and technologies and sustainable utilisation of natural resources in an economically and environmentally appropriate way [3].
Similarly, ‘Earth Summit 2002’ in its action plan has urged the world to:Develop production and consumption policies to improve the products and services provided, while reducing environmental and health impacts, where appropriate, using science-based approaches, such as life cycle analysis. [4]
In every country, the construction industry is a major contributor to socio-economic development and also a major user of energy and natural resources. Building construction consumes 40% of the materials entering the global economy and generates 40-50% of greenhouse gasses and the agents of acid rain [2]. It is therefore essential that the building industry is totally involved in sustainable development in society.
Windows are amongst the most sensitive elements in the external envelope of a building. Due to their multi-disciplinary role, they are important not only for their affects on the interior environment, but also on the overall energy performance of the building. Similarly, energy contents and the environmental impacts of the
materials involved in window construction are important factors in the ecology of buildings. The improved characteristics of advanced windows, results in substantial energy savings as a direct result of their use and together with reduced maintenance costs, makes them an economic success over their life cycle. Energy efficient windows, with the least possible environmental burden over their whole-life cycle, are therefore important in achieving desired levels of sustainability within the building sector.
Life Cycle Assessment of Timber WindowsThere is an intimate connection between energy, environment and sustainable development. A society seeking sustainable development must utilise energy resources which cause the least possible, if unavoidable, environmental impacts. Energy efficiency is of prime significance in achieving sustainability because lesser environmental impacts are associated with energy-efficient approaches. Life Cycle Assessment (LCA) is a very helpful tool that serves many purposes such as; to identify processes, ingredients, and systems that are major contributors to environmental impacts;
Life cycle assessment of aluminium-clad timber windows
22 Life cycle assessment of aluminium-clad timber windows
to compare different options within a particular process with the objective of minimising environmental impacts; to provide guidance in long-term strategic planning concerning trends in product design and materials.
A process to evaluate the environmental burdens associated with a product system, or activity by identifying and quantitatively or qualitatively describing the energy and materials used, and wastes released to the environment, and to assess the impacts of the energy. The assessment includes the entire life cycle of the product or activity, encompassing, extracting and processing the raw materials; manufacturing; distribution; use; reuse; maintenance; recycling and final disposal; and all transportation involved.
Life Cycle Assessment provides a material and energy balance over the entire life of a material, product or service, determining its interaction with its environment and assessing its impacts on the environment. Figure 1 shows the basic cradle to grave approach of an LCA.
The two most important factors to be considered in the Life Cycle Assessment of a product are its associated energy and environmental impacts i.e.
the amount of energy consumed in producing the product and impacts on the environment as a direct result of this production in the form of toxicity emitted into air, land or water.
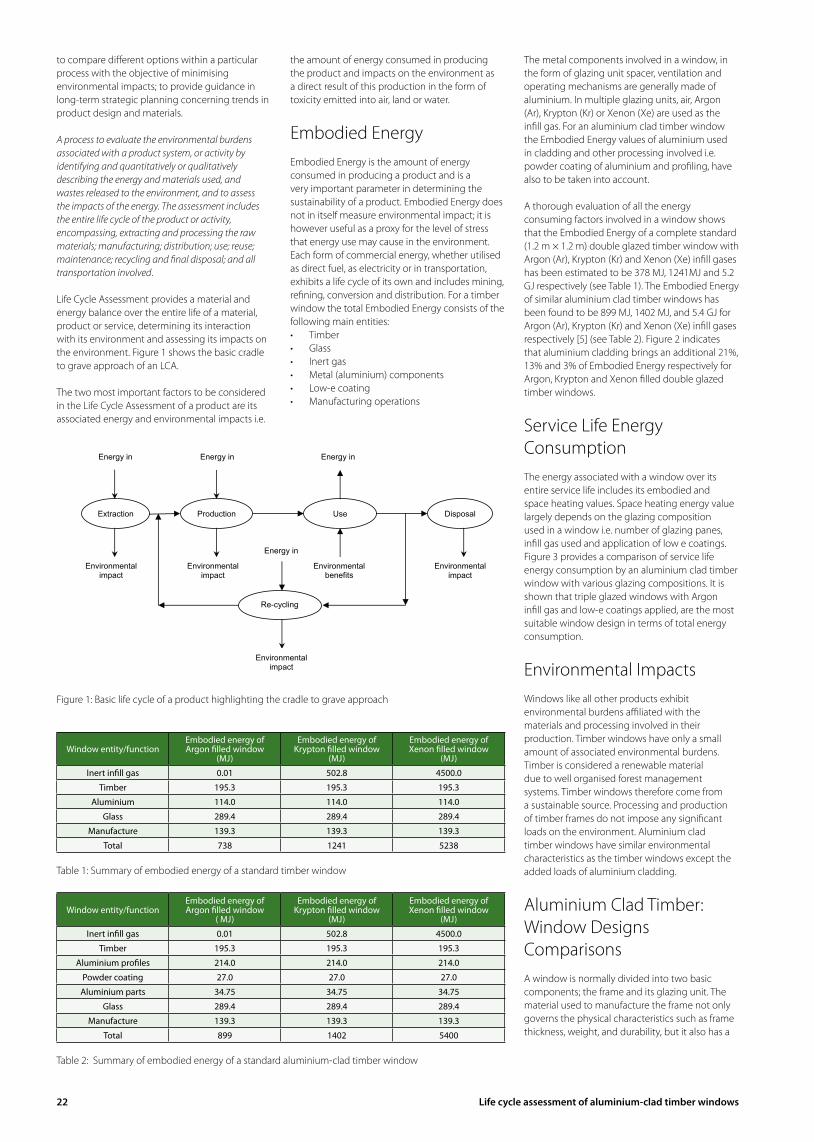
Embodied EnergyEmbodied Energy is the amount of energy consumed in producing a product and is a very important parameter in determining the sustainability of a product. Embodied Energy does not in itself measure environmental impact; it is however useful as a proxy for the level of stress that energy use may cause in the environment. Each form of commercial energy, whether utilised as direct fuel, as electricity or in transportation, exhibits a life cycle of its own and includes mining, refining, conversion and distribution. For a timber window the total Embodied Energy consists of the following main entities:• Timber• Glass• Inertgas• Metal(aluminium)components• Low-ecoating• Manufacturingoperations
The metal components involved in a window, in the form of glazing unit spacer, ventilation and operating mechanisms are generally made of aluminium. In multiple glazing units, air, Argon (Ar), Krypton (Kr) or Xenon (Xe) are used as the infill gas. For an aluminium clad timber window the Embodied Energy values of aluminium used in cladding and other processing involved i.e. powder coating of aluminium and profiling, have also to be taken into account.
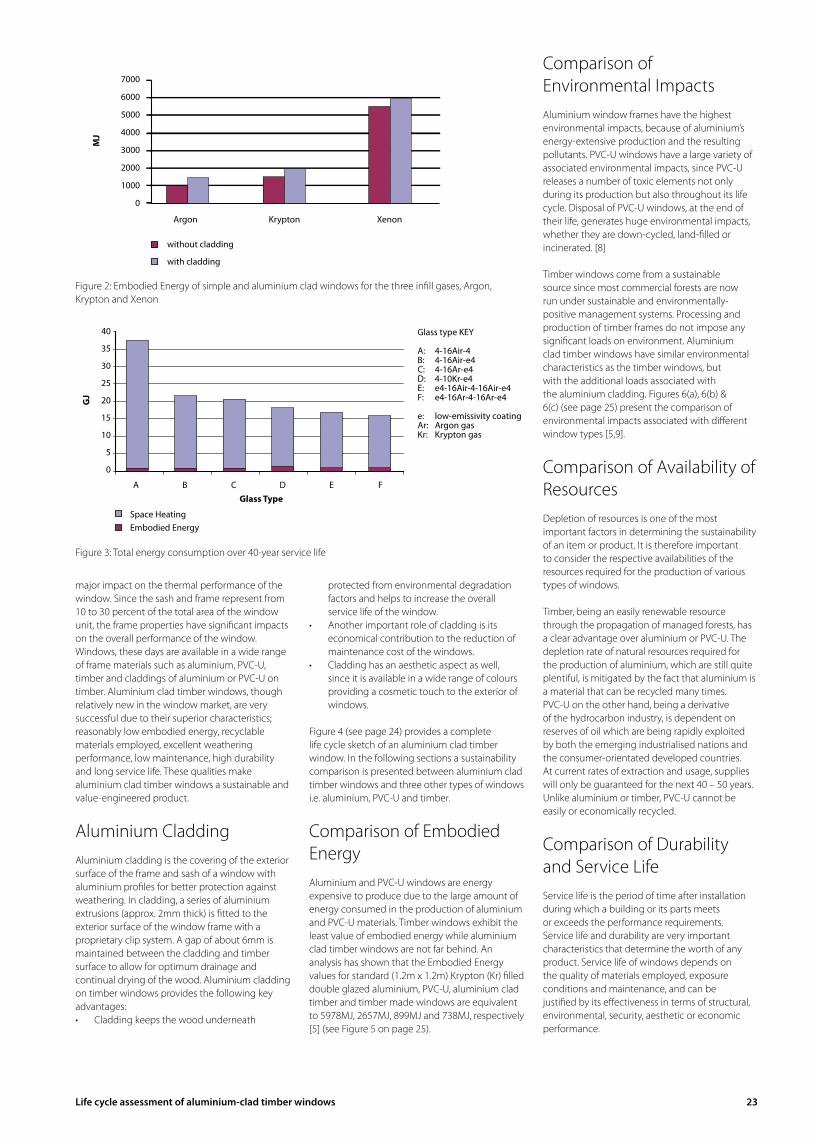
A thorough evaluation of all the energy consuming factors involved in a window shows that the Embodied Energy of a complete standard (1.2 m × 1.2 m) double glazed timber window with Argon (Ar), Krypton (Kr) and Xenon (Xe) infill gases has been estimated to be 378 MJ, 1241MJ and 5.2 GJ respectively (see Table 1). The Embodied Energy of similar aluminium clad timber windows has been found to be 899 MJ, 1402 MJ, and 5.4 GJ for Argon (Ar), Krypton (Kr) and Xenon (Xe) infill gases respectively [5] (see Table 2). Figure 2 indicates that aluminium cladding brings an additional 21%, 13% and 3% of Embodied Energy respectively for Argon, Krypton and Xenon filled double glazed timber windows.
Service Life Energy ConsumptionThe energy associated with a window over its entire service life includes its embodied and space heating values. Space heating energy value largely depends on the glazing composition used in a window i.e. number of glazing panes, infill gas used and application of low e coatings. Figure 3 provides a comparison of service life energy consumption by an aluminium clad timber window with various glazing compositions. It is shown that triple glazed windows with Argon infill gas and low-e coatings applied, are the most suitable window design in terms of total energy consumption.
Environmental Impacts Windows like all other products exhibit environmental burdens affiliated with the materials and processing involved in their production. Timber windows have only a small amount of associated environmental burdens. Timber is considered a renewable material due to well organised forest management systems. Timber windows therefore come from a sustainable source. Processing and production of timber frames do not impose any significant loads on the environment. Aluminium clad timber windows have similar environmental characteristics as the timber windows except the added loads of aluminium cladding.
Aluminium Clad Timber: Window Designs ComparisonsA window is normally divided into two basic components; the frame and its glazing unit. The material used to manufacture the frame not only governs the physical characteristics such as frame thickness, weight, and durability, but it also has a
Window entity/functionEmbodied energy of Argon filled window
(MJ)
Embodied energy of Krypton filled window
(MJ)
Embodied energy of Xenon filled window
(MJ)
Inert infill gas 0.01 502.8 4500.0
Timber 195.3 195.3 195.3
Aluminium 114.0 114.0 114.0
Glass 289.4 289.4 289.4
Manufacture 139.3 139.3 139.3
Total 738 1241 5238
Table 1: Summary of embodied energy of a standard timber window
Window entity/functionEmbodied energy of Argon filled window
( MJ)
Embodied energy of Krypton filled window
(MJ)
Embodied energy of Xenon filled window
(MJ)
Inert infill gas 0.01 502.8 4500.0
Timber 195.3 195.3 195.3
Aluminium profiles 214.0 214.0 214.0
Powder coating 27.0 27.0 27.0
Aluminium parts 34.75 34.75 34.75
Glass 289.4 289.4 289.4
Manufacture 139.3 139.3 139.3
Total 899 1402 5400
Table 2: Summary of embodied energy of a standard aluminium-clad timber window
Figure 1: Basic life cycle of a product highlighting the cradle to grave approach
Life cycle assessment of aluminium-clad timber windows 23
major impact on the thermal performance of the window. Since the sash and frame represent from 10 to 30 percent of the total area of the window unit, the frame properties have significant impacts on the overall performance of the window. Windows, these days are available in a wide range of frame materials such as aluminium, PVC-U, timber and claddings of aluminium or PVC-U on timber. Aluminium clad timber windows, though relatively new in the window market, are very successful due to their superior characteristics; reasonably low embodied energy, recyclable materials employed, excellent weathering performance, low maintenance, high durability and long service life. These qualities make aluminium clad timber windows a sustainable and value-engineered product.
Aluminium CladdingAluminium cladding is the covering of the exterior surface of the frame and sash of a window with aluminium profiles for better protection against weathering. In cladding, a series of aluminium extrusions (approx. 2mm thick) is fitted to the exterior surface of the window frame with a proprietary clip system. A gap of about 6mm is maintained between the cladding and timber surface to allow for optimum drainage and continual drying of the wood. Aluminium cladding on timber windows provides the following key advantages:• Claddingkeepsthewoodunderneath
protected from environmental degradation factors and helps to increase the overall service life of the window.
• Anotherimportantroleofcladdingisitseconomical contribution to the reduction of maintenance cost of the windows.
• Claddinghasanaestheticaspectaswell,since it is available in a wide range of colours providing a cosmetic touch to the exterior of windows.
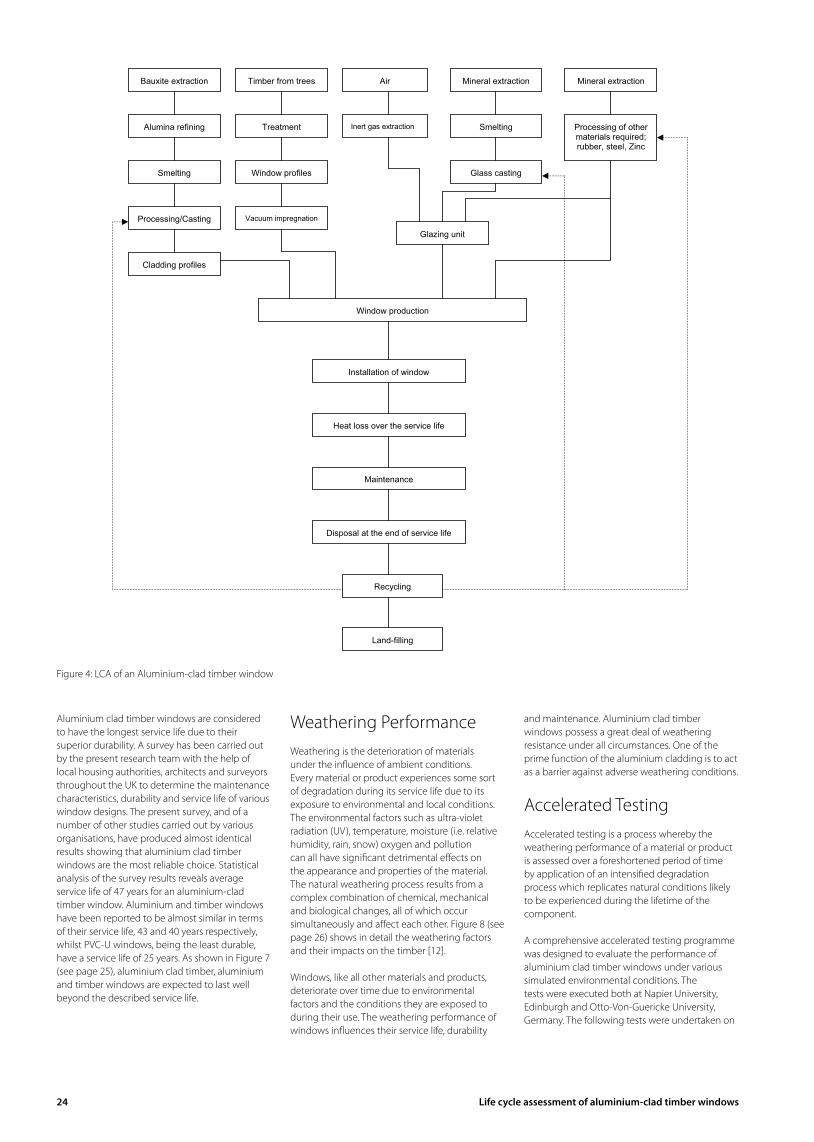
Figure 4 (see page 24) provides a complete life cycle sketch of an aluminium clad timber window. In the following sections a sustainability comparison is presented between aluminium clad timber windows and three other types of windows i.e. aluminium, PVC-U and timber.
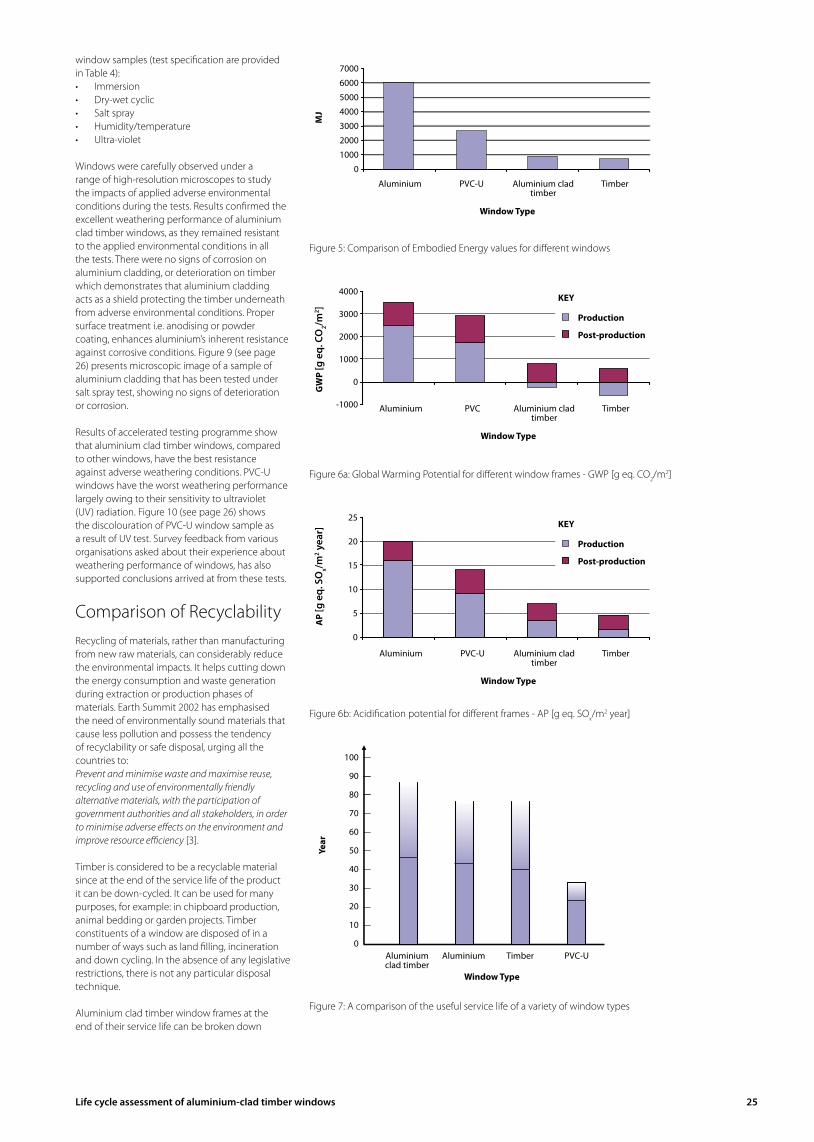
Comparison of Embodied Energy Aluminium and PVC-U windows are energy expensive to produce due to the large amount of energy consumed in the production of aluminium and PVC-U materials. Timber windows exhibit the least value of embodied energy while aluminium clad timber windows are not far behind. An analysis has shown that the Embodied Energy values for standard (1.2m x 1.2m) Krypton (Kr) filled double glazed aluminium, PVC-U, aluminium clad timber and timber made windows are equivalent to 5978MJ, 2657MJ, 899MJ and 738MJ, respectively [5] (see Figure 5 on page 25).
Comparison of Environmental ImpactsAluminium window frames have the highest environmental impacts, because of aluminium’s energy-extensive production and the resulting pollutants. PVC-U windows have a large variety of associated environmental impacts, since PVC-U releases a number of toxic elements not only during its production but also throughout its life cycle. Disposal of PVC-U windows, at the end of their life, generates huge environmental impacts, whether they are down-cycled, land-filled or incinerated. [8]
Timber windows come from a sustainable source since most commercial forests are now run under sustainable and environmentally-positive management systems. Processing and production of timber frames do not impose any significant loads on environment. Aluminium clad timber windows have similar environmental characteristics as the timber windows, but with the additional loads associated with the aluminium cladding. Figures 6(a), 6(b) & 6(c) (see page 25) present the comparison of environmental impacts associated with different window types [5,9].
Comparison of Availability of ResourcesDepletion of resources is one of the most important factors in determining the sustainability of an item or product. It is therefore important to consider the respective availabilities of the resources required for the production of various types of windows.
Timber, being an easily renewable resource through the propagation of managed forests, has a clear advantage over aluminium or PVC-U. The depletion rate of natural resources required for the production of aluminium, which are still quite plentiful, is mitigated by the fact that aluminium is a material that can be recycled many times.PVC-U on the other hand, being a derivative of the hydrocarbon industry, is dependent on reserves of oil which are being rapidly exploited by both the emerging industrialised nations and the consumer-orientated developed countries. At current rates of extraction and usage, supplies will only be guaranteed for the next 40 – 50 years. Unlike aluminium or timber, PVC-U cannot be easily or economically recycled.
Comparison of Durability and Service LifeService life is the period of time after installation during which a building or its parts meets or exceeds the performance requirements. Service life and durability are very important characteristics that determine the worth of any product. Service life of windows depends on the quality of materials employed, exposure conditions and maintenance, and can be justified by its effectiveness in terms of structural, environmental, security, aesthetic or economic performance.
0
5
10
15
20
25
30
35
40
4-16Air-4 4-16Air-e4 4-16Ar-e4 4-10Kr-e4 e4-16Air-4-16Air-e4
e4-16Ar-4-16Ar-e4
GJ
Space HeatingEmbodied Energy
Figure 3: Total energy consumption over 40-year service life
Space HeatingEmbodied Energy
GJ
40
35
30
25
20
15
10
5
0
A B C D E FGlass Type
Glass type KEY
A: 4-16Air-4B: 4-16Air-e4C: 4-16Ar-e4D: 4-10Kr-e4E: e4-16Air-4-16Air-e4F: e4-16Ar-4-16Ar-e4
e: low-emissivity coatingAr: Argon gasKr: Krypton gas
without cladding
with cladding
0
1000
2000
3000
4000
5000
6000
7000
MJ
Argon Krypton Xenon
Figure 2: Embodied Energy of simple and aluminium clad windows for the three infill gases, Argon, Krypton and Xenon
MJ
without cladding
with cladding
7000
6000
5000
4000
3000
2000
1000
0
Argon Krypton Xenon
24 Life cycle assessment of aluminium-clad timber windows
Aluminium clad timber windows are considered to have the longest service life due to their superior durability. A survey has been carried out by the present research team with the help of local housing authorities, architects and surveyors throughout the UK to determine the maintenance characteristics, durability and service life of various window designs. The present survey, and of a number of other studies carried out by various organisations, have produced almost identical results showing that aluminium clad timber windows are the most reliable choice. Statistical analysis of the survey results reveals average service life of 47 years for an aluminium-clad timber window. Aluminium and timber windows have been reported to be almost similar in terms of their service life, 43 and 40 years respectively, whilst PVC-U windows, being the least durable, have a service life of 25 years. As shown in Figure 7 (see page 25), aluminium clad timber, aluminium and timber windows are expected to last well beyond the described service life.
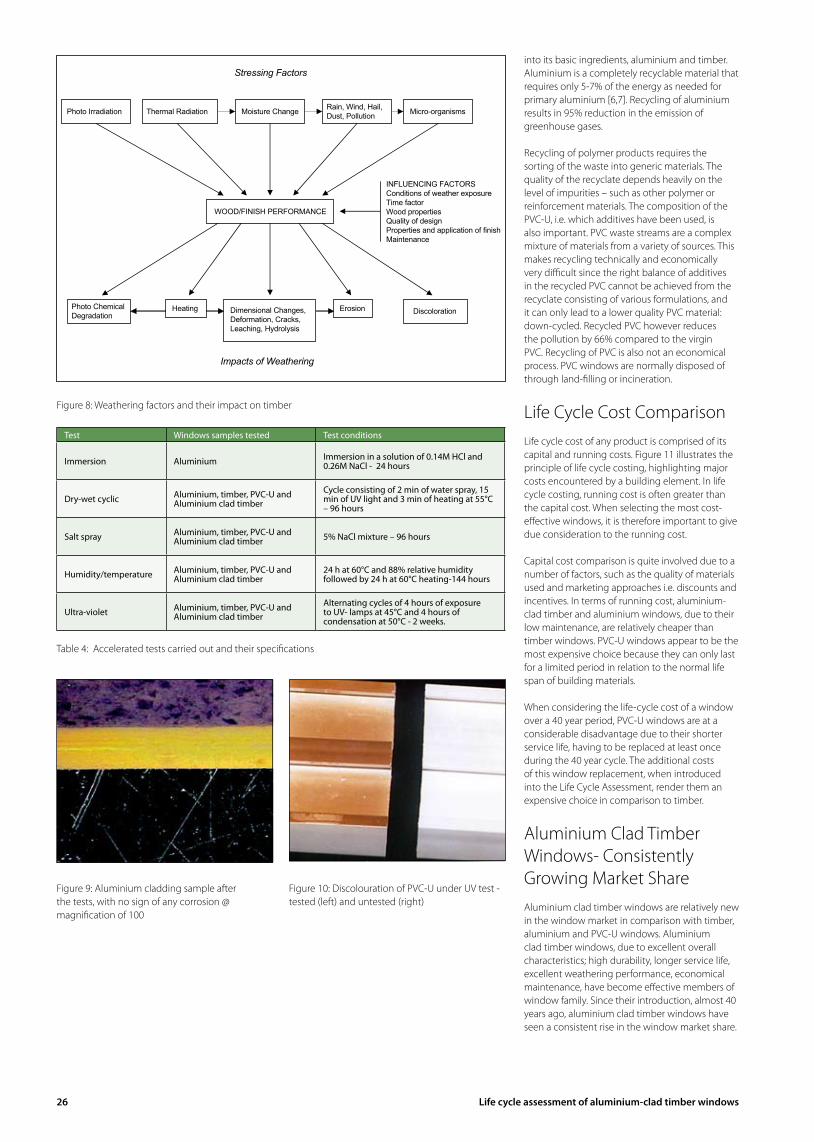
Weathering PerformanceWeathering is the deterioration of materials under the influence of ambient conditions. Every material or product experiences some sort of degradation during its service life due to its exposure to environmental and local conditions. The environmental factors such as ultra-violet radiation (UV), temperature, moisture (i.e. relative humidity, rain, snow) oxygen and pollution can all have significant detrimental effects on the appearance and properties of the material. The natural weathering process results from a complex combination of chemical, mechanical and biological changes, all of which occur simultaneously and affect each other. Figure 8 (see page 26) shows in detail the weathering factors and their impacts on the timber [12].
Windows, like all other materials and products, deteriorate over time due to environmental factors and the conditions they are exposed to during their use. The weathering performance of windows influences their service life, durability
and maintenance. Aluminium clad timber windows possess a great deal of weathering resistance under all circumstances. One of the prime function of the aluminium cladding is to act as a barrier against adverse weathering conditions.
Accelerated TestingAccelerated testing is a process whereby the weathering performance of a material or product is assessed over a foreshortened period of time by application of an intensified degradation process which replicates natural conditions likely to be experienced during the lifetime of the component.
A comprehensive accelerated testing programme was designed to evaluate the performance of aluminium clad timber windows under various simulated environmental conditions. The tests were executed both at Napier University, Edinburgh and Otto-Von-Guericke University, Germany. The following tests were undertaken on
Figure 4: LCA of an Aluminium-clad timber window
Life cycle assessment of aluminium-clad timber windows 25
window samples (test specification are provided in Table 4):• Immersion• Dry-wetcyclic• Saltspray• Humidity/temperature• Ultra-violet
Windows were carefully observed under a range of high-resolution microscopes to study the impacts of applied adverse environmental conditions during the tests. Results confirmed the excellent weathering performance of aluminium clad timber windows, as they remained resistant to the applied environmental conditions in all the tests. There were no signs of corrosion on aluminium cladding, or deterioration on timber which demonstrates that aluminium cladding acts as a shield protecting the timber underneath from adverse environmental conditions. Proper surface treatment i.e. anodising or powder coating, enhances aluminium’s inherent resistance against corrosive conditions. Figure 9 (see page 26) presents microscopic image of a sample of aluminium cladding that has been tested under salt spray test, showing no signs of deterioration or corrosion.
Results of accelerated testing programme show that aluminium clad timber windows, compared to other windows, have the best resistance against adverse weathering conditions. PVC-U windows have the worst weathering performance largely owing to their sensitivity to ultraviolet (UV) radiation. Figure 10 (see page 26) shows the discolouration of PVC-U window sample as a result of UV test. Survey feedback from various organisations asked about their experience about weathering performance of windows, has also supported conclusions arrived at from these tests.
Comparison of RecyclabilityRecycling of materials, rather than manufacturing from new raw materials, can considerably reduce the environmental impacts. It helps cutting down the energy consumption and waste generation during extraction or production phases of materials. Earth Summit 2002 has emphasised the need of environmentally sound materials that cause less pollution and possess the tendency of recyclability or safe disposal, urging all the countries to:Prevent and minimise waste and maximise reuse, recycling and use of environmentally friendly alternative materials, with the participation of government authorities and all stakeholders, in order to minimise adverse effects on the environment and improve resource efficiency [3].
Timber is considered to be a recyclable material since at the end of the service life of the product it can be down-cycled. It can be used for many purposes, for example: in chipboard production, animal bedding or garden projects. Timber constituents of a window are disposed of in a number of ways such as land filling, incineration and down cycling. In the absence of any legislative restrictions, there is not any particular disposal technique.
Aluminium clad timber window frames at the end of their service life can be broken down
01000200030004000500060007000
MJ
Aluminium PVC Aluminium clad timber Timber
MJ
Aluminium PVC-U Aluminium clad timber
Timber
Window Type
7000
6000
5000
4000
3000
2000
1000
0
Figure 5: Comparison of Embodied Energy values for different windows
-1000
0
1000
2000
3000
4000
Production
Post-production
Aluminium PVC Aluminium clad timber TimberAluminium PVC Aluminium clad timber
Timber
Window Type
KEY
-1000
0
1000
2000
3000
4000
Production
Post-production
Aluminium PVC Aluminium clad timber Timber
Production
Post-production
GW
P [g
eq.
cO
2/m2 ]
4000
3000
2000
1000
0
-1000
Figure 6a: Global Warming Potential for different window frames - GWP [g eq. CO2/m2]
0
5
10
15
20
25
Production
Post-production
Aluminium PVC Aluminium clad timber Timber
AP
[g e
q. s
Ox/m
2 yea
r]
KEY
-1000
0
1000
2000
3000
4000
Production
Post-production
Aluminium PVC Aluminium clad timber Timber
Production
Post-production
Aluminium PVC-U Aluminium clad timber
Timber
Window Type
25
20
15
10
5
0
Figure 6b: Acidification potential for different frames - AP [g eq. SOx/m2 year]
Aluminium PVCAluminium clad timber Timber
Year
Aluminium clad timber
Aluminium Timber PVC-U
Window Type
100
90
80
70
60
50
40
30
20
10
0
Figure 7: A comparison of the useful service life of a variety of window types
26 Life cycle assessment of aluminium-clad timber windows
into its basic ingredients, aluminium and timber. Aluminium is a completely recyclable material that requires only 5-7% of the energy as needed for primary aluminium [6,7]. Recycling of aluminium results in 95% reduction in the emission of greenhouse gases.
Recycling of polymer products requires the sorting of the waste into generic materials. The quality of the recyclate depends heavily on the level of impurities – such as other polymer or reinforcement materials. The composition of the PVC-U, i.e. which additives have been used, is also important. PVC waste streams are a complex mixture of materials from a variety of sources. This makes recycling technically and economically very difficult since the right balance of additives in the recycled PVC cannot be achieved from the recyclate consisting of various formulations, and it can only lead to a lower quality PVC material: down-cycled. Recycled PVC however reduces the pollution by 66% compared to the virgin PVC. Recycling of PVC is also not an economical process. PVC windows are normally disposed of through land-filling or incineration.
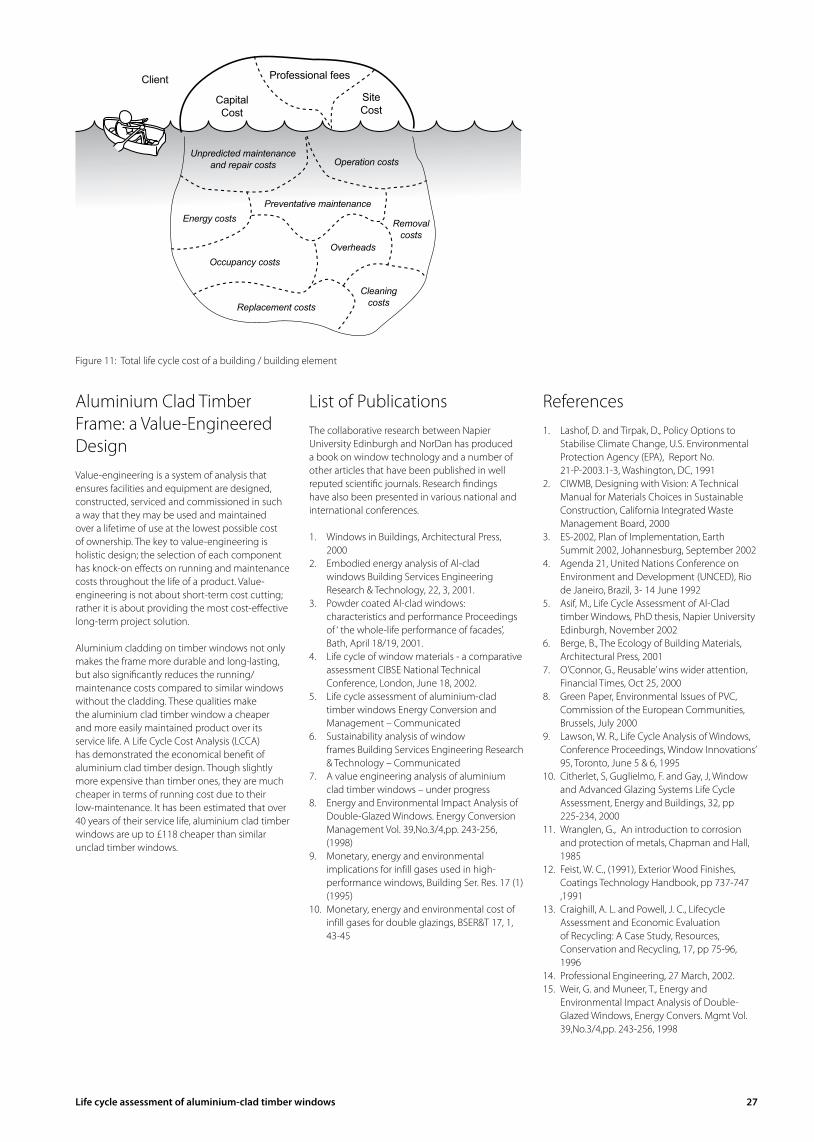
Life Cycle Cost ComparisonLife cycle cost of any product is comprised of its capital and running costs. Figure 11 illustrates the principle of life cycle costing, highlighting major costs encountered by a building element. In life cycle costing, running cost is often greater than the capital cost. When selecting the most cost-effective windows, it is therefore important to give due consideration to the running cost. Capital cost comparison is quite involved due to a number of factors, such as the quality of materials used and marketing approaches i.e. discounts and incentives. In terms of running cost, aluminium-clad timber and aluminium windows, due to their low maintenance, are relatively cheaper than timber windows. PVC-U windows appear to be the most expensive choice because they can only last for a limited period in relation to the normal life span of building materials.
When considering the life-cycle cost of a window over a 40 year period, PVC-U windows are at a considerable disadvantage due to their shorter service life, having to be replaced at least once during the 40 year cycle. The additional costs of this window replacement, when introduced into the Life Cycle Assessment, render them an expensive choice in comparison to timber.
Aluminium Clad Timber Windows- Consistently Growing Market ShareAluminium clad timber windows are relatively new in the window market in comparison with timber, aluminium and PVC-U windows. Aluminium clad timber windows, due to excellent overall characteristics; high durability, longer service life, excellent weathering performance, economical maintenance, have become effective members of window family. Since their introduction, almost 40 years ago, aluminium clad timber windows have seen a consistent rise in the window market share.
INFLUENCING FACTORSConditions of weather exposureTime factorWood propertiesQuality of designProperties and application of finishMaintenance
Stressing Factors
Impacts of Weathering
WOOD/FINISH PERFORMANCE
Photo Irradiation
Photo ChemicalDegradation
Dimensional Changes,Deformation, Cracks,Leaching, Hydrolysis
Thermal Radiation
Heating Erosion Discoloration
Moisture Change Rain, Wind, Hail,Dust, Pollution Micro-organisms
Figure 8: Weathering factors and their impact on timber
Test Windows samples tested Test conditions
Immersion Aluminium Immersion in a solution of 0.14M HCl and 0.26M NaCl - 24 hours
Dry-wet cyclic Aluminium, timber, PVC-U and Aluminium clad timber
Cycle consisting of 2 min of water spray, 15 min of UV light and 3 min of heating at 55°C – 96 hours
Salt spray Aluminium, timber, PVC-U and Aluminium clad timber 5% NaCl mixture – 96 hours
Humidity/temperature Aluminium, timber, PVC-U and Aluminium clad timber
24 h at 60°C and 88% relative humidity followed by 24 h at 60°C heating-144 hours
Ultra-violet Aluminium, timber, PVC-U and Aluminium clad timber
Alternating cycles of 4 hours of exposure to UV- lamps at 45°C and 4 hours of condensation at 50°C - 2 weeks.
Table 4: Accelerated tests carried out and their specifications
Figure 9: Aluminium cladding sample after the tests, with no sign of any corrosion @ magnification of 100
Figure 10: Discolouration of PVC-U under UV test - tested (left) and untested (right)
Life cycle assessment of aluminium-clad timber windows 27
Aluminium Clad Timber Frame: a Value-Engineered DesignValue-engineering is a system of analysis that ensures facilities and equipment are designed, constructed, serviced and commissioned in such a way that they may be used and maintained over a lifetime of use at the lowest possible cost of ownership. The key to value-engineering is holistic design; the selection of each component has knock-on effects on running and maintenance costs throughout the life of a product. Value-engineering is not about short-term cost cutting; rather it is about providing the most cost-effective long-term project solution.
Aluminium cladding on timber windows not only makes the frame more durable and long-lasting, but also significantly reduces the running/maintenance costs compared to similar windows without the cladding. These qualities make the aluminium clad timber window a cheaper and more easily maintained product over its service life. A Life Cycle Cost Analysis (LCCA) has demonstrated the economical benefit of aluminium clad timber design. Though slightly more expensive than timber ones, they are much cheaper in terms of running cost due to their low-maintenance. It has been estimated that over 40 years of their service life, aluminium clad timber windows are up to £118 cheaper than similar unclad timber windows.
List of PublicationsThe collaborative research between Napier University Edinburgh and NorDan has produced a book on window technology and a number of other articles that have been published in well reputed scientific journals. Research findings have also been presented in various national and international conferences.
1. Windows in Buildings, Architectural Press, 2000
2. Embodied energy analysis of Al-clad windows Building Services Engineering Research & Technology, 22, 3, 2001.
3. Powder coated Al-clad windows: characteristics and performance Proceedings of ‘ the whole-life performance of facades’, Bath, April 18/19, 2001.
4. Life cycle of window materials - a comparative assessment CIBSE National Technical Conference, London, June 18, 2002.
5. Life cycle assessment of aluminium-clad timber windows Energy Conversion and Management – Communicated
6. Sustainability analysis of window frames Building Services Engineering Research & Technology – Communicated
7. A value engineering analysis of aluminium clad timber windows – under progress
8. Energy and Environmental Impact Analysis of Double-Glazed Windows. Energy Conversion Management Vol. 39,No.3/4,pp. 243-256, (1998)
9. Monetary, energy and environmental implications for infill gases used in high-performance windows, Building Ser. Res. 17 (1) (1995)
10. Monetary, energy and environmental cost of infill gases for double glazings, BSER&T 17, 1, 43-45
References1. Lashof, D. and Tirpak, D., Policy Options to
Stabilise Climate Change, U.S. Environmental Protection Agency (EPA), Report No. 21-P-2003.1-3, Washington, DC, 1991
2. CIWMB, Designing with Vision: A Technical Manual for Materials Choices in Sustainable Construction, California Integrated Waste Management Board, 2000
3. ES-2002, Plan of Implementation, Earth Summit 2002, Johannesburg, September 2002
4. Agenda 21, United Nations Conference on Environment and Development (UNCED), Rio de Janeiro, Brazil, 3- 14 June 1992
5. Asif, M., Life Cycle Assessment of Al-Clad timber Windows, PhD thesis, Napier University Edinburgh, November 2002
6. Berge, B., The Ecology of Building Materials, Architectural Press, 2001
7. O’Connor, G., Reusable’ wins wider attention, Financial Times, Oct 25, 2000
8. Green Paper, Environmental Issues of PVC, Commission of the European Communities, Brussels, July 2000
9. Lawson, W. R., Life Cycle Analysis of Windows, Conference Proceedings, Window Innovations’ 95, Toronto, June 5 & 6, 1995
10. Citherlet, S, Guglielmo, F. and Gay, J, Window and Advanced Glazing Systems Life Cycle Assessment, Energy and Buildings, 32, pp 225-234, 2000
11. Wranglen, G., An introduction to corrosion and protection of metals, Chapman and Hall, 1985
12. Feist, W. C., (1991), Exterior Wood Finishes, Coatings Technology Handbook, pp 737-747 ,1991
13. Craighill, A. L. and Powell, J. C., Lifecycle Assessment and Economic Evaluation of Recycling: A Case Study, Resources, Conservation and Recycling, 17, pp 75-96, 1996
14. Professional Engineering, 27 March, 2002.15. Weir, G. and Muneer, T., Energy and
Environmental Impact Analysis of Double-Glazed Windows, Energy Convers. Mgmt Vol. 39,No.3/4,pp. 243-256, 1998
CapitalCost
ClientSiteCost
Professional fees
Unpredicted maintenanceand repair costs Operation costs
Preventative maintenanceEnergy costs
Occupancy costs
Removalcosts
Overheads
Replacement costsCleaning
costs
Figure 11: Total life cycle cost of a building / building element
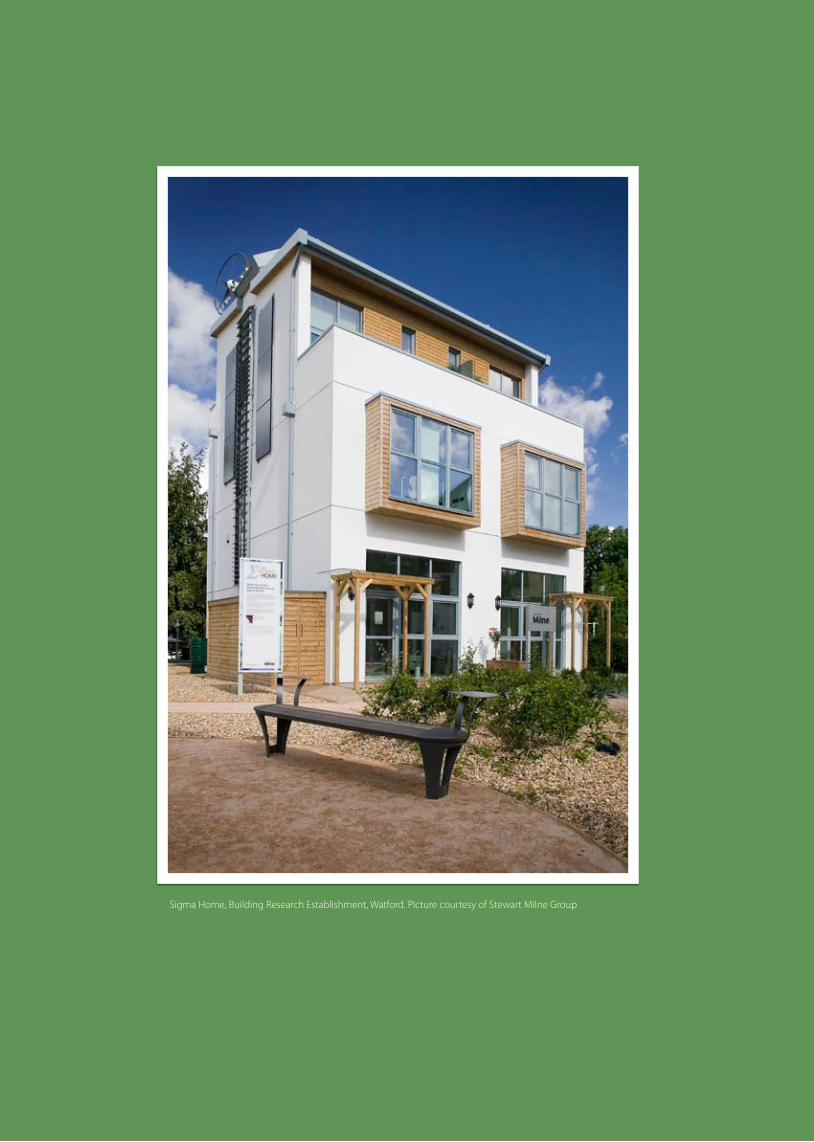
Sigma Home, Building Research Establishment, Watford. Picture courtesy of Stewart Milne Group
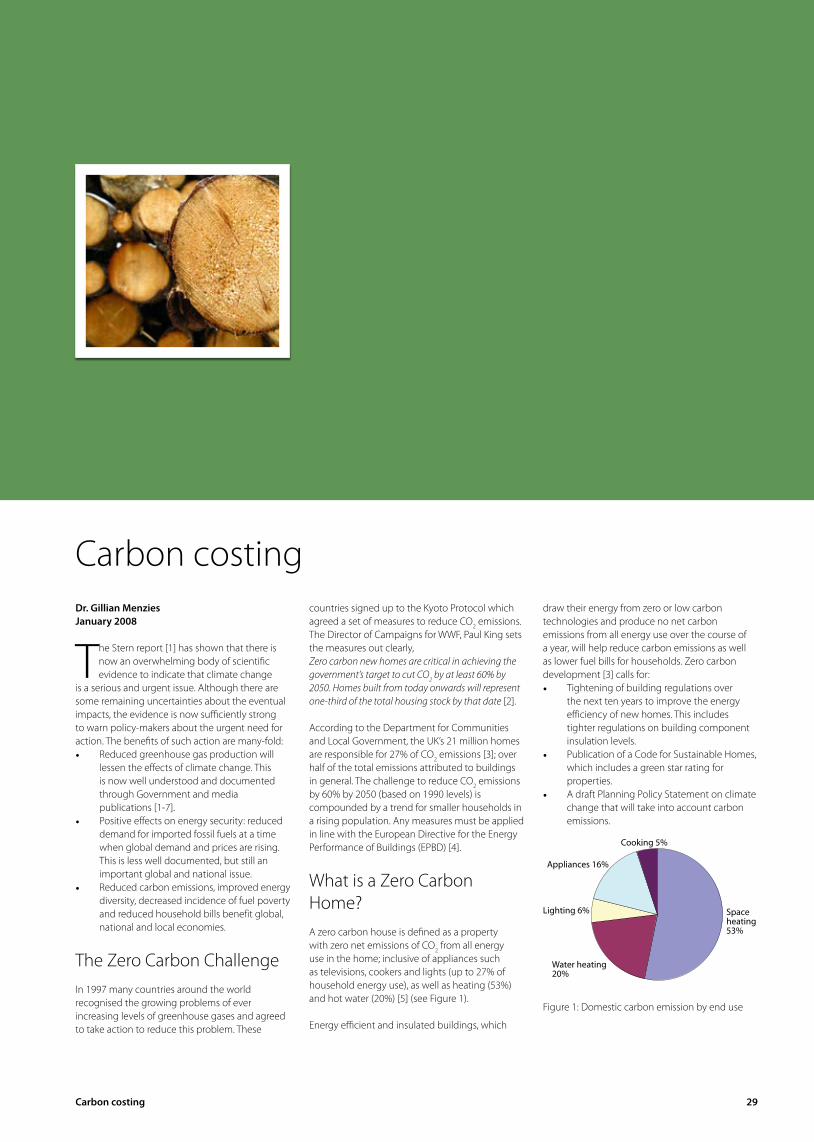
carbon costing 29
Carbon costingdr. Gillian menziesJanuary 2008
The Stern report [1] has shown that there is now an overwhelming body of scientific evidence to indicate that climate change
is a serious and urgent issue. Although there are some remaining uncertainties about the eventual impacts, the evidence is now sufficiently strong to warn policy-makers about the urgent need for action. The benefits of such action are many-fold:
Reduced greenhouse gas production will •lessen the effects of climate change. This is now well understood and documented through Government and media publications [1-7].Positive effects on energy security: reduced •demand for imported fossil fuels at a time when global demand and prices are rising. This is less well documented, but still an important global and national issue.Reduced carbon emissions, improved energy •diversity, decreased incidence of fuel poverty and reduced household bills benefit global, national and local economies.
The Zero Carbon ChallengeIn 1997 many countries around the world recognised the growing problems of ever increasing levels of greenhouse gases and agreed to take action to reduce this problem. These
countries signed up to the Kyoto Protocol which agreed a set of measures to reduce CO2 emissions. The Director of Campaigns for WWF, Paul King sets the measures out clearly,Zero carbon new homes are critical in achieving the government’s target to cut CO2 by at least 60% by 2050. Homes built from today onwards will represent one-third of the total housing stock by that date [2].
According to the Department for Communities and Local Government, the UK’s 21 million homes are responsible for 27% of CO2 emissions [3]; over half of the total emissions attributed to buildings in general. The challenge to reduce CO2 emissions by 60% by 2050 (based on 1990 levels) is compounded by a trend for smaller households in a rising population. Any measures must be applied in line with the European Directive for the Energy Performance of Buildings (EPBD) [4].
What is a Zero Carbon Home?A zero carbon house is defined as a property with zero net emissions of CO2 from all energy use in the home; inclusive of appliances such as televisions, cookers and lights (up to 27% of household energy use), as well as heating (53%) and hot water (20%) [5] (see Figure 1).
Energy efficient and insulated buildings, which
draw their energy from zero or low carbon technologies and produce no net carbon emissions from all energy use over the course of a year, will help reduce carbon emissions as well as lower fuel bills for households. Zero carbon development [3] calls for:
Tightening of building regulations over •the next ten years to improve the energy efficiency of new homes. This includes tighter regulations on building component insulation levels.Publication of a Code for Sustainable Homes, •which includes a green star rating for properties.A draft Planning Policy Statement on climate •change that will take into account carbon emissions.
Space Heating, 53%
Water Heating, 20%
Lighting, 6%
Appliances, 16%
Cooking, 5%Cooking 5%
Appliances 16%
Water heating20%
Spaceheating53%
Lighting 6%
Figure 1: Domestic carbon emission by end use
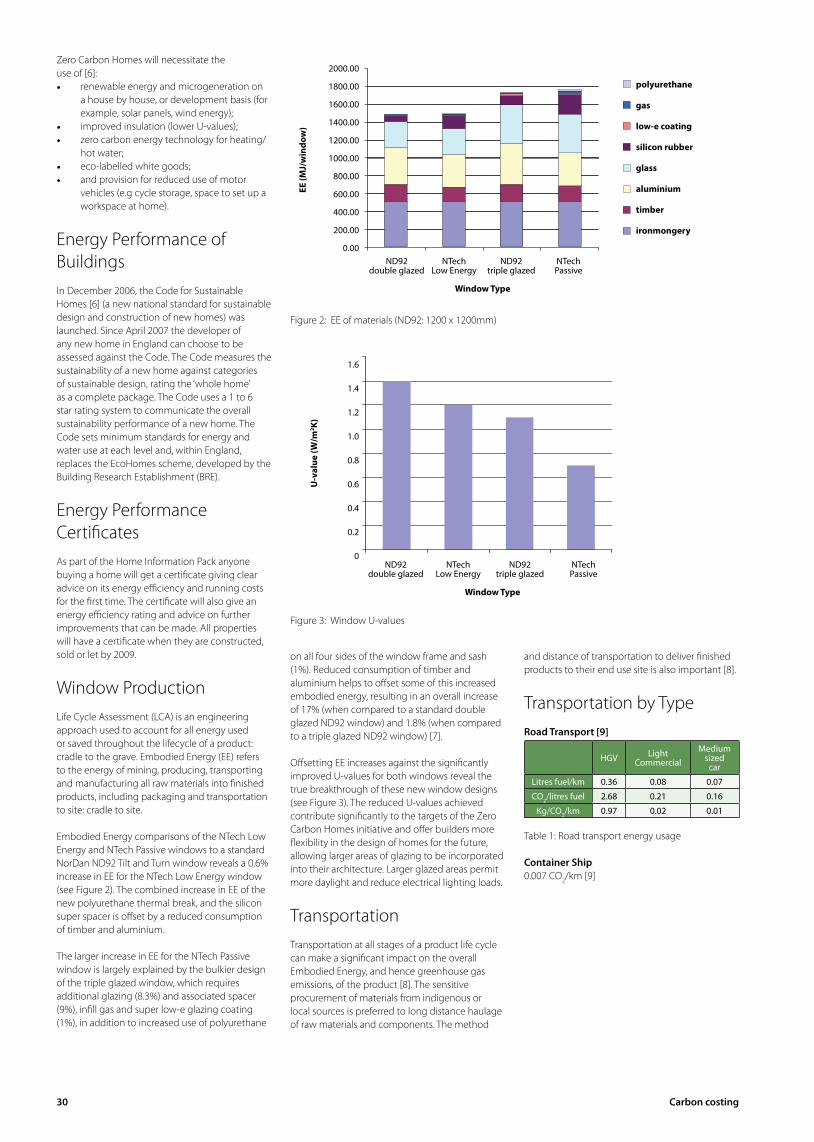
30 carbon costing
Zero Carbon Homes will necessitate theuse of [6]:
renewable energy and microgeneration on •a house by house, or development basis (for example, solar panels, wind energy);improved insulation (lower U-values);•zero carbon energy technology for heating/•hot water;eco-labelled white goods;•and provision for reduced use of motor •vehicles (e.g cycle storage, space to set up a workspace at home).
Energy Performance of BuildingsIn December 2006, the Code for Sustainable Homes [6] (a new national standard for sustainable design and construction of new homes) was launched. Since April 2007 the developer of any new home in England can choose to be assessed against the Code. The Code measures the sustainability of a new home against categories of sustainable design, rating the ‘whole home’ as a complete package. The Code uses a 1 to 6 star rating system to communicate the overall sustainability performance of a new home. The Code sets minimum standards for energy and water use at each level and, within England, replaces the EcoHomes scheme, developed by the Building Research Establishment (BRE).
Energy Performance CertificatesAs part of the Home Information Pack anyone buying a home will get a certificate giving clear advice on its energy efficiency and running costs for the first time. The certificate will also give an energy efficiency rating and advice on further improvements that can be made. All properties will have a certificate when they are constructed, sold or let by 2009.
Window ProductionLife Cycle Assessment (LCA) is an engineering approach used to account for all energy used or saved throughout the lifecycle of a product: cradle to the grave. Embodied Energy (EE) refers to the energy of mining, producing, transporting and manufacturing all raw materials into finished products, including packaging and transportation to site: cradle to site.
Embodied Energy comparisons of the NTech Low Energy and NTech Passive windows to a standard NorDan ND92 Tilt and Turn window reveals a 0.6% increase in EE for the NTech Low Energy window (see Figure 2). The combined increase in EE of the new polyurethane thermal break, and the silicon super spacer is offset by a reduced consumption of timber and aluminium.
The larger increase in EE for the NTech Passive window is largely explained by the bulkier design of the triple glazed window, which requires additional glazing (8.3%) and associated spacer (9%), infill gas and super low-e glazing coating (1%), in addition to increased use of polyurethane
on all four sides of the window frame and sash (1%). Reduced consumption of timber and aluminium helps to offset some of this increased embodied energy, resulting in an overall increase of 17% (when compared to a standard double glazed ND92 window) and 1.8% (when compared to a triple glazed ND92 window) [7].
Offsetting EE increases against the significantly improved U-values for both windows reveal the true breakthrough of these new window designs (see Figure 3). The reduced U-values achieved contribute significantly to the targets of the Zero Carbon Homes initiative and offer builders more flexibility in the design of homes for the future, allowing larger areas of glazing to be incorporated into their architecture. Larger glazed areas permit more daylight and reduce electrical lighting loads.
TransportationTransportation at all stages of a product life cycle can make a significant impact on the overall Embodied Energy, and hence greenhouse gas emissions, of the product [8]. The sensitive procurement of materials from indigenous or local sources is preferred to long distance haulage of raw materials and components. The method
and distance of transportation to deliver finished products to their end use site is also important [8].
Transportation by Typeroad Transport [9]
HGV Light Commercial
Medium sized
car
Litres fuel/km 0.36 0.08 0.07
CO2/litres fuel 2.68 0.21 0.16
Kg/CO2/km 0.97 0.02 0.01
Table 1: Road transport energy usage
container ship0.007 CO2/km [9]
Figure 2: EE of materials (ND92: 1200 x 1200mm)
0.00
200.00
400.00
600.00
800.00
1000.00
1200.00
1400.00
1600.00
1800.00
2000.00
EE (M
J/w
indo
w)
polyurethane
gas
low-e coating
silicon rubber
glass
aluminium
timber
ironmongery
ND92doubleglazed
NTECHlow
energy
NTECHPassive
ND92triple
glazed
EE (M
J/w
indo
w)
ND92double glazed
NTechLow Energy
ND92triple glazed
NTechPassive
Window Type
polyurethane
gas
low-e coating
silicon rubber
glass
aluminium
timber
ironmongery
2000.00
1800.00
1600.00
1400.00
1200.00
1000.00
800.00
600.00
400.00
200.00
0.00
Figure 3: Window U-values
0
0.2
0.4
0.6
0.8
1
1.2
1.4
1.6
ND92 do
uble
glaze
d
NTECH Low E
nergy
ND92 tri
ple gl
azed
NTECH Pas
sive
U-V
alue
(W/m
2 K)
ND92double glazed
NTechLow Energy
ND92triple glazed
NTechPassive
Window Type
1.6
1.4
1.2
1.0
0.8
0.6
0.4
0.2
0
U-v
alue
(W/m
2 K)
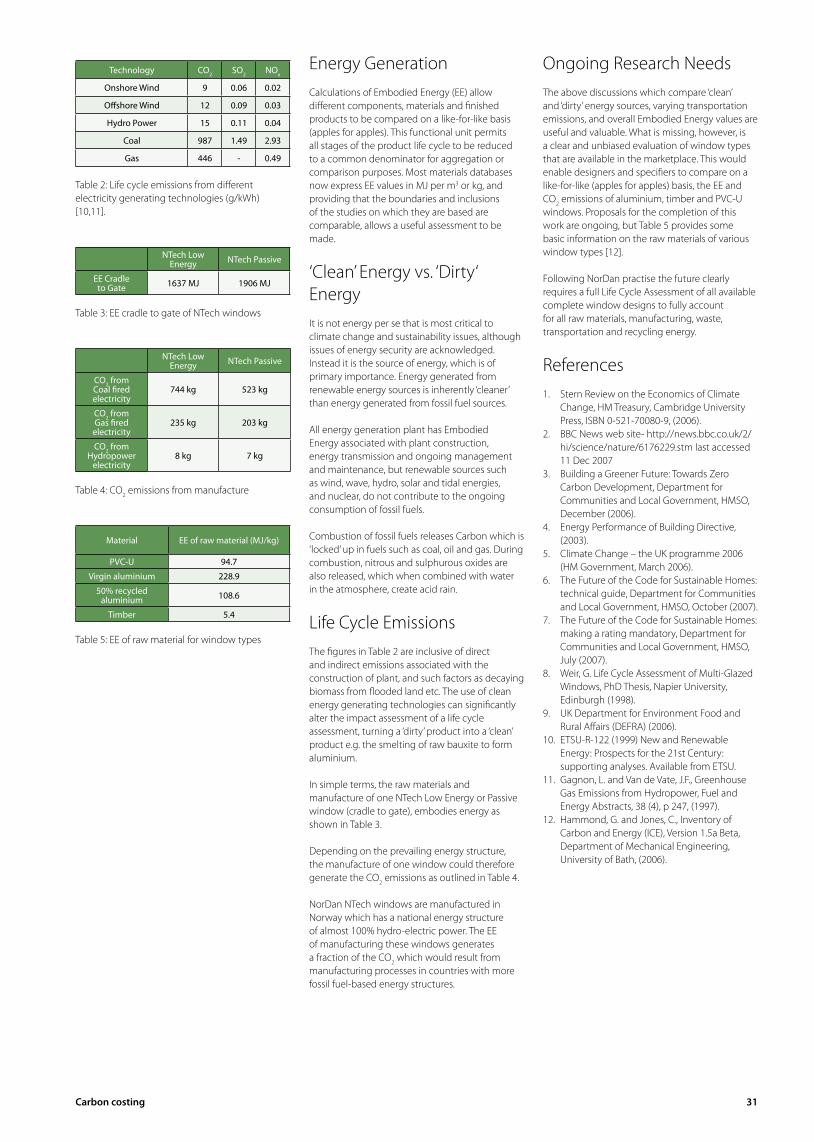
carbon costing 31
Technology CO2 SO2 NOx
Onshore Wind 9 0.06 0.02
Offshore Wind 12 0.09 0.03
Hydro Power 15 0.11 0.04
Coal 987 1.49 2.93
Gas 446 - 0.49
Table 2: Life cycle emissions from different electricity generating technologies (g/kWh) [10,11].
NTech LowEnergy NTech Passive
EE Cradleto Gate 1637 MJ 1906 MJ
Table 3: EE cradle to gate of NTech windows
NTech LowEnergy NTech Passive
CO2 fromCoal firedelectricity
744 kg 523 kg
CO2 fromGas fired
electricity235 kg 203 kg
CO2 fromHydropower
electricity8 kg 7 kg
Table 4: CO2 emissions from manufacture
Material EE of raw material (MJ/kg)
PVC-U 94.7
Virgin aluminium 228.9
50% recycled aluminium 108.6
Timber 5.4
Table 5: EE of raw material for window types
Energy GenerationCalculations of Embodied Energy (EE) allow different components, materials and finished products to be compared on a like-for-like basis (apples for apples). This functional unit permits all stages of the product life cycle to be reduced to a common denominator for aggregation or comparison purposes. Most materials databases now express EE values in MJ per m3 or kg, and providing that the boundaries and inclusions of the studies on which they are based are comparable, allows a useful assessment to be made.
‘Clean’ Energy vs. ‘Dirty‘ EnergyIt is not energy per se that is most critical to climate change and sustainability issues, although issues of energy security are acknowledged. Instead it is the source of energy, which is of primary importance. Energy generated from renewable energy sources is inherently ‘cleaner’ than energy generated from fossil fuel sources.
All energy generation plant has Embodied Energy associated with plant construction, energy transmission and ongoing management and maintenance, but renewable sources such as wind, wave, hydro, solar and tidal energies, and nuclear, do not contribute to the ongoing consumption of fossil fuels.
Combustion of fossil fuels releases Carbon which is ‘locked’ up in fuels such as coal, oil and gas. During combustion, nitrous and sulphurous oxides are also released, which when combined with water in the atmosphere, create acid rain.
Life Cycle EmissionsThe figures in Table 2 are inclusive of direct and indirect emissions associated with the construction of plant, and such factors as decaying biomass from flooded land etc. The use of clean energy generating technologies can significantly alter the impact assessment of a life cycle assessment, turning a ‘dirty’ product into a ‘clean’ product e.g. the smelting of raw bauxite to form aluminium.
In simple terms, the raw materials and manufacture of one NTech Low Energy or Passive window (cradle to gate), embodies energy as shown in Table 3.
Depending on the prevailing energy structure, the manufacture of one window could therefore generate the CO2 emissions as outlined in Table 4.
NorDan NTech windows are manufactured in Norway which has a national energy structure of almost 100% hydro-electric power. The EE of manufacturing these windows generates a fraction of the CO2 which would result from manufacturing processes in countries with more fossil fuel-based energy structures.
Ongoing Research NeedsThe above discussions which compare ‘clean’ and ‘dirty’ energy sources, varying transportation emissions, and overall Embodied Energy values are useful and valuable. What is missing, however, is a clear and unbiased evaluation of window types that are available in the marketplace. This would enable designers and specifiers to compare on a like-for-like (apples for apples) basis, the EE and CO2 emissions of aluminium, timber and PVC-U windows. Proposals for the completion of this work are ongoing, but Table 5 provides some basic information on the raw materials of various window types [12].
Following NorDan practise the future clearly requires a full Life Cycle Assessment of all available complete window designs to fully account for all raw materials, manufacturing, waste, transportation and recycling energy.
References1. Stern Review on the Economics of Climate
Change, HM Treasury, Cambridge University Press, ISBN 0-521-70080-9, (2006).
2. BBC News web site- http://news.bbc.co.uk/2/hi/science/nature/6176229.stm last accessed 11 Dec 2007
3. Building a Greener Future: Towards Zero Carbon Development, Department for Communities and Local Government, HMSO, December (2006).
4. Energy Performance of Building Directive, (2003).
5. Climate Change – the UK programme 2006 (HM Government, March 2006).
6. The Future of the Code for Sustainable Homes: technical guide, Department for Communities and Local Government, HMSO, October (2007).
7. The Future of the Code for Sustainable Homes: making a rating mandatory, Department for Communities and Local Government, HMSO, July (2007).
8. Weir, G. Life Cycle Assessment of Multi-Glazed Windows, PhD Thesis, Napier University, Edinburgh (1998).
9. UK Department for Environment Food and Rural Affairs (DEFRA) (2006).
10. ETSU-R-122 (1999) New and Renewable Energy: Prospects for the 21st Century: supporting analyses. Available from ETSU.
11. Gagnon, L. and Van de Vate, J.F., Greenhouse Gas Emissions from Hydropower, Fuel and Energy Abstracts, 38 (4), p 247, (1997).
12. Hammond, G. and Jones, C., Inventory of Carbon and Energy (ICE), Version 1.5a Beta, Department of Mechanical Engineering, University of Bath, (2006).
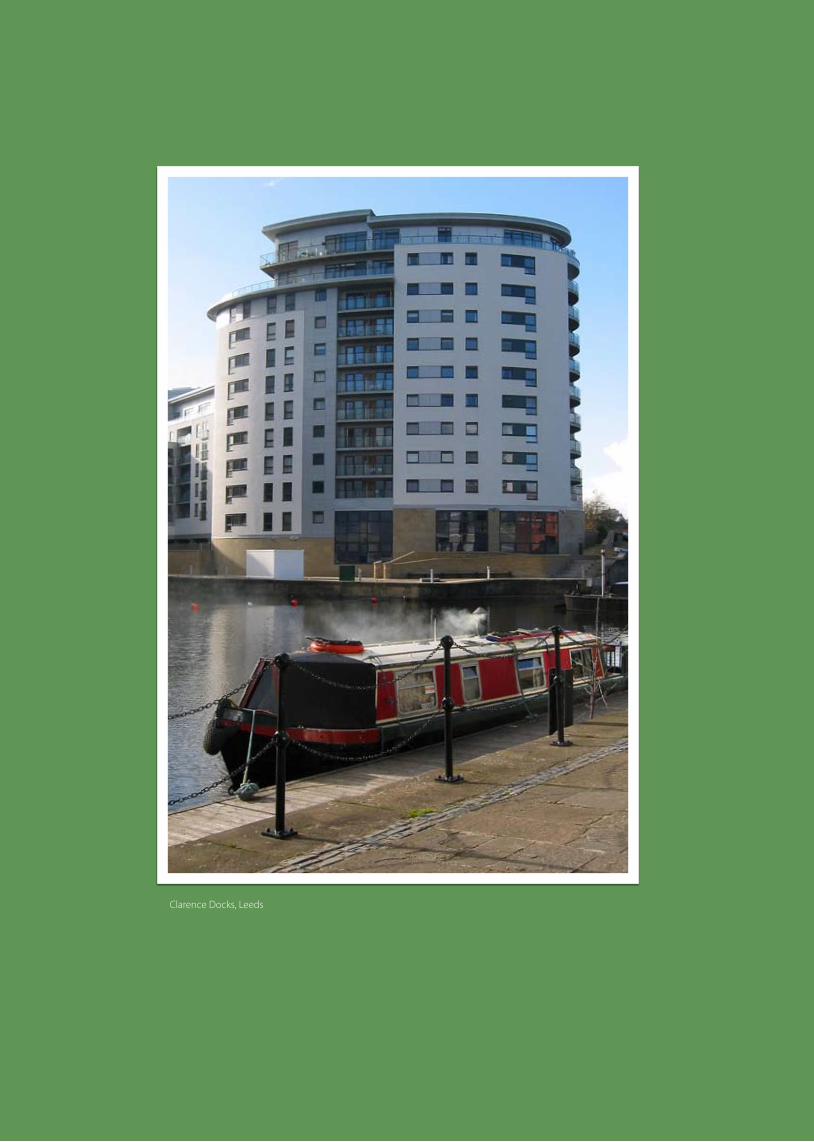
Clarence Docks, Leeds
The importance of U-values 33
There is no other component in the building sector with as rapid development in quality than in the field of windows. The thermal loss
coefficient of windows on the market (U-value) has been reduced by a factor 8 during the last 30 years. [1]
The principle of allocating an energy rating to windows, much the same as those applied to energy labels on white goods, is based on the general specification of the various components that go into the product manufacture, rather than being an accurate indicator of the overall performance of the window.
NorDan base whole-window performance on the results obtained from previous hot-box testing methods, compared with modern computer-modelled calculations, prior to obtaining verification by an independent testing authority. This process is crucial as U-values are an excellent
indicator of heat loss, which may then be used to calculate costs for projected energy use with various glazing combinations.
Depending on different industrial and scientific methods commonly used for calculating heat loss, NorDan found that their new NTech Passive window produced a variety of U-value results less than 0.7 W/m2K. Rather than advertise the lowest value, NorDan typically elected to adopt a ‘safe zone’ U-value of 0.7W/m2K.
A typical single glazed window has a U-value of 5.0 W/m2K, whereas a triple-glazed NorDan NTech Passive window with argon gas in the cavities, has a U-value of just 0.7 W/m2K. The latter is therefore seven times more efficient in energy retention, saving money, conserving energy and saving many hundreds of tonnes of CO2 emissions over the life-span of the window.
NorDan products not only have the lowest EE but also deliver lowest running costs (LCA). These two key factors ensure that their contribution maximises the impact against Global Warming by minimising CO2 emissions, causing less expenditure on heating bills, and conserving energy for future use.
References1. http://www.passivhaustagung.de/Passive_
House_E/windows_passive_houses_06.html, last accessed 12.6.08
The importance of U-values
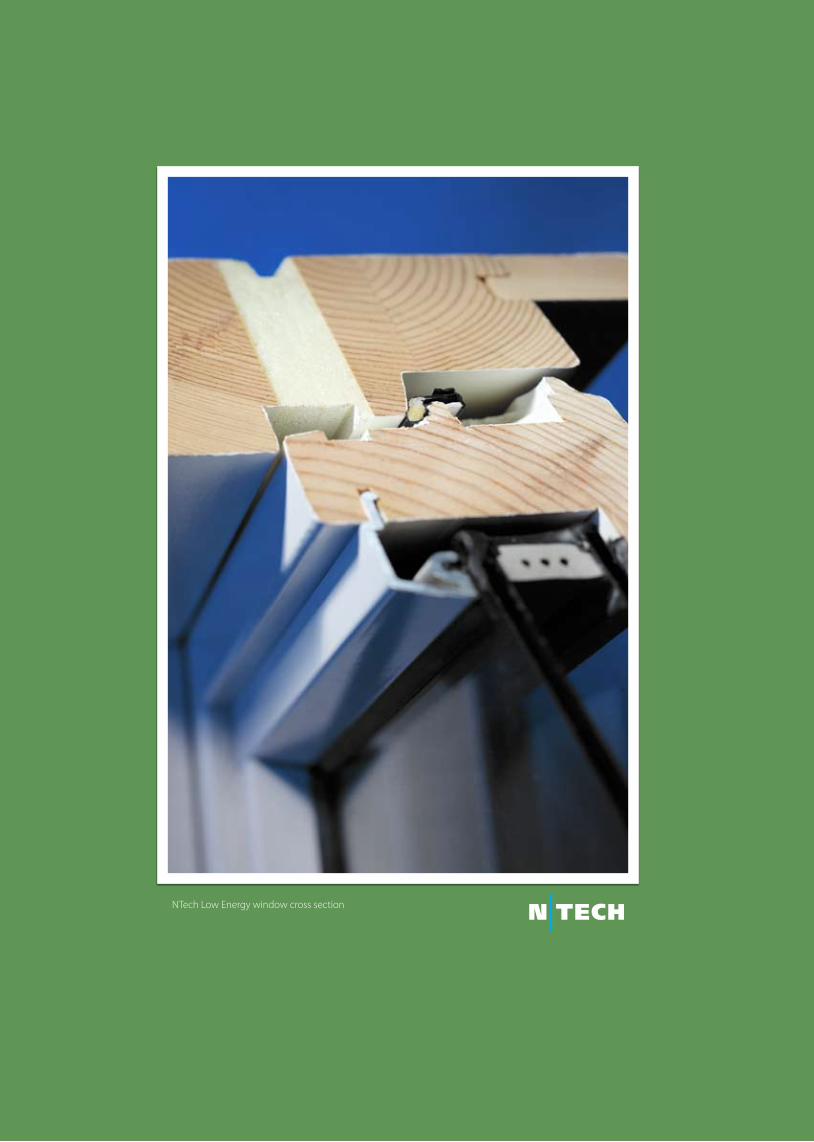
NTech Low Energy window cross section
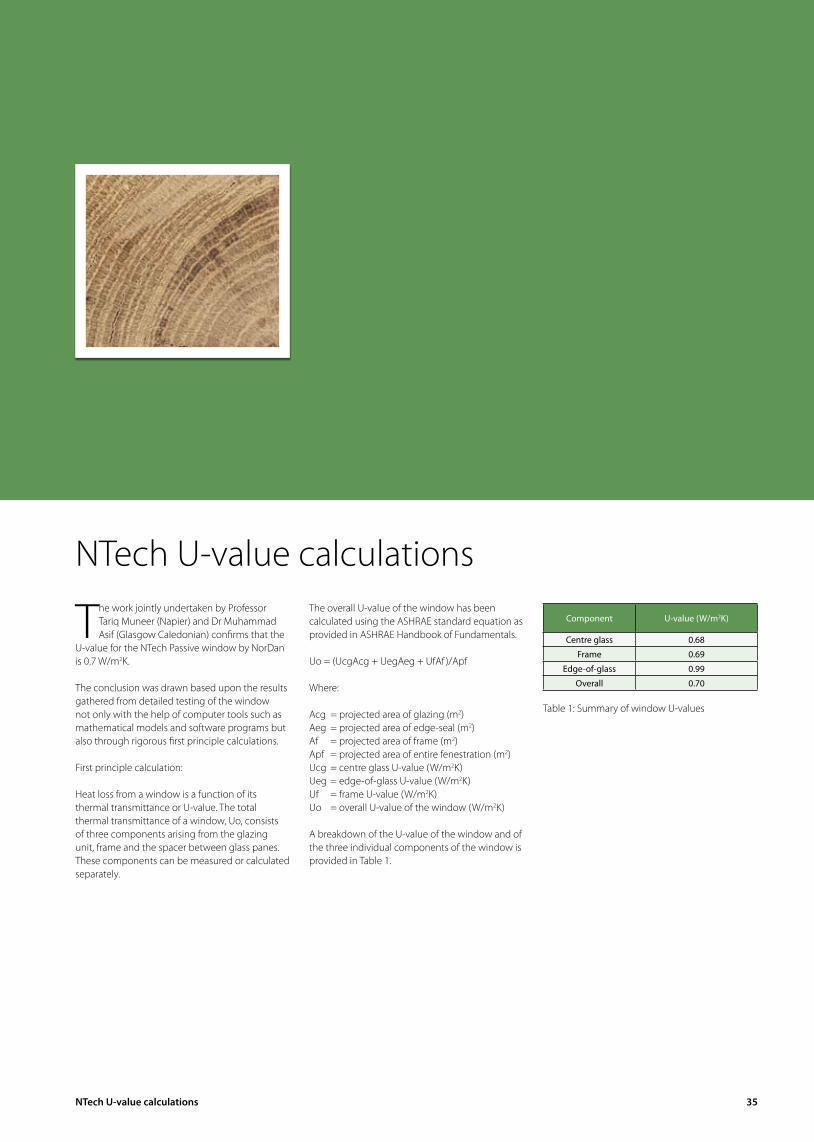
NTech U-value calculations 35
The work jointly undertaken by Professor Tariq Muneer (Napier) and Dr Muhammad Asif (Glasgow Caledonian) confirms that the
U-value for the NTech Passive window by NorDan is 0.7 W/m2K.
The conclusion was drawn based upon the results gathered from detailed testing of the window not only with the help of computer tools such as mathematical models and software programs but also through rigorous first principle calculations.
First principle calculation:
Heat loss from a window is a function of its thermal transmittance or U-value. The total thermal transmittance of a window, Uo, consists of three components arising from the glazing unit, frame and the spacer between glass panes. These components can be measured or calculated separately.
The overall U-value of the window has been calculated using the ASHRAE standard equation as provided in ASHRAE Handbook of Fundamentals.
Uo = (UcgAcg + UegAeg + UfAf )/Apf
Where:
Acg = projected area of glazing (m2)Aeg = projected area of edge-seal (m2)Af = projected area of frame (m2)Apf = projected area of entire fenestration (m2)Ucg = centre glass U-value (W/m2K)Ueg = edge-of-glass U-value (W/m2K)Uf = frame U-value (W/m2K)Uo = overall U-value of the window (W/m2K)
A breakdown of the U-value of the window and of the three individual components of the window is provided in Table 1.
Component U-value (W/m2K)
Centre glass 0.68
Frame 0.69
Edge-of-glass 0.99
Overall 0.70
Table 1: Summary of window U-values
NTech U-value calculations
NTech Passive window cross section
NTech life cycle cost comparisons 37
doctor muhammad Asifmay 2008
In the wake of the ever increasing energy and environmental challenges facing the planet, sustainability has become one of the core issues
in the world. Particularly, in the EU, sustainability has become an integral part of activities across the board – all sectors i.e. domestic, industrial, transportation and commercial have placed it at the forefront of their practices.
In the UK, the housing sector has a key role to play in promoting sustainability since it accounts for 29% and 27% of the total energy consumption and CO2 emissions respectively [1]. The UK has therefore set stringent targets for the housing sector - the government has announced that all new homes will be zero carbon by 2016 [2]. The target will be achieved by a framework for progressively tightening building regulations up to 2016, to increase the energy efficiency and reduce the carbon footprint of new homes. Several sets of building regulations such as Part L, Section 6 and the Code for Sustainable Homes are already in places that aim to increase the energy and environmental sustainability of new homes and give homeowners better information about the sustainability of their home.
Windows are amongst the most sensitive elements in a building envelope, also, due to their multi-disciplinary role, they are important not only for their effects on the interior environment but also for the energy performance of the building. Energy contents and environmental impacts of the materials involved, add to a window’s significance in the ecology of buildings. The improved characteristics of advanced windows can lead to substantial energy saving as a direct result of their use. Energy efficient windows with the least possible environmental burden over their whole life-cycle are thus very important in achieving low and zero carbon targets and the desired levels of sustainability in buildings.
Life Cycle Cost AnalysisLife Cycle Cost Analysis (LCCA) provides a system by means of which the total cost of a project over a given period, accounting for capital costs, running costs, maintenance and repair costs, and any other costs likely to be incurred throughout the life of a project, is estimated. Precisely LCCA can be defined as;
an economic assessment of an item, area, system or facility that considers all the significant costs of ownership over its economic life, expressed in terms of equivalent dollars [3].
LCCA is a very helpful tool that can provide a holistic economical analysis of windows as it considers the total cost incurred over their service life rather than merely initial capital cost. It quite pragmatically provides a basis for budgeting for future expenditure related to windows. The running cost of a window could be easily over 20 times higher than its capital cost, it is therefore extremely crucial to give due attention. The running cost, particularly in harsher climates, is greatly dominated by its energy (heat loss) cost, which can make up to 90% of the life cycle cost of a window.
Life Cycle Cost Comparison Analysis (LCCCA) between NorDan NTech windows and Approved Document Part L Conservation of Fuel and Power (2002 Edition) with April 2005 & September 2005 amendments- superseded by 6th April 2006 (hereafter referred to as ‘Part L’).
Life cycle costing (LCC) is an extremely effective yet a complicated process to undertake. Calculating Life Cycle Costing of windows is inherently difficult to precisely predict regarding the life time energy cost due to a number of unpredictable factors including energy prices and government policies. This is mainly because electricity and gas prices over the last five years have doubled in the UK. Also, oil prices in the international markets, for the last few years are
NTech life cycle cost comparisons
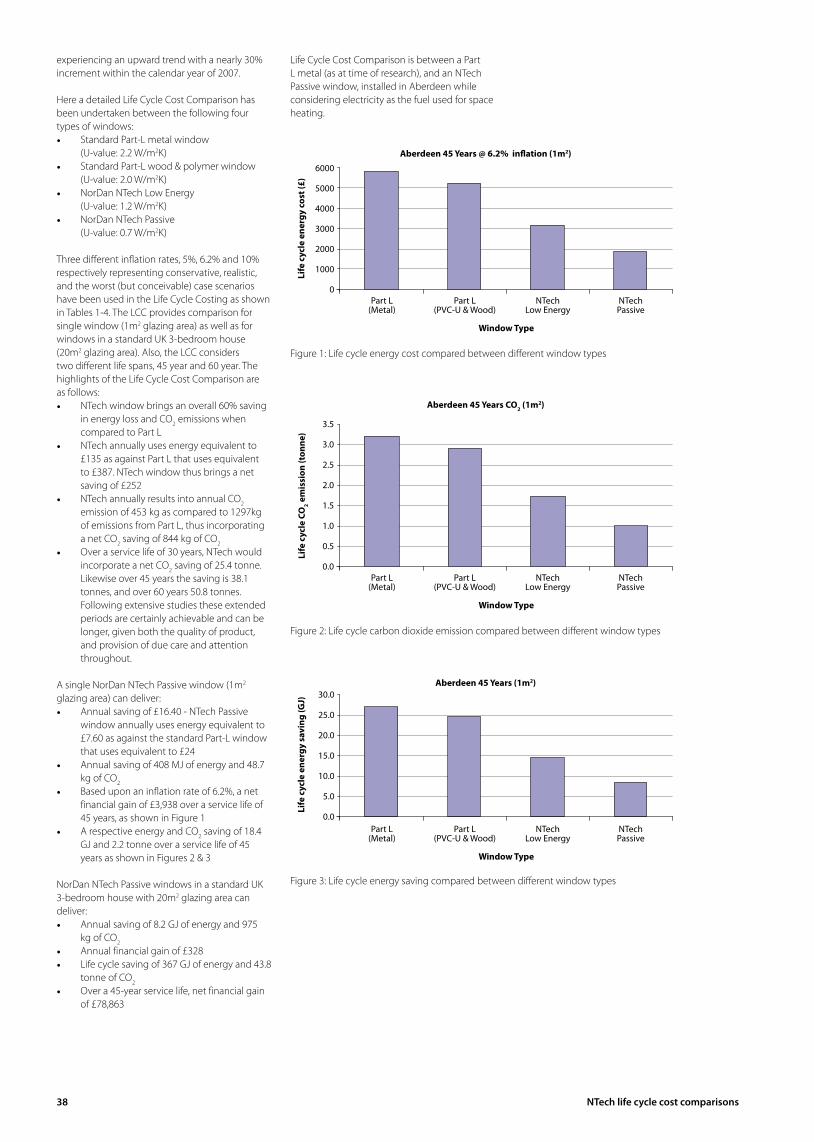
38 NTech life cycle cost comparisons
experiencing an upward trend with a nearly 30% increment within the calendar year of 2007.
Here a detailed Life Cycle Cost Comparison has been undertaken between the following four types of windows:
Standard Part-L metal window •(U-value: 2.2 W/m2K)Standard Part-L wood & polymer window •(U-value: 2.0 W/m2K)NorDan NTech Low Energy •(U-value: 1.2 W/m2K)NorDan NTech Passive •(U-value: 0.7 W/m2K)
Three different inflation rates, 5%, 6.2% and 10% respectively representing conservative, realistic, and the worst (but conceivable) case scenarios have been used in the Life Cycle Costing as shown in Tables 1-4. The LCC provides comparison for single window (1m2 glazing area) as well as for windows in a standard UK 3-bedroom house (20m2 glazing area). Also, the LCC considers two different life spans, 45 year and 60 year. The highlights of the Life Cycle Cost Comparison are as follows:
NTech window brings an overall 60% saving •in energy loss and CO2 emissions when compared to Part LNTech annually uses energy equivalent to •£135 as against Part L that uses equivalent to £387. NTech window thus brings a net saving of £252NTech annually results into annual CO• 2 emission of 453 kg as compared to 1297kg of emissions from Part L, thus incorporating a net CO2 saving of 844 kg of CO2
Over a service life of 30 years, NTech would •incorporate a net CO2 saving of 25.4 tonne. Likewise over 45 years the saving is 38.1 tonnes, and over 60 years 50.8 tonnes. Following extensive studies these extended periods are certainly achievable and can be longer, given both the quality of product, and provision of due care and attention throughout.
A single NorDan NTech Passive window (1m2 glazing area) can deliver:
Annual saving of £16.40 - NTech Passive •window annually uses energy equivalent to £7.60 as against the standard Part-L window that uses equivalent to £24Annual saving of 408 MJ of energy and 48.7 •kg of CO2
Based upon an inflation rate of 6.2%, a net •financial gain of £3,938 over a service life of 45 years, as shown in Figure 1A respective energy and CO• 2 saving of 18.4 GJ and 2.2 tonne over a service life of 45 years as shown in Figures 2 & 3
NorDan NTech Passive windows in a standard UK 3-bedroom house with 20m2 glazing area can deliver:
Annual saving of 8.2 GJ of energy and 975 •kg of CO2
Annual financial gain of £328•Life cycle saving of 367 GJ of energy and 43.8 •tonne of CO2
Over a 45-year service life, net financial gain •of £78,863
Life Cycle Cost Comparison is between a Part L metal (as at time of research), and an NTech Passive window, installed in Aberdeen while considering electricity as the fuel used for space heating.
Figure 1: Life cycle energy cost compared between different window types
Aberdeen 45 Years @ 6.2% inflation (1m2)
0
1000
2000
3000
4000
5000
6000
Part L(Metal)
Part L(PVC-U& Wood)
NTECH(Low Energy)
NTECH(Passive)
Life
cyc
le e
nerg
y co
st (£
)Part L
(Metal)Part L
(PVC-U & Wood)NTech
Low EnergyNTechPassive
Window Type
Life
cyc
le e
nerg
y co
st (£
)
Aberdeen 45 Years @ 6.2% inflation (1m2)
Figure 2: Life cycle carbon dioxide emission compared between different window types
Aberdeen 45 Years CO2 (1m2)
0.0
0.5
1.0
1.5
2.0
2.5
3.0
3.5
Part L(Metal)
Part L(PVC-U& Wood)
NTECH(Low Energy)
NTECH(Passive)
Life
cyc
le C
O2 e
mis
sion
(ton
ne)
Part L(Metal)
Part L(PVC-U & Wood)
NTechLow Energy
NTechPassive
Window Type
Life
cyc
le C
O2 e
mis
sion
(ton
ne)
Aberdeen 45 Years CO2 (1m2)
Figure 3: Life cycle energy saving compared between different window types
Aberdeen 45 Years (1m2)
0.0
5.0
10.0
15.0
20.0
25.0
30.0
Part L(Metal)
Part L(PVC-U& Wood)
NTECH(Low Energy)
NTECH(Passive)
Life
cyc
le e
nerg
y sa
ving
(GJ)
Part L(Metal)
Part L(PVC-U & Wood)
NTechLow Energy
NTechPassive
Window Type
Life
cyc
le e
nerg
y sa
ving
(GJ)
Aberdeen 45 Years (1m2)
6000
5000
4000
3000
2000
1000
0
3.5
3.0
2.5
2.0
1.5
1.0
0.5
0.0
30.0
25.0
20.0
15.0
10.0
5.0
0.0
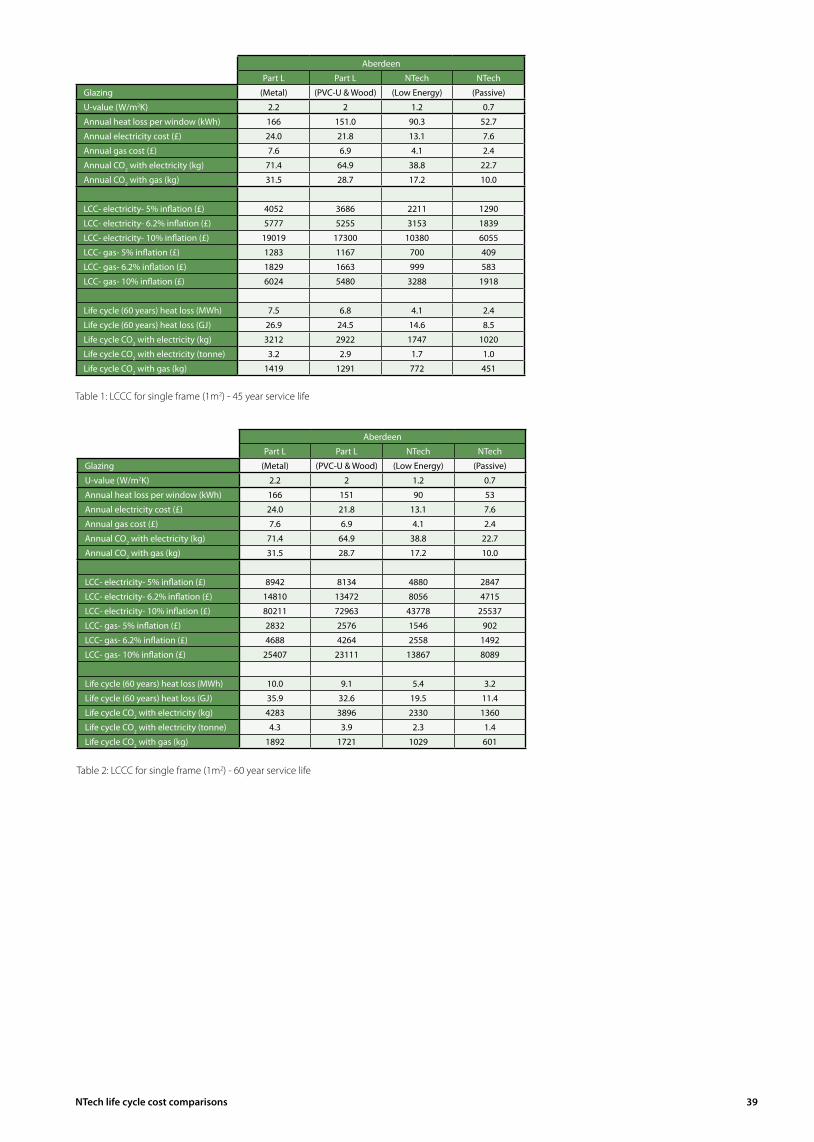
NTech life cycle cost comparisons 39
Aberdeen
Part L Part L NTech NTech
Glazing (Metal) (PVC-U & Wood) (Low Energy) (Passive)
U-value (W/m2K) 2.2 2 1.2 0.7
Annual heat loss per window (kWh) 166 151 90 53
Annual electricity cost (£) 24.0 21.8 13.1 7.6
Annual gas cost (£) 7.6 6.9 4.1 2.4
Annual CO2 with electricity (kg) 71.4 64.9 38.8 22.7
Annual CO2 with gas (kg) 31.5 28.7 17.2 10.0
LCC- electricity- 5% inflation (£) 8942 8134 4880 2847
LCC- electricity- 6.2% inflation (£) 14810 13472 8056 4715
LCC- electricity- 10% inflation (£) 80211 72963 43778 25537
LCC- gas- 5% inflation (£) 2832 2576 1546 902
LCC- gas- 6.2% inflation (£) 4688 4264 2558 1492
LCC- gas- 10% inflation (£) 25407 23111 13867 8089
Life cycle (60 years) heat loss (MWh) 10.0 9.1 5.4 3.2
Life cycle (60 years) heat loss (GJ) 35.9 32.6 19.5 11.4
Life cycle CO2 with electricity (kg) 4283 3896 2330 1360
Life cycle CO2 with electricity (tonne) 4.3 3.9 2.3 1.4
Life cycle CO2 with gas (kg) 1892 1721 1029 601
Table 2: LCCC for single frame (1m2) - 60 year service life
Aberdeen
Part L Part L NTech NTech
Glazing (Metal) (PVC-U & Wood) (Low Energy) (Passive)
U-value (W/m2K) 2.2 2 1.2 0.7
Annual heat loss per window (kWh) 166 151.0 90.3 52.7
Annual electricity cost (£) 24.0 21.8 13.1 7.6
Annual gas cost (£) 7.6 6.9 4.1 2.4
Annual CO2 with electricity (kg) 71.4 64.9 38.8 22.7
Annual CO2 with gas (kg) 31.5 28.7 17.2 10.0
LCC- electricity- 5% inflation (£) 4052 3686 2211 1290
LCC- electricity- 6.2% inflation (£) 5777 5255 3153 1839
LCC- electricity- 10% inflation (£) 19019 17300 10380 6055
LCC- gas- 5% inflation (£) 1283 1167 700 409
LCC- gas- 6.2% inflation (£) 1829 1663 999 583
LCC- gas- 10% inflation (£) 6024 5480 3288 1918
Life cycle (60 years) heat loss (MWh) 7.5 6.8 4.1 2.4
Life cycle (60 years) heat loss (GJ) 26.9 24.5 14.6 8.5
Life cycle CO2 with electricity (kg) 3212 2922 1747 1020
Life cycle CO2 with electricity (tonne) 3.2 2.9 1.7 1.0
Life cycle CO2 with gas (kg) 1419 1291 772 451
Table 1: LCCC for single frame (1m2) - 45 year service life
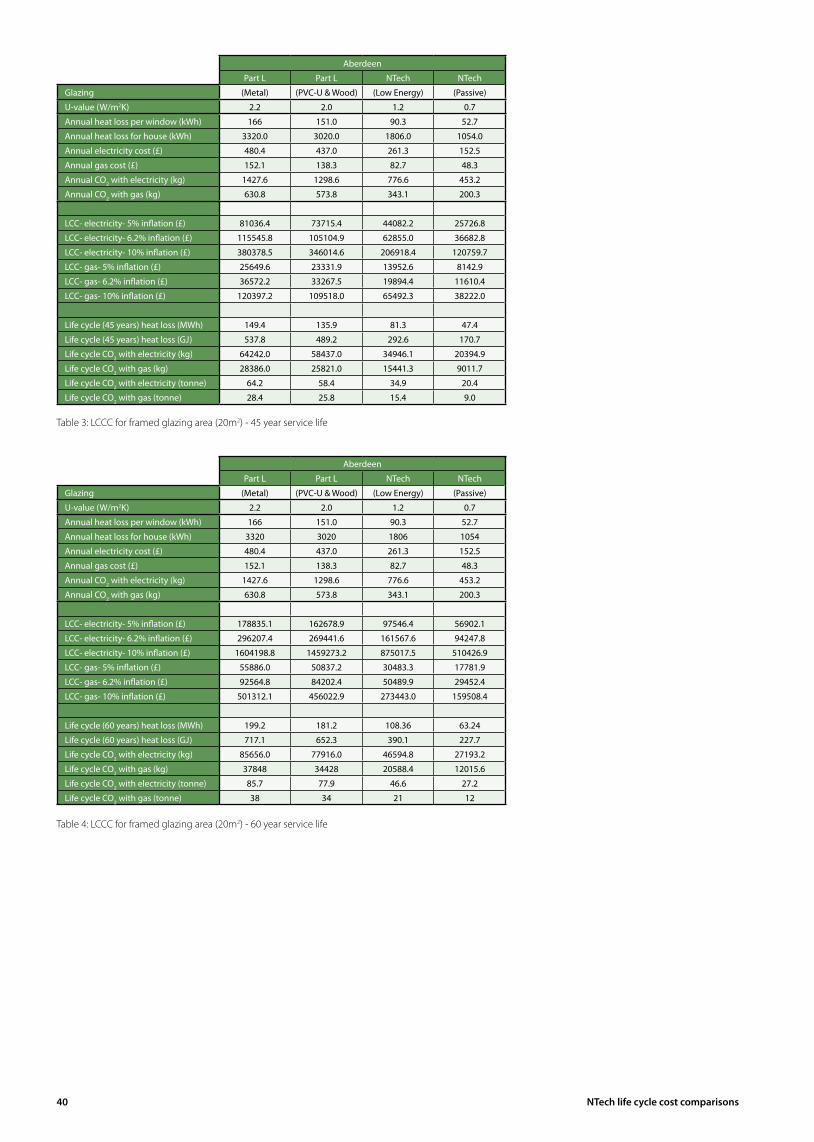
40 NTech life cycle cost comparisons
Table 4: LCCC for framed glazing area (20m2) - 60 year service life
Aberdeen
Part L Part L NTech NTech
Glazing (Metal) (PVC-U & Wood) (Low Energy) (Passive)
U-value (W/m2K) 2.2 2.0 1.2 0.7
Annual heat loss per window (kWh) 166 151.0 90.3 52.7
Annual heat loss for house (kWh) 3320 3020 1806 1054
Annual electricity cost (£) 480.4 437.0 261.3 152.5
Annual gas cost (£) 152.1 138.3 82.7 48.3
Annual CO2 with electricity (kg) 1427.6 1298.6 776.6 453.2
Annual CO2 with gas (kg) 630.8 573.8 343.1 200.3
LCC- electricity- 5% inflation (£) 178835.1 162678.9 97546.4 56902.1
LCC- electricity- 6.2% inflation (£) 296207.4 269441.6 161567.6 94247.8
LCC- electricity- 10% inflation (£) 1604198.8 1459273.2 875017.5 510426.9
LCC- gas- 5% inflation (£) 55886.0 50837.2 30483.3 17781.9
LCC- gas- 6.2% inflation (£) 92564.8 84202.4 50489.9 29452.4
LCC- gas- 10% inflation (£) 501312.1 456022.9 273443.0 159508.4
Life cycle (60 years) heat loss (MWh) 199.2 181.2 108.36 63.24
Life cycle (60 years) heat loss (GJ) 717.1 652.3 390.1 227.7
Life cycle CO2 with electricity (kg) 85656.0 77916.0 46594.8 27193.2
Life cycle CO2 with gas (kg) 37848 34428 20588.4 12015.6
Life cycle CO2 with electricity (tonne) 85.7 77.9 46.6 27.2
Life cycle CO2 with gas (tonne) 38 34 21 12
Aberdeen
Part L Part L NTech NTech
Glazing (Metal) (PVC-U & Wood) (Low Energy) (Passive)
U-value (W/m2K) 2.2 2.0 1.2 0.7
Annual heat loss per window (kWh) 166 151.0 90.3 52.7
Annual heat loss for house (kWh) 3320.0 3020.0 1806.0 1054.0
Annual electricity cost (£) 480.4 437.0 261.3 152.5
Annual gas cost (£) 152.1 138.3 82.7 48.3
Annual CO2 with electricity (kg) 1427.6 1298.6 776.6 453.2
Annual CO2 with gas (kg) 630.8 573.8 343.1 200.3
LCC- electricity- 5% inflation (£) 81036.4 73715.4 44082.2 25726.8
LCC- electricity- 6.2% inflation (£) 115545.8 105104.9 62855.0 36682.8
LCC- electricity- 10% inflation (£) 380378.5 346014.6 206918.4 120759.7
LCC- gas- 5% inflation (£) 25649.6 23331.9 13952.6 8142.9
LCC- gas- 6.2% inflation (£) 36572.2 33267.5 19894.4 11610.4
LCC- gas- 10% inflation (£) 120397.2 109518.0 65492.3 38222.0
Life cycle (45 years) heat loss (MWh) 149.4 135.9 81.3 47.4
Life cycle (45 years) heat loss (GJ) 537.8 489.2 292.6 170.7
Life cycle CO2 with electricity (kg) 64242.0 58437.0 34946.1 20394.9
Life cycle CO2 with gas (kg) 28386.0 25821.0 15441.3 9011.7
Life cycle CO2 with electricity (tonne) 64.2 58.4 34.9 20.4
Life cycle CO2 with gas (tonne) 28.4 25.8 15.4 9.0
Table 3: LCCC for framed glazing area (20m2) - 45 year service life
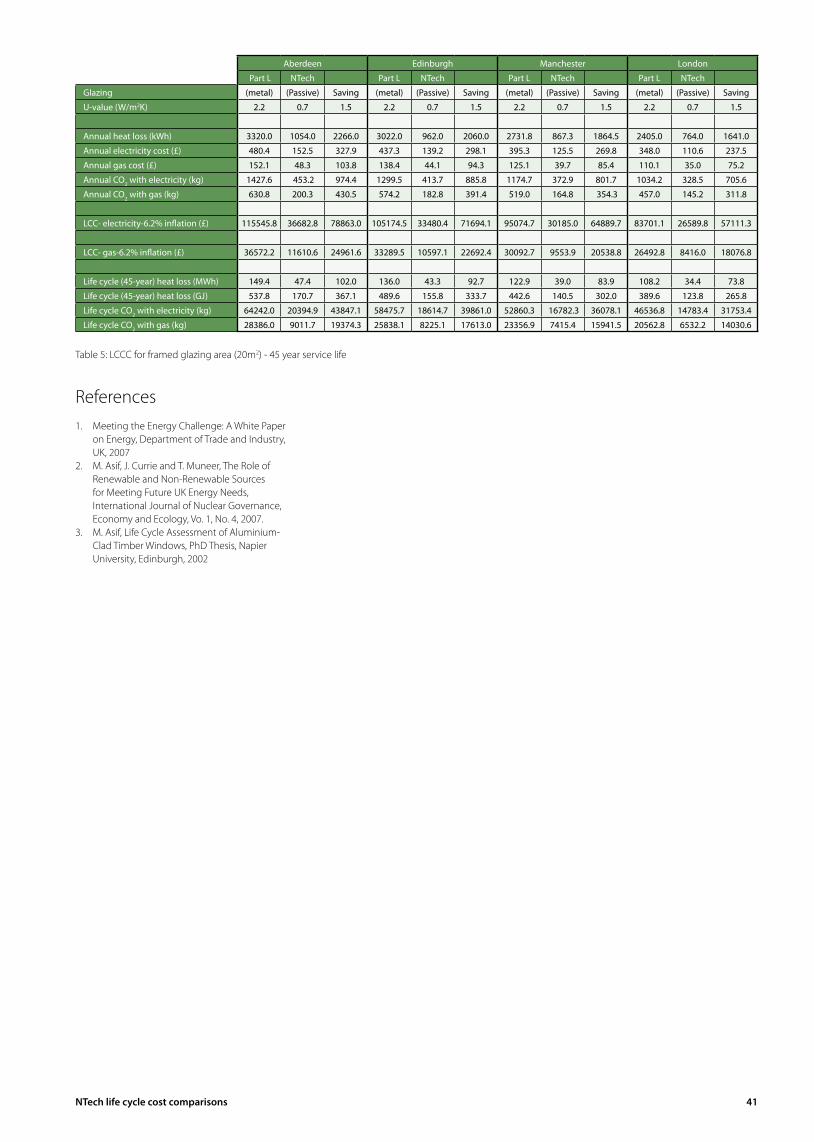
NTech life cycle cost comparisons 41
Table 5: LCCC for framed glazing area (20m2) - 45 year service life
Aberdeen Edinburgh Manchester London
Part L NTech Part L NTech Part L NTech Part L NTech
Glazing (metal) (Passive) Saving (metal) (Passive) Saving (metal) (Passive) Saving (metal) (Passive) Saving
U-value (W/m2K) 2.2 0.7 1.5 2.2 0.7 1.5 2.2 0.7 1.5 2.2 0.7 1.5
Annual heat loss (kWh) 3320.0 1054.0 2266.0 3022.0 962.0 2060.0 2731.8 867.3 1864.5 2405.0 764.0 1641.0
Annual electricity cost (£) 480.4 152.5 327.9 437.3 139.2 298.1 395.3 125.5 269.8 348.0 110.6 237.5
Annual gas cost (£) 152.1 48.3 103.8 138.4 44.1 94.3 125.1 39.7 85.4 110.1 35.0 75.2
Annual CO2 with electricity (kg) 1427.6 453.2 974.4 1299.5 413.7 885.8 1174.7 372.9 801.7 1034.2 328.5 705.6
Annual CO2 with gas (kg) 630.8 200.3 430.5 574.2 182.8 391.4 519.0 164.8 354.3 457.0 145.2 311.8
LCC- electricity-6.2% inflation (£) 115545.8 36682.8 78863.0 105174.5 33480.4 71694.1 95074.7 30185.0 64889.7 83701.1 26589.8 57111.3
LCC- gas-6.2% inflation (£) 36572.2 11610.6 24961.6 33289.5 10597.1 22692.4 30092.7 9553.9 20538.8 26492.8 8416.0 18076.8
Life cycle (45-year) heat loss (MWh) 149.4 47.4 102.0 136.0 43.3 92.7 122.9 39.0 83.9 108.2 34.4 73.8
Life cycle (45-year) heat loss (GJ) 537.8 170.7 367.1 489.6 155.8 333.7 442.6 140.5 302.0 389.6 123.8 265.8
Life cycle CO2 with electricity (kg) 64242.0 20394.9 43847.1 58475.7 18614.7 39861.0 52860.3 16782.3 36078.1 46536.8 14783.4 31753.4
Life cycle CO2 with gas (kg) 28386.0 9011.7 19374.3 25838.1 8225.1 17613.0 23356.9 7415.4 15941.5 20562.8 6532.2 14030.6
References1. Meeting the Energy Challenge: A White Paper
on Energy, Department of Trade and Industry, UK, 2007
2. M. Asif, J. Currie and T. Muneer, The Role of Renewable and Non-Renewable Sources for Meeting Future UK Energy Needs, International Journal of Nuclear Governance, Economy and Ecology, Vo. 1, No. 4, 2007.
3. M. Asif, Life Cycle Assessment of Aluminium-Clad Timber Windows, PhD Thesis, Napier University, Edinburgh, 2002
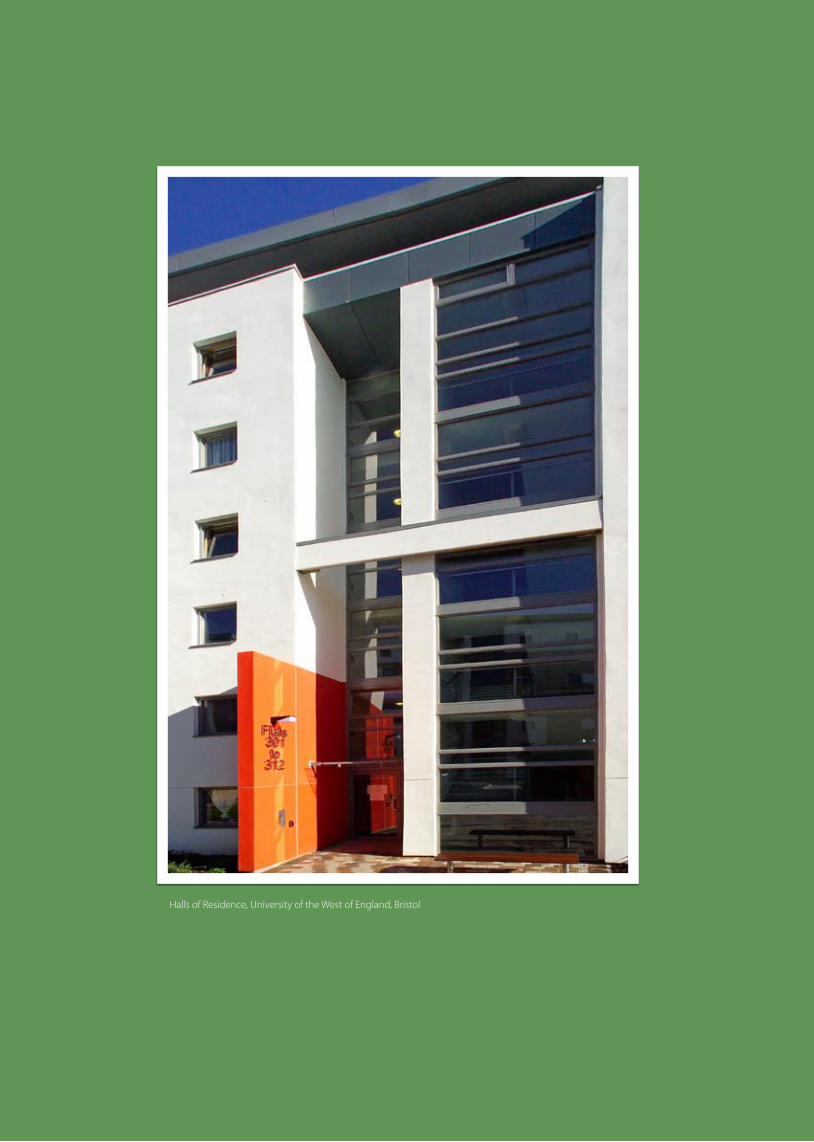
Halls of Residence, University of the West of England, Bristol
Whole life analysis 43
ian miller, cyril sweett (Whole Life Team)may 2008
1.0 Introduction
NorDan UK Ltd commissioned the Cyril Sweett ‘Whole Life Team’ to update the analysis for a range of window
technologies, both in terms life cycle replacement and energy costs.
The driver for this review of previous work in the forthcoming launch of a new generation of product, referred to as ‘NTech’.
NorDan are reviewing their entire Marketing approach that will not only reflect the latest mergers within the business structure but also communicates the strengths of the new product in meeting the increasing need for sustainability.
1.1 Introduction: NorDan ASNorDan AS, is a Norwegian company (Est. 1926 – current t/o 1,080M Nok) specialising in the manufacture of timber windows and doors. Their daughter company, NorDan UK Ltd (Reg. 1983 – current t/o £30M) manages sales and services throughout the UK. Although NDAS is renowned as a traditional timber manufacturer, in
the early 1960’s they made an important decision to upgrade all their manufacturing facilities to produce only high performance products, and at about the same time introduce aluminium cladding as an option to the sales of windows and doors.
The aluminium cladding was designed to provide a self draining, self ventilating, weather screen. The original purpose being to provide a simple means to introduce a variety of colours without affecting traditional manufacturing processes. In the early days the aluminium was provided either anodised or natural, the latter often being painted once it had weathered (oxidised), see Figure 1.
As time evolved new benefits of the optional aluminium cladding (‘Alu-Clad’ as it became to be known) became widely recognised, such as, for the reduced cost of external maintenance, it’s simplicity to replace damaged cladding (albeit very rare), and external protection producing enhanced durability and longevity (see Figure 2). Anodising meanwhile gave way to Polyester Powder Coating with it’s huge array of attractive colours.
Now almost 50 years on, the design of NorDan’s high performance products together with it’s Alu-Clad option, still remains based on the very same design principles from all that time ago.
Figure 1: NorDan timber finished window(without aluminium cladding).
Figure 2: NorDan Alu-Clad timber window.
In 2001 Alu-Clad timber windows and doors finally overtook the production of timber windows, and this gap has widened ever since.
Whole life analysis
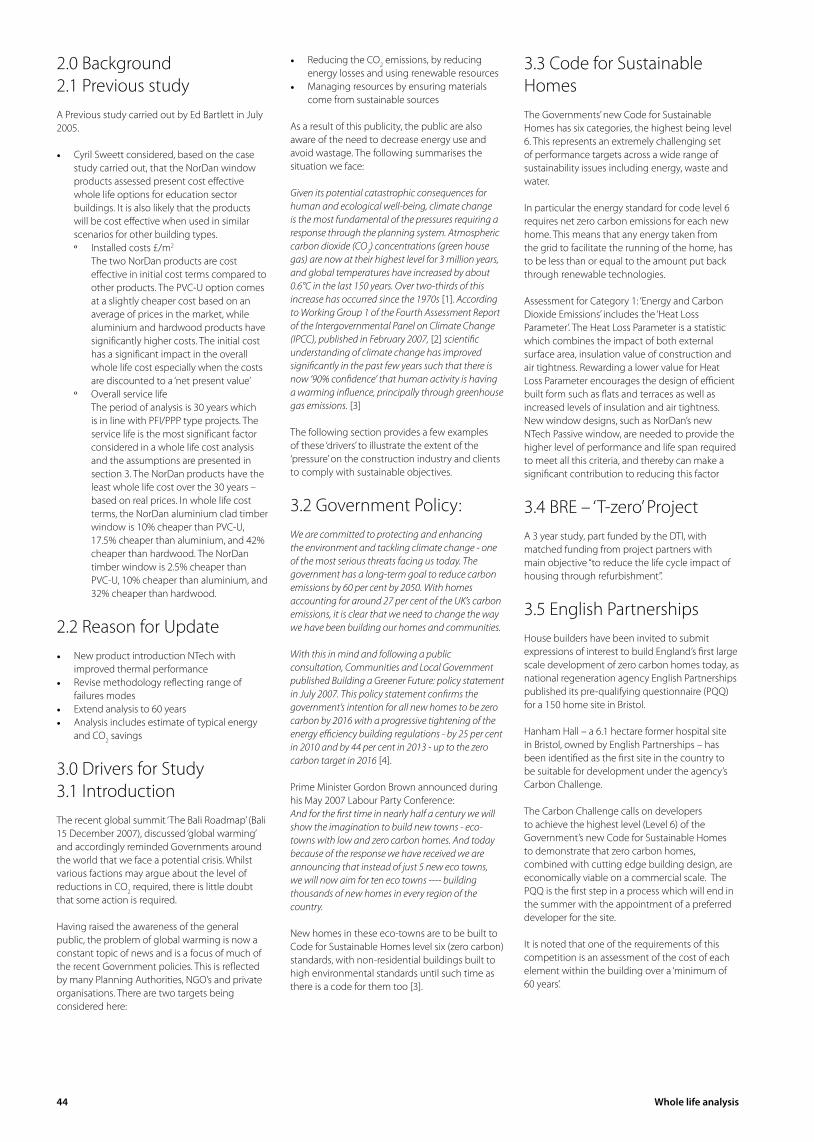
44 Whole life analysis
2.0 Background2.1 Previous studyA Previous study carried out by Ed Bartlett in July 2005.
Cyril Sweett considered, based on the case •study carried out, that the NorDan window products assessed present cost effective whole life options for education sector buildings. It is also likely that the products will be cost effective when used in similar scenarios for other building types.
Installed costs £/mº 2 The two NorDan products are cost effective in initial cost terms compared to other products. The PVC-U option comes at a slightly cheaper cost based on an average of prices in the market, while aluminium and hardwood products have significantly higher costs. The initial cost has a significant impact in the overall whole life cost especially when the costs are discounted to a ‘net present value’Overall service life ºThe period of analysis is 30 years which is in line with PFI/PPP type projects. The service life is the most significant factor considered in a whole life cost analysis and the assumptions are presented in section 3. The NorDan products have the least whole life cost over the 30 years – based on real prices. In whole life cost terms, the NorDan aluminium clad timber window is 10% cheaper than PVC-U, 17.5% cheaper than aluminium, and 42% cheaper than hardwood. The NorDan timber window is 2.5% cheaper than PVC-U, 10% cheaper than aluminium, and 32% cheaper than hardwood.
2.2 Reason for UpdateNew product introduction NTech with •improved thermal performanceRevise methodology reflecting range of •failures modesExtend analysis to 60 years•Analysis includes estimate of typical energy •and CO2 savings
3.0 Drivers for Study3.1 IntroductionThe recent global summit ‘The Bali Roadmap’ (Bali 15 December 2007), discussed ‘global warming’ and accordingly reminded Governments around the world that we face a potential crisis. Whilst various factions may argue about the level of reductions in CO2 required, there is little doubt that some action is required.
Having raised the awareness of the general public, the problem of global warming is now a constant topic of news and is a focus of much of the recent Government policies. This is reflected by many Planning Authorities, NGO’s and private organisations. There are two targets being considered here:
Reducing the CO• 2 emissions, by reducing energy losses and using renewable resourcesManaging resources by ensuring materials •come from sustainable sources
As a result of this publicity, the public are also aware of the need to decrease energy use and avoid wastage. The following summarises the situation we face:
Given its potential catastrophic consequences for human and ecological well-being, climate change is the most fundamental of the pressures requiring a response through the planning system. Atmospheric carbon dioxide (CO2) concentrations (green house gas) are now at their highest level for 3 million years, and global temperatures have increased by about 0.6°C in the last 150 years. Over two-thirds of this increase has occurred since the 1970s [1]. According to Working Group 1 of the Fourth Assessment Report of the Intergovernmental Panel on Climate Change (IPCC), published in February 2007, [2] scientific understanding of climate change has improved significantly in the past few years such that there is now ‘90% confidence’ that human activity is having a warming influence, principally through greenhouse gas emissions. [3] The following section provides a few examples of these ‘drivers’ to illustrate the extent of the ‘pressure’ on the construction industry and clients to comply with sustainable objectives.
3.2 Government Policy:We are committed to protecting and enhancing the environment and tackling climate change - one of the most serious threats facing us today. The government has a long-term goal to reduce carbon emissions by 60 per cent by 2050. With homes accounting for around 27 per cent of the UK’s carbon emissions, it is clear that we need to change the way we have been building our homes and communities.
With this in mind and following a public consultation, Communities and Local Government published Building a Greener Future: policy statement in July 2007. This policy statement confirms the government’s intention for all new homes to be zero carbon by 2016 with a progressive tightening of the energy efficiency building regulations - by 25 per cent in 2010 and by 44 per cent in 2013 - up to the zero carbon target in 2016 [4].
Prime Minister Gordon Brown announced during his May 2007 Labour Party Conference:And for the first time in nearly half a century we will show the imagination to build new towns - eco-towns with low and zero carbon homes. And today because of the response we have received we are announcing that instead of just 5 new eco towns, we will now aim for ten eco towns ---- building thousands of new homes in every region of the country.
New homes in these eco-towns are to be built to Code for Sustainable Homes level six (zero carbon) standards, with non-residential buildings built to high environmental standards until such time as there is a code for them too [3].
3.3 Code for Sustainable HomesThe Governments’ new Code for Sustainable Homes has six categories, the highest being level 6. This represents an extremely challenging set of performance targets across a wide range of sustainability issues including energy, waste and water.
In particular the energy standard for code level 6 requires net zero carbon emissions for each new home. This means that any energy taken from the grid to facilitate the running of the home, has to be less than or equal to the amount put back through renewable technologies.
Assessment for Category 1: ‘Energy and Carbon Dioxide Emissions’ includes the ‘Heat Loss Parameter’. The Heat Loss Parameter is a statistic which combines the impact of both external surface area, insulation value of construction and air tightness. Rewarding a lower value for Heat Loss Parameter encourages the design of efficient built form such as flats and terraces as well as increased levels of insulation and air tightness. New window designs, such as NorDan’s new NTech Passive window, are needed to provide the higher level of performance and life span required to meet all this criteria, and thereby can make a significant contribution to reducing this factor
3.4 BRE – ‘T-zero’ Project A 3 year study, part funded by the DTI, with matched funding from project partners with main objective “to reduce the life cycle impact of housing through refurbishment”.
3.5 English PartnershipsHouse builders have been invited to submit expressions of interest to build England’s first large scale development of zero carbon homes today, as national regeneration agency English Partnerships published its pre-qualifying questionnaire (PQQ) for a 150 home site in Bristol.
Hanham Hall – a 6.1 hectare former hospital site in Bristol, owned by English Partnerships – has been identified as the first site in the country to be suitable for development under the agency’s Carbon Challenge.
The Carbon Challenge calls on developers to achieve the highest level (Level 6) of the Government’s new Code for Sustainable Homes to demonstrate that zero carbon homes, combined with cutting edge building design, are economically viable on a commercial scale. The PQQ is the first step in a process which will end in the summer with the appointment of a preferred developer for the site.
It is noted that one of the requirements of this competition is an assessment of the cost of each element within the building over a ‘minimum of 60 years’.
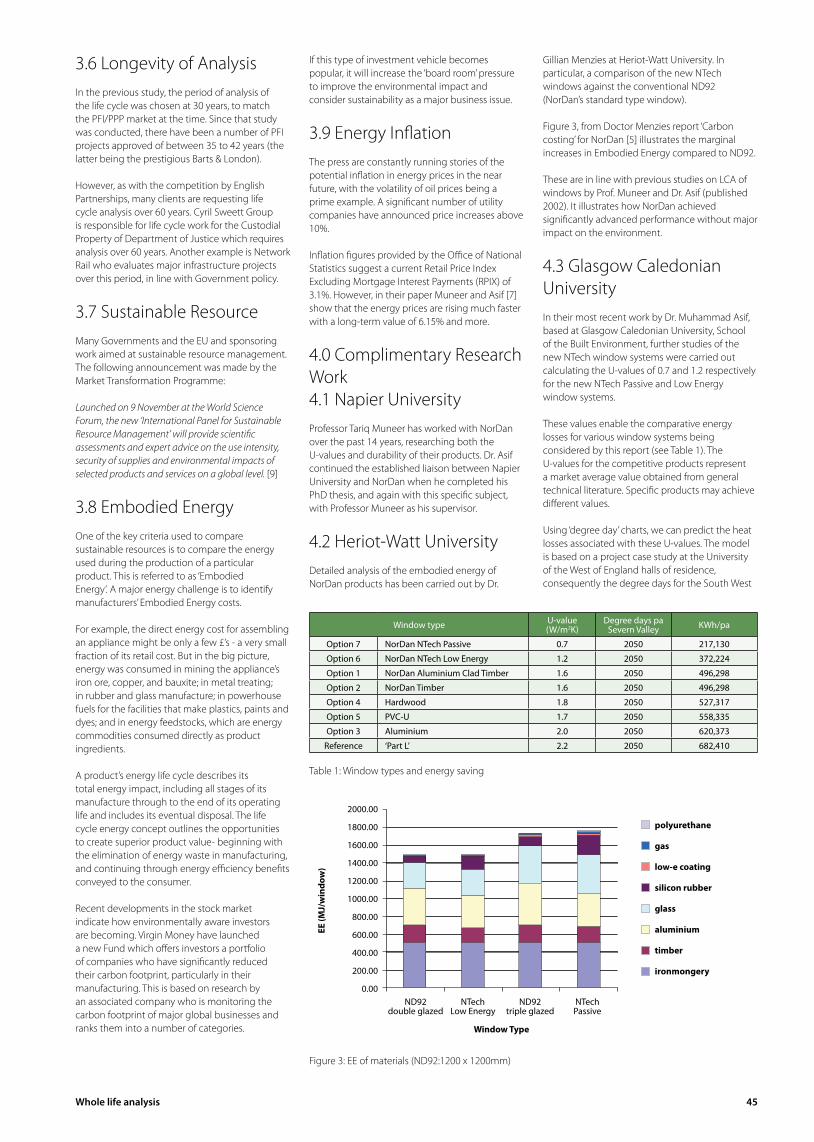
Whole life analysis 45
3.6 Longevity of AnalysisIn the previous study, the period of analysis of the life cycle was chosen at 30 years, to match the PFI/PPP market at the time. Since that study was conducted, there have been a number of PFI projects approved of between 35 to 42 years (the latter being the prestigious Barts & London).
However, as with the competition by English Partnerships, many clients are requesting life cycle analysis over 60 years. Cyril Sweett Group is responsible for life cycle work for the Custodial Property of Department of Justice which requires analysis over 60 years. Another example is Network Rail who evaluates major infrastructure projects over this period, in line with Government policy.
3.7 Sustainable ResourceMany Governments and the EU and sponsoring work aimed at sustainable resource management. The following announcement was made by the Market Transformation Programme:
Launched on 9 November at the World Science Forum, the new ‘International Panel for Sustainable Resource Management’ will provide scientific assessments and expert advice on the use intensity, security of supplies and environmental impacts of selected products and services on a global level. [9]
3.8 Embodied EnergyOne of the key criteria used to compare sustainable resources is to compare the energy used during the production of a particular product. This is referred to as ‘Embodied Energy’. A major energy challenge is to identify manufacturers’ Embodied Energy costs.
For example, the direct energy cost for assembling an appliance might be only a few £’s - a very small fraction of its retail cost. But in the big picture, energy was consumed in mining the appliance’s iron ore, copper, and bauxite; in metal treating; in rubber and glass manufacture; in powerhouse fuels for the facilities that make plastics, paints and dyes; and in energy feedstocks, which are energy commodities consumed directly as product ingredients.
A product’s energy life cycle describes its total energy impact, including all stages of its manufacture through to the end of its operating life and includes its eventual disposal. The life cycle energy concept outlines the opportunities to create superior product value- beginning with the elimination of energy waste in manufacturing, and continuing through energy efficiency benefits conveyed to the consumer.
Recent developments in the stock market indicate how environmentally aware investors are becoming. Virgin Money have launched a new Fund which offers investors a portfolio of companies who have significantly reduced their carbon footprint, particularly in their manufacturing. This is based on research by an associated company who is monitoring the carbon footprint of major global businesses and ranks them into a number of categories.
If this type of investment vehicle becomes popular, it will increase the ‘board room’ pressure to improve the environmental impact and consider sustainability as a major business issue.
3.9 Energy InflationThe press are constantly running stories of the potential inflation in energy prices in the near future, with the volatility of oil prices being a prime example. A significant number of utility companies have announced price increases above 10%.
Inflation figures provided by the Office of National Statistics suggest a current Retail Price Index Excluding Mortgage Interest Payments (RPIX) of 3.1%. However, in their paper Muneer and Asif [7] show that the energy prices are rising much faster with a long-term value of 6.15% and more.
4.0 Complimentary Research Work4.1 Napier UniversityProfessor Tariq Muneer has worked with NorDan over the past 14 years, researching both the U-values and durability of their products. Dr. Asif continued the established liaison between Napier University and NorDan when he completed his PhD thesis, and again with this specific subject, with Professor Muneer as his supervisor.
4.2 Heriot-Watt UniversityDetailed analysis of the embodied energy of NorDan products has been carried out by Dr.
Gillian Menzies at Heriot-Watt University. In particular, a comparison of the new NTech windows against the conventional ND92 (NorDan’s standard type window). Figure 3, from Doctor Menzies report ‘Carbon costing’ for NorDan [5] illustrates the marginal increases in Embodied Energy compared to ND92.
These are in line with previous studies on LCA of windows by Prof. Muneer and Dr. Asif (published 2002). It illustrates how NorDan achieved significantly advanced performance without major impact on the environment.
4.3 Glasgow Caledonian UniversityIn their most recent work by Dr. Muhammad Asif, based at Glasgow Caledonian University, School of the Built Environment, further studies of the new NTech window systems were carried out calculating the U-values of 0.7 and 1.2 respectively for the new NTech Passive and Low Energy window systems.
These values enable the comparative energy losses for various window systems being considered by this report (see Table 1). The U-values for the competitive products represent a market average value obtained from general technical literature. Specific products may achieve different values.
Using ‘degree day’ charts, we can predict the heat losses associated with these U-values. The model is based on a project case study at the University of the West of England halls of residence, consequently the degree days for the South West
Window type U-value(W/m2K)
Degree days paSevern Valley KWh/pa
Option 7 NorDan NTech Passive 0.7 2050 217,130
Option 6 NorDan NTech Low Energy 1.2 2050 372,224
Option 1 NorDan Aluminium Clad Timber 1.6 2050 496,298
Option 2 NorDan Timber 1.6 2050 496,298
Option 4 Hardwood 1.8 2050 527,317
Option 5 PVC-U 1.7 2050 558,335
Option 3 Aluminium 2.0 2050 620,373
Reference ‘Part L’ 2.2 2050 682,410
Table 1: Window types and energy saving
Figure 3: EE of materials (ND92:1200 x 1200mm)
0.00
200.00
400.00
600.00
800.00
1000.00
1200.00
1400.00
1600.00
1800.00
2000.00
EE (M
J/w
indo
w)
polyurethane
gas
low-e coating
silicon rubber
glass
aluminium
timber
ironmongery
ND92doubleglazed
NTECHlow
energy
NTECHPassive
ND92triple
glazed
EE (M
J/w
indo
w)
ND92double glazed
NTechLow Energy
ND92triple glazed
NTechPassive
Window Type
polyurethane
gas
low-e coating
silicon rubber
glass
aluminium
timber
ironmongery
2000.00
1800.00
1600.00
1400.00
1200.00
1000.00
800.00
600.00
400.00
200.00
0.00
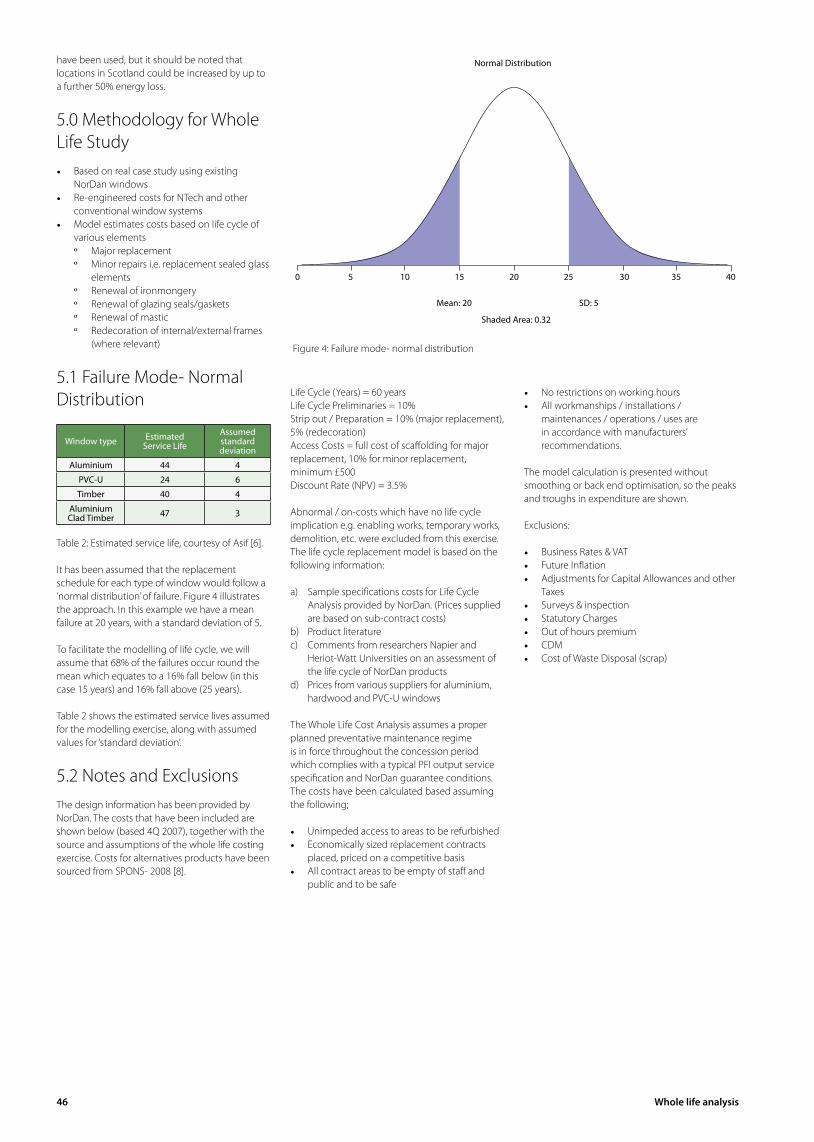
46 Whole life analysis
have been used, but it should be noted that locations in Scotland could be increased by up to a further 50% energy loss.
5.0 Methodology for Whole Life Study
Based on real case study using existing •NorDan windowsRe-engineered costs for NTech and other •conventional window systemsModel estimates costs based on life cycle of •various elements
Major replacementºMinor repairs i.e. replacement sealed glass ºelementsRenewal of ironmongeryºRenewal of glazing seals/gasketsºRenewal of masticºRedecoration of internal/external frames º(where relevant)
5.1 Failure Mode- Normal Distribution
Window type Estimated Service Life
Assumed standard deviation
Aluminium 44 4
PVC-U 24 6
Timber 40 4
Aluminium Clad Timber 47 3
Table 2: Estimated service life, courtesy of Asif [6].
It has been assumed that the replacement schedule for each type of window would follow a ‘normal distribution’ of failure. Figure 4 illustrates the approach. In this example we have a mean failure at 20 years, with a standard deviation of 5.
To facilitate the modelling of life cycle, we will assume that 68% of the failures occur round the mean which equates to a 16% fall below (in this case 15 years) and 16% fall above (25 years).
Table 2 shows the estimated service lives assumed for the modelling exercise, along with assumed values for ‘standard deviation’.
5.2 Notes and ExclusionsThe design information has been provided by NorDan. The costs that have been included are shown below (based 4Q 2007), together with the source and assumptions of the whole life costing exercise. Costs for alternatives products have been sourced from SPONS- 2008 [8].
Life Cycle (Years) = 60 years Life Cycle Preliminaries = 10%Strip out / Preparation = 10% (major replacement), 5% (redecoration)Access Costs = full cost of scaffolding for major replacement, 10% for minor replacement, minimum £500 Discount Rate (NPV) = 3.5% Abnormal / on-costs which have no life cycle implication e.g. enabling works, temporary works, demolition, etc. were excluded from this exercise. The life cycle replacement model is based on the following information:
a) Sample specifications costs for Life Cycle Analysis provided by NorDan. (Prices supplied are based on sub-contract costs)
b) Product literaturec) Comments from researchers Napier and
Heriot-Watt Universities on an assessment of the life cycle of NorDan products
d) Prices from various suppliers for aluminium, hardwood and PVC-U windows
The Whole Life Cost Analysis assumes a proper planned preventative maintenance regime is in force throughout the concession period which complies with a typical PFI output service specification and NorDan guarantee conditions. The costs have been calculated based assuming the following;
Unimpeded access to areas to be refurbished•Economically sized replacement contracts •placed, priced on a competitive basisAll contract areas to be empty of staff and •public and to be safe
No restrictions on working hours•All workmanships / installations / •maintenances / operations / uses are in accordance with manufacturers’ recommendations.
The model calculation is presented without smoothing or back end optimisation, so the peaks and troughs in expenditure are shown.
Exclusions:
Business Rates & VAT•Future Inflation•Adjustments for Capital Allowances and other •TaxesSurveys & inspection•Statutory Charges•Out of hours premium•CDM•Cost of Waste Disposal (scrap)•
Normal Distribution
Mean: 20 Sd: 5Shaded Area: 0.32
Figure 4: Failure mode- normal distribution
Normal Distribution
Mean: 20 SD: 5
Shaded Area: 0.32
0 5 10 15 20 25 30 35 40
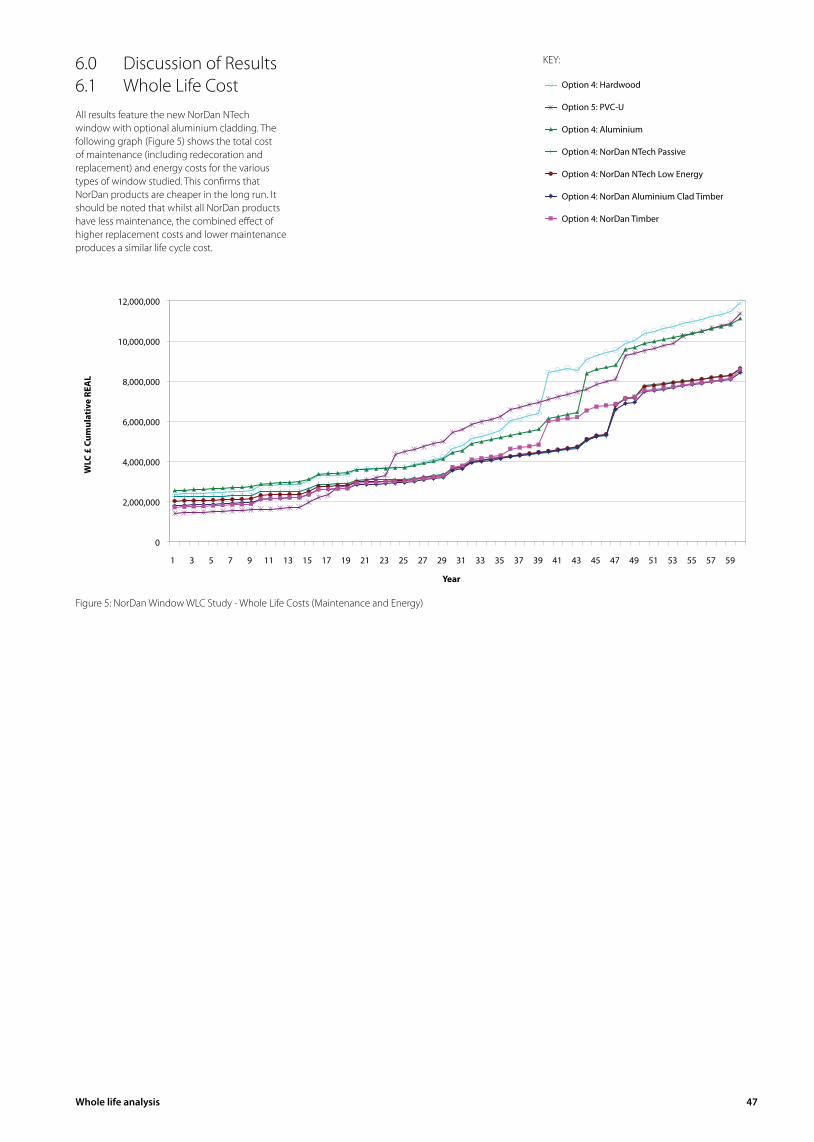
Whole life analysis 47
6.0 Discussion of Results6.1 Whole Life CostAll results feature the new NorDan NTech window with optional aluminium cladding. The following graph (Figure 5) shows the total cost of maintenance (including redecoration and replacement) and energy costs for the various types of window studied. This confirms that NorDan products are cheaper in the long run. It should be noted that whilst all NorDan products have less maintenance, the combined effect of higher replacement costs and lower maintenance produces a similar life cycle cost.
0
2,000,000
4,000,000
6,000,000
8,000,000
10,000,000
12,000,000
1 3 5 7 9 11 13 15 17 19 21 23 25 27 29 31 33 35 37 39 41 43 45 47 49 51 53 55 57 59
Year
WLC
£ C
umul
ativ
e R
EAL
KEY:
Option 4: Hardwood
Option 5: PVC-U
Option 3: Aluminum
Option 7: NorDan NTECH Passive
Option 6: NorDan NTECH Low Energy
Option 1: NorDan Aluminum Clad Timber
Option 2: NorDan Timber
Figure 5: NorDan Window WLC Study - Whole Life Costs (Maintenance and Energy)
WLC
£ C
umul
ativ
e RE
AL
Option 4: Hardwood
Option 5: PVC-U
Option 4: Aluminium
Option 4: NorDan NTech Passive
Option 4: NorDan NTech Low Energy
Option 4: NorDan Aluminium Clad Timber
Option 4: NorDan Timber
1 3 5 7 9 11 13 15 17 19 21 23 25 27 29 31 33 35 37 39 41 43 45 47 49 51 53 55 57 59
Year
12,000,000
10,000,000
8,000,000
6,000,000
4,000,000
2,000,000
0
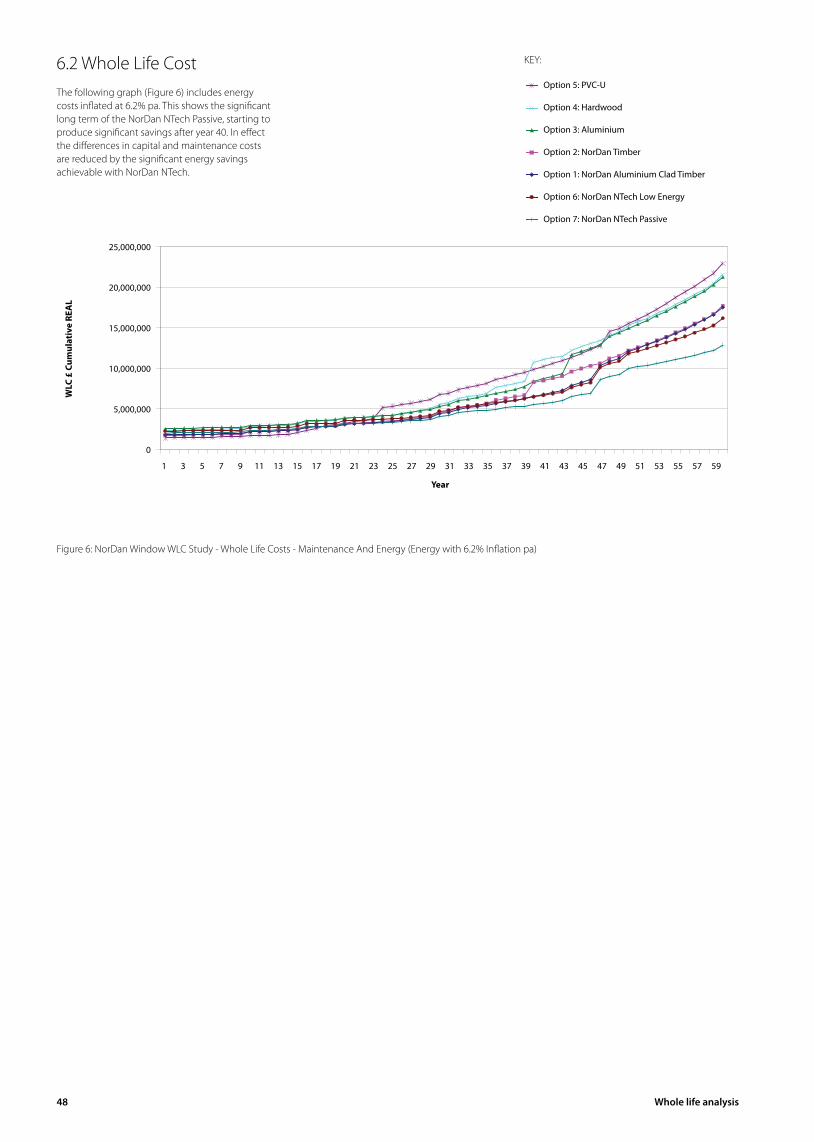
48 Whole life analysis
6.2 Whole Life CostThe following graph (Figure 6) includes energy costs inflated at 6.2% pa. This shows the significant long term of the NorDan NTech Passive, starting to produce significant savings after year 40. In effect the differences in capital and maintenance costs are reduced by the significant energy savings achievable with NorDan NTech.
0
5,000,000
10,000,000
15,000,000
20,000,000
25,000,000
1 3 5 7 9 11 13 15 17 19 21 23 25 27 29 31 33 35 37 39 41 43 45 47 49 51 53 55 57 59
Year
WLC
£ C
umul
ativ
e R
EAL
KEY:
Option 1: NorDan Aluminum Clad Timber
Option 7: NorDan NTECH Passive
Option 4: Hardwood
Option 5: PVC-U
Option 3: Aluminum
Option 6: NorDan NTECH Low Energy
Option 2: NorDan Timber
Figure 6: NorDan Window WLC Study - Whole Life Costs - Maintenance And Energy (Energy with 6.2% Inflation pa)
WLC
£ C
umul
ativ
e RE
AL
1 3 5 7 9 11 13 15 17 19 21 23 25 27 29 31 33 35 37 39 41 43 45 47 49 51 53 55 57 59
Year
Option 5: PVC-U
Option 4: Hardwood
Option 3: Aluminium
Option 2: NorDan Timber
Option 1: NorDan Aluminium Clad Timber
Option 6: NorDan NTech Low Energy
Option 7: NorDan NTech Passive
25,000,000
20,000,000
15,000,000
10,000,000
5,000,000
0
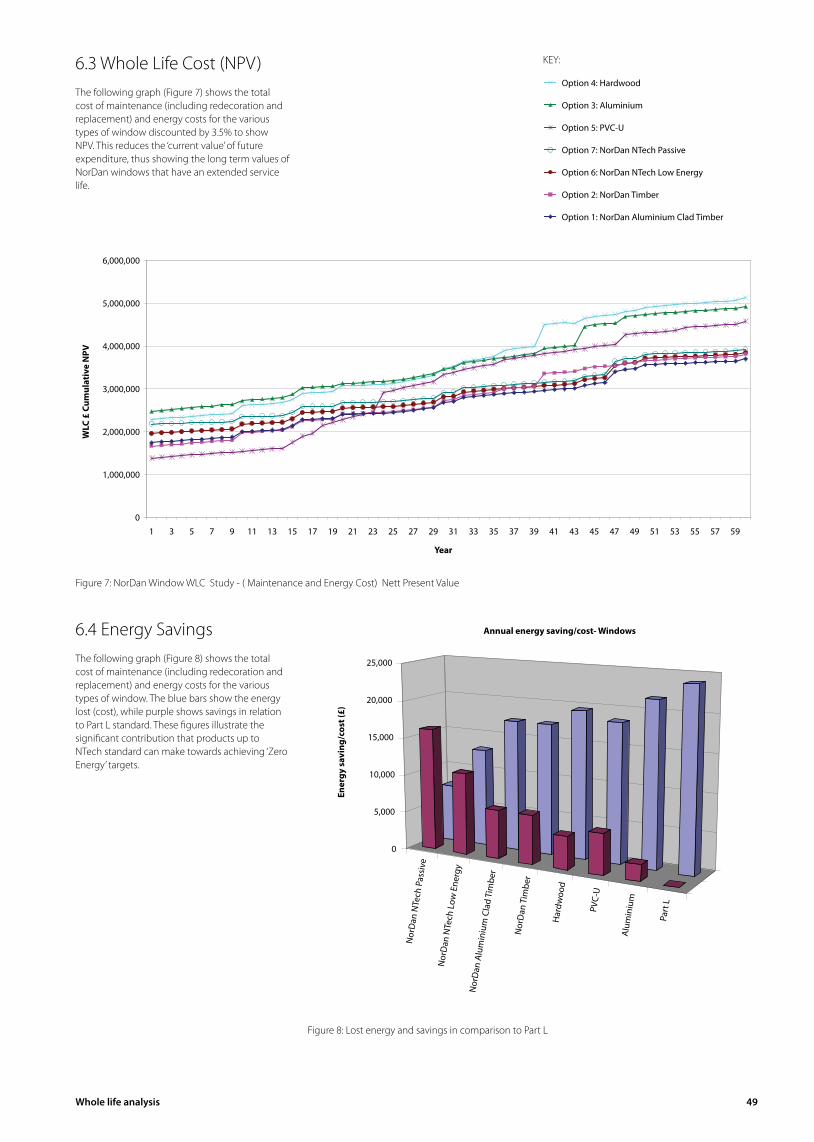
Whole life analysis 49
6.3 Whole Life Cost (NPV)The following graph (Figure 7) shows the total cost of maintenance (including redecoration and replacement) and energy costs for the various types of window discounted by 3.5% to show NPV. This reduces the ‘current value’ of future expenditure, thus showing the long term values of NorDan windows that have an extended service life.
0
1,000,000
2,000,000
3,000,000
4,000,000
5,000,000
6,000,000
1 3 5 7 9 11 13 15 17 19 21 23 25 27 29 31 33 35 37 39 41 43 45 47 49 51 53 55 57 59
Year
WLC
£ C
umul
ativ
e N
PV
6.4 Energy SavingsThe following graph (Figure 8) shows the total cost of maintenance (including redecoration and replacement) and energy costs for the various types of window. The blue bars show the energy lost (cost), while purple shows savings in relation to Part L standard. These figures illustrate the significant contribution that products up to NTech standard can make towards achieving ‘Zero Energy’ targets.
KEY:
Option 1: NorDan Aluminum Clad Timber
Option 7: NorDan NTECH Passive
Option 5: PVC-U
Option 3: Aluminum
Option 6: NorDan NTECH Low Energy
Option 2: NorDan Timber
Option 4: Hardwood
Figure 7: NorDan Window WLC Study - ( Maintenance and Energy Cost) Nett Present Value
NorDan
- NTE
CH Pas
sive
NorDan
- NTE
CH Low E
nergy
NorDan
- Alu-
Clad Ti
mber
NorDan
- Tim
ber
Hardwoo
dPVC-U
Alumini
um
Part L
0
5,000
10,000
15,000
20,000
25,000
Ener
gy S
avin
g/C
ost (
£)
Type of Window
Annual Energy Saving/Cost- Windows
Saving vs Part L
Annual Energy Cost
Figure 8: Lost energy and savings in comparison to Part L
1 3 5 7 9 11 13 15 17 19 21 23 25 27 29 31 33 35 37 39 41 43 45 47 49 51 53 55 57 59
Year
WLC
£ C
umul
ativ
e N
PVOption 4: Hardwood
Option 3: Aluminium
Option 5: PVC-U
Option 7: NorDan NTech Passive
Option 6: NorDan NTech Low Energy
Option 2: NorDan Timber
Option 1: NorDan Aluminium Clad Timber
Ener
gy s
avin
g/co
st (£
)
Annual energy saving/cost- Windows
25,000
20,000
15,000
10,000
5,000
0
Nor
Dan
NTe
ch P
assi
ve
Nor
Dan
NTe
ch L
ow E
nerg
y
Nor
Dan
Alu
min
ium
Cla
d Ti
mbe
r
Nor
Dan
Tim
ber
Har
dwoo
d
PVC-
U
Alum
iniu
m
Part
L
6,000,000
5,000,000
4,000,000
3,000,000
2,000,000
1,000,000
0
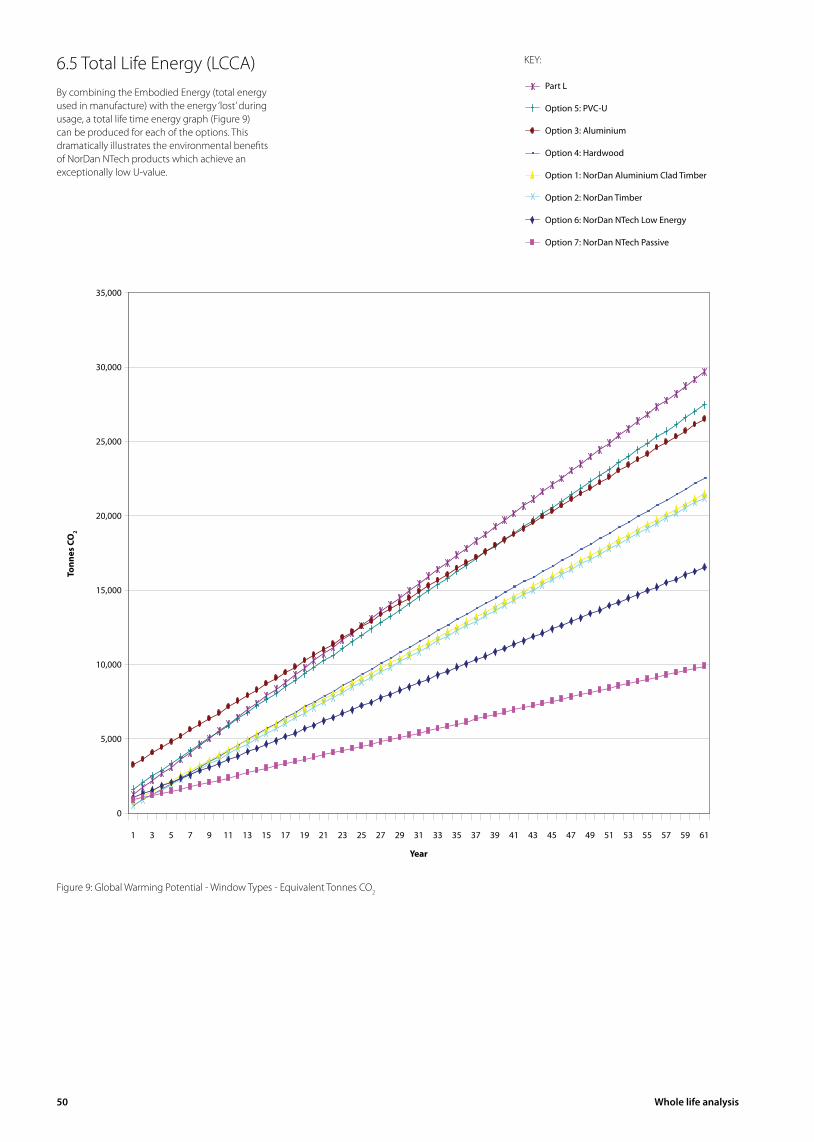
50 Whole life analysis
6.5 Total Life Energy (LCCA)By combining the Embodied Energy (total energy used in manufacture) with the energy ‘lost’ during usage, a total life time energy graph (Figure 9)can be produced for each of the options. This dramatically illustrates the environmental benefits of NorDan NTech products which achieve an exceptionally low U-value.
0
5,000
10,000
15,000
20,000
25,000
30,000
35,000
1 3 5 7 9 11 13 15 17 19 21 23 25 27 29 31 33 35 37 39 41 43 45 47 49 51 53 55 57 59 61
Years
Tonn
es C
O2
KEY:
Part L
Option 5: PVC-U
Option 3: Aluminum
Option 4: Hardwood
Option 1: NorDan Aluminum Clad Timber
Option 2: NorDan Timber
Option 6: NorDan NTECH Low Energy
Option 7: NorDan NTECH Passive
Figure 9: Global Warming Potential - Window Types - Equivalent Tonnes CO2
Tonn
es C
O2
1 3 5 7 9 11 13 15 17 19 21 23 25 27 29 31 33 35 37 39 41 43 45 47 49 51 53 55 57 59 61
Year
Part L
Option 5: PVC-U
Option 3: Aluminium
Option 4: Hardwood
Option 1: NorDan Aluminium Clad Timber
Option 2: NorDan Timber
Option 6: NorDan NTech Low Energy
Option 7: NorDan NTech Passive
35,000
30,000
25,000
20,000
15,000
10,000
5,000
0
Whole life analysis 51
7.0 ConclusionsNorDan NTech aluminium clad windows show significant savings in both maintenance and energy losses over it’s life, in real cost terms.
The substantial reductions in energy losses •add to this figure. If energy inflation of 6.2% per annum is taken into account, these differences become substantial, far outweighing any differential in capital costs. The benefits of the NTech Passive become more apparent after year 40 when the greater capital cost is paid back.The research at Heriot-Watt University has •confirmed that wooden frames windows achieve the lowest ‘embedded’ energy figures. When added to the energy losses during the lifetime, the NorDan NTech Passive saves 66% of the CO2 emissions compared to Part L windows.There is only a small increase in embodied •energy for NTech windows but there are significant energy and CO2 savings from these type of windows, showing the lowest CO2 footprint. The NTech Passive windows save 20,000 tonnes of CO2 over it’s entire life (cradle to grave) when compared with windows that meet Part L (at time of publishing).Whereas aluminium windows have the •highest embodied energy figure, they gain from energy savings over and above Part L but it takes some 29 years before the overall CO2 ‘footprint’ of these windows is less than Part L (at time of publishing).
8.0 References1. Eco-towns Prospectus. CLG, Jul. 2007; and
TCPA and D. Lock: Eco-towns: Scoping Report. Helping to Deliver a Step Change in the Quality and Availability of Homes for the People of England. TCPA, Jul. 2007.
2. Best Practice in Urban Extensions and New Settlements: Report on Emerging Good Practice. TCPA, 2007
3. Eco-towns and the Next 60 years of Planning – Rob Shaw, Town & Country Planning Tomorrow series paper 9, September 2007, tcpa.
4. DCLG Web-site: Planning, building and the environment
5. Academic Analysis of LC for NorDan: Jan 08 – Dr. Gillian Menzies
6. Window LCA, Dr. M. Asif, 20027. Foreword to Academic Brochure, Prof. T.
Muneer, Dr. M.Asif.8. SPONS – Architect’s and Builders Price Book –
Davis Langdon - 20089. http://www.sustainabilityinstitute.net/index.
php?option=com_content&task=view&id=159&Itemid=26, last accessed May 2008.
9.0 Contact DetailsPoh TanCyril Sweett Group plc60 Gray’s Inn RoadLondon WC1X 8AQMobile: 07879 810 425Office: 0207 061 [email protected]
Ian C Miller Cyril Sweett Group plc60 Gray’s Inn RoadLondon WC1X 8AQMobile: 07796 446 394Office: 0207 061 [email protected]
Appendix A: Case Study Case Study Details: University of West England, Bristol – Halls of Residence
6,304 m2 of NorDan, aluminium clad windows
conclusion 53
This publication illustrates how NorDan’s joint ventures with academia have enabled them to look ahead to the future of the industry,
whilst keeping in front of regulation changes and market trends. Over the last 10 years research findings have assisted NorDan, not only to investigate environmental impacts and efficiencies of it’s main factories, but also to address social and domestic demands for enhanced safety, security, advanced acoustics, and further enhancements towards higher energy saving. Despite these increasing demands for improvement, NorDan’s products have continued to remain competitive.
In the late 20th Century, international warnings regarding global warming became a major concern. Mankind urgently needs to redress previous environmental damage and work together towards a sustainable future. This is why NorDan has looked at its manufacturing businesses, utilising the most authoritative academic research in order to assess the environmental effect of production by measuring Embedded Energy (EE), and producing a Life Cycle Assessment (LCA). The research has proved invaluable and has opened a challenging new era for NorDan, who has since moved on to LCCA, LCCCA and Whole Life cycle Costing, all as featured
in this publication. It has become apparent that NorDan still appear to be the only window and door manufacturer to have completed such in-depth research. Without similar manufacturers adhering to the same principles, it raises difficulties for consumers to compare products on a like-for-like basis.
The purpose of this publication has been, in part, to introduce NorDan’s new NTech product range that has resulted directly from the research detailed in this publication. NorDan’s dedication to manufacturing only durable, high-performance products is as strong now as it was 50 years ago, when NorDan changed their production lines to manufacture only high performance products.
The NTech Passive window provides an astonishingly low whole window U-value of 0.7 W/m2K; specifically designed to answer a Government-led initiative and simultaneously deal with environmental issues which require a window and door solution that provides:
lowest possible Embodied Energy (EE) •lowest possible U-values •sustainability•added value•
These are the critical key factors in considering new or replacement windows and doors. The research in this publication has analysed each aspect.
Despite LCA requiring further refinement to improve standards, NorDan’s research has concluded that, by selecting a high performance window or door to, at least, the manufacturing standard set by a timber based NTech Passive window, immediate contributions can be achieved for mankind’s and the environment’s benefit.
Whatever happens in the future, there is no reason to avoid saving maximum amounts of energy now, and in so doing, deliver positive contributions to the environment from cradle to grave. After all that is what environmental LCA, LCCA, LCCCA and WLA all aim to achieve in order to drive progress and assist in purchasing decisions that are right for the future.
Conclusion
Caption here
For further information, please contact your nearest NorDan UK office:
ABERDEENNorDan UK Ltd83-87 CausewayendAberdeenAB25 3TQ
Tel: 01224 633174 Fax: 01224 642584
GLENROTHESNorDan UK LtdUnit 12, Eastfield Business ParkNewark Road SouthGlenrothesKY7 4NS
Tel: 01592 775800Fax: 01592 775900
WISHAWNorDan UK Ltd96 Kirk RoadWishawNorth LanarkshireML2 7NS
Tel: 01698 376922 Fax: 01698 376852
GLOUCESTERNorDan UK LtdGreen Farm Business PkFalcon CloseQuedgeleyGloucesterGL2 4LY
Tel: 01452 883131 Fax: 01452 883739
IPSWICHNorDan UK LtdMaitland RoadLion Barn Business ParkNeedham MarketIpswichIP6 8NZ
Tel: 01449 722922Fax: 01449 722911
Email: [email protected]: www.nordan.co.uk