academic society “matei-teiu botez” iaşi, românia faculty...
TRANSCRIPT

Academic Society “Matei-Teiu Botez” Iaşi, România
Faculty of Civil Engineering Iaşi, România
APDP Moldova Branch
INVITATIONYou are kindly invited to participate toTHE 5TH INTERNATIONAL SYMPOSIUM
Highway and Bridge Engineering 2007
December 7, 2007, Technical University “Gh. Asachi” Iaşi, RomâniaImportant dates: - participation confirmation and abstract – October 10th, 2007
- full paper - November 15th, 2007Main topics: - Accelerated Testing Methods and Techniques in Transportation Engineering
- Structural and Geometric Design of Highways and Railways- Bridges Design- Highways and Bridges Construction Technologies- Maintenance, Rehabilitation and Reliability of Highways and Bridges- Construction, Maintenance and Rehabilitation of Airports- Static and Dynamic Analysis of Bridges- Long Term Monitoring of Pavement Performance- Management of Transportation Infrastructures- Mathematical Methods in Transportation Engineering
Web address: - http://www.ce.tuiasi.ro/english/conferences/
Symposium’s Organizers:Academic Society “Matei-Teiu Botez” Iaşi
Faculty of Civil Engineering, Structural Mechanics Department APDP Moldova Branch
Correspondence addresses: [email protected]; [email protected]
Contact persons: dr.ing. Rodian Scînteie [email protected] drd.ec. Alina Mihaela Nicuţă [email protected]
Constantin Ionescu, Nicolae Tăutu, Nicolae Ţăranu,Professor of Structural Engineering Civil Engineer Professor of Civil Engineering
President President Dean Academic Society “Matei-Teiu Botez” APDP Moldova Branch Faculty of Civil Engineering

“Highway and Bridge Engineering 2007”, International Symposium Iaşi, Romania, December 7, 2007
Analysis of the functional quality of pavements from texture
measurements
Elisabete Freitas and Paulo Pereira Department of Civil Engineering, University of Minho, Guimarães, 4800-058, Portugal,
Department of Civil Engineering, University of Minho, Guimarães, 4800-058, Portugal,
Summary
The surface texture of a pavement, including uneveness, is largely determinant of
drivers’safety and comfort. It is undoubtedly a major cause of road traffic
accidents all over the world. Statistics show that one million killed and 50 million
injured are reported every year by Competent Authorities.
The effect of traffic noise has also become a critical public issue. On the road
networking the surface characteristics of pavements also contributed to nearly 80-
90% of roadway traffic noise. Not only engines or exhaust systems generate noise.
The impact of tire-surface at speeds above 50 km/h also needs to be added to prime
offenders. Functional requirements such as roadway safety, environmental quality,
driving comfort and operating costs in the road network are assessed by indicators
whose limits are continuously adjusted. The roadway texture is again a main
intervenient.
This paper aims at describing the texture indicators that can be used for the
assessment of the texture of a pavement from a network point of view, based on
profiles acquired at high speeds, including megatexture.
First an overview of the concepts related to texture and the effects of texture,
including unevenness, on safety, driving comfort, ride quality and environmental
quality is given. Then, a case study related to a highly trafficked road in the north
of Portugal is presented. This study is the second phase of a broader study that
started with the analysis of the structural capacity of that road. In this second
phase, a high speed profilometer was used to measure the pavement profile with a
sampling rate which is considered to be adequate for the analysis of longitudinal
profile, macrotexture and unevenness. Indicators such as the mean profile depth,
the IRI and the rutting depth and the corresponding effects were addressed.
KEYWORDS: pavement; profile, texture ranges, texture spectrum, texture level,
indicator, mean profile depth, IRI.

2 E. Freitas, P. Pereira
INTRODUCTION
Road pavements have two main functions, structural and functional, the indicators
and corresponding limits of which evolve with time. Relatively to the functional
component, that evolution is a consequence of the road users’ demands. These
demands include safety and driving comfort. Moreover, environmental indicators
such as noise are also included. At present, it is estimated that there are more than
one million killed and 50 million injured annually on the road network all over the
world, [1]. In addiction, 80 to 90% of noise results from roadway traffic (according
to European Community). Among other factors, the accurate definition of the
functional indicators related to texture can help reducing these statistics.
Factors such as tyre/pavement friction, [2], noise emission caused by tyre/road
interaction, [3], driving comfort, [4], as well as rolling resistance, wear of tyres,
[5], and other operating costs are influenced, to a great extent, by pavement
irregularities and therefore by road texture and unevenness.
In order to assess, compare and improve the functional quality of roads, there has
been an effort to standardize the measurement methods of texture at high speeds
(travelling speeds), based on surface profiles. An exception is made for the case of
the microtexture due to technical issues that are expected to be shortly overcome.
Meanwhile research on predicting friction based on microtexture profiles is being
carried out at present, [6].
This study is the second phase of a broader study that aimed at assessing the
structural and the functional quality of a highly trafficked road in the north of
Portugal.
This second phase aims at presenting a full assessment of the texture of a pavement
from a network point of view by introducing indicators related to megatexture
based on profiles acquired at high speeds.
Initially an overview of the concepts related to texture and to the effects of texture
is portrayed, followed by the assessment of the functional quality of a road.
CONCEPTS RELATED TO TEXTURE
The profile of a surface may be described by two coordinates: the distance along a
certain travel direction, the amplitude which is normal to the surface plane (Figure
1) and the texture wavelength defined as the (minimum) distance between
periodically repeated parts of the curve.

“Highway and Bridge Engineering 2007”, International Symposium 3
4
3
2
1
1
Figure 1. Example of a surface profile, [7]
Due to that possibility, the profile of a surface may be described as the sum of
several sinusoids with a certain phase, wavelength or frequency and amplitude by
means of mathematical Fourier techniques and therefore by its spectrum.
A texture spectrum is obtained when a profile curve has been analyzed by either
mathematical Fourier techniques or by the corresponding filtering processes in
order to determine the amplitude of its spectral components (wavelengths or spatial
frequencies), [8].
In its turn, the pavement texture is the deviation of a pavement surface from a true
planar surface within the wavelength range of the microtexture, the macrotexture,
the megatexture and the unevenness, [8]. Although unevenness is described by the
amplitude and the wavelength, some authors do not consider it as a texture
descriptor.
According to ISO13473-1, the ranges of texture are defined as follows [8]:
▪ microtexture: the deviation of a pavement surface from a true planar surface
with the characteristic dimensions along the surface of less than 0,5 mm; peak-
to-peak amplitudes normally vary in the range of 0,001 mm to 0,5 mm;
▪ macrotexture: the deviation of a pavement surface from a true planar surface
with the characteristic dimensions along the surface of 0,5 mm to 50 mm; peak-
to-peak amplitudes may normally vary in the range of 0,l mm to 20 mm;
▪ megatexture: the deviation of a pavement surface from a true planar surface
with the characteristic dimensions along the surface of 50 mm to 500 mm; peak-
to-peak amplitudes normally vary in the range of 0,l mm to 50 mm;
▪ unevenness: the deviation of a pavement surface from a true planar surface with
the characteristic dimensions along the surface of 0,5 m to 50 m.
Legend:
1 Amplitude
2 Profile
3 Texture wavelength
4 Distance

4 E. Freitas, P. Pereira
INFLUENCE OF TEXTURE AND UNEVENNESS
The surface texture is mostly determined by the selection of the materials
(especially aggregates), the mixture design, the finishing techniques and the
behaviour of the mixture throughout time. In its turn, the surface texture determines
the functional quality of the road for what respects to safety, [1], and driving
comfort, [4], the structural quality due to dynamic loading, [9], and the
environment quality relatively to vehicle emissions, wear, [5], and noise, [3].
Figure 2 shows the influence of texture ranges on pavement surface characteristics.
Figure 2. Influence of texture ranges on pavement surface characteristics, [10]
The microtexture is usually too small to be observed by the eye. It is obtained by
the surface properties (sharpness and harshness) of the individual aggregates or
other particles of the surface which are directly in contact with the tyres and
therefore originating tyre-wearing. The microtexture provides adequate stopping on
dry surfaces at typical vehicle operational speeds and on wet (not flooded) surfaces
when vehicle speeds are inferior to 80 km.
The macrotexture is the texture which has wavelengths in the same order of size as
tyre tread elements in the tyre/road interface. The macrotexture is obtained by a
suitable proportion of the aggregate and mortar of the surface or by certain surface
finishing techniques. Surfaces are normally designed with a certain macrotexture in
order to obtain suitable water drainage in the tyre/road interface. The macrotexture
provides adequate wet-pavement friction (in conjunction with the microtexture)
and reduces splash and spray at high speeds. It greatly determines the tyre-
pavement noise. High wavelengths (> 10 mm) also determine the noise inside the
vehicles and the rolling resistance.

“Highway and Bridge Engineering 2007”, International Symposium 5
The megatexture is the texture of which wavelengths have the same order of size as
a tyre/road interface. It results from inadequate compaction of the surface and from
surface distresses such as potholes. High levels of megatexture increase the vehicle
wear, the rolling resistance and have a negative impact on ride quality.
The unevenness includes longitudinal and transverse long waves. They result from
a poor construction quality and from traffic loading. The longitudinal unevenness,
through vibrations, affects the ride comfort (Figure 3 (a)), creates dynamic loadings
and the road holding of vehicles and indirectly affects safety (Figure 3 (b)). The
transverse unevenness, for instance due to rutting, affects safety through lateral
instability and water accumulation. They also increase vehicle delay costs, fuel
consumption and maintenance costs.
Figure 3. Characterization of the road profile: (a) long waves; (b) short waves, [11]
TEXTURE AND UNEVENNESS INDICATORS
There a number of texture and unevenness indicators. Some result from direct
measurements of the surface profile by means of high speed profilometers, such as
the texture profile level and the International Roughness Index, and others are
indirect measures of the texture such as the friction coefficient or the Sand Patch
used to assess microtexture and macrotexture. Nevertheless, whenever a surface
profile is defined by its spectrum, the resulting amplitudes within a certain band
may be transformed into a unique indicator defined as texture profile level (L). The
texture profile level is a logarithmic transformation of an amplitude representation
of a profile (Equation 1), [12].
Figure 4 shows an example of the use of this indicator to define several texture
spectra for comparison purposes, which include all texture ranges. The texture
level is usually between 20 dB and 80 dB, [13].
y
(b) (a)
wavelength (λ)
phase (Xo)
theoretical profile x
ampli
tud
e (A
)

6 E. Freitas, P. Pereira
Ltx,λ or LTX,λ = 20 lg refa
aλ (1)
where:
Ltx,λ = texture profile level in one-third-octave bands (re 10-6
m, in dB);
LTX,λ = texture profile level in octave bands (re 10-6
m in dB);
aλ = root mean square value of the surface profile amplitude (in m);
aref = reference value = 10-6
m;
λ = subscript indicating a value obtained with a one-third-octave-band filter
or octave bad filter having centre wavelength λ.
Figure 4. Examples of texture spectra for 1/3 octave bands, [15]
Microtexture
Due to the fine resolution necessary to acquire a profile on the microtexture range,
no automated methods for measuring microtexture at highway speeds in situ exist.
As a consequence, measuring the pavement surface microtexture is commonly
carried out in laboratory, with laser profilers, or estimated in the field by using
friction measurements. In the field either punctual measurements are effectuated by
means of the British Pendulum, [14], or continuous measurements by means of
high speed friction testers. In this case the higher the microtexture, the higher the
friction coefficient.

“Highway and Bridge Engineering 2007”, International Symposium 7
Macrotexture
Two commonly used methods are the mean texture depth (MTD) and the mean
profile depth (MPD). The MTD is determined by using the volumetric method
(commonly referred to as the “sand patch test”, [16], whereas the MPD is
determined using laser technology at highway speeds, [8].
The first method consists of spreading sand or glass spheres in a patch. The
material is distributed with a rubber pad to form an approximately circular patch,
whose average diameter is measured. The mean texture depth is obtained by
dividing the volume of the material by the area covered.
The second method is calculated at a certain profile distance (base line) as
indicated in Figure 5 (usually 10 cm). The MTD may be estimated through a
conversion equation (presented in Figure 4). In this case the MTD is indicated as
Estimated Texture Depth (ETD).
Figure 5. Illustration of the concepts of base line and profile depth and the texture
indicators mean profile depth and estimated texture depth (in millimetres), [8]
Megatexture
Specifically for the analysis of the megatexture, which is probably the less studied
range of the texture, the International Organization for Standardization (ISO) is
preparing the ISO/CD 13473-5 “Characterization of pavement texture by use of
surface profiles – Part 5: Measurement of megatexture”, [7], where the following
texture profile level indicators (L) are proposed:

8 E. Freitas, P. Pereira
LMe - an indicator representing an overall description of defects existing in the
deviation between the pavement surface and a true planar surface, the characteristic
dimensions of which range between 50 mm and 500 mm along the surface (this
deviation corresponds to texture wavelengths analysed in one-third-octave bands,
which include centre wavelengths from 63 mm to 500 mm);
LTX63 - it represents a description of the pavement defects having the shortest
dimensions within the megatexture range (deviation between the real surface and a
true planar surface corresponding to texture wavelengths analysed in one-third-
octave bands which include centre wavelengths from 50 mm to 80 mm, being
equivalent to an octave band with a centre wavelength of 63 mm);
LTX500 - it represents a description of the pavement defects having the longest
dimensions within the megatexture range (deviation between the real surface and a
true planar surface corresponding to texture wavelengths analysed in one-third-
octave bands which include centre wavelengths from 400 mm to 630 mm, being
equivalent to an octave band with a centre wavelength of 500 mm).
The LMe is used when there is a requirement to characterise megatexture by a single
measure. The LTX63 facilitates the characterisation of defects which correspond
approximately to the length of a normal tyre/pavement contact patch and which, for
this reason, play a direct role in the generation of tyre/road noise. The LTX500
indicator enables the characterisation of defects which can lead to tyres losing
contact with the surface and therefore reduce safety (increase in stopping distances,
loss of steering control in bends) and the comfort of the driver and passengers. This
indicator is complementary to the information obtained by unevenness
measurements at short unevenness wavelengths (0, 7 m to 1,3 m). An illustration of
these indicators is presented in Figure 6.
20
30
40
50
60
315 160 80 40 20 10 5 2,5
Texture wavelength [mm]
Textu
re p
rofil
e le
vel [
dB
rel.
1 µ
m rm
s]
Fi g 4-1 i n 13473-5
630
L TX63L TX500
L Me = 44,6 dB
L TX63 = 41,5 dB
L TX500 = 41,6 dB
Figure 6. Example of one-third-octave band texture spectrum with indication of the texture
levels of the octave bands LTX500 and LTX63, [7]

“Highway and Bridge Engineering 2007”, International Symposium 9
Unevenness
The International Roughness Index is one of the most used indicators for the
assessment of the unevenness of a road.
The IRI was developed by the World Bank in the 1980s. This index is used to
assess the condition and the evolution of the longitudinal profile usually in the
wheel track. The IRI constitutes a standardized roughness measurement and
represents the average rectified slope of the profile, which is a filtered ratio of the
accumulated suspension motion of a standard vehicle, [17], divided by the distance
travelled by the vehicle during the measurement. The commonly recommended
units of the IRI are meters per kilometre (m/km) or millimetres per meter (mm/m).
Other indicators based on the response of a users’ panel have been developed, [18].
Since these indicators take into account the users’ opinion on driving comfort, they
are appropriate for defining functional maintenance strategies, [19].
CASE STUDY
Road location and geometry
The study of the texture was carried out on the EN 206 Variant, between Carreira
and Guimarães (Portugal) as shown in Figure 7.
Figure 7. General view of the EN 206 Variant
Carreira Guimarães
A7
10 E. Freitas, P. Pereira
This road is 2 km long and it is constituted by 2 lanes per direction (3,5 m each), a
3 m separation between carriageways, 2 service lanes (2,5 m each), and shoulders
(1 m each). The current cross-section has a transversal slope of 2,5 % on both
sides. The design structure of the pavement is constituted by 3 asphalt layers
(wearing course – 6 cm; binder course – 6 cm; base layer – 12 cm) and an unbound
sub base (graded aggregates – 20 cm).
Surface Condition
In a phase previous to this work that focused the structural condition of the road,
[20], [21], the assessment of the surface condition was performed through visual
inspection. The main distresses recorded were ravelling and cracking.
It was observed that, in general, the exterior lanes are more distressed than the
interior ones. A different behaviour between driving directions was registered. In
the direction from Guimarães to Carreira, the condition of the pavement is
relatively homogenous and in a better condition if compared to the other direction.
A small increase of the distress severity is recorded near the A7 roundabout,
probably due to the high tangential forces as a result of breaking.
On the Carreira–Guimarães direction, two homogenous stretches can be established
regarding distress severity. The most distressed one is comprised along the first
700 m of the analyzed length and exhibits the highest distress severity and extent,
if compared to the other stretches.
The raveling observed on the surface of the road exhibits different levels of
severity. Some possible causes for the appearance of raveling are: loss of bond
between the aggregate particles and the asphalt binder; aggregate segregation;
inadequate compaction during construction; mechanical dislodging from certain
types of traffic, such as vehicles with studded tires.
The cracking observed also exhibits different levels of severity which were
originated at the top and progressed downwards. As a consequence, low MPD and
high megatexture levels are expected.
Equipment and testing methodology
A high speed profilometer was used for data collection. It is equipped with 1
inertial motion sensor, 2 accelerometers and 5 lasers, 2 of which are prepared for
measuring the macrotexture in both wheel paths (Figure 8).

“Highway and Bridge Engineering 2007”, International Symposium 11
Figure 8. University of Minho and Coimbra High Speed Profilometer
One pass-by was done on each lane and the following data were registered:
▪ Vehicle speed;
▪ Longitudinal profile - every 10 meters;
▪ Cross Profile Rutting: full rut, left and right wheel path - every 10 meters;
▪ Geometrical Data: crossfall, grade and radius of curve - every 10 meters;
▪ Roughness (IRI): every 10 meters;
▪ Macrotexture (MPD) - every meter.
ANALYSIS OF THE RESULTS
Longitudinal profile
The longitudinal profile of a road is defined after removing the grade and very long
undulations. Figure 9 presents 12 profiles which correspond to 3 measurements per
lane.
In each direction, the profiles are similar. This is an indication of small transverse
variations along the road. On the traffic direction, the profile is variable. In this
case, the range of deviations is -20 mm to 20 mm. Higher deviations may be also
found, specifically near Carreira and at a distance of 800 m from there. For the
latter, insufficient bearing capacity is a possible cause. For the former, there exists
the possibility of settlement of the embankment that supports a bridge.

12 E. Freitas, P. Pereira
-60.00
-40.00
-20.00
0.00
20.00
40.00
60.00
1
10
1
20
1
30
1
40
1
50
1
60
1
70
1
80
1
90
1
10
01
11
01
12
01
13
01
14
01
15
01
16
01
17
01
18
01
19
01
Distance (m)
Dep
th (
mm
)
-60.00
-40.00
-20.00
0.00
20.00
40.00
60.00
1
10
1
20
1
30
1
40
1
50
1
60
1
70
1
80
1
90
1
10
01
11
01
12
01
13
01
14
01
15
01
16
01
17
01
18
01
19
01
Distance (m)
Dep
th (
mm
)
Carreira
CarreiraGuimarães
Guimarães
Figure 9. Profile depth
Unevenness
Figure 10 shows the IRI for the 12 profiles previously analyzed (3 in each lane).
Generally, the IRI is similar for the 3 profiles in each direction. In both directions,
very high values may be found (more than 3 m/km). These high values correspond
to the location of the bridge and to Carreira, as previously observed from the
longitudinal profile. If these specific points are disregarded, a single homogeneous
section can be considered in the direction from Carreira to Guimarães, while in the
opposite direction two homogeneous sections may be identified. The first one from
a distance 0 mm to 1200 m and the second one from 1200 m until the end of the
road.
In this case the IRI evolution with distance does not match with the described
surface condition. This fact may be an indication of the contribution of the
subgrade condition on the evolution of IRI throughout time. In the future, the
assessment of the surface condition and the IRI would confirm this hypothesis.
A general classification of the road unevenness is proposed by the Portuguese Road
Administration, based on the percentage of road length of which the IRI obtained
by 100 m overcomes a certain limit.
For the wearing course, the unevenness is classified with excellent if the following
limits are simultaneously respected:
bridge
bridge

“Highway and Bridge Engineering 2007”, International Symposium 13
▪ IRI < 1,5 – 50% of the road length;
▪ IRI < 2,5 – 80% of the road length;
▪ IRI < 3,0 – 100% of the road length.
As can be verified in Figure 10, there are a few IRI values superior to 3 m/km
which leads to less than 10% of the total distance out of compliance with the
recommendations. For this situation, the road is classified with good. Thus, there
are no major consequences in what respects the rolling resistance, riding quality
and safety.
0.00
1.00
2.00
3.00
4.00
5.00
6.00
10 110 210 310 410 510 610 710 810 910 1 010 1 110 1 210 1 310 1 410 1 510 1 610 1 710 1 810 1 910
Distance (m)
IRI
(m/k
m)
0.00
1.00
2.00
3.00
4.00
5.00
6.00
10 110 210 310 410 510 610 710 810 910 1 010 1 110 1 210 1 310 1 410 1 510 1 610 1 710 1 810 1 910
Distance (m)
IRI
(m/k
m)
Carreira Guimarães
Guimarães Carreira
Figure 10. IRI for the right and the left lane in both directions
Rutting
Figure 11 sows the rutting measured in the 4 lanes for the right and left wheel
paths.

14 E. Freitas, P. Pereira
0.0
1.0
2.0
3.0
4.0
5.0
6.0
7.0
1 101 201 301 401 501 601 701 801 901 1 001 1 101 1 201 1 301 1 401 1 501 1 601 1 701 1 801 1 901
Distance (m)
Ruttin
g (
mm
)
left
0.0
1.0
2.0
3.0
4.0
5.0
6.0
7.0
1 101 201 301 401 501 601 701 801 901 1 001 1 101 1 201 1 301 1 401 1 501 1 601 1 701 1 801 1 901
Distance (m)
Ruttin
g (
mm
)
0.0
1.0
2.0
3.0
4.0
5.0
6.0
7.0
1 101 201 301 401 501 601 701 801 901 1 001 1 101 1 201 1 301 1 401 1 501 1 601 1 701 1 801 1 901
Distance (m)
Ruttin
g (
mm
)
0.0
1.0
2.0
3.0
4.0
5.0
6.0
7.0
1 101 201 301 401 501 601 701 801 901 1 001 1 101 1 201 1 301 1 401 1 501 1 601 1 701 1 801 1 901
Distance (m)
Ruttin
g (
mm
)
Carreira (right lane) Guimarães
Carreira
GuimarãesCarreira (left lane)
Guimarães (right lane)
CarreiraGuimarães (left lane)
right
Figure 11. Rutting depth

“Highway and Bridge Engineering 2007”, International Symposium 15
In general the rut depth is lower than 3 mm. The right lane shows in both directions
the highest variability and the highest values, although the threshold value
considered for maintenance has never been reached. This threshold is 20 mm for
the Portuguese conditions.
The best behaviour obtained for the Guimarães-Carreira direction is probably due
to a better construction quality as supported by surface condition analysis.
For this road, safety is not compromised in what concerns water accumulation on
the wheel paths.
Macrotexture
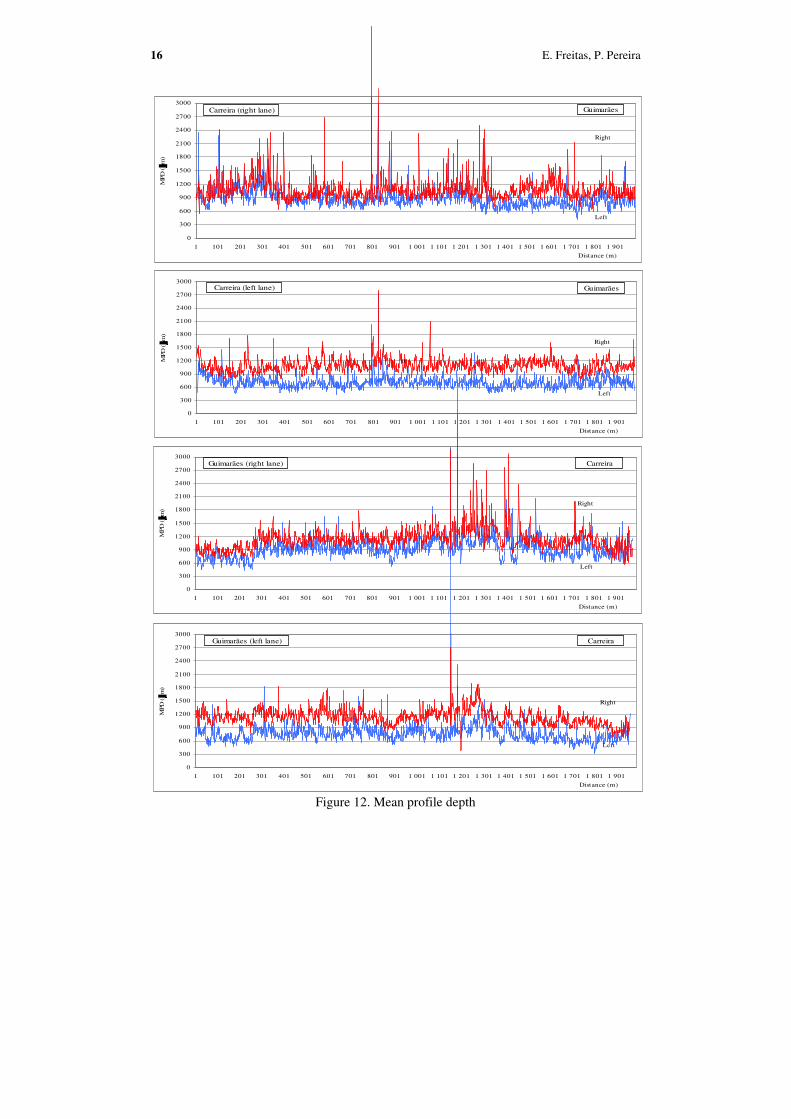
The indicator chosen for the analysis of the macrotexture was the Mean Profile
Depth. Figure 12 shows the MPD for the right and left wheels path in both
directions.
In view of the fact that about half of the design life of the pavement has passed by,
a MPD near 0,6 mm would be expected, which is the threshold limit value. For
both directions, the left lane, which is also the less trafficked, is quite
homogeneous: Nevertheless, MPD of the right wheel path reaches values over
1,2 mm, which are characteristic of porous surfaces.
The MPD in the right lane is very heterogeneous, for both directions. In this case,
the MPD is higher and may be related to the surface condition. In the direction of
Carreira to Guimarães, at a distance of 1300 m, it is possible to notice a decrease of
the MPD that corresponds to a change of the properties of the mixture that leads to
less distress and thus a smaller MPD.
Based on these facts, it seems that the safety in what respects to friction in wet
weather conditions is not affected. Nevertheless, environmental concerns must be
taken into account as far as noise and rolling resistance are concerned. An
important increase in noise levels has certainly occurred and it is predictable to
continue increasing if no maintenance works are carried out in the near future.
Megatexture
For the analysis of the megatexture based on the indicators recommended in draft
standard ISO 13473-5 a second pass-by on each lane is required. In this case the
data required is as follows:
▪ Vehicle speed;
▪ Longitudinal profile - every 2,5 centimeters;
▪ Geometrical Data: crossfall, grade and radius of curve.
16 E. Freitas, P. Pereira
0
300
600
900
1200
1500
1800
2100
2400
2700
3000
1 101 201 301 401 501 601 701 801 901 1 001 1 101 1 201 1 301 1 401 1 501 1 601 1 701 1 801 1 901
Distance (m)
MPD
(m
)
Left
Right
0
300
600
900
1200
1500
1800
2100
2400
2700
3000
1 101 201 301 401 501 601 701 801 901 1 001 1 101 1 201 1 301 1 401 1 501 1 601 1 701 1 801 1 901
Distance (m)
MPD
(m
)
0
0
300
600
900
1200
1500
1800
2100
2400
2700
3000
1 101 201 301 401 501 601 701 801 901 1 001 1 101 1 201 1 301 1 401 1 501 1 601 1 701 1 801 1 901
Distance (m)
MPD
(m
)
0
300
600
900
1200
1500
1800
2100
2400
2700
3000
1 101 201 301 401 501 601 701 801 901 1 001 1 101 1 201 1 301 1 401 1 501 1 601 1 701 1 801 1 901
Distance (m)
MPD
(m
)
Carreira (right lane) Guimarães
Carreira
Left
Right
GuimarãesCarreira (left lane)
Guimarães (right lane)
Left
Right
Left
Right
CarreiraGuimarães (left lane)
Figure 12. Mean profile depth

“Highway and Bridge Engineering 2007”, International Symposium 17
A computer software is being specifically developed for the analysis of the
megatexture. This program is based on the power spectral density (PSD) of the
measured profile. The PSD is a well-known method for the interpretation of
complex signals containing a variety of wavelengths and amplitudes. The PSD
analysis can be accomplished using the pwelch algorithm included in the Matlab®
signal processing toolbox, [22]. Then the texture level and the texture level
indicators are calculated from Equation 1.
CONCLUSIONS
Texture and unevenness highly influence safety, driving comfort and environment
quality. Dealing with texture should be an easy assignment at a network level. For
that reason, this paper dealt with both texture and unevenness. The concepts related
to these surface characteristics were extensively presented. The ordinary texture
indicators which regard microtexture, macrotexture and unevenness, such as the
friction coefficient, the mean profile depth and the IRI were addressed. Indicators
to assess megatexture at high speeds, relying on the concept of texture-profile level
that can be used at a network level, were also included. The texture profile level is
based on pavement profiles measured at high speeds. It represents a description of
defects existing in the deviation between the pavement surface and a true planar
surface within the megatexture wavelength ranges. Although it is recommended for
the assessment of megatexture, it may be used for the assessment of texture in all
ranges.
The second phase of a study regarding the condition of a roadway in Guimarães
was also presented. The first phase was addressed to its structural condition. In this
paper the aim of research was its functional condition. Important deviations of the
longitudinal profile were measured, although, as far as unevenness is concerned,
these deviations had led to a classification of good.
The macrotexture correlated well with the surface condition previously observed.
The segregation and the raveling observed contributed to the high MPD. As a
result, an increase of the noise level is expected.
Future work will include the assessment of the megatexture based on spectral
analysis of the pavement profile obtained at high speed by means of the software
under development.
References
1. Larson, R., Scofield, L., Sorenson, J, Pavement Functional Surface Characteristics, 5th
Symposium on Pavement Surface Characteristics-Roads and Airports. World Road Association,
Toronto, Canada, 2004.

18 E. Freitas, P. Pereira
2. NCHRP 291, Evaluation of Pavement Friction Characteristics, NCHRP Synthesis 291,
Transportation Research Board, Washington DC, 2000.
3. SILVIA, “Guidance Manual for the Implementation of Low-Noise Road Surfaces”, FEHRL
Report 2006/02, Forum of European National Highway Research Laboratories, Brussels, Belgium,
2006.
4. Delanne, Y., Daburon, P., Uneveness and Vibracional Comfort of light Cars, International
Symposium of the Environmental Impact of Road Unevenness, Oporto, Portugal, 1999
5. Domenichini, L., Martinelli, F., Influence of the Road Characteristics on Tyre Wear, 5th
Symposium on Pavement Surface Characteristics-Roads and Airports, World Road Association,
Toronto, Canada, 2004.
6. Do M.-T., Marsac P., Delanne Y., Prediction of Tyre/wet Road Friction from Road Surface
Microtexture and Tyre Rubber Properties, 5th Symposium on Pavement Surface Characteristics-
Roads and Airports, World Road Association, Toronto, Canada, 2004.
7. ISO/CD 13473-5, Characterization of Pavement Texture by Use of Surface Profiles – Part 5:
Measurement of megatexture, Draft standard ISO/CD 13473-5, International Organisation for
Standardisation (ISO), Geneve, Switzerland.
8. ISO 13473-1:1997, Characterization of Pavement Texture by Use of Surface Profiles – Part 1:
Determination of Mean Profile Depth, International Organisation for Standardisation (ISO), Geneve,
Switzerland.
9. Dolcemascolo, V., Jacob, B., Influence of the Road Profile on Pavement Dynamic Loading.
International Symposium of the Environmental Impact of Road Unevenness, Oporto, Portugal, 1999.
10. Snyder, M., Pavement Surface Characteristics: A Synthesis and Guide, American Concrete
Pavement Association Publication EB235P, Skokie, IL, 2007.
11. Delanne, Y., Uni des Chaussées et Confort Vibratoire des Véhicules, Laboratoire Central des
Ponts et Chaussées, Nantes, 1997.
12. ISO/CD 13473-4, Characterization of Pavement Texture by Use of Surface Profiles – Part 4:
Spectral Analysis of Surface Profiles, Draft standard ISO/CD 13473-4, International Organisation for
Standardisation (ISO), Geneve, Switzerland.
13. Sandberg, U., Ejsmont, J. Tyre / Road Noise Reference Book. Informex SE – 59040. Kisa.
Sweden (www.informex.info), 2002.
14. ASTM E303-93: Standard Test Method for Measuring Surface Frictional Properties Using the
British Pendulum Tester, Volume 04.03, Road and Paving Materials; Vehicle-Pavement Systems.
American Society for Testing and Materials, 2003.
15. Domenichini, L., Fracassa, A., La Torre, F., Loprencipe, G., Ranzo, A., Scalamandrè, A., TINO
Project: Relationship Between Road Surface Characteristics and Noise Emission, 1º International
Colloquium on Vehicle Tyre Road Interaction “The Noise Emission”, Roma, Italy, 1999.
16. ASTM E965-96, Standard Test Method for Measuring Pavement Macrotexture Depth Using a
Volumetric Technique, American Society for Testing and Materials, West Conshohocken, 2006.
17. Sayers, M., Karamihas, S., Little Book of Profiling, Basic information about measuring and
interpreting road profiles, University of Michigan, 1998.
18. Delanne, Y., Pereira, P., Advantages and Limits of Different Road Roughness Profile Signal-
Processing Procedures Applied in Europe, Transportation Research Record nº 1764, TRB,
Washington, 2001.
19. Pereira, P., Delanne, Y., Freitas, E., “Etablissement des Classes d’Uni Pour la Gestion de
l’Entretien des Routes”, International symposium on the environmental impact of road pavement
unevenness, Oporto, Portugal, 22 e 23 de March 1999.
20. Ionescu, A.G., Freitas, E.F., “Modelling an Asphalt Pavement in Portugal”,
Intersection/Intersectii, http://www.ce.tuiasi.ro/intersections, 2007.
21. Vrancianu, I.D., Freitas, E.F., “Definition of Homogenous Road Sectors According to COST
336”, Intersection/Intersectii, http://www.ce.tuiasi.ro/intersections, 2007.
22. MathWorks, Signal Processing Toolbox for Use with Matlab®, Users Guide, Version 6, 2006.