academic staff senate presentation march 17, 2014
TRANSCRIPT

Academic Staff Senate
PresentationMarch 17, 2014
Presentation Overview Purpose of this Presentation Interpreting NSSE Results NSSE Administration Selected UW-Platteville NSSE 2013 Results
Institutional Satisfaction Engagement Indicators Item Comparisons
Proposed Institutional Response Questions & Discussion

Purpose of this Presentation

Academic Staff Senate Presentation Further disseminate the results of an
institutional measure Given time, only giving ‘macro’ and select
‘drill-down’ views of the results Draw attention to NSSE results across the
institution Promote the Improvement of Learning’s
endorsed Institutional Response

Interpreting NSSE Results
Interpreting NSSE Results These are students’ self-report of their
perceptions, experiences and plans.
Interpreting NSSE Results These are students’ self-report of their
perceptions, experiences and plans. This is designed to be a measure of the
INSTITUTION.

Interpreting NSSE Results These are students’ self-report of their
perceptions, experiences and plans. This is designed to be a measure of the
INSTITUTION. In comparing, outliers cancel each other out.
How do we choose our targets?
How do we choose our targets?
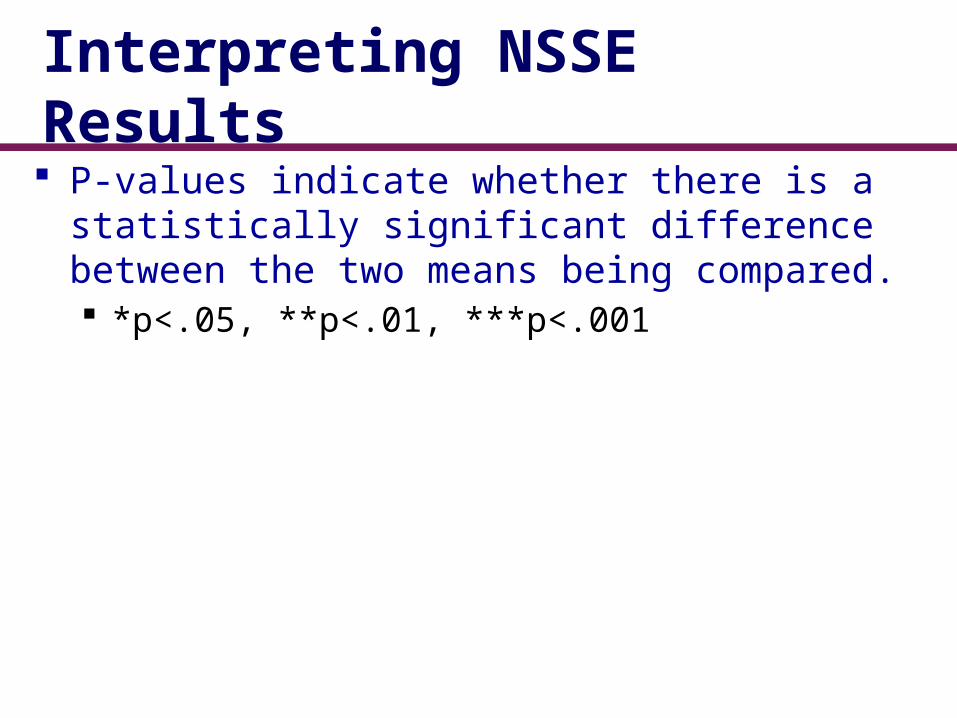
Interpreting NSSE Results P-values indicate whether there is a
statistically significant difference between the two means being compared. *p<.05, **p<.01, ***p<.001

Interpreting NSSE Results P-values indicate whether there is a
statistically significant difference between the two means being compared. *p<.05, **p<.01, ***p<.001
Effect sizes indicate how meaningful that difference is in standard deviations. (Cohen’s d) Small = .10 Medium = .30 Large = .50

NSSE Administration

Survey Administration Census-administered
first-year & senior students
Spring administration Multiple follow-ups to
increase response rates Additional Modules provide option to delve deeper into the student experience Experiences with Diverse Perspectives Experiences with Writing

A Commitment to Data Quality
NSSE’s Psychometric Portfolio presents evidence of validity, reliability, and other indicators of data quality. It serves higher education leaders, researchers, and professionals who use NSSE.See the Psychometric Portfolio nsse.iub.edu/links/psychometric_portfolio
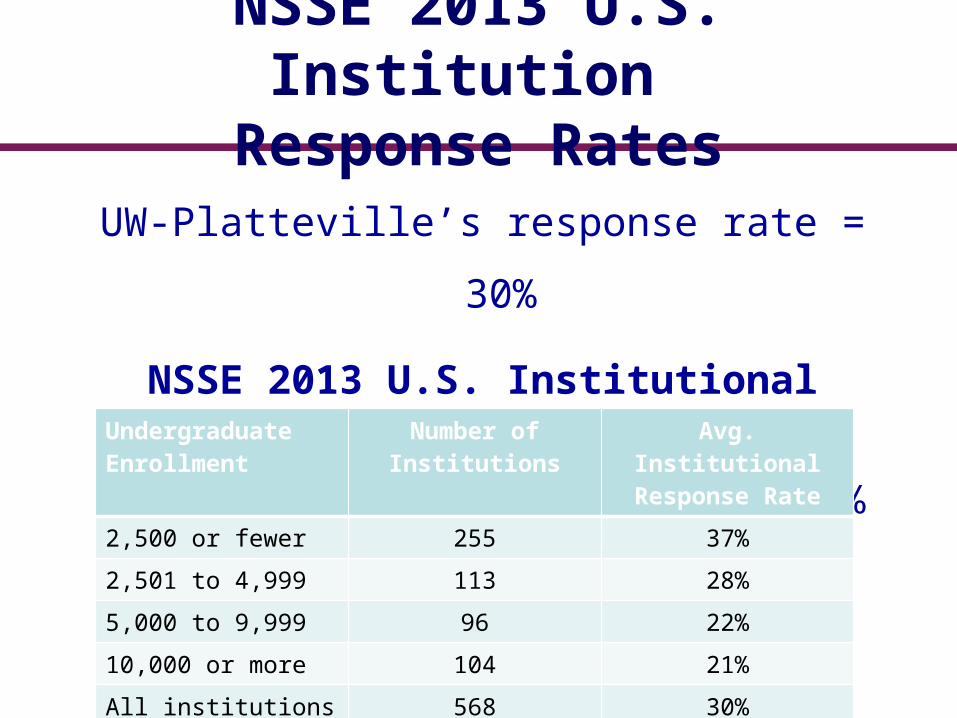
NSSE 2013 U.S. Institution
Response RatesUW-Platteville’s response rate = 30%
NSSE 2013 U.S. Institutional
Response RatesAll NSSE 2013 institutions = 30%Undergraduate
EnrollmentNumber of Institutions
Avg. Institutional
Response Rate
2,500 or fewer 255 37%
2,501 to 4,999 113 28%
5,000 to 9,999 96 22%
10,000 or more 104 21%
All institutions 568 30%
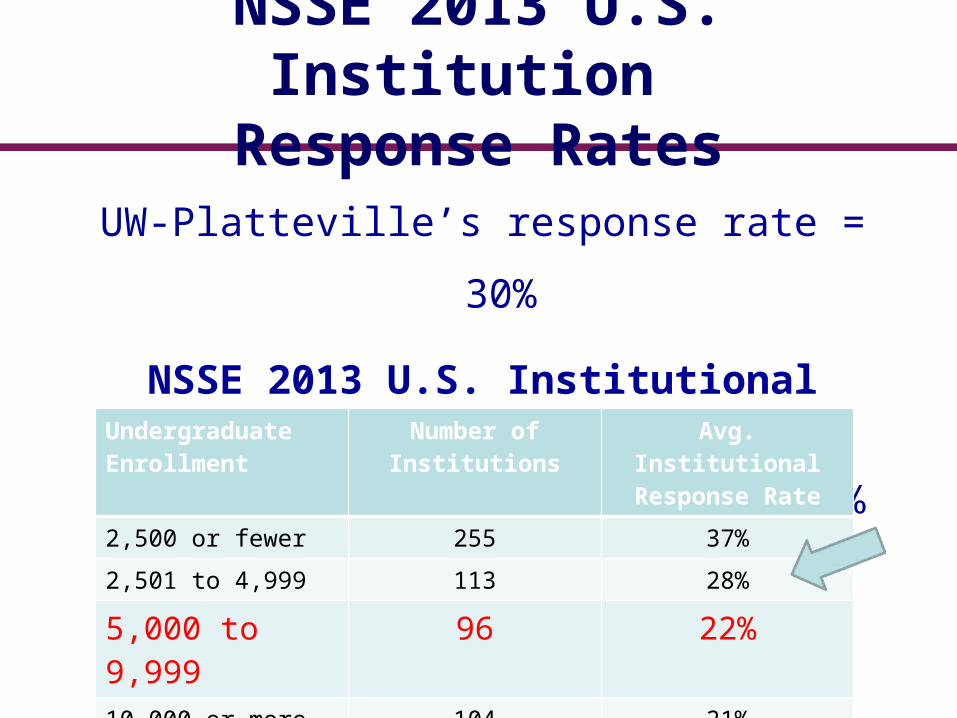
NSSE 2013 U.S. Institution
Response RatesUW-Platteville’s response rate = 30%
NSSE 2013 U.S. Institutional
Response RatesAll NSSE 2013 institutions = 30%Undergraduate
EnrollmentNumber of Institutions
Avg. Institutional
Response Rate
2,500 or fewer 255 37%
2,501 to 4,999 113 28%
5,000 to 9,999
96 22%
10,000 or more 104 21%
All institutions 568 30%
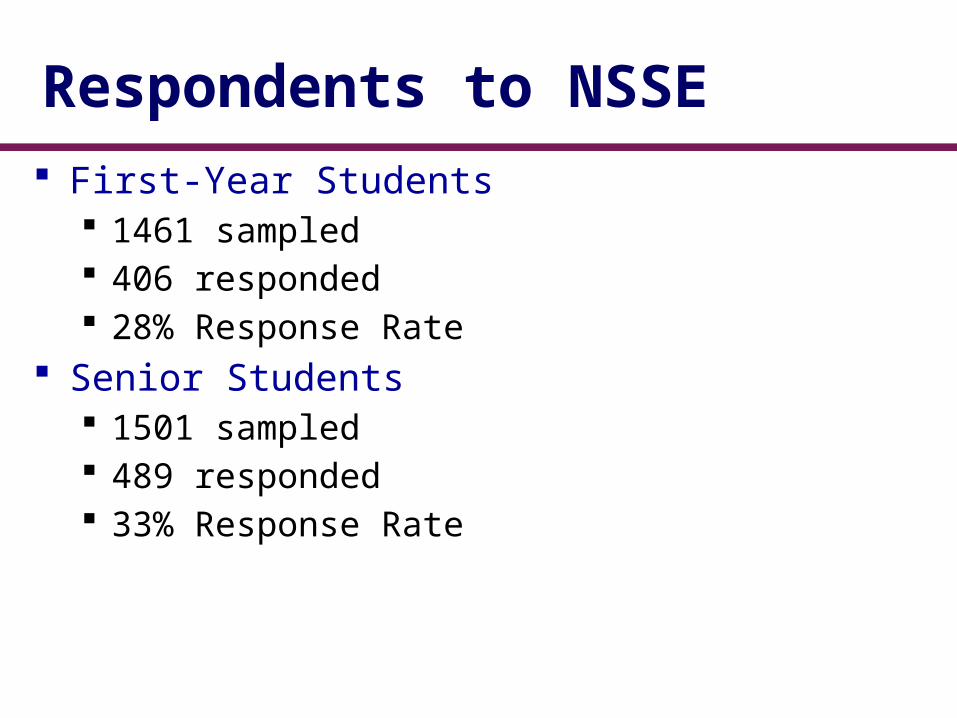
Respondents to NSSE First-Year Students
1461 sampled 406 responded 28% Response Rate
Senior Students 1501 sampled 489 responded 33% Response Rate
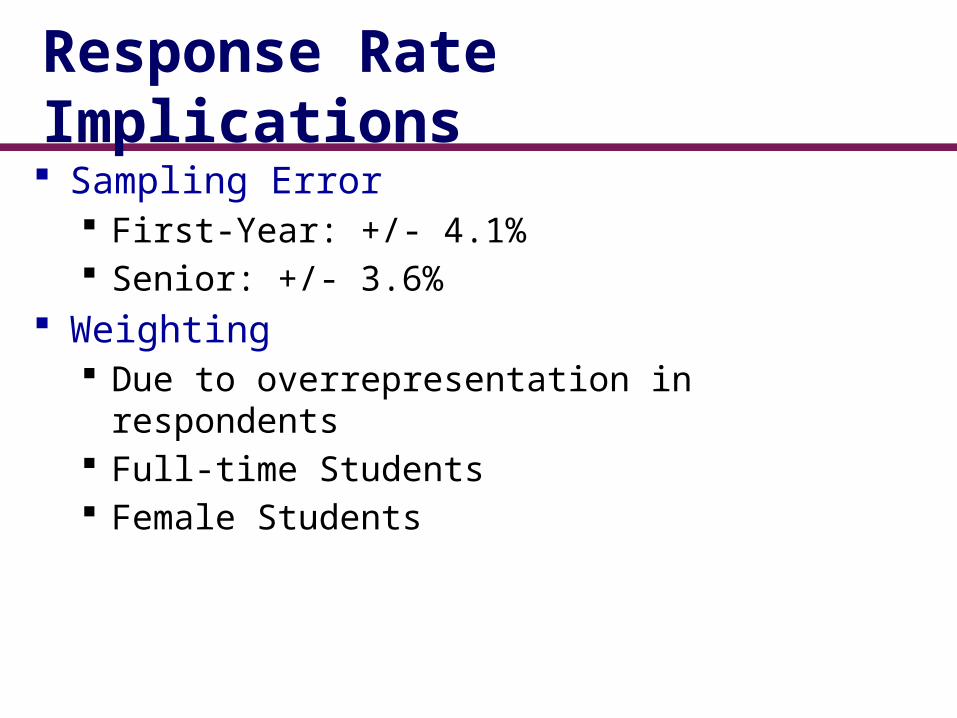
Response Rate Implications Sampling Error
First-Year: +/- 4.1% Senior: +/- 3.6%
Weighting Due to overrepresentation in respondents Full-time Students Female Students

Selected UW-Platteville NSSE 2013 Results
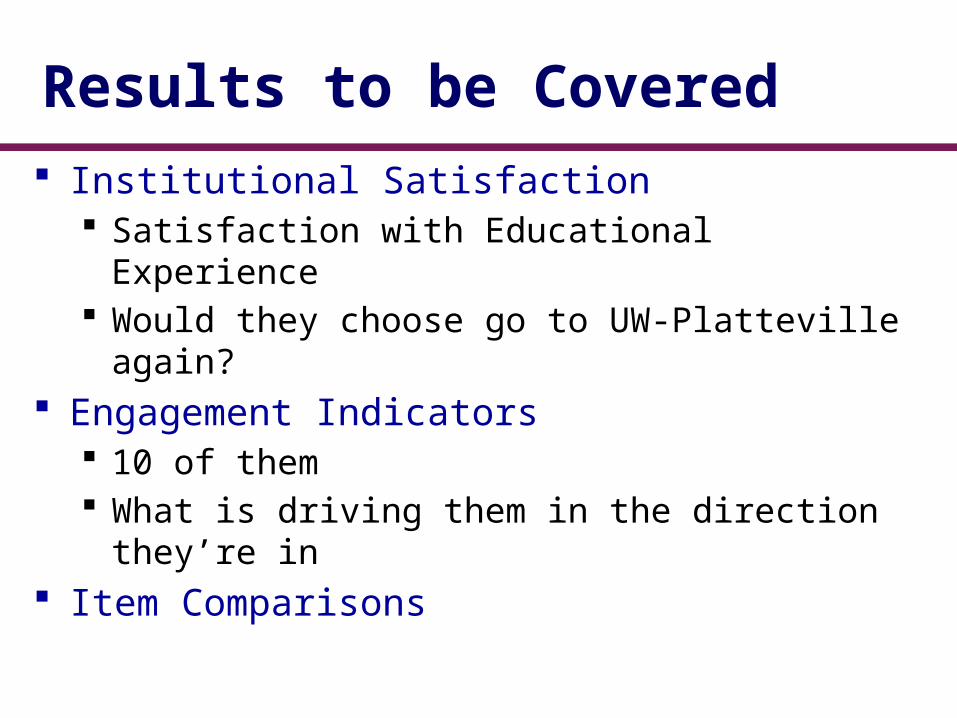
Results to be Covered Institutional Satisfaction
Satisfaction with Educational Experience Would they choose go to UW-Platteville
again? Engagement Indicators
10 of them What is driving them in the direction they’re
in Item Comparisons
National Comparison Group consists of…
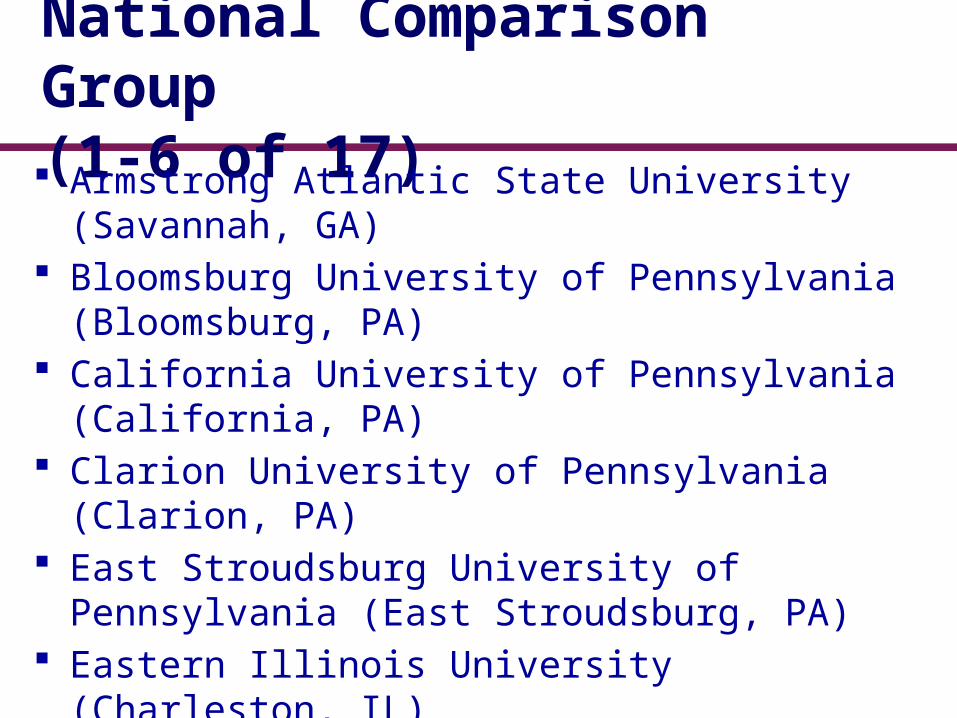
National Comparison Group (1-6 of 17) Armstrong Atlantic State University
(Savannah, GA) Bloomsburg University of Pennsylvania
(Bloomsburg, PA) California University of Pennsylvania
(California, PA) Clarion University of Pennsylvania (Clarion,
PA) East Stroudsburg University of Pennsylvania
(East Stroudsburg, PA) Eastern Illinois University (Charleston, IL)
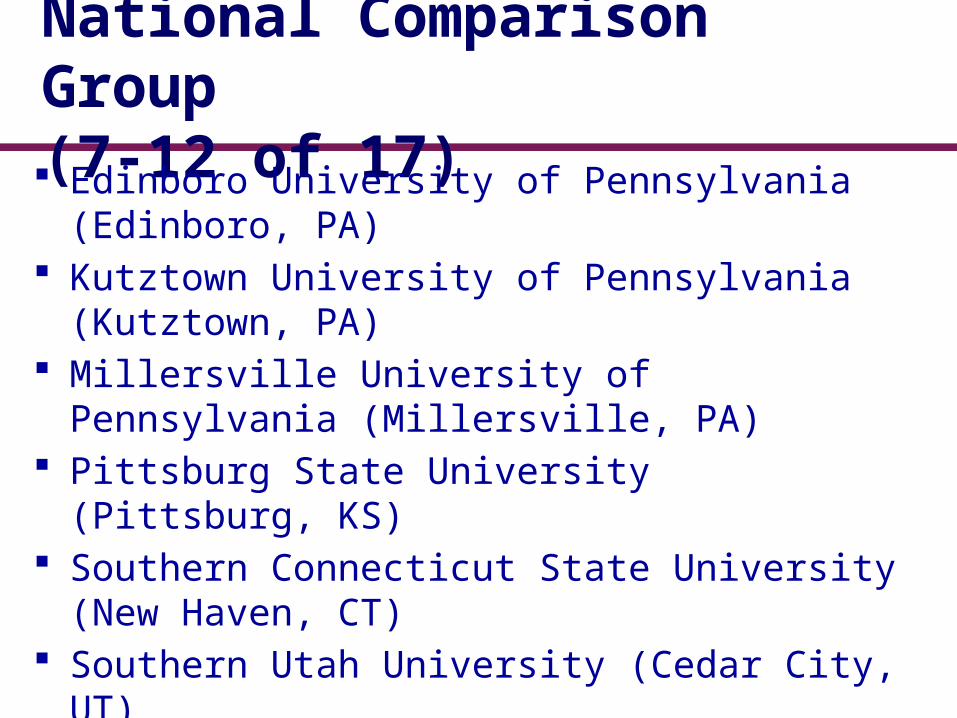
National Comparison Group (7-12 of 17) Edinboro University of Pennsylvania
(Edinboro, PA) Kutztown University of Pennsylvania
(Kutztown, PA) Millersville University of Pennsylvania
(Millersville, PA) Pittsburg State University (Pittsburg, KS) Southern Connecticut State University (New
Haven, CT) Southern Utah University (Cedar City, UT)
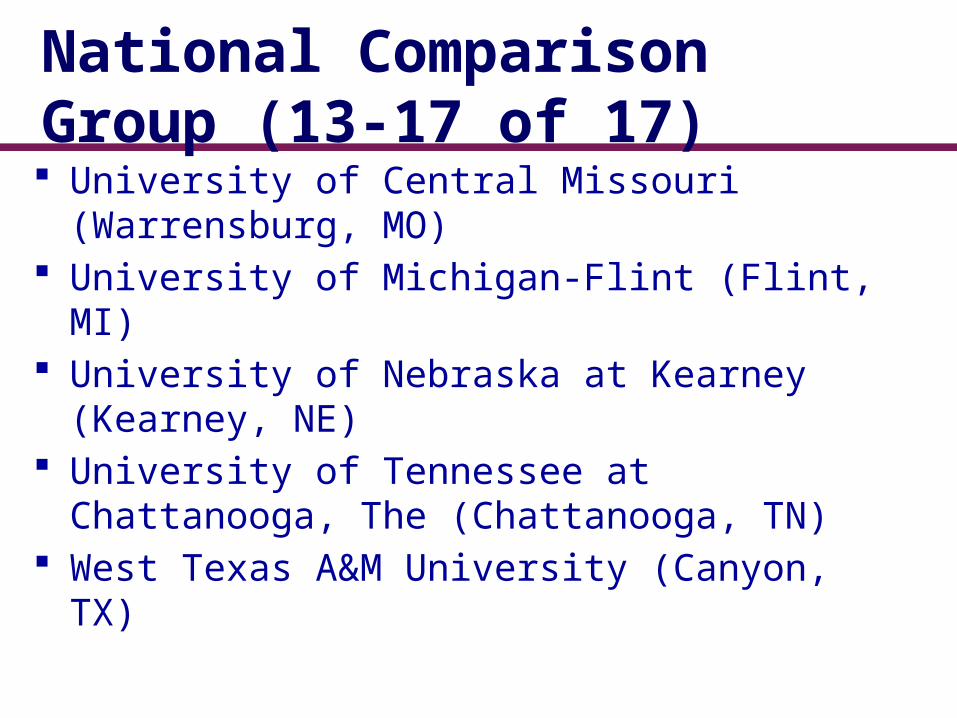
National Comparison Group (13-17 of 17) University of Central Missouri (Warrensburg,
MO) University of Michigan-Flint (Flint, MI) University of Nebraska at Kearney (Kearney,
NE) University of Tennessee at Chattanooga, The
(Chattanooga, TN) West Texas A&M University (Canyon, TX)
Satisfaction with “Entire Educational Experience” at UW-
Platteville

Satisfaction with “Entire Educational Experience” at UW-
Platteville
First-year
Senior
Percentage Rating Their Overall Experience as "Excellent" or "Good"
86%
85%
87%
87%
0% 25% 50% 75% 100%
National Comparison
UW-Platteville
National Comparison
UW-Platteville
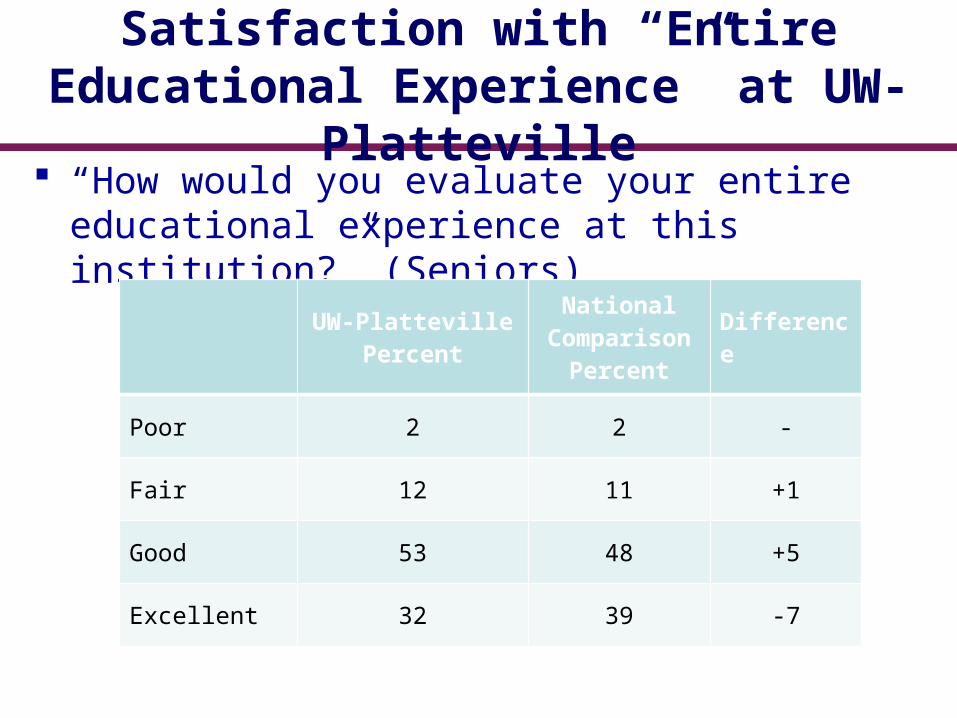
Satisfaction with “Entire Educational Experience” at UW-
Platteville “How would you evaluate your entire
educational experience at this institution?” (Seniors)
UW-PlattevillePercent
National Comparison
Percent
Difference
Poor 2 2 -
Fair 12 11 +1
Good 53 48 +5
Excellent 32 39 -7
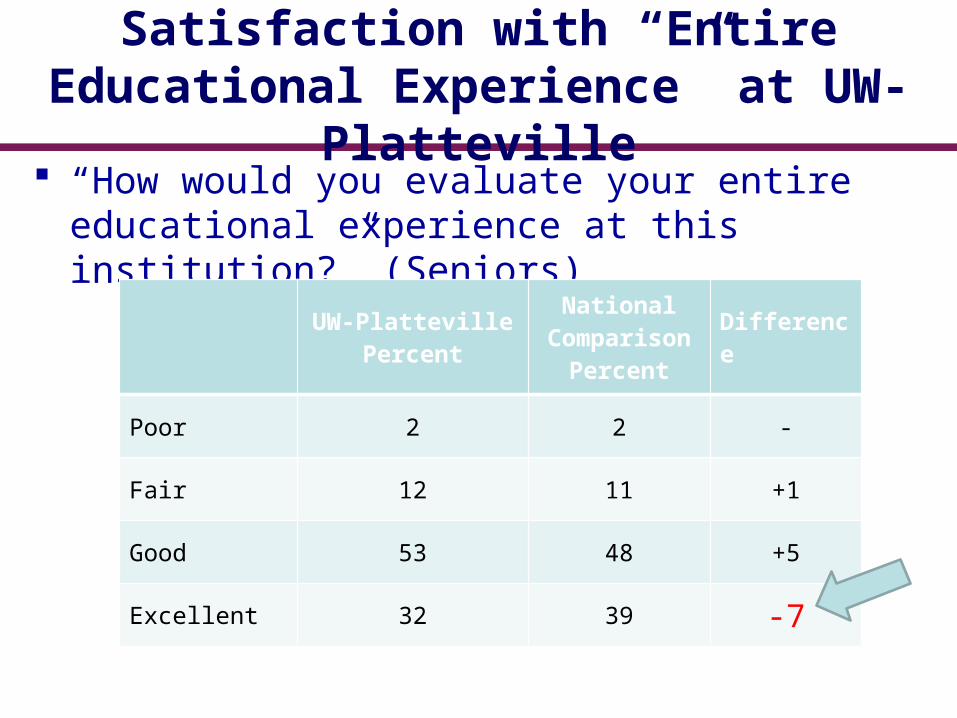
Satisfaction with “Entire Educational Experience” at UW-
Platteville “How would you evaluate your entire
educational experience at this institution?” (Seniors)
UW-PlattevillePercent
National Comparison
Percent
Difference
Poor 2 2 -
Fair 12 11 +1
Good 53 48 +5
Excellent 32 39 -7
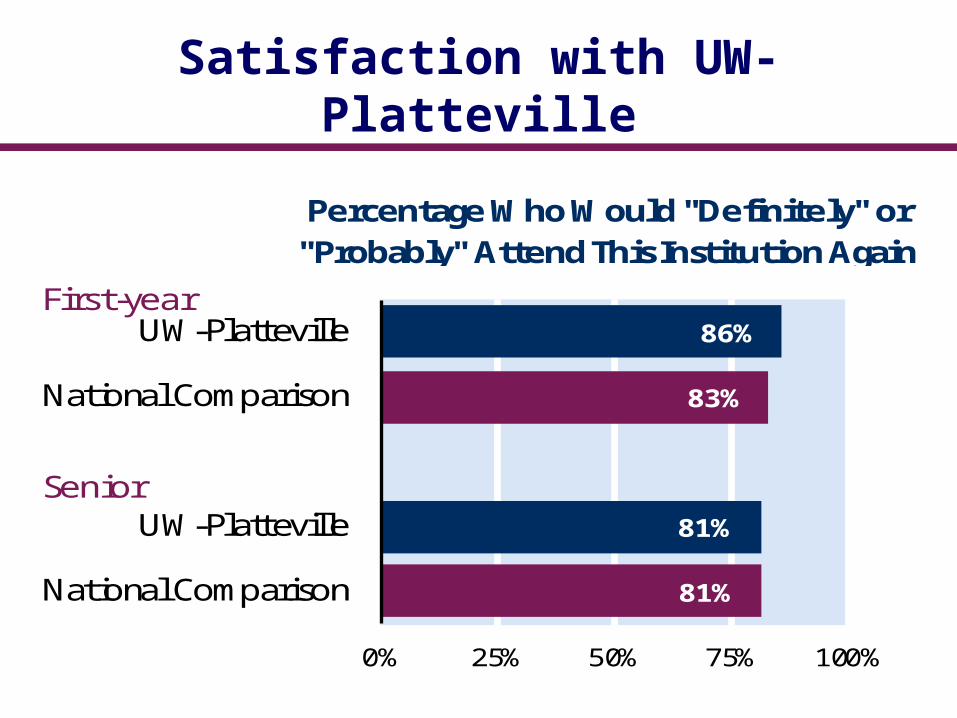
Satisfaction with UW-Platteville
First-year
Senior
Percentage Who Would "Definitely" or "Probably" Attend This Institution Again
81%
81%
83%
86%
0% 25% 50% 75% 100%
National Comparison
UW-Platteville
National Comparison
UW-Platteville
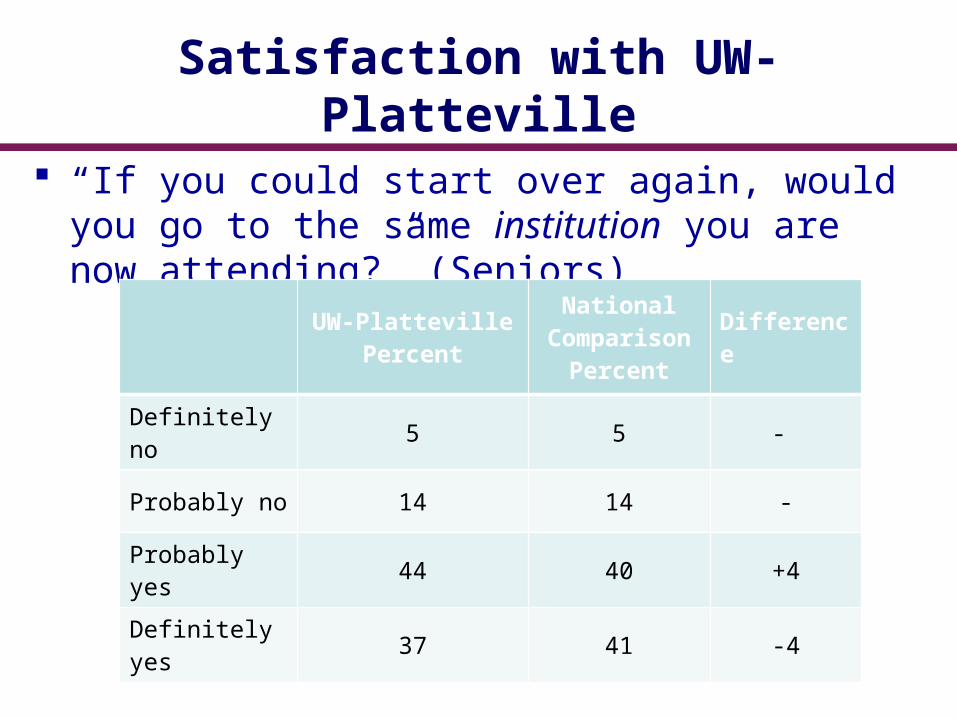
Satisfaction with UW-Platteville
“If you could start over again, would you go to the same institution you are now attending?” (Seniors)
UW-PlattevillePercent
National Comparison
Percent
Difference
Definitely no 5 5 -
Probably no 14 14 -
Probably yes 44 40 +4
Definitely yes 37 41 -4

Satisfaction with UW-Platteville
“If you could start over again, would you go to the same institution you are now attending?” (Seniors)
UW-PlattevillePercent
National Comparison
Percent
Difference
Definitely no 5 5 -
Probably no 14 14 -
Probably yes 44 40 +4
Definitely yes 37 41 -4
NSSE Engagement Indicators
Student – Faculty
Interaction
NSSE Engagement Indicators
Student – Faculty
Interaction
Academic ChallengeAcademic Challenge
Experiences with FacultyExperiences with Faculty
Learning with PeersLearning with Peers
Campus EnvironmentCampus Environment
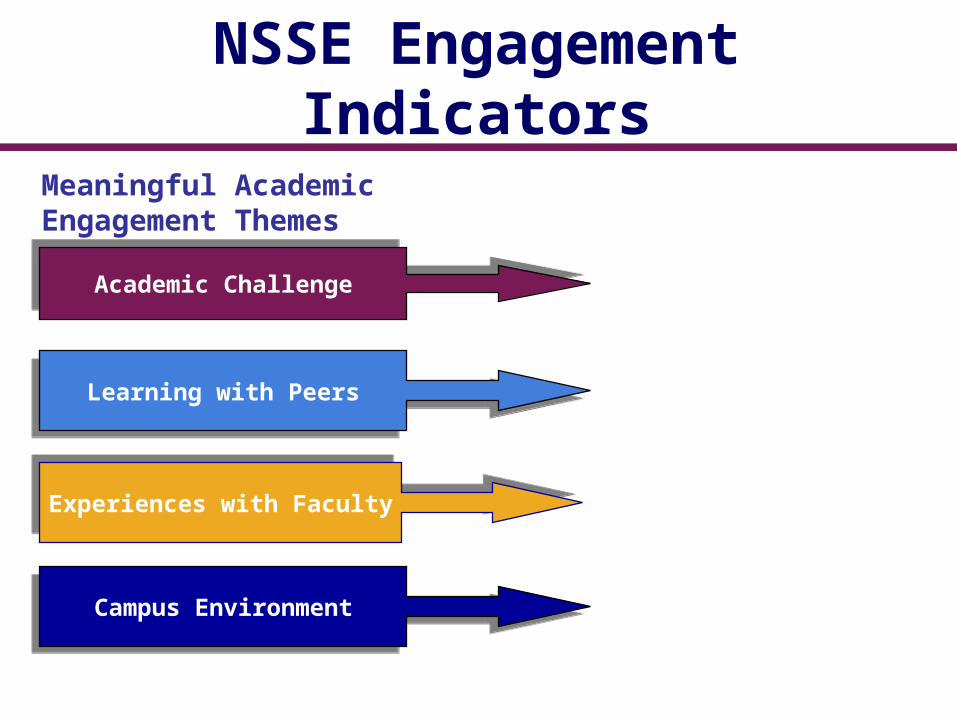
Meaningful AcademicEngagement Themes
NSSE Engagement Indicators
Student – Faculty
Interaction
Academic ChallengeAcademic Challenge
Experiences with FacultyExperiences with Faculty
Learning with PeersLearning with Peers
Campus EnvironmentCampus Environment
Meaningful AcademicEngagement Themes
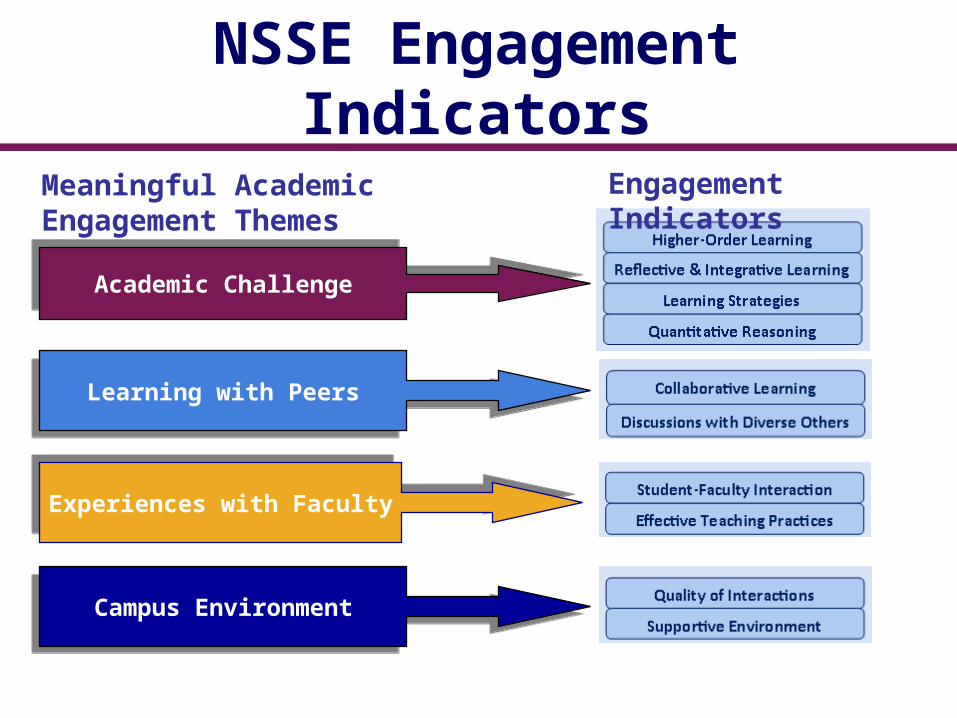
Engagement Indicators
Engagement Indicators
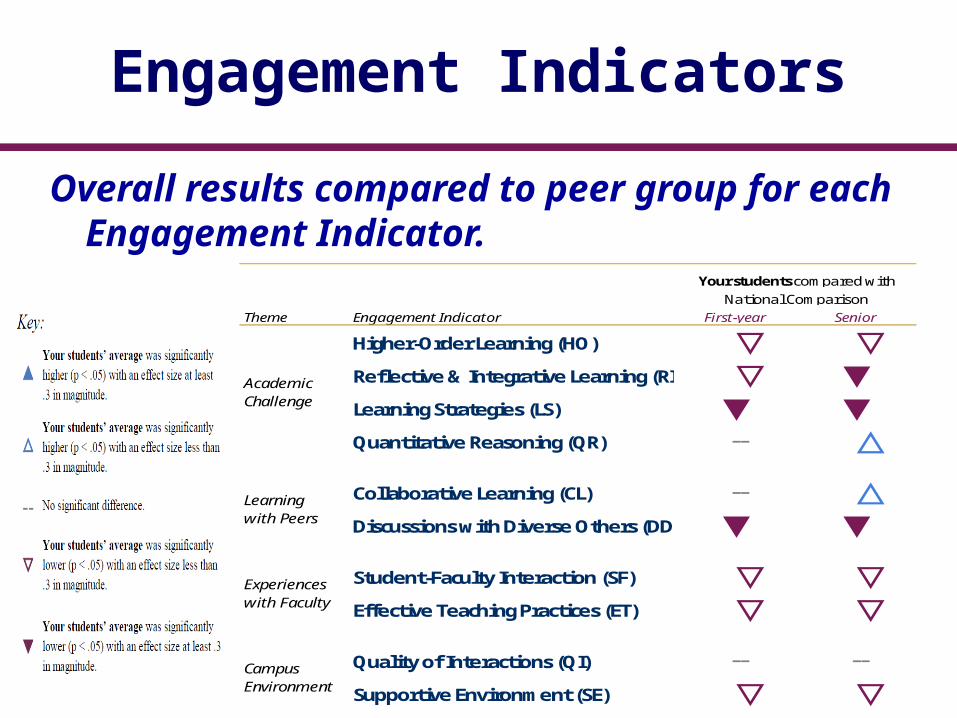
Overall results compared to peer group for each Engagement Indicator.
Theme Engagement Indicator
Higher-Order Learning (HO)
Reflective & Integrative Learning (RI)
Learning Strategies (LS)
Quantitative Reasoning (QR)
Collaborative Learning (CL)
Discussions with Diverse Others (DD)
Student-Faculty Interaction (SF)
Effective Teaching Practices (ET)
Quality of Interactions (QI)
Supportive Environment (SE)
▽▼▼△
National ComparisonFirst-year Senior
▼--
--
▼▽▽--
▽
Academic Challenge
Learning with Peers
Experiences with Faculty
Campus Environment
▽▽
△▼▽▽--
Your students compared with
▽

Seniors’ Engagement Indicators
Seniors
Your seniors compared with
Theme Engagement Indicator National Comparison
Academic Challenge
Higher-Order Learning ▽
Reflective and Integrative Learning ▼
Learning Strategies
▼
Quantitative Reasoning
△
Learning with Peers
Collaborative Learning △
Discussions with Diverse Others ▼
Experiences with Faculty
Student-Faculty Interaction ▽
Effective Teaching Practices
▽
Campus Environment
Quality of Interactions --
Supportive Environment
▽
▲
Your students’ average was significantly higher (p<.05) with an effect size at least .3 in magnitude.
△
Your students’ average was significantly higher (p<.05) with an effect size less than .3 in magnitude.
--No significant difference.
▽
Your students’ average was significantly lower (p<.05) with an effect size less than .3 in magnitude.
▼
Your students’ average was significantly lower (p<.05) with an effect size at least .3 in magnitude.

Higher Order Learning (4) During the current school year, how much
has your coursework emphasized the following?
UW-PlattevilleNational Comparison Mean Effect Size
Evaluating a point of view, decision, or information source
2.6 3.0*** -0.40
Forming a new idea or understanding from various pieces of information
2.7 3.0*** -0.31
Analyzing an idea, experience, or line of reasoning in depth by examining its parts
3.0 3.1 -0.06
Applying facts, theories, or methods to practical problems or new situations
3.1 3.1 -0.01Back
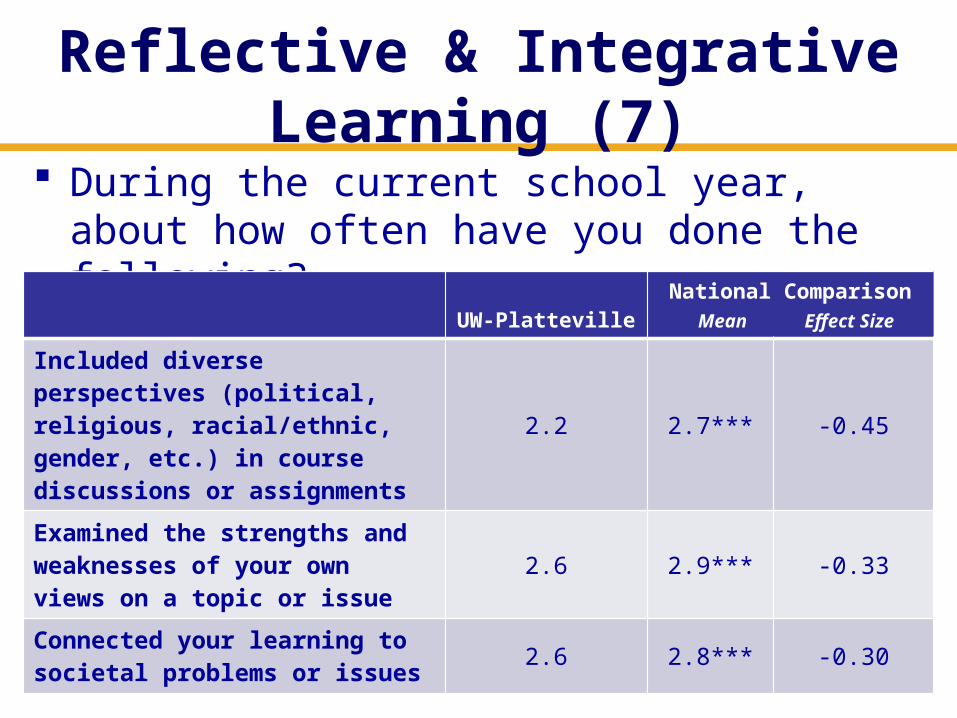
Reflective & Integrative Learning (7)
During the current school year, about how often have you done the following?
UW-PlattevilleNational Comparison Mean Effect Size
Included diverse perspectives (political, religious, racial/ethnic, gender, etc.) in course discussions or assignments
2.2 2.7*** -0.45
Examined the strengths and weaknesses of your own views on a topic or issue
2.6 2.9*** -0.33
Connected your learning to societal problems or issues 2.6 2.8*** -0.30
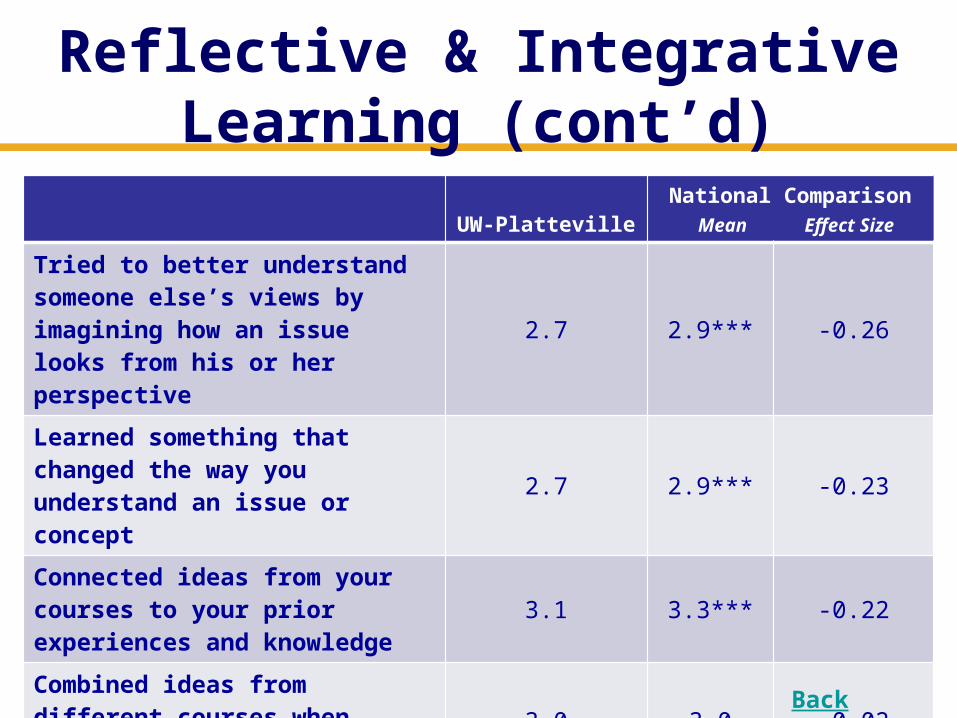
Reflective & Integrative Learning (cont’d)
UW-PlattevilleNational Comparison Mean Effect Size
Tried to better understand someone else’s views by imagining how an issue looks from his or her perspective
2.7 2.9*** -0.26
Learned something that changed the way you understand an issue or concept
2.7 2.9*** -0.23
Connected ideas from your courses to your prior experiences and knowledge
3.1 3.3*** -0.22
Combined ideas from different courses when completing assignments
3.0 3.0 -0.02
Back

Learning Strategies (3) During the current school year, about how
often have you done the following?
UW-PlattevilleNational Comparison Mean Effect Size
Identified key information from reading assignments 3.0 3.3*** -0.39
Summarized what you learned in class or from course materials
2.6 2.9*** -0.32
Reviewed your notes after class 2.7 2.9*** -0.24
Back
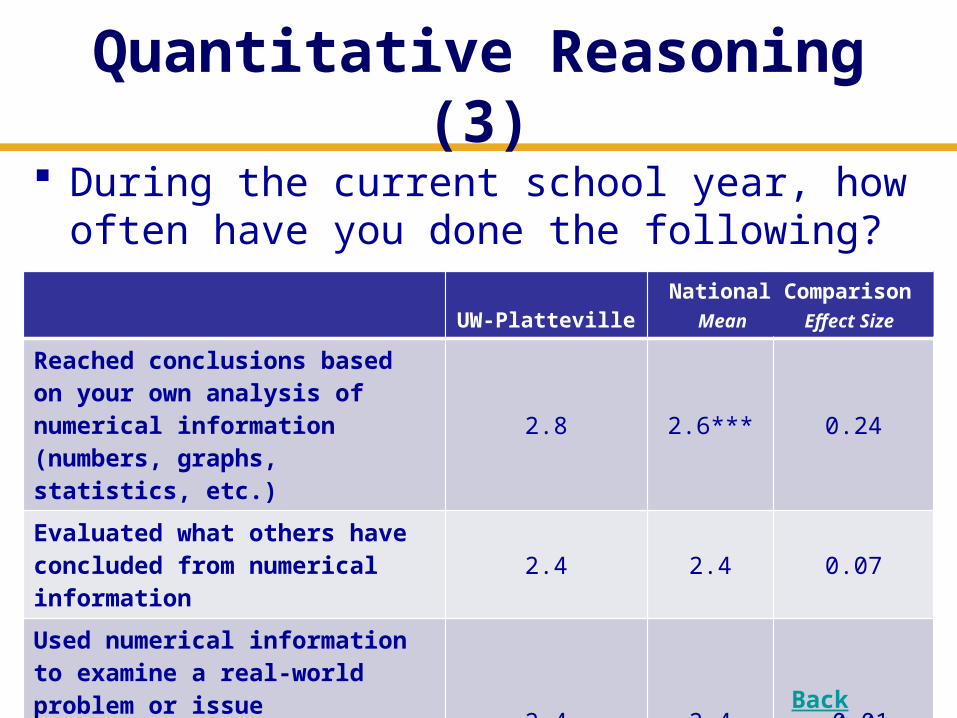
Quantitative Reasoning (3)
During the current school year, how often have you done the following?
UW-PlattevilleNational Comparison Mean Effect Size
Reached conclusions based on your own analysis of numerical information (numbers, graphs, statistics, etc.)
2.8 2.6*** 0.24
Evaluated what others have concluded from numerical information
2.4 2.4 0.07
Used numerical information to examine a real-world problem or issue (unemployment, climate change, public health, etc.)
2.4 2.4 -0.01
Back
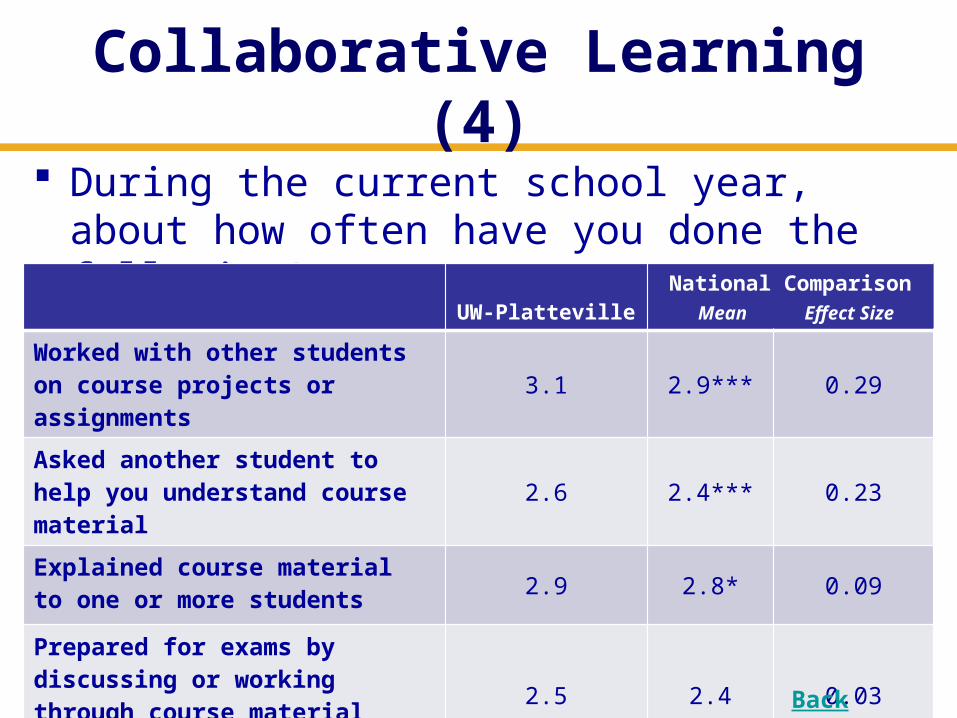
Collaborative Learning (4) During the current school year, about how
often have you done the following?
UW-PlattevilleNational Comparison Mean Effect Size
Worked with other students on course projects or assignments
3.1 2.9*** 0.29
Asked another student to help you understand course material
2.6 2.4*** 0.23
Explained course material to one or more students 2.9 2.8* 0.09
Prepared for exams by discussing or working through course material with other students
2.5 2.4 0.03
Back
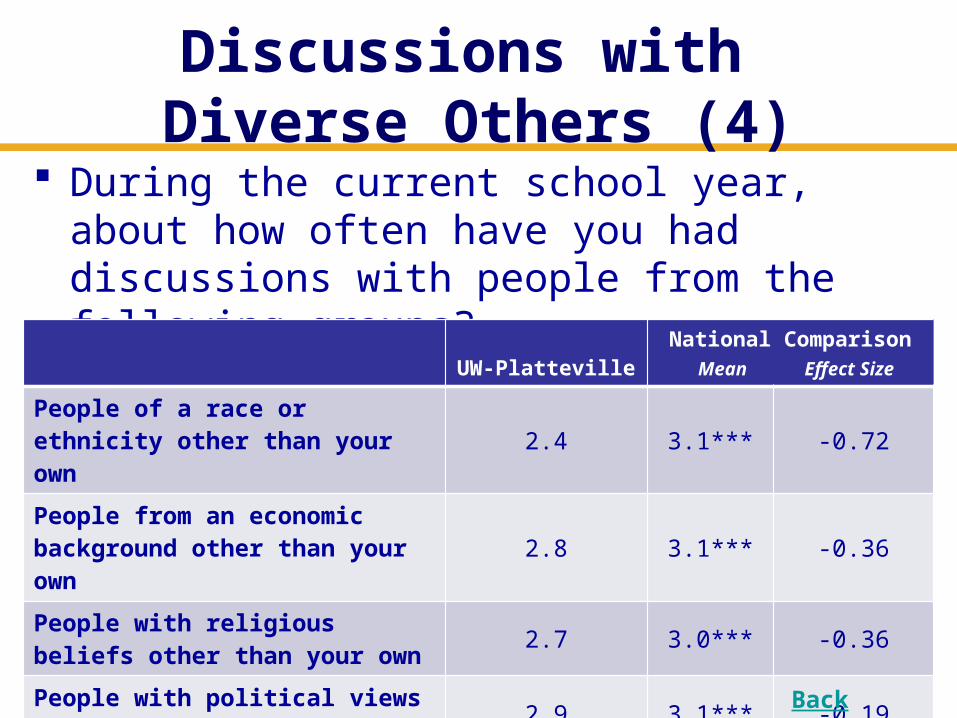
Discussions with Diverse Others (4)
During the current school year, about how often have you had discussions with people from the following groups?
UW-PlattevilleNational Comparison Mean Effect Size
People of a race or ethnicity other than your own 2.4 3.1*** -0.72
People from an economic background other than your own
2.8 3.1*** -0.36
People with religious beliefs other than your own 2.7 3.0*** -0.36
People with political views other than your own 2.9 3.1*** -0.19
Back
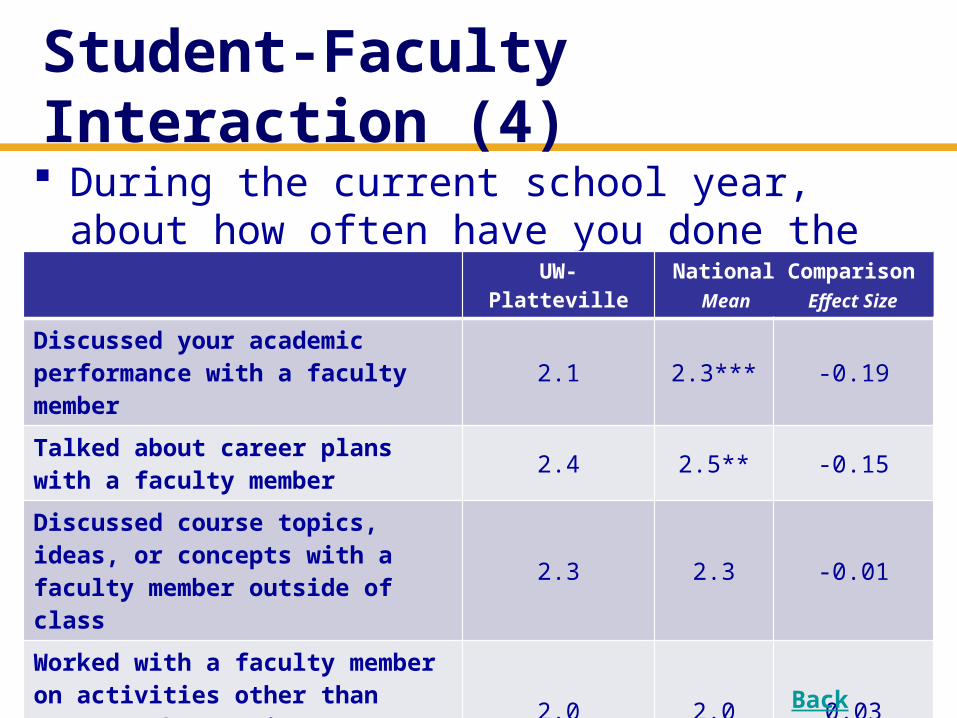
Student-Faculty Interaction (4) During the current school year, about how
often have you done the following?
UW-Platteville
National Comparison Mean Effect
Size
Discussed your academic performance with a faculty member
2.1 2.3*** -0.19
Talked about career plans with a faculty member 2.4 2.5** -0.15
Discussed course topics, ideas, or concepts with a faculty member outside of class
2.3 2.3 -0.01
Worked with a faculty member on activities other than coursework (committees, student groups, etc.)
2.0 2.0 0.03Back

Effective Teaching Practices (5)
During the current school year, to what extent have your instructors done the following?
UW-PlattevilleNational Comparison Mean Effect Size
Provided feedback on a draft or work in progress 2.6 2.8*** -0.24
Taught course sessions in an organized way 3.1 3.2** -0.14
Clearly explained course goals and requirements 3.1 3.2** -0.13
Provided prompt and detailed feedback on tests or completed assignments
2.8 2.9** -0.12
Used examples or illustrations to explain difficult points
3.1 3.2* -0.10
Back

Quality of Interactions (5) Indicate the quality of your interactions
with the following people at your institution
UW-PlattevilleNational Comparison Mean Effect Size
Faculty 5.4 5.6*** -0.18
Students 5.6 5.7 -0.03
Academic Advisors 5.3 5.2 0.03
Student services staff (career services, student activities, housing, etc.)
4.9 4.8 0.05
Other administrative staff and offices (registrar, financial aid, etc.)
4.9 4.8 0.05
Back

Supportive Environment (8)
How much does your institution emphasize the following?
UW-Platteville
National Comparison
Mean Effect Size
Encouraging contact among students from different backgrounds (social, racial/ethnic, religious, etc.)
2.2 2.5*** -0.30
Attending events that address important social, economic, or political issues
2.2 2.5*** -0.29
Providing opportunities to be involved socially 2.7 2.9*** -0.20
Providing support for your overall well-being (recreation, health care, counseling, etc.)
2.6 2.8*** -0.19

Supportive Environment (cont’d)
UW-PlattevilleNational Comparison Mean Effect Size
Helping you manage your non-academic responsibilities (work, family, etc.)
1.9 2.1*** -0.18
Using learning support services (tutoring services, writing center, etc.)
2.7 2.8** -0.16
Attending campus activities and events (performing arts, athletic events, etc.)
2.5 2.6* -0.12
Providing support to help students succeed academically
2.8 2.9* -0.11
Back
Item Comparison

Item Comparison 86 Individual Items
2 summary items Too many to examine at first glance Focus on highest and lowest performers
initially Compared to National Comparison Group

Item Comparison
Highest and lowest performing items compared to peer group.
Senior
Highest Performing Relative to National ComparisonWorked with other students on course projects or assignments b (CL)
Asked another student to help you understand course material b (CL)
Reached conclusions based on your own analysis of numerical information (…)b (QR)
Participated in an internship, co-op, field exp., student teach., clinical placemt. (HIP)
Completed a culminating senior experience (…) (HIP)
Lowest Performing Relative to National ComparisonInst. emphasizes… Attending events that address important social/econ./polit. issues c (SE)
Connected your learning to societal problems or issues b (RI)
Evaluating a point of view, decision, or information source c (HO)
Included diverse perspectives (…) in course discussions or assignments b (RI)
Discussions with… People of a race or ethnicity other than your ownb (DD)
Item #
-14
-15
-18
-22
-32
14i.
2b.
4d.
2c.
8a.
+15
+11
+11
+10
+7
-40 -30 -20 -10 0 10 20 30 40
1h.
1e.
6a.
11a.
11f.

Proposed Institutional Response to NSSE 2013 Results
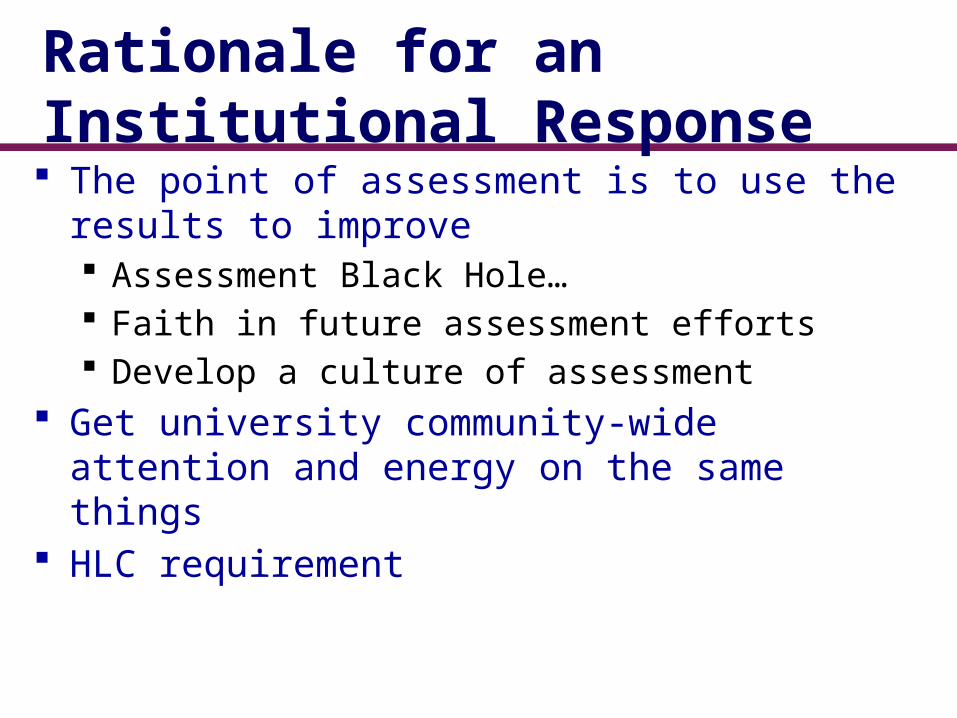
Rationale for an Institutional Response The point of assessment is to use the results
to improve Assessment Black Hole… Faith in future assessment efforts Develop a culture of assessment
Get university community-wide attention and energy on the same things
HLC requirement
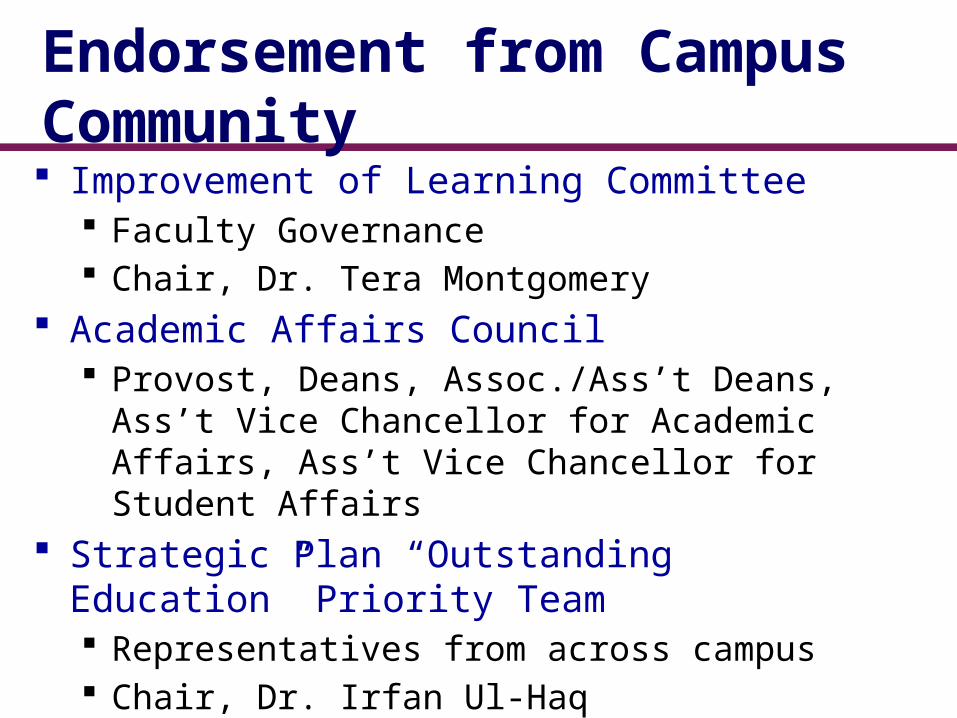
Endorsement from Campus Community Improvement of Learning Committee
Faculty Governance Chair, Dr. Tera Montgomery
Academic Affairs Council Provost, Deans, Assoc./Ass’t Deans, Ass’t Vice
Chancellor for Academic Affairs, Ass’t Vice Chancellor for Student Affairs
Strategic Plan “Outstanding Education” Priority Team Representatives from across campus Chair, Dr. Irfan Ul-Haq

Process of Choosing Items Those items with largest effect sizes below
our national comparison group Those items towards which we can have a
direct effect (rather than having to rely on student response)
Covered each of the NSSE Themes
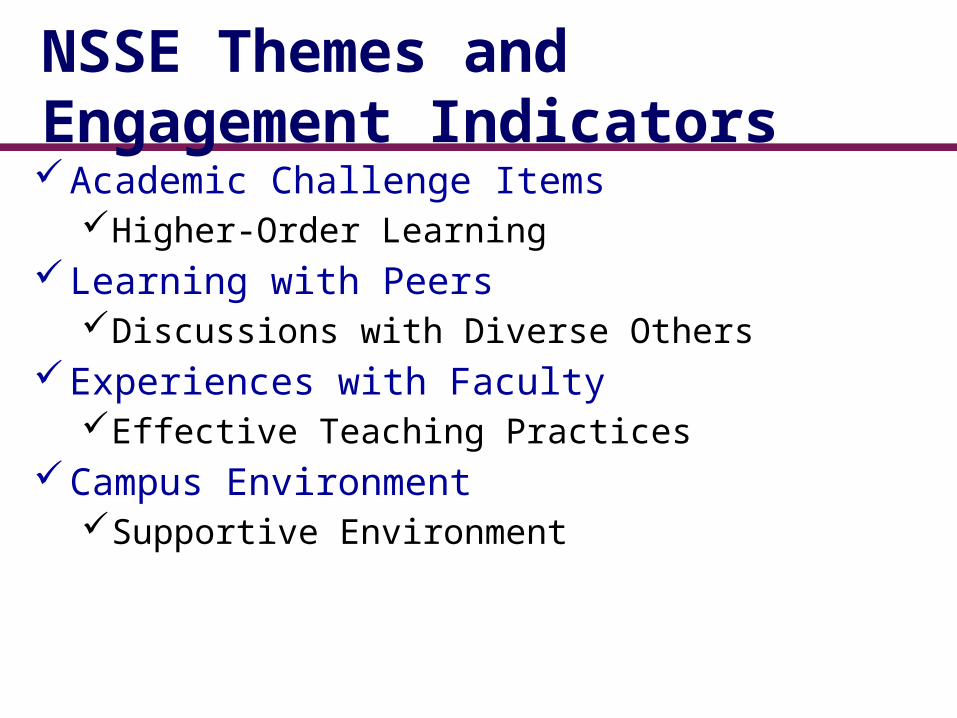
NSSE Themes and Engagement IndicatorsAcademic Challenge Items
Higher-Order LearningLearning with Peers
Discussions with Diverse OthersExperiences with Faculty
Effective Teaching PracticesCampus Environment
Supportive Environment

5 Proposed Areas of Focus Writing SkillsHigher Order LearningAcademic ChallengeDiversity and InclusionTransfer Student Experience

Questions and Discussion
Writing

Thanks very much!([email protected])
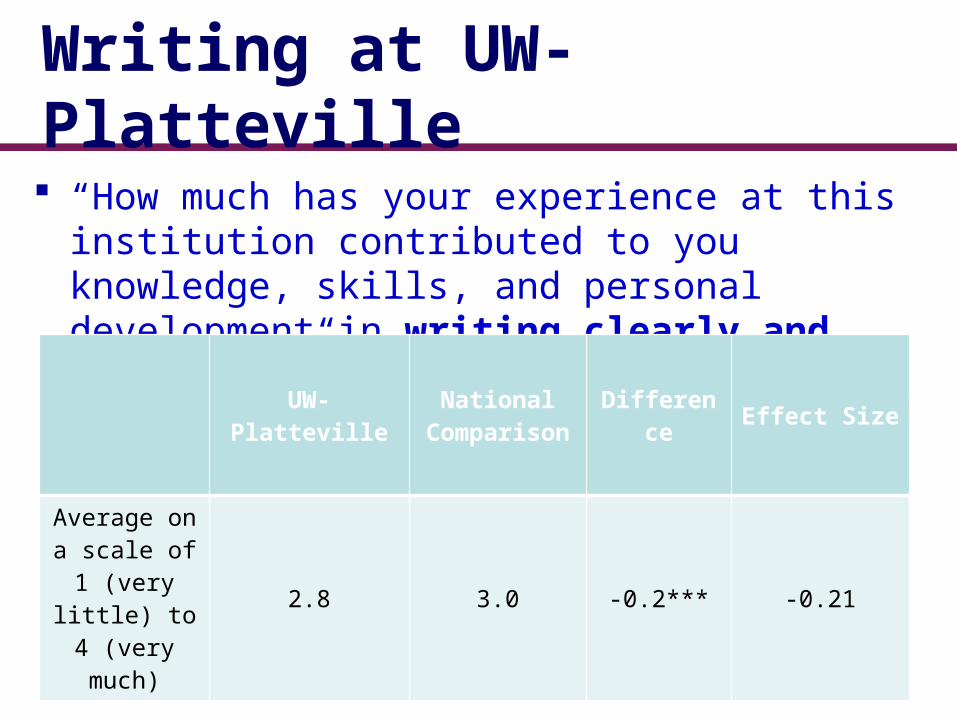
Writing at UW-Platteville “How much has your experience at this
institution contributed to you knowledge, skills, and personal development in writing clearly and effective?”
UW-Platteville
National Compariso
n
Difference Effect Size
Average on a scale of 1 (very little) to 4 (very
much)
2.8 3.0 -0.2*** -0.21

Writing at UW-Platteville “How much has your experience at this
institution contributed to you knowledge, skills, and personal development in writing clearly and effective?”
UW-PlattevillePercent
National Comparison
Percent
Difference
1 (Very little) 6 6 -
2 (Some) 30 22 +8
3 (Quite a bit) 38 38 -
4 (Very much) 26 35 -9

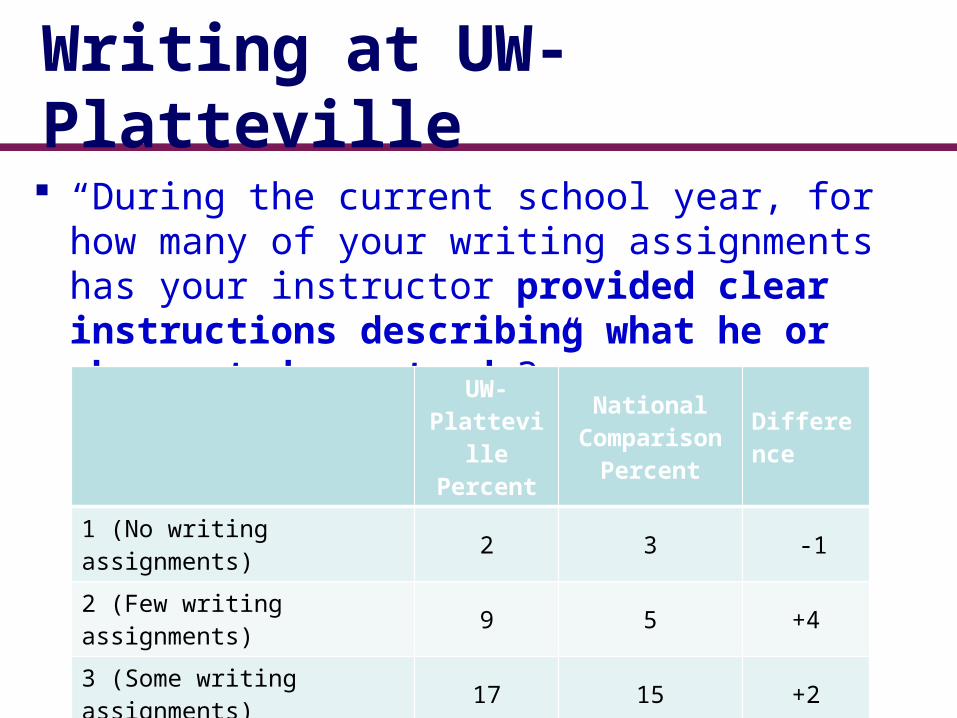
Writing at UW-Platteville
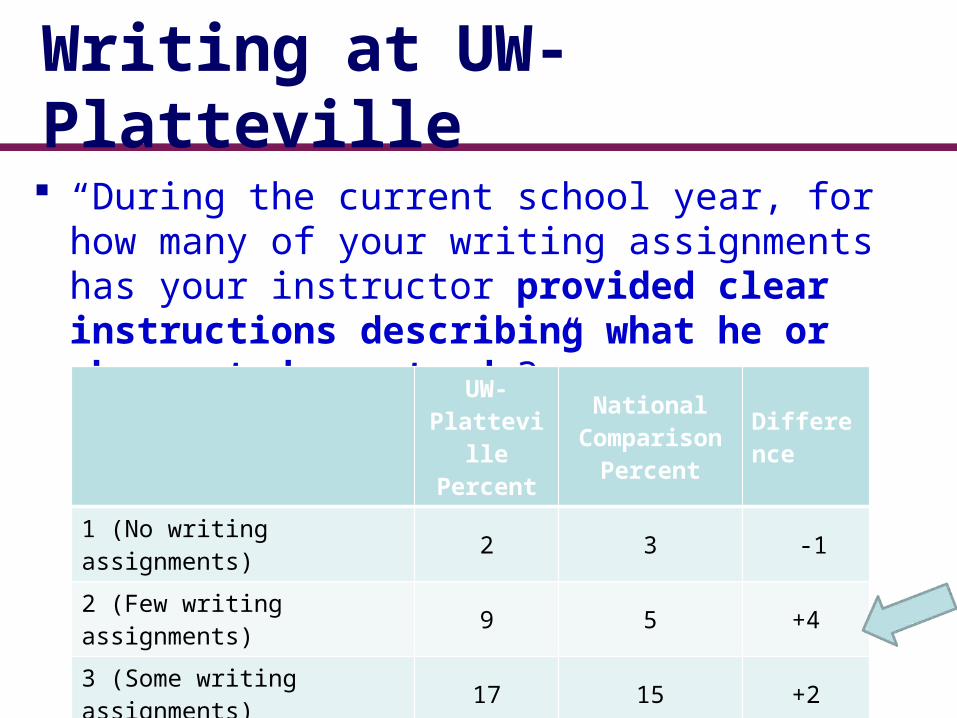
“During the current school year, for how many of your writing assignments has your instructor provided clear instructions describing what he or she wanted you to do?”
UW-Platteville
National Compariso
n
Difference Effect Size
Average on a scale of 1 (none) to 5
(all)
3.8 4.0 -0.2*** -0.18
Writing at UW-Platteville “During the current school year, for how
many of your writing assignments has your instructor provided clear instructions describing what he or she wanted you to do?” UW-
Platteville
Percent
National Comparison
Percent
Difference
1 (No writing assignments) 2 3 -1
2 (Few writing assignments) 9 5 +4
3 (Some writing assignments) 17 15 +2
4 (Most writing assignments) 50 45 +5
5 (All writing assignments) 22 32 -10
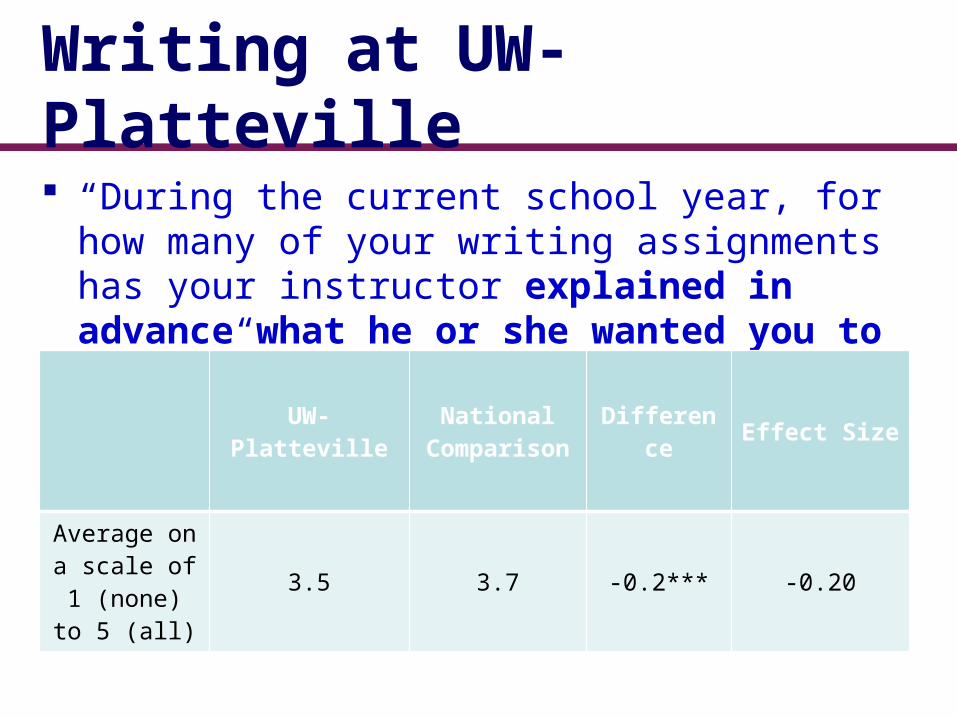
Writing at UW-Platteville “During the current school year, for how
many of your writing assignments has your instructor explained in advance what he or she wanted you to learn?”
UW-Platteville
National Compariso
n
Difference Effect Size
Average on a scale of 1 (none) to 5
(all)
3.5 3.7 -0.2*** -0.20

Writing at UW-Platteville “During the current school year, for how
many of your writing assignments has your instructor explained in advance what her or she wanted you to learn?”
UW-Plattevill
ePercent
National Comparison
Percent
Difference
1 (No writing assignments) 6 5 +1
2 (Few writing assignments) 12 10 +2
3 (Some writing assignments) 30 24 +6
4 (Most writing assignments) 34 34 -
5 (All writing assignments) 17 27 -10

Writing at UW-Platteville “During the current school year, to what
extent have your instructors provided feedback on a draft or work in progress?”
UW-Platteville
National Compariso
n
Difference Effect Size
Average on a scale of 1 (very little) to 4 (very
much)
2.6 2.8 -0.2*** -0.24
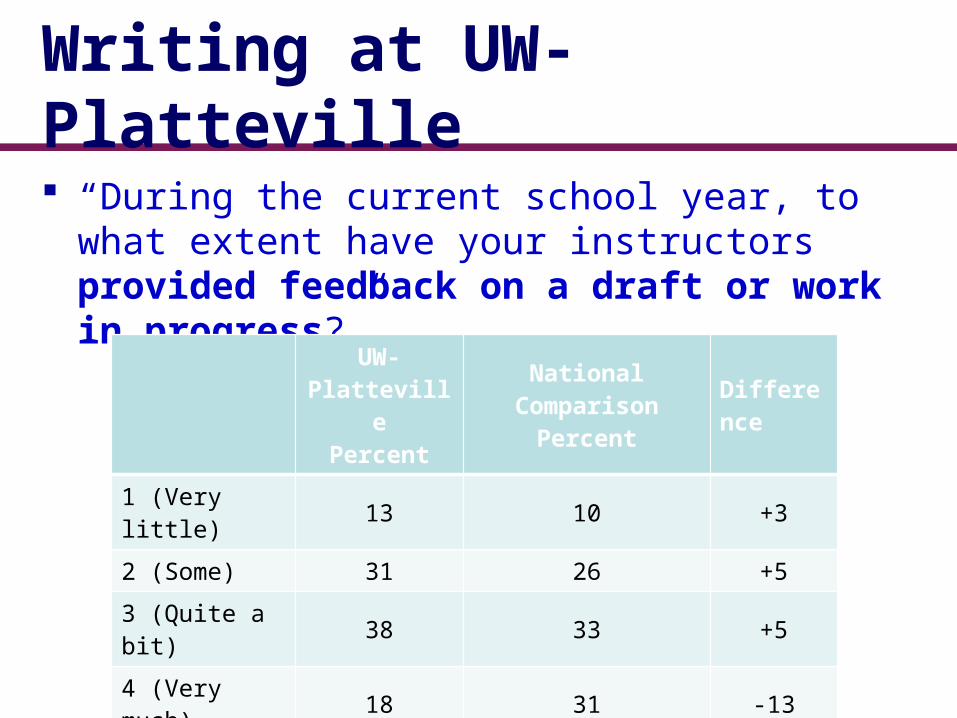
Writing at UW-Platteville “During the current school year, to what
extent have your instructors provided feedback on a draft or work in progress?”
UW-PlattevillePercent
National Comparison
Percent
Difference
1 (Very little) 13 10 +3
2 (Some) 31 26 +5
3 (Quite a bit) 38 33 +5
4 (Very much) 18 31 -13
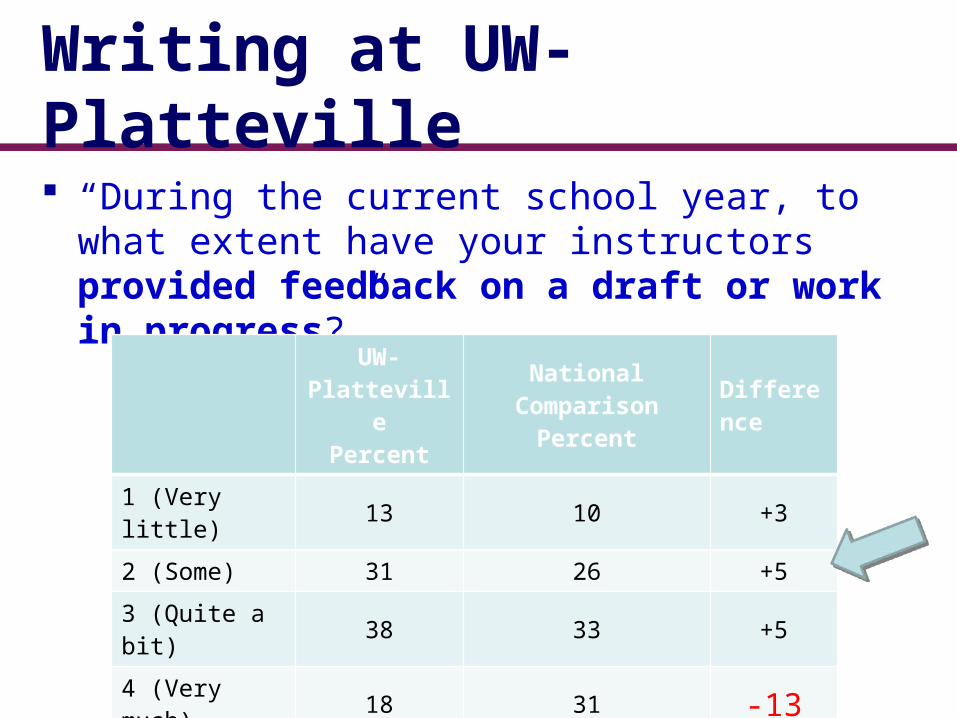
Writing at UW-Platteville “During the current school year, to what
extent have your instructors provided feedback on a draft or work in progress?”
UW-PlattevillePercent
National Comparison
Percent
Difference
1 (Very little) 13 10 +3
2 (Some) 31 26 +5
3 (Quite a bit) 38 33 +5
4 (Very much) 18 31 -13
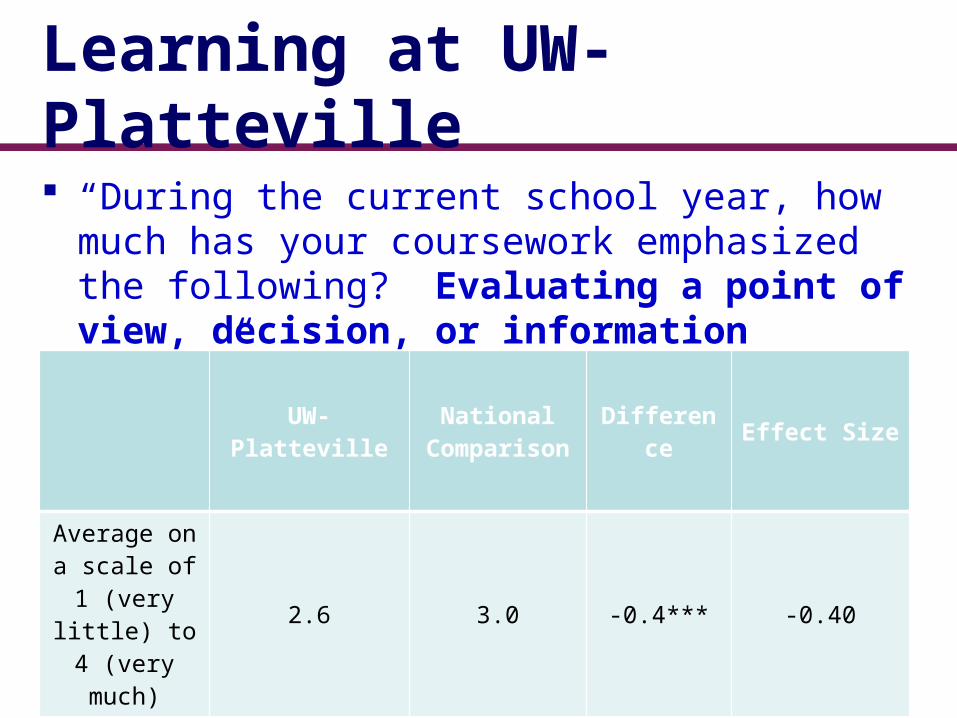
Learning at UW-Platteville “During the current school year, how much
has your coursework emphasized the following? Evaluating a point of view, decision, or information source”
UW-Platteville
National Compariso
n
Difference Effect Size
Average on a scale of 1 (very little) to 4 (very
much)
2.6 3.0 -0.4*** -0.40
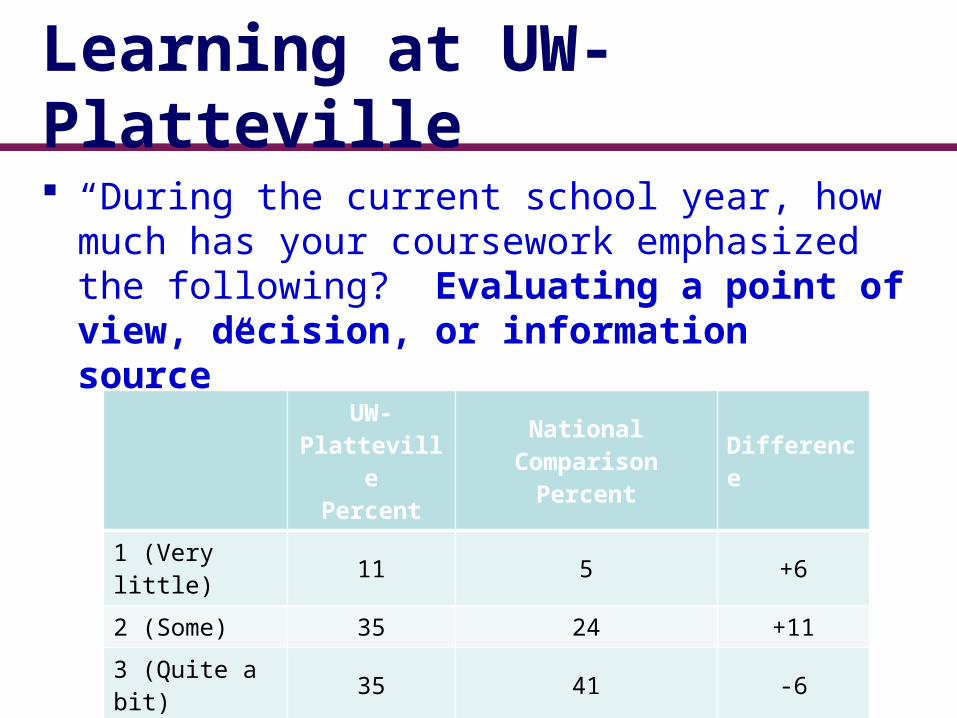
Learning at UW-Platteville “During the current school year, how much
has your coursework emphasized the following? Evaluating a point of view, decision, or information source”
UW-PlattevillePercent
National Comparison
Percent
Difference
1 (Very little) 11 5 +6
2 (Some) 35 24 +11
3 (Quite a bit) 35 41 -6
4 (Very much) 19 30 -11
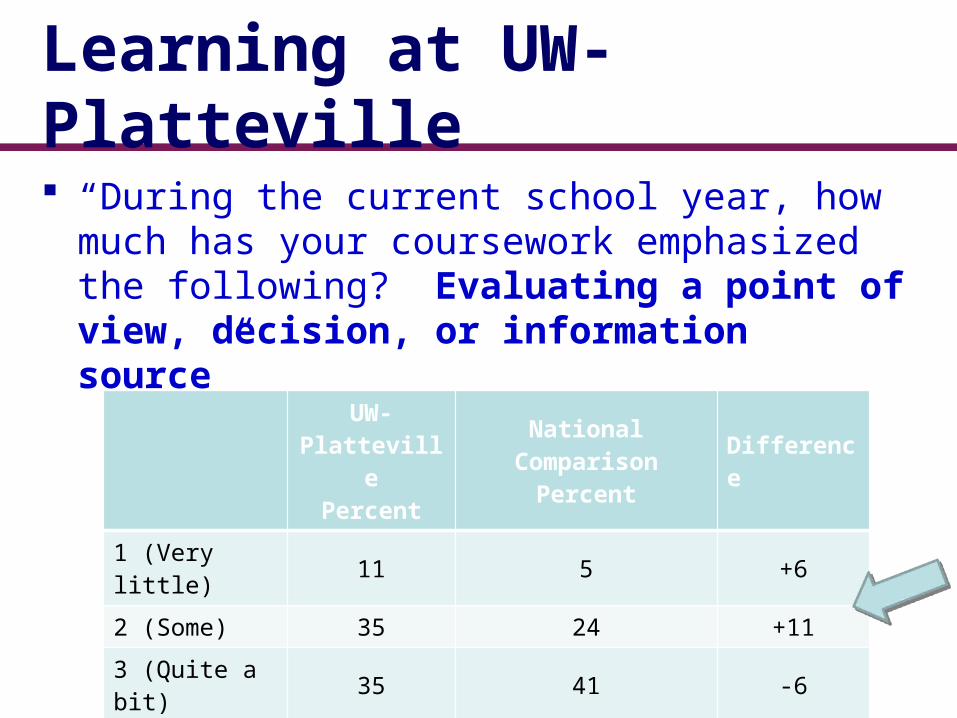
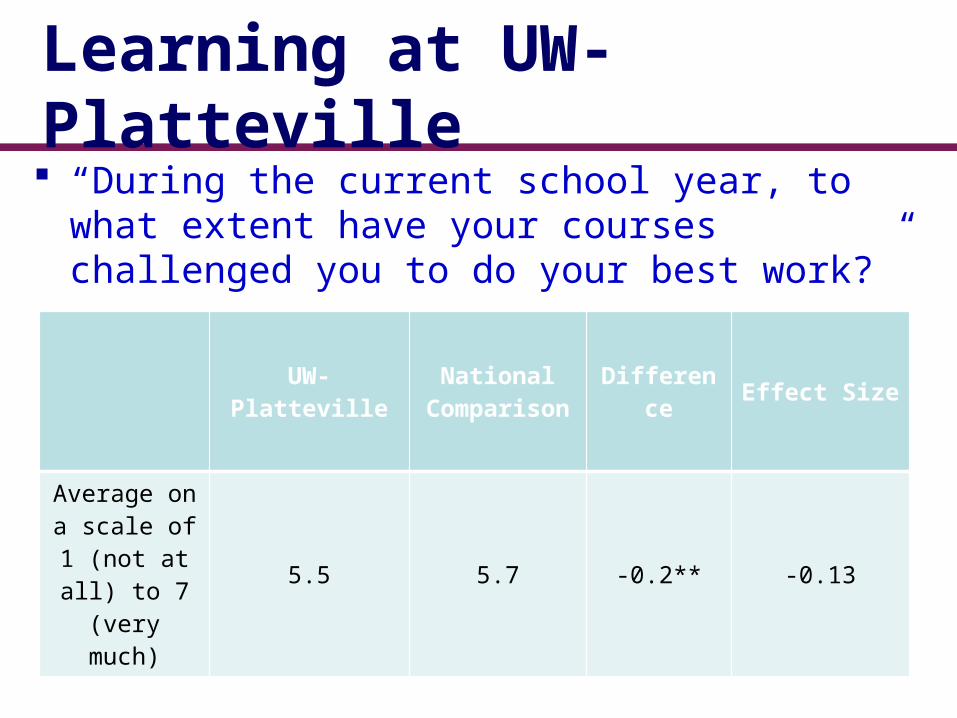
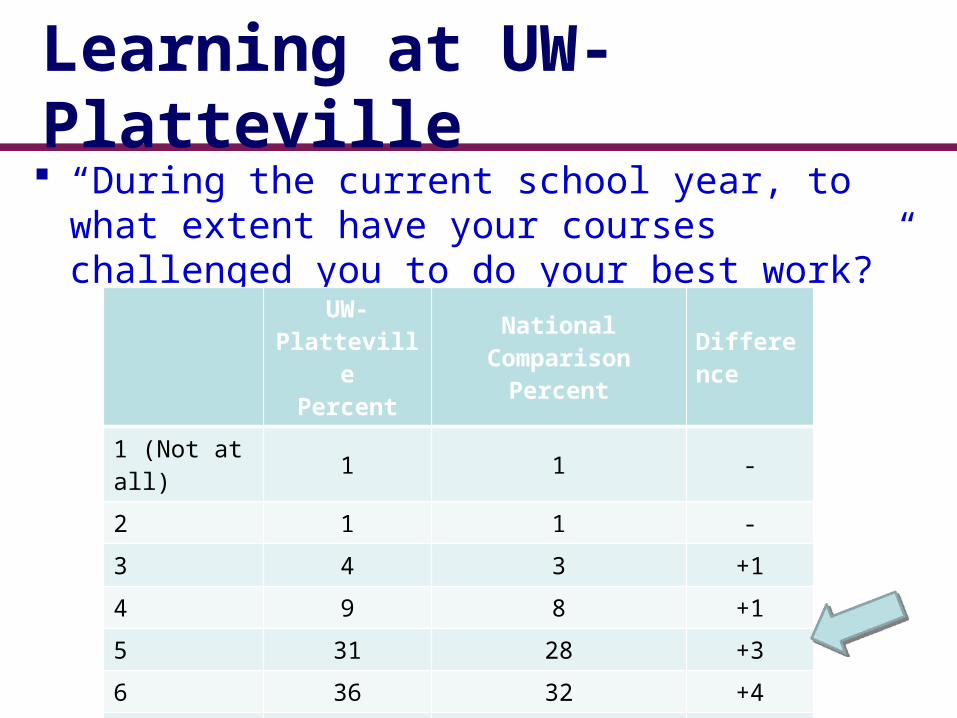
Learning at UW-Platteville “During the current school year, to what
extent have your courses challenged you to do your best work?”
UW-Platteville
National Compariso
n
Difference Effect Size
Average on a scale of 1 (not at all) to 7 (very
much)
5.5 5.7 -0.2** -0.13

Learning at UW-Platteville “During the current school year, to what
extent have your courses challenged you to do your best work?”
UW-PlattevillePercent
National Comparison
Percent
Difference
1 (Not at all) 1 1 -
2 1 1 -
3 4 3 +1
4 9 8 +1
5 31 28 +3
6 36 32 +4
7 (Very much) 19 28 -9
Learning at UW-Platteville “During the current school year, to what
extent have your courses challenged you to do your best work?”
UW-PlattevillePercent
National Comparison
Percent
Difference
1 (Not at all) 1 1 -
2 1 1 -
3 4 3 +1
4 9 8 +1
5 31 28 +3
6 36 32 +4
7 (Very much) 19 28 -9

Diversity at UW-Platteville “During the current school year, about how
often have you had discussions with the following groups? People of a race or ethnicity other than your own”
UW-Platteville
National Compariso
n
Difference Effect Size
Average on a scale of 1 (never) to 4 (very often)
2.4 3.1 -0.7*** -0.72
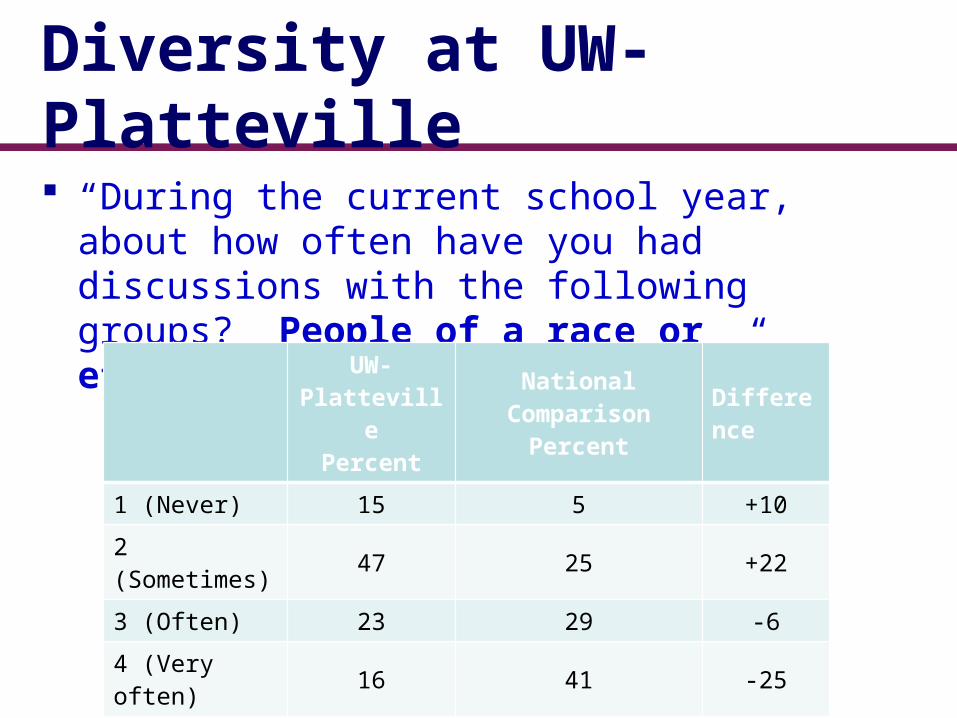
Diversity at UW-Platteville “During the current school year, about how
often have you had discussions with the following groups? People of a race or ethnicity other than your own”
UW-PlattevillePercent
National Comparison
Percent
Difference
1 (Never) 15 5 +10
2 (Sometimes) 47 25 +22
3 (Often) 23 29 -6
4 (Very often) 16 41 -25

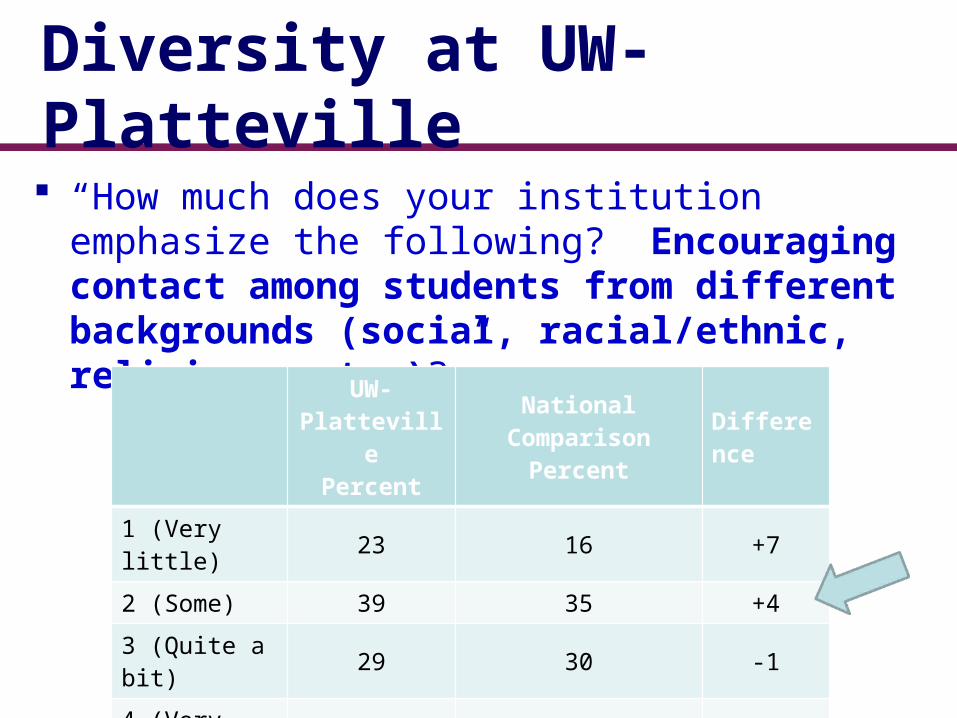
Diversity at UW-Platteville “How much does your institution emphasize
the following? Encouraging contact among students from different backgrounds (social, racial/ethnic, religious, etc.)”
UW-Platteville
National Compariso
n
Difference Effect Size
Average on a scale of 1 (very little) to 4 (very
much)
2.2 2.5 -0.3*** -0.30

Diversity at UW-Platteville “How much does your institution emphasize
the following? Encouraging contact among students from different backgrounds (social, racial/ethnic, religious, etc.)?”UW-
PlattevillePercent
National Comparison
Percent
Difference
1 (Very little) 23 16 +7
2 (Some) 39 35 +4
3 (Quite a bit) 29 30 -1
4 (Very much) 8 19 -11
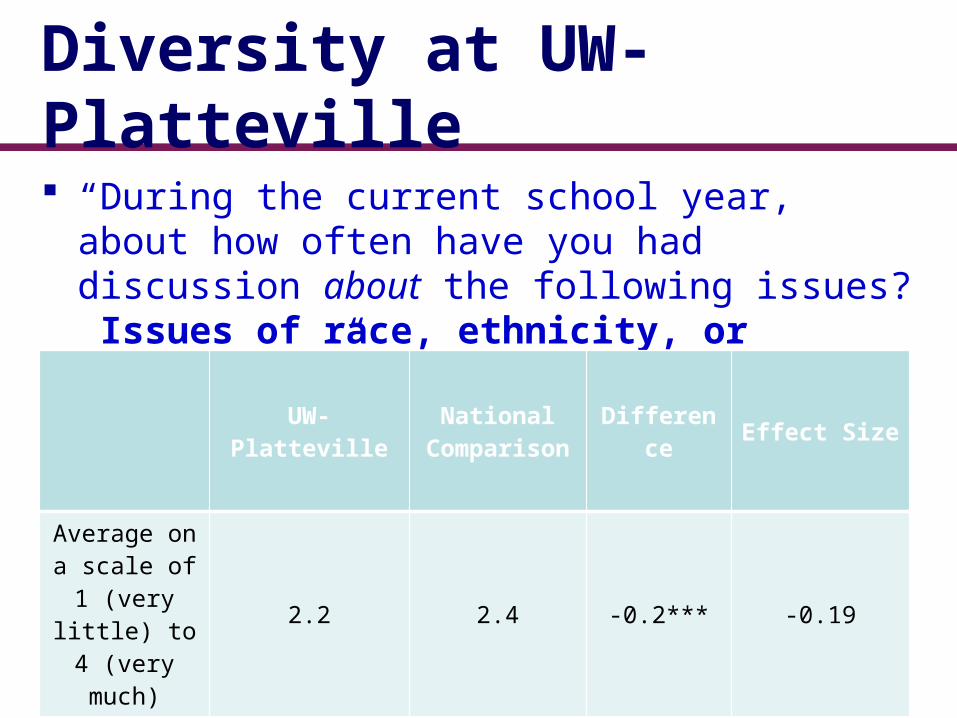
Diversity at UW-Platteville “During the current school year, about how
often have you had discussion about the following issues? Issues of race, ethnicity, or nationality”
UW-Platteville
National Compariso
n
Difference Effect Size
Average on a scale of 1 (very little) to 4 (very
much)
2.2 2.4 -0.2*** -0.19
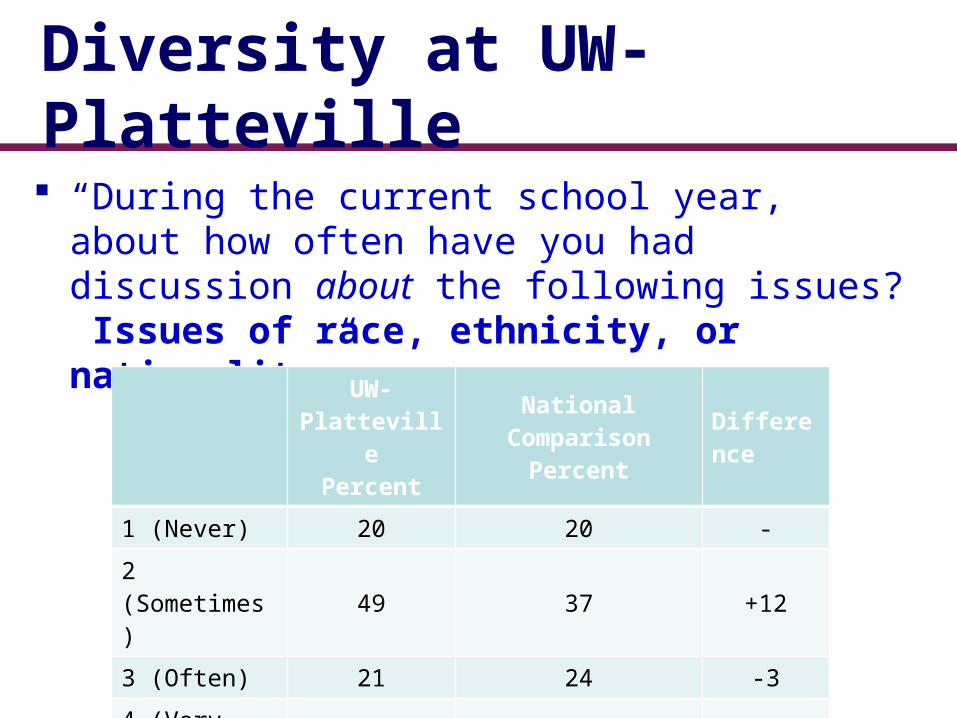
Diversity at UW-Platteville “During the current school year, about how
often have you had discussion about the following issues? Issues of race, ethnicity, or nationality”
UW-PlattevillePercent
National Comparison
Percent
Difference
1 (Never) 20 20 -
2 (Sometimes) 49 37 +12
3 (Often) 21 24 -3
4 (Very Often) 11 19 -8

Transfer Student Experience “Supportive Environment” Engagement
Indicator: 8 Items beginning: “How much does your institution emphasize the following?...”
UW-Platteville
Senior Non-Transfer Students
UW-Platteville
Senior Transfer Students
Difference
Effect Size(h2)
Average on an 8 item subscale
30.6 26.7 -3.9*** -.023
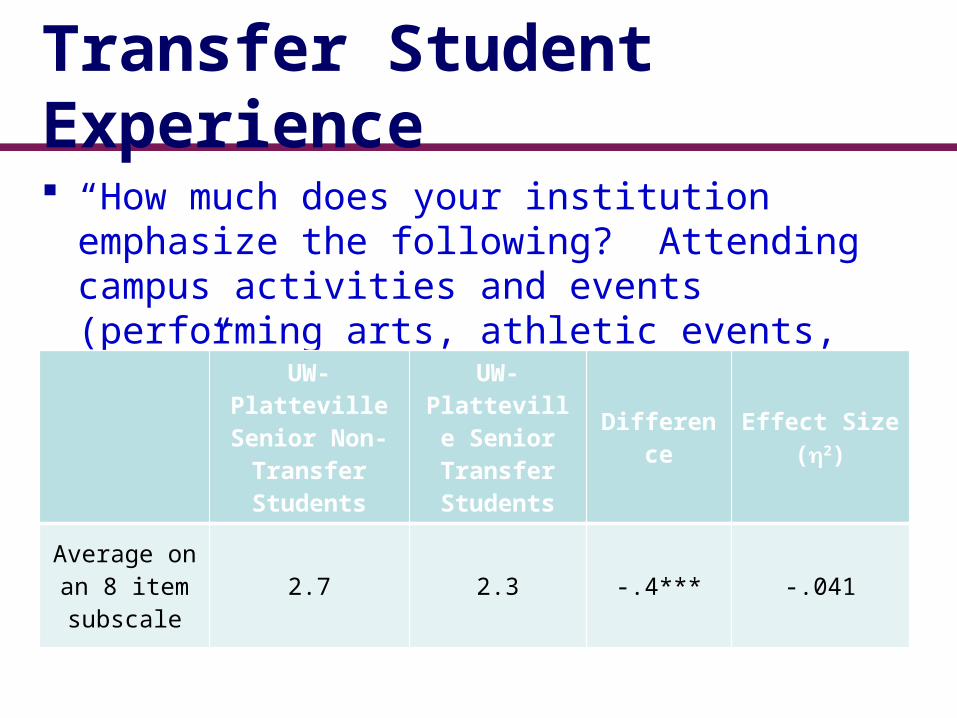
Transfer Student Experience “How much does your institution emphasize
the following? Attending campus activities and events (performing arts, athletic events, etc.)”
UW-Platteville
Senior Non-Transfer Students
UW-Platteville
Senior Transfer Students
Difference
Effect Size(h2)
Average on an 8 item subscale
2.7 2.3 -.4*** -.041
Transfer Student Experience “How much does your institution emphasize
the following? Attending campus activities and events (performing arts, athletic events, etc.)”
UW-PlattevilleSenior Non-
Transfer Students Percent
UW-Platteville
Senior Transfer Students Percent
Difference
Very Little 8 22 +14
Some 33 39 +6
Quite a bit 43 28 -15
Very much 16 11 -5
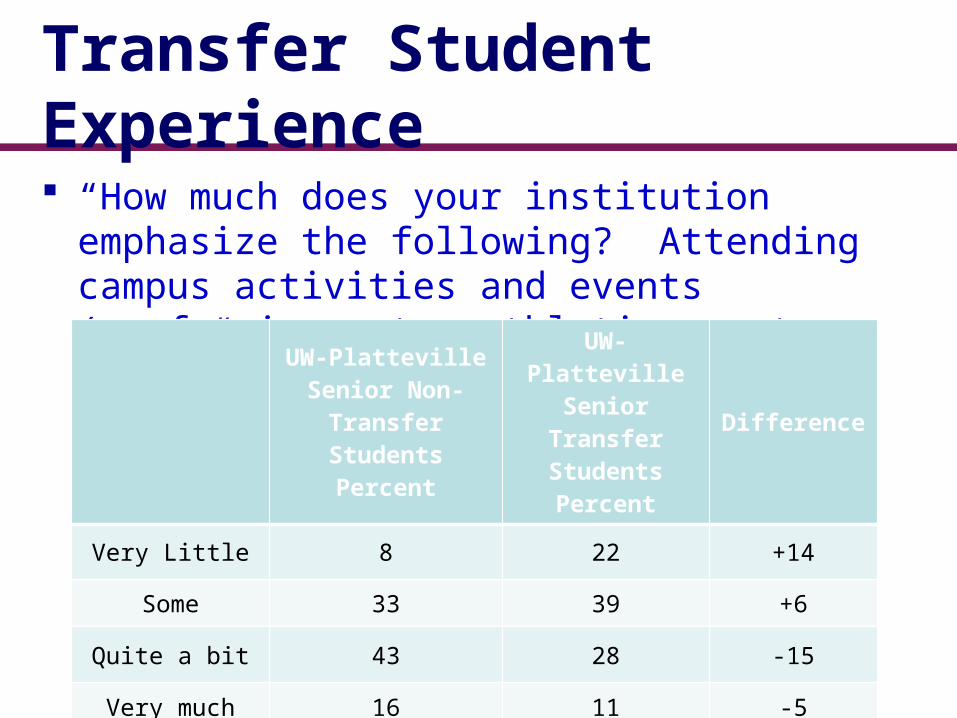
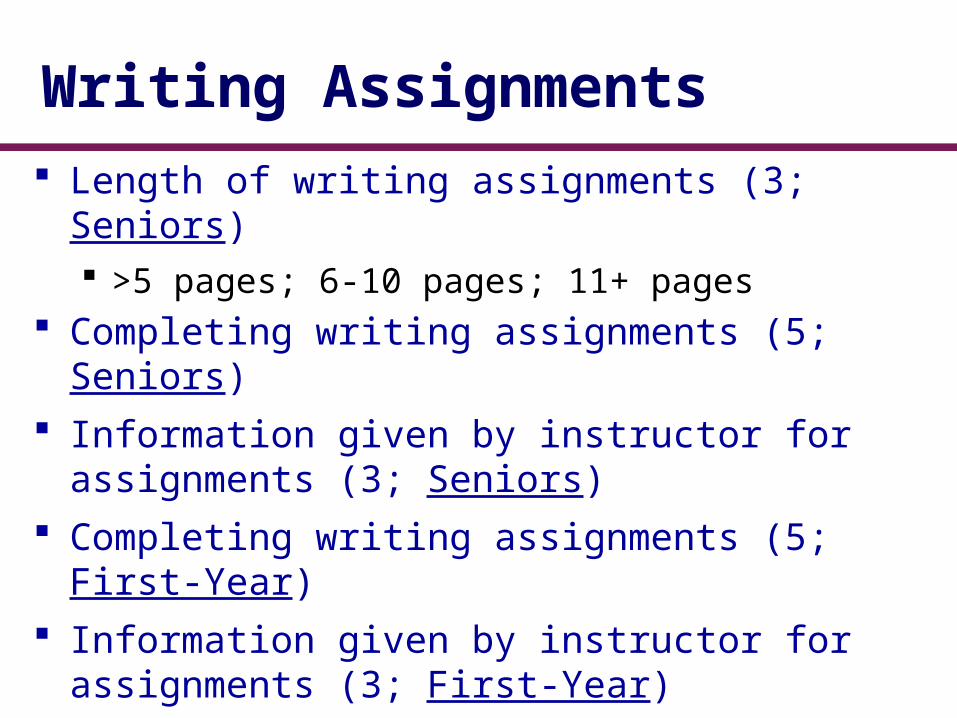
Writing Assignments Length of writing assignments (3; Seniors)
>5 pages; 6-10 pages; 11+ pages Completing writing assignments (5; Seniors) Information given by instructor for
assignments (3; Seniors) Completing writing assignments (5; First-Year
) Information given by instructor for
assignments (3; First-Year)
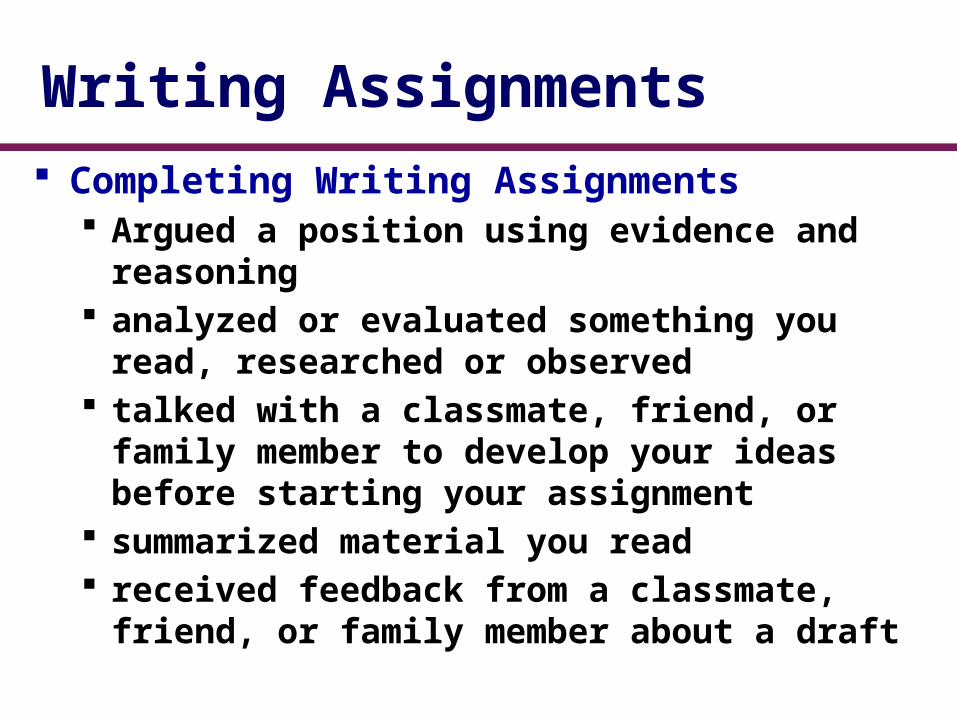
Writing Assignments Completing Writing Assignments
Argued a position using evidence and reasoning
analyzed or evaluated something you read, researched or observed
talked with a classmate, friend, or family member to develop your ideas before starting your assignment
summarized material you read received feedback from a classmate,
friend, or family member about a draft
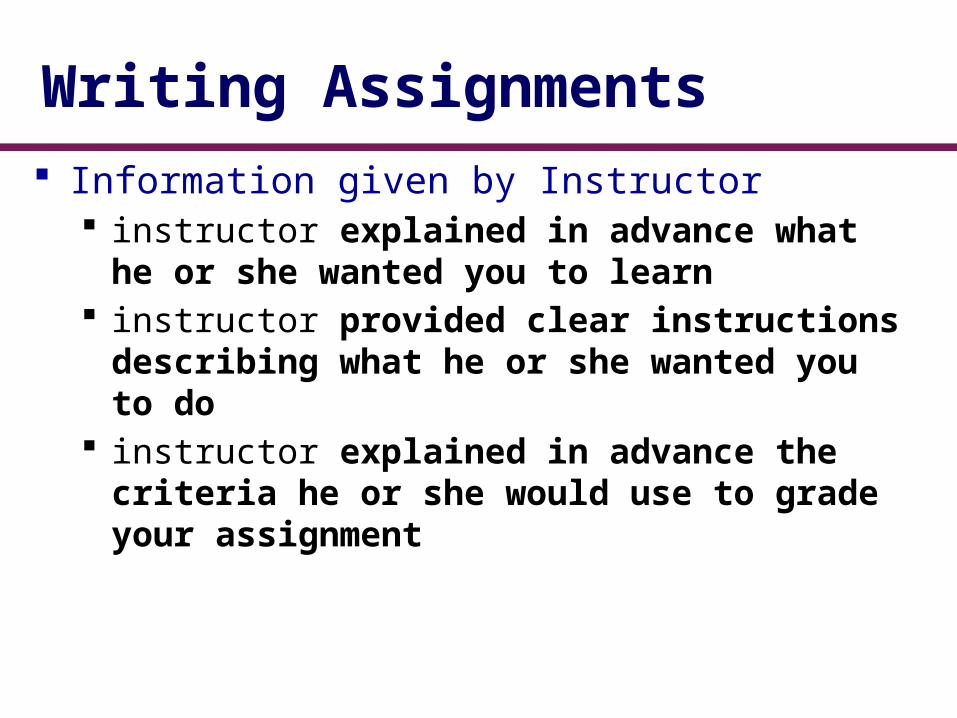
Writing Assignments Information given by Instructor
instructor explained in advance what he or she wanted you to learn
instructor provided clear instructions describing what he or she wanted you to do
instructor explained in advance the criteria he or she would use to grade your assignment
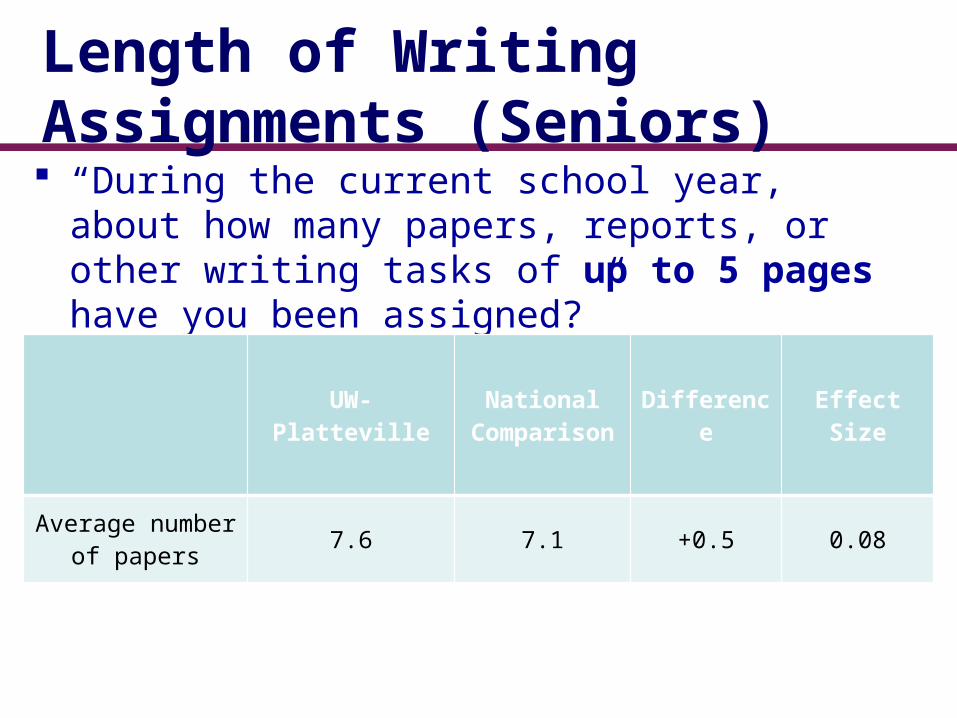
Length of Writing Assignments (Seniors) “During the current school year, about how
many papers, reports, or other writing tasks of up to 5 pages have you been assigned?”
UW-Platteville
National Compariso
n
Difference
Effect Size
Average number of papers 7.6 7.1 +0.5 0.08
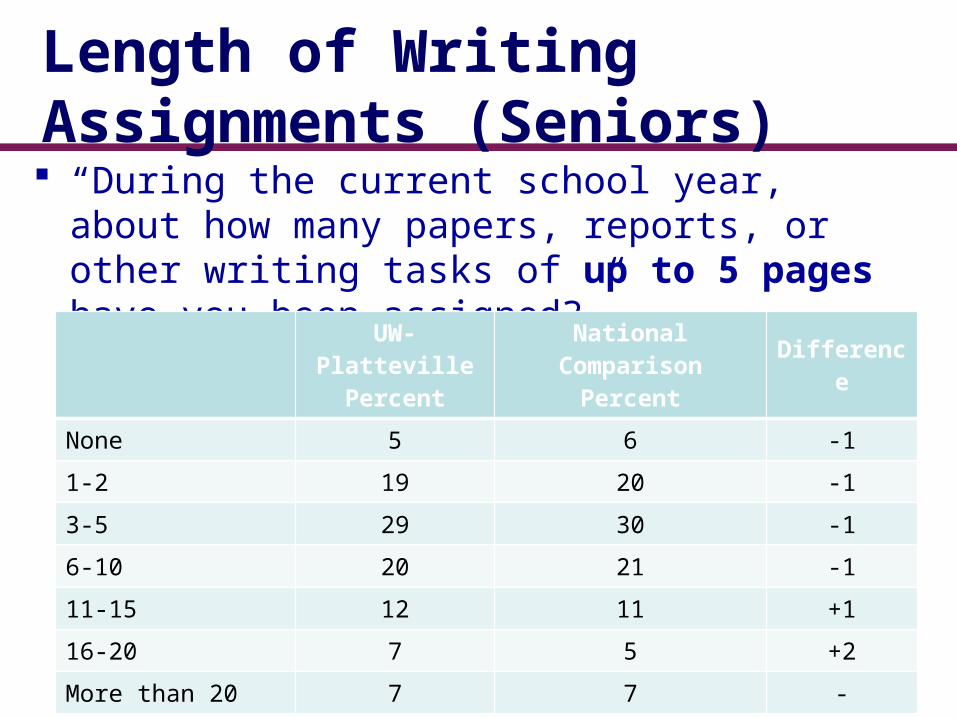
Length of Writing Assignments (Seniors) “During the current school year, about how
many papers, reports, or other writing tasks of up to 5 pages have you been assigned?”
UW-PlattevillePercent
National Comparison
Percent
Difference
None 5 6 -1
1-2 19 20 -1
3-5 29 30 -1
6-10 20 21 -1
11-15 12 11 +1
16-20 7 5 +2
More than 20 7 7 -
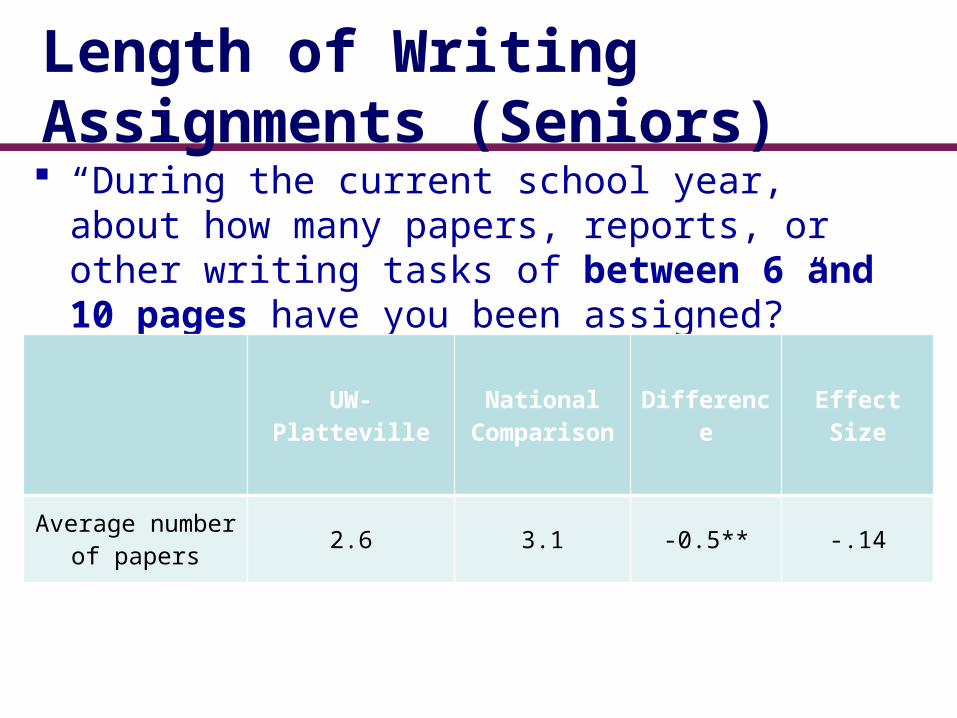
Length of Writing Assignments (Seniors) “During the current school year, about how
many papers, reports, or other writing tasks of between 6 and 10 pages have you been assigned?”
UW-Platteville
National Compariso
n
Difference
Effect Size
Average number of papers 2.6 3.1 -0.5** -.14

Length of Writing Assignments (Seniors) “During the current school year, about how
many papers, reports, or other writing tasks of between 6 and 10 pages have you been assigned?”UW-
PlattevillePercent
National Comparison
Percent
Difference
None 24 23 +1
1-2 45 38 +7
3-5 21 25 -4
6-10 8 9 -1
11-15 1 3 -2
16-20 0 1 -1
More than 20 1 1 -

Length of Writing Assignments (Seniors) “During the current school year, about how
many papers, reports, or other writing tasks of 11 pages or more have you been assigned?”
UW-Platteville
National Compariso
n
Difference
Effect Size
Average number of papers 1.5 1.7 -0.2 -0.06

Length of Writing Assignments (Seniors) (Back) “During the current school year, about how
many papers, reports, or other writing tasks of 11 pages or more have you been assigned?” UW-
PlattevillePercent
National Comparison
Percent
Difference
None 53 46 +7
1-2 33 38 -5
3-5 9 10 -1
6-10 2 3 -1
11-15 0 1 -1
16-20 0 1 -1
More than 20 1 1 -
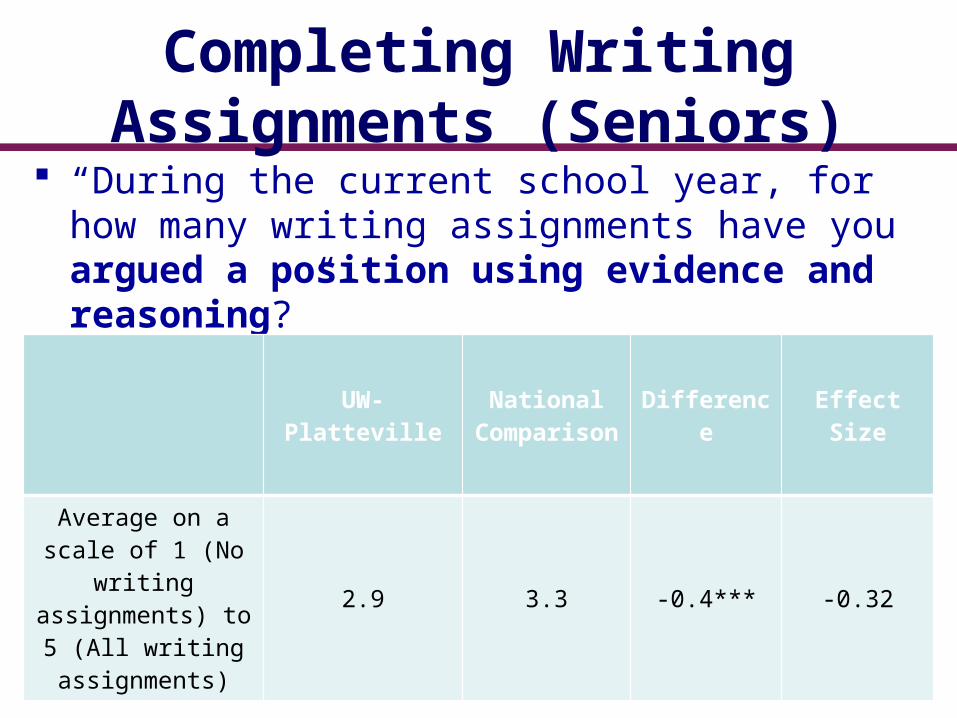
Completing Writing Assignments (Seniors)
“During the current school year, for how many writing assignments have you argued a position using evidence and reasoning?”
UW-Platteville
National Compariso
n
Difference
Effect Size
Average on a scale of 1 (No
writing assignments) to 5
(All writing assignments)
2.9 3.3 -0.4*** -0.32
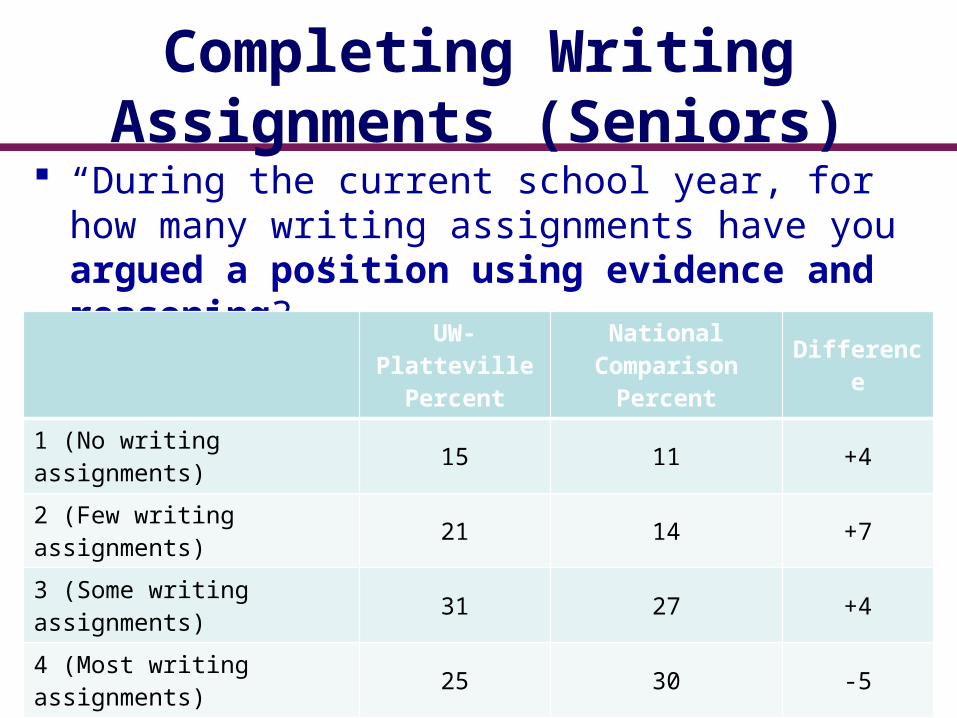
Completing Writing Assignments (Seniors)
“During the current school year, for how many writing assignments have you argued a position using evidence and reasoning?”
UW-PlattevillePercent
National Comparison
Percent
Difference
1 (No writing assignments) 15 11 +4
2 (Few writing assignments) 21 14 +7
3 (Some writing assignments) 31 27 +4
4 (Most writing assignments) 25 30 -5
5 (All writing assignments) 8 17 -9
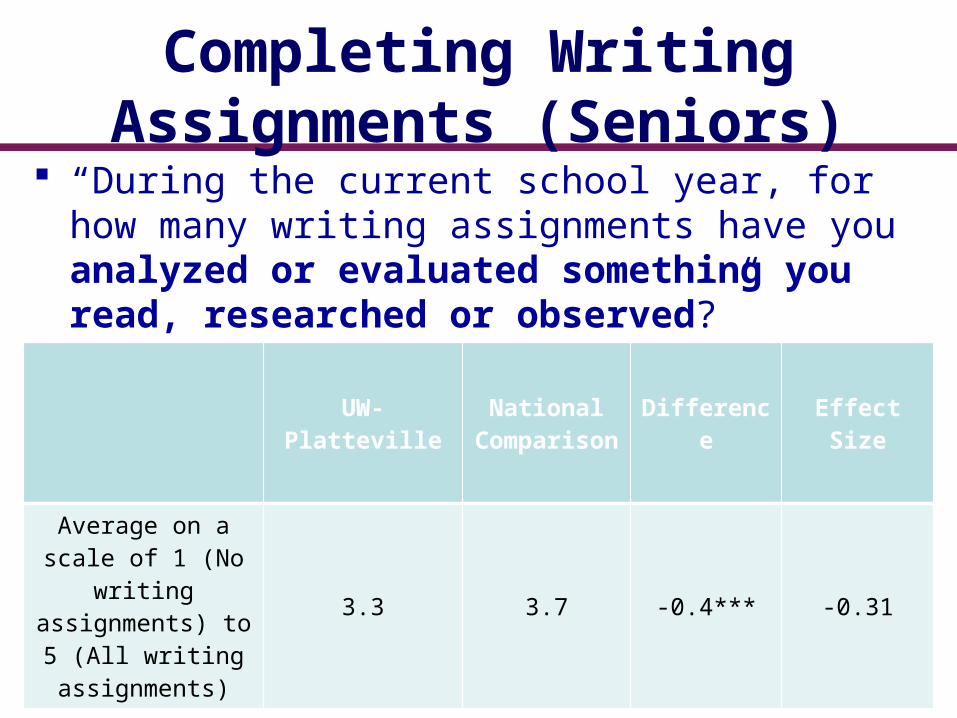
Completing Writing Assignments (Seniors)
“During the current school year, for how many writing assignments have you analyzed or evaluated something you read, researched or observed?”
UW-Platteville
National Compariso
n
Difference
Effect Size
Average on a scale of 1 (No
writing assignments) to 5
(All writing assignments)
3.3 3.7 -0.4*** -0.31

Completing Writing Assignments (Seniors)
“During the current school year, for how many writing assignments have you analyzed or evaluated something you read, researched or observed?”
UW-PlattevillePercent
National Comparison
Percent
Difference
1 (No writing assignments) 5 5 -
2 (Few writing assignments) 16 9 +7
3 (Some writing assignments) 33 24 +9
4 (Most writing assignments) 32 40 -8
5 (All writing assignments) 14 23 -9
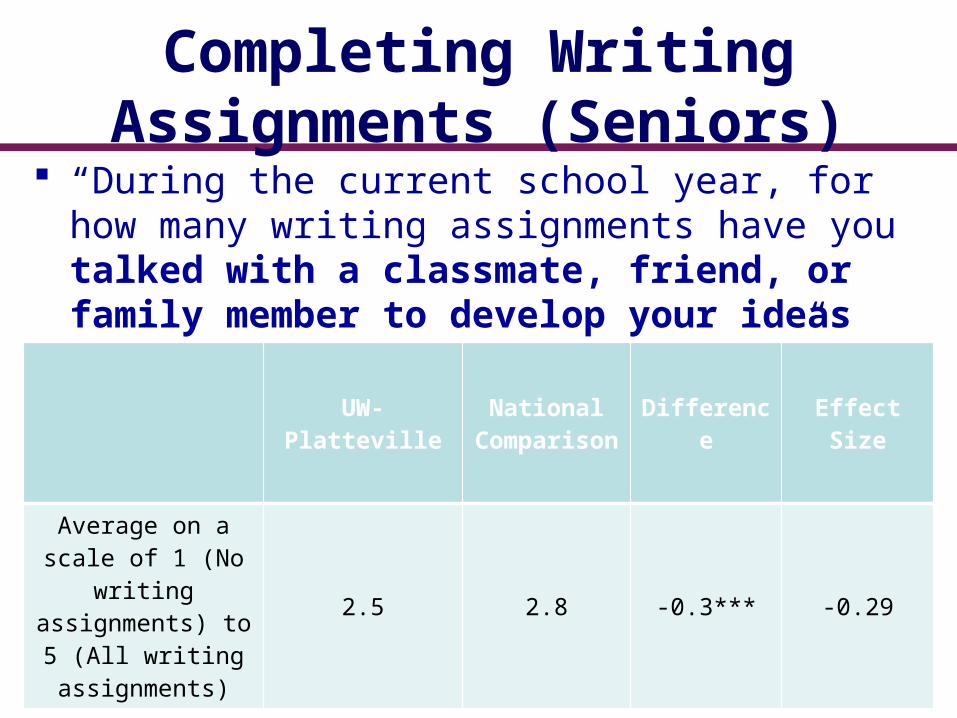
Completing Writing Assignments (Seniors)
“During the current school year, for how many writing assignments have you talked with a classmate, friend, or family member to develop your ideas before starting your assignment?”
UW-Platteville
National Compariso
n
Difference
Effect Size
Average on a scale of 1 (No
writing assignments) to 5
(All writing assignments)
2.5 2.8 -0.3*** -0.29
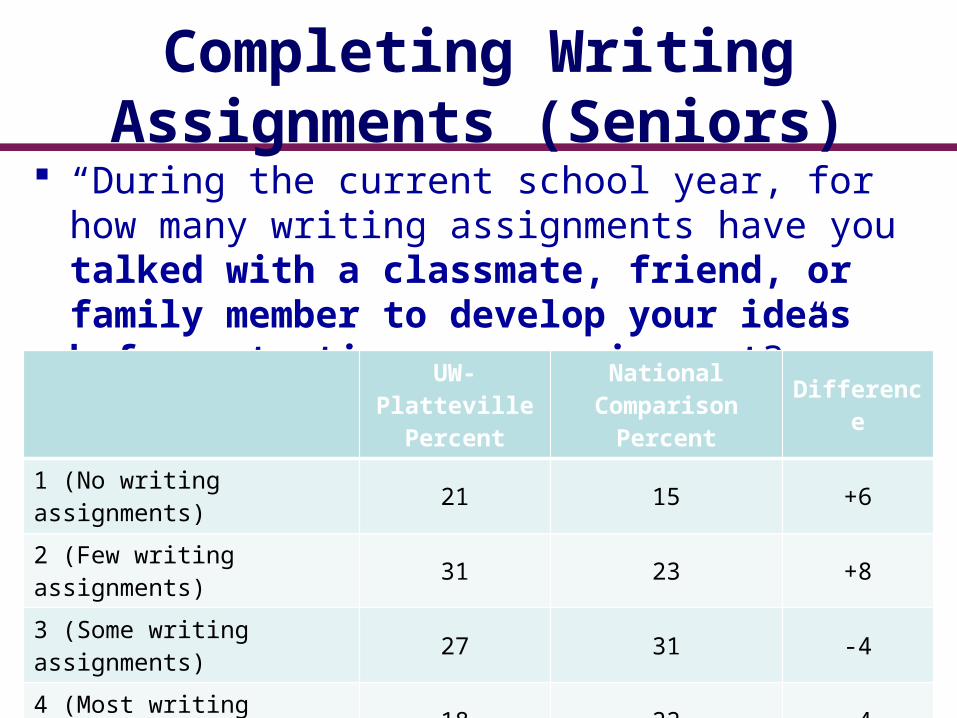
Completing Writing Assignments (Seniors)
“During the current school year, for how many writing assignments have you talked with a classmate, friend, or family member to develop your ideas before starting your assignment?”UW-
PlattevillePercent
National Comparison
Percent
Difference
1 (No writing assignments) 21 15 +6
2 (Few writing assignments) 31 23 +8
3 (Some writing assignments) 27 31 -4
4 (Most writing assignments) 18 22 -4
5 (All writing assignments) 3 8 -5
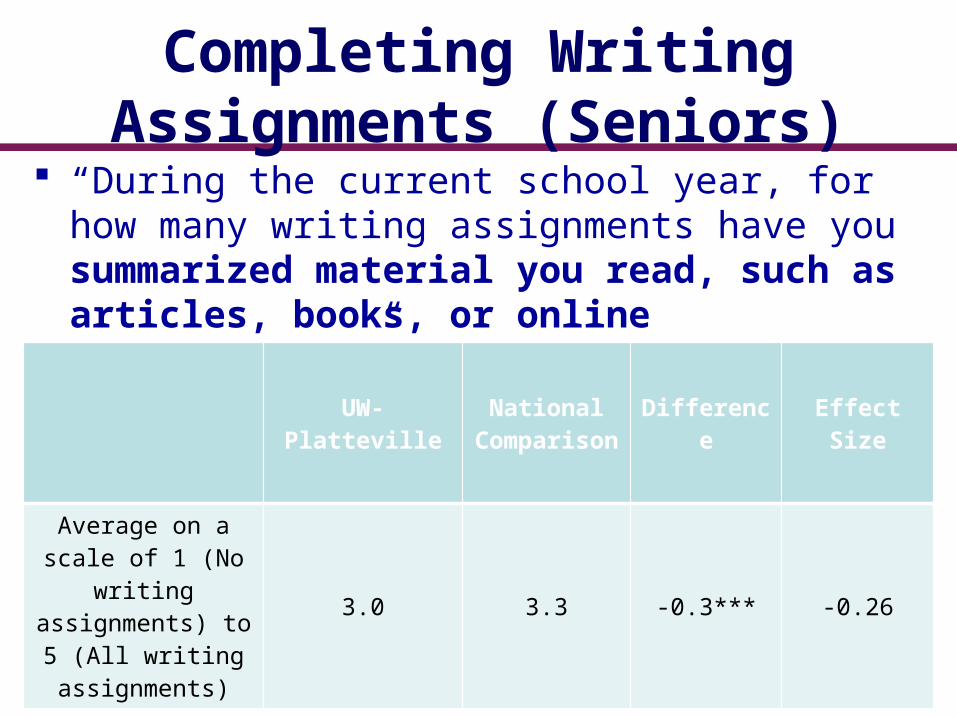
Completing Writing Assignments (Seniors)
“During the current school year, for how many writing assignments have you summarized material you read, such as articles, books, or online publications?”
UW-Platteville
National Compariso
n
Difference
Effect Size
Average on a scale of 1 (No
writing assignments) to 5
(All writing assignments)
3.0 3.3 -0.3*** -0.26
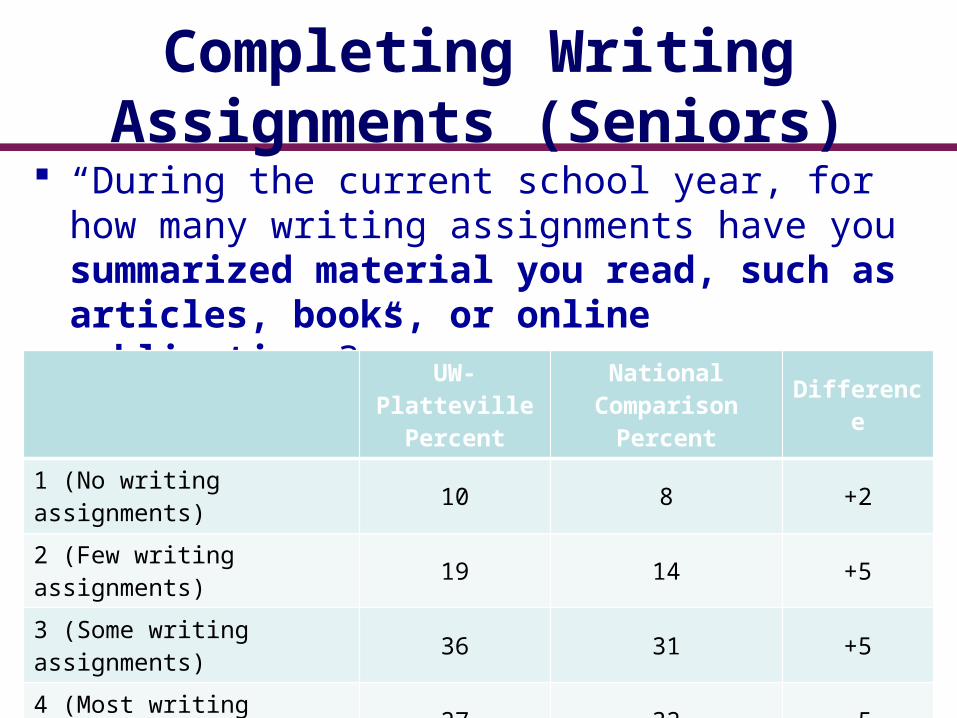
Completing Writing Assignments (Seniors)
“During the current school year, for how many writing assignments have you summarized material you read, such as articles, books, or online publications?”
UW-PlattevillePercent
National Comparison
Percent
Difference
1 (No writing assignments) 10 8 +2
2 (Few writing assignments) 19 14 +5
3 (Some writing assignments) 36 31 +5
4 (Most writing assignments) 27 32 -5
5 (All writing assignments) 8 15 -7
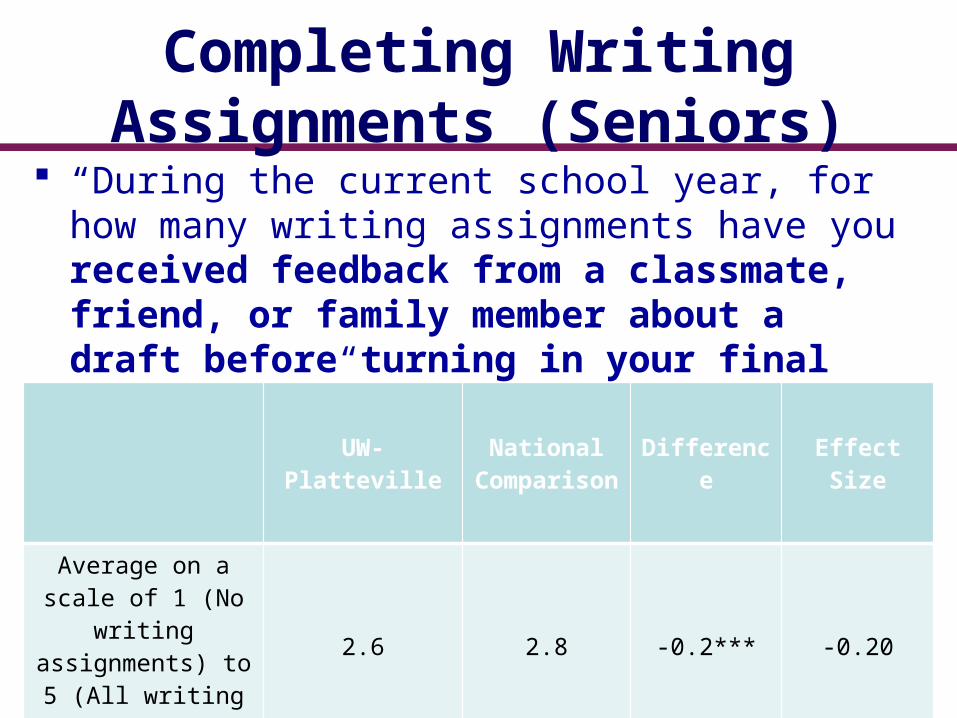
Completing Writing Assignments (Seniors)
“During the current school year, for how many writing assignments have you received feedback from a classmate, friend, or family member about a draft before turning in your final assignment?”
UW-Platteville
National Compariso
n
Difference
Effect Size
Average on a scale of 1 (No
writing assignments) to 5
(All writing assignments)
2.6 2.8 -0.2*** -0.20
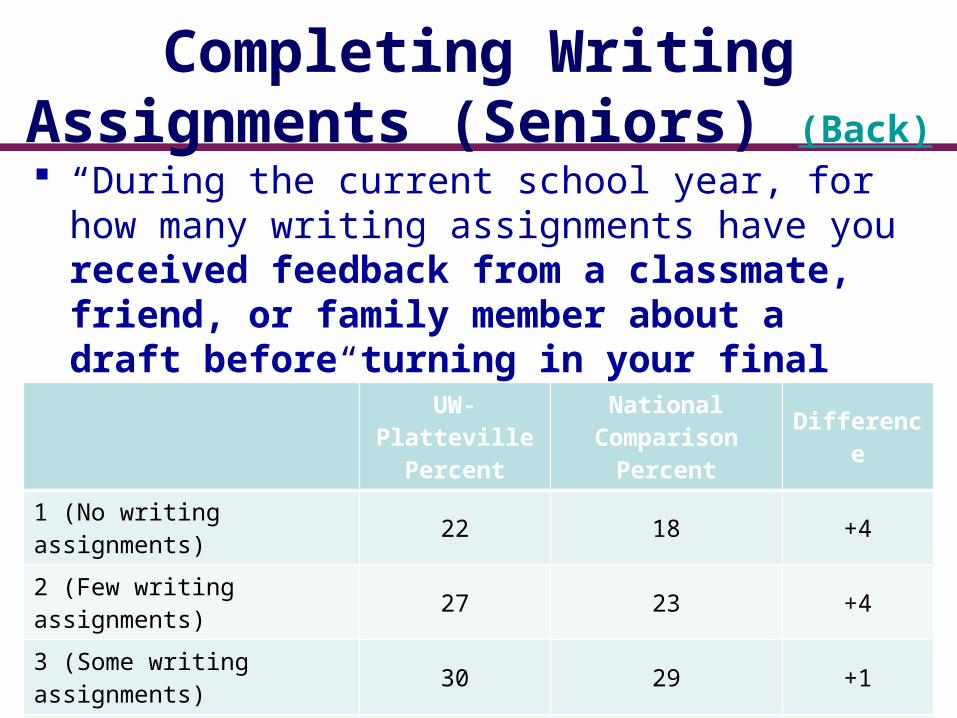
Completing Writing Assignments (Seniors) (Back) “During the current school year, for how
many writing assignments have you received feedback from a classmate, friend, or family member about a draft before turning in your final assignment?” UW-
PlattevillePercent
National Comparison
Percent
Difference
1 (No writing assignments) 22 18 +4
2 (Few writing assignments) 27 23 +4
3 (Some writing assignments) 30 29 +1
4 (Most writing assignments) 17 21 -4
5 (All writing assignments) 5 9 -4

Information Given by Instructor for Assignments
(Seniors) “During the current school year, for how many of your writing assignments has your instructor explained in advance what he or she wanted you to learn?”
UW-Platteville
National Compariso
n
Difference
Effect Size
Average on a scale of 1 (No
writing assignments) to 5
(All writing assignments)
3.5 3.7 -0.2*** -0.20
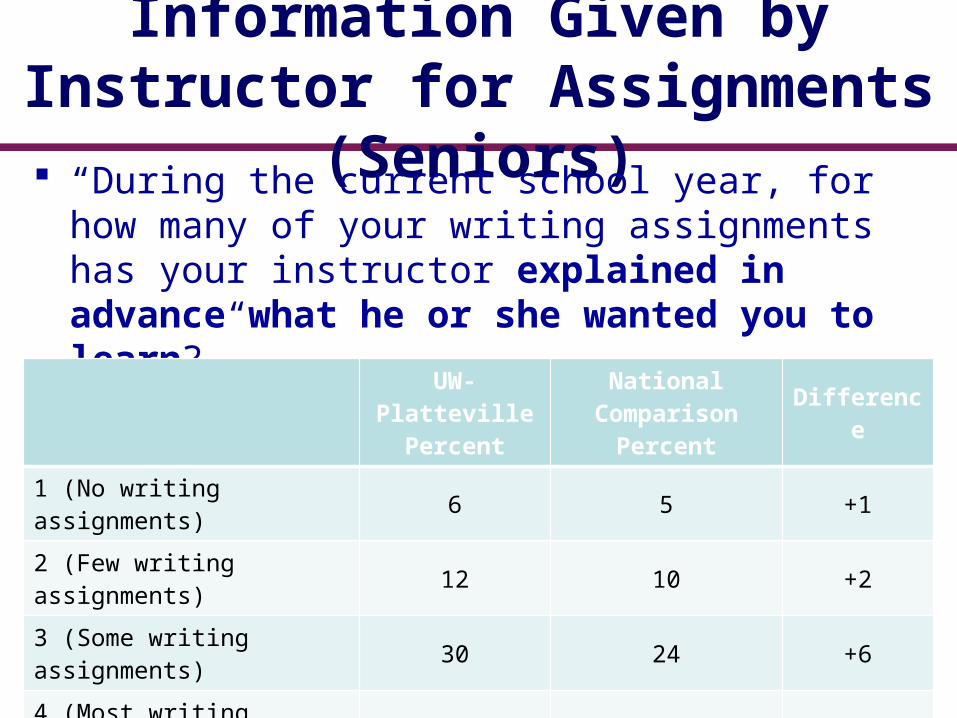
Information Given by Instructor for Assignments
(Seniors) “During the current school year, for how many of your writing assignments has your instructor explained in advance what he or she wanted you to learn?”
UW-PlattevillePercent
National Comparison
Percent
Difference
1 (No writing assignments) 6 5 +1
2 (Few writing assignments) 12 10 +2
3 (Some writing assignments) 30 24 +6
4 (Most writing assignments) 34 34 -
5 (All writing assignments) 17 27 -10

Information Given by Instructor for Assignments
(Seniors) “During the current school year, for how many of your writing assignments has your instructor provided clear instructions describing what he or she wanted you to do?”
UW-Platteville
National Compariso
n
Difference
Effect Size
Average on a scale of 1 (No
writing assignments) to 5
(All writing assignments)
3.8 4.0 -0.2*** -0.18

Information Given by Instructor for Assignments
(Seniors) “During the current school year, for how many of your writing assignments has your instructor provided clear instructions describing what he or she wanted you to do?”
UW-PlattevillePercent
National Comparison
Percent
Difference
1 (No writing assignments) 2 3 -1
2 (Few writing assignments) 9 5 +4
3 (Some writing assignments) 17 15 +2
4 (Most writing assignments) 50 45 +5
5 (All writing assignments) 22 32 -10

Information Given by Instructor for Assignments
(Seniors) “During the current school year, for how many of your writing assignments has your instructor explained in advance the criteria he or she would use to grade your assignment?”
UW-Platteville
National Compariso
n
Difference
Effect Size
Average on a scale of 1 (No
writing assignments) to 5
(All writing assignments)
3.8 4.0 -0.2*** -0.18
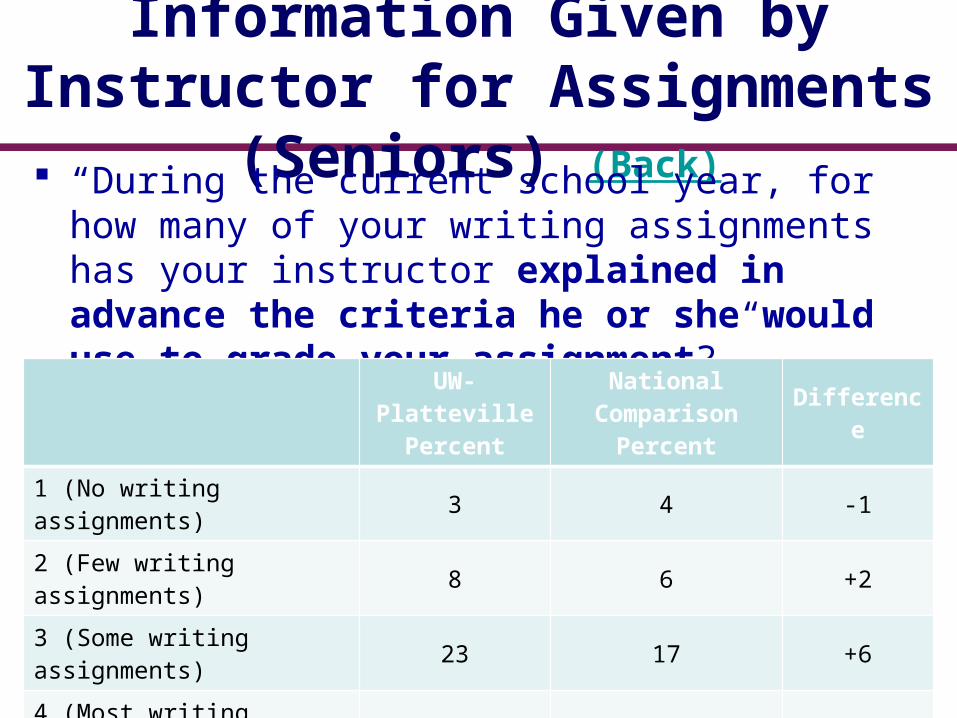
Information Given by Instructor for Assignments
(Seniors) (Back) “During the current school year, for how many of your writing assignments has your instructor explained in advance the criteria he or she would use to grade your assignment?”
UW-PlattevillePercent
National Comparison
Percent
Difference
1 (No writing assignments) 3 4 -1
2 (Few writing assignments) 8 6 +2
3 (Some writing assignments) 23 17 +6
4 (Most writing assignments) 42 36 +6
5 (All writing assignments) 24 37 -13

“During the current school year, for how many writing assignments have you analyzed or evaluated something you read, researched, or observed?”
Completing Writing Assignments (First-Year)
UW-Platteville
National Compariso
n
Difference
Effect Size
Average on a scale of 1 (No
writing assignments) to 5
(All writing assignments)
3.3 3.6 -0.3*** -0.30

Completing Writing Assignments (First-Year)
“During the current school year, for how many writing assignments have you analyzed or evaluated something you read, researched, or observed?”
UW-PlattevillePercent
National Comparison
Percent
Difference
1 (No writing assignments) 2 4 -2
2 (Few writing assignments) 18 10 +8
3 (Some writing assignments) 38 26 +12
4 (Most writing assignments) 32 40 -8
5 (All writing assignments) 10 20 -10
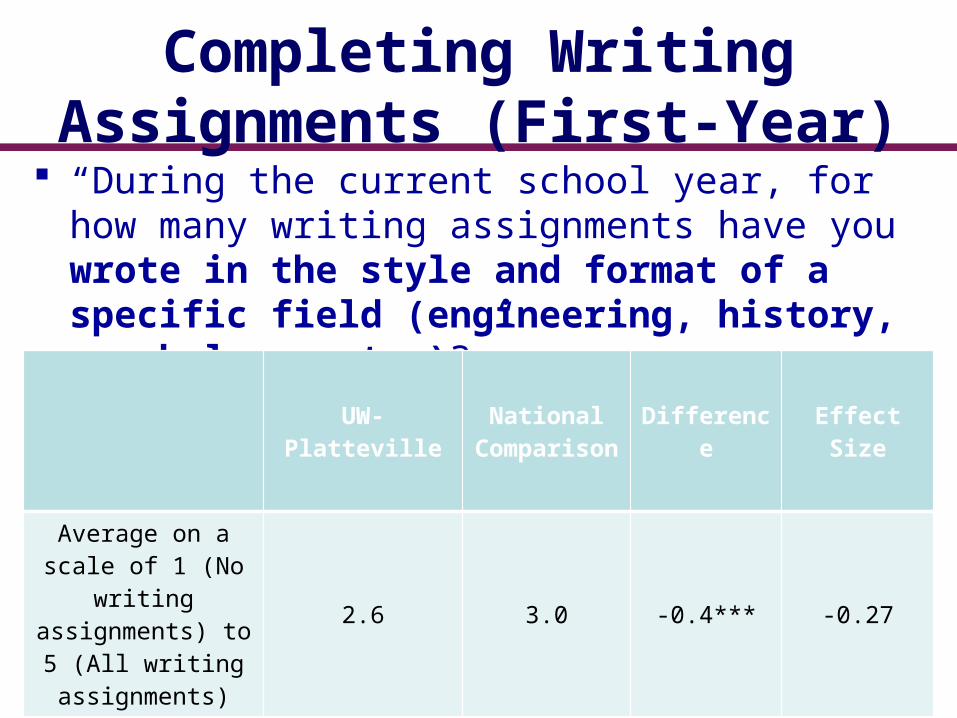
Completing Writing Assignments (First-Year)
“During the current school year, for how many writing assignments have you wrote in the style and format of a specific field (engineering, history, psychology, etc.)?”
UW-Platteville
National Compariso
n
Difference
Effect Size
Average on a scale of 1 (No
writing assignments) to 5
(All writing assignments)
2.6 3.0 -0.4*** -0.27

Completing Writing Assignments (First-Year)
“During the current school year, for how many writing assignments have you wrote in the style and format of a specific field (engineering, history, psychology, etc.)?” UW-
PlattevillePercent
National Comparison
Percent
Difference
1 (No writing assignments) 22 19 +3
2 (Few writing assignments) 30 18 +12
3 (Some writing assignments) 23 25 -2
4 (Most writing assignments) 19 23 -4
5 (All writing assignments) 7 15 -8
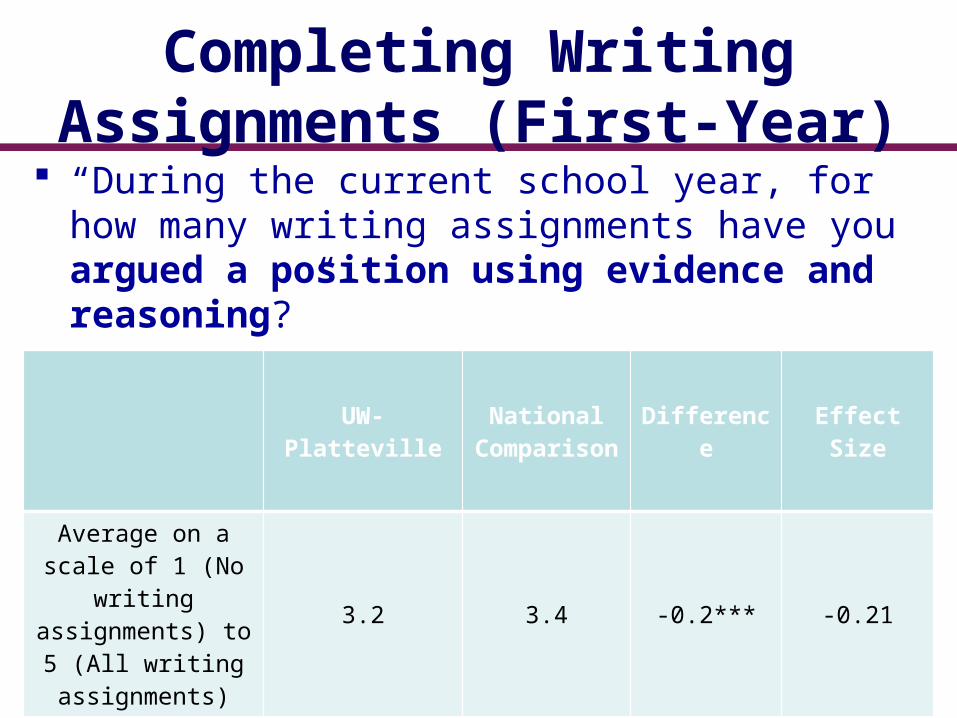
Completing Writing Assignments (First-Year)
“During the current school year, for how many writing assignments have you argued a position using evidence and reasoning?”
UW-Platteville
National Compariso
n
Difference
Effect Size
Average on a scale of 1 (No
writing assignments) to 5
(All writing assignments)
3.2 3.4 -0.2*** -0.21
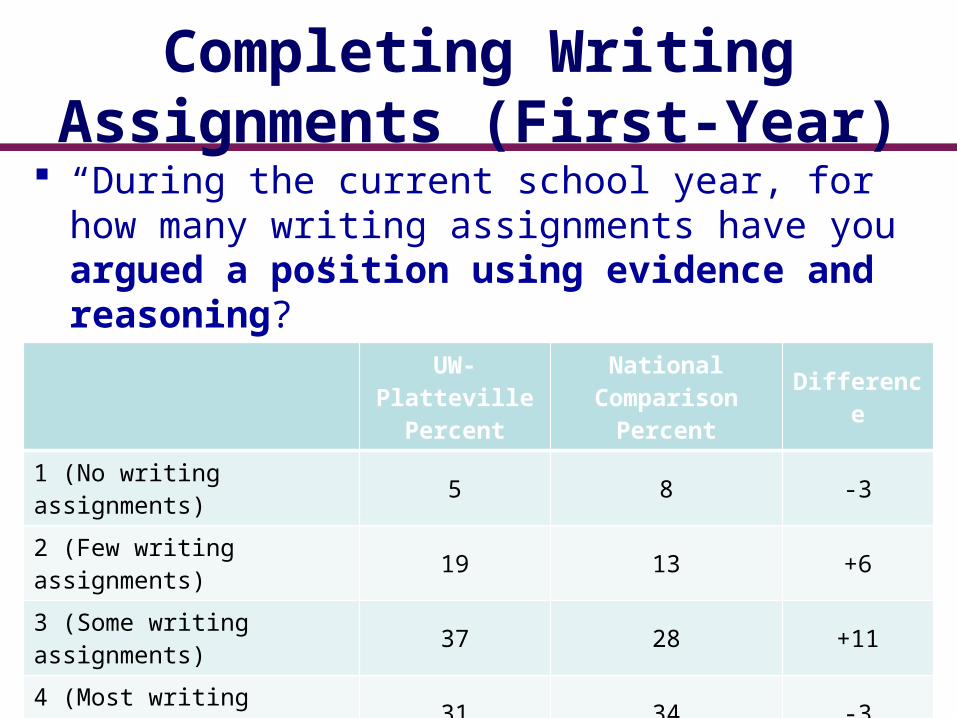
Completing Writing Assignments (First-Year)
“During the current school year, for how many writing assignments have you argued a position using evidence and reasoning?”
UW-PlattevillePercent
National Comparison
Percent
Difference
1 (No writing assignments) 5 8 -3
2 (Few writing assignments) 19 13 +6
3 (Some writing assignments) 37 28 +11
4 (Most writing assignments) 31 34 -3
5 (All writing assignments) 7 18 -11
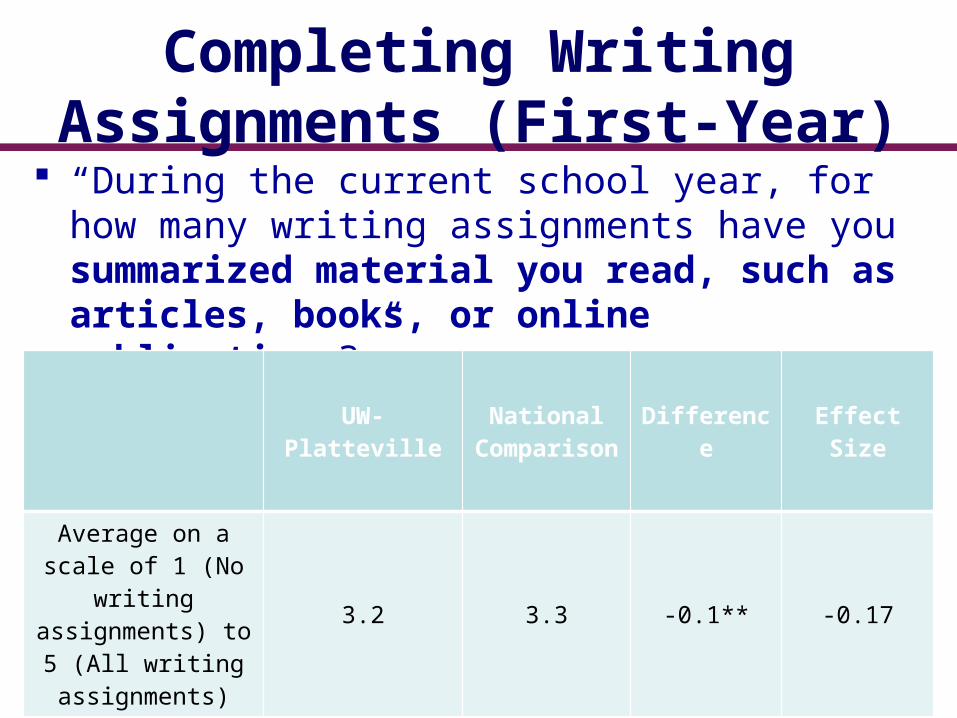
Completing Writing Assignments (First-Year)
“During the current school year, for how many writing assignments have you summarized material you read, such as articles, books, or online publications?”
UW-Platteville
National Compariso
n
Difference
Effect Size
Average on a scale of 1 (No
writing assignments) to 5
(All writing assignments)
3.2 3.3 -0.1** -0.17

Completing Writing Assignments (First-Year)
“During the current school year, for how many writing assignments have you summarized material you read, such as articles, books, or online publications?”
UW-PlattevillePercent
National Comparison
Percent
Difference
1 (No writing assignments) 4 6 -2
2 (Few writing assignments) 21 15 +6
3 (Some writing assignments) 38 32 +6
4 (Most writing assignments) 31 33 -2
5 (All writing assignments) 6 14 -8
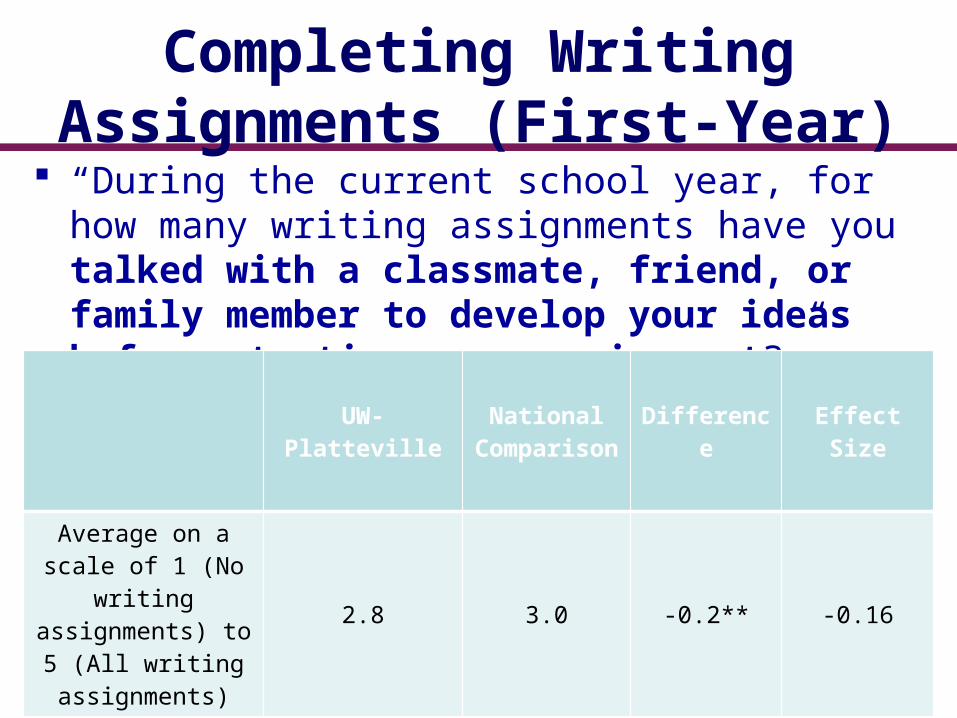
Completing Writing Assignments (First-Year)
“During the current school year, for how many writing assignments have you talked with a classmate, friend, or family member to develop your ideas before starting your assignment?”
UW-Platteville
National Compariso
n
Difference
Effect Size
Average on a scale of 1 (No
writing assignments) to 5
(All writing assignments)
2.8 3.0 -0.2** -0.16
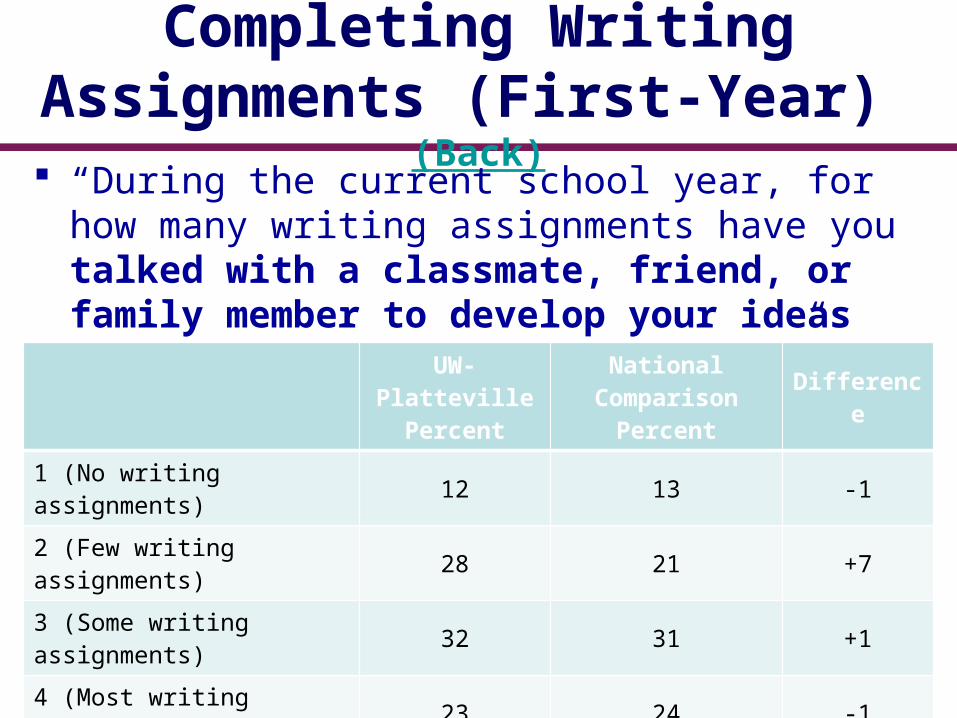
Completing Writing Assignments (First-Year)
(Back) “During the current school year, for how many writing assignments have you talked with a classmate, friend, or family member to develop your ideas before starting your assignment?”UW-
PlattevillePercent
National Comparison
Percent
Difference
1 (No writing assignments) 12 13 -1
2 (Few writing assignments) 28 21 +7
3 (Some writing assignments) 32 31 +1
4 (Most writing assignments) 23 24 -1
5 (All writing assignments) 5 11 -6
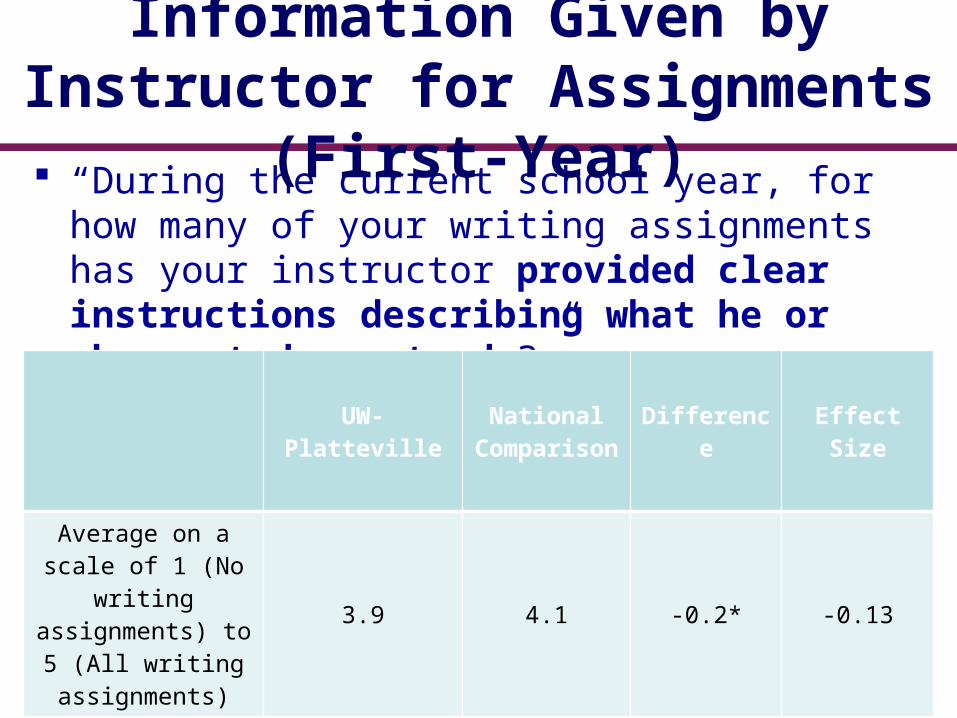
“During the current school year, for how many of your writing assignments has your instructor provided clear instructions describing what he or she wanted you to do?”
Information Given by Instructor for Assignments
(First-Year)
UW-Platteville
National Compariso
n
Difference
Effect Size
Average on a scale of 1 (No
writing assignments) to 5
(All writing assignments)
3.9 4.1 -0.2* -0.13
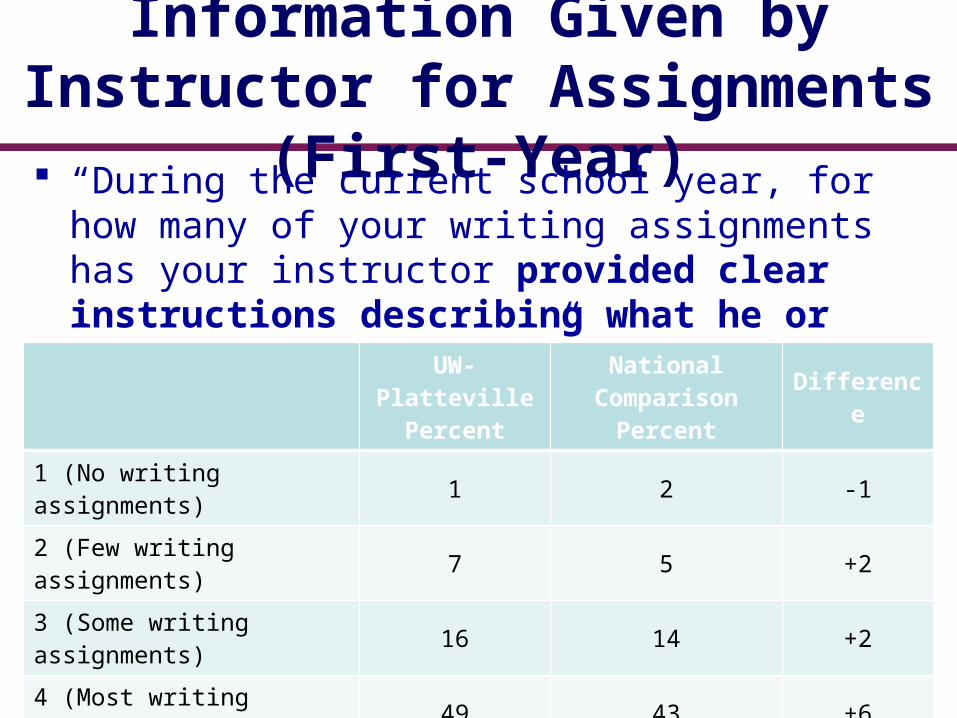
Information Given by Instructor for Assignments
(First-Year) “During the current school year, for how many of your writing assignments has your instructor provided clear instructions describing what he or she wanted you to do?” UW-
PlattevillePercent
National Comparison
Percent
Difference
1 (No writing assignments) 1 2 -1
2 (Few writing assignments) 7 5 +2
3 (Some writing assignments) 16 14 +2
4 (Most writing assignments) 49 43 +6
5 (All writing assignments) 27 36 -9
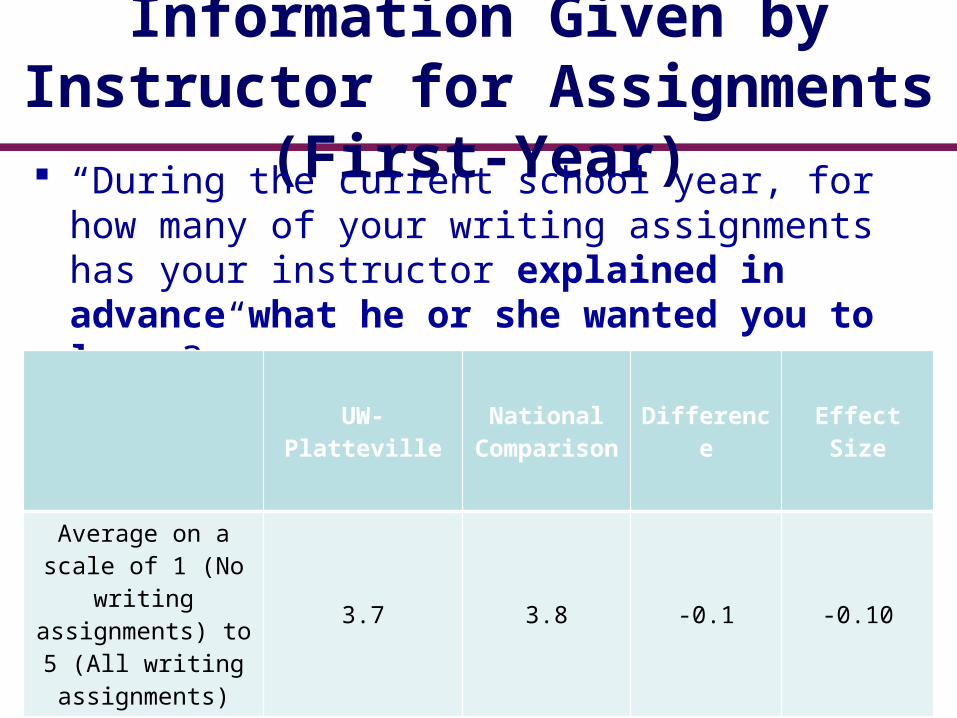
Information Given by Instructor for Assignments
(First-Year) “During the current school year, for how many of your writing assignments has your instructor explained in advance what he or she wanted you to learn?”
UW-Platteville
National Compariso
n
Difference
Effect Size
Average on a scale of 1 (No
writing assignments) to 5
(All writing assignments)
3.7 3.8 -0.1 -0.10

Information Given by Instructor for Assignments
(First-Year) “During the current school year, for how many of your writing assignments has your instructor explained in advance what he or she wanted you to learn?”
UW-PlattevillePercent
National Comparison
Percent
Difference
1 (No writing assignments) 3 4 -1
2 (Few writing assignments) 10 9 +1
3 (Some writing assignments) 26 23 +3
4 (Most writing assignments) 38 33 +5
5 (All writing assignments) 22 30 -8
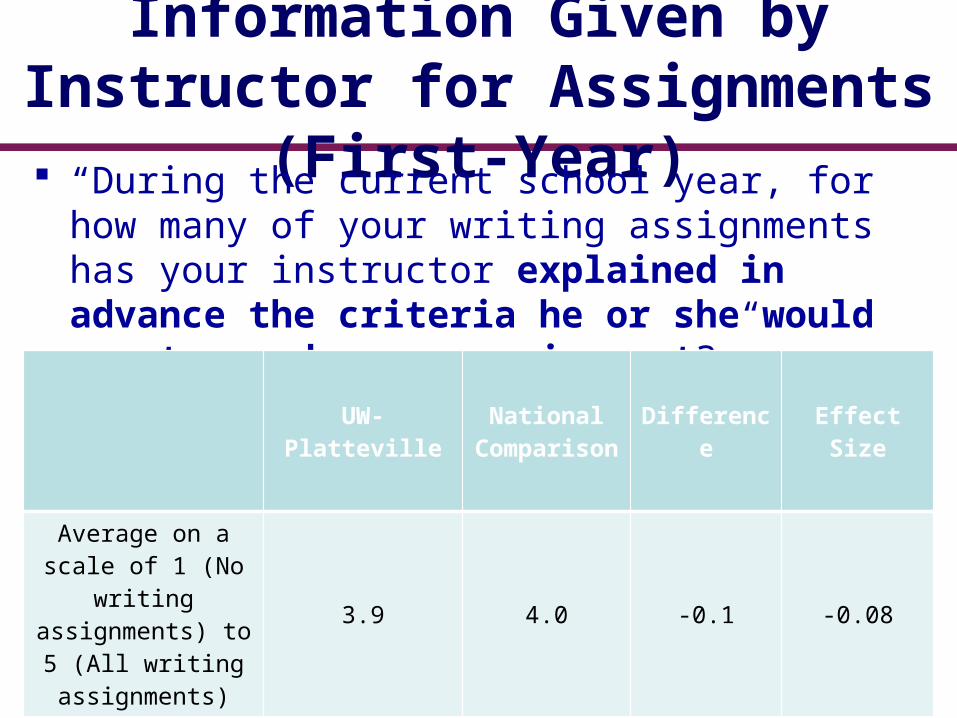
Information Given by Instructor for Assignments
(First-Year) “During the current school year, for how many of your writing assignments has your instructor explained in advance the criteria he or she would use to grade your assignment?”
UW-Platteville
National Compariso
n
Difference
Effect Size
Average on a scale of 1 (No
writing assignments) to 5
(All writing assignments)
3.9 4.0 -0.1 -0.08

Information Given by Instructor for Assignments
(First-Year) (Back) “During the current school year, for how many of your writing assignments has your instructor explained in advance the criteria he or she would use to grade your assignment?”UW-
PlattevillePercent
National Comparison
Percent
Difference
1 (No writing assignments) 2 3 -1
2 (Few writing assignments) 7 7 -
3 (Some writing assignments) 21 17 +4
4 (Most writing assignments) 35 33 +2
5 (All writing assignments) 34 40 -6