accelerated math 7 second quarter unit 3: equivalent ... math 7 curr... · accelerated math 7...
TRANSCRIPT
HIGLEY UNIFIED SCHOOL DISTRICT INSTRUCTIONAL ALIGNMENT
Accelerated Math 7 Second Quarter
Unit 3: Equivalent Expressions and Equations Topic B: Solving Equations (Continued)
In Topic B, students use linear equations and inequalities to solve problems. They continue to use bar diagrams from earlier grades where they see fit but will quickly discover that some problems would more reasonably be solved algebraically (as in the case of large numbers). Guiding students to arrive at this realization on their own develops the need for algebra. This algebraic approach builds upon work in Grade 6 with equations (6.EE.B.6, 6.EE.B.7) to now include multi-step equations and inequalities containing rational numbers (7.EE.B.3, 7.EE.B.4). Students translate word problems into algebraic equations and become proficient at solving equations of the form 𝑝𝑝𝑝𝑝 + 𝑞𝑞 = 𝑟𝑟 and 𝑝𝑝(𝑝𝑝 + 𝑞𝑞) = 𝑟𝑟, where 𝑝𝑝, 𝑞𝑞, and 𝑟𝑟, are specific rational numbers (7.EE.B.4a). As they become fluent in generating algebraic solutions, students identify the operations, inverse operations, and order of steps, comparing these to an arithmetic solution. In this topic, students utilize this knowledge to simplify and solve equations where linear expressions are on either or both sides of the equation (8.EE.C.7b). Students should also connect solving linear equations to solving equations of the form x2= p and x3 = p because of the use of inverse operations (8.EE.A.2). Incorporating the Equations and Expression standards with the Number System standards provides context and motivation for learning about irrational numbers: for instance, to find the side length of a square of a certain area and use this understanding to solve equations involving perfect squares and cubes. Through the course of this study, students build on their knowledge of solving equations to realize that there may be a unique solution, infinitely many solutions, or no solution (8.EE.C.7a). Students solve problems involving consecutive numbers, total cost, age comparisons, distance/rate/time, area and perimeter. Solving equations and inequalities with a variable is all about numbers, and students are challenged with the goal of finding the number(s) that makes the equation true. When given in context, students recognize that values exist, and it is simply their job to discover them. Throughout Topic B students must write and solve linear equations in real-world and mathematical situations.
Big Idea:
• Mathematical expressions, equations, inequalities and graphs are used to represent and solve real-world and mathematical problems. • Linear equations can have one solution, infinitely many solutions, or no solution. • Rules for arithmetic and algebra can be used together with notations of equivalence to transform equations. • When one expression has a different value than a related expression, an inequality provides a way to show that relationship between the expressions:
the value of one expression is greater than (or greater than or equal to) the value of the other expression instead of being equal. • Variables may be used to represent a specific number, or, in some situations, to represent all numbers in a specified set. • Solving algebraic equations/inequalities is the process of determining the number(s) that, when substituted for the variable, result in a true sentence. • Inequalities have either infinitely many solutions or no solutions.
Essential Questions:
• What are some possible real-life situations to which there may be more than one solution? • How does the ongoing use of fractions and decimals apply to real-life situations? • What do equality and inequality symbols represent? • How do the algebraic properties help in solving equations? • How does the substitution process help in solving problems? • Why are variables used in equations/inequalities? • What might a variable represent in a given situation? • How do we express a relationship mathematically? • How do we determine the value of an unknown quantity?
6/10/2016
• Where in the real world can you find and what are the important attributes of linear patterns and linear relationships?
Vocabulary coefficients, like terms, distributive property, factor, multiplicative property of zero, variable, additive identity, number sentence, equation, solution, inequality, linear equation, Multiplication Property of Equality, Addition Property of Equality, inverse operations, perfect squares, perfect cubes
Grade
Domain
Standard
AZ College and Career Readiness Standards Explanations & Examples Resources
8 EE 7ab C. Analyze and solve linear equations and pairs of simultaneous linear equations Solve linear equations in one variable.
a. Give examples of linear equations in one variable with one solution, infinitely many solutions, or no solutions. Show which of these possibilities is the case by successively transforming the given equation into simpler forms, until an equivalent equation of the form x = a, a = a, or a = b results (where a and b are different numbers).
b. Solve linear equations with rational number coefficients, including equations whose solutions require expanding expressions using the distributive property and collecting like terms.
8.MP.2. Reason abstractly and quantitatively. 8.MP.5. Use appropriate tools strategically. 8.MP.6. Attend to precision. 8.MP.7. Look for and make use of structure.
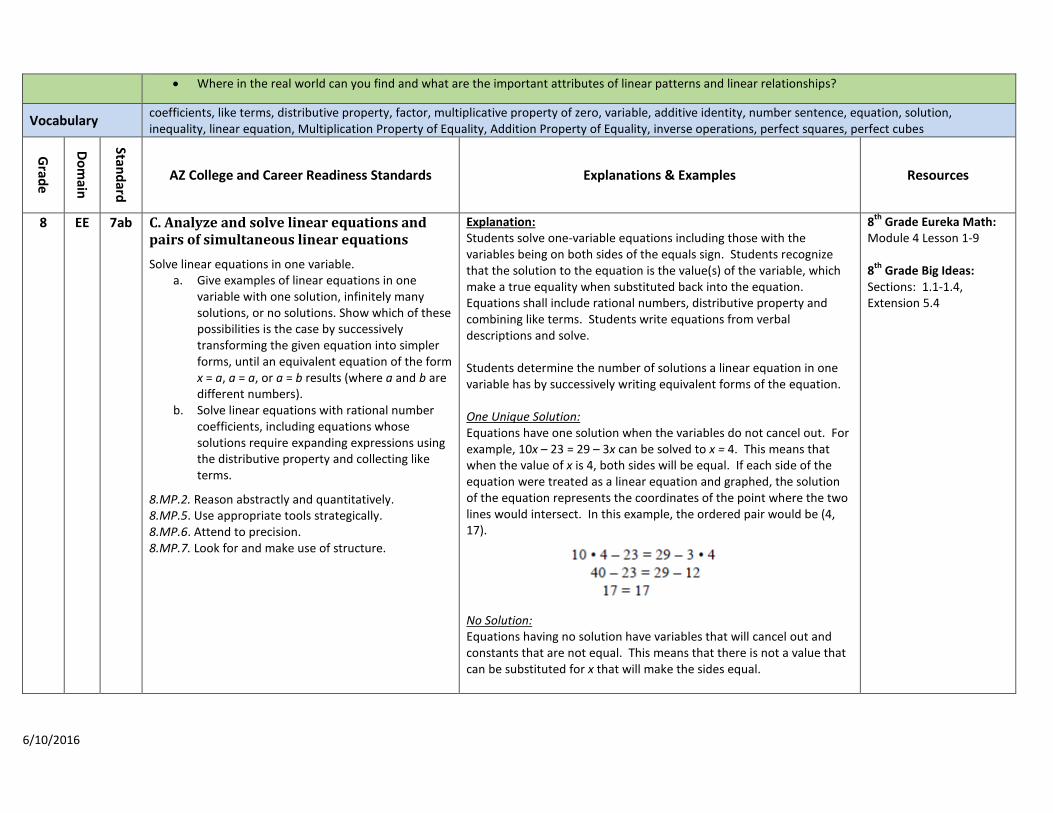
Explanation: Students solve one-variable equations including those with the variables being on both sides of the equals sign. Students recognize that the solution to the equation is the value(s) of the variable, which make a true equality when substituted back into the equation. Equations shall include rational numbers, distributive property and combining like terms. Students write equations from verbal descriptions and solve. Students determine the number of solutions a linear equation in one variable has by successively writing equivalent forms of the equation. One Unique Solution: Equations have one solution when the variables do not cancel out. For example, 10x – 23 = 29 – 3x can be solved to x = 4. This means that when the value of x is 4, both sides will be equal. If each side of the equation were treated as a linear equation and graphed, the solution of the equation represents the coordinates of the point where the two lines would intersect. In this example, the ordered pair would be (4, 17).
No Solution: Equations having no solution have variables that will cancel out and constants that are not equal. This means that there is not a value that can be substituted for x that will make the sides equal.
8th Grade Eureka Math: Module 4 Lesson 1-9 8th Grade Big Ideas: Sections: 1.1-1.4, Extension 5.4
6/10/2016
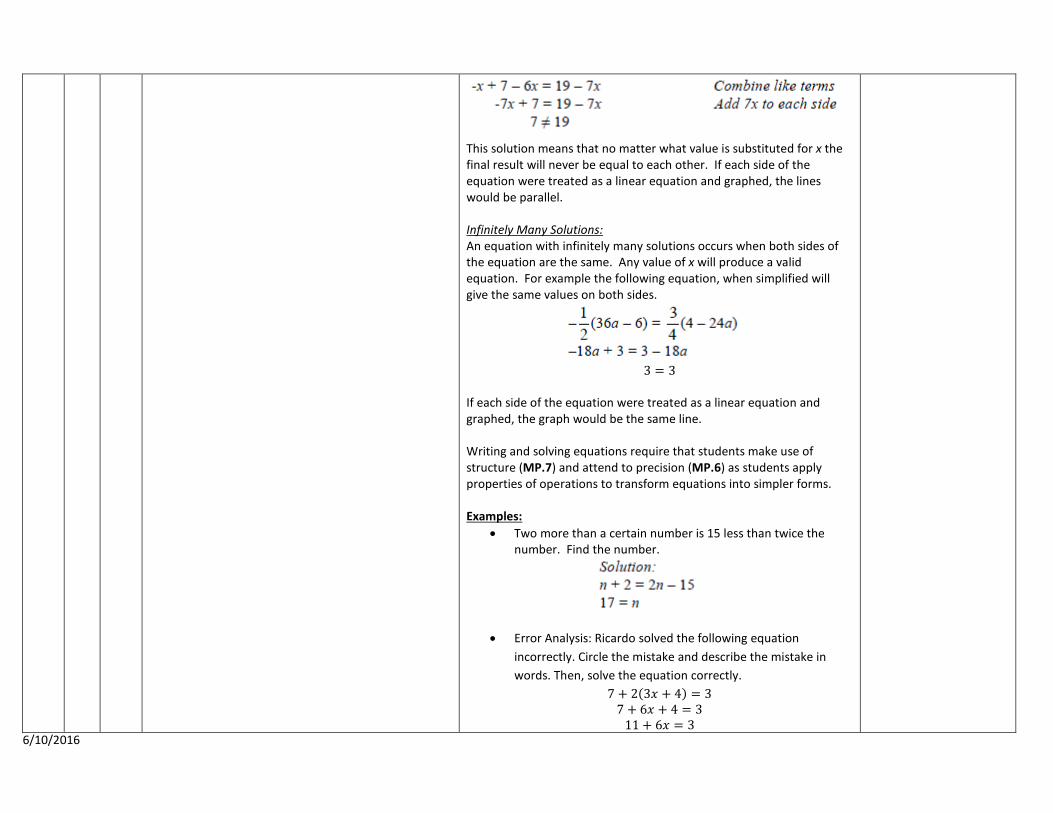
This solution means that no matter what value is substituted for x the final result will never be equal to each other. If each side of the equation were treated as a linear equation and graphed, the lines would be parallel. Infinitely Many Solutions: An equation with infinitely many solutions occurs when both sides of the equation are the same. Any value of x will produce a valid equation. For example the following equation, when simplified will give the same values on both sides.
3 = 3
If each side of the equation were treated as a linear equation and graphed, the graph would be the same line. Writing and solving equations require that students make use of structure (MP.7) and attend to precision (MP.6) as students apply properties of operations to transform equations into simpler forms. Examples:
• Two more than a certain number is 15 less than twice the number. Find the number.
• Error Analysis: Ricardo solved the following equation incorrectly. Circle the mistake and describe the mistake in words. Then, solve the equation correctly.
7 + 2(3𝑝𝑝 + 4) = 3 7 + 6𝑝𝑝 + 4 = 3
11 + 6𝑝𝑝 = 3 6/10/2016
6𝑝𝑝 = −8
𝑝𝑝 = −86
𝑝𝑝 = −43
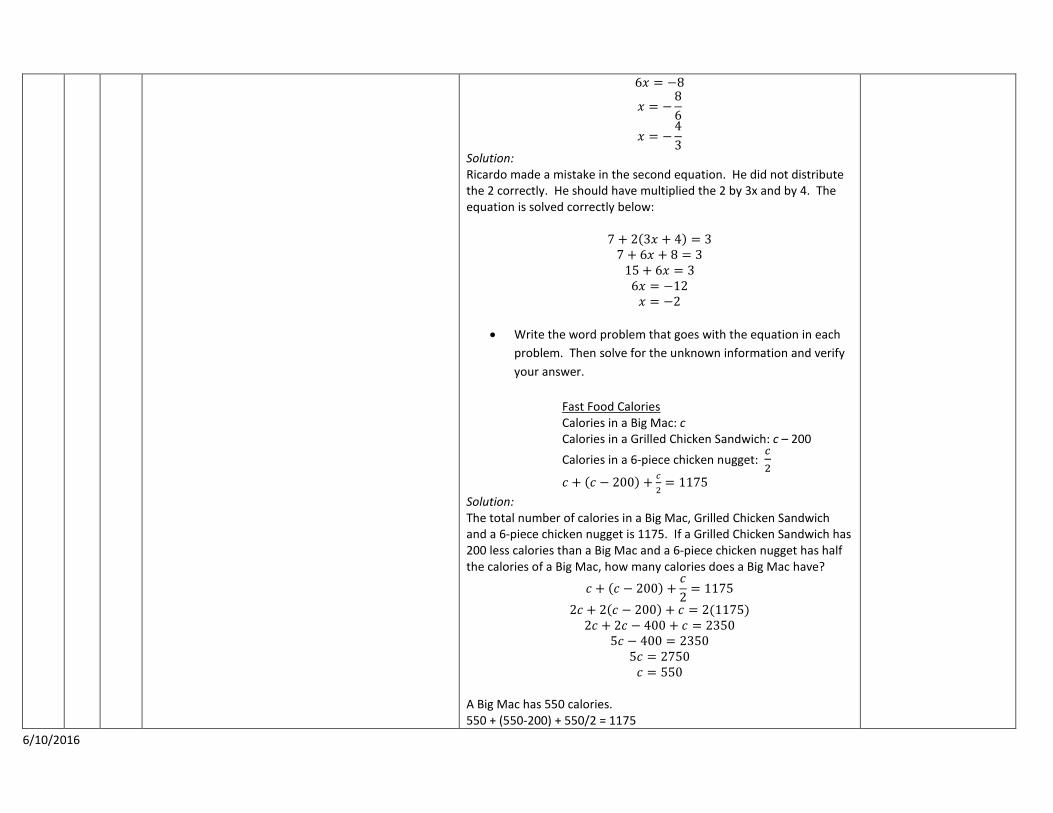
Solution: Ricardo made a mistake in the second equation. He did not distribute the 2 correctly. He should have multiplied the 2 by 3x and by 4. The equation is solved correctly below:
7 + 2(3𝑝𝑝 + 4) = 3 7 + 6𝑝𝑝 + 8 = 3
15 + 6𝑝𝑝 = 3 6𝑝𝑝 = −12 𝑝𝑝 = −2
• Write the word problem that goes with the equation in each
problem. Then solve for the unknown information and verify your answer.
Fast Food Calories Calories in a Big Mac: c Calories in a Grilled Chicken Sandwich: c – 200 Calories in a 6-piece chicken nugget:
𝑐𝑐2
𝑐𝑐 + (𝑐𝑐 − 200) + 𝑐𝑐2
= 1175 Solution: The total number of calories in a Big Mac, Grilled Chicken Sandwich and a 6-piece chicken nugget is 1175. If a Grilled Chicken Sandwich has 200 less calories than a Big Mac and a 6-piece chicken nugget has half the calories of a Big Mac, how many calories does a Big Mac have?
𝑐𝑐 + (𝑐𝑐 − 200) +𝑐𝑐2
= 1175
2𝑐𝑐 + 2(𝑐𝑐 − 200) + 𝑐𝑐 = 2(1175) 2𝑐𝑐 + 2𝑐𝑐 − 400 + 𝑐𝑐 = 2350
5𝑐𝑐 − 400 = 2350 5𝑐𝑐 = 2750 𝑐𝑐 = 550
A Big Mac has 550 calories. 550 + (550-200) + 550/2 = 1175
6/10/2016
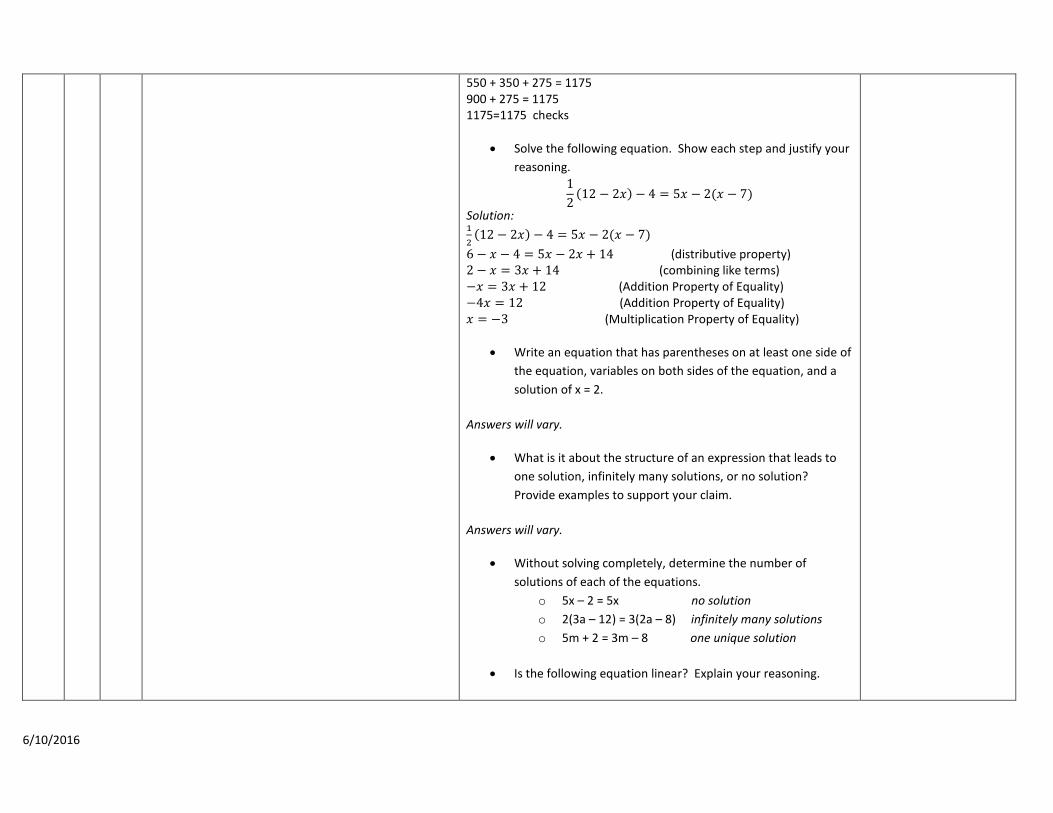
550 + 350 + 275 = 1175 900 + 275 = 1175 1175=1175 checks
• Solve the following equation. Show each step and justify your reasoning.
12
(12 − 2𝑝𝑝) − 4 = 5𝑝𝑝 − 2(𝑝𝑝 − 7)
Solution: 12
(12 − 2𝑝𝑝) − 4 = 5𝑝𝑝 − 2(𝑝𝑝 − 7) 6 − 𝑝𝑝 − 4 = 5𝑝𝑝 − 2𝑝𝑝 + 14 (distributive property) 2 − 𝑝𝑝 = 3𝑝𝑝 + 14 (combining like terms) −𝑝𝑝 = 3𝑝𝑝 + 12 (Addition Property of Equality) −4𝑝𝑝 = 12 (Addition Property of Equality) 𝑝𝑝 = −3 (Multiplication Property of Equality)
• Write an equation that has parentheses on at least one side of the equation, variables on both sides of the equation, and a solution of x = 2.
Answers will vary.
• What is it about the structure of an expression that leads to one solution, infinitely many solutions, or no solution? Provide examples to support your claim.
Answers will vary.
• Without solving completely, determine the number of solutions of each of the equations.
o 5x – 2 = 5x no solution o 2(3a – 12) = 3(2a – 8) infinitely many solutions o 5m + 2 = 3m – 8 one unique solution
• Is the following equation linear? Explain your reasoning.
6/10/2016
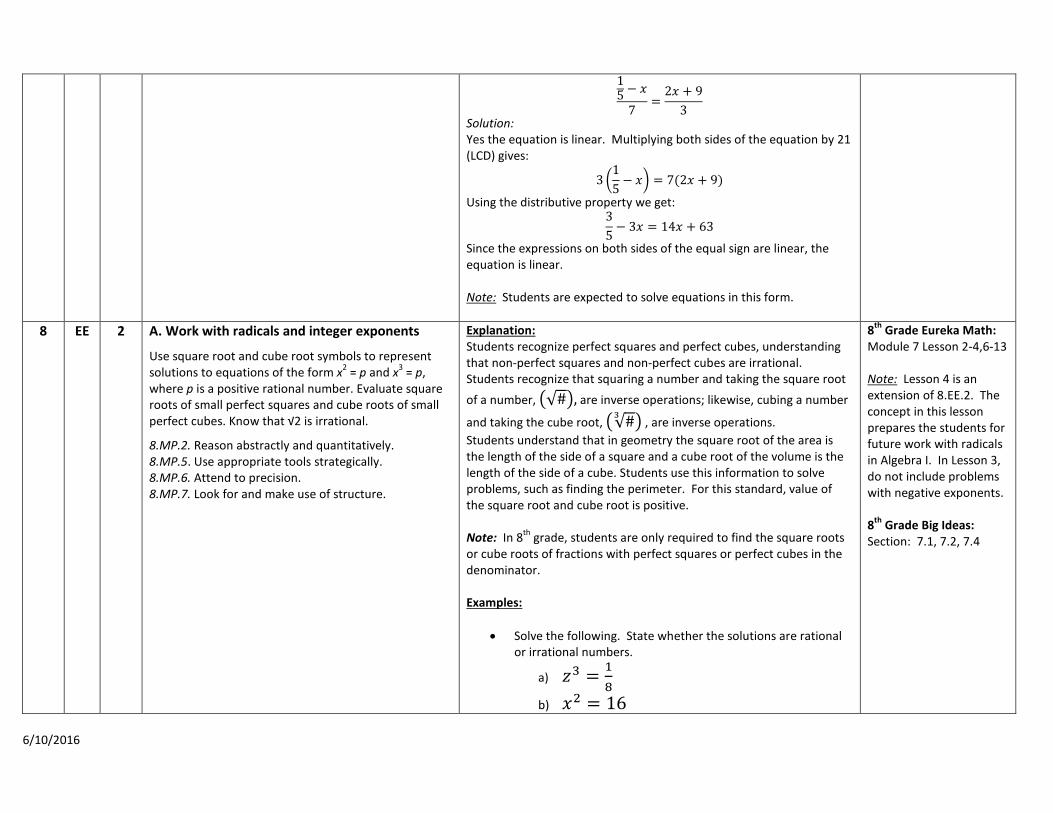
15 − 𝑝𝑝
7=
2𝑝𝑝 + 93
Solution: Yes the equation is linear. Multiplying both sides of the equation by 21 (LCD) gives:
3 �15− 𝑝𝑝� = 7(2𝑝𝑝 + 9)
Using the distributive property we get: 35− 3𝑝𝑝 = 14𝑝𝑝 + 63
Since the expressions on both sides of the equal sign are linear, the equation is linear. Note: Students are expected to solve equations in this form.
8 EE 2 A. Work with radicals and integer exponents
Use square root and cube root symbols to represent solutions to equations of the form x2 = p and x3 = p, where p is a positive rational number. Evaluate square roots of small perfect squares and cube roots of small perfect cubes. Know that √2 is irrational.
8.MP.2. Reason abstractly and quantitatively. 8.MP.5. Use appropriate tools strategically. 8.MP.6. Attend to precision. 8.MP.7. Look for and make use of structure.
Explanation: Students recognize perfect squares and perfect cubes, understanding that non-perfect squares and non-perfect cubes are irrational. Students recognize that squaring a number and taking the square root of a number, �√#�, are inverse operations; likewise, cubing a number
and taking the cube root, �√#3 � , are inverse operations. Students understand that in geometry the square root of the area is the length of the side of a square and a cube root of the volume is the length of the side of a cube. Students use this information to solve problems, such as finding the perimeter. For this standard, value of the square root and cube root is positive. Note: In 8th grade, students are only required to find the square roots or cube roots of fractions with perfect squares or perfect cubes in the denominator. Examples:
• Solve the following. State whether the solutions are rational or irrational numbers.
a) 𝑧𝑧3 = 18
b) 𝑝𝑝2 = 16
8th Grade Eureka Math: Module 7 Lesson 2-4,6-13 Note: Lesson 4 is an extension of 8.EE.2. The concept in this lesson prepares the students for future work with radicals in Algebra I. In Lesson 3, do not include problems with negative exponents. 8th Grade Big Ideas: Section: 7.1, 7.2, 7.4
6/10/2016
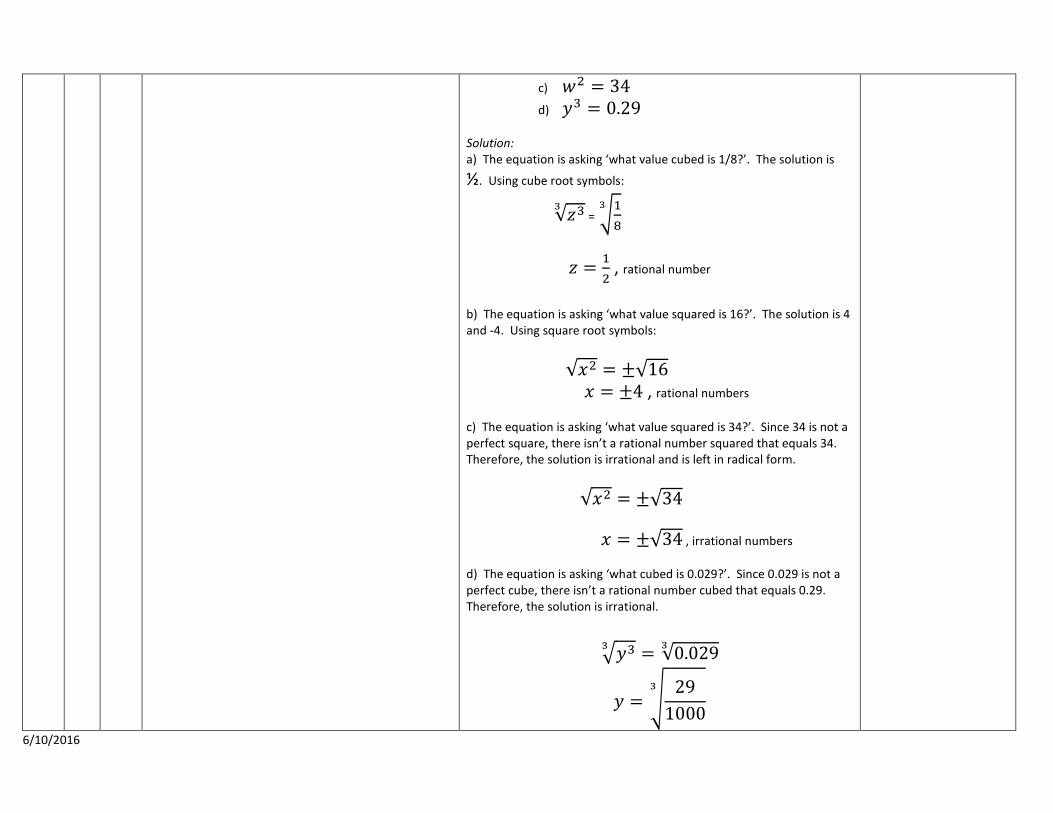
c) 𝑤𝑤2 = 34 d) 𝑦𝑦3 = 0.29
Solution: a) The equation is asking ‘what value cubed is 1/8?’. The solution is
½. Using cube root symbols:
√𝑧𝑧3 3 = �1
83
𝑧𝑧 = 12 , rational number
b) The equation is asking ‘what value squared is 16?’. The solution is 4 and -4. Using square root symbols:
√𝑝𝑝2 = ±√16 𝑝𝑝 = ±4 , rational numbers c) The equation is asking ‘what value squared is 34?’. Since 34 is not a perfect square, there isn’t a rational number squared that equals 34. Therefore, the solution is irrational and is left in radical form.
√𝑝𝑝2 = ±√34
𝑝𝑝 = ±√34 , irrational numbers d) The equation is asking ‘what cubed is 0.029?’. Since 0.029 is not a perfect cube, there isn’t a rational number cubed that equals 0.29. Therefore, the solution is irrational.
�𝑦𝑦33 = √0.0293
𝑦𝑦 = � 291000
3
6/10/2016
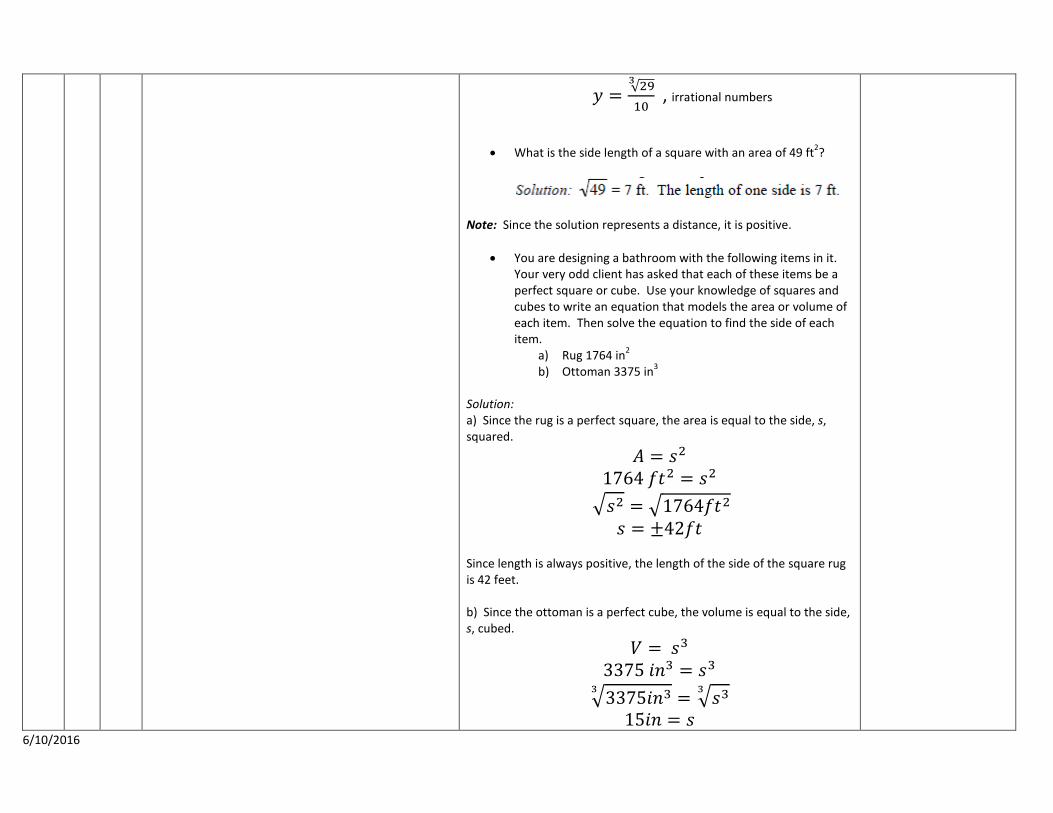
𝑦𝑦 = √293
10 , irrational numbers
• What is the side length of a square with an area of 49 ft2?
Note: Since the solution represents a distance, it is positive.
• You are designing a bathroom with the following items in it. Your very odd client has asked that each of these items be a perfect square or cube. Use your knowledge of squares and cubes to write an equation that models the area or volume of each item. Then solve the equation to find the side of each item.
a) Rug 1764 in2 b) Ottoman 3375 in3
Solution: a) Since the rug is a perfect square, the area is equal to the side, s, squared.
𝐴𝐴 = 𝑠𝑠2 1764 𝑓𝑓𝑓𝑓2 = 𝑠𝑠2
�𝑠𝑠2 = �1764𝑓𝑓𝑓𝑓2 𝑠𝑠 = ±42𝑓𝑓𝑓𝑓
Since length is always positive, the length of the side of the square rug is 42 feet. b) Since the ottoman is a perfect cube, the volume is equal to the side, s, cubed.
𝑉𝑉 = 𝑠𝑠3 3375 𝑖𝑖𝑖𝑖3 = 𝑠𝑠3
�3375𝑖𝑖𝑖𝑖33 = �𝑠𝑠33 15𝑖𝑖𝑖𝑖 = 𝑠𝑠
6/10/2016
The length of the side of the ottoman is 15 inches.
6/10/2016
Accelerated Math 7 Second Quarter
Unit 4: Ratios and Proportional Relationships (4 weeks) Topic A: Proportional Relationships
In Unit 4, students build upon upon their Grade 6 reasoning about ratios, rates, and unit rates (6.RP.1, 6.RP.2, 6.RP.3) to formally define proportional relationships and the constant of proportionality (7.RP.2). In Topic A, students examine situations carefully to determine if they are describing a proportional relationship. Their analysis is applied to relationships given in tables, graphs, and verbal descriptions (7.RP.2a).
Big Idea: • Rates, ratios, and proportional relationships express how quantities change in relationship to each other. • Rates, ratios, and proportional relationships can be represented in multiple ways. • Rates, ratios, and proportional relationships can be applied to problem solving situations.
Essential Questions:
• How do rates, ratios, and proportional relationships apply to our world? • When and why do you use proportional comparisons? • How does comparing quantities describe the relationship between them? • How can you determine if a relationship is proportional? • How are proportional quantities represented in a graph?
Vocabulary proportional to, proportional relationship, ratio, rate, unit rate, equivalent ratio, ratio table, associated rate, origin, coordinate plane
Grade
Domain
Standard
AZ College and Career Readiness Standards Explanations & Examples Resources
6/10/2016
7 RP 2a A. Analyze proportional relationships and use them to solve real-world and mathematical problems.
Recognize and represent proportional relationships between quantities.
a. Decide whether two quantities are in a proportional relationship, e.g., by testing for equivalent ratios in a table or graphing on a coordinate plane and observing whether the graph is a straight line through the origin.
7.MP.3. Construct viable arguments and critique the reasoning of others. 7.MP.4. Model with mathematics.
7.MP.6. Attend to precision.
7.MP.8. Look for and express regularity in repeated reasoning.
Explanations: Students’ understanding of the multiplicative reasoning used with proportions continues from 6th grade. Students determine if two quantities are in a proportional relationship from a table or by graphing on a coordinate plane. Fractions and decimals could be used with this standard.
Students may use a content web site and/or interactive white board to create tables and graphs of proportional or non-proportional relationships.
Students model with mathematics (MP.4) and attend to precision (MP.6) as they look for and express repeated reasoning (MP.8) by generating various representations of proportional relationships.
Note: This standard focuses on the representations of proportions. Solving proportions is addressed in 7.RP.3.
Examples:
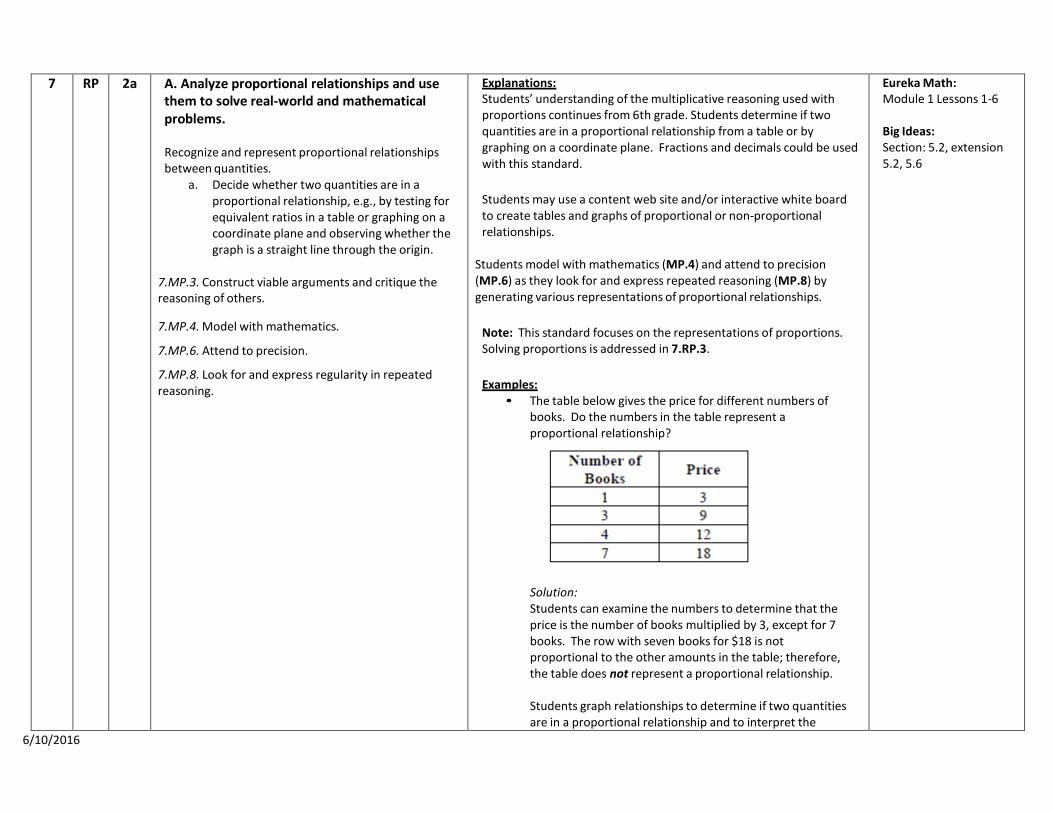
• The table below gives the price for different numbers of books. Do the numbers in the table represent a proportional relationship?
Solution: Students can examine the numbers to determine that the price is the number of books multiplied by 3, except for 7 books. The row with seven books for $18 is not proportional to the other amounts in the table; therefore, the table does not represent a proportional relationship.
Students graph relationships to determine if two quantities are in a proportional relationship and to interpret the
Eureka Math: Module 1 Lessons 1-6
Big Ideas: Section: 5.2, extension 5.2, 5.6
6/10/2016
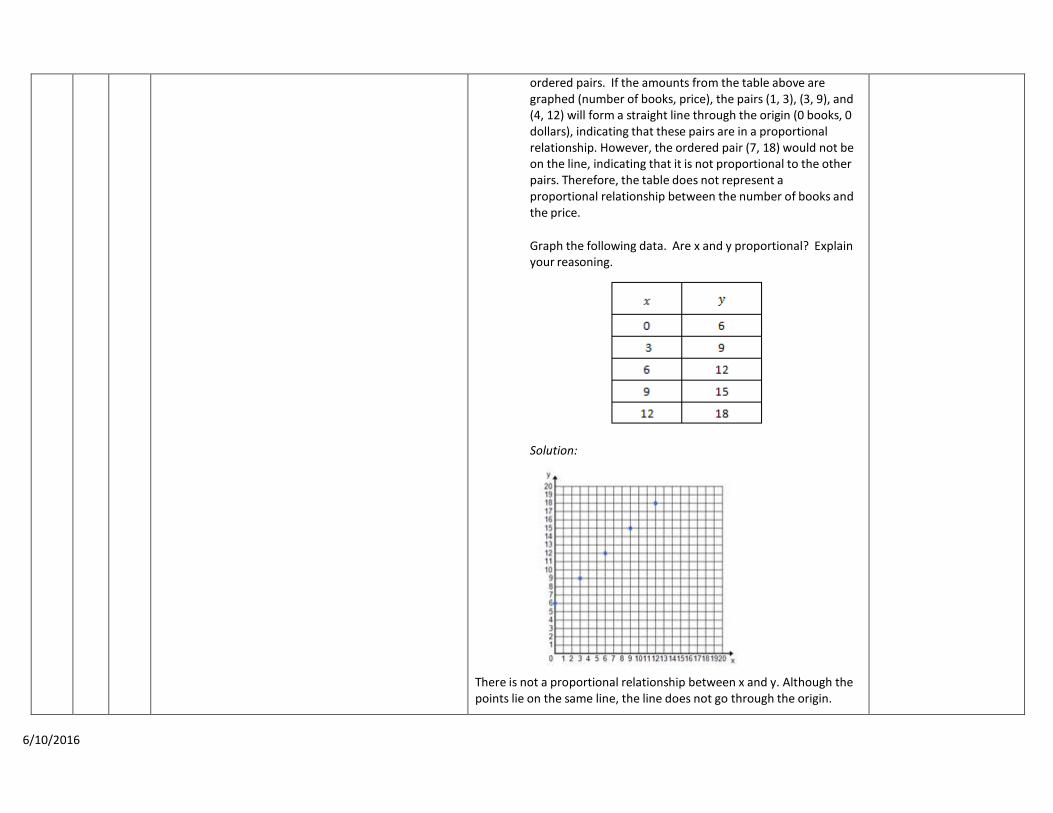
ordered pairs. If the amounts from the table above are graphed (number of books, price), the pairs (1, 3), (3, 9), and (4, 12) will form a straight line through the origin (0 books, 0 dollars), indicating that these pairs are in a proportional relationship. However, the ordered pair (7, 18) would not be on the line, indicating that it is not proportional to the other pairs. Therefore, the table does not represent a proportional relationship between the number of books and the price.
Graph the following data. Are x and y proportional? Explain your reasoning.
Solution:
There is not a proportional relationship between x and y. Although the points lie on the same line, the line does not go through the origin.
6/10/2016
Accelerated Math 7 Second Q t Unit 4: Ratios and Proportional Relationships
Topic B: Unit Rate and the Constant of Proportionality In Topic B, students learn that the unit rate of a collection of equivalent ratios is called the constant of proportionality and can be used to represent proportional relationships with equations of the form y = kx, where k is the constant of proportionality (7.RP.2b, 7.RP.2c, 7.EE.4a). Students relate the equation of a proportional relationship to ratio tables and to graphs and interpret the points on the graph within the context of the situation (7.RP.2d).
Big Idea:
• Rates, ratios, and proportional relationships express how quantities change in relationship to each other. • Rates, ratios, and proportional relationships can be represented in multiple ways. • Rates, ratios, and proportional relationships can be applied to problem solving situations.
Essential Questions:
• How do rates, ratios, and proportional relationships apply to our world? • When and why do I use proportional comparisons? • How does comparing quantities describe the relationship between them? • How do graphs illustrate proportional relationships? • What does the unit rate represent?
Vocabulary Proportional to, proportional relationship, constant of proportionality, ratio, rate of change, unit rate, equivalent ratio, ratio table, independent variable, dependent variable
Grade
Domain
Standard
AZ College and Career Readiness Standards
Explanations & Examples
Resources
7 RP 2bcd A. Analyze proportional relationships and use them to solve real-world and mathematical problems.
Recognize and represent proportional relationships between quantities.
b. Identify the constant of proportionality (unit rate) in tables, graphs, equations, diagrams, and verbal descriptions of proportional relationships.
c. Represent proportional relationships by
Explanation:
Students identify the constant of proportionality (unit rate) from tables, graphs, equations and verbal descriptions of proportional relationships. Fractions and decimals could be used with this standard.
Graphing proportional relationships represented in a table helps students recognize that the graph is a line through the origin (0,0) with a constant of proportionality equal to the rate of change (slope) of the line.
Students model with mathematics (MP.4) and attend to precision (MP.6) as they look for and express repeated reasoning (MP.8) by
Eureka Math: Module 1 Lessons 1-6
Big Ideas: Section: 5.2, extension 5.2, 5.6
6/10/2016
equations. For example, if total cost t is proportional to the number n of items purchased at a constant price p, the relationship between the total cost and the number of items can be expressed as t = pn.
d. Explain what a point (x, y) on the graph of a
proportional relationship means in terms of the situation, with special attention to the points (0, 0) and (1, r) where r is the unit rate.
7.MP.1. Make sense of problems and persevere in solving them.
7.MP.2. Reason abstractly and quantitatively.
7.MP.3. Construct viable arguments and critique the reasoning of others.
7.MP.4. Model with mathematics.
7.MP.5. Use appropriate tools strategically.
7.MP.6. Attend to precision.
7.MP.7. Look for and make use of structure.
7.MP.8. Look for and express regularity in repeated reasoning.
generating various representations of proportional relationships and use those representations to identify and describe constants of proportionality.
Students write equations from context and identify the coefficient as the unit rate (rate of change, slope) which is also the constant of proportionality.
Note: This standard focuses on the representations of proportions. Solving proportions is addressed in 7.RP.3.
Examples:
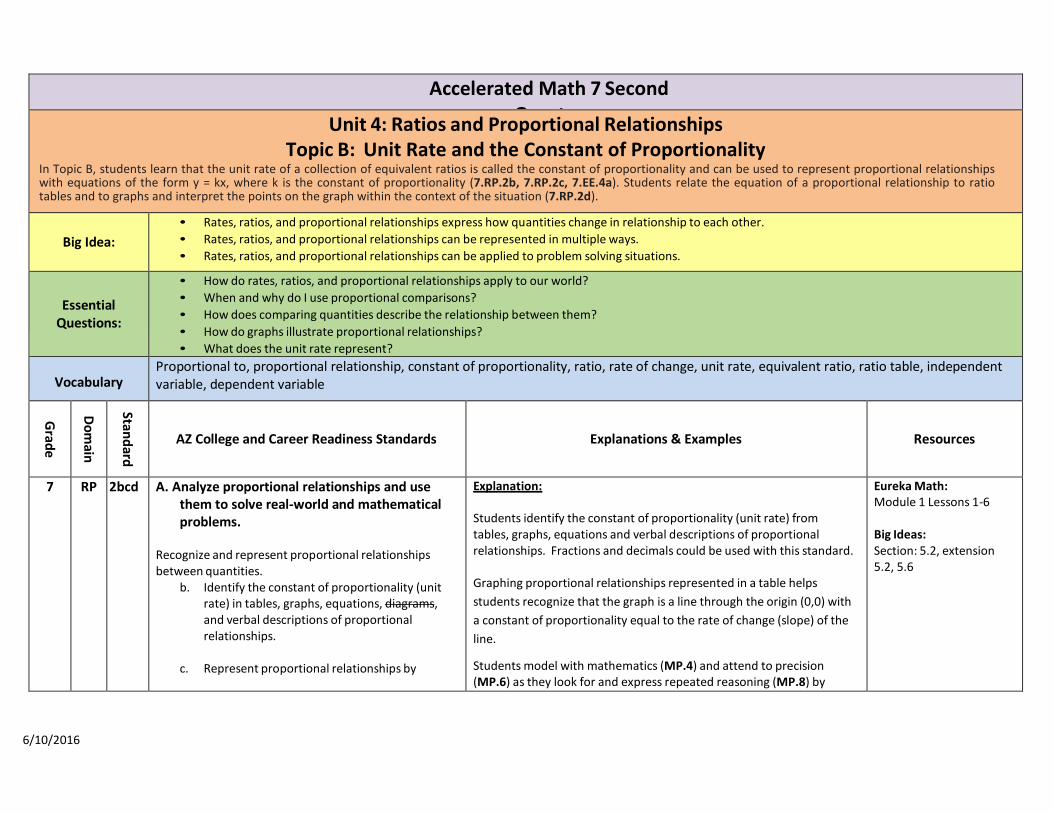
• Why are the two quantities in the table proportional? What is the constant of proportionality? Explain the meaning of each data point and write an equation that represents the data.
The ordered pair (4, 12) means that 4 books cost $12, (3,9) means 3 books cost $9, and (7,21) means 7 books cost $21. The ordered pair (1, 3) indicates that 1 book is $3, which is the unit rate. The y-coordinate when x = 1 will be the unit rate. The constant of proportionality is the unit rate. The equation, P=3b, represents the relationship between the number of books, b, and the total price, P.
The graph below represents the price of the bananas at one store. What is the constant of proportionality?
6/10/2016

Solution: From the graph, it can be determined that 4 pounds of bananas is $1.00; therefore, 1 pound of bananas is $0.25, which is the constant of proportionality for the graph. Note: Any point on the line will yield this constant of proportionality.
• The price of bananas at another store can be determined by
the equation: P = $0.35n, where P is the price and n is the number of pounds of bananas. What is the constant of proportionality (unit rate)?
Solution: The constant of proportionality is the coefficient of x (or the independent variable). The constant of proportionality is 0.35.
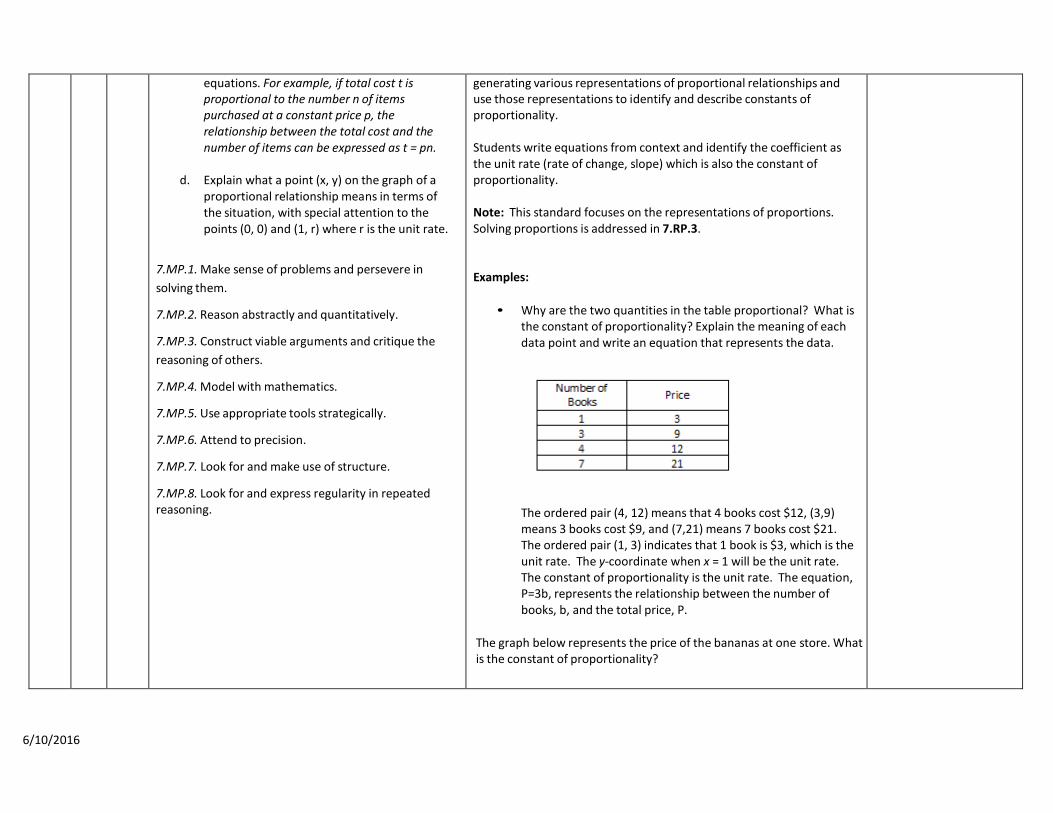
• A student is making trail mix. Create a graph to determine if the
quantities of nuts and fruit are proportional for each serving size listed in the table. If the quantities are proportional, what is the constant of proportionality or unit rate that defines the relationship? Explain how the constant of proportionality was determined and how it relates to both the table and graph.
6/10/2016
The relationship is proportional. For each of the other serving sizes there are 2 cups of fruit for every 1 cup of nuts (2:1). The constant of proportionality is shown in the first column of the table and by the steepness (rate of change) of the line on the graph.
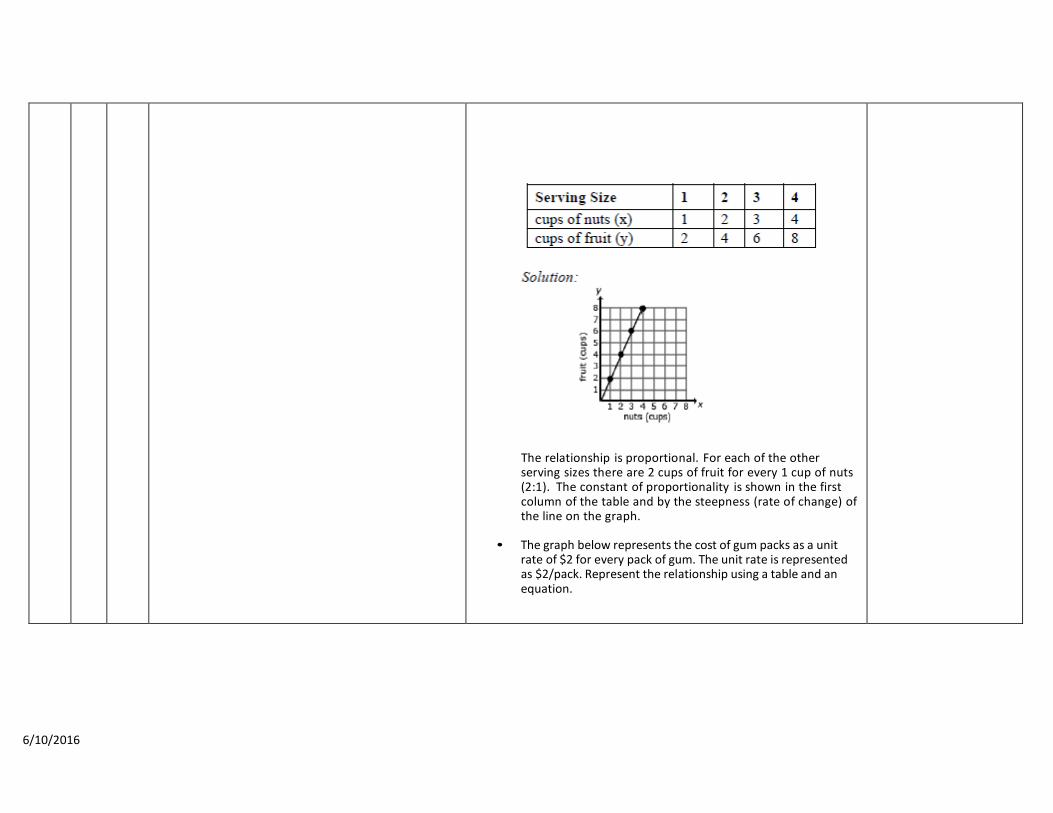
• The graph below represents the cost of gum packs as a unit
rate of $2 for every pack of gum. The unit rate is represented as $2/pack. Represent the relationship using a table and an equation.
6/10/2016
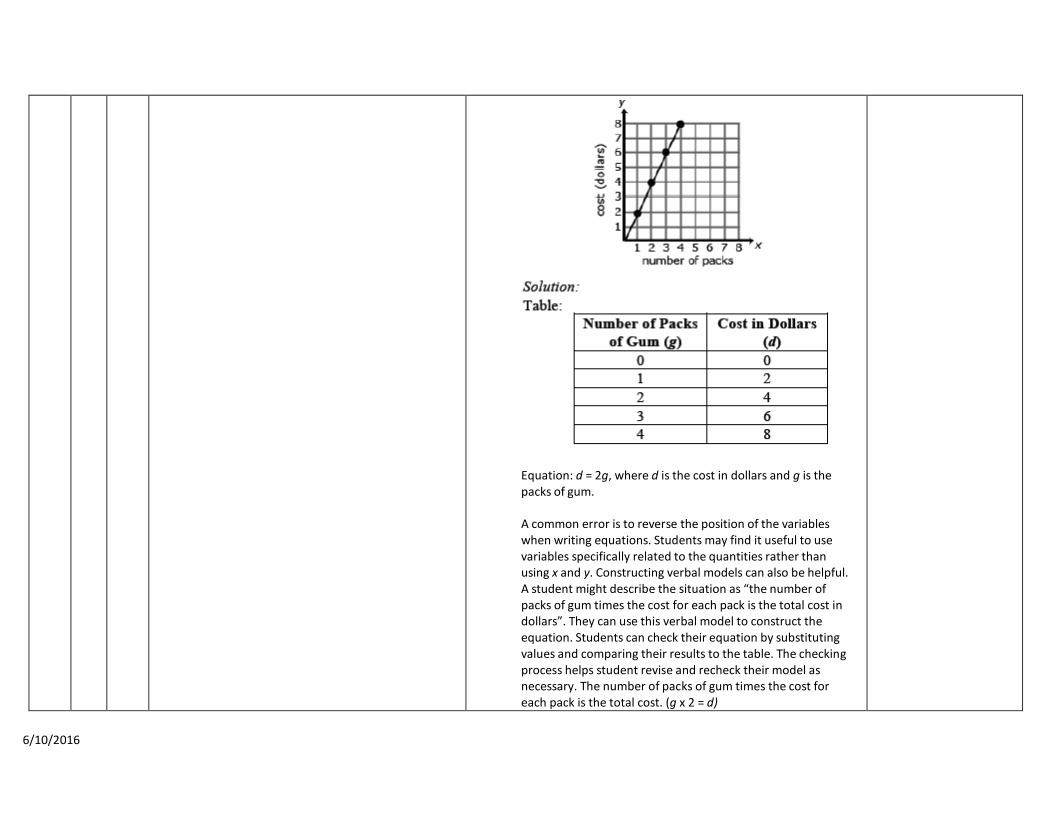
Equation: d = 2g, where d is the cost in dollars and g is the packs of gum.
A common error is to reverse the position of the variables when writing equations. Students may find it useful to use variables specifically related to the quantities rather than using x and y. Constructing verbal models can also be helpful. A student might describe the situation as “the number of packs of gum times the cost for each pack is the total cost in dollars”. They can use this verbal model to construct the equation. Students can check their equation by substituting values and comparing their results to the table. The checking process helps student revise and recheck their model as necessary. The number of packs of gum times the cost for each pack is the total cost. (g x 2 = d)
6/10/2016
8 EE 5 B. Understand the connections between proportional relationships, lines, and linear equations
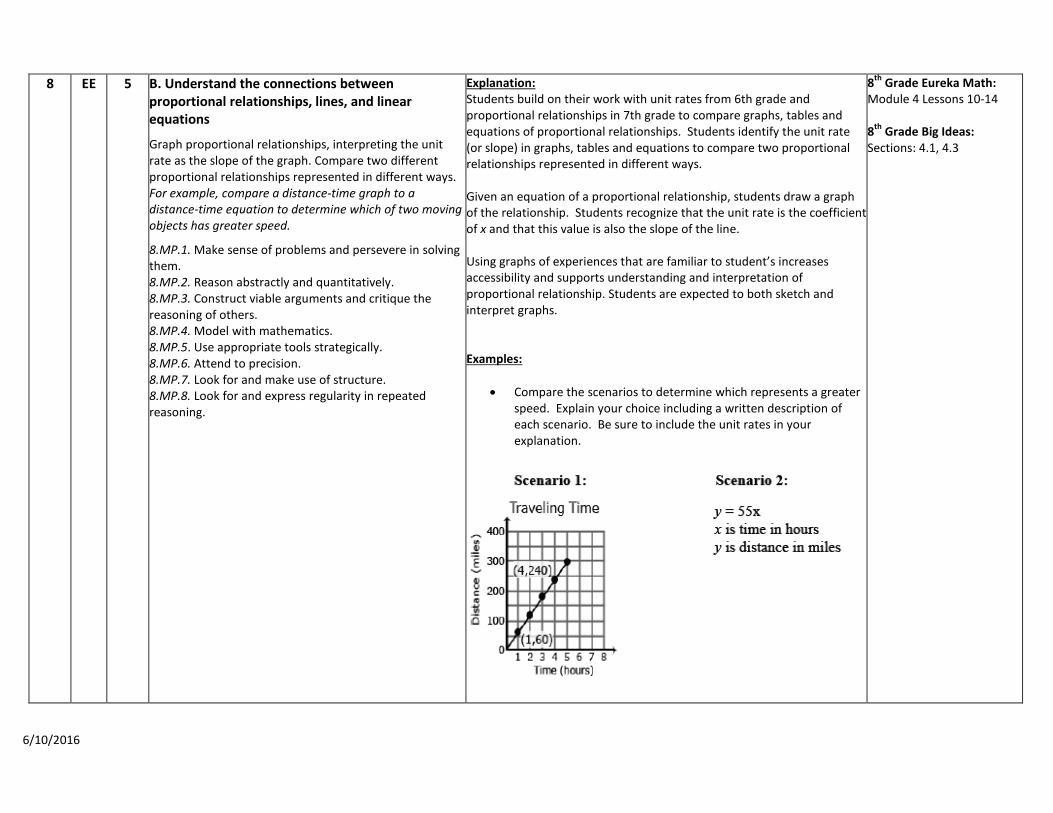
Graph proportional relationships, interpreting the unit rate as the slope of the graph. Compare two different proportional relationships represented in different ways. For example, compare a distance-time graph to a distance-time equation to determine which of two moving objects has greater speed.
8.MP.1. Make sense of problems and persevere in solving them. 8.MP.2. Reason abstractly and quantitatively. 8.MP.3. Construct viable arguments and critique the reasoning of others. 8.MP.4. Model with mathematics. 8.MP.5. Use appropriate tools strategically. 8.MP.6. Attend to precision. 8.MP.7. Look for and make use of structure. 8.MP.8. Look for and express regularity in repeated reasoning.
Explanation: Students build on their work with unit rates from 6th grade and proportional relationships in 7th grade to compare graphs, tables and equations of proportional relationships. Students identify the unit rate (or slope) in graphs, tables and equations to compare two proportional relationships represented in different ways. Given an equation of a proportional relationship, students draw a graph of the relationship. Students recognize that the unit rate is the coefficient of x and that this value is also the slope of the line. Using graphs of experiences that are familiar to student’s increases accessibility and supports understanding and interpretation of proportional relationship. Students are expected to both sketch and interpret graphs. Examples:
• Compare the scenarios to determine which represents a greater speed. Explain your choice including a written description of each scenario. Be sure to include the unit rates in your explanation.
8th Grade Eureka Math: Module 4 Lessons 10-14 8th Grade Big Ideas: Sections: 4.1, 4.3
6/10/2016
Solution: Scenario 1 has the greater speed since the unit rate is 60 miles per hour. The graph shows this rate since 60 is the distance traveled in one hour. Scenario 2 has a unit rate of 55 miles per hour shown as the coefficient in the equation.
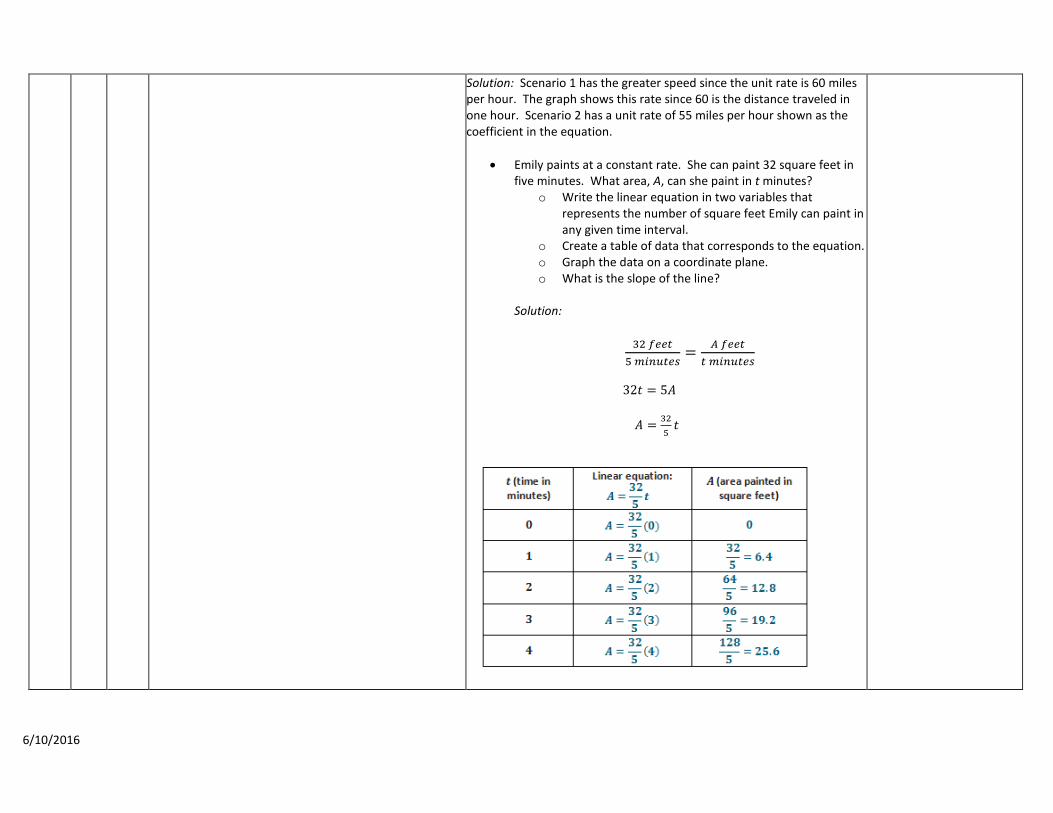
• Emily paints at a constant rate. She can paint 32 square feet in five minutes. What area, A, can she paint in t minutes?
o Write the linear equation in two variables that represents the number of square feet Emily can paint in any given time interval.
o Create a table of data that corresponds to the equation. o Graph the data on a coordinate plane. o What is the slope of the line?
Solution:
32 𝑓𝑓𝑓𝑓𝑓𝑓𝑓𝑓5 𝑚𝑚𝑚𝑚𝑚𝑚𝑚𝑚𝑓𝑓𝑓𝑓𝑚𝑚
= 𝐴𝐴 𝑓𝑓𝑓𝑓𝑓𝑓𝑓𝑓𝑓𝑓 𝑚𝑚𝑚𝑚𝑚𝑚𝑚𝑚𝑓𝑓𝑓𝑓𝑚𝑚
32𝑓𝑓 = 5𝐴𝐴 𝐴𝐴 = 32
5𝑓𝑓
6/10/2016
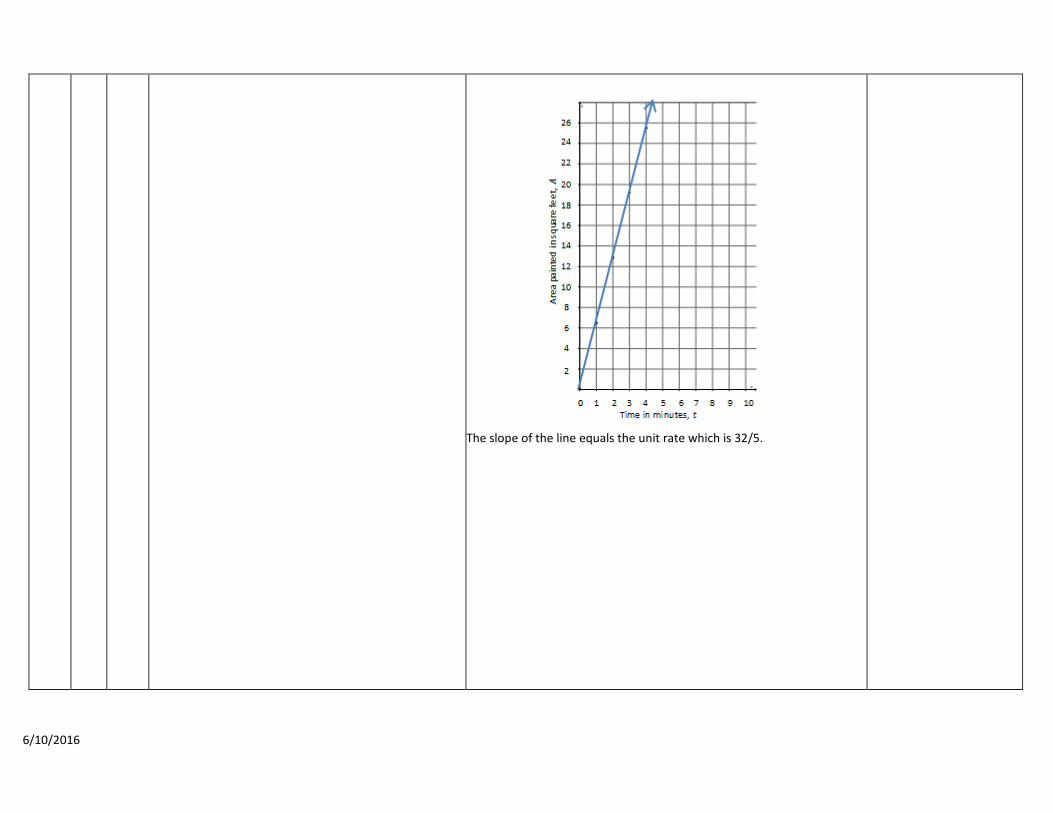
The slope of the line equals the unit rate which is 32/5.
6/10/2016
Accelerated Math 7 Second Q t Unit 4: Ratios and Proportional Relationships
Topic C: Ratios and Rates Involving Fractions In Topic C, students extend their reasoning about ratios and proportional relationships to compute unit rates for ratios and rates specified by rational numbers, such as a speed of ½ mile per ¼ hour (7.RP.1). Students apply their experience in the first two topics and their new understanding of unit rates for ratios and rates involving fractions to solve multistep ratio word problems (7.RP.3, 7.EE.4a).
Big Idea:
• Rates, ratios, and proportional relationships express how quantities change in relationship to each other. • Rates, ratios, and proportional relationships can be represented in multiple ways. • Rates, ratios, and proportional relationships can be applied to problem solving situations.
Essential Questions:
• How do rates, ratios, percentages and proportional relationships apply to our world? • When and why do I use proportional comparisons? • How does comparing quantities describe the relationship between them? • How do graphs illustrate proportional relationships? • How can I use proportional relationships to solve ratio problems?
Vocabulary Proportional to, proportional relationship, constant of proportionality, ratio, rate, unit rate, ratio table, complex fraction, commission, mark- down, mark-up, discount
Grade
Dom
ain
Standard
AZ College and Career Readiness Standards
Explanations & Examples
Resources
7 RP 1 A. Analyze proportional relationships and use them to solve real-world and mathematical problems.
Compute unit rates associated with ratios of fractions, including ratios of lengths, areas and other quantities measured in like or different units. For example, if a person walks ½ mile in each ¼ hour, compute the unit rate as the complex fraction ½/¼ miles per hour, equivalently 2 miles per hour.
7.MP.2. Reason abstractly and quantitatively.
Explanation:
Students continue to work with unit rates from 6th grade; however, the comparison now includes fractions compared to fractions. The comparison can be with like or different units. Fractions may be proper or improper.
Students interpreted and computed quotients of fractions in 6th grade; solving word problems involving division of fractions by fractions (6.NS.A.1). Using visual representations to review this concept may be necessary.
For example, review dividing fractions using a bar model.
Eureka Math: Module 1 Lessons 11-15
Big Ideas: Sections: 5.1
6/10/2016
7.MP.6. Attend to precision. •
•
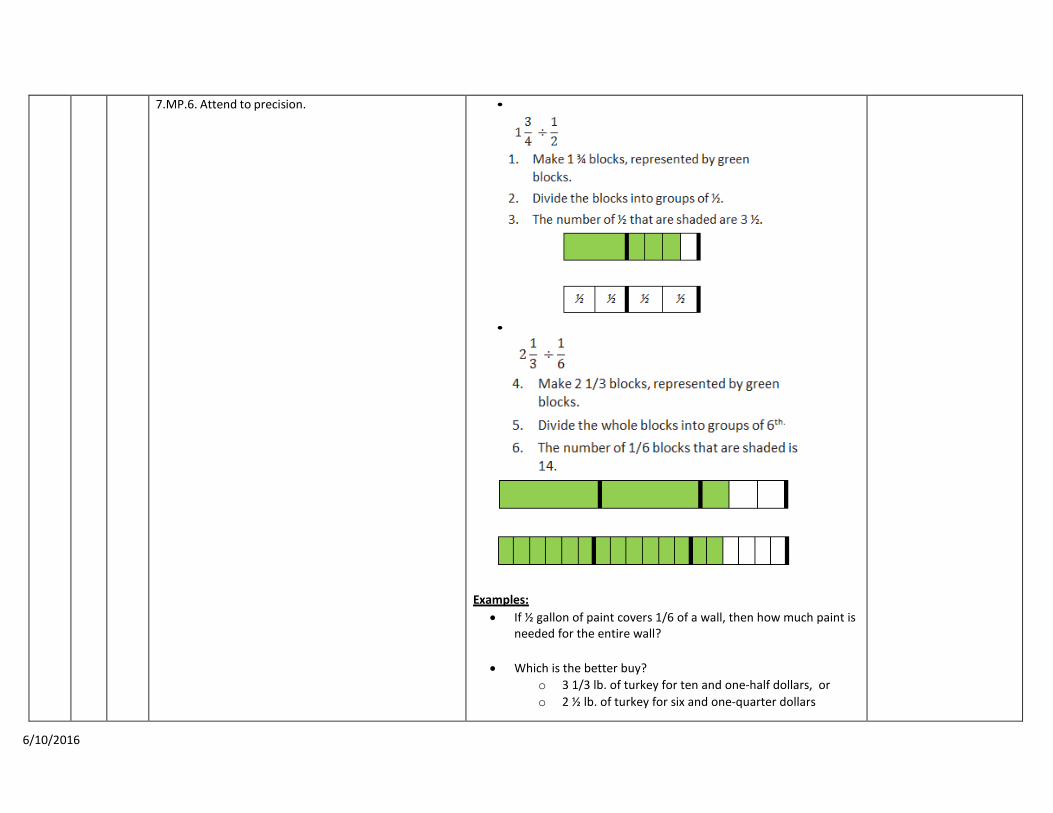
Examples: • If ½ gallon of paint covers 1/6 of a wall, then how much paint is
needed for the entire wall?
• Which is the better buy? o 3 1/3 lb. of turkey for ten and one-half dollars, or o 2 ½ lb. of turkey for six and one-quarter dollars
6/10/2016
7 RP 3 A. Analyze proportional relationships and use them to solve real-world and mathematical problems. Use proportional relationships to solve multi-step ratio and percent problems. Examples: simple interest, tax, markups and markdowns, gratuities and commissions, fees, percent increase and decrease, percent error.
7.MP.1. Make sense of problems and persevere in solving them. 7.MP.2. Reason abstractly and quantitatively. 7.MP.3. Construct viable arguments and critique the reasoning of others. 7.MP.4. Model with mathematics. 7.MP.5. Use appropriate tools strategically. 7.MP.6. Attend to precision. 7.MP.7. Look for and make use of structure. 7.MP.8. Look for and express regularity in repeated reasoning.
Explanation:
In 6th grade, students used ratio tables and unit rates to solve problems. Students expand their understanding of proportional reasoning to solve problems that are more efficient to solve by setting up a proportion. Students use the properties of equality to solve the equation.
Note: Only include one-step equations in this unit (6.EE.B.7). Students will learn how to solve multi-step equations in Unit 5.
Examples:
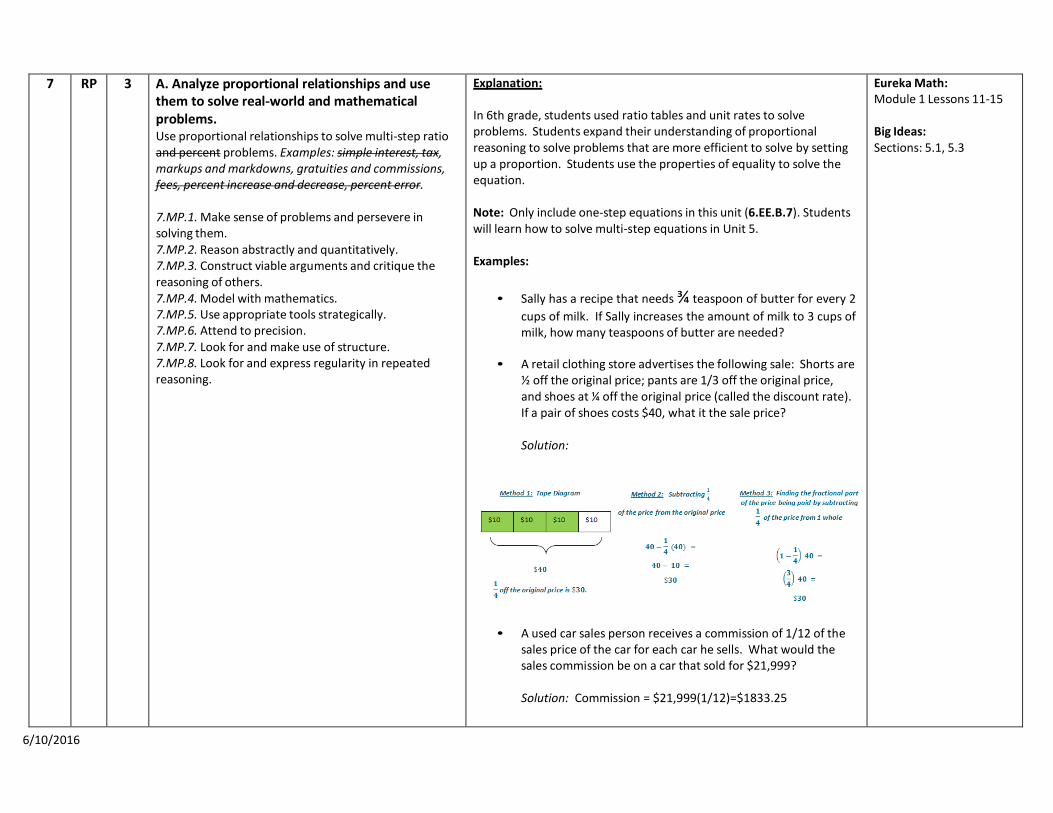
• Sally has a recipe that needs ¾ teaspoon of butter for every 2
cups of milk. If Sally increases the amount of milk to 3 cups of milk, how many teaspoons of butter are needed?
• A retail clothing store advertises the following sale: Shorts are
½ off the original price; pants are 1/3 off the original price, and shoes at ¼ off the original price (called the discount rate). If a pair of shoes costs $40, what it the sale price?
Solution:
• A used car sales person receives a commission of 1/12 of the sales price of the car for each car he sells. What would the sales commission be on a car that sold for $21,999?
Solution: Commission = $21,999(1/12)=$1833.25
Eureka Math: Module 1 Lessons 11-15
Big Ideas: Sections: 5.1, 5.3
6/10/2016
Accelerated Math 7 Second Quarter
Unit 5: Percent and Proportional Relationships (3 weeks) Topic A: Proportional Reasoning with Percents (Part 1)
In Unit 4, students deepen their understanding of ratios and proportional relationships from Unit 3 (7.RP.A.1, 7.RP.A.2, 7.RP.A.3) by solving a variety of percent problems. Topic A builds on students’ conceptual understanding of percent from Grade 6 (6.RP.3c), and relates 100% to “the whole.” Students represent percents as decimals and fractions and extend their understanding from Grade 6 to include percents greater than 100%, such as 225%, and percents less than 1%, such as1/2 % or 0.5%.. Students create algebraic representations and apply their understanding of percent to interpret and solve multi-step word problems related to markups or markdowns, simple interest, sales tax, commissions, fees, and percent error (7.RP.A.3). Students solve problems related to changing percents and use their understanding of percent and proportional relationships to solve these problems. Students also apply their understanding of absolute value from Unit 1 (7.NS.A.1b) when solving percent error problems.
Big Idea:
• Rates, ratios, percentages and proportional relationships can be applied to solve multi-step percent problems. • Multiple representations can be used to solve percent problems (tape diagrams, double number-line, graphs, equations, etc…) • A unified understanding of numbers is developed by recognizing fractions, decimals, and percents as different representations of
rational numbers.
Essential Questions:
• How can you use proportional relationships to solve percent problems? • How can you express a unit rate as a percent? • How are the fraction and decimal representation related to the percent? • How can you identify the “whole” in a percent problem? • How does the context of a problem determine whether there is a percent increase or decrease? • What is the difference between the absolute error and the percent error?
Vocabulary Ratio, proportion, percent increase, percent decrease, percent error, markdown, markup, sales price, discount price
Grade
Domain
Standard
AZ College and Career Readiness Standards Explanations & Examples Resources
7 RP 3 A. Analyze proportional relationships and use them to solve real-world and mathematical problems.
Use proportional relationships to solve multistep ratio and percent problems. Examples: simple interest, tax, markups and markdowns, gratuities and commissions, fees, percent increase and decrease, percent error.
Explanations:
The use of proportional relationships is extended to solve percent problems involving sales tax, markups and markdowns simple interest (I = prt, where I = interest, p = principal, r = rate, and t = time (in years)), gratuities and commissions, fees, percent increase and decrease, and percent error.
Students should be able to explain or show their work using a
Eureka Math: Module 4 Lessons 1-10 Big Ideas: Sections:6.3-6.7
6/10/2016
7.MP.1. Make sense of problems and persevere in solving them. 7.MP.2. Reason abstractly and quantitatively. 7.MP.3. Construct viable arguments and critique the reasoning of others. 7.MP.4. Model with mathematics. 7.MP.5. Use appropriate tools strategically. 7.MP.6. Attend to precision. 7.MP.7. Look for and make use of structure. 7.MP.8. Look for and express regularity in repeated reasoning.
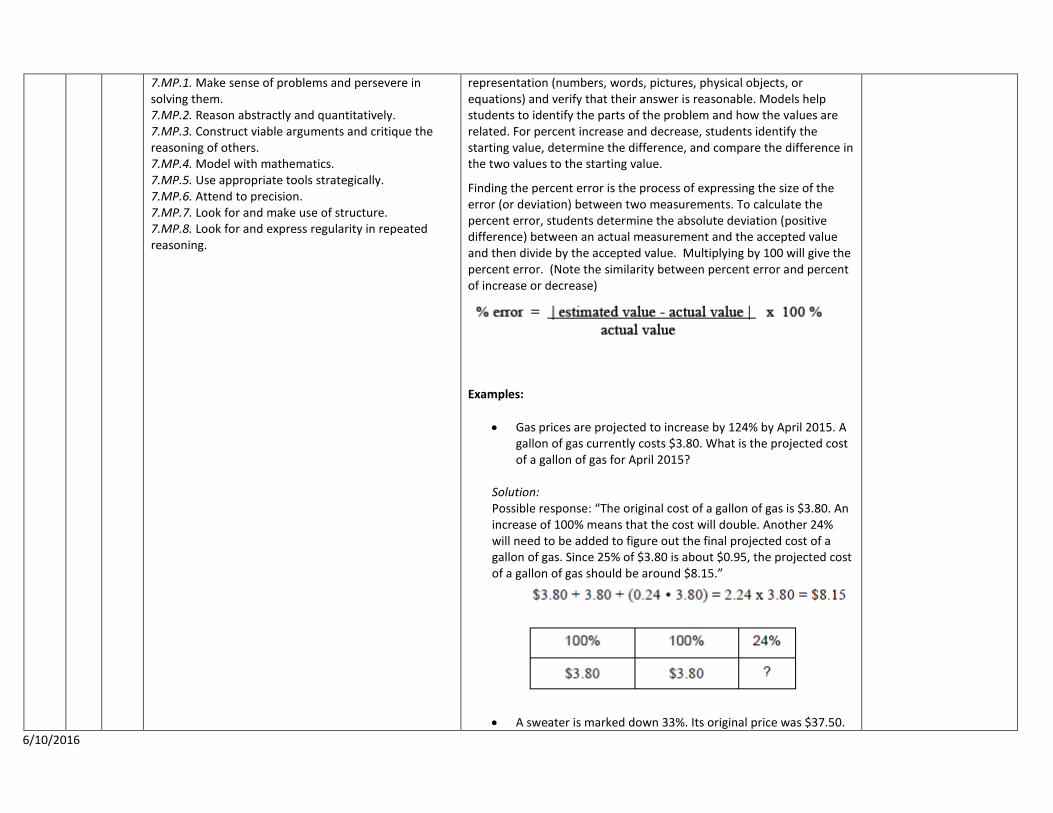
representation (numbers, words, pictures, physical objects, or equations) and verify that their answer is reasonable. Models help students to identify the parts of the problem and how the values are related. For percent increase and decrease, students identify the starting value, determine the difference, and compare the difference in the two values to the starting value.
Finding the percent error is the process of expressing the size of the error (or deviation) between two measurements. To calculate the percent error, students determine the absolute deviation (positive difference) between an actual measurement and the accepted value and then divide by the accepted value. Multiplying by 100 will give the percent error. (Note the similarity between percent error and percent of increase or decrease)
Examples:
• Gas prices are projected to increase by 124% by April 2015. A gallon of gas currently costs $3.80. What is the projected cost of a gallon of gas for April 2015?
Solution: Possible response: “The original cost of a gallon of gas is $3.80. An increase of 100% means that the cost will double. Another 24% will need to be added to figure out the final projected cost of a gallon of gas. Since 25% of $3.80 is about $0.95, the projected cost of a gallon of gas should be around $8.15.”
• A sweater is marked down 33%. Its original price was $37.50. 6/10/2016
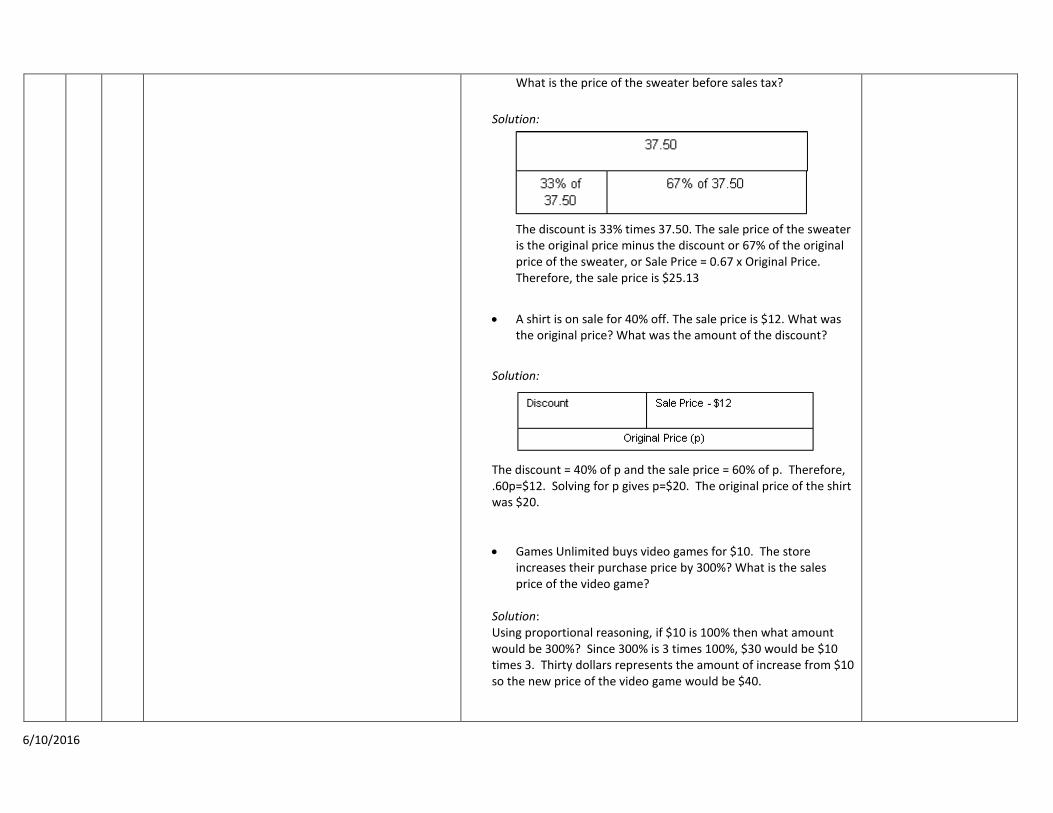
What is the price of the sweater before sales tax?
Solution:
The discount is 33% times 37.50. The sale price of the sweater is the original price minus the discount or 67% of the original price of the sweater, or Sale Price = 0.67 x Original Price. Therefore, the sale price is $25.13
• A shirt is on sale for 40% off. The sale price is $12. What was the original price? What was the amount of the discount?
Solution:
The discount = 40% of p and the sale price = 60% of p. Therefore, .60p=$12. Solving for p gives p=$20. The original price of the shirt was $20.
• Games Unlimited buys video games for $10. The store increases their purchase price by 300%? What is the sales price of the video game?
Solution: Using proportional reasoning, if $10 is 100% then what amount would be 300%? Since 300% is 3 times 100%, $30 would be $10 times 3. Thirty dollars represents the amount of increase from $10 so the new price of the video game would be $40.
6/10/2016
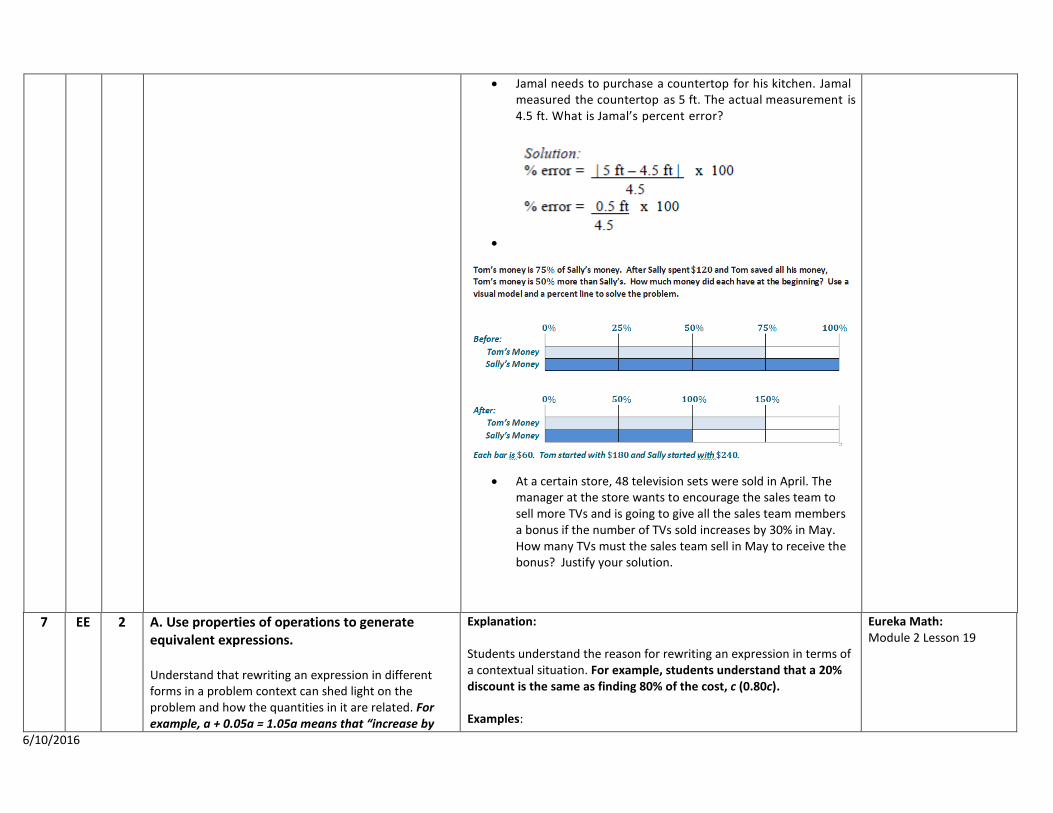
• Jamal needs to purchase a countertop for his kitchen. Jamal measured the countertop as 5 ft. The actual measurement is 4.5 ft. What is Jamal’s percent error?
•
• At a certain store, 48 television sets were sold in April. The manager at the store wants to encourage the sales team to sell more TVs and is going to give all the sales team members a bonus if the number of TVs sold increases by 30% in May. How many TVs must the sales team sell in May to receive the bonus? Justify your solution.
7 EE 2 A. Use properties of operations to generate
equivalent expressions. Understand that rewriting an expression in different forms in a problem context can shed light on the problem and how the quantities in it are related. For example, a + 0.05a = 1.05a means that “increase by
Explanation: Students understand the reason for rewriting an expression in terms of a contextual situation. For example, students understand that a 20% discount is the same as finding 80% of the cost, c (0.80c). Examples:
Eureka Math: Module 2 Lesson 19
6/10/2016
5%” is the same as “multiply by 1.05.”
7.MP.2. Reason abstractly and quantitatively. 7.MP.6. Attend to precision. 7.MP.7. Look for and make use of structure. 7.MP.8. Look for and express regularity in repeated reasoning.
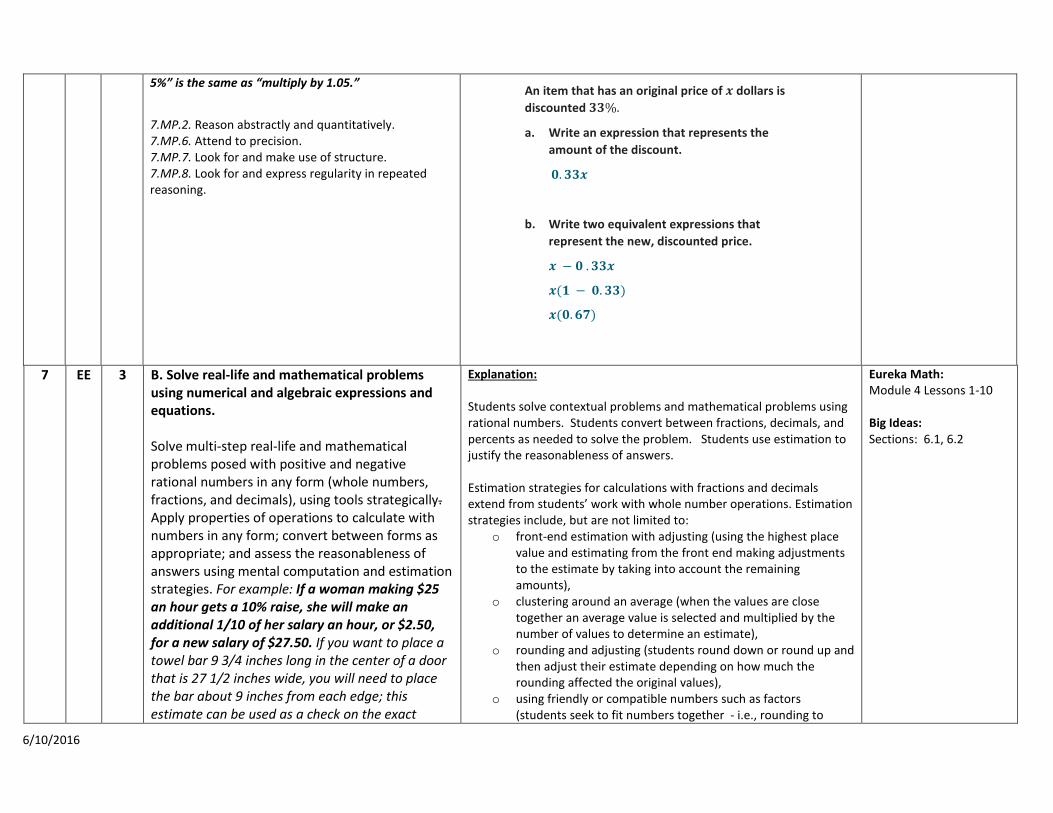
An item that has an original price of 𝒙𝒙 dollars is discounted 𝟑𝟑𝟑𝟑%.
a. Write an expression that represents the amount of the discount.
𝟎𝟎.𝟑𝟑𝟑𝟑𝒙𝒙
b. Write two equivalent expressions that represent the new, discounted price.
𝒙𝒙 − 𝟎𝟎 .𝟑𝟑𝟑𝟑𝒙𝒙
𝒙𝒙(𝟏𝟏 − 𝟎𝟎.𝟑𝟑𝟑𝟑)
𝒙𝒙(𝟎𝟎.𝟔𝟔𝟔𝟔)
7 EE 3 B. Solve real-life and mathematical problems using numerical and algebraic expressions and equations. Solve multi-step real-life and mathematical problems posed with positive and negative rational numbers in any form (whole numbers, fractions, and decimals), using tools strategically. Apply properties of operations to calculate with numbers in any form; convert between forms as appropriate; and assess the reasonableness of answers using mental computation and estimation strategies. For example: If a woman making $25 an hour gets a 10% raise, she will make an additional 1/10 of her salary an hour, or $2.50, for a new salary of $27.50. If you want to place a towel bar 9 3/4 inches long in the center of a door that is 27 1/2 inches wide, you will need to place the bar about 9 inches from each edge; this estimate can be used as a check on the exact
Explanation: Students solve contextual problems and mathematical problems using rational numbers. Students convert between fractions, decimals, and percents as needed to solve the problem. Students use estimation to justify the reasonableness of answers. Estimation strategies for calculations with fractions and decimals extend from students’ work with whole number operations. Estimation strategies include, but are not limited to:
o front-end estimation with adjusting (using the highest place value and estimating from the front end making adjustments to the estimate by taking into account the remaining amounts),
o clustering around an average (when the values are close together an average value is selected and multiplied by the number of values to determine an estimate),
o rounding and adjusting (students round down or round up and then adjust their estimate depending on how much the rounding affected the original values),
o using friendly or compatible numbers such as factors (students seek to fit numbers together - i.e., rounding to
Eureka Math: Module 4 Lessons 1-10 Big Ideas: Sections: 6.1, 6.2
6/10/2016
computation. 7.MP.1. Make sense of problems and persevere in solving them. 7.MP.2. Reason abstractly and quantitatively. 7.MP.3. Construct viable arguments and critique the reasoning of others. 7.MP.4. Model with mathematics. 7.MP.5. Use appropriate tools strategically. 7.MP.6. Attend to precision. 7.MP.7. Look for and make use of structure. 7.MP.8. Look for and express regularity in repeated reasoning.
factors and grouping numbers together that have round sums like 100 or 1000), and
o using benchmark numbers that are easy to compute (students select close whole numbers for fractions or decimals to determine an estimate).
Examples:
• Three students conduct the same survey about the number of hours people sleep at night. The results of the number of people who sleep 8 hours a nights are shown below. In which person’s survey did the most people sleep 8 hours?
o Susan reported that 18 of the 48 people she surveyed get 8 hours sleep a night
o Kenneth reported that 36% of the people he surveyed get 8 hours sleep a night
o Jamal reported that 0.365 of the people he surveyed get 8 hours sleep a night
Solution: In Susan’s survey, the number is 37.5%, which is the greatest percentage.
• Bonnie goes out to eat and buys a meal that costs $12.50 that includes a tax of $.75. She only wants to leave a tip based on the cost of the food. Write an equation that could be used to represent the total cost of the bill, C, including the tip. Let t represent the tip percentage. Solution: In this situation, students need to realize that the tax must be subtracted from the total cost before being multiplied by the percent of tip and then added back to obtain the final cost. C = (12.50 – 0.75)(1 + t) + 0.75
6/10/2016