accelerated pavement testing validation of a hma … · accelerated pavement testing validation of...
TRANSCRIPT

State of Florida Department of Transportation
Accelerated Pavement Testing Validation of a HMA Gradation-Based Evaluation Method
FDOT Office State Materials Office
Research Report Number
FL/DOT/SMO/10-539
Authors James Greene
Sungho Kim Bouzid Choubane
Date of Publication
December 2010

i
TABLE OF CONTENTS TABLE OF CONTENTS ................................................................................................................. i LIST OF FIGURES ........................................................................................................................ ii LIST OF TABLES .......................................................................................................................... ii Executive Summary ....................................................................................................................... iii INTRODUCTION .......................................................................................................................... 1 OBJECTIVE ................................................................................................................................... 1 BACKGROUND ............................................................................................................................ 1
Dominant Aggregate Size Range ................................................................................................ 1 Porosity as a Criterion for Aggregate Contact ............................................................................ 4 DASR Porosity Summary ........................................................................................................... 4
VALIDATION THROUGH ACCELERATED PAVEMENT TESTING ..................................... 6 Accelerated Pavement Testing Facility ....................................................................................... 6 Past APT Experiment .................................................................................................................. 6 Current Experiment ..................................................................................................................... 8
CONCLUSIONS AND RECOMMENDATIONS ....................................................................... 13 ACKNOWLEDGEMENTS .......................................................................................................... 14 DISCLAIMER .............................................................................................................................. 14 REFERENCES ............................................................................................................................. 14 APPENDIX A: Dynamic Modulus and IDT Data ....................................................................... 16 APPENDIX B: Core Volumetric Data ........................................................................................ 17 APPENDIX C: FWD and PSPA Data ......................................................................................... 18

ii
LIST OF FIGURES FIGURE 1 Dominant aggregates and interstitial volume. .............................................................. 2 FIGURE 2 Particle size spacing analysis. ....................................................................................... 3 FIGURE 3 Spacing analysis for two contiguous particle sizes. ..................................................... 3 FIGURE 4 Flowchart for DASR porosity analysis. ........................................................................ 5 FIGURE 5 APT Test Track and HVS. ............................................................................................ 6 FIGURE 6 Gradation and volumetric properties for fine and coarse graded mixture experiment. 7 FIGURE 7 Interaction chart for fine and coarse graded mixture experiment. ................................ 8 FIGURE 8 Rut profiles for fine and coarse graded mixture experiment. ....................................... 8 FIGURE 9 Gradation chart and volumetric properties for the DASR experiment. ........................ 9 FIGURE 10 Interaction chart for the DASR experiment. ............................................................. 10 FIGURE 11 Photograph of experiment 6 cores. ........................................................................... 10 FIGURE 12 HVS rut profiles for the DASR experiment. ............................................................ 11 FIGURE 13 Asphalt strain gauge. ................................................................................................ 11 FIGURE 14 Tensile strain properties of lane 6 versus lane 7. ...................................................... 12 FIGURE 15 3D rut profiles for lane 6 and lane 7. ........................................................................ 13 FIGURE 17 Dynamic modulus data. ............................................................................................ 16
LIST OF TABLES TABLE 1 IDT Properties .............................................................................................................. 16 TABLE 2 Lane 6 Core Volumetric Properties ............................................................................. 17 TABLE 3 Lane 7 Core Volumetric Properties ............................................................................. 17 TABLE 4 Lane 6 Backcalculated Moduli .................................................................................... 18 TABLE 5 Lane 7 Backcalculated Moduli .................................................................................... 18 TABLE 6 PSPA Seismic Moduli .................................................................................................. 19

iii
EXECUTIVE SUMMARY Particle size distribution is a critical property that greatly influences an asphalt mixtures resistance to permanent deformation and cracking as well as the mixtures workability, permeability, and durability. The Superpave mix design method attempts to address some of these issues by requiring an aggregate gradation pass within control points. The control points serve three purposes: 1) to control the top size of the aggregate, 2) to control the relative proportion of coarse and fine aggregate, and 3) to control the dust proportion. Little additional guidance is given regarding suitable aggregate gradations. Thus, it is always possible that some blends may pass the required Superpave criteria but could perform poorly. A new theoretical approach for evaluation and specification of aggregate gradations was recently developed in Florida. The intent was to provide a framework to ensure that the resulting mixtures will have sufficient aggregate interlock to resist permanent deformation. Presumably, this method can, therefore, be used at the mix design phase to assess the field performance of an asphalt mixture based on its aggregate gradation. Consequently, this study was conducted to assess the appropriateness and to validate this proposed approach using a controlled accelerated pavement testing (APT) experiment. This paper presents a description of the aggregate-based performance evaluation method as well as the subsequent experimental APT validation effort and findings.

Greene, Kim, and Choubane 1
INTRODUCTION Particle size distribution is a critical property that greatly influences an asphalt mixtures resistance to permanent deformation and cracking as well as the mixtures workability, permeability, and durability. The aggregate structure is expected to provide a strong support system to transfer load throughout the mixture and resist damage associated with repeated loading. The Superpave mix design method attempts to address some of these issues by requiring an aggregate gradation pass within control points (1). The control points serve three purposes: 1) to control the top size of the aggregate, 2) to control the relative proportion of coarse and fine aggregate, and 3) to control the dust proportion. Original Superpave guidance also recommended a restricted zone to avoid designing a mixture that followed the maximum density line too closely within the finer portion of the gradation. The restricted zone was meant to encourage the use of clean manufactured sand rather than fine natural sand (2). More recent research has found that many mixtures with gradations that fall within the restricted zone performed well and the restricted zone recommendation has subsequently been eliminated (3, 4). Otherwise, little additional guidance is given regarding suitable aggregate gradations. Thus, it is always possible that some blends may pass the required Superpave criteria but could perform poorly (5). OBJECTIVE A theoretical approach recently developed in Florida provides a framework for evaluating and specifying aggregate gradations as to ensure that the resulting mixtures will have appropriate resistance to permanent deformation (6). Presumably, this method can, thus, be used at the mix design phase to assess the field performance of an asphalt mixture based solely on its aggregate gradation. Accordingly, the primary objective of this study was to investigate and validate this proposed aggregate-based performance evaluation method. To allow for a faster and a more practical assessment under closely simulated in-service conditions, accelerated pavement testing (APT) was considered to address the objectives of this investigation. APT is generally defined as a controlled application of a realistic wheel loading to a pavement system simulating long-term, in-service loading conditions. This allows the monitoring of a pavement system’s performance and response to accumulation of damage within a much shorter time frame. A complete description of the test facility has been presented elsewhere (7, 8). BACKGROUND The following paragraphs briefly describe the recently proposed framework for evaluation and specification of aggregate gradations being assessed in this study. Further details are provided elsewhere (6). It is recognized that good asphalt mixture performance will depend on the characteristics and properties of the aggregate gradation and the binder. Having recognized this important fact, two primary questions must then be answered in order to determine if an efficient transfer of load throughout an asphalt mixture is possible.
1. Which particle size(s) will have a dominant role on the performance of an asphalt mixture? 2. Are these particles in good contact with each other?
Dominant Aggregate Size Range The dominant aggregate size range (DASR) is the interactive range of particle sizes that form the primary structural network of aggregates. The DASR must be composed of coarse enough particles for a mixture to effectively resist deformation. Particles larger than the DASR will simply float in the mixture matrix

Greene, Kim, and Choubane 2
and will not play a major role in deformation resistance. Particle sizes smaller than the DASR (including binder) will serve to fill the void space between the DASR. The volume of the material that exists between the voids of the DASR (aggregate, binder, and air voids) is referred to as the interstitial volume (IV). The components within the IV are known as the interstitial components (IC). The properties of the IV and IC will strongly influence the durability and fracture resistance of the mixture. FIGURE 1 illustrates the DASR concept.
DASR
IC, IV
SMA Dense Coarse Dense Fine
FIGURE 1 Dominant aggregates and interstitial volume.
A theoretical spacing analysis was developed to determine if contiguous particle sizes are interactive and included in the determination of the DASR. It was assumed that the largest particles were uniformly distributed over an entire representative area. Smaller particles were uniformly distributed within the remaining volume or area. A brief description of the spacing analysis is described below.
1. Assume a representative cross sectional area of a mixture. Aggregate particles are idealized as
circles within this sectional surface area. 2. Calculate the number and area of particles in the cross sectional area for each particle size. 3. Uniformly distribute the largest particles according to a hexagonal pattern within the available
area. 4. Calculate the area available for the next largest size particles by subtracting the area occupied
by the larger particles from the total representative area. 5. Distribute the next largest particles according to a hexagonal pattern within the remaining area
as determined in step 4. 6. Repeat steps 4 and 5 for every particle size. 7. Calculate the center-to-center spacing between the particles within each hexagonal area.
An idealized illustration of the spacing analysis process is shown in FIGURE 2. A representative
cross section with the largest particle size distributed in a hexagonal pattern is shown on the left. If, for example, the area consumed by the largest particle size is 20 percent of the total area, the remaining 80 percent will be the representative area used for analysis of the next particle size. Each particle is distributed throughout its respective representative area in a similar hexagonal pattern. The center-to-center spacing between each particle can then be calculated by simple geometry.

Greene, Kim, and Choubane 3
Initial area = 100%Solid particles area = 20%Area for 2nd step = 80%
2nd step area = 80%Solid particles area = 30% x 80% = 24%Area for 3rd step = 70% x 80% = 56%
Largest Particle Size Next Largest Particle Size
FIGURE 2 Particle size spacing analysis.
The theoretical spacing analysis indicated that as the proportion of larger to smaller particles
decreased, the larger particle spacing increased. In other words, as the number of larger particles decreased, their spacing increased. The reverse was true for smaller particles, as shown in (a) Spacing of contiguous particles. (b) Rate of change in particle spacing
FIGURE 3(a). Particle spacing for either larger or smaller particles began to increase more
rapidly once the relative proportion of the different size aggregate was approximately 70/30, as indicated in FIGURE 3(b). Based on this analysis, it was concluded that two contiguous coarse particle sizes should interact if one sieve retains less than 70 percent and the other retains greater than 30 percent (e.g., 40/60, 50/50, 60/40). All contiguous particles sizes determined to be interactive are considered part of the DASR and will act as a single network.
0
1
2
3
4
100
/0
95/5
90/
10
85/
15
80/
20
70/
30
60/
40
50/
50
40/
60
30/
70
20/
80
15/
85
10/
90
5/95
0/1
00
Sp
acin
g, c
m
Large/Small Particle Proportion
Larger Particle Size
Smaller Particle Size
0.00
0.05
0.10
0.15
0.20
0.25
0 10 20 30 40 50 60 70 80 90 100
Slo
pe
% passing
Larger Particle Size
Smaller Particle Size
Spacing begins to rapidly increase
(a) Spacing of contiguous particles. (b) Rate of change in particle spacing
FIGURE 3 Spacing analysis for two contiguous particle sizes.

Greene, Kim, and Choubane 4
Porosity as a Criterion for Aggregate Contact The voids in the mineral aggregate (VMA) of an asphalt mixture refers to the volume of available space between aggregates and is analogous to void volume, or porosity, in soil. In soil mechanics, the porosity of loose granular materials is approximately 45 to 50 percent, regardless of particle size or distribution (9). This implies that the porosity of aggregate particles within an asphalt mixture must be no greater than 50 percent for the particles to be in contact with each other. By assuming that an asphalt mixture has a certain effective asphalt content and air voids for a given gradation (i.e., VMA), porosity can be calculated for any single sieve size, or any two or more contiguous sieve sizes within the mixture. For example, the porosity of the particles retained on the 4.75 mm sieve and passing the 9.5 mm sieve can be calculated using the following procedure.
First, the total volume of mixture consisting of particles that are equal to or smaller than the size of interest is determined.
)AGG(TM)T( VVV 5.95.975.4 (1)
where,
VT(4.75-9.5) = total volume available for particles retained on the 4.75 mm sieve and passing the 9.5 mm
VTM = total volume of mixture VAGG(≥9.5) = volume of particles retained on the 9.5mm sieve
It should be noted that the volume of voids within VT(4.75-9.5) includes the volume of aggregates passing the 4.75 mm sieve and the volume of effective asphalt plus air voids as follows (i.e., the VMA of the mixture).
VMAVV AGGV )75.4()5.975.4( (2)
where,
VV(4.75-9.5) = total volume of voids within VT(4.75-9.5) VAGG(< 4.75) = volume of particles passing the 4.75 mm sieve
The porosity of this aggregate particle size is then calculated.
)5.9(
)75.4(
)5.9(
)75.4(
)5.975.4(
)5.975.4()5.975.4(
AGGTM
AGGTM
AGGTM
AGG
T
V
VV
VV
VV
VMAV
V
V
(3) Where,
VAGG(4.75) = volume of particles retained on the 4.75 mm sieve
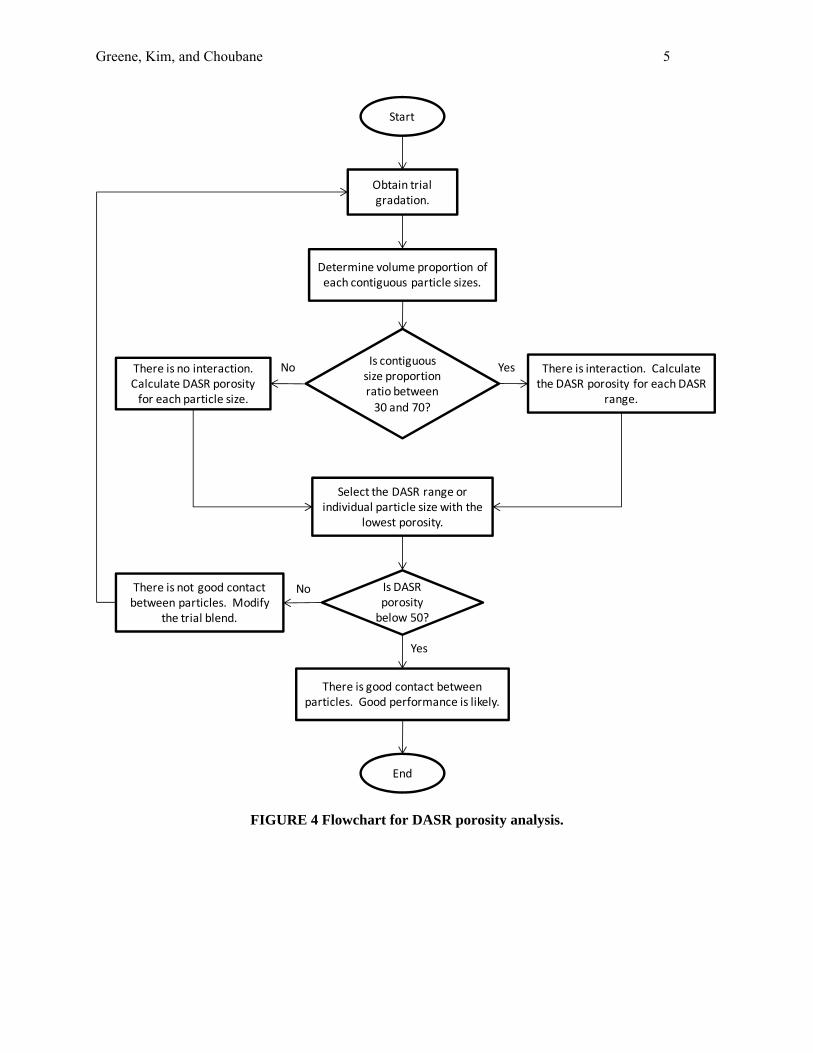
This calculation can be performed for any other particle size or range of particle sizes, such as the DASR of the mixture. DASR Porosity Summary In summary, the DASR can be a single particle size or several contiguous particle sizes. In addition, only particle sizes greater than the 1.18 mm sieve can be considered coarse enough to provide the interlock necessary to resist permanent deformation. FIGURE 4 summarizes the procedure to calculate DASR porosity.
Greene, Kim, and Choubane 5
Determine volume proportion of each contiguous particle sizes.
Is contiguous size proportion ratio between
30 and 70?
There is interaction. Calculate the DASR porosity for each DASR
range.
Start
Is DASR porosity below 50?
There is not good contact between particles. Modify
the trial blend.
There is good contact between particles. Good performance is likely.
Select the DASR range or individual particle size with the
lowest porosity.
There is no interaction. Calculate DASR porosity for each particle size.
Obtain trial gradation.
End
No Yes
Yes
No
FIGURE 4 Flowchart for DASR porosity analysis.

Greene, Kim, and Choubane 6
VALIDATION THROUGH ACCELERATED PAVEMENT TESTING Accelerated Pavement Testing Facility FDOT uses APT to allow for a faster and more practical assessment of pavements under closely simulated in-service conditions. In Florida’s APT program, the accelerated loading is performed using a Heavy Vehicle Simulator (HVS), Mark IV model. Accelerated loading is performed uni-directionally. The temperature of rutting experiments is held constant at 122 º F (50º C) by installing insulated panels and employing a heater system integrated into the HVS. Each test section is trafficked until a rut depth of approximately 0.5 inch (12.5-mm) is accumulated. Test lanes are divided into three pavement sections (identified as A, B and C), with each pavement section being approximately 50 feet (15.2-m) long and 12 feet (3.7-m) wide. The supporting layers for the test track consist of a 10.5 inch limerock base over a 12 inch limerock stabilized subgrade. This foundation is typical of Florida roadways. The test track and HVS is shown in FIGURE 5.
1
2
3
45
67
A
B
C
FIGURE 5 APT Test Track and HVS.
Past APT Experiment Initial Superpave implementation guidelines encouraged the use of coarse gradations for higher traffic-level mixtures since it was thought that coarse graded mixtures provided better rut resistance. An early HVS experiment conducted by FDOT was an evaluation of the rut resistance of fine and coarse graded limestone mixtures (8). Each test section was comprised of two 2-inch lifts of a 12.5 mm Superpave (SP 12.5) mixture with PG 67-22 binder. The pavement was trafficked with a 425 mm Super Single tire (Goodyear G286 A SS, 425/65R22.5) loaded at 9,000 pounds and inflated to 110 psi. The evaluation showed that the fine-graded mixture was superior despite the commonly held belief that coarse-graded mixtures provided better rut resistance. In order to gain a better understanding of how the respective
Greene, Kim, and Choubane 7
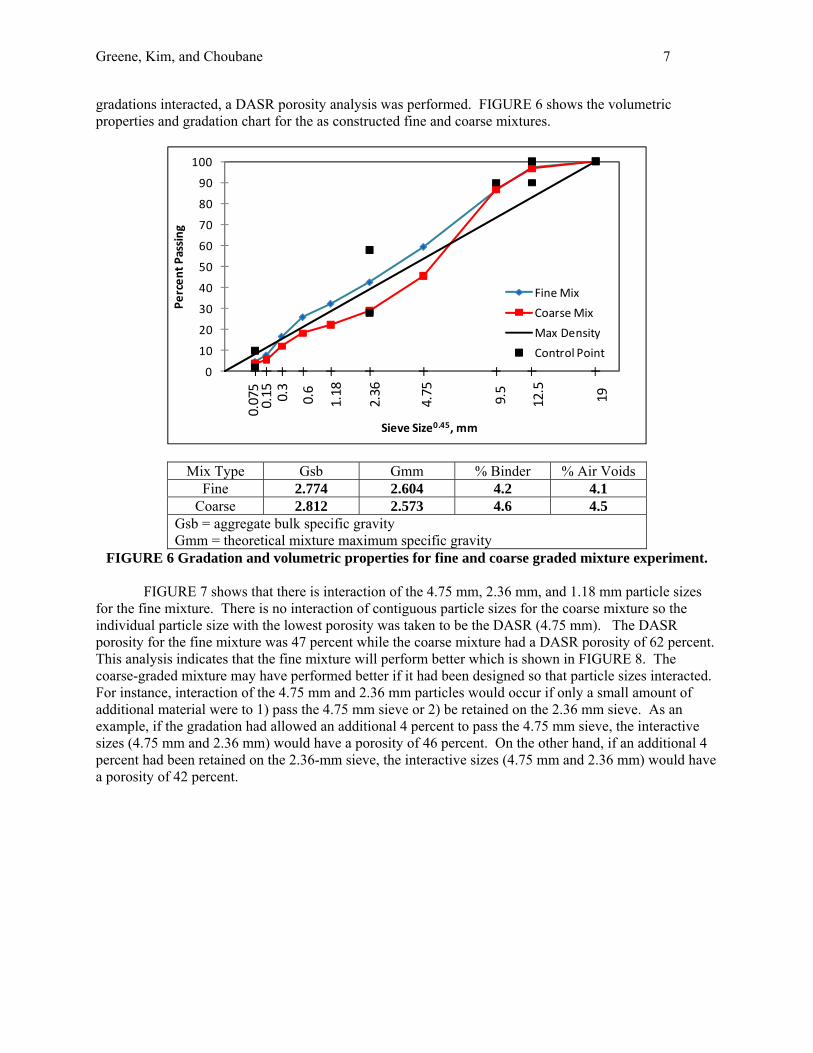
gradations interacted, a DASR porosity analysis was performed. FIGURE 6 shows the volumetric properties and gradation chart for the as constructed fine and coarse mixtures.
0
10
20
30
40
50
60
70
80
90
100
Percent Passing
Sieve Size0.45, mm
Fine Mix
Coarse Mix
Max Density
Control Point
1912.5
9.5
4.75
2.36
1.18
0.6
0.3
0.15
0.075
Mix Type Gsb Gmm % Binder % Air Voids Fine 2.774 2.604 4.2 4.1
Coarse 2.812 2.573 4.6 4.5 Gsb = aggregate bulk specific gravity Gmm = theoretical mixture maximum specific gravity
FIGURE 6 Gradation and volumetric properties for fine and coarse graded mixture experiment.
FIGURE 7 shows that there is interaction of the 4.75 mm, 2.36 mm, and 1.18 mm particle sizes for the fine mixture. There is no interaction of contiguous particle sizes for the coarse mixture so the individual particle size with the lowest porosity was taken to be the DASR (4.75 mm). The DASR porosity for the fine mixture was 47 percent while the coarse mixture had a DASR porosity of 62 percent. This analysis indicates that the fine mixture will perform better which is shown in FIGURE 8. The coarse-graded mixture may have performed better if it had been designed so that particle sizes interacted. For instance, interaction of the 4.75 mm and 2.36 mm particles would occur if only a small amount of additional material were to 1) pass the 4.75 mm sieve or 2) be retained on the 2.36 mm sieve. As an example, if the gradation had allowed an additional 4 percent to pass the 4.75 mm sieve, the interactive sizes (4.75 mm and 2.36 mm) would have a porosity of 46 percent. On the other hand, if an additional 4 percent had been retained on the 2.36-mm sieve, the interactive sizes (4.75 mm and 2.36 mm) would have a porosity of 42 percent.

Greene, Kim, and Choubane 8
0
10
20
30
40
50
60
70
80
90
100
19.0‐12.5 12.5‐9.5 9.5‐4.75 4.75‐2.36 2.36‐1.18
Large/Small Particle Proportion, %
Contigous Sieve Sizes, mm
Fine Mix
Coarse Mix
Particle interaction
FIGURE 7 Interaction chart for fine and coarse graded mixture experiment.
0
2
4
6
8
10
12
14
16
18
0 20,000 40,000 60,000 80,000
Rut Depth, mm
HVS Repetitions
3A Fine 3B Fine 5A Coarse 5C Coarse
Coarse GradedDASR Porosity = 62%
Fine GradedDASR Porosity = 47%
For good aggregate interlock of the Dominant Aggregate Size Range,DASR Porosity < 50%
FIGURE 8 Rut profiles for fine and coarse graded mixture experiment.
Current Experiment To obtain further information and confirm the above findings, two mixture were purposely designed to produce one mixture with a DASR porosity below 50 percent (referred to as the good design) and the other with a DASR porosity above 50 percent (referred to as the poor design). Both mixtures included a virgin binder meeting the requirements of PG 67-22 and the same granite aggregate components but in different percentages as to obtain the two significantly different DASRs. The mixtures were also designed to meet Superpave criteria for a 12.5 mm traffic level D mixture (10 – 30 million ESALs). FIGURE 9 shows the in-place gradation charts and the volumetric properties for the mixtures. The Superpave gradation controls were used to design the mixtures but the as constructed gradations for both mixes slightly violated the 9.5 mm control point. The respective mixtures were then placed in two, 2 inch

Greene, Kim, and Choubane 9
lifts to construct two distinct test tracks (or lanes) while complying with all the standard FDOT construction, materials, and in-place (as constructed) specifications and methods. Each of the test lanes was further divided into three distinct pavement test sections. For all pavement test sections, the supporting layers consisted of a 10.5 in limerock base over a 12 in limerock stabilized subgrade. Lane 6 was constructed with the mixture that was expected to perform poorly while the mixture placed on Lane 7 was anticipated to perform well. Material properties including the dynamic modulus indirect tensile (IDT) data, constructed air voids, and backcalculated layer moduli can be found in APPENDICES A through C, respectively.
The interaction chart, shown in FIGURE 10, indicates that the 4.75 mm, 2.36 mm, and 1.18 mm particle sizes are interactive for both mixtures. Lane 7 had a DASR porosity of 44 percent while lane 6 had a DASR porosity of 59 percent. FIGURE 11 shows photographs of cores retrieved from lane 6 and lane 7. The photographs show that the larger particles in lane 6 appear to float among the particles that make up the DASR. The particles in lane 7 appear to create a better aggregate network.
0
10
20
30
40
50
60
70
80
90
100
Percent Passing
Sieve Size0.45, mm
Poor Mix (Lane 6)
Good Mix (Lane 7)
Max Density
Control Point
1912.5
9.5
4.75
2.36
1.18
0.6
0.3
0.15
0.075
Mix Type Gsb Gmm % Binder % Air Voids Poor 2.651 2.460 5.3 4.0 Good 2.646 2.471 5.3 3.3
Gsb = aggregate bulk specific gravity Gmm = theoretical mixture maximum specific gravity
FIGURE 9 Gradation chart and volumetric properties for the DASR experiment.

Greene, Kim, and Choubane 10
0
10
20
30
40
50
60
70
80
90
100
19.0‐12.5 12.5‐9.5 9.5‐4.75 4.75‐2.36 2.36‐1.18
Large/Small Particle Proportion, %
Contigous Sieve Sizes, mm
Poor Design
Good Design
Particle interaction
FIGURE 10 Interaction chart for the DASR experiment.
Lane 6 Lane 7
FIGURE 11 Photograph of experiment 6 cores.
Finally, each test section was trafficked with a 455 mm wide-base single tire (Michelin X One
XDA-HT Plus, 455/55R22.5) inflated to 100 psi and loaded to 9000 pounds. A 12.5 mm rut was generated by the HVS tests after approximately 2,500 passes for the poor mixture and after approximately 50,000 passes for the good mixture. The HVS test results are shown in FIGURE 12. Additionally, a repeated load test performed at 30⁰ C indicated that the poor mixture had an average flow number of 88 while the good mixture had an average flow number of 269.

Greene, Kim, and Choubane 11
0
5
10
15
20
25
30
35
0 10,000 20,000 30,000 40,000 50,000 60,000 70,000
Rut Depth, mm
HVS Repetitions
Lane 6Poor DASR Porosity = 59%
Lane 7Good DASR Porosity = 44%
FIGURE 12 HVS rut profiles for the DASR experiment.
To better quantify the pavement performance, embedded strain gauges were placed at the bottom of the asphalt directly below the center of the wheel path for one pavement section in lane 6 and lane 7. Two gauges were placed in the longitudinal direction and two were placed in the transverse direction for each test section. The Tokyo Sokki Model KM-100HAS asphalt gauge model that was used is shown in. FIGURE 13.
FIGURE 13 Asphalt strain gauge.

Greene, Kim, and Choubane 12
FIGURE 14(a) shows the tensile strain ratio measured for lane 6 and lane 7 (L6/L7). There is no significant difference in longitudinal strain. However, the transverse tensile strain for Lane 6 is approximately 1.8 times that of Lane 7 when loading is initiated and gradually decreases to 1.4 times greater after 1000 passes. Furthermore, the accumulated transverse strain is significantly greater for lane 6 which can clearly be seen in FIGURE 14(b) and FIGURE 14(c). The increased transverse strain magnitude and accumulation are an indication that much of the rutting was due to transverse shearing of material from the wheel path. Shearing of the mixture in lane 6 was evident by the significant humps of transferred material outside of the wheel path. The result of the shearing action can be seen in the 3D rut profiles shown in FIGURE 15. Significant shearing was not observed on Lane 7, which had a DASR porosity of less than 50 percent.
0.00
0.25
0.50
0.75
1.00
1.25
1.50
1.75
2.00
50 Passes 500 Passes 1000 Passes
Lane 6 / Lane 7 Tensile Strain Ratio
Tensile Strain Ratio
Longitudinal Tension Ratio Transverse Tension Ratio
a) Tensile strain ratio.
0
20
40
60
80
100
120
140
0 10 20 30 40 50 60 70
Transverse M
icrostrain
Time, seconds
Lane 6
Lane 7
0
10
20
30
40
50
60
70
50 Passes 500 Passes 1000 Passes
Accumulated Transverse M
icrostrain Lane 6
Lane 7
b) Accumulated strain. c) Strain profiles after 50 passes.
FIGURE 14 Tensile strain properties of lane 6 versus lane 7.
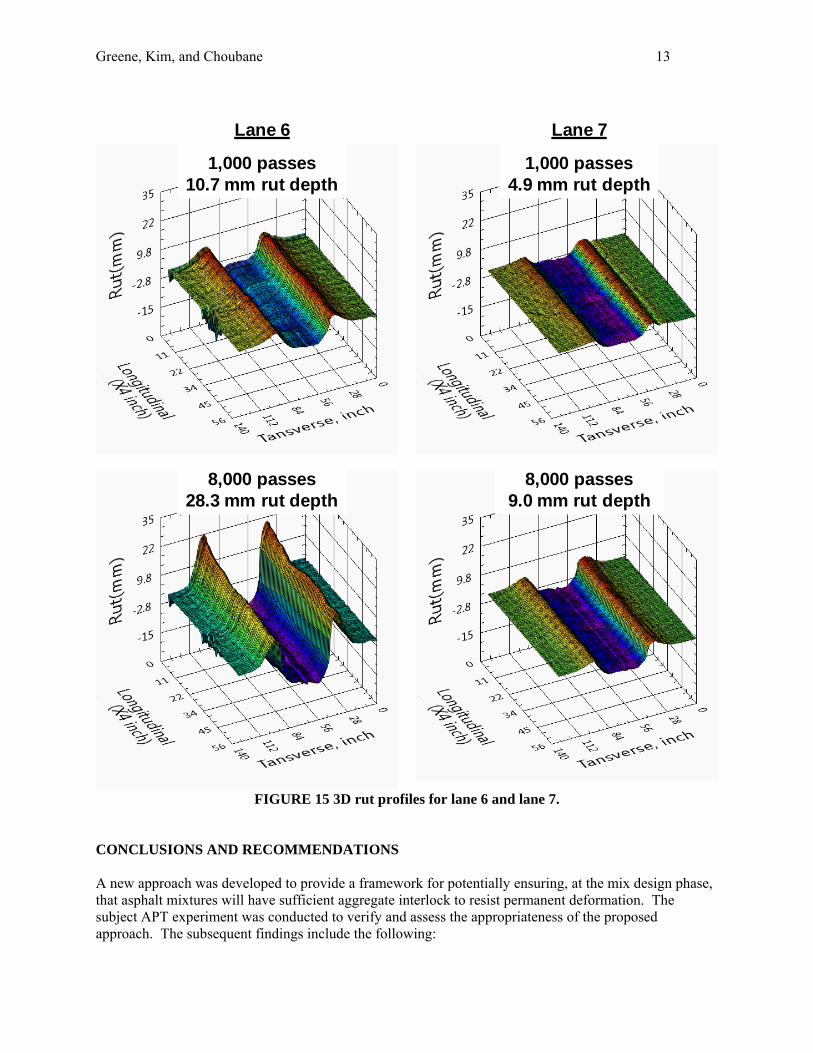
Greene, Kim, and Choubane 13
Lane 6
1,000 passes10.7 mm rut depth
8,000 passes28.3 mm rut depth
Lane 7
1,000 passes4.9 mm rut depth
8,000 passes9.0 mm rut depth
FIGURE 15 3D rut profiles for lane 6 and lane 7.
CONCLUSIONS AND RECOMMENDATIONS A new approach was developed to provide a framework for potentially ensuring, at the mix design phase, that asphalt mixtures will have sufficient aggregate interlock to resist permanent deformation. The subject APT experiment was conducted to verify and assess the appropriateness of the proposed approach. The subsequent findings include the following:

Greene, Kim, and Choubane 14
The Superpave gradation controls are limited in their ability to predict performance. A mixture’s DASR and the DASR porosity can be used to determine the interactive range of particle
sizes and if good contact exists between those particles. A porosity of greater than 50 percent was determined to differentiate between good and poor performing gradations.
Caution should be used when particle size interactions are marginal. Marginal interactions may include contiguous sizes whose volume proportions (large/small particle size) ranges from 25 to 35 and 65 to 75.
Minor changes in a mixtures particle size distribution may have a significant effect on rut resistance. This fact has design and production implications.
Gradation control is one step in optimizing asphalt mixture performance. The rutting performance of an asphalt mixture can also be improved through proper control of aggregate properties, binder properties, construction, etc. It is recommended that the DASR porosity of asphalt mix designs be evaluated during the design
process. Mix designs with porosities greater than 50 percent should be limited in use or otherwise modified with proper aggregate and binder properties to ensure good performance. The DASR porosity method can also be used as a forensic tool to evaluate the performance of in-service asphalt mixtures. Further research is currently underway to address the effect of interstitial components to disrupt the DASR interaction. ACKNOWLEDGEMENTS The work represented herein was the result of a team effort. The authors would like to acknowledge Kyle Sheppard, Lance Denmark, and Jason White for their diligent efforts and contributing knowledge. DISCLAIMER The content of this paper reflects the views of the authors who are solely responsible for the facts and accuracy of the data as well as for the opinions, findings and conclusions presented herein. The contents do not necessarily reflect the official views or policies of the Florida Department of Transportation. This paper does not constitute a standard, specification, or regulation. In addition, the above listed agency assumes no liability for its contents or use thereof. REFERENCES 1. Federal Highway Administration. Superpave Mixture Design Guide. Washington, D.C., 2001.
Asphalt Institute. Superpave Mix Design (SP-2). Lexington, KY, 1996. 2. McGennis, R.B., R.M. Anderson, T.W. Kennedy, and M. Solaimanian. Background of Asphalt
Superpave Mixture Design and Analysis. Federal Highway Association, Report No. FHWA-SA-95-003, Washington D.C., 1994.
3. Kandhal, P.S., and L.A. Cooley, Jr. NCHRP Report 464: The Restricted Zone in the Superpave Aggregate Gradation Specification. Transportation Research Board of the National Academies, Washington D.C., 2001.
4. Chowdhury, A., H,W, Button, and J.D.C. Grau. Effects of Superpave Restricted Zone on Permanent Deformation. Report No. 201-2, Texas Transportation Institute, College Station TX, 2001.
5. Christensen, D.W., and R.F. Bonaquist. Volumetric Requirements for Superpave Mix Design. National Cooperative Highway Research Program Report 567, Transportation Research Board of the National Academies, Washington D.C., 2006.

Greene, Kim, and Choubane 15
6. Roque, R., J. Birgison, K. Sungho, and A. Guarin. Development of Mix Design Guidelines For Improved Performance of Asphalt Mixtures. Florida Department of Transportation. Tallahassee, FL, January 2006.
7. Byron, T., B. Choubane, and M. Tia. Assessing Appropriate Loading Configuration in Accelerated Pavement Testing. Proceedings, 2nd International Conference on Accelerated Pavement Testing, Minneapolis, MN, 2004.
8. Choubane, B. S. Gokhale, G. Sholar, and H. Moseley. Evaluation of Coarse and Fine-Graded Superpave Mixtures Under Accelerated Pavement Testing. Transportation Research Record: Journal of the Transportation Research Board, No 1974, National Research Council, Washington D.C., 2005, pp. 120-127.
9. Holtz, R.D., and W.D. Kovacs. An Introduction to Geotechnical Engineering. Prentice Hall, Englewood Cliffs, N.J., 1981.

Greene, Kim, and Choubane 16
APPENDIX A: DYNAMIC MODULUS AND IDT DATA
1
10
100
1,000
10,000
1.00E‐04 1.00E‐02 1.00E+00 1.00E+02 1.00E+04
Dynam
ic M
odulus, ksi
Reduced Frequency, Hz
Lane 6 T Lane 7 T Lane 6 B Lane 7 B
FIGURE 16 Dynamic modulus data.
TABLE 1 IDT Properties HMA Layer
a D1, 1/psi m-
value Creep Rate
DCSEHMA, kJ/m3
DCSEMin, kJ/m3
Resilient Modulus,
GPa
Tensile Strength,
MPa
Tensile Failure Strain
Fracture Energy, kJ/m3
Energy Ratio
Lane 6 Top
4.62E-08
4.28E-07
0.694 3.58E-08 9.5 3.119 11.03 2.49 4847.1 9.8 3.1
Lane 6 Bottom
4.63E-08
4.27E-07
0.687 3.39E-08 6.8 3.016 10.49 2.47 3059.45 7.1 2.3
Lane 7 Top
4.58E-08
5.53E-07
0.637 2.86E-08 7.6 3.140 10.59 2.55 3891.85 7.9 2.4
Lane 7 Bottom
4.66E-08
4.07E-07
0.679 3.01E-08 5.4 2.758 12.80 2.42 5051.54 5.6 2.0

Greene, Kim, and Choubane 17
APPENDIX B: CORE VOLUMETRIC DATA
TABLE 2 Lane 6 Core Volumetric Properties Lane Core ID Section Station Offset Lift Thickness (in) Gmb Gmm Air Voids (%)
Lan
e 6
10T A 13.4 6.8 1.68 2.277 2.497 8.8 10B 13.4 6.8 2.55 2.288 2.497 8.4 11T A 18.9 2.2 1.81 2.291 2.497 8.2 11B 18.87 2.2 2.41 2.303 2.497 7.8 12T A 37.0 12.4 2.26 2.281 2.497 8.7 12B 37.0 12.4 1.72 2.273 2.497 9.0 13T B 51.1 12.4 2.21 2.287 2.497 8.4 13B 51.1 12.4 1.75 2.293 2.497 8.2 14T B 56.1 0.8 2.20 2.289 2.497 8.3 14B 56.1 0.8 2.31 2.263 2.497 9.4 15T B 64.9 3.1 2.34 2.293 2.497 8.2 15B 64.9 3.1 2.24 2.287 2.497 8.4 16T C 108.4 2.6 2.25 2.297 2.497 8.0 16B 108.4 2.6 2.22 2.302 2.497 7.8 17T C 142.0 10.6 2.05 2.307 2.497 7.6 17B 142.0 10.6 2.09 2.318 2.497 7.2 18T C 150.9 1.30 1.72 2.254 2.497 9.7 18B 150.9 1.30 2.01 2.291 2.497 8.3
TABLE 3 Lane 7 Core Volumetric Properties
Lane Core ID Section Station Offset Lift Thickness (in) Gmb Gmm Air Voids (%)
Lan
e 7
1T A 4.17 10.34 1.36 2.27 2.499 9.2 1B 4.17 10.34 1.83 2.339 2.499 6.4 2T A 10.16 3.26 1.66 2.313 2.499 7.4 2B 10.16 3.26 2.17 2.354 2.499 5.8 3T A 25.13 2.17 2.26 2.307 2.499 7.7 3B 25.13 2.17 2.00 2.347 2.499 6.1 4T B 58.89 10.07 1.98 2.289 2.499 8.4 4B 58.89 10.07 1.91 2.319 2.499 7.2 5T B 62.07 6.53 2.09 2.295 2.499 8.2 5B 62.07 6.53 1.83 2.287 2.499 8.5 6T B 98.55 2.99 2.14 2.322 2.499 7.1 6B 98.55 2.99 1.92 2.329 2.499 6.8 7T C 107.1 8.61 2.00 2.28 2.499 8.7 7B 107.1 8.61 1.87 2.308 2.499 7.7 8T C 112.1 6.53 2.12 2.295 2.499 8.2 8B 112.1 6.53 1.94 2.295 2.499 8.2 9T C 151.5 7.07 2.09 2.235 2.499 10.5 9B 151.5 7.07 2.29 2.256 2.499 9.7

Greene, Kim, and Choubane 18
APPENDIX C: FWD AND PSPA DATA
TABLE 4 Lane 6 Backcalculated Moduli
Lane 6
East Wheel Path Center Wheel Path West Wheel Path
Station (ft)
HMA (ksi)
Base (ksi)
Subgrade (ksi)
Station (ft)
HMA (ksi)
Base (ksi)
Subgrade (ksi)
Station (ft)
HMA (ksi)
Base (ksi)
Subgrade (ksi)
60 331 61 35 15 349 49 31 59 411 66 34
70 304 67 38 23 343 60 33 73 337 61 40
83 456 69 41 34 410 73 32 83 357 56 42
94 313 72 40 44 529 52 33 93 339 52 44
101 380 47 41 50 290 75 36 100 468 46 44
117 405 43 45 117 554 46 48
127 370 47 52 127 369 84 48
137 463 48 55 137 440 35 50
144 762 30 42 145 713 30 44 Note: The HMA modulus was adjusted to a reference temperature of 77�F.
TABLE 5 Lane 7 Backcalculated Moduli
Lane 7
East Wheel Path West Wheel Path
Station (ft)
HMA (ksi) Base (ksi)
Subgrade (ksi)
Station (ft)
HMA (ksi)
Base (ksi)
Subgrade (ksi)
11 375 36 27.80 11 566 37 27
21 466 44 33.60 24 361 63 37
32 343 53 38.10 34 348 76 39
42 390 49 34.40 44 342 59 38
53 355 47 33.90 50 376 59 35
58 370 43 30.80 60 371 68 35
74 378 46 29.90 73 327 77 35
84 470 41 31.80 83 374 59 37
95 420 35 34.20 93 362 53 38
100 427 36 32.60 100 376 48 34
116 482 38 35.00 116 447 44 40
127 376 42 42.40 126 419 44 56
137 431 43 42.90 136 563 47 51
148 488 41 40.70 145 657 38 40
Note: The HMA modulus was adjusted to a reference temperature of 77�F.

Greene, Kim, and Choubane 19
A Portable Seismic Pavement Analyzer (PSPA) was used to determine the stiffness (Elastic modulus) of the asphalt layer of each lane. The Bells equation was used to determine the mid-depth HMA temperature. Seismic moduli determined by PSPA are corrected to a temperature of 77°F and a design frequency of 15 Hz using the following equation:
)2.3(*)2627.1)
9
5*)32((*0109.0(
77
T
EE PSPA
Fo
Where: E77°F = design modulus of the AC pavement, ksi EPSPA = modulus measured from the PSPA, ksi T = AC mid depth pavement temperature, °F
TABLE 6 PSPA Seismic Moduli Section Station (ft) Modulus
North to South East to West (ksi)
6A 40 4.5 474 6.5 478 8.5 464
6B 84
1.3 496 3 468 5 475 7 460 9 493
11 490
6C 128
1.3 498 3 465 5 486 7 489 9 476
11 482
7A 40
2 426 4 488
6.2 463 8.4 502
10.4 466
7B 84
2 430 4 453
6.2 447 8.4 412
10.4 396
7C 128
2 425 4 419
6.2 495 8.5 444
10.4 431