accelerated testing validation - department of energy · accelerated testing validation. rangachary...
TRANSCRIPT
Accelerated Testing Validation
Rangachary Mukundan (PI), Rodney Borup, John Davey, Roger Lujan
Los Alamos National LaboratoryAdam Z. Weber
Lawrence Berkeley National LaboratoryGreg James
Ballard Power Systems, IncMike Brady
Oak Ridge National LaboratorySteve Grot
Ion Power, IncThis presentation does not contain anyproprietary or confidential information
Objective/Barrier/Target
The objectives of this project are 3-fold1. Correlation of the component lifetimes measured in an AST to real-world
behavior of that component.2. Validation of existing ASTs for Catalyst layers and Membranes3. Development of new ASTs for GDLs, bipolar plates and interfaces
Technical Barrier Addressed: A. Durability• Durability of fuel cell systems operating over automotive drive cycles has not
been demonstrated.• Stationary fuel cells must achieve greater than 40,000 hours durability to
compete against other distributed power generation systems. • Research is also needed to understand failure mechanisms and develop
mitigation strategies.
Technical TargetsAutomotive : Durability with cycling: 5,000 hours (2010/2015): 2005 Status (2000 hours for stack and 1000 hours for system) Stationary : Durability: 40,000 hours (2011): 2005 Status = 20,000 hours

ApproachObjective1 : Correlation of the component lifetimes measured in an AST to real-world behavior of that component.
Stack
B.O.P.
BOP/Stack Data (Total 4)Thermodynamic conditions – AverageFrequency & size of voltage transients
Stack Data (Total 4)Define distribution of degradation of
MEAsPick 3 MEAs from each of the highest,
lowest & average degradation for further analysis
Medium High Low
Bus Fleet DataProvide voltage degradation distribution data
from P5 fleet & HD6 ModuleProvide detailed degradation data from buses
analyzed in detail (4)
Cell Data (Total 36 samples)Perform Cathode CVs (EPSA)Perform Anode CVs (EPSA)Global Loss Break Down TestLocal Loss Break Down & Limiting Current Test
(3 points)
MEA X-Section (Total 108)Membrane Thickness changePlatinum layer thickness changePlatinum particle size changePlatinum in the membrane levelRuthenium concentration on Cathode
Field Data
Correlate AST & Field Data Versus Physical Attribute Change
Good correlation if AST slope similar to Field data slope
Physical Attribute Change
AST Data
Voltage Loss
LANL

Approach (Objective 1)Materials• New MEAs, and GDLs used in the bus modules for AST analysis
Field data analysis of 3 bus stacks from different locations and routes• Bus stack(s) are presently in service, or recently returned• Data analysis from one bus module using a different MEA design• Bus module data set will be Pareto plots showing importance of operating
conditions (Voltage jumps, start/stop, etc.)
Testing of in-service bus stacks/modules in the lab to compare/confirm field results• Analysis of MEAs selected from stacks • Global and localized Loss Voltage Breakdown (Kinetic, Ohmic, Mass
Transport)• Localized cathode limiting current• Global ECSA (anode and cathode)
FA Analysis of cross-sectioned MEAsMembrane thickness, Pt layer thickness, Pt particle size, Pt in the membrane, Ruthenium on the cathode

Approach (Objective 1)Test materials with widely varying durability• Custom membranes/MEAs
supplied by ion power• Bus MEAs provided by Ballard
Power Systems• Commercial MEAs obtained from
W.L. Gore
Correlate loss in AST metric to cell performance (LBNL)• ECSA to voltage loss in kinetic
region• Cross-over to OCV
Analyze EOL MEAsCorrelate physical attribute to performance loss

Approach (Objective 2)Objective 2 : Validation of existing ASTs for Catalyst layers and Membranes
Vcell = U −ηORR −ηHOR −ηΩ,HFR −ηΩ,elec −ηtx,H2 ,elec −ηtx,H2 ,GDL −ηtx,O2 ,elec −ηtx,O2 ,GDL −ηtx,H2O,GDL
ηΩ, cat = i Rsheet
3+ζ
Voltage loss Breakdown
Ignore anode kinetics and transport
Membrane degradation
Pt Catalyst degradation
Carbon Corrosion
GDL degradation
Catalyst layer ionomer degradation
ηΩ,HFR
ηORR
ηtx,O2 ,elec
ηtx,O2 ,GDL
ηΩ,elec
Better understand ionomer degradation and losses due to proton conduction in electrode
LBNL Porous electrode model
• Verify single component degradation in current ASTs• Correlate with fuel cell drive cycle data

Approach (Objective 3)
Objective 3 : Development of new ASTs for GDLs, bipolar plates and interfaces
GDL Durability• Multiple materials supplied by SGL• Develop an AST for durability of GDL (hydrophobicity loss)• Test #1: Water Immersion (ex-situ)• Test #2: Vapor Water in Oxidative Conditions (Air + potential in-situ)• Test #3: GDL Cycling (T, RH, V in-situ)
Bipolar plate Durability• Metal and Nitride (ORNL) bipolar plates • Test #1. Corrosion measurement with simulated fuel cell conditions• Test #2. Corrosion measurement with applied potential
MEA Interface Durability• Test #1: Constant current operation at ≤ -20 oC• Test #2: Freeze/thaw cycling of un-purged cells to – 40 oC
Project Timeline
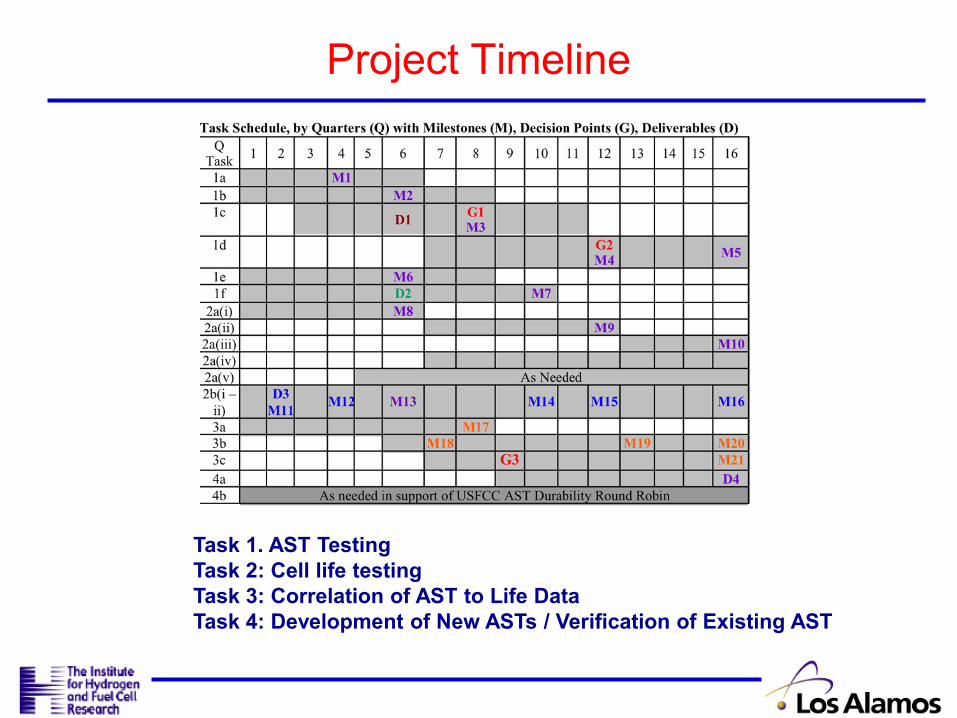
Task 1. AST TestingTask 2: Cell life testingTask 3: Correlation of AST to Life DataTask 4: Development of New ASTs / Verification of Existing AST

Project Timeline
Begin08/09
End09/13
G309/12
MilestonesM1 : Ballard delivers BOL Bus MEAs and initial breakdown analysisM2 : Develop GDL ASTM3 : Complete initial AST testingM4 : Complete Drive cycle testing with start up / shut downM5 : Final Statistical correlation of AST and Bus data to material property and AST lifetimes to drive cycle of materials with varying lifetimesCo-ordinate with USCar Tech Team and USFCC fuel cell council
Go/No go DecisionG1 : Stop using multiple Membranes and down-select a membrane if degradation mechanism of various initial membranes is identicalG2 : Initial Correlation of AST of life cycle and bus data – Redirect AST based on resultsG3 : Go/ No go on Freeze AST for MEA interfaces
M103/10
G109/11
G201/12
M509/13
M209/10
M309/11
M409/12
OrganizationLANL• Co-ordinate project• Perform all ASTs and Drive cycle testing• Materials Analysis of EOL materials
Ballard Power Systems• Analyze Bus Data• Deliver BOL MEAs used in Busses• Analysis of EOL MEAs
Ion Power ORNLDeliver MEAs with varying durabilityDeliver metal bipolar plates
LBNL• Detailed Voltage loss break-down• Statistical correlation of materials properties to lifetimes and AST metric loss
of materials with differing durabilities

BudgetDOE Cost Share Recipient Cost
ShareTOTAL
$4,000,000 $159,790 $4,159,790
96% 4% 100%
FY09-10 (Year 1)LANL $550k
Industrial + Univ. Partners (Ballard, Ion Power) $239kOther National Labs (LBNL, ORNL) $234k FY09-FY10 Total $1023k
YR 1 YR 2 YR 3 YR 4 CUMULATIVE
$1023k $1081k $1037k $1020k $4160k

Any Inputs/Needs
Continued feedback from USCAR Tech Team on ASTs
Any additional input from Stationary fuel cell OEMs