accelerating adaptive processes: product innovation in the
TRANSCRIPT

Accelerating AdaptiveProcesses: ProductInnovation in the GlobalComputer Industry
Kathleen M. EisenhardtBehnam N. TabriziStanford University
© 1995 by Cornell University,0001-8392/95/4001-0084/$! .00,
The research was very generouslysupported by the Alfred P, SloanFoundation and was conducted while thefirst author was the Finmeccanica FacultyScholar, We appreciate the manycontributions made by members of theStanford-McKinsey-Augsburg researchteam. We also benefitted immenselyfrom the very helpful advice of ShonaBrown, Lee Fleming, Charlie Galunic,Andy Hargadon, Jim Jucker, Bob Keeley,Neil Kane, Laura Kopczak, GarryMarchant, Anne Miner, Christine Oliver,Bob Sutton, Marcie Tyre, Mark Zbaracki,Harvard and Stanford seminarparticipants, and our three anonymousreviewers.
This paper contrasts two theoretical models for firms'achieving fast adaptation through product innovation.The compression model assumes a well-known, rationalprocess and relies on squeezing together or compressingthe sequential steps of such a process. The experientialmodel assumes an uncertain process and relies onimprovisation, real-time experience, and flexibility. Thetwo models are tested using data from 72 productdevelopment projects drawn from European, Asian, andU.S. computer firms. The results indicate that using anexperiential strategy of multiple design iterations,extensive testing, frequent project milestones, a powerfulproject leader, and a multifunctional team acceleratesproduct development. In contrast, the compressionstrategy of supplier involvement, use of computer-aideddesign, and overlapping development steps describesfast pace only for mature industry segments. The resultsalso show that planning and rewarding for scheduleattainment are ineffective ways of accelerating pace. Weconclude with linkages to punctuated equilibrium andselection models of adaptation, fast organizationalprocesses, organic versus improvisational structures, andcomplexity theory.*
Adaptation is a process of fundamental interest toorganizational scholars. Historically, a debate has beenshaped by two extreme perspectives. One is thatorganizations are inertial and so are unable to changesignificantly. The other is that organizations are malleableand can realign with evolving conditions. More recently, thisdebate has shifted from whether adaptation happens to howand when it occurs (Gersick, 1994), Punctuated equilibrium,which centers on large, infrequent, structural changes toachieve adaptation, has emerged as the dominant model ofsuch processes (Miller and Freisen, 1984; Romanelli andTushman, 1994), Yet, as others (Miller and Chen, 1994;Brown and Eisenhardt, 1995b) have observed, adaptationcan also occur through small, frequent shifts in how firmscompete in the marketplace.
Product innovation is a primary way in which this alternativeform of adaptation can happen. For many organizations,creating new products is a central path by which they adaptand sometimes even transform themselves in changingenvironments (Womack, Jones, and Roos, 1990; Dougherty,1992; Brown and Eisenhardt, 1995a), Hewlett-Packardtransformed from an instruments company to a computer-based one through new product development. Similarly, Intelchanged from a memory company to a microprocessor firmthrough product development (Burgelman, 1991), Thus, inthe face of intense international competition, rapidtechnology evolution, and customers' maturing expectations,product innovation is a primary way in which firms actuallyadapt.
In recent years, fast adaptation has become a pivotal,strategic competence for many organizations (e,g,,Eisenhardt, 1989; Stalk and Hout, 1990), Not surprisinglythen, this same theme of fast pace has become critical inproduct innovation. The evidence for the importance of rapid
84/Administrative Science Quarterly, 40 (1995): 84-110
Adaptive Processes
product development to success is compelling, Vesey (1991)reported on a study of high-technology products, showingthat products that were six months late in entering themarket, but were within budget, earned 33 percent less overa five-year period than they would have if on time. Enteringthe market on time, even 50 percent over budget, reduced afirm's profitability by only 4 percent for that product.Moreover, fast product development is usually moreproductive and lower cost, because lengthy time in productdevelopment tends to waste resources on peripheralactivities, changes, and mistakes (Stalk and Hout, 1990;Clark and Fujimoto, 1991), Thus, although there may bepitfalls to rapid product development (von Braun, 1990), it isoften essential for the successful adaptation and, ultimately,for the survival of firms.
But how do firms develop products quickly? Several previousresearch streams provide some insights. One streamsynthesizes the experiences of the authors, often peoplewith decades of experience in product development (e.g..Gold, 1987; Rosenau, 1988; Stalk and Hout, 1990; Cordero,1991; Vesey, 1991), Although they typically have littlesystematic data or theoretical foundation, they do tend tohave captivating anecdotes and many ideas for managerialpractice. Drawing on his extensive industrial experience,Rosenau (1988), for example, enumerated about 10 factorsthat are organized around the key idea of shortening thetime of steps in the development process. Similarly, Cordero(1991) drew on his industry experience to emphasize theuse of computer-aided design (CAD) as well as carefulplanning and targeted rewards to accelerate productdevelopment,
A second stream emphasizes impressionistic data gatheredfrom managers engaged in product development (e,g,, Guptaand Wilemon, 1990; Mabert, Muth, and Schmenner, 1992;McDonough, 1993), Typically, the methodology involvesusing surveys to gather the broad, general attitudes andopinions of single informants within a firm about fast productdevelopment, Gupta and Wilemon (1990) surveyed 80managers on the factors that they believed would speed upand slow down product development. Among these factorsare the importance of senior management support,multifunctional involvement, and detailed productrequirements planning, Millson, Raj, and Wilemon (1992)extended this work to a rational blueprint for acceleratingnew product development: (1) simplify, (2) eliminate delay,(3) eliminate steps, (4) speed up operations, and (5) performparallel processes,
A third research stream is characterized by in-depth casestudies or small-sample studies conducted in globalindustries, frequently emphasizing the virtues of Japanesemanagement (e.g., Quinn, 1985; Imai, Nonaka, andTakeuchi, 1985; Clark, Chew, and Fujimoto, 1987; Womack,Jones, and Roos, 1990; lansiti, 1992), Imai, Nonaka, andTakeuchi (1985) studied five innovative and successfulJapanese products, each representing a differenttechnology-based industry. The authors argued that aninvolved supplier network has the strongest effect on thespeed of development. In a later study, Clark and his
85/ASQ, March 1995

colleagues (Clark, Chew, and Fujinnoto, 1987; Hayes,Wheelwright, and Clark, 1988; Clark and Fujimoto, 1991)found that supplier involvement, nnultifunctional teanns, andoverlapping product development stages are among thepivotal determinants of rapid product development in theglobal automotive industry.
Taken together, these research results outline broad factors,such as planning, the use of CAD, supplier involvement,powerful project leaders, and multifunctional teams thatquicken the pace of product development. This work givesmuch needed insight into fast product development. Yetthese ideas often rest on impressionistic data from theauthors' career experiences or managers' subjectiveperceptions of product development processes. Althoughthe data underlying the third stream are more systematic,even here, the theory is modest, the sample sizes are small,and there is limited or no multivariate testing of hypotheses.Also, since most of these studies emphasize themanagement practices of successful Japanese companies,often in the auto industry (e.g., Womack, Jones, and Roos,1990; Clark and Fujimoto, 1991), their generalizability isconfounded by the questions of whether the results areunique to Japan or to large, mechanical assembly products.
In contrast to the research on fast product development, afew authors have looked at pace outside of the productdevelopment context. Bastien and Hostager (1988) explainedhow jazz musicians relied on improvisation to createinnovative music rapidly. Eisenhardt (1989) examined howexecutives make fast strategic decisions in the high-velocity,computer industry. Weick (1993) described how somefirefighters quickly assessed a catastrophic situation andlived, while others perished. In each of these studies, thesituations are highly uncertain, and the people involved relyon highly experiential and real-time information in thecontext of targeted structure to achieve fast pace. Unlike theproduct development research, this work suggests achievingfast pace by relying on iterative experiences, flexibility, andimprovisation.
This paper explores rapid adaptive processes, focusing onproduct innovation as a crucial adaptive process. We createtwo theoretical models, one building on existing productdevelopment research and the other relying on findings thatemphasize real-time experience, flexibility, and improvisation.We then examine them with data from 72 productdevelopment projects from 36 Asian, U,S,, and Europeanfirms operating in the fast-paced, global computer industry.The computer industry is characterized by short product lifecycles, intense and international competition, an evolvingscientific base, and a lack of Japanese domination. It is ahigh-velocity industry where speed matters (Bourgeois andEisenhardt, 1988),
At a higher level, the paper attempts to open up organizationtheory to a more dynamic conception of firms. Much oforganization theory is locked into static equilibrium models,such as transaction-cost economics, resource dependence,agency, and contingency theories. Even organizationecology, which is dynamic at the population level, is largely
86/ASQ, March 1995
Adaptive Processes
inertial at the firm level, and models of change, such aspunctuated equilibrium are, in fact, highly static. Yet fastpace and quick adaptation have emerged as central,competitive capabilities for contemporary firms (Eisenhardt,1989; D'Aveni, 1994; Galunic and Eisenhardt, 1996). Thetwo theoretical models developed here sketch potentialorganizational forms for creating such core capabilities. Wealso attempt to contribute to the innovation literature bydeveloping more theoretically based models of rapid productdevelopment and testing them using a larger sample andmore systematic research design than previous work.
BACKGROUND
A classic distinction in organizational thinking is betweensituations that can be described as certain, predictable,well-understood, or routine and situations that arecharacterized as unpredictable, intractable, or uncertain(Burns and Stalker, 1961; Galbraith, 1973; Scott, 1987). Animplication of this distinction is that when situations arecertain or predictable, then people can plan and organizetheir activities to rely on routine and bureaucraticorganization (Galbraith, 1973). When uncertainty reigns, thenpeople adjust to this lack of information by being moreexperimental, flexible, and even improvisational (Scott,1987).
This distinction appears in numerous areas of organizationalinquiry. In organizational design, authors describe howconditions of low uncertainty are best adapted tobureaucratic or mechanistic organizations, while in conditionsof high uncertainty, more flexible, adaptive, organicorganizations are appropriate (Burns and Stalker, 1961;Lawrence and Lorsch, 1967; Galbraith, 1973). The distinctionalso appears in decision-making theories. Fredrickson (1984)advised that when uncertainty is low, rational models ofgoals and choice processes are appropriate, whereas lesscomprehensive models become relevant in more uncertain,turbulent settings. Typologies of efficient problem-solvingstrategies for differing technologies (Thompson, 1967;Perrow, 1986) and organizational control (Ouchi, 1980) alsoreflect the distinction between certain and uncertain tasks.
This same distinction emerges in the nascent theorizingabout fast product development. One approach, drawingfrom much of the existing product development literaturesurveyed above (e.g., Rosenau, 1988; Womack, Jones, andRoos, 1990; Stalk and Hout, 1990; Millson, Raj, andWilemon, 1992), as well as disciplines such as civilengineering, is based on what we term the compressionstrategy. It assumes that product development is apredictable series of steps that can be compressed.Acceleration involves planning these steps (e.g., Gupta andWilemon, 1990; Womack, Jones, and Roos, 1990),simplifying them through supplier involvement (e.g., Imai,Nonaka, and Takeuchi, 1985; Clark and Fujimoto, 1991),shortening the time that it takes to complete each step inthe development process (e.g., Rosenau, 1988; Stalk andHout, 1990; Cordero, 1991), overlapping development steps(Stalk and Hout, 1990; Clark and Fujimoto, 1991), andrewarding designers for speed (e.g.. Gold, 1987). Overall,
87/ASQ, March 1995

this strategy involves rationalizing the steps of the productdevelopnnent process and then squeezing or connpressingthem together.
An alternative view is what we term the experientialstrategy. The basic ideas here are found in a variety of fields,including improvisation (Bastien and Hostager, 1988; Weick,1993; Moorman and Miner, 1994), chemistry andbiochemistry (Curtis and Barnes, 1989), neurobiology (Levy,1994), cognitive psychology (Payne, Bettman, and Johnson,1988), and strategic choice (Eisenhardt, 1989; Eisenhardtand Zbaracki, 1992), as well as in some productdevelopment literature (e.g., Quinn, 1985). The keyassumption here is that product development is a veryuncertain path through foggy and shifting markets andtechnologies. Thus acceleration in this scenario involvesrapidly building intuition and flexible options so as tocope with an unclear and changing environment. Yet,simultaneously, it also involves providing enoughstructure so that people will create sensemaking, avoidprocrastination, and be confident enough to act in thesehighly uncertain situations, which easily lead to paralyzinganxiety and conflict. This approach is thus more a responseto uncertainty than certainty, more iterative than linear, andmore experienced-based than planned.
The thesis here is that both compression and experientialstrategies accelerate product development. Yet becausethey have different assumptions about the underlyingprocess (i.e., certainty vs. uncertainty), they do so indifferent ways. To the extent that product developmentis a predictable path through well-known markets andtechnologies, then the compression strategy is relevant. Ifthe path is more uncertain, then an experiential strategy isrelevant. In the next sections, we expand these strategiesthrough a series of hypotheses and examine themempirically.
Hypotheses
Compression strategy. The underlying assumption of thecompression strategy is that product development is apredictable or certain process, one that can be planned outas a series of discrete steps. Such a process can then becompressed by shortening the time of each step,overlapping the execution of successive steps, andrewarding developers for attaining the compressed schedule.The result is accelerated product development.
From a compression perspective, more time spent inplanning is particularly important for squeezing productdevelopment time. By emphasizing planning, productdevelopers can better understand and rationalize thedevelopment process (Gupta and Wilemon, 1990). This, inturn, allows them to eliminate unnecessary steps (Cordero,1991) and sequence activities in efficient order. Withoutsuch planning, developers are more likely to do tasks thatare not needed or to do them incorrectly, resulting in wastedresources through substantial delays and backtracking asthese mistakes are fixed. Further, more time spent inplanning can also help developers to delegate steps
88/ASQ, March 1995

Adaptive Processes
appropriately to the best-qualified people, who, in turn, canprobably execute the task most quickly. Thus more timespent in planning should help shorten project time byrationalizing the process, reducing mistakes, and shorteningdelays (e.g,, Rosenau, 1988; Gupta and Wilemon, 1990;Cordero, 1991; lansiti, 1992), Hayes, Wheelwright, and Clark(1988) explicitly noted the importance of predevelopmentplanning to fast product development.
More time spent in planning also squeezes developmenttime because it can help to smooth interactions amongdevelopers and gain resources, both of which can acceleratepace. Planning provides a blueprint for action that organizesproject team interaction. Such planning can limitmisunderstandings and reduce time-consuming coordinationproblems, as team members can refer to the plan forcommon language and understanding, Womack, Jones, andRoos (1990) observed that when lean automotivemanufacturers spent substantial effort in planning, conflictswere resolved and the projects moved ahead more quickly.Lack of resources can also be a roadblock to fast productdevelopment. Development teams that spend more timeplanning may have an edge in gaining resources becauseplanning can enhance the appearance of being competentand well organized (Pfeffer, 1992), Thus extensive planningcan serve as an important signal of project quality (Feldmanand March, 1981), In formal terms:
Hypothesis 1 (HI): More time spent in planning is associated withshorter development time,
A key assumption of the compression perspective is thatproduct development is a series of predictable steps.Because the development steps are clear in advance,another way to shorten development time is to delegate theexecution of those steps to another organization throughsupplier involvement (Gold, 1987; Imai, Nonaka, andTakeuchi, 1985; Clark and Fujimoto, 1991), Supplierinvolvement in many stages of the process reduces theworkload of the focal team, as Clark and Fujimoto (1991)found in their study of the automotive industry, because thework of developing ideas and designs is shared withsuppliers. Further, supplier involvement allows the focaldevelopers to focus on the execution of tasks that takeadvantage of their key competencies and skills. Productdevelopment time is also shortened because suppliers canexploit their own competencies as well. Thus, since thosewith more expertise can execute tasks faster, supplierinvolvement in more steps of the design process shouldreduce product development time.
Supplier involvement is also fast for other reasons. Ifsuppliers are involved in many steps of the process, thenthey are more likely to catch future problems, such ascontradictory specifications or unrealistic designs, sooner inthe process, when they are easier to fix. Supplierinvolvement also improves thinking about the product designby integrating suppliers' ideas and alternative perspectivesinto the product in more stages of the process. In theirstudy of six product development projects among heavyindustrial manufacturers in the U,S, midwest, Mabert, Muth,
89/ASQ, March 1995
Personal communication with AndrewHargadon, a Ph,D, student at StanfordUniversity and former product-development engineer.
and Schmenner (1992) found that the suppliers wereinvolved in many stages of fast projects. In formal terms:Hypothesis 2 (H2): More supplier involvement is associated withshorter development time.
Product development time can also be compressed byshortening the time of individual steps in the developmentprocess (e,g,, Rosenau, 1988; Stalk and Hout, 1990), Whileapproaches to trimming step time may vary with differenttypes of development processes, one important tool is CAD(Rosenau, 1988), As Cordero (1991) observed, CAD speedsup computation times in the design process by allowingdevelopers to reach a final design more quickly through theautomation of predictable computational procedures. MoreCAD use in the development process should shorten theentire process by accelerating the computations of individualengineers.
More CAD use by developers also shortens predictableprocesses through the reuse of past designs (Huber, 1991),Reusing past learning and expertise should dramaticallyshorten actual design time and lead to fewer errorsdownstream that need to be corrected. Such reuse shouldsignificantly reduce the risk of a product's nonfunctionality ata later date, when such errors are much more difficult to fix.
Finally, more CAD use by developers can also smoothinteraction among project team members, CAD systemsgive developers an electronic communication net that canexpedite both communication and coordination amongproduct designers,'' In formal terms:
Hypothesis 3 (H3): More designers using computer-aided design(CAD) is associated with shorter development time.Compression of product development steps involves notonly shortening individual steps, but also reducing the waittime between steps or even overlapping those steps (Stalkand Hout, 1990), Predictable steps can be overlappedbecause they are better known in advance, more tasks canbe accomplished in parallel, and the waiting time betweensteps can be eliminated by overlapping these steps, Imai,Nonaka, and Takeuchi (1985) found that problem solvingcould be overlapped by overlaying engineering andproduction phases in the development of a successful (andfast time-to-market) copier developed by Fuji-Xerox,Likewise, Clark and Fujimoto (1991) found that overlappingsteps, such as integrating die design and die making,significantly reduced product cycle time. Drawing from theirexperience, other authors (e,g,. Gold, 1987; Cordero, 1991)have given similar importance to project overlap. Therefore:
Hypothesis 4 (H4): A higher degree of project overlap is associatedwith shorter development time.
Multifunctional teams are closely linked to successful projectoverlap (e,g,, Quinn, 1985; Stalk and Hout, 1990; Clark andFujimoto, 1991) because the different stages rely ondiffering blends of multifunctional expertise. Such teamspermit development steps to be integrated and linktechnical, marketing, and manufacturing activities. Suchteams also speed up the product development processbecause downstream problems in the various functionalareas are more likely to be observed early in the process.
90/ASQ, March 1995

Adaptive Processes
when they are easier to correct (e.g., Imai, Nonaka, andTakeuchi, 1985; Gold, 1987). Further, involving morefunctions early in the process reduces the wait timebetween steps (Stalk and Hout, 1990), The time that it takesto move between design and prototype manufacturing, forexample, is likely to be reduced when manufacturing peopleare already present on the team (e,g,, Gupta and Wilemon,1990; Cordero, 1991; Mabert, Muth, and Schmenner, 1992),In formal terms:
Hypothesis 5 (H5): Multifunctional teams are associated withshorter developnnent time.
The above hypotheses involve compressing developmenttime through up-front planning, leveraging the expertise ofsuppliers, using CAD to cut the execution time of individualdevelopment steps, and overlapping product developmentphases through the use of multifunctional teams. Our finalcompression hypothesis addresses motivating developers toshorten process time.
As suggested by agency, achievement, and learning theoriesof motivation, as well as by some product developmentwriters (e,g,. Gold, 1987; Gupta and Wilemon, 1990;Cordero, 1991), rewards can have an important effect onproduct development speed. This is particularly true whenthe development process is predictable. In these situations,an explicit development schedule can be created, andrewards can be tied to meeting that schedule. Rewardsbased on schedule attainment focus the attention ofdevelopers on the particular project at hand, rather than onother projects, and on time-based performance, rather thanon other issues, such as the technological sophistication ofthe product. This increases speed because it limits effortsthat are peripheral to the central task.
In addition, rewarding product developers for achieving cleardeadlines better synchronizes the energies and attention ofthe team (Gersick, 1988), Clear goals also typically createteam alignment (e,g,, Sherif et al,, 1961) and so limittime-consuming bickering about the ultimate agenda of thegroup. For all of these reasons, rewarding the project teamfor schedule attainment should focus and motivatedevelopers to shorten product development time. Thesearguments lead to the following hypothesis:
Hypothesis 6 (H6): Greater reward for schedule attainment isassociated with shorter development time.
Experiential strategy. In contrast to the compressionstrategy, the experiential strategy suggests that movingfaster simply by accelerating an existing, albeit streamlinedprocess is unrealistic. The underlying assumption here is thatproduct development is a highly uncertain path throughfoggy and shifting markets and technologies. The key to fastproduct development is, then, rapidly building intuition andiflexible options in order to learn quickly about and shift withuncertain environments. At the same time, it is alsoimportant to create structure and motivate pace in thesesettings, because the uncertainty can create paralyzinganxiety about the future (George, 1980; Weick, 1993), Thusfast pace entails both cognitive and emotional issues,
91/ASQ, March 1995

From the experiential perspective, one way to speed upproduct development is through frequent iteration. Just ascatalysts and heat accelerate chemical reactions by creatingmore opportunities for reactions to occur (Curtis and Barnes,1989), multiple design iterations (also termed "prototyping"in some popular literature) accelerate product design bysimply offering more opportunities or chances for a "hit."These design iterations can be simultaneous, alternativedesigns, designs that are iterations of previous designs, orsome combination of the two. Regardless of the actualiteration pattern, simply increasing the number of designiterations improves the odds of success and thusaccelerates the process, particularly when predictable pathsdo not exist.
Iterations also shorten development time for other,more subtle reasons. They accelerate the building ofunderstanding about the product. By trying design variations,developers can gain an intuitive feel for the sensitivity of theparameters and the robustness of the designs. Similar tosituated learning (e.g.. Brown, Collins, and Duguid, 1989;Lave and Wenger, 1991), learning by doing through multipleiterations is a quicker way to learn than less participative andmore cognitive strategies. Further, as several authors havedescribed (Payne, Bettman, and Johnson, 1988; Eisenhardt,1989), judging the worth of an iteration is particularly difficultin unpredictable settings. Multiple iterations make suchjudgments easier, since comparing alternatives makesstrengths and weaknesses much more apparent (Payne,Bettman, and Johnson,1988; Eisenhardt, 1989).
Iterations also build more flexibility into understanding. Manyiterations improve cognitive ability to shift with newinformation (Eisenhardt, 1989; Weick, 1993). Also, whenthere are many iterations, designers are also less likely tobecome attached to one particular variation and so are betterable to adjust if changing conditions warrant it. Finally,iterations shorten the process by improving the confidenceof development teams. Teams that have created multipleiterations will be less likely to procrastinate because they worrythat they may be missing better alternatives and so be moreable to settle on a design (Eisenhardt, 1989). In formal terms:Hypothesis 7 (H7): More design iterations are associated withshorter development time.Testing throughout the design process is closely related tofrequent iterations. Testing reveals problems that can thenbe addressed in subsequent design iterations. Testingspeeds product development because developers are morelikely to discover errors earlier in the process, when they areeasier to correct (Gupta and Wilemon, 1990). Testingthroughout the development process gives frequentevaluations of the current design. In contrast, withoutextensive testing, developers may uncover their errors toolate. Testing is especially important in uncertain situations, inwhich developers are more likely to discover, rather thananticipate errors.
A related advantage is that extensive testing acceleratesunderstanding and reconceptualization of the productthrough trial and error learning. By confronting real dataabout actual results, such as some aspect of the design that
92/ASa March 1995
Adaptive Processes
does not work or works differently than anticipated, theproduct team is firmly forced out of faulty preconceptions(Mabert, Muth, and Schmenner, 1992; von Hippel and Tyre,1993). The result is a process in which developers are likelyto update and improve their thinking frequently throughoutthe design process in response to concrete results.
While the above reasons emphasize the cognitive aspect ofthe speed advantages of extensive testing, there areemotional advantages as well. Testing also increases speedbecause it builds developers' confidence. When productteams test particular designs, the development processbecomes more concrete and believable. Like what happensin the illusion of control (Langer, 1975), developers gainconfidence because they have proactively engaged in aconcrete action. This is especially relevant in unpredictablesituations, in which people often procrastinate in the face ofuncertainty (George, 1980). Testing throughout thedevelopment process also increases speed because itcreates many failures from which designers can learn.Moreover, because the testing is on-going, the size of anyparticular failure is likely to be small, since designers haveprobably incorporated the learning from earlier failures. Suchsmall, frequent failures are very motivating and createparticularly rapid learning because they capture people'sattention but yet are not so large as to raise denial orblocking defenses (Sitkin, 1992).
Finally, testing increases development speed becauseattending to the kind of factual and concrete information thattesting provides grounds discussions in concrete facts,rather than in abstractions that can lead to endless conflictand interpersonal animosity. Several studies outside ofproduct development illustrate this phenomenon. Murnighanand Conlon (1991) found that string quartets thatconcentrated on playing music, rather than on discussingmusical choices, got along better. Similarly, Eisenhardt andBourgeois (1995) found that slavish attention to factualoperating and environmental data was characteristic of topmanagement teams that could disagree, but could still getalong. In formal terms:
Hypothesis 8 (H8): More time spent in testing throughout thedevelopment process is associated with shorter development time.
Frequent milestones (i.e., formal project review points) alsoaccelerate product development, but such milestones do notimply comprehensive planning. Rather, they suggestfrequent reassessment of the current state of progress.Frequent milestones shorten development time becausethey force people to look often at what they are doing sothat if actions are off-course, they can be corrected earlier inthe process. Particularly in uncertain situations, frequentmilestones are an effective way of checking currentprogress against evolving markets and technologies (Gersick,1994). Milestones also provide a sense of order and routinethat serves as a counterpoint to the more freewheeling andeven chaotic activities of iteration and testing (Bastien andHostager, 1988; Weick, 1993).
Frequent milestones also shorten development timebecause they are motivating. Their frequency creates a
93/ASO, March 1995

experiential models.
Table 1
sense of urgency that keeps developers from procrastinating(e,g,, Gersick, 1988), Achieving the milestones can also givepeople a sense of control and accomplishment that can bevery motivating (McClelland, 1961; Langer, 1975), Inaddition, they also may promote coordination andcommunication among different parts of the developmentteam. In contrast, with widely spaced milestones, problemsare spotted later, when it is usually harder to readjust.Project progress can stall or go off track because of limitedor incorrect direction, and misunderstandings can arisebecause of lack of communication and coordination ofactivities among developers. The adaptive process can failbecause it becomes too unstructured and chaotic (Waldrop,1992), In formal terms:
Hypothesis 9 (H9): Less time between milestones is associatedwith shorter development time.
Powerful leaders also help to accelerate productdevelopment by keeping the process focused. Such a highlyiterative and experiential process can lose its focus if theproduct team loses sight of the "big picture," Conflicts andconfusion can emerge. Powerful project leaders are essentialto hold the product development process together. Suchleaders accelerate the speed of product development bymaintaining a disciplining vision that keeps the chaos ofexperiential product development under control (Brown andEisenhardt, 1995a), Such a leader is also better able tosecure the resources that the team needs to execute thedesign task, Clark and his colleagues (Clark, Chew, andFujimoto, 1987; Clark and Fujimoto, 1991) have providedevidence for the importance of a powerful leader to the paceof a product development project. They used the term"heavyweight" to describe project leaders who report tohigh levels within the hierarchy, have high status within theorganization, and have direct responsibility for many aspectsof the project. They found that projects managed byheavyweight managers had a nine-month advantage overprojects run by managers with little influence. Thesearguments lead to the following hypothesis:
Hypothesis 10 (H10): Greater power of the project leader isassociated with shorter development time.
Table 1 summarizes and compares the compression andexoeriential models.
Comparison of Compression and Experiential Modeis
Characteristic Compression Experiential
Key assumption Certainty UncertaintyImage of product innovation Predictable series of well-defined Uncertain path through foggy &
steps shifting markets & technologiesStrategy for speed Rationalize & then squeeze the Quickly build understanding &
process options while maintaining focus &motivation
Tactics for speed Planning Multiple iterationsSupplier involvement Extensive testingCut step time through CAD Frequent milestonesOverlap with multifunctional teams Powerful leaderReward for meeting schedule
94/ASQ, March 1995

Adaptive Processes
METHODS
Sample
The research population is large (i.e., greater than $50 millionin sales) computer companies in the U.S.. Europe, and Asiathat compete in the personal computer (PC), minicomputer,mainframe, and peripherals segments of the industry. Theresearch team assembled company names from a variety ofsources, including Dataquest. International Data Corporation,and COMPUSTAT. as well as electronics trade sources, suchas Electronics News and Electronics Times.
We chose to use data from the computer industry becausethe quickly evolving scientific and competitive base andmodest capital intensity contribute to making this ahigh-velocity industry in which rapid pace is critical(Bourgeois and Eisenhardt, 1988). In addition, in contrastwith several important previous studies (Imai, Nonaka, andTakeuchi. 1985; Womack, Jones, and Roos, 1990; Clark andFujimoto. 1991), we also wanted to focus on an industry thatwas not dominated by Japanese competitors or by large,mechanical designs. Large firms were chosen so that wecould study established development processes rather thanthe more idiosyncratic and developing processes of youngand small firms.
The research team sent letters to the presidents or relevantvice presidents of these companies, asking them toparticipate in the study, and followed up with telephonecalls. Executives were assured of the confidentiality of theirdata and that only aggregate data would be reported.
The unit of analysis is the product development project.Within each company, we studied two product developmentprojects within a single product group. Research teammembers and firm executives jointly chose these twoprojects to ensure recent projects at similar levels ofcomplexity within industry segments. Most projects hadbeen completed within four to nine months of the study. Afew were as old as 12 months or as recent as two months.
We studied one medium-sized development project and onemajor development project in each firm. A major project wasdefined as one involving significant innovation, a newproduct generation, and/or a major commitment ofresources. A medium-scale project was defined as arepresentative or typical project resulting in a new product.Research team members worked with firm executives toensure a consistent interpretation of medium and majoracross firms, particularly within industry segments. Majorprojects usually were those to develop a new hardwareplatform. Medium projects usually involved the developmentof a new product within an existing platform family andcomputer architecture, such as a new model with higherprocessor speed, more input/output slots, or other similarfunctionality features. Executives preferred to select theirmost recent projects so that the resulting information wouldreflect their current practices.
Thirty-six computer companies participated in the study, witheach contributing two products from a single strategicbusiness unit (SBU), for a total of 72 products. The response
95/ASQ. March 1995

rate was approximately 70 percent. The high response rateappears to be due to extensive corporate interest in thebenchmarking information from the study. Firms were toobtain feedback at the end of the study comparing theirpractices with those of others. Reasons for declining toparticipate primarily revolved around the firms' personnelbeing too busy. Reflecting the composition of the globalcomputer industry, 50 percent of the firms were from theU.S., 30 percent from Asia, and 20 percent from Europe.Most firms were begun since 1970, with the majority havingbeen launched since 1980, Reflecting the composition of theindustry, the sample of projects was approximately 48percent personal computer, 19 percent peripherals, 14percent mainframe, and 19 percent minicomputer projects.While sampling bias is always a possibility when there arenonrespondents, the potential for sampling bias was reducedby high response rates, roughly equal response rates acrossgeographic regions, and the constrained variation of age andfirm size within the population.
Data Collection
Data were collected using a detailed instrument thatincluded top management, marketing, manufacturing, andfinance sections as well as the product development sectionstudied here. The total instrument was 107 pages long,including a 29-page product development section. Theproduct development section consisted of closed-end itemsthat focused on primarily objective information about theproduct development process (e,g,, percentage of engineerswho used CAD), Such objective data are likely to be moreaccurate and less subject to retrospective sensemaking andcommon methods variance than more subjective data(Wagner and Crampton, 1993), One of the authors was theprincipal designer of the product development section. Bothauthors have work experience in the computer industry andacademic training in computer-related fields. Severalacademics who were knowledgeable about technology-based firms, a venture capitalist, and several managementconsultants with significant experience in the industry alsoparticipated in the design. The instrument was pilot-tested atfour sites, foreign and domestic. It was then revised in lightof the pilot-test results.
Data gathering proceeded in several steps. First, aftersecuring the cooperation of the firm, the research team sentthe data collection instrument to the location where theproducts were developed. To enhance data accuracy, theinstrument included not only specific questions but alsodetailed instructions, definitions of key terms, a documentgiving an overview of the research, and the names of twomembers of the research team whom company respondentscould contact with questions at any time. Many respondentstook advantage of these communication capabilities.
According to their knowledge of specific informationrequired, different people within the firm completedparticular sections of the instrument. The information foreach project was completed by two to four members of thedevelopment project team, inciuding the leader. Theserespondents were directly involved with daily product
96/ASQ, March 1995

Adaptive Processes
development. Such knowledgeable respondents helped toensure accurate data. While completing the instrument, firmpersonnel called or faxed their research team contacts withquestions and requests for clarification, which also helped toensure accurate data.
After the instrument was completed, two research teammembers (all with field research training, most with technicalbackgrounds, and most completely blind to the hypothesesof this study) thoroughly reviewed the completed instrumentfor problems and completeness. They then met with therespondents on-site, for an average of one to two days, toverify the validity of the responses, help respondentscomplete any incomplete items, gather qualitative andobservational data, and answer questions. These verificationsessions entailed group meetings among firm personnel(including developers from both projects, project managers,and their managers) involved in completing the instrumentand the two research team members. During thesesessions, the product development section was reviewed toensure accurate data. These verification sessions also servedto limit further the potential for social desirability bias byinvolving a large number of knowledgeable individualsbeyond those specifically responsible for a given project.Discrepancies were cleared up and archival data wereconsulted to verify dates when the accuracy of the dataseemed questionable. Smaller meetings were held asappropriate. Any remaining or subsequent issues wereaddressed by follow-up phone calls and faxes.
Japanese-speaking research team members worked with theAsian firms, while Europeans handled European firms, andU.S. members focused on U.S. firms. The instrument wasavailable in English, Japanese, and German. The instrumentused in non-Japanese (e.g., Taiwan and Korea) Asian firmswas in English.
The potential for social desirability bias was reduced by theuse of multiple informants in multiple settings and by theinterest among informants in accurate, benchmark data fortheir projects in this highly competitive industry. In addition,the measures of many constructs rest on relatively objectivedata, which are less susceptible to social desirability biasingthan subjective data. The study was also embedded in alarger study of excellence among electronics firms, so firmrespondents were unaware of our specific interest in fastproduct development.
Common methods variance is also a concern. The potentialfor bias was reduced by having the instrument completedsuccessively in different ways and at different times, initiallyby two to four members of the product development teamand later, during the verification session, by the researchteam members and a larger group of firm personnel. Inaddition, the many types of measures, including percentages,elapsed times, types of people involved, and Likert-scaleitems, also limits the potential for common methodsproblems. Finally, as Wagner and Crampton (1993) observedin their review of numerous studies, the problem ofcommon methods variance is often overstated.
97/ASQ, March 1995

Measures
It was critical to measure time well, as accuratemeasurement of time is particularly important for manyconcepts in this study. The start of a project was marked bythe time at which the first meeting was held to consider thedevelopment of this specific product. Frequently, it alsomarked the first assignment of firm personnel to assess thefeasibility of the product. The ending date was the date atwhich product stabilization was reached. Stabilization is awell-known industry term describing the time at which nomore changes are made to the product. These dates wereobtained from the group response of multiple informants, asdescribed above, and were verified, as appropriate, witharchival documents. This information was maintained by aproduct development process group in many firms.
Measuring several constructs also required dividing theproduct development process into phases. These phaseswere developed with several experienced managementconsultants, a senior engineering executive with twentyyears of experience in the computer industry, and a venturecapitalist. They were then pilot-tested at four sites. Thecorporate informants had little difficulty understanding andusing these categories, as the phrasing and phases arecommon within the industry. We determined the start andend dates, the length of these phases, and their overlap withother phases from the combined response of multipleinformants.
The phases are as follows: Predevelopment or the planningphase begins at the project start and ends with completionof the basic product requirements. The conceptual designbegins with the completed basic product requirements andends with final specification of the product. Product designincludes the actual engineering work to take thespecifications to a fully designed product and ends with finalrelease to system test. Testing begins with component andsystem test and ends with release of the product toproduction. Process development begins with the firstprocess design and ends at the completion of the first pilotrun. Production start-up includes increases in productionvolume and ends at the stabilization of production. Thefollowing are descriptions of the measures for each of thehypothesized constructs.
Planning corresponds to the percentage of time that wasspent on the predevelopment phase (i.e., from the start ofthe project to the development of basic productrequirements), as designated by the respondentmanagement group. This percentage was computed bydividing the total reported time spent on planning theproduct by the total elapsed time, from the start date to theend date, of the development project.
Supplier involvement in stages of the development processwas measured by whether suppliers were involved in eachof the stages of the product development process, asdescribed above, and was calculated as the number ofstages in which suppliers actually participated. Involvementwas defined as having one or more employees of a supplier
98/ASQ, March 1995

Adaptive Processes
as recognized members of the product development team,actively participating in team meetings and design activities.
CAD usage was measured by the percentage of designengineers on the product development team (electronic,mechanical, and manufacturing process) who usedcomputer-aided design systems when designing on theproject. We also used a second, less direct measure, therating by respondents of the importance of increasing CADusage to decreasing product development time, on a 5-pointLikert scale (1 = not at all important and 5 = veryimportant). The correlation between the two measures is.50.
Project overlap was measured by the sum of the overlaps (inmonths) across the six phases described above of theproduct development project, divided by the totaldevelopment time. Higher percentages of overlap reflectedmore project overlap.
Multifunctional team was measured by whether personnelfrom specific functions were involved on the productdevelopment team during the various stages of productdevelopment. The functions were purchasing,manufacturing, marketing/sales, engineering, service, andfinance/cost accounting. For each phase of the project, wecalculated the total number of functions. The finalmultifunctional team measure is calculated by adding thetotal number of functions in every phase. As in the case ofsupplier involvement, involvement is defined as having oneor more members of the function as recognized members ofthe product development team, including active participationin team meetings and design activities.
Reward for schedule attainment was measured by a 5-pointLikert scale asking whether the product developmentpersonnel were rewarded for meeting the scheduledeadlines during the course of the project (1 = never,5 - always).
Number of design iterations was measured directly byasking how many iterations occurred in the development ofthe product. An iteration was defined as a redesign of atleast 10 percent of a product's parts. Since the scale of thisresponse might vary by industry segment (e.g., mainframesand personal computers may have different numbers ofiterations because of differences in the nature of theproduct), this measure was adjusted by the average numberof iterations for each industry segment. We divided thedifference between the number of design iterations for aproject and the average number of iterations of itscorresponding industn/ segment by the average number ofiterations in the industry segment. The industry segments ofpersonal computers, peripherals, mainframes, andminicomputers that we used as our research populationcorrespond to major product categories within the industry.
Test corresponds to the percentage of time that is spent ontesting the designs. Like the planning measure above, thispercentage was measured by dividing the total reported timespent on testing the product (from start to end date) by the
99/ASQ, March 1995

total elapsed time, from the start date to the end date, ofthe development project.
Time between milestones was measured by first asking therespondent group to provide the number of formalmilestones for the project, with a milestone defined as anofficially scheduled project review point. The respondentswere then asked the average time (weeks) between thesemilestones during the project. Since the scale of thisresponse can vary by industry segment (e.g., the time scalemay differ for personal computers and mainframes), thismeasure was adjusted in the same way as the number ofdesign iterations.
Power of the project leader was measured by asking therespondent group where in the SBU hierarchy the projectmanager reported. We coded this 1 if he or she reporteddirectly to the SBU manager (the highest reportingrelationship), and 0 if the reporting relationship were withsomeone lower in the SBU hierarchy. As a second measure,we also assessed power by whether or not the projectmanager was the final decision maker on the key issues ofbudget, team composition, and the project timetable. Theinteritem correlations for these measures ranged between.33 and .50, with a Cronbach alpha of approximately .67.
Dependent and Control Variables
Development time for each development projectcorresponds to its duration relative to the averagedevelopment time of all projects in its industry segment. Theduration of each project was measured by the start and enddates of the project, as defined earlier. The averagedevelopment time of all projects in each industry segment isthe mean of all the reported industry segment projectdurations. The relative development time was calculated bydividing the difference between each project's duration andthe average project duration of its corresponding industrysegment by the average project duration of its industrysegment. We adjusted the development time of each projectby the average development time of its segment, since theprojects in the personal computer segment, for example,may take considerably less time than projects in themainframe segment and may be subject to differentcompetitive forces pushing for completion.
Project size. As noted earlier, two projects came from eachstrategic business unit. One was a medium-size projectwhile the other was a major project. Since it seems likelythat major projects would take longer to complete thanmedium-scale ones, we controlled for these differencesusing a dummy variable. Zero indicates a medium-scaleproject, and one corresponds to a major project.
RESULTS
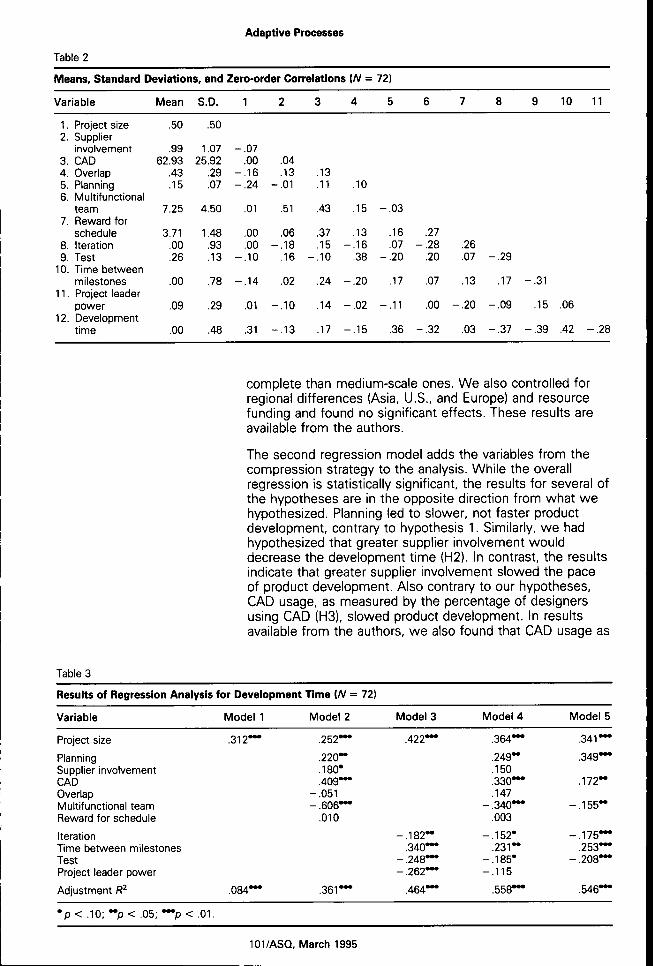
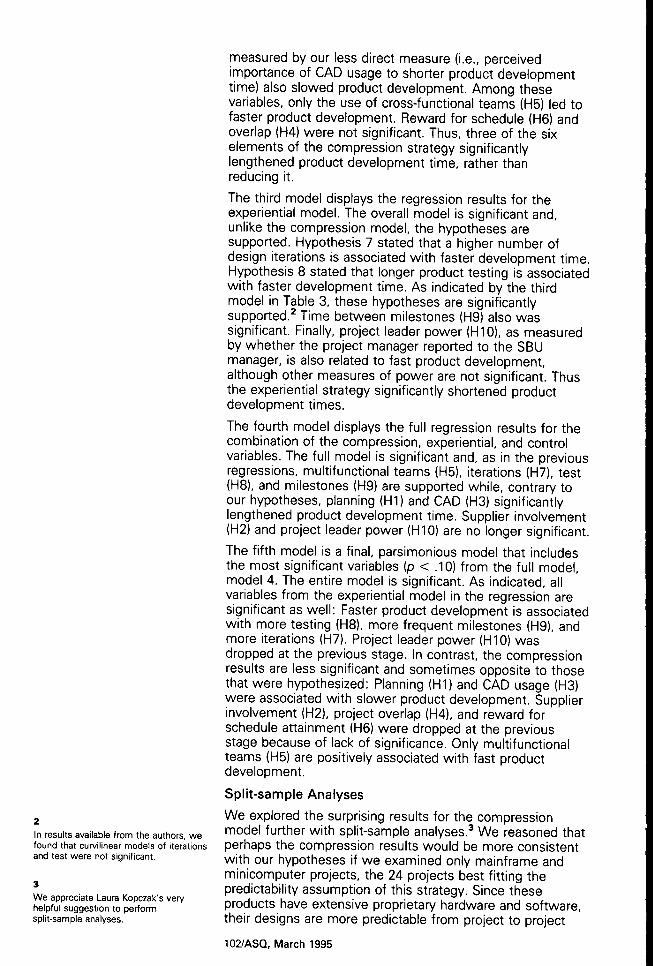
Table 2 presents the means, standard deviations, andcorrelations among the variables. Table 3 presents theresults of the ordinary least squares regression analyses.The first column shows the regression of the control variableagainst product development time. As indicated andexpected, major projects take significantly longer to
100/ASQ, March 1995
Adaptive Processes
Table 2
Means, Standard Deviations, and
Variable
1, Project size2, Supplier
involvement3, CAD4, Overlap5, Planning6, Multifunctional
team7, Reward for
schedule8, Iteration9, Test
10, Time betweenmilestones
11, Project leaderpower
12, Developmenttime
Mean
,50
,9962,93
,43,15
7,25
3,71,00,26
,00
,09
,00
S.D.
,50
1,0725,92
,29,07
4,50
1,48.93,13
,78
,29
,48
Zero-order Correiations (/V =
1
- ,07,00
- ,16- ,24
,01
,00,00
- ,10
- ,14
,01
,31
2
,04,13
- ,01
,51
,06- ,18
,16
,02
- ,10
- ,13
3
,13,11
,43
,37,15
- ,10
,24
,14
,17
4
,10
,15
,13- ,16
,38
- ,20
- ,02
- ,15
72)
5
- ,03
,16,07
- ,20
,17
- ,11
,36
6
,27- 2 8
,20
,07
,00
- ,32
7
,26,07
,13
- ,20
,03
8
- ,29
,17
- ,09
- ,37
9 10
- ,31
,15 ,06
- ,39 ,42
11
- 2 8
complete than medium-scale ones. We also controlled forregional differences (Asia, U,S., and Europe) and resourcefunding and found no significant effects. These results areavailable from the authors.
The second regression model adds the variables from thecompression strategy to the analysis. While the overallregression is statistically significant, the results for several ofthe hypotheses are in the opposite direction from what wehypothesized. Planning led to slower, not faster productdevelopment, contrary to hypothesis 1, Similarly, we hadhypothesized that greater supplier involvement woulddecrease the development time (H2), In contrast, the resultsindicate that greater supplier involvement slowed the paceof product development. Also contrary to our hypotheses,CAD usage, as measured by the percentage of designersusing CAD (H3), slowed product development. In resultsavailable from the authors, we also found that CAD usage as
Table 3
Results of
Variable
Regression Anaiysis for Development Time (/V =
Model 1 Model 2
72)
Model 3 Model 4 Model 5
Project size ,312*'
PlanningSupplier involvementCADOverlapMultifunctional teamReward for schedule
IterationTime between milestonesTestProject leader power
Adjustment R^ ,084*
,422*
,220~,180*,409*
-,051- ,606*
,010
,361'
- , 1 8 2 -,340—
- ,248—- ,262—
,464—
364—
249-150330—147340—003
152*2 3 1 -185*115
,341
,349
,172
-,155
-,175,253
- 2 0 8
,558— ,546—
* p < ,10; —p < ,05; *—p < ,01,
101/ASQ, March 1995
In results available from the authors, wefound that curvilinear models of iterationsand test were not significant.
We appreciate Laura Kopczak's veryhelpful suggestion to performsplit-sample analyses.
measured by our less direct measure (i.e., perceivedimportance of CAD usage to shorter product developmenttime) also slowed product development. Among thesevariables, only the use of cross-functional teams (H5) led tofaster product development. Reward for schedule (H6) andoverlap (H4) were not significant. Thus, three of the sixelements of the compression strategy significantlylengthened product development time, rather thanreducing it.
The third model displays the regression results for theexperiential model. The overall model is significant and,unlike the compression model, the hypotheses aresupported. Hypothesis 7 stated that a higher number ofdesign iterations is associated with faster development time.Hypothesis 8 stated that longer product testing is associatedwith faster development time. As indicated by the thirdmodel in Table 3, these hypotheses are significantlysupported.^ Time between milestones (H9) also wassignificant. Finally, project leader power (H10), as measuredby whether the project manager reported to the SBUmanager, is also related to fast product development,although other measures of power are not significant. Thusthe experiential strategy significantly shortened productdevelopment times.
The fourth model displays the full regression results for thecombination of the compression, experiential, and controlvariables. The full model is significant and, as in the previousregressions, multifunctional teams (H5), iterations (H7), test(H8), and milestones (H9) are supported while, contrary toour hypotheses, planning (HI) and CAD (H3) significantlylengthened product development time. Supplier involvement(H2) and project leader power (H10) are no longer significant.
The fifth model is a final, parsimonious model that includesthe most significant variables (p < .10) from the full model,model 4. The entire model is significant. As indicated, allvariables from the experiential model in the regression aresignificant as well: Faster product development is associatedwith more testing (H8), more frequent milestones (H9), andmore iterations (H7). Project leader power (H10) wasdropped at the previous stage. In contrast, the compressionresults are less significant and sometimes opposite to thosethat were hypothesized: Planning (HI) and CAD usage (H3)were associated with slower product development. Supplierinvolvement (H2), project overlap (H4), and reward forschedule attainment (H6) were dropped at the previousstage because of lack of significance. Only multifunctionalteams (H5) are positively associated with fast productdevelopment.
Split-sample Analyses
We explored the surprising results for the compressionmodel further with split-sample analyses.^ We reasoned thatperhaps the compression results would be more consistentwith our hypotheses if we examined only mainframe andminicomputer projects, the 24 projects best fitting thepredictability assumption of this strategy. Since theseproducts have extensive proprietary hardware and software,their designs are more predictable from project to project
102/ASQ, March 1995
Adaptive Processes
and more insulated from changing technologies. Also, theirmarkets are stable and mature {Business Week, 1994).
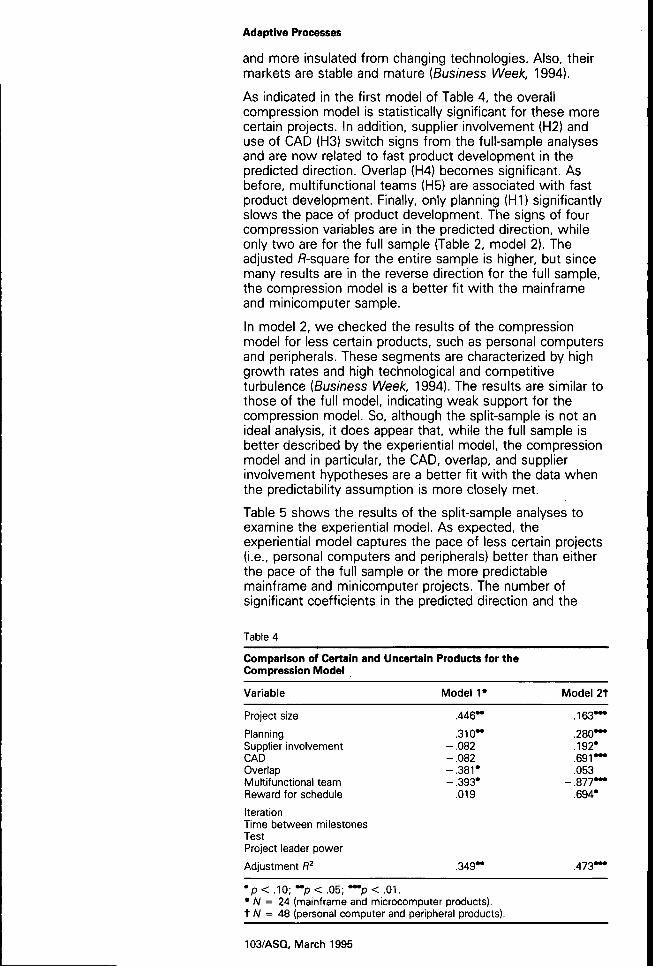
As indicated in the first model of Table 4, the overallcompression model is statistically significant for these morecertain projects. In addition, supplier involvement (H2) anduse of CAD (H3) switch signs from the full-sample analysesand are now related to fast product development in thepredicted direction. Overlap (H4) becomes significant. Asbefore, multifunctional teams (H5) are associated with fastproduct development. Finally, only planning (HI) significantlyslows the pace of product development. The signs of fourcompression variables are in the predicted direction, whileonly two are for the full sample (Table 2, model 2). Theadjusted /^-square for the entire sample is higher, but sincemany results are in the reverse direction for the full sample,the compression model is a better fit with the mainframeand minicomputer sample.
In model 2, we checked the results of the compressionmodel for less certain products, such as personal computersand peripherals. These segments are characterized by highgrowth rates and high technological and competitiveturbulence (Business Week, 1994). The results are similar tothose of the full model, indicating weak support for thecompression model. So, although the split-sample is not anideal analysis, it does appear that, while the fuH sample isbetter described by the experiential model, the compressionmodel and in particular, the CAD, overlap, and supplierinvolvement hypotheses are a better fit with the data whenthe predictability assumption is more closely met.
Table 5 shows the results of the split-sample analyses toexamine the experiential model. As expected, theexperiential model captures the pace of less certain projects(i.e., personal computers and peripherals) better than eitherthe pace of the full sample or the more predictablemainframe and minicomputer projects. The number ofsignificant coefficients in the predicted direction and the
Table 4
Comparison of Certain and Uncertain Products for theCompression Modei
Variable Model 1* Model 2t
Project size
PlanningSupplier involvementCADOverlapMultifunctional teamReward for schedule
IterationTime between milestonesTestProject ieader power
Adjustment R^
.446~
.310--.082-.082- . 3 8 1 *- .393*
.019
.349-
.163
.280
.192
.691
.053-.877
.694
.473
• p < .10; - p < .05;—p< .01.• W = 24 (mainframe and microcomputer products).t /V = 48 (personal computer and peripheral products).
103/ASQ, March 1995
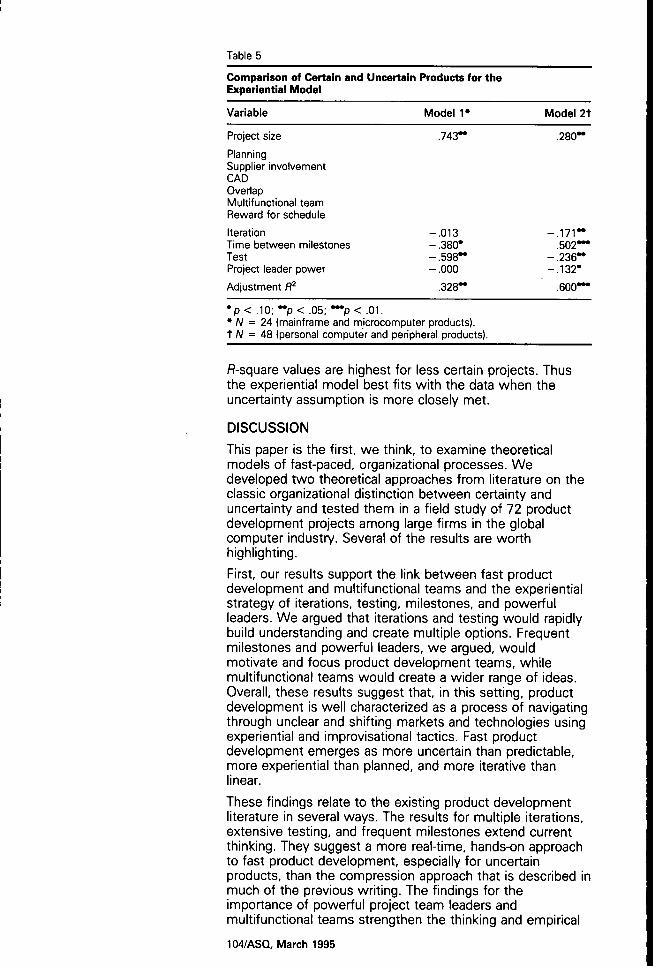
Table 5
Comparison of Certain and Uncertain Products for theExperiential iVIodei
Variable
Project size
PlanningSupplier involvementCADOverlapMultifunctional teamReward for schedule
IterationTime between milestonesTestProject leader power
Adjustment R^
Model 1»
,743-
-,013- ,380*- , 5 9 8 --,000
,328-
* N = 24 (mainframe and microcomputer products),t N = 48 (personal computer and peripheral products).
Model 2t
,280-
- . 1 7 1 -,502—
- , 2 3 6 -- ,132*
,600—
ff-square values are highest for less certain projects. Thusthe experiential model best fits with the data when theuncertainty assumption is more closely met,
DISCUSSION
This paper is the first, we think, to examine theoreticalmodels of fast-paced, organizational processes. Wedeveloped two theoretical approaches from literature on theclassic organizational distinction between certainty anduncertainty and tested them in a field study of 72 productdevelopment projects among large firms in the globalcomputer industry. Several of the results are worthhighlighting.
First, our results support the link between fast productdevelopment and multifunctional teams and the experientialstrategy of iterations, testing, milestones, and powerfulleaders. We argued that iterations and testing would rapidlybuild understanding and create multiple options. Frequentmilestones and powerful leaders, we argued, wouldmotivate and focus product development teams, whilemultifunctional teams would create a wider range of ideas.Overall, these results suggest that, in this setting, productdevelopment is well characterized as a process of navigatingthrough unclear and shifting markets and technologies usingexperiential and improvisational tactics. Fast productdevelopment emerges as more uncertain than predictable,more experiential than planned, and more iterative thanlinear.
These findings relate to the existing product developmentliterature in several ways. The results for multiple iterations,extensive testing, and frequent milestones extend currentthinking. They suggest a more real-time, hands-on approachto fast product development, especially for uncertainproducts, than the compression approach that is described inmuch of the previous writing. The findings for theimportance of powerful project team leaders andmultifunctional teams strengthen the thinking and empirical
104/ASa March 1995
Adaptive Processes
results of many authors (e.g., Quinn, 1985; Gold, 1987;Gupta and Wilemon, 1990; Clark and Fujimoto, 1991) byreplicating them with a more systematic research design andwith field data from an industry that is less Japanese-dominated and less characterized by large, mechanicalproducts.
Second, the results for CAD, supplier involvement, andoverlap are mixed. Like others (e.g.. Gold, 1987; Clark,Chew, and Fujimoto, 1987; Gupta and Wilemon, 1990), weargued that supplier involvement would simplify the process,CAD would shorten process step times, and overlappingwould shorten the process. Yet for the full sample, thesevariables are negatively or nonsignificantly associated withfast product development. Why?
For CAD, one reason may be inappropriate implementation.In talking informally with product developers and executivesafter data collection, we learned that many CAD systemstake a long time to learn to use effectively. Further, somefirms end up with incompatible CAD systems that createnew delays. Also, some designers become so involved withCAD that they get caught up in computer "hacking" andlose focus on product development. One engineer bestsummed up the above arguments: "to foul-up takes ahuman, to really foul-up takes a computer." Finally, we alsolearned in our informal conversations that current CADsoftware is often directed at automating well-knowncalculations and facilitating reuse of old designs. While theseapplications may speed predictable product design, they arepoorly suited to creating new iterations and comprehensivetesting. Yet the results of this study indicate that these latterapplications would be very useful for speeding productdevelopment. Only in predictable projects that havewell-known computational demands did CAD work well inthis study.
For supplier involvement, one reason for the mixed resultsmay be that, for less predictable projects, early involvementmay be difficult to achieve because there is less certaintyabout which suppliers will be used. Fast developerstherefore may eschew early supplier involvement in favor oflast-minute supplier selection or buying off-the-shelfcomponents in order to maintain design flexibility much laterinto the development process. In contrast, for predictableprojects, suppliers are likely to be clear early on, and, as weargued in developing this hypothesis, it is possible and evenpreferable to involve them early in the process.
The mixed results for CAD, overlap, and supplierinvolvement also relate to the previous product developmentliterature. These variables have been associated with fastproduct development by many authors (e.g., Imai, Nonaka,andTakeuchi, 1985; Rosenau, 1988; Cordero, 1991; Clarkand Fujimoto, 1991; Mabert, Muth, and Schmenner, 1992).What the results here suggest is that these past results(which form the heart of the compression strategy) may holdfor predictable, mature products such as automobiles(Womack, Jones, and Roos, 1990; Clark and Fujimoto, 1991)and heavy industrial equipment (e.g., Mabert, Muth, andSchmenner, 1992). In contrast, they are less significant and
105/ASQ, March 1995

even negative predictors of development speed for productssuch as personal computers, for which technology andmarkets are rapidly and unpredictably evolving. Thissuggests a contingent view of fast product development inwhich the compression strategy is relevant for predictableprojects, while the experiential strategy is more germane tounpredictable projects. In projects with a mix of predictableand unpredictable aspects, a combination of strategies islil<ely to be relevant.
Third, contrary to our and others' arguments, planning andrewards for schedule are associated with slow productdevelopment (e.g.. Gold, 1987; Womack, Jones, and Roos,1990; Gupta and Wilemon, 1990), Possibly, these conceptswere poorly measured. Certainly, our single Likert-scale itemfor reward for schedule is not a strong measure. But otherexplanations come to mind. One is reverse causality. Slowfirms may use reward for schedule as a solution to theirpace problems, not vice versa. Another possible reason isthat the schedule may actually slow down developers whocould move more quickly. Designers, who are rewarded forschedule, may also neglect other outcomes such as qualityand adherence to specifications. This could lead toinappropriate trade-offs regarding product quality andsubsequent delays or surprises downstream, whichultimately retard the process. In contrast, fast developers inthis study appear to be motivated by frequent milestones,which create a sense of urgency (Gersick, 1988) andachievement (McClelland, 1961), and by extensive testing,which creates intense task involvement (Sitkin, 1992),
For planning, one explanation is that extensive planningsimply wastes time, especially in high-velocity industriessuch as computers. This explanation is consistent withearlier work in the industry that describes how fast strategicdecision makers avoid planning because it is a futile exercisewhen the environment is changing rapidly and unpredictably(Eisenhardt,1989), Thus, perhaps planning slows down thepace of the process when information is incomplete orobsolete. Consistent with situated learning (Lave andWenger, 1991), it may be faster to probe, test, iterate, andexperience than to plan.
Beyond Product Innovation
Finally, our results relate to the broader organizational andstrategic literatures. At the outset, we noted that adaptationresearch has shifted from whether adaptation happens tohow and when it occurs (Gersick, 1994), Punctuatedequilibrium, which characterizes adaptation in terms of large,infrequent structural changes has emerged as a dominantmodel of adaptation (Miller and Freisen, 1984; Gersick,1994; Romanelli and Tushman, 1994), Yet adaptation canalso occur through small, frequent shifts in how firmscompete in the marketplace. For example. Miller and Chen(1994) focused on pricing, advertising, and scheduling movesin the airline industry, Galunic and Eisenhardt (1996)examined charter or domain changes among the strategicbusiness units within a major electronics firm. Here, wedescribe product development processes that may providethe same type of rapid, marketplace adaptation within the
106/ASQ, March 1995

Adaptive Processes
computer industry. The image is adaptation to evolvingmarkets and technologies through a consistent, rapid flow ofnew products that reposition and ultimately reshape firms.As an example, Hewlett-Packard evolved from aninstruments company to a computer-based one throughsuccessive new products, while Intel evolved from amemory to a microprocessor firm through product innovation(Burgelman, 1991). This view contrasts with adaptation aswrenching, infrequent change that punctuates long periodsof inertia. In this paper, we attempt to shed light on theorganizational processes or, in strategy parlance, the corecapabilities that create this type of rapid adaptation.
Our work also relates to the speed of organizationalprocesses. There is surprisingly little understanding in theorganizational literature of how and why processes are fast.At best, there are some traditional assumptions that speedmight be achieved by skimping on analysis and information,slashing conflict, or being centralized (e.g., Vroom andYetton, 1973; Mintzberg, Raisinghani, and Th^oret, 1976;Fredrickson, 1984). Yet each of these tactics also impairs thequality and effectiveness of organizations and fails to dealwith how people overcome the emotional blocks to speed,such as anxiety and procrastination. Cutting analysis andinformation is likely to impair quality and to sap theconfidence of managers. Eliminating conflict is problematicbecause conflict is often linked to high-quality processes. Itis also difficult to suppress. Centralization is problematic,especially in dynamic environments, because such dictatorialaction often creates isolation and rigidity (Staw, Sandelands,and Dutton, 1981). So, overall, these views are likely to betoo simplistic.
In contrast, the results here provide three new insightsabout the speed of organizational processes. One is thatthere is no single way to be fast. Rather, there are multipleapproaches for gaining speed in organizational processes.Second, these approaches are distinct from those in thetraditional organizational literature, such as cuttinginformation, suppressing conflict, or relying on centralization.The compression tactics rely on efficiently organizing theprocess and then taking advantage of possibilities foroverlap, technological advances such as CAD, and theexpertise of others, such as suppliers. The experientialapproach rests on accelerated learning through iteration andtesting that is combined with the motivation and focus ofleadership and frequent milestones. Here real-timeinteraction, flexibility, and improvisation are essential. Third,the efficacy of these approaches appears to be contingenton the task. Compression tactics build on a rational,engineering perspective from the product developmentliterature and seem to fit best in more certain settings. Inthis study, they best described mainframe and minicomputerprojects. In contrast, experiential tactics build on ideas aboutintuition and improvisation that have emerged frominductive, case research on jazz (Bastien and Hostager,1988), strategic choice (Eisenhardt, 1989), and survival(Weick, 1993). Their domain seems to be uncertain settings.In this study, they best described product innovation in thecomputer industry, particularly the volatile peripheral and
107/ASQ, March 1995

REFERENCES
Bastien, David T., and Todd J.Hostager1988 "Jazz as a process of
organizational innovation."Communication Research, 15:582-602.
personal computer segments. Taken together, these insightsbegin to outline a more valid and complex view of fastorganizational processes.
Perhaps most importantly, from an organization theoryperspective, we call into question the traditional linkbetween organic processes and uncertain situations (Burnsand Stalker, 1961; Lawrence and Lorsch, 1967; March,1988). Burns and Stalker (1961) characterized organicprocesses as lacking structure. Typical is their report of aninformant's claiming, "Of course, nobody knows his jobhere" (p. 93). But playful, fluid organic processes fail tocapture the importance of focus and structure that emergeshere. Fast processes in uncertain situations may not beorganic, but they are improvisational in that they combinereal-time learning through design iterations and testing withthe focus and discipline of milestones and powerful leaders.Thus our work joins a small but growing number of studiesthat challenge the relevance of organic processes toeffective organization (Jelinek and Schoonhoven, 1990;Weick, 1993; Brown and Eisenhardt, 1995b) and relateclosely to emergent ideas on balancing order and disorderwithin complex, adaptive systems (Kauffman, 1992;Waldrop,1992).
CONCLUSION
Many organizational theories have their roots in the 1970s, atime when the concerns for speed and flexibility thatdominate contemporary firms were not an issue (see alsoGalunic and Eisenhardt, 1994). Not surprisingly, theoriessuch as transaction cost economics, agency, and resourcedependence are static or nearly so. Institutional theory haslittie to say about pace and change. Even organizationecology, which is dynamic at the population level, is largelystatic at the firm level. While these theories may be usefulin equilibrium, they are not so appropriate for capturingorganizational forms in abruptly changing, competitivesettings. Yet ironically, many firms exist in industries inwhich moving quickly is a key core capability and fastproduct innovation is central to maintaining that pace.
In this paper we probed fast product innovation and, in sodoing, attempted to contribute not only to the productinnovation literature but also to the beginning of an outline offast, adaptive organizational processes and, ultimately,organizational forms that fit with competitive, fast-pacedsituations. A more dynamic organizational paradigm thatcaptures key features of continuously adaptive,contemporary firms is beginning to emerge.
Bourgeois, L. Jay, and KathleenM. Eisenhardt1988 "Strategic decision processes
in high velocity environments:Four cases in themicrocomputer industry."Management Science, 34:816-835.
Brown, John Seely, Allan Collins,and Paul Duguid1989 "Situated cognition and the
culture of learning."Educational Researcher, 18:32-42.
108/ASQ, March 1995

Adaptive Processes
Brown, Shona L., and Kathleen M.Eisenhardt1995a "Product development: Past
research, present findings,and future directions,"Academy of ManagementReview, vol, 20 (in press),
1995b "Product innovation as corecapability: The art ofdynamic adaptation,"Working paper. Departmentof Industrial Engineering andEngineering Management,Stanford University,
Burgelman, Robert A.1991 "Intraorganizational ecology of
strategy making andorganizational adaptation:Theory and field research,"Organization Science, 2:239-262,
Burns, Tom, and G. M. Stalker1961 The Management of
Innovation, London: Tavistock,
Business Week1994 "The end of the end for 'big
iron'," January 10: 81,
Clark, Kim B., W. Bruce Chew, andTakahiro Fujimoto1987 "Product development in the
world auto industry,"Brookings Papers onEconomic Activity, 3:729-781, New York:Brookings Institution,
Clark, Kim B., and TakahiroFujimoto1991 Product Development
Performance: Strategy,Organization, andManagement in the WorldAuto Industry, Boston:Harvard Business SchoolPress,
Cordero, Rene1991 "Managing for speed to avoid
product obsolescence: Asurvey of techniques." Journalof Product InnovationManagement, 8: 283-294,
Curtis, M., and N. S. Barnes1989 Biology, New York: Worth,
D'Aveni, Richard A.1994 Hypercompetition, New York:
Free Press,
Dougherty, Deborah1992 "Interpretive barriers to
successful product innovationin large firms," OrganizationScience, 3: 179-202.
Eisenhardt, Kathleen M.1989 "Making fast strategic
decisions in high velocityenvironments." Academy ofManagement Journal, 32:543-576,
Eisenhardt, Kathleen M., and L.Jay Bourgeois III1995 "Conflict and strategic
decision making: How topmanagement teamsdisagree," Working paper.Department of IndustrialEngineering and EngineeringManagement, StanfordUniversity,
Eisenhardt, Kathleen M. and MarkJ. Zbaracki1992 "Strategic decision making,"
Strategic ManagementJournal, 13: 17-37,
Feldman, Martha S., and JamesG. March1981 "Information in organizations
as signal and symbol,"Administrative ScienceOuarterly, 26: 171-186,
Fredrickson, James W.1984 "The comprehensiveness of
strategic decision processes:Extension, observations,future directions," Academyof Management Journal, 27:445-466,
Galbraith, Jay R.1973 Designing Complex
Organizations, Reading, MA:Addison-Wesley,
Galunic, D. Charles, and KathleenM. Eisenhardt1994 "Renewing the
strategy-structure-performance paradigm," InB, M, Staw and L, L,Cummings (eds,). Research inOrganizational Behavior, 16:215-255, Greenwich, CT: JAIPress.
1996 "The evolution ofintracorporate domains:Losing divisional charters inhigh-technology,multidivisional corporations,"Organization Science, vol. 7(in press).
George, Alexander L.1980 Presidential Decision Making
in Foreign Policy. Boulder,CO: Westview,
Gersick, Connie J. G.1988 "Marking time: Predictable
transitions in group tasks."Academy of ManagementJournal, 31: 9-41,
1994 "Pacing of strategic change:The case of a new venture,"Academy of ManagementJournal, 37: 9-45,
Gold, Bela1987 "Approaches to accelerating
product and processdevelopment," Journal ofProduct InnovationManagement, 4: 81-88,
Gupta, Ashok K., and David LWllemon1990 "Accelerating the
development oftechnology-based newproducts," CaliforniaManagement Review, 32(2):24-44,
Hayes, Robert H., Steven C.Wheelwright, and Kim B. Clark1988 Dynamic Manufacturing, New
York: Free Press,
Huber, George P.1991 "Organizational learning: The
contributing processes andthe literatures," OrganizationScience, 2: 88-114.
lansiti, Marco1992 "Science-based product
development: An empiricalstudy of the mainframecomputer industry." Workingpaper. Harvard BusinessSchool.
Imai, Kenochi, Ikujiro Nonaka, andHirotaka Takeuchi1985 "Managing the new product
development process: HowJapanese companies learnand unlearn," In R, Hayes, K,Clark, and P, Lorenz (eds,).The Uneasy Alliance:Managing theProductivity-TechnologyDilemma: 337-375, Boston:Harvard Business SchoolPress,
Jelinek, Mariann, and Claudia B.Schoonhoven1990 The Innovation Marathon,
London: Basil-Blackwell.
Kauffman, Stuart A.1992 Origins of Order:
Self-Organization andSelection in Evolution. Oxford:Oxford University Press,
Langer, Ellen1975 "The illusion of control,"
Journal of Personality andSocial Psychology, 32:311-328,
Lave, J., and E. Wenger1991 Situated Learning, Cambridge,
MA: Cambridge UniversityPress,
Lawrence, Paul R. and Jay W.Lorsch1967 Organization and
Environment: ManagingDifferentiation and Integration,Boston: Graduate School ofBusiness Administration,Harvard University.
Levy, Steven1994 "Dr, Edelman's brain," New
Yorker, May 2: 62-73,
109/ASQ, March 1995

Mabert, Vincent A., John F. Muth,and Roger W. Schmenner1992 "Collapsing new product
development times: Six casestudies." Joumal of ProductInnovation Management. 9:200-212,
March, James G.1988 "Decisions and Organizations.
Oxford: Basil Blackwell.
McClelland, David A.1961 The Achieving Society, New
York: Van Nostrand.
McDonough, Edward F.1993 "Faster new product
development: Investigatingthe effects of technology andcharacteristics of the projectleader and team." Journal ofProduct InnovationManagement. 10: 241-250,
Miller, Danny, and Ming-Jer Chen1994 "Sources and consequences
of competitive inertia: A studyof the U,S, airline industry,"Administrative ScienceQuarterly. 39: 1-23,
Miller, Danny, and Peter Freisen1984 Organizations: A Ouantum
View, Englewood Cliffs. NJ:Prentice-Hall,
Millson, Murray R., S. P. Raj, andDavid Wilemon1992 "A survey of major
approaches for acceleratingnew product development,"Journal of Product InnovationManagement, 9: 53-69.
Mintzberg, Henry, DuruRaisinghani, and Andr6 Th^oret1976 "The structure of
'unstructured' decisionprocesses," AdministrativeScience Ouarterly, 21:246-275,
Moornnan, Christine, and Anne S.Miner1994 "Walking the tightrope:
Improvisation in new productdevelopment andintroduction," Working paper.Graduate School of Business,University of Wisconsin,
Murnighan, J. Keith, and DonaldConlon1991 "The dynamics of intense
work groups: A study ofBritish string quartets,"Administrative ScienceQuarterly, 36: 165-186.
OuchI, William G.1980 "Markets, bureaucracies, and
clans," Administrative ScienceOuarterly, 25: 129-141,
Payne, John, John Bettman, andE. Johnson1988 "Adaptive strategy selection
in decision making." Journalof Experimental Psychology,14: 534-552,
Perrow, Charles1986 Complex Organizations: A
Critical Essay, New York:Random House,
Pfeffer, Jeffrey1992 Managing with Power,
Boston: Harvard BusinessSchool Press.
Quinn, James Brian1985 "Managing innovation:
Controlled chaos," HarvardBusiness Review, May-June:73-84,
Romanelli, Elaine, and Michael LTushman1994 "Organizational transformation
as punctuated equilibrium: Anempirical test," Academy ofManagement Journal, 37:1141-1166.
Rosenau, Morton D.1988 "Speeding your product to
market." Journal of ConsumerMarketing, 5: 23-40,
Scott, W. Richard1987 Organizations: Rational,
Natural, and Open Systems.Englewood Cliffs, NJ:Prentice-Hall,
Sherif, M., et al.1961 Intergroup Conflict and
Cooperation: The Robber'sCave Experiment. Norman,OK: University of Oklahoma,Institute of IntergroupRelations.
Sitkin, Sim B.1992 "Learning through failure: The
strategy of small losses," InB, M, Staw and L, L.Cummings (eds,). Research inOrganizational Behavior, 14:231-266. Greenwich, CT: JAIPress,
Stalk, George, and Thomas M.Hout1990 Competing against Time: How
Time-based Competition isReshaping Global Markets,New York: Free Press.
Staw, Barry, Lance Sandelands,and Jane Dutton1981 "Threat-rigidity effects in
organizational behavior: Amultilevel analysis,"Administrative ScienceOuarterly, 26: 501-524,
Thompson, James D.1967 Organizations in Action, New
York: McGraw-Hill,
Vesey, Joseph T.1991 "The new competitors: They
think in terms of speed tomarket," Academy ofManagement Executive, 5(2):23-33.
von Hippel, Eric, and Marcie Tyre1993 "How learning by doing is
done: Problem identification innovel process equipment."Working paper, Sloan School,MIT.
von Braun, Christoph-Friedrich1990 "The acceleration trap," Sloan
Management Review, 32(1):49-58,
Vroom, Victor H., and PhilipYetton1973 Leadership and Decision
Making, Pittsburgh: Universityof Pittsburgh Press,
Wagner, John A., and Suzanne M.Crampton1993 "Percept-percept inflation in
micro organizational research:An investigation of prevalenceand effect," In D, Moore (ed.).Academy of ManagementBest Papers Proceedings1993: 310-314,
Waldrop, W. Mitchell1992 Complexity: The Emerging
Science at the Edge of Orderand Chaos, New York: Simon& Schuster,
Weick, Karl E.1993 "The collapse of sensemaking
in organizations: The MannGulch disaster,"Administrative ScienceOuarterly, 38: 62&-652,
Womack, J. P., D. T. Jones, andD. R. Roos1990 The Machine That Changed
the World: The Story of LeanProduction, New York: HarperPerennial,
110/ASQ, March 1995
