accelerating global adoption of photovoltaic … global adoption of photovoltaic technologies world...
TRANSCRIPT

Accelerating Global Adoption of Photovoltaic Technologies
World Green Energy Forum 2010Gyeongju CityKorea
Dr. Vijay K. Kapur, MBA
President/CEO
E-Mail: [email protected]
www.isetinc.com
International Solar Electric Technology, Inc. (ISET)
20600 Plummer St. Chatsworth, CA, 91311
November 17-19, 2010

Outline
• Introduction to ISET
• Abundance of Solar Energy
• PV Business in the Industrialized World Today
• World Demographics
• Base of the Pyramid
• Potential for PV business in the Rest of the World
• ISET’s Technology for Low Cost PV Manufacturing
• A 50 MW/Yr Turnkey System
• Accelerating Global Adoption of PV
• Summary

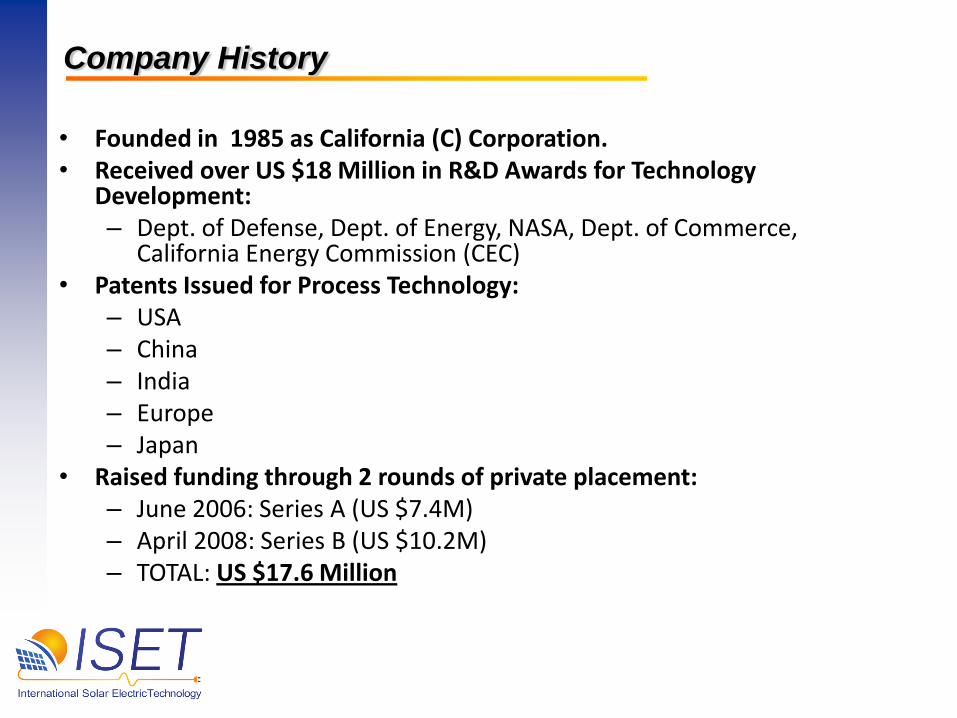
• Founded in 1985 as California (C) Corporation.
• Received over US $18 Million in R&D Awards for Technology Development:– Dept. of Defense, Dept. of Energy, NASA,
Dept. of Commerce, California Energy Commission (CEC)
• Patents Issued for Process Technology:– USA, China , India, Europe &Japan
• Raised funding through 2 rounds of private placement:– June 2006: Series A (US $7.4M)– April 2008: Series B (US $10.2M)– TOTAL: US $17.6 Million
• Operating in a fully permitted 24000 ft2 building.
About ISET
• Founded in 1985 as California (C) Corporation.• Received over US $18 Million in R&D Awards for Technology
Development:– Dept. of Defense, Dept. of Energy, NASA, Dept. of Commerce,
California Energy Commission (CEC)• Patents Issued for Process Technology:
– USA– China– India– Europe– Japan
• Raised funding through 2 rounds of private placement:– June 2006: Series A (US $7.4M)– April 2008: Series B (US $10.2M)– TOTAL: US $17.6 Million
Company History

• 1 Terawatt (TW) = 1 Trillion Watts
• 2005 US Daily power consumption: 3.35 TW
• 2005 World’s Daily Power Consumption: 15.8 TW
• Daily Incident Power on Planet Earth: 174,000 TW
Planet Earth receives energy from the Sun equal to it’s
annual Energy Usage every 40 minutes.
Availability of Solar Energy

Comparative Abundance of Solar Energy

• Annual Average Incident Solar Radiation (Hours of Peak Sunshine per Day)
• Abundant Sunshine in Developing Nations:– Africa, Asia, Middle East, South America, Central America, Oceania
• Very Large Untapped Market Potential for Low-Cost Photovoltaics.
Availability of Solar Energy

PV Business Status
In the Industrialized World

• 2009 worldwide sales: US $38 billion
• 40+% annual growth since 1997.
• 2020 projected sales volume: >US $100 billion
• Global deployment in 2009: > 7.5Gigawatts.
• Growing worldwide demand for renewable energy.
• Government support for solar energy in:
– Germany, France, Italy, UK, Spain, Portugal, Greece, USA, Canada, China, India and others.
Photovoltaic Business Outlook in the Industrialized World

Cost Driver in Industrialized countries - Grid Parity
Price (With No Subsidy) of Residential Grid connected PV Systems
Annual Output: 1700 KWh/kW
$5000/kW $4000/kW 3000/kW $2500/kW $2000/kW
Net Monthly Loan Payment
Term: 25 years Interest: 7%
Tax Rate: 30%29.74 23.79 17.84 14.87 11.90
Monthly Savings From PV Generated Electricity
Utility Rate - $0.12/kWh 20.40 20.40 20.40 20.40 20.40
Utility Rate - $0.15/kWh 21.25 21.25 21.25 21.25 21.25
Utility Rate - $0.20/kWh 28.33 28.33 28.33 28.33 28.33
Target Installed Price for
Grid -Parity$2.00 -$3.00
PerWatt

• Critical Factors:
– Grid-Connected systems currently rely on government subsidies.
– Market pressure to reduce total installed system price.
Components Current Price/Watt Target Price/Watt
PV Module:$1.50 - $2.25 $1.00 - $1.25
Inverter:$0.35 - $0.65 $0.25 - $0.30
Installation & Materials:$2.00 - $3.00 $1.00 - $1.50
TOTAL:$3.85 – $5.95 $2.25 - $3.05
Grid-Connected Systems
Grid Parity is expected to achieved between 3-5 Yrs.

Market Projections for the Industrialized World

World Demographics
Projected Changes and Trends

Electricity Consumption Vs. HDI

• Near-term planning must include strong strategy for sales to Developing Countries.
World Population (Billions)
Year Developed Nations Developing Nations Total
2009 1.2 5.6 6.8
2050 1.3 8.0 9.3
Rapidly Increasing Demand
Growing Purchasing
Power
ISET’s Low-Cost Printed CIGS
Modules+ +
Strong Sales in Developing
Nations
World Demographics

Demographics –Age Distribution

Limited Buying Power of World’s Population

Population Vs. Per Capita Income
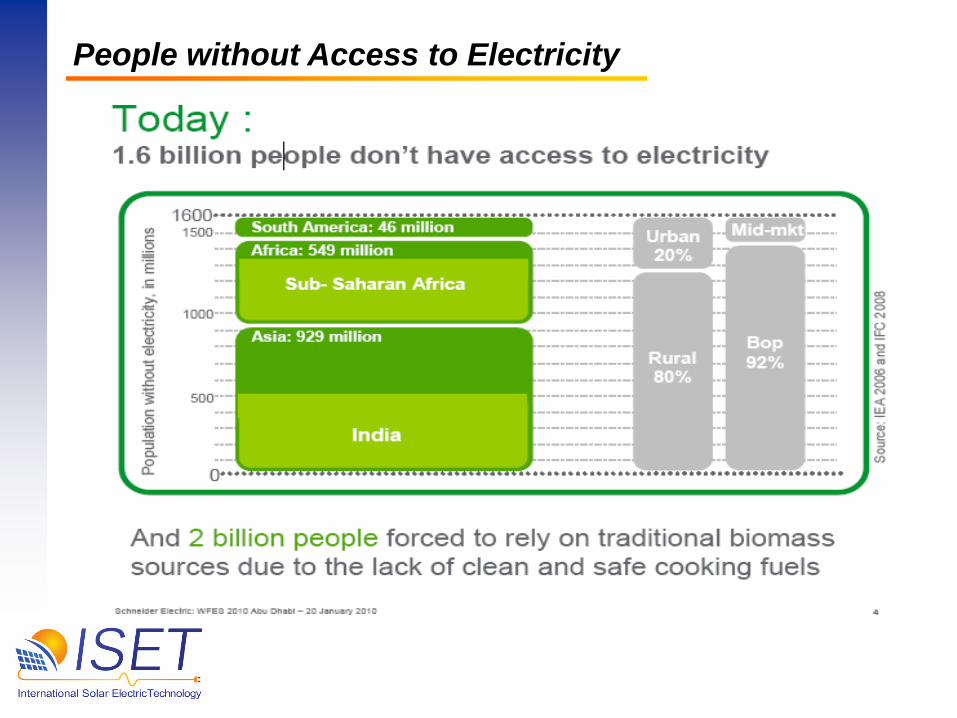
People without Access to Electricity

People with No Access to Electricity

People Gaining Access to Electricity

Continued Challenge
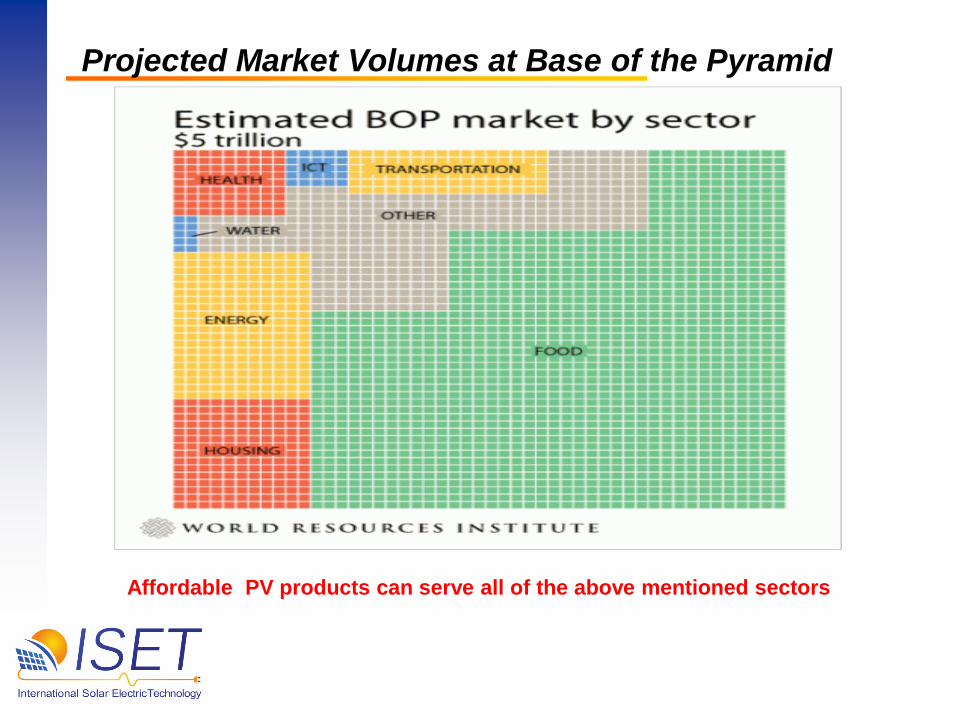
Projected Market Volumes at Base of the Pyramid
Affordable PV products can serve all of the above mentioned sectors

Needs of BOP People

• Critical Factors:
– Intense Demand for Energy.– Unreliable or Unavailable Power Infrastructure.– Areas of highest population developing world have an abundant supply of annual
sunshine.
• Critical Power Needs:– Battery Charging
• LED Lanterns• Cellular Phones
– Water Pumping– Rural Electrification– Medical Supply Refrigeration
• Primary Competition:– Diesel Generators– Kerosene Fuel– Disposable Batteries
• High Market Price Tolerance for low-wattage portable and remote PV applications.
Market Overview – Developing World

High Price Usage for Very Low Usage of Electricity

Introduction of PV Products in the Developing Countries

Providing Access to Electricity in Developing Countries
ISET’s Technology for Manufacturing Affordable
andCustomized CIGS modules

*Active device thickness approximately 1/15th the diameter of a human hair.
(-)
(+)
ISET’s Cell Structure
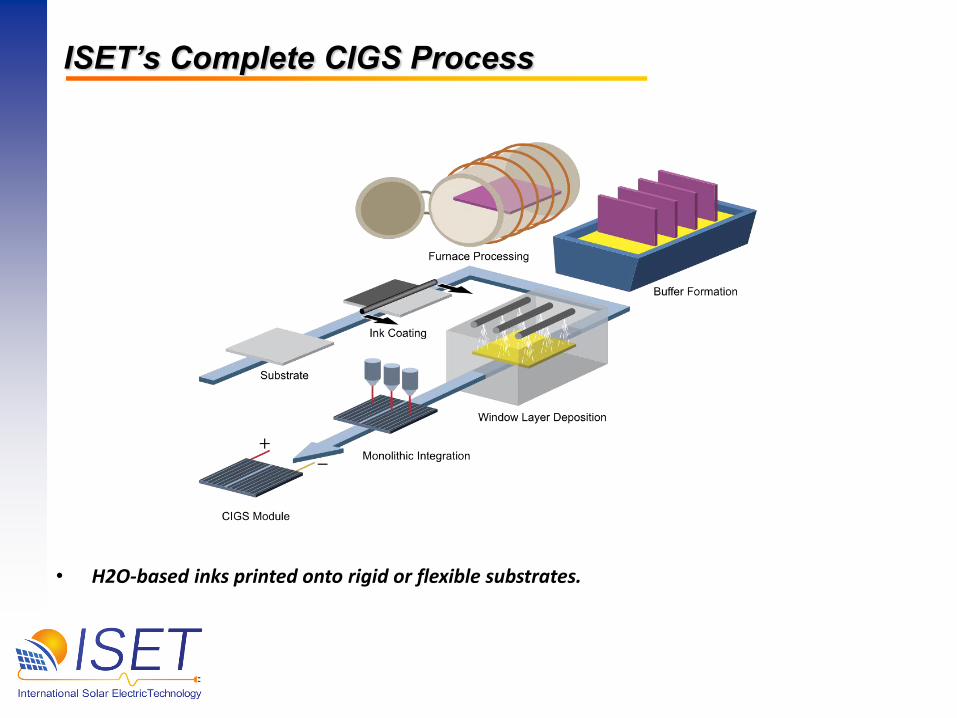
• H2O-based inks printed onto rigid or flexible substrates.
ISET’s Complete CIGS Process

ISET’s Ink55 Gallons (280 Kg)
Total Cost: $60K.
vs.
Crystalline Silicon6.5 Metric Tons
@$50/KgTotal Cost: $326K
1.45 MW of PV Panels
ISET’s CIGS Nanoparticle Ink

• Monolithic Integration:– Creates many interconnected cells on a single substrate.
– Cell patterning may be optimized for best power output.
ISET’s Integrated Module Structure

Benefits• No wiring together of individual
cells, saves assembly costs.
• Fine pattern lines maximizes collection area, increasing power output.
• Voltage output adjusted by changing # of cells in pattern.
• Same function for large utility power panels as well as for small handheld battery chargers.
ISET’s Integrated Module Structure
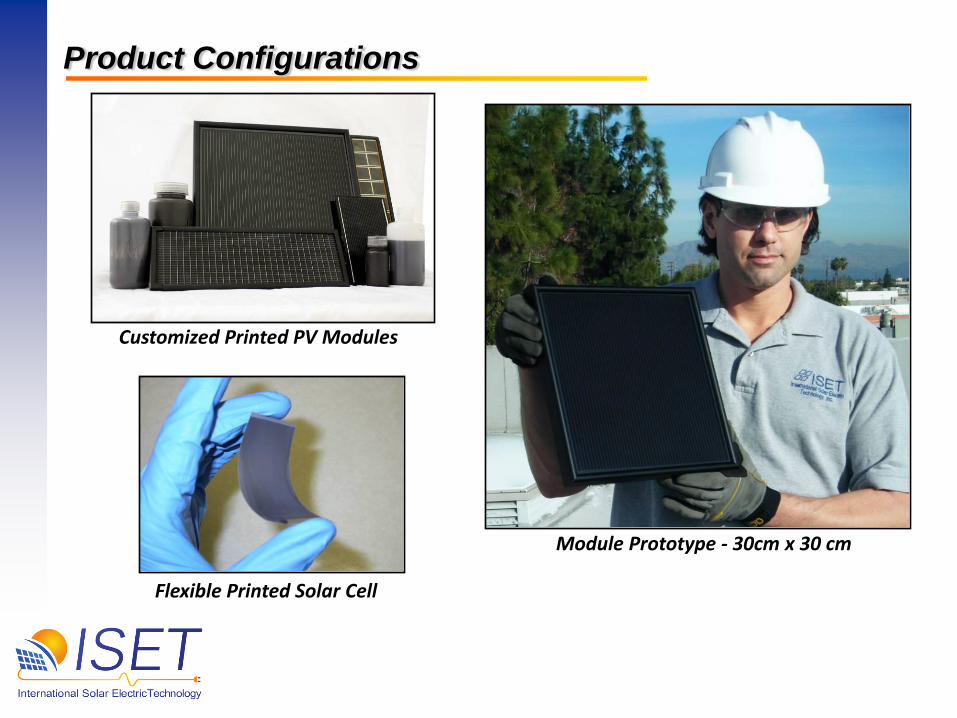
Product Configurations
Customized Printed PV Modules
Flexible Printed Solar Cell
Module Prototype - 30cm x 30 cm

Product Configurations
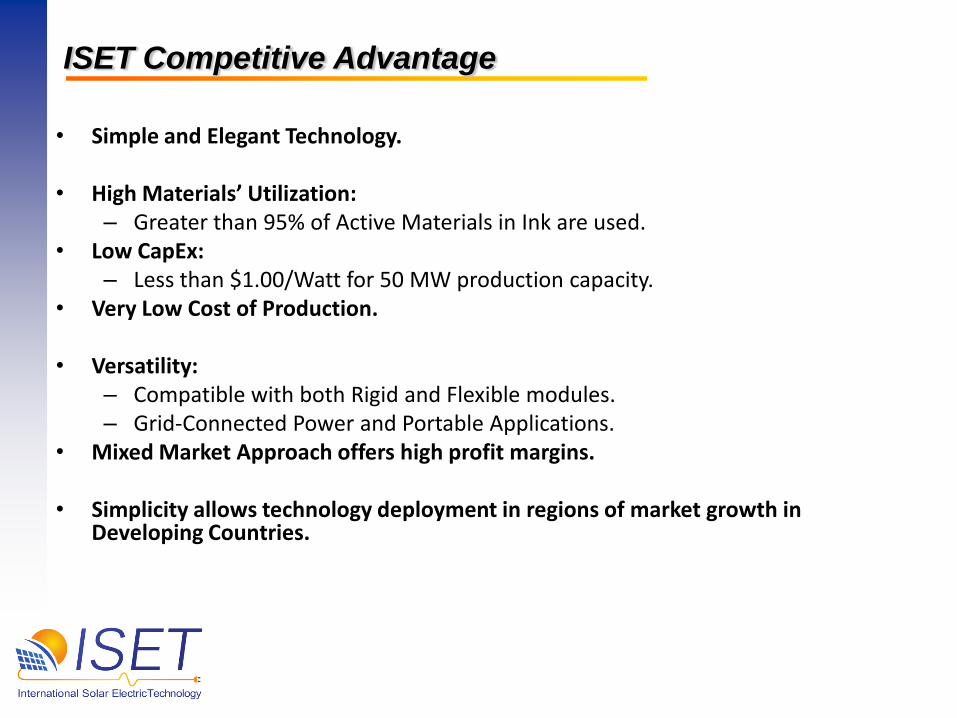
• Simple and Elegant Technology.
• High Materials’ Utilization:– Greater than 95% of Active Materials in Ink are used.
• Low CapEx:– Less than $1.00/Watt for 50 MW production capacity.
• Very Low Cost of Production.
• Versatility:– Compatible with both Rigid and Flexible modules.– Grid-Connected Power and Portable Applications.
• Mixed Market Approach offers high profit margins.
• Simplicity allows technology deployment in regions of market growth in Developing Countries.
ISET Competitive Advantage

Timeline 2010 2011-2012 2012-Beyond
Capacity 3.0 MW 30-50 MW 100-200 MW
ProductsPortable Modules;
Customized Solar ProductsPortable and Power
ModulesPortable and Power
Modules
Customers N/AResidential & Commercial
Rooftop Installers; Utilities, OEM’s of Off Grid Products
Solar Farms; Utilities;All Markets
Development PlanStreamline Manufacturing
ProcessRevenue Generation
Global Expansion of Low-Cost PV
Target Manufacturing Cost
per WattN/A $0.70 $0.65-$0.50
Pilot Plant
FullProduction
Mass Production
Manufacturing Ramp-Up Plan

Manufacturing Cost Estimates
• Output at 10% Module Conversion Efficiency: 100 Watts / M2
• Resultant Estimated Cost: $0.65 / Watt
Estimated Manufacturing Costs at 50 MW/yr Capacity
Direct Materials Costs Cost ($/m2)
Active Device Materials $15.00
Lamination and Sealant Materials $20.00
Frames, Junction Box $7.50
Total Materials Cost: $42.50
Direct Labor with Fringes $5.00
Capital Equipment Depreciation (St. Line 7 yrs.) $10.00
Factory Overhead & Management $7.50
TOTAL ESTIMATED COST per m2: $65.00

Manufacturing Cost Estimates
• Output at 10% Module Conversion Efficiency: 100 Watts / M2
• Resultant Estimated Cost: $0.65 / Watt
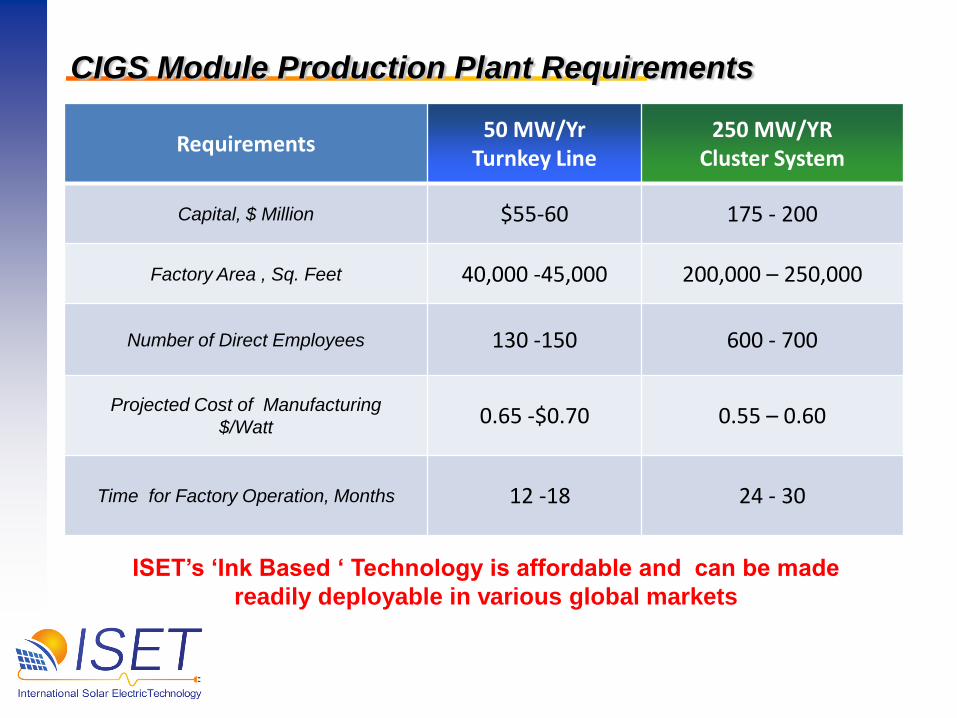
CIGS Module Production Plant Requirements
Requirements 50 MW/Yr
Turnkey Line250 MW/YR
Cluster System
Capital, $ Million $55-60 175 - 200
Factory Area , Sq. Feet 40,000 -45,000 200,000 – 250,000
Number of Direct Employees 130 -150 600 - 700
Projected Cost of Manufacturing
$/Watt0.65 -$0.70 0.55 – 0.60
Time for Factory Operation, Months 12 -18 24 - 30
ISET’s ‘Ink Based ‘ Technology is affordable and can be made
readily deployable in various global markets

ISET’s Plans for Manufacturing
• Develop 50MW/YR ‘Turn-Key’ production line
– Complete Supply Chain
– Rapidly-Deployable
• Install a 50MW/Yr solar panel manufacturing line in ISET’s current facility
• Manufacturing of PV Products
– Grid-connected applications (USA)
– Customized panels for exports to emerging markets in developing countries
• International Business Growth
– Technology Licensing
– Sales of ‘Turn-Key’ production lines

• Grid Connected Systems in the U.S.:
– Collaborate with local utilities and Real Estate Developers for solar installations
– Partner with PV system developers offering complete solar solutions.
• Portable and Remote Power PV Applications:
– Collaboration with PV systems developer and distributors in India other developing
countries.
– Establishing connections within the consumer electronics industry.
• Dissemination of Low Cost PV Manufacturing via Technology Licensing
– Joint Venture partnerships with established companies in countries with market potential.
Marketing Plan

Population and Watts per Capita
Population in Millions
>1000 >100 100 – 30 30 – 10 10 – 1 <1
No. of Countries
2 9 27 45 72 68
Watts per Capita
>10001000 -
750750 – 500 500 – 250 250 – 100 100- 50 <50
No. of Countries
14 11 20 24 43 24 55
Global Average Watts per Capita = 297 watts

Energy Availability Gains provided by 250 MW/YR Cluster
CountryPopulation
Millions
Current Usage
KWH/Capita
KWH/Capita Gain
in 5 yearsChange (%)
El Salvador 6.88 768 218 28.4
Bhutan 2.16 1922 644 36.1
Angola 15.9 214 94.3 44
Nepal 27.1 93.5 55.3 59.1
Laos 5.9 284 254 89.4
Cote d’Ivoire 18.2 90.7 82.6 91.2
Cambodia 14 81 107 132
Fiji 0.85 1010 1769 175
Burkina Faso 13.2 42.7 114 266
Eritrea 4.4 55.7 341 612

Accelerating PV Growth
• Install affordable 250 MW/Yr manufacturing clusters
– countries with population ~ 10 million
– replicate 50 MW/Yr turnkey lines
• Promote a sense of availability of low cost energy
• Improve quality of life, productivity resulting in economic growth
• Train local talent in manufacturing, product design and technical support.
• Encourage communities to adopt PV generators
– Agriculture
– clean water
– Telecommunication
– Education
– Medical Facilities
– transportation fields.
• Create awareness and acceptability of PV generators in the local social structure

Summary
ISET’s ‘Ink Based’ technology for manufacturing
low cost, affordable, flexible PV modules can be
a catalyst for global adoption of PV technology
in the near future.

THANK YOU
FOR YOUR
ATTENTION
20600 Plummer St.
Chatsworth, California, USA
91311
www.isetinc.com