accelerating shale asset success through applied reservoir understanding...
TRANSCRIPT

1
GUSS14 - 16
Accelerating Shale Asset Success through Applied Reservoir
Understanding
JEFF DAHL, JOHN SPAID, Devon Energy OKC; BUDDY MCDANIEL, BILL GRIESER, RON DUSTERHOFT, BILL
JOHNSON, AND SHAMEEM SIDDIQUI, Halliburton
This paper has been selected for presentation for the 2014 Gussow Geosciences Conference. The authors of this material have been cleared by all interested
companies/employers/clients to authorize the Canadian Society of Petroleum Geologists (CSPG), to make this material available to the attendees of Gussow 2014
and online.
ABSTRACT
Horizontal drilling and multistage hydraulic fracturing have been credited for much of the success achieved in ultralow permeability shale reservoirs, making it possible to produce natural gas, natural gas liquids, and crude oil at economic rates. Although thousands of wells have been drilled and completed using these techniques, there are relatively few design tools and processes available within the industry designed specifically for these applications. In the past, much of the optimization process has been the result of trial and error techniques that can be both costly and time consuming. This paper examines a step-out development project where new processes and tools were used to accelerate the de-risking of the asset area by identifying the best quality reservoir targets and significantly improving production and economics by implementing a completion optimization process. This reservoir centric process uses earth modeling, complex fracture modeling, and reservoir simulation tools developed specifically for shale type formations. It also focuses on designing the wellbores to best accommodate the staged stimulation treatments that can help maximize the stimulated volume and the connected fracture area within this volume. When optimized, this process can help maximize
the estimated ultimate recovery (EUR) while sustaining economically viable production rates. A detailed example is presented illustrating how these tools were successfully applied within a new development to accelerate reservoir understanding, help improve well performance consistency through more effective well placement, and significantly increase well performance through applied engineering processes, completion designs, and effective stimulation treatments. The success of the project is discussed to illustrate both the initial and sequential performance improvements as new processes and designs were implemented. Total well cost comparisons are also included to verify the economic benefit achieved within this asset. INTRODUCTION
In North America, the economic production from unconventional shale reservoirs has significantly impacted local, national, and global economies; however, upon observation of the information often used to make engineering decisions it can be determined that the industry is generally deficient within the area of fit-for-purpose engineering tools for these assets. Currently, much of the success within these fields can be attributed to a combination of innovative thinking, rapid
2
deployment, and incremental improvement. Using this approach, it can be observed that the time necessary to create economic solutions within the Barnett shale through the early 2000s has been reduced significantly during operations within more recent developments, such as the Eagle Ford. While this has proven to be a very successful model in North America; to date, there is still an increasing demand to move beyond incremental improvement by providing tools and processes to help enable geoscientists and engineers make better decisions by testing and evolving innovative ideas through the use of computer modeling and simulation. This type of approach has the capability to further reservoir understanding to accelerate the de-risking of new assets and shortening the necessary appraisal and development time. Using conventional techniques, even relatively minor step-out projects can be very difficult because of the extreme variation of reservoir characteristics often encountered. In an attempt to help minimize problems such as this, a new reservoir-centric solution has been created and tested along with tools to help geoscientists and engineers collaborate more effectively and accelerate the process of optimizing an unconventional shale development. A field example of a step-out development in the Barnett shale is also examined, showing how these tools can be used to more effectively place the exact lateral location and complete wells to provide improved consistency and higher productivity.
Reservoir-Centric Solution
Within higher risk assets, such as deepwater, the use of multidiscipline teams to carefully model, plan, and develop assets has become commonplace. Within many of these high cost assets, the lines between the disciplines of geosciences, reservoir engineering, drilling, and completions often becomes blurred, forcing people to work much more closely to arrive at an optimized solution. However, during most land-based operations, a more conventional model of multiple discipline-specific teams is still quite common, resulting in situations where not all objectives and success criteria are aligned. In many cases, the key performance indicators are cost-oriented, focusing on reducing the costs associated with drilling and completing complex wells within even more complex reservoirs. This type of model often results in drilling decisions that are not well aligned with the well and completion designs necessary to help maximize reservoir or asset performance. An argument can clearly be made that the best performers are those who can generate the lowest cost when measured in dollars per barrel of oil equivalent ($/BOE) produced, where there is a balance between exploration and development expenses and the asset productivity or value achieved.
Based upon this philosophy, it was determined that a much more reservoir-centric solution was necessary to reap the maximum benefit from unconventional shale reservoirs. Upon examining the issues further, it was observed that most of these reservoirs could be more accurately characterized as source rock reservoirs. This means there has been a very complex geologic history behind each of these reservoirs, which must be carefully modeled to establish the current conditions to understand true production potential. Reservoir characterization needs the integration of several disciplines, which includes basin modeling, core analysis, geochemistry, petrophysics, geology, and geophysics. This effort can be described as a relatively conventional exploration and appraisal process, but the variability in these reservoirs, combined with the extremely low reservoir quality, means that some capability to high-grade specific reservoir attributes is necessary to help maximize asset value. In nearly all cases, these attributes vary continuously within a single field, as well as from one source rock reservoir to the next, making this an extremely difficult task. Implementation of such a process requires a significant amount of effort and cooperation across multiple disciplines. Two of the greatest challenges revolve around effectively managing data from multiple sources to provide useful information and setting performance objectives that account for the interdependence of well placement, completion design, and well productivity performance. Figure 1 provides a snapshot of how complex data management can be during a full field development effort. While “big data solutions” are currently discussed extensively within all areas of the industry, determining an effective solution for this type of problem is still not commonplace or simple. Technology within this area is also progressing very rapidly, so it is likely that new solutions will continue to become available. Determining the best solution to address a specific need will be the challenge. For a full asset development project, Figure 2 provides a framework that can be used to create a common platform that combines information and data from multiple sources to help enable the creation of a regularly updated integrated subsurface model. In the ideal case, this environment is capable of monitoring activities in near real-time and displaying the past (wells and completions already completed), present (wells currently being drilled and completed), and future (wells and completions planned) within the modeled reservoir. The model can be updated regularly as new well information becomes available to help create a single environment from where geoscientists, reservoir engineers, drilling engineers, and production engineers can work and collaborate.

3
Figure 1: Conventional data structures spread throughout multiple disciplines
for a full field development.
Figure 2: Integrated data platform and incorporation of a common subsurface
model that can be used by multiple disciplines.
While, in the past, hydraulic fracturing has been observed as a means of achieving reservoir contact vertically above and below a horizontal wellbore. Currently, it is being recognized that the variation in rock properties from layer to layer within these reservoirs can significantly impact the ability to create the desired fracture height and/or sustain fracture conductivity through some of these layers. As a result, improved wellbore placement within the reservoir is currently being recognized as a key enabler for improved fracture placement and completion performance.
Maximizing the asset value has become an exercise to help ensure proper well placement and hydraulic fracture treatments along the wellbore to help maximize well performance. Operational efficiency and drilling and completion execution are still very important, but understanding the reservoir and maximizing well productivity is also very important. This is a much more balanced approach, where optimization can be performed on the net present value (NPV) or return on investment (ROI), rather than the well cost and/or initial production rate. Figure 3 illustrates how this process can be deployed using an integrated subsurface model to help enable the asset team to work within a more collaborative environment, use reservoir information to make better decisions, and continuously improve the model and process throughout the development program. During this process, the subsurface model is regularly updated using new well information and calibrated model information, helping ensure that the most current and relevant information is always available to the asset team. This allows previous decisions to be reviewed to evaluate if near-term plans should be revised, not only long-term planning. By deploying this process, the data have more value and can become effective during well and field planning earlier within the life of the asset.
Figure 3: Field development process and workflows using a common
subsurface model within a continuous improvement or refinement process.

4
Reservoir Characterization
Building the first generation subsurface model or earth model is the primary goal of reservoir characterization. Within resource shales, many people consider that these reservoirs are relatively uniform, and reservoir risk is minimized. However, after several years of experience, the industry is learning that these reservoirs are actually very heterogeneous, with many thinly bedded laminations with highly variable properties spanning the reservoir height, and have significant (but more gradual) variations laterally. In many cases, these reservoirs have significant structural features, which include karsts, faults, and folds, making it difficult to plan and drill wells effectively without detailed geologic information. Also, because these can be classified as ultralow permeability source rocks, these reservoirs are in a state where the fluids are not equalized; therefore, reservoir fluid properties can vary from dry gas to condensate to oil depending upon the exact local burial history, hydrocarbon generation, and hydrocarbon migration that has occurred throughout geologic time. The use and integration of nearly every geologic tool available, beginning with petroleum systems analysis, is necessary for the reservoir characterization of a source rock reservoir. This includes basin and source rock modeling, core analysis, geochemistry, petrophysical analysis, geologic modeling, and geophysics, followed by geostatistical earth modeling for creating the most realistic subsurface model possible. Dusterhoft et al. (2013) provided a relatively detailed description of this process, which resulted in the creation of a detailed geocellular subsurface model. A key factor to consider is that this is only the first generation model; as the project progresses, this becomes the platform for capturing all present and future wellbore, drilling, formation evaluation, stimulation, production, and reservoir information. It will be continuously updated throughout the life of the asset. The idea of creating a constantly changing subsurface model capable of accepting new information from multiple sources and locally updating is not simple and has required significant modifications to tools considered current and state-of-the-art. Many of these changes are still in development, including new solutions for gridding and meshing to help enable placement of complex wellbores, hydraulically induced fractures, existing natural fractures, and features, such as faults, to help enable local updates and refinement based upon new information as it becomes available. As a project progresses, this becomes a single environment that captures and retains all of the information about the reservoir and is made accessible to the entire asset team, helping enable more effective collaboration and the use of the most current asset information for well and
completion designs. If managed effectively, it also helps enable all existing wellbores and stimulation treatments to be observed, current wells being drilled or completed, and future planned wells and completions. This is a valuable tool that can help improve well spacing and completion solutions as the field is being developed.
Well Placement and Well Planning
By using the subsurface model, higher quality reservoir sections can be identified both regionally and stratagraphically, making it possible to identify higher quality reservoir targets and help enable improved well placement. New tools integrating the surface and subsurface planning can help enable optimized solutions for both surface pad location and size, as well as achieving the desired reservoir coverage. The subsurface model can be used as a map during horizontal well planning. By mapping surfaces, and even specific facies, it becomes possible to plan a well trajectory more accurately to help maximize the wellbore contact with the best quality reservoir. Understanding the specific facies properties and gamma response can also help enable a geosteering plan to be created to help the drillers on location identify where they are and keep the well within the desired reservoir target. Reservoir Simulation
Reservoir simulation becomes important in multiple ways and is integral for tying well and completion designs to well performance. Initial completion designs incorporate reservoir simulation based upon the most relevant information available in the subsurface model and is used to help optimize the completion and fracture treatment design based upon expected or modeled productivity. After the well has been completed and placed on production, the reservoir simulation tool can be used in a production history matching mode, making corrections to key reservoir and completion attributes to help ensure that the actual production results can be simulated effectively. Under most normal circumstances, a reservoir study would be completed at this point; but here, it is only beginning because the history matched reservoir simulation model can now be used to update and calibrate the properties in the subsurface model and hydraulic fracture simulation tool. This creates an iterative improvement process around reservoir model quality and hydraulic fracture design.
5
Hydraulic Fracture Simulation
The complexities of hydraulic fracturing, with multiple stages, each with multiple points for fractures to be generated, and in a horizontal well environment, are currently becoming understood. If one considers this as multiple fractures competing for width within a highly stressed environment, the picture begins to take shape. Many of the existing modeling tools available to the industry today are based upon some very basic assumptions, such as symmetric bi-wing fractures; however, when one considers the complex environment within which these horizontal wells are placed, this might no longer be a valid assumption because stress interaction exists between adjacent fractures, fracturing stages, and even wellbores within a pad or infill development. Considering that the induced fractures tend to follow the path of least resistance suggests that new tools are necessary to model hydraulic fracture growth within this environment. Presently, the industry is beginning to observe that first generation fracture design and simulation tools can help engineers model and understand fracture growth behavior within this complex environment, as well as aid better decision-making that can have a positive influence on maximizing reservoir volume contacted and connected area within the contacted reservoir volume. The coupling of these hydraulic fracture simulators with higher end reservoir simulators can help enable a very robust completions optimization process, making it possible to identify fracture and reservoir characteristics that will have the greatest impact on well production. Improved Decision-Making and Planning
All of these tools are used within a collaborative environment to help enable engineers and geoscientists to make better decisions with respect to reservoir characterization, well placement, well design, and completion design (including fracture length and spacing, and stimulation treatment design), proppant size, concentration, and volume. The ability to combine all of these with a common subsurface model and incorporate all new reservoir, well, completion, and production information provides the asset team with the most recent and advanced knowledge available to continuously help improve well planning, drilling, and completion operations throughout the entire life of an asset. This can dramatically speed up learning during exploration and appraisal, but can also help identify remediation and infield drilling opportunities during later stages of development. The following example is a case history where many of these techniques have been used during an actual, challenging field development.
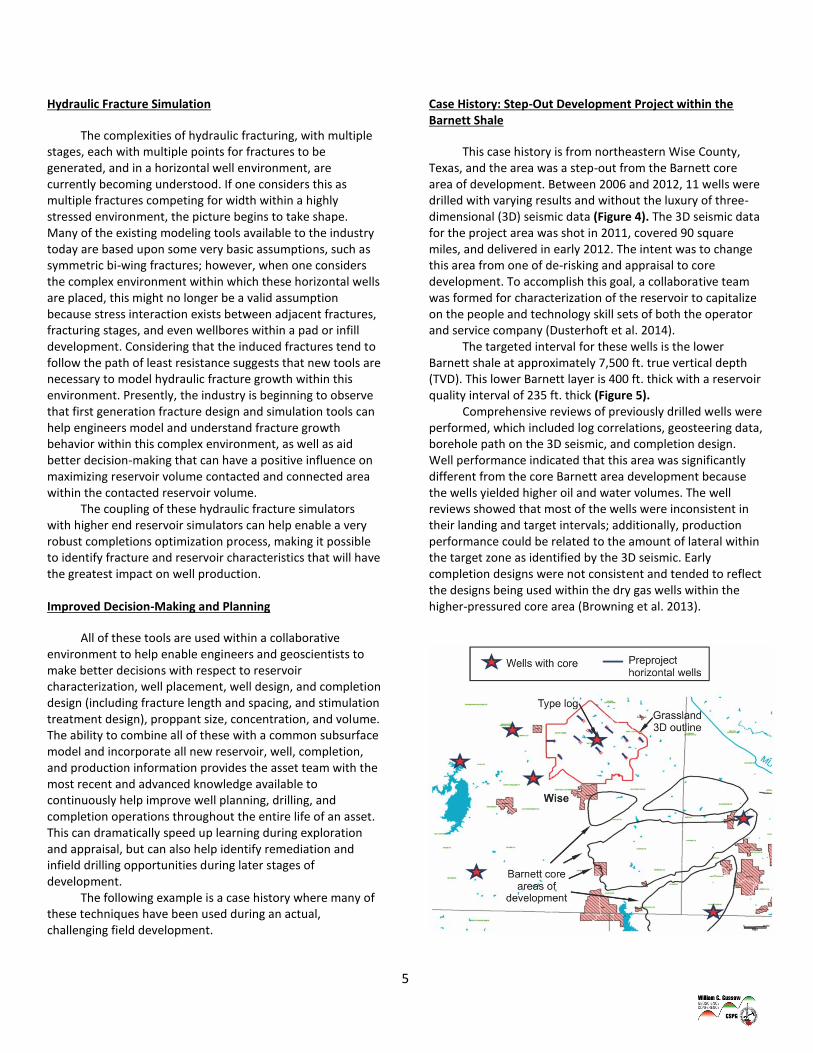
Case History: Step-Out Development Project within the Barnett Shale
This case history is from northeastern Wise County, Texas, and the area was a step-out from the Barnett core area of development. Between 2006 and 2012, 11 wells were drilled with varying results and without the luxury of three-dimensional (3D) seismic data (Figure 4). The 3D seismic data for the project area was shot in 2011, covered 90 square miles, and delivered in early 2012. The intent was to change this area from one of de-risking and appraisal to core development. To accomplish this goal, a collaborative team was formed for characterization of the reservoir to capitalize on the people and technology skill sets of both the operator and service company (Dusterhoft et al. 2014). The targeted interval for these wells is the lower Barnett shale at approximately 7,500 ft. true vertical depth (TVD). This lower Barnett layer is 400 ft. thick with a reservoir quality interval of 235 ft. thick (Figure 5). Comprehensive reviews of previously drilled wells were performed, which included log correlations, geosteering data, borehole path on the 3D seismic, and completion design. Well performance indicated that this area was significantly different from the core Barnett area development because the wells yielded higher oil and water volumes. The well reviews showed that most of the wells were inconsistent in their landing and target intervals; additionally, production performance could be related to the amount of lateral within the target zone as identified by the 3D seismic. Early completion designs were not consistent and tended to reflect the designs being used within the dry gas wells within the higher-pressured core area (Browning et al. 2013).

6
Figure 4: Map showing the location of the Grassland 3D project area.
Figure 5: Type log of the Grasslands area showing the lower Barnett
reservoir section.
Reservoir Understanding in Source Rock Reservoirs
A subsurface model of the reservoir target was created using a comprehensive process involving the acquisition of all available data and information, bringing everything together to create a detailed model, providing information on structural features, mineralogy, facies distribution, mechanical properties, and reservoir characteristics. This phase of the project used information from multiple logs and cores from wells within a reasonable proximity, as well as a high quality 3D seismic shot from this area. Completion of this phase revealed that this reservoir had a tremendous amount of vertical heterogeneity. When the early well surveys were inserted into this model and well productivity was analyzed, it was observed that the best-producing wells had all penetrated a specific layer highlighted within the model, while wells that did not contact this layer had lower production. A clay-rich layer with a much higher Poisson’s ratio was also identified just above the best quality reservoir. It was determined that this layer represented a geohazard, making it difficult to effectively stimulate through and even more difficult to retain good fracture conductivity within this layer during production. These features have been identified within a vertical slice taken from the subsurface model illustrated in Figure 6. This model suggested that drilling the wells to a slightly lower target within the shale section, as well as remaining within the higher quality reservoir and below the clay-rich layer, would significantly help improve production potential. However, there was some concern because the lower well placement could add a significant risk of downward fracture growth into a water-bearing formation.
Figure 6: Slice of the subsurface model showing higher quality reservoir
sections, as well as clay-rich geohazards.
The initial results of lowering the well targets were immediately positive, with gas and oil shows picked up immediately by the mud logging equipment on location as soon as the higher quality reservoir rock was penetrated. It was also noted that when the well path exited the higher quality reservoir sections, the gas and oil shows quickly vanished. With the subsurface model using the 3D seismic, it was now possible to more accurately plan horizontal well landing points and well paths necessary to remain within the higher quality reservoir. Understanding the mineralogy of key reservoir layers, particularly the clay-rich geohazard on top of this reservoir section, a plan for geosteering was created and executed to help maximize wellbore contact with the best reservoir rock. Figure 7 illustrates one of the early wells where geosteering was used.
Figure 7—Pre-project well path shown in subsurface model and a revised well
path based on keeping the wellbore within the higher quality reservoir.
Detailed Completion Review
Use of the subsurface model significantly helped improve reservoir knowledge and enabled the team to perform a detailed review of completion designs and production performance. This project began with a review of existing wells, incorporating more rigorous analysis and interpretation to help create a path forward. This analysis was supported by engineers and geoscientists and was conducted in an open and collaborative environment, which facilitated open discussion and presentation of new ideas.
HIGH CLAY, LOW TOC, DUCTILE, NON-RESERVOIR
LOW CLAY, HIGH TOC, BRITTLE, RESERVOIR
7
The following is a short summary of key activities conducted during this planning phase:
Production history matching of existing wells to calibrate reservoir models and simulation tools.
Fracture modeling using multiple planar fracture models to estimate fracture height and length, as well as the expected proppant distribution within the fracture.
Fracture pressure matching was performed using different planar fracture models to help understand fracture growth characteristics.
A complex fracture modeling tool was incorporated into the design review to provide additional insight about complex fracture growth and created fracture width within this environment.
Reservoir and fracture sensitivity analyses were completed to determine critical treatment design parameters that could be used to help maximize well productivity, specifically targeting production of oil and hydrocarbon liquids.
Production History Matching
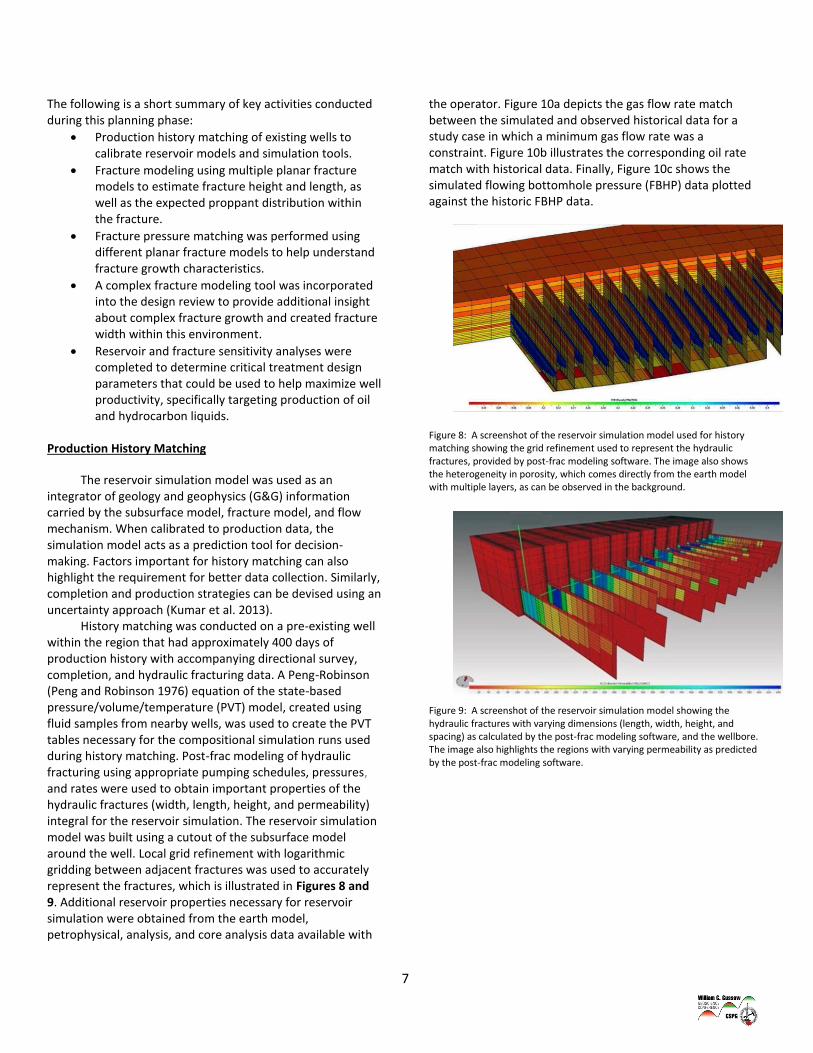
The reservoir simulation model was used as an integrator of geology and geophysics (G&G) information carried by the subsurface model, fracture model, and flow mechanism. When calibrated to production data, the simulation model acts as a prediction tool for decision-making. Factors important for history matching can also highlight the requirement for better data collection. Similarly, completion and production strategies can be devised using an uncertainty approach (Kumar et al. 2013). History matching was conducted on a pre-existing well within the region that had approximately 400 days of production history with accompanying directional survey, completion, and hydraulic fracturing data. A Peng-Robinson (Peng and Robinson 1976) equation of the state-based pressure/volume/temperature (PVT) model, created using fluid samples from nearby wells, was used to create the PVT tables necessary for the compositional simulation runs used during history matching. Post-frac modeling of hydraulic fracturing using appropriate pumping schedules, pressures, and rates were used to obtain important properties of the hydraulic fractures (width, length, height, and permeability) integral for the reservoir simulation. The reservoir simulation model was built using a cutout of the subsurface model around the well. Local grid refinement with logarithmic gridding between adjacent fractures was used to accurately represent the fractures, which is illustrated in Figures 8 and 9. Additional reservoir properties necessary for reservoir simulation were obtained from the earth model, petrophysical, analysis, and core analysis data available with
the operator. Figure 10a depicts the gas flow rate match between the simulated and observed historical data for a study case in which a minimum gas flow rate was a constraint. Figure 10b illustrates the corresponding oil rate match with historical data. Finally, Figure 10c shows the simulated flowing bottomhole pressure (FBHP) data plotted against the historic FBHP data.
Figure 8: A screenshot of the reservoir simulation model used for history matching showing the grid refinement used to represent the hydraulic fractures, provided by post-frac modeling software. The image also shows the heterogeneity in porosity, which comes directly from the earth model with multiple layers, as can be observed in the background.
Figure 9: A screenshot of the reservoir simulation model showing the hydraulic fractures with varying dimensions (length, width, height, and spacing) as calculated by the post-frac modeling software, and the wellbore. The image also highlights the regions with varying permeability as predicted by the post-frac modeling software.

8
Figure 10a: Gas rate (constraint) match between simulated (QGP, red line) and historical (QGPH) data.
Figure 10b: Oil rate match during history matching.
Figure 10c : FBHP match during history matching.
History matching of this well showed poor communication from the well to fractures. Upon closer review, it was confirmed that much of this wellbore was located above the clay-rich geohazard, making it extremely difficult to sustain a conductive fracture between the wellbore and best quality reservoir section. To realistically match the modeled fractures to the observed well production, the extent of fracture conductivity damage was within the range of 97%, which confirmed the need for refined well placement and also prompted a redesign of the fracture stimulation treatments. Stimulation Design Review Historical completion information from past wells revealed poor correlation between completion metrics and production. A number of wells were selected to fracture model in a conventional 3D frac simulator. Actual frac rate and pressure information was matched in the model. The resulting frac dimensions and conductivities were given to members of the reservoir modeling group for production modeling purposes. The calibrated reservoir simulation tools were then used to perform sensitivity analysis to help establish completion improvement options that would have a positive impact on well productivity. During the pressure matching using conventional planar fracture models, it was noted that the pressure matches significantly improved when multiple fractures per perforation cluster were simulated, suggesting that the actual created fracture width and length might be less than expected because of complex fracture growth. This prompted the team to consider new complex fracture simulation models. Complex Fracture Network Simulation A new-generation complex fracture network simulation tool (Walters and Schischka 2013) was tested and evaluated during this stage to gain insight into the region’s fracture complexity. This can best be described as a Generation 1 discrete element solid mechanics tool that models fracture growth behavior as a function of applied net treating pressure. This modeling tool has the advantage of being very fast in its calculations, but it has the disadvantage because it does not fully account for fluid propagation and proppant transport throughout the fracture network.

9
Table 1 summarizes results of the complex fracture network simulation.
TABLE 1—SUMMARY OF NATURAL FRACTURE FAMILIES USED IN THE COMPLEX FRACTURE NETWORK SIMULATION MODEL
Rough area (Million ft2) 1.60
Primary fracture direction (degrees E of N) 41.0
Secondary fracture direction (degrees E of N) 129.0
Net pressure applied (psi) 800
Net pressure drop curve (nth root) 16
Figure 11 illustrates the basic natural fracture pattern used in the complex fracture network simulator. To create this fracture network, openhole image log data captured for each well, combined with microseismic information obtained during fracture stimulations on a pad just to the south of the region were used. Formation properties and stress information used in the complex fracture model were obtained from the subsurface model and are listed in Table 2. Figures 12 through 14 depict the results of the complex fracture network simulator at different stages of the treatment, thus demonstrating how the complex fracture networks are initiated and how they continue to propagate throughout the reservoir as the treatment progresses.
Figure 11: Natural fracture pattern used to generate input for the complex fracture network simulator.
TABLE 2—SUMMARY OF FORMATION PROPERTIES USED IN THE COMPLEX FRACTURE NETWORK SIMULATION
MODEL
Permeability (md) 0.0001
Porosity (%) 10
Density (specific gravity [SG]) 2.4
StressMin (psi) 3800
StressMax (psi) 4180
Young's modulus (MMpsi) 4.00
Poisson's ratio 0.19
Joint tensile stress (psi) 100
Joint cohesive stress (psi) 300
Joint friction coefficient 0.65
Figure 12: Initiation of the complex fracture network showing the fracture network (left) and the associated stresses around the fracture network (right).
Figure 13: Continued growth of the complex fracture network showing the fracture network (left) and the associated stresses around the fracture network (right).

10
Figure 14: Complex fracture network after pumping was stopped, and pressures were allowed to equalize within the created fracture system.
Fracture Sensitivity Analysis Based upon the new fracture design and simulation work, the team needed to understand how more effective completion design and incorporating fracture complexity could be used to contribute to improved well productivity. One of the necessary methods for evaluating the performance of unconventional reservoirs involves the use of numerical simulation. The ideal workflow involves building an earth model and cutting out a section around the wellbore(s) and history matching by changing the uncertainty parameters until a reasonable match is obtained between the historical and predicted data, which is then used for predicting performance. Because the history matching process can arrive at multiple non-unique solutions, it is often necessary to conduct a sensitivity study before history matching to narrow down the range of uncertainty parameters. A sensitivity analysis was conducted for a well on which subsurface modeling and post-frac analysis data were available. A post-frac analysis of hydraulic fracturing using appropriate pumping schedules, pressures, and rates was used to obtain properties of the hydraulic fractures (width, length, height, and permeability), that became an integral part of the reservoir simulation model. The post-frac analysis predicted a total of 37 fractures for the 13 stages of fracturing used for this well. A reservoir simulation model was built around the wellbore by using data extracted as much as possible from the subsurface model built for the reservoir and incorporating the fracture attributes from the post-frac analysis. Because fluid composition data and test reports were available for this, as well as several other wells within the same reservoir, PVT tables were created from a common equation of a state model (Peng-Robinson based) that captured the effects of fluid property variation within this mostly gas condensate rich reservoir. A fully compositional numerical simulation was run for 15 years for
all of the sensitivity cases selected. These cases included sensitivities to matrix permeability, number of fractures created, wellhead pressure, condensate-to-gas ratio (CGR), and the presence of natural fractures to simulate fracture complexity. Table 3 lists the various parameters used during the sensitivity study.
TABLE 3—PARAMETERS USED DURING THE SENSITIVITY STUDY
(a) Matrix Permeability (b) Wellhead
Pressure
Base case 100 nD
Base case 500 psia
Case K1 10 nD Case P1 300 psia
Case K2 1,000
nD
(d) Fluid CGR
(c) Number of Fractures Base case 13 STB/MMscf
Base case 37 Case K1 27 STB/MMscf
Case S1 (every second fracture inactive)
19 Case K2 36 STB/MMscf
Case S2 (every second and third fracture
inactive) 13
Case S3 (every second, third, and fourth fracture
inactive) 10
(e) Natural Fracture Presence
Base case No natural
fracture
Case NF1 Natural fracture
with 100-ft spacing
Case NF2 Natural fracture
with 200-ft spacing
The sensitivity study revealed that the matrix permeability has the largest influence on oil rates, followed by fluid composition (CGR) within the range chosen, then the spacing of natural fractures (depicting fracture complexity, Figures 15 through 17), the number of hydraulic fractures, and wellhead pressure. Some of these findings are similar to those reported by Kumar et al. (2013) in another liquids-rich-shale play.

11
Figure 15: Three screenshots showing the pressure distributions inside the reservoir simulation model used for sensitivity analysis after 15 years of production. The hydraulic fractures are from the base case (37 fractures), but the natural fracture spacing varied from none (base case) to 200 and 100 ft. respectively.
Figure 16: Comparison between the two natural fracture cases and base case shows that the presence of natural fractures can result in almost twice the amount of oil recovered during the base case.
Figure 17: Comparison between the two natural fracture cases and base case shows that the presence of natural fractures can result in almost twice the amount of oil recovered during the base case.
This was of significant interest to the team because increasing the number of factures and the degree of fracture complexity both had a significant effect on the liquid production rates simulated. Because these were variables that had potential to be affected by team decisions, potential changes to both the wellbore completion plan and fracture stimulation designs were extensively reviewed. This resulted in some very significant completion design changes to more effectively place proppant into some of the very narrow fractures to achieve conductivity within a complex fracture network. Also, the combined addition of more perforation clusters per stage, as well as a newer product that provides temporary near wellbore (NWB) diversion (Allison et al. 2011) was identified as an approach to increasing the connected fracture area and having a positive impact on liquids productivity. Completion Design Changes The study of previous work performed in this field, combined with forward modeling and sensitivity testing, provided a tremendous amount of information that was reviewed, evaluated, and ultimately conformed to actionable design changes that could be easily implemented on location. Five key areas were identified, and several preferred actions were undertaken, as shown below. Areas identified for potential improvement:
1. Address lateral and perforation cluster placements. 2. Minimize NWB damage and loss of conductivity.

12
3. Modify the treatment schedule to help improve results within complex fracture systems.
4. Help optimize the net treating pressure to help improve proppant placement.
5. Help ensure all perforation clusters open at some point during each treatment stage.
Implemented solutions/changes to the above areas of concern were:
1. Adjust lateral target to a higher reservoir quality rock; select cluster location based on lateral log data.
2. To help improve NWB conductivity, use surface modification agent (SMA) on the tail-in proppant (Vo et al. 2013) and incorporate the friction reducer (FR) cleanup package.
3. Begin 100-mesh proppant early to enter secondary fractures when they are at their maximum width.*
4. Increase proppant lbm/gal to drive higher net pressure increase.
5. Add NWB diversion stages to promote more open clusters.
*3D simulations of natural fracture opening indicated maximum width during early opening times for these fractures. The net result of reviewing and modeling actual results, combined with forward modeling, produced a series of design changes that were implemented (some individually, some in combinations) to leverage the knowledge gained from the comprehensive completion analysis. Table 4 summarizes these changes.
TABLE 4—SUMMARY OF STIMULATION TREATMENT DESIGN CHANGES
Old Design New Design
Perforation clusters, length (ft) 2, 4 3, 2
Fluid Slickwater Slickwater
Slurry rate (bbl/min) 80 60
Surfactant package No Yes
FR cleanup No Yes
40/70-mesh sand (% of total) 80 16
40/70-mesh sand (max conc. lbm/gal) 1.5 1.5
Proppant SMA No Yes
100-mesh sand (% of total) 20 84
100-mesh sand (max conc. lbm/gal) 0.25 3.0
Summary of Results
The application of this process required a significant amount of time and effort from both geosciences and engineering perspectives. It was implemented while drilling, and completion operations were ongoing in the field, making it possible to compare results from before, during, and after the well placement and completion design recommendations were made. For the purposes of this paper, EUR was used as a measurement of well performance based on early production and projected into the future. While this process is not perfectly accurate, the consistent approach incorporated here provides a realistic comparison of well performance. Figure 18 illustrates EUR results, where the values have been normalized to the best pre-project performing well. It can be observed from Figure 18 that not everything progressed as smoothly as planned during the well placement phase of this project. While the early results were very positive, some problems were encountered that can be summarized as follows:
Well A: This well was kicked off early in the hot shale section of the reservoir, and only approximately 30% of this well was actually located within the higher quality reservoir section. However, foreknowing this before production was beneficial.
Wells B, C, D, and E: These wells were all drilled within a portion of the reservoir in which there was no strong barrier to stop the fracture treatment from growing into a wet zone. This was identified as a possible concern when a pilot hole was drilled for Well D. Although these wells did not perform well in terms of hydrocarbon production, they all produced significant quantities of water, suggesting that a conductive fracture system had been created. At this point, well targets were raised slightly, remaining within the higher quality reservoir but staying near the top to help minimize the risk of fracturing into the water.
The consistent and good well performance achieved once the well placement and completion designs were optimized was observed to yield a very positive result, helping eliminate well risk and achieving economic performance.

13
Figure 18: Well performance results showing normalized EUR for each well in the order drilled and completed during this development.
Based upon the reservoir simulation work performed during the completion optimization portion of this project, increased oil productivity was another measurement of success. Of the wells completed, the final well was the one in which the fully optimized treatment designs were pumped. For the purpose of well performance comparison, Figure 19 illustrates the production results for approximately two years from the best pre-project producing well. Figure 20 illustrates the production results for approximately four months from the final well in the dataset.
Figure 19: Production results from the best performing pre-project well.
Figure 20: Production results from the final well in the dataset.
By comparing the data within these figures, it can be observed that the final well completed reached the same cumulative oil volume within four months compared to the pre-project well achieved within 50 months, and is still sustaining significantly higher daily oil production rates. Additionally, the final well is producing significantly higher gas rates, which are also being sustained at high rates. These early results are considered to be very strong evidence that the reservoir simulation work used to support the changes implemented into the optimized completion designs has provided a solution to achieve improved liquids production rates from this complex reservoir. Because this project incorporated the drilling of a vertical pilot hole and collection of core and open hole logs for both the vertical well and horizontal lateral within this well, some comparison of well construction and completion costs should also be factored into the success criteria for the project. To do this, the drilling and completion costs were divided by the gross perforated interval (GPI) in feet to provide a realistic comparison of the cost normalized to the lateral length. The pre and post-project costs were then averaged. Using this approach, the cost results of this project can be summarized as follows:
Pre-project average well cost: 1,113 ($/GPI)
Post-project average well cost: 1,061 ($/GPI)
Based upon this analysis, the post-project wells, including the cost for data acquisition and completion changes, were approximately 4.7% lower than the pre-project wells drilled. Although additional data were acquired, and

14
significantly more proppant was placed into the new wells, the reduced treatment rate, reduced water volumes, and improved drilling and operational efficiency combined resulted in a lower overall cost per well. The results of this project have proven to be very successful as a result of a strong and collaborative team consisting of geoscientists and engineers from both the operator and the service company. The collaborative and cooperative environment during this project is considered to have contributed significantly to the ultimate success achieved.
Conclusions
Production outcome from early development of this field appeared to be randomly distributed. The economic viability of the asset was questionable. Detailed reservoir characterization and the creation of an earth model was instrumental in identifying higher quality reservoir layers and improved well targeting within the field. Production results exhibited that much more consistent well performance was achieved when the laterals were drilled to the target layers.
Advanced reservoir simulation using compositional modeling exhibited that the combination of well placement and location of geohazards, or very clay-rich layers, within the reservoir could be attributed to some of the poorer producing wells early during the project appraisal. Within this reservoir, the use of a more advanced compositional reservoir simulator helped enable understanding of the importance of increased fracture surface area and fracture conductivity to realize much better fluids production. This demonstrated the importance of having better understanding of the reservoir fluid properties and how this information could be used to help improve completion designs and well performance.
A new fracture design workflow was developed using a new generation fracture network simulator in conjunction with an advanced compositional reservoir simulator to design, evaluate, and then calibrate the completion design tools using net treating pressure and stimulation injected fluid volume and, ultimately, well production. This new workflow resulted in significant stimulation treatment design changes based upon predicted production improvements that were later realized during this project.
Improved reservoir understanding achieved through the deployment of this reservoir centric solution
provided the means to reduce the total well cost by approximately 5%, even while acquiring more data, as well as building and using the earth model as a tool to provide collaboration between geologists, geophysicists, petrophysicists and different engineering disciplines.
The project helped enable the asset team to achieve consistent and repeatable well performance above the best well within the field before the project began. Well productivity was stabilized and increased while well costs were reduced, significantly adding to the economic value of the asset.
The high liquids production rates within the final wells during this evaluation strongly supports the reservoir simulation and sensitivity work performed to help improve the completion/stimulation designs to help enable better liquids production from this condensate reservoir.
Acknowledgements The authors thank the management of Devon Energy Corporation and Halliburton for permission to publish this work. The authors also thank Eric Hart, Rusty Werline, Geoff Spade, Eric Holderby, Ian Adams, Ken Williams, and Carlos Davila for their contributions and support to this project.
References Allison, D.B., Curry, S.S., and Todd, B.L. 2011. Restimulation of
Wells using Biodegradable Particulates as Temporary Diverting Agents. Paper SPE 149221 presented at the Canadian Unconventional Resources Conference, 15–17 November, Alberta, Canada. http://dx.doi.org/10.2118/149221-MS.
Browning, J., Tinker, S.W., Ikonnikova, S., et al. 2013. BARNETT SHALE MODEL-1: Study develops decline analysis, geologic parameters for reserves, production forecast. Oil & Gas J. 111 (8).
Dusterhoft, R., Kumar, A., Siddiqui, S., et al. 2014. New Processes and Tools for Design and Execution to Optimize Hydraulic Fracturing Treatments in Shale Reservoirs. Paper SPE 168583 presented at the SPE Hydraulic Fracturing Technology Conference, The Woodlands, Texas, USA, 4–6 February. http://dx.doi.org/10.2118/168583-MS.
Dusterhoft, R., Williams, K., Kumar, A. et al. 2013. Understanding Complex Source Rock Petroleum Systems to Achieve Success in Shale Developments. Paper SPE 164271 presented at the 18th Middle East Oil and Gas

15
Show and Conference (MEOS), Manama, Bahrain, 10–13 March. http://dx.doi.org/10.2118/164271-MS.
Kumar, A., Dusterhoft, R., and Siddiqui, S. 2013. Completion and Production Strategies for Liquids-Rich Wells in Ultra-Low-Permeability Reservoirs. Paper SPE 166177 presented at the SPE Annual Technical Conference and Exhibition, New Orleans, Louisiana, USA, 30 September–2 October. http://dx.doi.org/10.2118/166177-MS.
Peng, D.Y. and Robinson, D.B. 1976. A New Two-Constant Equation of State. Ind. Eng. Chem. Fundamen. 15 (1): 59–64. http://dx.doi.org/10.1021/i160057a011.
Vo, L.K., Nguyen, P.D., and Weaver, J.D. 2013. Development and Applications of an Aqueous-Based Surface Modification Agent. Paper SPE 165172 presented at the SPE European Formation Damage Conference and Exhibition, Noordwijk, The Netherlands, 5–7 June. http://dx.doi.org/10.2118/165172-MS.
Walters, H.G. and Schischka, N. 2013. Unconventional Wisdom. Oilfield Technology. 6 (3): 29–33.