accentuated cortico-cortical evokedpotentialsinneocortical epilepsy in ... · accentuated...
TRANSCRIPT
Accentuated cortico-corticalevokedpotentials inneocorticalepilepsy in areas of ictal onsetMasaki Iwasaki1,4, Rei Enatsu1, Riki Matsumoto1,3, Eric Novak2,Baburaj Thankappen1, Zhe Piao1, Tim O’Connor R1,Karl Horning1, William Bingaman1, Dileep Nair1,21 Epilepsy Center, Neurological Institute, Cleveland Clinic2 Biostatistics, Department of Qualitative Health Sciences, Cleveland Clinic, USA3 Department of Neurology, Kyoto University Graduate School of Medicine4 Department of Neurosurgery, Tohoku University Graduate School of Medicine, Japan
Received November 11, 2009; Accepted August 20, 2010
ABSTRACT – Objective. To determine whether patients with neocortical epi-lepsy show evidence for increased excitability measured by cortico-corticalevoked potentials (CCEPs) in ictal-onset regions. Methods. In patients under-going intracranial recordings with subdural electrodes for epilepsy surgery, wemeasured amplitudes, latencies, and stimulus thresholds of CCEPs near ictalonset zones (iCCEPs), and compared with adjacent neocortex not associatedwith ictal EEG (nCCEP). CCEP amplitude and latency measurements weremade with each stimulation site, using graded stimulation intensities. Results.Ten patients were included in this study. CCEPs were recorded in eight of10 patients. The first negative (N1) iCCEP amplitude was higher than that ofnCCEP in seven of the eight patients. In the group analysis, this difference wasstatistically significant. In three of these patients, the difference was individuallysignificant. In one patient, the amplitude was higher in nCCEP than iCCEPand the area selected as nCCEP was within primary eloquent cortex. Therewas no significant difference seen in latency changes or stimulus threshold.Conclusions. Accentuated CCEP amplitudes near ictal onset zones could reflectan increased excitability of the cortex associated with the epileptogenic zone insome patients with neocortical epilepsy. The response of the neocortex to low-frequency stimulation may vary depending on the presence or absence ofintrinsic epileptogenicity.
Key words: cortical stimulation, epilepsy, evoked potentials, ictal-onset zone,subdural electrode, low frequency stimulation
The purpose of a presurgical evalua-tion in patients with medically intrac-table focal epilepsy is to estimate thelocation and the extent of the epilep-togenic zone. The location of theepileptogenic zone is not directlymeasurable; rather it is assumed bythe concordance of data whichresolve the location of the irritativezone, ictal onset zone, functionaldeficit zone, and epileptic lesion
(Carreno and Lüders, 2001). Whenthere is a lack of concordance ofdata, or if functional and epilepticregions are in close proximity, furtherevaluation using intracranial EEGrecordings may be warranted. Theplacement of subdural and depth elec-trodes is based on the hypothesisgenerated by the noninvasive phaseof the testing. Invasive electrodesonly identify the reflection of the
Epileptic Disord 2010; 12 (4): 292-302
doi:10.1684/epd.2010.0334
Correspondence:D. NairEpilepsy Center, Desk S51,Cleveland Clinic, 9500 Euclid Avenue,Cleveland, OH 44195, USA<[email protected]>
Original article
292 Epileptic Disord Vol. 12, No. 4, December 2010
spread of ictal activity if the true ictal onset is either deepin the brain or at the margins of the subdural or depthelectrode array (Nair et al., 2008). For purposes of thisstudy, regions identified by invasive recordings as ictalonset have been described as the “ictal onset zone,”although the precise area of the true ictal onset cannotalways be delineated by this methodology.Cortical excitability is closely related to the pathophysio-logy of epilepsy. Increased excitability of cortex in epilep-tic patients can be associated with increased amplitudes ofevoked potentials. Giant somatosensory evoked potentialshave been reported in patients with progressive myoclonicepilepsy (Shibasaki et al., 1985; Dawson, 1947). Regionsof epileptogenicity within the cortex have occasionallybeen reported to elicit seizures with high frequency directcortical stimulation (Penfield and Jasper, 1954; Walker,1949). The lack of clear association might be a result ofthe propagation of the high-frequency stimulation todistant cortical regions, such as the symptomatic or epilep-togenic zones (Schulz et al., 1997; Ishitobi et al., 2000). Itremains controversial whether the epileptogenic zone hasa decreased threshold to induce a seizure as a result of anexternal electrical stimulus.Local cortical responses to low-frequency stimulationhave been reported and termed “direct cortical responses”(DCRs) (Adrian, 1936). DCRs from single or paired pulsestimulation have been studied in patients with mesial tem-poral lobe epilepsy (Wilson et al., 1990; Wilson et al.,1998; Valentin et al., 2005 For Valentin 2005 indicatewhen 2005a and when 2005b]) and in patients with neo-cortical epilepsy (Valentin et al., 2002; Valentin et al.2005a; Valentin et al., 2005b; Matsumoto et al., 2005).They suggested that a cortical imbalance between excita-tion and inhibition is likely to be the pathophysiologicalbasis for human partial epilepsy (Wilson et al., 1990;Wilson et al., 1998; Valentin et al., 2005a). In the currentstudy, we measured similar local cortical responses result-ing from the direct electrical stimulation of various sites intemporal, frontal, and parietal neocortex. We refer to theseresponses as cortico-cortical evoked potentials (CCEPs)which we reported in our prior studies of functional corti-cal connectivity (Matsumoto et al., 2004; Matsumotoet al., 2007). We hypothesized that the ictal onset zonemay produce CCEPs with larger amplitudes, shorter laten-cies, as well as lower stimulation thresholds, compared toregions outside the ictal onset zone.
Patients and methods
Study subjects
Ten patients (six male patients) with medically intractableneocortical epilepsy were prospectively recruited for thisstudy. This study had the approval of the institutional
review board committee of the Cleveland Clinic (IRB #4513) and informed consent was obtained from allpatients prior to the study. Consecutive patients wereselected who underwent invasive video-EEG monitoringand were found to have electrocorticographic patternssuggestive of a focal ictal onset.The study was performed extraoperatively in the epilepsymonitoring unit after the standard presurgical evaluationand after restarting antiepileptic medication. The patientswere awake and relaxed during testing. The subduralelectrode arrays consisted of platinum disc electrodes(diameter: 3.97 mm, inter-electrode distance: 10 mm)embedded in a silicon membrane (custom-made,Cleveland Clinic Foundation, Ohio). The relationshipbetween electrode position and major cerebral sulci wasidentified on a three-dimensional reconstructed post-operative T1-weighted MRI (1.5 T, 2 mm slice thicknesswithout interslice gap) or by high resolution volumetricCT (2 mm slice thickness) using the signal voids createdby the electrodes (Hadar and Bingaman, 2002;Matsumoto et al., 2004).
Cortico-cortical evoked potentials
The method of CCEPs has been described in more detailelsewhere (Matsumoto et al., 2004). In brief, bipolar elec-trical stimulation was applied to adjacent electrodes usinga Grass S88 stimulator (Astro-Med, Inc., RI). A constantcurrent, monophasic square wave pulse with 0.3 ms dura-tion, was delivered at a frequency of 1 Hz. An alternatingstimulus polarity was used to counterbalance the stimulusartefacts and maintain charge balance.Evoked potentials were recorded from the cortical surfaceby the electrodes around the stimulation site using theEpoch 2000 evoked potential measuring system (AxonSystems, Inc., NY) for the first seven patients and theNihon Khoden EEG system (EEG 1000 Nihon Khoden,Japan) for the last three patients. We began using a secondsystem so that raw data could be recorded for off-lineanalysis. An extracranial scalp electrode (contralateralmastoid) was used as the reference. The signals wereband pass filtered between 1 and 800 Hz and sampledat 2,000 Hz for the first seven patients. In the last threepatients, filtering was set from 1 to 300 Hz with a sam-pling rate of 1,000 Hz. Each average consisted of 10 to54 stimuli (table 1) with a recording time of 200 msduration and a 20 ms prestimulus baseline.In each patient, two sites were selected for recordingCCEPs; the ictal onset zone CCEP (iCCEP) and a siteclose to the ictal onset but not associated with ictalpatterns (nCCEP). The electrodes selected for iCCEPrecordings were based on onset of the initial ictal patternsof either a low voltage fast activity or repetitive spikingactivity. The nCCEP electrodes were within the samelobe of brain as the iCCEP electrodes but not associatedwith ictal EEG activity in the first 30 seconds.
Accentuated CCEPs in ictal onset
Epileptic Disord Vol. 12, No. 4, December 2010 293

CCEPs were recorded with graded stimulus intensities inorder to investigate the relationship between intensity andamplitude, as well as intensity and latency of theresponse. The bipolar stimulation of each subdural elec-trode pair was titrated from a low stimulus intensity of1.0 mA, followed by increments of 1.0 or 2.0 mA, up toa maximum of 15 mA. The intensity was always deliveredeither below afterdischarge threshold or without elicitinga clinical response (such as muscle twitch or a sensation).The typical morphology of CCEP responses was charac-terized by a prominent negative deflection (N1). The N1amplitude was measured from the pre-stimulus baselineto the peak of the N1 potential for each electrode. Thegroup analysis was performed by taking the amplitude ofthe N1 response at the electrode showing the maximumresponse at the maximum stimulation intensity level foreach patient. The maximum intensity level was definedas the highest stimulation applied to both iCCEP andnCCEP data without artefact. A higher stimulation wasignored if applied in one zone but not the other.Stimulus intensity versus N1 amplitude curve was alsoevaluated individually for each patient by comparing theiCCEP amplitude curve to the nCCEP amplitude curve.The electrode showing the highest N1 amplitude atgreatest current intensity was used for the analysis oflatency and amplitude at the various stimulation intensitygrades.
Statistics
For each patient, a t-test for paired data was conducted toidentify any difference between amplitude readings in theictal onset zone and the non-ictal zone. However, forextremely small samples, or when data deviated from nor-mality, a binomial sign test was used. Similar analysis wasconducted for latency values. A binomial sign test wasalso used to determine if the amplitude measurementthreshold occurred earlier in the ictal zone than in thenon-ictal zone. Statistical significance was determined atthe 5% level (i.e. α = 0.05). When results were not avail-able for both iCCEP and nCCEP, a pairing could not bemade and the intensity level was not included.
Results
Demographics
The patient characteristics and details of invasive evalua-tion are described in table 2. Five patients had neocorticaltemporal lobe epilepsy (patients 1, 4, 6, 9 and 10), fourhad frontal lobe epilepsy (patients 2, 3, 7and 8) and onehad perirolandic epilepsy (patient 5). Three patients hadprior failed epilepsy surgery (patients 3, 4 and 7). Locationof ictal onset zone measurements for iCCEP varied amongpatients: patient 1 had two ictal onset zones (right ento-
rhinal cortex and posterior aspect of the right superiortemporal gyrus); patient 2 (posterior aspect of right medialfrontal gyrus); patient 3 (right orbitofrontal cortex); patient4 (left middle temporal gyrus anterior to the glioma);patient 5 (left lower postcentral gyrus); patient 6 (parahip-pocampal gyrus); patient 7 (left orbitofrontal gyrus);patient 8 (right middle frontal gyrus); patient 9 (left super-ior temporal gyrus); and patient 10 (right middle temporalgyrus). The type and dosage of anticonvulsant medicationduring the recordings varied for each patient.CCEPs were successfully recorded in eight of 10 patients.There were no symptoms or seizures induced during theprocedure. Stimulus artefacts precluded analysis in twopatients (patients 6 and 7). Response threshold intensityranged between 3 and 8 mA for iCCEPs, and between4 and 15 mA for nCCEPs. In Patient 1, two sets ofiCCEP and nCCEP were studied for two separate ictalonset zones. CCEPs were not always recorded from allregions surrounding the stimulation, such as when thestimulation was performed at the edge of electrodearray.
General characteristics of cortico-corticalevoked potentials
Cortico-cortical evoked potentials (CCEPs) consisted oftwo components: an initial stimulus artefact and a seriesof cortical potentials. The stimulus artefact occurredwithin 3-5 ms and consisted of a baseline drift withquick decay following the stimulus. CCEPs were thencharacterized by a prominent negative peak, labelled asN1, with a latency ranging from around 5 to 82 ms. Theelectrode which showed the largest N1 amplitude wastypically adjacent to the stimulating pair.
Amplitude difference
The iCCEP and nCCEP amplitude measurements werecompared and differences calculated for each maximumstimulus intensity level. The amplitude was higher inthe iCCEP measurements than in nCCEP in seven of10 patients. In one of 10 patients, the amplitude washigher in nCCEP than iCCEP measurements. CCEPscould not be recorded in two of 10 patients .The meanamplitude difference between iCCEP and nCCEP acrossall patients was 209.0 which was significantly greater inthe ictal onset zone (p = 0.002).For each patient, the iCCEP and nCCEP amplitude mea-surements were compared and differences calculated foreach stimulus intensity level (figures 1-3). The meanamplitude differences between iCCEPs and nCCEPs, andthe number of iCCEP amplitude measurements that weregreater than nCCEP amplitude measurements, can beseen in table 1. Patients 2, 3 and 4 had individual iCCEPamplitudes that were significantly greater than nCCEPamplitudes (with p-values equal to 0.0091, 0.0125 and
M. Iwasaki, et al.
294 Epileptic Disord Vol. 12, No. 4, December 2010
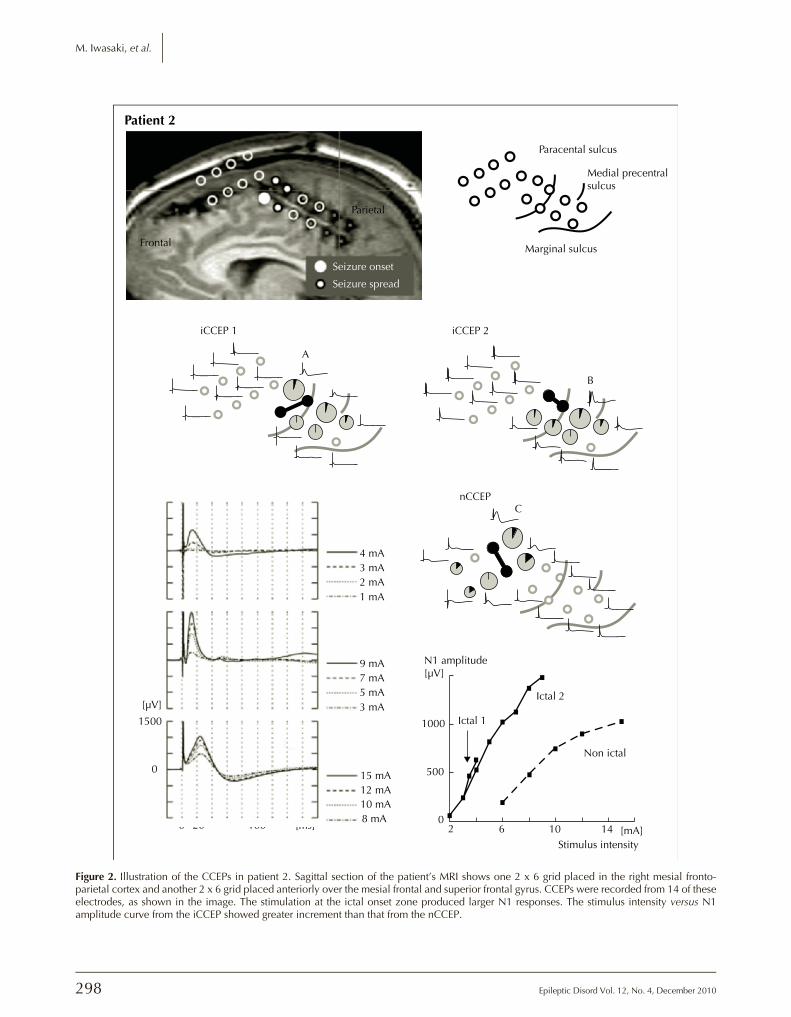
0.0437, respectively). An example of the amplitude andstimulus intensity curves, demonstrating how iCCEP stim-ulation produced a left shift in the curve compared to thenCCEP curve, is seen in figure 2. Two ictal onset zoneswere stimulated in this patient as shown in figure 2, how-ever the first ictal onset zone had a maximum stimulationintensity of 4 mA with higher intensities producing amotor response. In the second ictal onset zone, higherstimulation intensities could be delivered without after-discharges or eliciting a clinical response, therefore thisarea was used in the statistical analysis. However bothregions, as shown in the graph, had similar slope andleft shift as compared to the non-ictal site.
There was no statistical difference of the individualamplitude measurements between iCCEP and nCCEP inpatients 1, 5, 8, 9 and 10. Two ictal and non-ictal zoneswere recorded for patient 1. Although the amplitudes inthe first ictal onset zone were slightly higher than in thenon-ictal zones, this was not true for the second ictal andnon-ictal pair in this patient. In patients 8, 9 and 10, theiCCEPs were of larger amplitude than the nCCEPs but didnot reach statistical significance individually. The per-centage of times in which the iCCEP amplitudes weregreater than the nCCEP at all the incremental stimulationscombined were also more frequent in patients 2, 3, 4 and10, but this did not reach statistical significance.
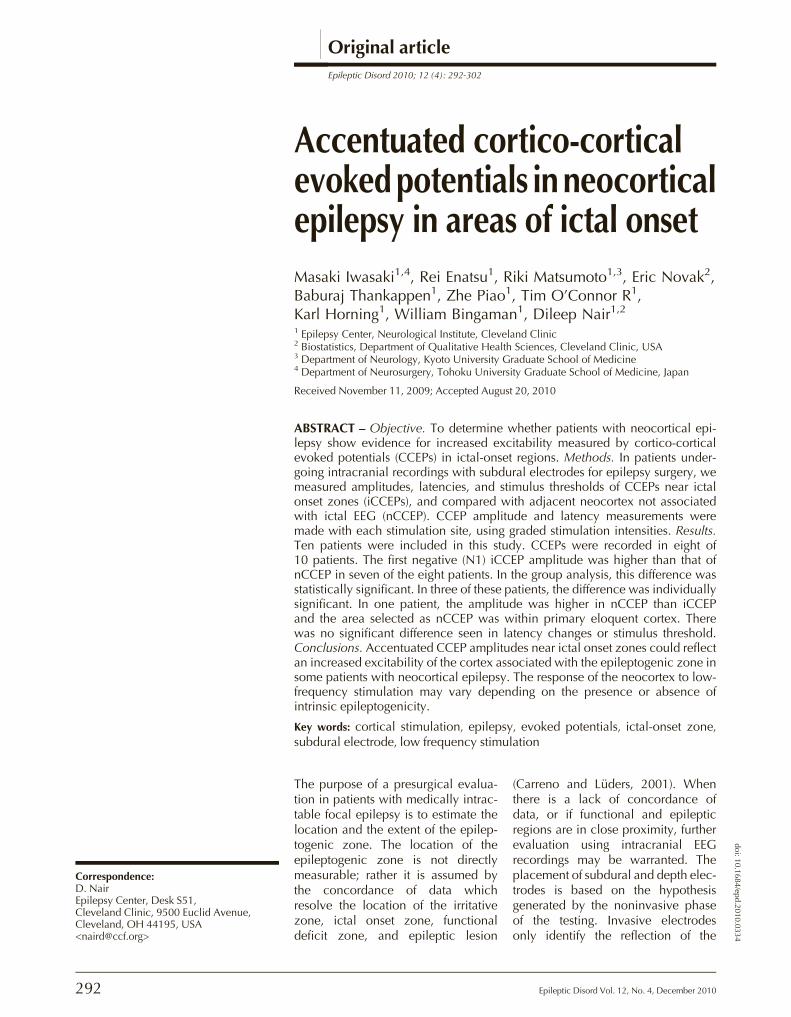
Superior temporalsulcus
Lateraltemporalneocortex
Entorhinal cortex
N1 amplitude / latencynCCEP (9mA)
Seizure onsetSeizure spread
iCCEP (9mA)
Patient 1
B
A
Earliest N1
10 ms delay
100% amplitude
70%
40%
Stimulation
Figure 1. Illustration of the CCEPs in patient 1 (top row). The volume-rendered brain MRI of the right fronto-temporal region is displayedfrom the anterior inferior oblique view. One six-contact subdural strip electrode is placed over the right anterior basal temporal cortextowards the entorhinal cortex. One 2x6 subdural grid electrode is placed on the anterior lateral temporal cortex towards the temporo-polarregion. CCEPs were recorded from circled electrodes. Anatomical relationship is depicted next to the MRI. One form of ictal EEG initiated atthe electrode over the entorhinal cortex and spread to the anterior lateral temporal region (bottom row). CCEPs after stimulation of the ictalonset zone and after stimulation outside the ictal onset zone are compared. Stimulus intensity was 9 mA for both. Size of the full circles is pro-portional to the amplitude of N1 peak for the given stimulation. In this way, a distribution of the response is shown for the given stimulationand they cannot be used for comparison between stimulations (such as between iCCEP or nCCEPs data sets). 100% amplitude is assignedto the electrode with the largest N1 response. The angle of pie (painted in black) shows the relative latency of N1, i.e. latency delayfrom the earliest N1.
Accentuated CCEPs in ictal onset
Epileptic Disord Vol. 12, No. 4, December 2010 295
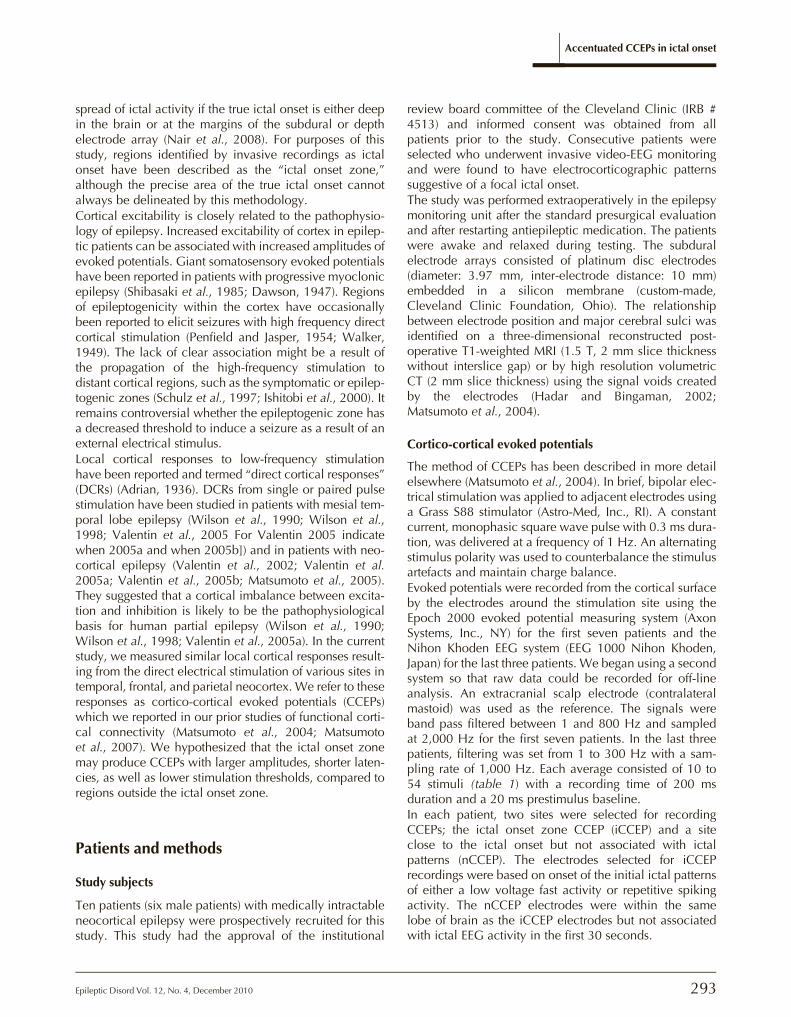
Table 1. Amplitude of CCEPs responses to graded stimulation intensity. Two positions of ictal and non-ictal stimulationwere tested for patient 1.
PatientNumber
StimulationIntensity (mA)
Numberof Averages
iCCEP Amplitude(μV)
nCCEPAmplitude(μV)
Mean Difference(iCCEP-nCCEP)(μV)
iCCEP> nCCEP
Percentageof Stimulationswith GreateriCCEPamplitudes
1(1st position)
9753
20202020
191126250
10614300 - 26.7
p = 0.7460
YesNoYesNo 25%
(2/8)1(2nd position)
9753
20202020
33713800
5212701190
NoNoNoNo
2 15121098765432
1010101010101010101010
No dataNo data15601486.613761131.81025.2824.6532.4244.60
1032.6904.2751.1No data257No data32No data000
616.3p = 0.0091*
--Yes-Yes-Yes-YesYesNo
83.3%(5/6)p = 0.1094
3 141210986432
101010101010101010
No dataNo data1111110810937033000No data
000No data000No data0
801.8p = 0.0125*
--Yes-YesYesYes--
100.0%(4/4)p = 0.0625
4 119753
2020202020
575372.8224.200
14476.5000
190.3p = 0.0437*
YesYesYesNoNo
60.0%(3/5)p = 0.5000
5 654
202020
12366.851.8
326.4236.80
-100.5p = 0.8375
NoNoYes
33.3%(1/3)p = 0.8750
8 8421
54545454
26811100
18159.100
34.77p = 0.1008
YesYesNoNo
50.0%(2/4)p =0.6875
9 15842
54545454
186.966.800
61.1000
48.15p = 0.1051
YesYesNoNo
50.0%(2/4)p = 0.6875
10 842
525252
74665.80
56438.20
69.87p = 0.343
YesYesNo
66.7%(2/3)p = 0.5000
iCCEP: CCEPs of ictal onset zone; nCCEP: CCEPs of neocortex uninvolved with the ictal EEG pattern; “Yes” means the amplitudeof iCCEP was larger than nCCEP; “No” means the amplitude of iCCEP was smaller or the same as nCCEP; * Indicates significance;No data: stimulation not applied.
M. Iwasaki, et al.
296 Epileptic Disord Vol. 12, No. 4, December 2010
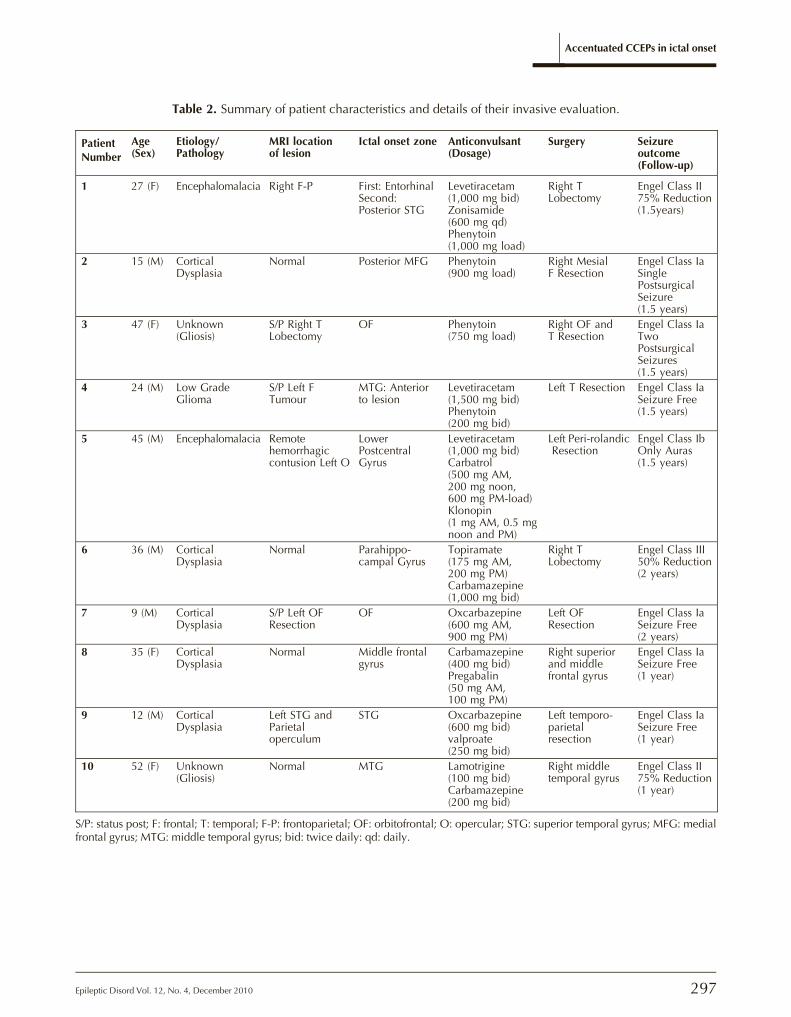
Table 2. Summary of patient characteristics and details of their invasive evaluation.
PatientNumber
Age(Sex)
Etiology/Pathology
MRI locationof lesion
Ictal onset zone Anticonvulsant(Dosage)
Surgery Seizureoutcome(Follow-up)
1 27 (F) Encephalomalacia Right F-P First: EntorhinalSecond:Posterior STG
Levetiracetam(1,000 mg bid)Zonisamide(600 mg qd)Phenytoin(1,000 mg load)
Right TLobectomy
Engel Class II75% Reduction(1.5years)
2 15 (M) CorticalDysplasia
Normal Posterior MFG Phenytoin(900 mg load)
Right MesialF Resection
Engel Class IaSinglePostsurgicalSeizure(1.5 years)
3 47 (F) Unknown(Gliosis)
S/P Right TLobectomy
OF Phenytoin(750 mg load)
Right OF andT Resection
Engel Class IaTwoPostsurgicalSeizures(1.5 years)
4 24 (M) Low GradeGlioma
S/P Left FTumour
MTG: Anteriorto lesion
Levetiracetam(1,500 mg bid)Phenytoin(200 mg bid)
Left T Resection Engel Class IaSeizure Free(1.5 years)
5 45 (M) Encephalomalacia Remotehemorrhagiccontusion Left O
LowerPostcentralGyrus
Levetiracetam(1,000 mg bid)Carbatrol(500 mg AM,200 mg noon,600 mg PM-load)Klonopin(1 mg AM, 0.5 mgnoon and PM)
Left Peri-rolandicResection
Engel Class IbOnly Auras(1.5 years)
6 36 (M) CorticalDysplasia
Normal Parahippo-campal Gyrus
Topiramate(175 mg AM,200 mg PM)Carbamazepine(1,000 mg bid)
Right TLobectomy
Engel Class III50% Reduction(2 years)
7 9 (M) CorticalDysplasia
S/P Left OFResection
OF Oxcarbazepine(600 mg AM,900 mg PM)
Left OFResection
Engel Class IaSeizure Free(2 years)
8 35 (F) CorticalDysplasia
Normal Middle frontalgyrus
Carbamazepine(400 mg bid)Pregabalin(50 mg AM,100 mg PM)
Right superiorand middlefrontal gyrus
Engel Class IaSeizure Free(1 year)
9 12 (M) CorticalDysplasia
Left STG andParietaloperculum
STG Oxcarbazepine(600 mg bid)valproate(250 mg bid)
Left temporo-parietalresection
Engel Class IaSeizure Free(1 year)
10 52 (F) Unknown(Gliosis)
Normal MTG Lamotrigine(100 mg bid)Carbamazepine(200 mg bid)
Right middletemporal gyrus
Engel Class II75% Reduction(1 year)
S/P: status post; F: frontal; T: temporal; F-P: frontoparietal; OF: orbitofrontal; O: opercular; STG: superior temporal gyrus; MFG: medialfrontal gyrus; MTG: middle temporal gyrus; bid: twice daily: qd: daily.
Accentuated CCEPs in ictal onset
Epileptic Disord Vol. 12, No. 4, December 2010 297
Seizure onset
Paracental sulcus
Patient 2
Medial precentralsulcus
Marginal sulcus
Parietal
Frontal
iCCEP 2
B
nCCEP
N1 amplitude[µV]
[µV]
Ictal 1
Ictal 2
Non ictal
10001500
0 20 100 [ms]
10 mA12 mA15 mA
3 mA5 mA7 mA9 mA
1 mA2 mA3 mA4 mA
8 mA
0
C
B
A
500
02 6 10 14 [mA]
Stimulus intensity
C
A
iCCEP 1
Seizure spread
Figure 2. Illustration of the CCEPs in patient 2. Sagittal section of the patient’s MRI shows one 2 x 6 grid placed in the right mesial fronto-parietal cortex and another 2 x 6 grid placed anteriorly over the mesial frontal and superior frontal gyrus. CCEPs were recorded from 14 of theseelectrodes, as shown in the image. The stimulation at the ictal onset zone produced larger N1 responses. The stimulus intensity versus N1amplitude curve from the iCCEP showed greater increment than that from the nCCEP.
M. Iwasaki, et al.
298 Epileptic Disord Vol. 12, No. 4, December 2010
10 mA8 mA6 mA
1000
0
A
B
A
B
A
B
4 mA
9 mA
500
07 mA5 mA3 mA
9 mA400
0
7 mA5 mA3 mA
Medialorbital sulcus
Seizure onsetSeizure spread
Olfactorysulcus
iCCEP
Patient 3
Patient 4
Patient 5
nCCEP
SF
ITS
STS
nCCEPiCCEP
AB
B
A
Pre-CS CS
SFS
iCCEP nCCEP
B
A
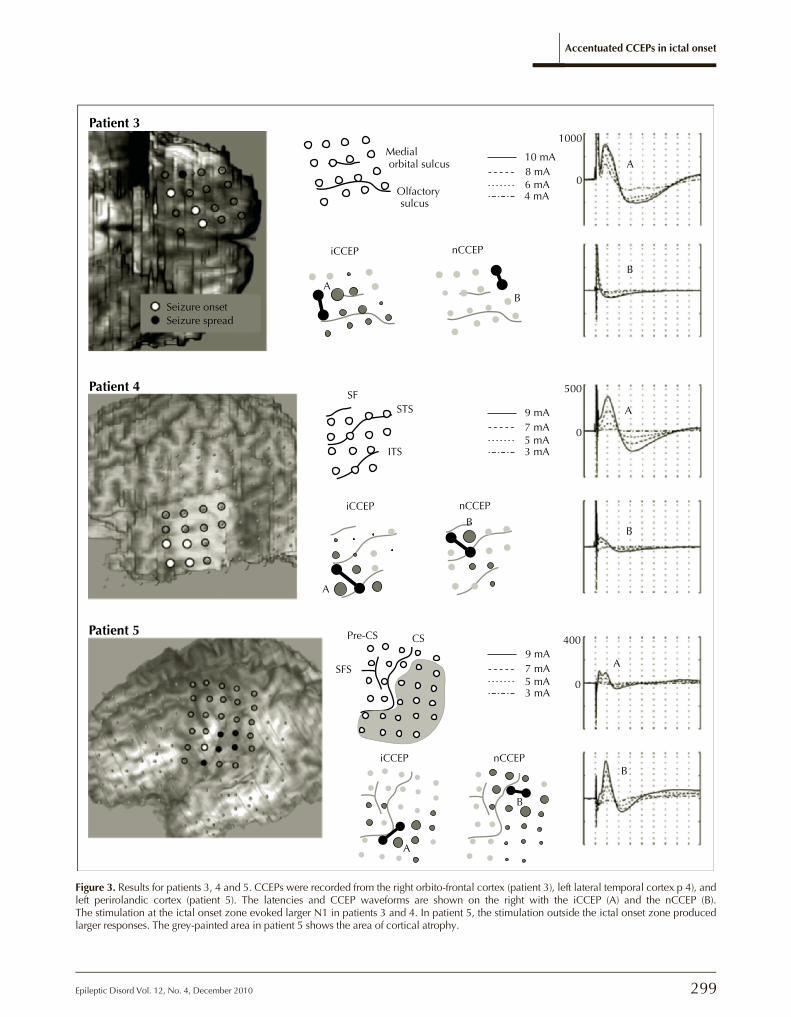
Figure 3. Results for patients 3, 4 and 5. CCEPs were recorded from the right orbito-frontal cortex (patient 3), left lateral temporal cortex p 4), andleft perirolandic cortex (patient 5). The latencies and CCEP waveforms are shown on the right with the iCCEP (A) and the nCCEP (B).The stimulation at the ictal onset zone evoked larger N1 in patients 3 and 4. In patient 5, the stimulation outside the ictal onset zone producedlarger responses. The grey-painted area in patient 5 shows the area of cortical atrophy.
Accentuated CCEPs in ictal onset
Epileptic Disord Vol. 12, No. 4, December 2010 299
Latency difference
Similar to the amplitude analysis, iCCEP and nCCEP max-imum intensity latency measurements were comparedboth as a group as well as individually. Patients 2 and5 had shorter iCCEP latency values (12.8 ms and 5.4 ms)than nCCEP latency values (25.7 ms and 18.3 ms) butthis did not reach statistical significance. Latencies werenot found to be statistically shorter in duration in theother patients, with iCCEP responses ranging from 5.4 to82 ms compared to the nCCEP responses rangingfrom 12.7 to 67 ms.
Amplitude threshold
In order to determine whether amplitude thresholds wereseen at lower stimulus intensities for iCCEP measurementscompared to nCCEP, a determination was made for eachof the eight patients indicating whether iCCEP wasobserved prior to nCCEP. Six of the eight patients (75%)had amplitude thresholds that were lower for iCCEP thannCCEP (table 1). For patient 3, iCCEPs were recorded firstat 4 mA whereas nCCEPs were never recorded up to14 mA. However, a lower amplitude threshold in iCCEPregions did not reach statistical significance for all cases.
Seizure free outcome after surgery
All eight patients underwent epilepsy surgery withremoval of tissue, including the tissue associated withthe ictal onset zone. Of the eight patients in whomCCEPs could be recorded, six (patients 2, 3, 4, 5, 8 and 9)had good seizure outcome (table 2). Patients 4, 8 and 9were completely seizure free for one year or longer,whereas patients 2 and 3 had one or two postoperativeseizures but eventually became seizure free. Althoughpatient 5 had a good clinical surgical outcome, he contin-ued to have frequent auras. This suggests that the epilep-togenic zone was incompletely resected. Patient 1 had areduction of her seizures following surgery but continuedto have seizures after surgery. The three patients in whomiCCEPs amplitudes showed significant individual differ-ences all had good seizure free outcome.
Discussion
The principal finding of this study is that, based on groupanalysis in patients with focal neocortical epilepsy, low-frequency stimulation at ictal onset zones produces amore marked increase in CCEP amplitude compared tothe stimulation outside the ictal onset zone. While indi-vidual differences in amplitudes elicited in three patientswere significantly higher in the ictal onset zone, this wasnot true for the remaining five patients. The measurementsof amplitude change in this study were performed using
graded stimulation intensities. By doing so, the stimula-tion and amplitude curves shifted to the left of the curvefor CCEP in the ictal onset zones. The presence ofenhanced amplitudes in ictal onset zones may be a reflec-tion of the increased excitability of the cortex associatedwith epileptogenicity in these regions in some patientswith neocortical epilepsy. It should be noted that regionsselected as controls (nCCEP) were not systematically ana-lyzed for any underlying pathology. Therefore, nCCEPmay not necessarily represent responses from normal cor-tex, however the comparisons with iCCEPs were made inregions of similar anatomical localization. Patient 5 wasthe only patient in whom the underlying cortex showedan imaging difference between iCCEP and nCCEP. In thispatient, the ictal onset electrode had an underlying ence-phalomalacia whereas the non-ictal electrode did not.This selected non-ictal region also showed eloquent func-tion by standard cortical stimulation. This may explainwhy this patient also showed the opposite relationshipin which the nCCEPs were larger than iCCEPs. It maybe important in future studies to compare not onlysimilar anatomical regions but differentiate primary versusassociation cortices, as well as lesional versus non-lesional areas.The latencies of these responses occurred within a shortperiod after the stimulation onset (5 and 82 ms). It isknown that electrical pulse stimulation of the neocorticalsurface produces stereotypical synaptic responses adja-cent to the stimulation called DCRs (Adrian, 1936; Barthand Sutherling, 1988). DCRs are characterized by a prom-inent negative peak around 10-20 ms, followed by slowpositive and negative potentials lasting up to 200 to300 ms (Barth and Sutherling, 1988; Goldring et al.,1961; Purpura et al., 1957). Our study noted larger varia-tions and more prolonged latencies than described inDCR studies. Some explanations include the variationsnoted in abnormal cortex or the effect of anticonvulsantmedication. However, the more likely explanation mayinvolve the significant differences in the electrode sizesand interelectrode distances, both of which were muchsmaller in the DCR studies. The larger surface area ofthe recording electrodes used in our study would enablerecording over a larger population of pyramidal neuronswhich may have some variable jitter in their individualresponses (Matsumoto et al., 2004). If so, then this jittermay have blunted the N1 peak, producing a longerlatency. Latencies recorded in our study were not signifi-cantly decreased in the ictal onset zone compared to thenon-ictal onset regions as might be expected when com-paring regions of potentially different synaptic excitability.Other reports that have studied late responses, rangingfrom 100 ms to one second after an inter-ictally appliedsingle-pulse stimulation, effectively predicted the topogra-phy of seizure onset in temporal lobe epilepsy (Valentinet al., 2002) as well as in frontal lobe epilepsy (Valentinet al., 2005a). When resected, these areas tended to pre-
M. Iwasaki, et al.
300 Epileptic Disord Vol. 12, No. 4, December 2010
dict good surgical outcome in frontal and temporal lobeepilepsy (Valentin et al., 2005b). These late responses werenot evaluated in our study. Early responses, similar toCCEPs, have been recorded in other studies (Valentinet al., 2002, 2005a, 2005b) but were not associated withregions of seizure onset. The main difference between themethodologies of these studies and ours is that our studycompared amplitudes of the evoked response to the stimu-lation intensity given in a graded fashion. This allowed for acomparison of amplitude response to the intensity of stim-ulation between various neocortical sites.The electrical stimulation used in our study was similar tothat in the previous DCR studies. The CCEPs most likelyshare common generator mechanisms with DCRs in theinitiation of the response and involve the cortico-corticalprojection neurons for the relatively distant transmissionof the responses. We speculate that CCEPs vary depend-ing on the efficiency of excitatory synaptic connectionsbetween the stimulated cortex and the remote cortex.Previous investigators revealed that positive potential(P1) and N1 DCRs were associated with the occurrenceof frequent action potentials and excitatory postsynapticpotentials (EPSPs) in the apical dendrites of pyramidalcells (Barth and Sutherling, 1988; Creutzfeldt et al.,1966). The cortical stimulation produces multisynapticexcitatory responses in the local cortical circuits (Douglaset al., 1995), mainly mediated by the ascending recurrentaxon collaterals of the pyramidal neurons and partly byexcitatory interneurons (Barth et al., 1989). This excitatoryprocess is followed by inhibitory postsynaptic potentials(IPSPs) and longer periods of hyperpolarization (DCR-P2)(Barth and Sutherling, 1988). The amplitude and timecourse of the N1 probably reflects the summation ofEPSPs occurring after multisynaptic excitations and sec-ondary inhibition by IPSPs. The region of maximumamplitude change was noted in the electrode adjacent tothe electrodes being stimulated. This may reflectincreased local excitability of the epileptic cortex.Initial attempts to study cortical stimulation as a surrogatemarker for the epileptogenic zone involved looking atafterdischarge thresholds and induction of typical aurasor seizures (Lesser et al., 1984; Luders et al., 1988;Penfield and Jasper, 1954; Walker, 1949). We assessedwhether stimulus threshold to evoke CCEP was lower inregions near ictal onset compared to non-ictal onsetzones but found no statistical significant difference.This preliminary study suggests that CCEPs close to ictalonset regions may be affected by the excitability of thecerebral cortex in some patients with focal epilepsy. Wedid not show this to be the case in each patient indivi-dually, but this was demonstrated when comparison wasperformed within the entire group of patients studied. It isinteresting that the three patients who did show significantindividual amplitude differences all had good seizureoutcome following epilepsy surgery. Whether the findingof a significant difference of amplitude between iCCEP
and nCCEP regions in an individual patient has goodcorrelation with seizure-free outcome after surgery isunclear based on the small number of patients in whichthis was observed in our study.A previous study suggested that cellular responses toexternal electrical stimulation are enhanced in the epilep-togenic cortex (Matsumoto et al., 2005). In vivo cellularrecordings from lateral temporal cortex in patients withintractable epilepsy showed that “epileptic” neuronswith spontaneous high-frequency bursts are more likelyto generate evoked single unit activities after direct corti-cal stimulation than do “normal” firing neurons (Wylerand Ward Jr., 1981). Techniques similar to CCEPs havebeen applied before in human subjects to evaluate epilep-togenicity. Wilson et al. (1990) used evoked potentialselicited by stimulation of the limbic structures to investi-gate the “preferred pathway” of epileptic activity. Theydid not find increased “response probability” when stimu-lating the epileptogenic region. Rutecki et al. (1989) foundthat the entorhinal-evoked hippocampal potentialsshowed different waveform configuration among patientswith and without hippocampal sclerosis. Stereotacticdepth electrode studies (Buser and Bancaud, 1983)reported that evoked responses in the amygdala after hip-pocampal stimulation were exclusively observed inpatients with temporal lobe epilepsy but less in othertypes of epilepsy. It was speculated that epileptogenesiscould generate new synaptic pathways which werenormally absent.Some limitations of this study include the evaluation ofonly predefined regions of the cortex in each case andthe variation of ictal EEG patterns, which makes the identi-fication of the electrodes involved in the initial changeschallenging. This study did not attempt to evaluate theictal patterns and their association to CCEP amplitudes;however, this would be an interesting consideration forfuture studies. Another issue that may have affected thesefindings is that the patients were receiving the typical dosesof anticonvulsants at the time of this study. What effectanticonvulsants would have had on the CCEP recordingsis not clear. For two of our patients, CCEP recordingcould not be accomplished due to stimulus artefacts. Thismight limit the usefulness of this technique in all patientswith intracranial recordings. Techniques that resolve stim-ulus artefacts could enhance the usefulness of this tech-nique and future efforts should focus on several regions ofthe cortex without knowledge of the ictal EEG information.In conclusion, the CCEPs recorded, following stimulationof ictal onset zones, were shown to increase in compari-son to similar regions of cortex not involved in the ictalactivity in our group of patients with focal neocortical epi-lepsy. This difference was only individually significant inthree of eight patients. The seizure-free outcome follow-ing surgery was good for the three in whom the differencewas individually significant. The number of patients stud-ied in this study was small. Thus, we consider this study to
Accentuated CCEPs in ictal onset
Epileptic Disord Vol. 12, No. 4, December 2010 301
be preliminary and a larger study necessary to validatethis finding. The ability to accurately record regions ofictal onset in invasive EEG can be challenging (Ebnerand Lüders, 2001). Therefore, exploring other surrogatemarkers for epileptogenicity could aid in the detection ofthese regions. □Acknowledgments.We wish to thank Dr Hans Lüders for his comments on the protocolfor this study as well as Ms Elaine Gottlieb for her editorial commentsof the paper.
Disclosure.None of the authors has any conflict of interest or financial support todisclose.
References
Adrian ED. The spread of activity in the cerebral cortex. JPhysiol1936; 88: 127-61.
Barth DS, Sutherling W. Current source-density and neuromag-netic analysis of the direct cortical response in rat cortex. BrainRes 1988; 450: 280-94.
Barth DS, Di S, Baumgartner C. Laminar cortical interactions dur-ing epileptic spikes studied with principal component analysisand physiological modeling. Brain Res 1989; 484: 13-35.
Buser P, Bancaud J. Unilateral connections between amygdalaand hippocampus in man. A study of epileptic patients withdepth electrodes. Electroencephalogr Clin Neurophysiol 1983;55: 1-12.
Carreno M, Luders H. General Principles of PresurgicalEvaluation. In: Lüders H, Comair Y, eds. Epilepsy Surgery.Philadelphia: Lippincott Williams & Wilkins, 2001: 185-99.
Creutzfeldt OD, Watanabe S, Lux HD. Relations between EEGphenomena and potentials of single cortical cells. I. Evokedresponses after thalamic and erpicortical stimulation.Electroencephalogr Clin Neurophysiol 1966; 20: 1-18.
Dawson GD. Investigations on a patient subject to myoclonic sei-zures after sensory stimulation. J Neurol Neursurg Psychiatry1947; 10: 141-62.
Douglas RJ, Koch C, Mahowald M, Martin KA, Suarez HH.Recurrent excitation in neocortical circuits. Science 1995; 269:981-5.
Ebner A, Luders H. Subdural Electrodes. In: Lüders H, Comair Y,eds. Epilepsy Surgery. Philadelphia: Lippincott Williams &Wilkins, 2001: 593-6.
Goldring S, Jerva MJ, Holmes TG, O’Leary JL, Shields JR. Directresponse of human cerebral cortex. Arch Neurol 1961; 4: 590-8.
Hadar EJ, BingamanWE. Surgery for hemispheric malformations ofcortical development.Neurosurg ClinNAm 2002; 13: 103-11 (ix.).
Ishitobi M, Nakasato N, Suzuki K, Nagamatsu K, Shamoto H,Yoshimoto T. Remote discharges in the posterior language area dur-ing basal temporal stimulation. Neuroreport 2000; 11: 2997-3000.
Lesser RP, Luders H, Klem G, Dinner DS, Morris HH, Hahn J.Cortical afterdischarge and functional response thresholds: resultsof extraoperative testing. Epilepsia 1984; 25: 615-21.
Lüders H, Lesser RP, Dinner DS, Morris HH, Wyllie E, Godoy J.Localization of cortical function: new information from extrao-perative monitoring of patients with epilepsy. Epilepsia 1988; 29(Suppl. 2): S56-65.
Matsumoto R, Nair DR, LaPresto E, Bingaman W, Shibasaki H,Luders HO. Functional connectivity in human cortical motorsystem: a cortico-cortical evoked potential study. Brain 2007;130: 181-97.
Matsumoto R, KinoshitaM, Taki J, et al. In vivo epileptogenicity offocal cortical dysplasia: a direct cortical paired stimulation study.Epilepsia 2005; 46: 1744-9.
Matsumoto R, Nair DR, LaPresto E, et al. Functional connectivityin the human language system: a cortico-cortical evoked poten-tial study. Brain 2004; 127: 2316-30.
Nair DR, Burgess R, McIntyre CC, Lüders H. Chronic subduralelectrodes in the management of epilepsy. Clin Neurophysiol2008; 119: 11-28.
PenfieldW, Jasper H. Epilepsy and the Functional Anatomy of theHuman Brain. Boston, MA: Little Brown, 1954.
Purpura DP, Pool JL, Ransohoff J, Frumin MJ, Housepian EM.Observations on evoked dendritic potentials of human cortex.Electroencephalogr Clin Neurophysiol Suppl 1957; 9: 453-9.
Rutecki PA, Grossman RG, Armstrong D, Irish-Loewen S.Electrophysiological connections between the hippocampusand entorhinal cortex in patients with complex partial seizures.J Neurosurg 1989; 70: 667-75.
Schulz R, Luders HO, Tuxhorn I, et al. Localization of epilepticauras induced on stimulation by subdural electrodes. Epilepsia1997; 38: 1321-9.
Shibasaki H, Yamashita Y, Neshige R, Tobimatsu S, Fukui R.Pathogenesis of giant somatosensory evoked potentials in pro-gressive myoclonic epilepsy. Brain 1985; 108 (Pt 1): 225-40.
Valentin A, Alarcon G, Garcia-Seoane JJ, et al. Single-pulse elec-trical stimulation identifies epileptogenic frontal cortex in thehuman brain. Neurology 2005a; 65: 426-35.
Valentin A, Alarcon G, Honavar M, et al. Single pulse electricalstimulation for identification of structural abnormalities and pre-diction of seizure outcome after epilepsy surgery: a prospectivestudy. Lancet Neurol 2005b; 4: 718-26.
Valentin A, Anderson M, Alarcon G, et al. Responses to singlepulse electrical stimulation identify epileptogenesis in thehuman brain in vivo. Brain 2002; 125: 1709-18.
Walker AE. Electrocorticography in Epilepsy. ElectroencephalogrClin Neurophysiol Suppl 1949; 2: 30-9.
Wilson CL, Khan SU, Engel Jr J, Isokawa M, Babb TL, Behnke EJ.Paired pulse suppression and facilitation in human epileptogenichippocampal formation. Epilepsy Res 1998; 31: 211-30.
Wilson CL, Isokawa M, Babb TL, Crandall PH. Functional con-nections in the human temporal lobe. I. Analysis of limbic systempathways using neuronal responses evoked by electrical stimula-tion. Exp Brain Res 1990; 82: 279-92.
Wyler AR, Ward Jr AA. Neurons in human epileptic cortex.Response to direct cortical stimulation. J Neurosurg 1981; 55:904-8.
M. Iwasaki, et al.
302 Epileptic Disord Vol. 12, No. 4, December 2010