access statement constraints …docs.azgs.az.gov/speccoll/2003-01/2003-01-0067.pdfaccess statement...
TRANSCRIPT

The following file is part of the Anderson Mine Collection
ACCESS STATEMENT
These digitized collections are accessible for purposes of education and research. We have indicated what we know about copyright and rights of privacy, publicity, or trademark. Due to the nature of archival collections, we are not always able to identify this information. We are eager to hear from any rights owners, so that we may obtain accurate information. Upon request, we will remove material from public view while we address a rights issue.
CONSTRAINTS STATEMENT
The Arizona Geological Survey does not claim to control all rights for all materials in its collection. These rights include, but are not limited to: copyright, privacy rights, and cultural protection rights. The User hereby assumes all responsibility for obtaining any rights to use the material in excess of “fair use.”
The Survey makes no intellectual property claims to the products created by individual authors in the manuscript collections, except when the author deeded those rights to the Survey or when those authors were employed by the State of Arizona and created intellectual products as a function of their official duties. The Survey does maintain property rights to the physical and digital representations of the works.
QUALITY STATEMENT
The Arizona Geological Survey is not responsible for the accuracy of the records, information, or opinions that may be contained in the files. The Survey collects, catalogs, and archives data on mineral properties regardless of its views of the veracity or accuracy of those data.
CONTACT INFORMATION Mining Records Curator
Arizona Geological Survey 3550 N. Central Ave, 2nd floor
Phoenix, AZ, 85012 602-771-1601
http://www.azgs.az.gov [email protected]

VOLUME 2
INERALS EXP
FINAL FE
JULY, 1978 MORR[S*'M KNUDSEN

W.O. NO.1114
COPY NO.&
INERALS EXPLOR
MI ALS'
FINAL FEASl
ANDERSON EC URANIUM MINE AND MILL
YAVAPAI COUNTY, ARIZONA
( j
JULY, 1978 MORRISON KNUDSEN

TABLE OF CONTENTS
VOLUME I 1 - GEOLOGY AND MINING
SECTION
VOLUME I 1 INTRODUCTION
VOLUME I 1 SUMMARY
GEOLOGY, ORE RESERVES AND HYDROLOGY
PAGE
v i i i
5.1 Geology 5-1
5.1.1 Regional Geology 5.1.2 Geology o f Mine Area
5.2 Ore Reserves
5.2.1 Geotechnical Study 5-1 2 5.2.2 B u l k Dens i t y 5-1 5 5.2.3 E q u i l i b r i u m 5-1 6
5.3 Hydrology
5.3.1 Groundwater 5.3.2 Sur face Water 5.3.3 Pump Tes t i ng
6 MINING
6.1 Overburden Removal
6.1.1 Preproduc t ion S t r i p p i n g 6.1.2 Produc t ion S t r i p p i n g
6.2 Ore and Waste M a t e r i a l s Handl ing 6-5
6.2.1 Secondary S t r i p p i ng 6-5 6.2.2 I n t e r i o r Waste Removal 6-5 6.2.3 Ore Min ing 6-6

i SECTION PAGE
6 MINING (Continued)
6 . 3 Ore Grade Control
6 .4 Stockpi 1 ing Procedure
6 .5 Mining Sequence
6 . 6 Schedule and C o n s t r a i n t s
6.6.1 A c t i v i t y Schedule 6 .6 .2 S t r i p p i n g 6 . 6 . 3 Mining 6 .6 .4 Mine Parameters 6 .6 .5 Mate r ia l Product ion Rates 6 .6 .6 Equipment Operat ing Parameters 6 . 6 . 7 Mine Maintenance
6 .7 Equipment L i s t i n g 6-15
6.8 Mine C a p i t a l Cost 6-17
6 .9 Manpower Requirements
6.10 Operat ing and Maintenance Costs
6.11 Maintenance Procedures 6-45
6.71.1 F i e l d Maintenance 6-45 6.11.2 Shop Maintenance 6-45
7 MINING FACILITIES 7-1
7.1 Admin is t ra t ion Bui ld ing 7-1
7.2 Maintenance and S e r v i c e Shops 7-3
7 . 3 Fuel S to rage

EXHIBIT 11-A - DRAWINGS
Drawing No. MEC-000 Drawing No. MEC-001 Drawing No. MEC-002 Drawing No. MEC-003 Drawing No. MEC-004
Drawing No. 21 -53-0-1 04 Drawi ng No. 21 -53-0-01 1
Drawing No. 21-53-0-012
Geol ogy Mine Area P l o t Plan Ta i l ing Disposal System Lube & T i r e Shop, Plans & Eleva t ions Fueling I s land & Tank Farm, Plans & El eva t ions Mill & Mine F a c i l i t y P l o t Plan Adminis t ra t ion Building General Arrangement Plan & Elevat ions Shop, Warehouse & Change House General Arrangement Plan & Elevat ions
EXHIBIT 11-B - MINE EQUIPMENT HOURLY COST CALCULATIONS
EXHIBIT 11-C - EQUIPMENT JUSTIFICATION
EXHIBIT 11-D - MINING ASSUMPTIONS AND FACTORS
i i i

VOLUME I1 INTRODUCTION
This f ea s ib i l i t y study report i s a compilation and summation of three
years of investigations by Mineral s Exploration Company and the i r con-
sul tants for the purpose of evaluating the economic v iab i l i ty of the
Anderson Project, Yavapai County, Arizona. The study i s reported in
three vol umes :
Volume I - Executive Summary
Volume I1 - Geology and Mining
Volume 111 - Ore Processing
Volumes I and 111 were written joint ly by Minerals Exploration Company
and Morrison-Knudsen Company. The Minerals Exploration Company's Mine
Development Group has undertaken the sole responsibil i ty for Volume I1
of the Anderson Project Final Feasibil i ty Study. This volume encompasses
the geology, ore reserves, mine engineering studies, and a description ' of mining procedures and f a c i l i t i e s . The principal intent of t h i s
volume i s to examine the capital requirements and operating economics
involved in the open p i t mining of the Anderson Project.
The project location i s shown on Figure 5-1, Location Map, Anderson
Project.
The resul ts of a l l the investigations t o date are incorporated into a
Financial Analysis presented in Volume I . The remainder of the report
describes the design basis and operating philosophy used to estimate
the capital and operating costs required to develop t h i s analysis.

MOJAVE COC OMlNO 0 PAGE
fi ANDERSON
WILLIAMS C
0 FLAGSTAFF
U
AJO
0 HOLBWOOK
SCALE IN MILES 0 10 20 50
LOCATION MAP-ARIZ . =- -
v
I I

This report i s considered to be a f inal f ea s ib i l i t y study, accurate to
within plus or minus 15 percent. Additional investigations are recom-
mended in certain areas t o study possible cost reductions. However,
these possible reductions or unforeseen cost additions are not expected
to exceed the s ta ted l imits b f accuracy.
The investigations and studies which generated the data and c r i t e r i a
for th i s volume of the Feasibi l i ty Study are described in the following
reports :
O R E RESERVES
a. Anderson Mine Geology Report, Minerals Exploration Company, August
b. Ore Control Techniques a t the Anderson Mine, Minerals Exploration I' \.
Company, September 1977
c. A Review of Estimated Mineable Uranium Reserves, Anderson Mine
Project, Chapman, Wood & Griswold, September 1977
d. Anderson Mine Bul k Density Study, Minerals Exploration Company,
January 1978
e. Development Report on Equilibrium a t the Anderson Mine Project,
Minerals Exploration Company, April 1978
TECHNICAL STUDIES
a. Slope S tab i l i ty Studies - Proposed Anderson Mine Property - Open
Pi t Uranium Mine, Dames & Moore, April 1977
b. Preliminary Geotechnical Investigation Report - Mil 1 and Tailings
Disposal S i t e , Sergent, Hauskins & Beckwith, August 1977 I

i' c . Prel iminary Feasi bi 1 i t y Study, Morri son-Knudsen, December 1977
d . Design Report - Proposed T a i l i n g s Impoundment, Anderson Uranium
P r o j e c t , Dames & Moore, May 1978
HYDROLOGICAL
a . Progress Report - Explorat ion f o r Water Supply, Anderson Mine,
Arizona, Water Development Corpora t ion , June 1977
b. Anderson Mine Sur face Water, Water Development Corpora t ion , J u l y 1977
c. Groundwater Hydrology of Anderson Mine Area, Arizona, Water
Devel opment Corporat ion, February 1978
d . Legal Evaluat ion of A l t e r n a t i v e Sources o f Water f o r t h e Anderson
1978
Sur face Water Hydrology of Bi l l Wi 11 iams River System, Arizona,
Water Development Corporat ion, March 1978

VOLUME I1 SUMMARY
COSTS
Capital and operating cos t s are based on equipment manufacturer 's quotes
representa t ives ' experience
as of June 1 , 1978, using
t h a t were evaluated a re as
and recommendations and local mining company
under Arizona conditions. The economics a re
the constant do l l a r technique. The reserves
follows:
Tons of Ore Contained Pounds of U308 Average Grade (%)
The capi ta l and operating cos t estimates a r e
MINE CAPITAL COST SUMMARY I
summarized be1 ow:
\ Addi t ion and I n i t i a l Rep1 acement Capital Capital
Preproduction $14,092,643 $ - 0 -
~ o t a i Project Capital
Mine
Maintenance
Administrative 721,418 132,000
TOTALS
MINE OPERATING COST SUMMARY
Annual Cost Period Total Period Cost
Production
Production
TOTALS

9% PRODUCTION
Per i od
Yrs 1-2
Yrs 3-9.84
Preproduct i on *
Production I **
Production I1 ***
Mill Feed Feed Tons/Year -- Grade % Recovery
Total 1bs U3%
OPERATING COST
$/Ton Mil led $ / l b $/I b $/Ton Mined
- - - - - - Q . 361
*Preproduction tonnage i s estimated a t approximatley 39,037,800 tons over an 18-month period including a 3-month pioneering period.
**Based on 730,000 tons/year @ 0.080% U308 and 90.13% recovery f o r the f i r s t two year.
***~ased on 730,000 tonslyear @ 0.0696% U308 and 88.55% recovery for the remainder of operation l i f e .
PROJECT SCHEDULE
The project schedule provides the basis f o r manpower loading and equipment
purchasing schedules. The key dates a re as follows:
Mine F a c i l i t i e s January 1 , 1979 - October 1 , 1979
Pioneering
Preproduction Str ipping
July 1 , 1979 - October 1 , 1979
October 1 , 1979 - January 1 , 1981
Preproduction Mining Apri 1 1 , 1980 - January 1 , 1981
Mi 11 Start-up* January 1 , 1981
*Stripping and mining a re c l a s s i f i e d as Production I and I1 from t h a t 1
date t o completion of the projec t .

SECTION 5
GEOLOGY, O R E RESERVES AND HYDROLOGY
This section addresses the geology of the project area and i t s relation-
ship to the ore reserves. The ore reserve estimate i s based upon an
economic cutoff grade and i s further influenced by:
a . backslope as determined by the Geotechnical Study
b. bulk densit ies for the different l i thologic units and
varying water content
c. grade refinement u t i l i z ing individual disequilibrium
factors.
The final portion of t h i s section discusses the hydrological aspects
including surface and groundwater and pump t e s t s leading to recomrnenda- i t ions as t o the source of mill water.
5.1 GEOLOGY
In l a t e 1977, Minerals' personnel completed a report defining the
geological aspects of the project area. The resultant geological
definit ion was based upon review of 513 d r i l l holes, of which 72
were cored through the ore zone. Surface reconnaissance and d r i l l
hole correlation resulted in a detailed understanding of s t ructures ,
l i thologies and other geologic features.
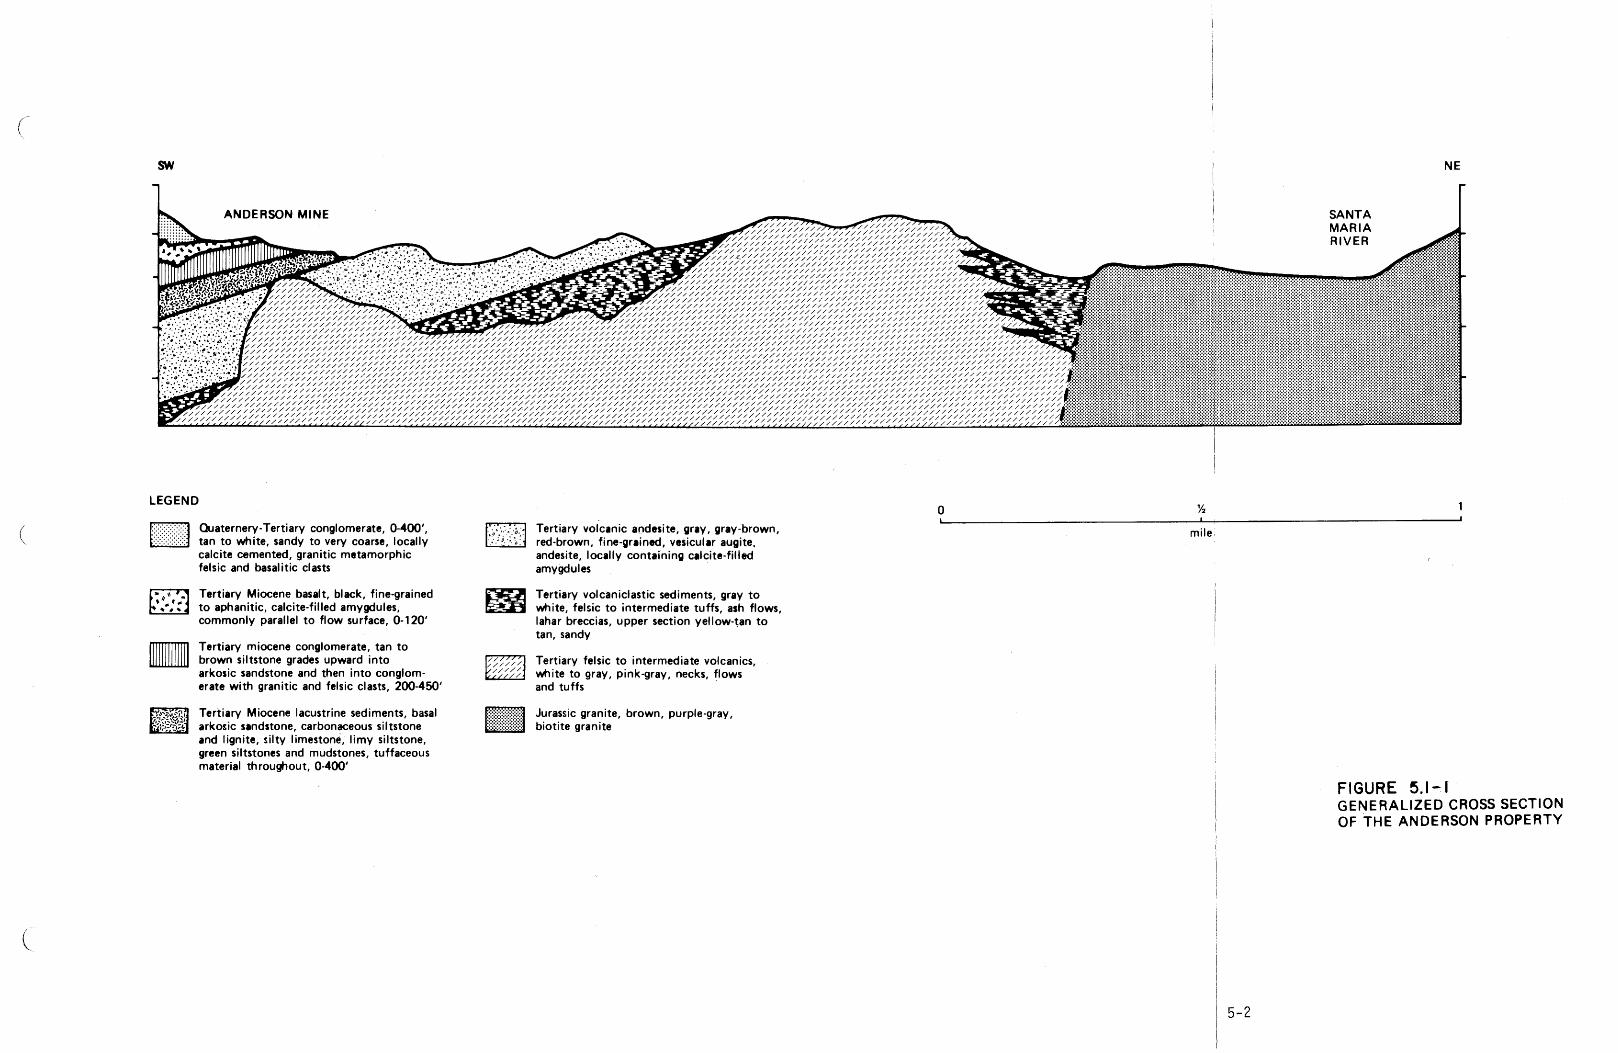
The mineralization i s primarily associated with the carbonaceous
s i l t s tones and l i g n i t i c materials associated with the lacustrine
sequence in the area. The beds overlie andesit ic volcanics and
a' are overlain by conglomerates and basal t i c flows as shown in
'i,
Figure 5.1-1, Generalized Cross Section of the Anderson Property.

i 5.7.1 Regional Geology
The Anderson Mine Property i s located along the northeast margin of
the Date Creek Basin in west-central Arizona. The basin i s
bordered by the Black Mountains on the n o r t h and northeast, by the
Rawhide, Buckskin, and McCracken Mountains on the west. To the
south and southeast i t i s bordered by a low drainage divide governed
in part by the Harcuvar Mountains andlor the Black Mountains. The
basin has a gently sloping topography to the west and northwest.
Surface Flow across the basin i s accomplished by three drainages:
the Santa Marja River, Date Creek, and Bullard Wash. The south-
flowing Big Sandy River joins the Santa Maria River in the north-
west portion of the basin just west of the confluence of Date Creek
and the Santa Maria River. This combined drainage flows southward
i n t o A1 amo River Reservoir, becoming the B i l 1 Wi 11 i ams River.
The area has been on the margin of several regional deformations.
I t was on the northwestern margin of Mazatzal Land, the south-
eastern margi n of the Cordi 1 l ar i an Geosyncl i ne , deformed by the
Laramide Drogeny, and i s presently on the margin of the Basin and
Range Physiographi c Province.
The area around Anderson Mine exhi b i t s structures typical of the
Basin and Range and i t i s the Basin and Range deformation which i s
evident in the area today. The structural trends of this deforma-
tion are a dominant northwest-southwest trend of parallel t o sub-
parallel hinged block faul ts and a less dominant west-northwest-

east-southeast f a u l t system. Many of these f a d t s exhibit recurrent
movements.
The regional stratigraphy may be 'briefly summarized by: 1) a
Precambrian or Jurassic grani t i c basement complex; 2) the lacus-
t r i an, cl as t i c and vol cani c members of the Pal eocene-Eocene Arti 11 ery
Peak Formation; 3) the Arrastra Volcanic Complex, including daci t i c
i n trus i ons , andes i t i c f 1 ows and vol cani cl as t i c members of early t o
mid-Tertiary age; 4) the Chapin Wash Formation - Anderson Mine
Lacustrian sediments of miocene age; 5) a conglomeri tic-sandstone
u n i t possibly equivalent t o upper Chapin Wash; 6 ) a Miocene basalt;
7) a Pl io-Pl ei stocene Conglomerate; and 8) Quaternary A1 1 uvium.
These are identified on Drawing No. MEC-000, Geology Map, in /
i, Exhibit I I-A.
5.1.2 Geology of Mine Area
All the drainage on the Anderson Mine Property i s to the north and
northwest into the Santa Maria River. The headward erosion of
these tributaries southward into the Date Creek Basin surface has
resulted in a series of subparallel gullies and ridges trending
north to northwest. Maximum topographic rel ief a t Anderson Mine i s
700 fee t .
Faulting in the area trends northwest-southeast and many of the
t r ibutar ies are devel oped part ial ly a1 ong faul t traces. The
southerly d i p and resistance to erosion of the stratigraphic section
i have tended t o inhibit the headward migration of the t r ibutar ies .

Three major faul t s , the East Boundary Fault System, Fault 1878, and
the West Boundary Fault System are present in the area. In addi-
tion to these are many parallel faul ts which have less displacement
than the major faul ts . A1 1 of these faul ts trend between ~ 3 0 ' ~ and
~ 5 5 ~ ~ . Another se t of f aul t s trending more westerly ( ~ 6 5 ~ ~ ) are
present a t least in the south-central portion of the property. A
s e t trending northeast has been conjectured by Urangesellschaft and
others, b u t has not been observed in the f ield.
Within the boundaries of the Anderson Mine claims, nine ( 9 ) in-
formal s tratigraphi c u n i t s have been recogni zed by Mineral s Expl o-
ration Company. From oldest t o youngest, these are: 1 ) Crystal 1 ine
Intrusive Rocks; 2 ) Felsic to Intermediate Intrusions and Flows;
3) Felsic t o Intermediate Volcaniclastic Sediments; 4) Andesitic
Volcanic ; 5) Lacustrian Sediments; 6 ) Lower Conglomerate; 7 )
Basal t i c Volcanic Flows and Dikes; 8) Upper Conglomerate; and 9)
As the Lacustrian Sediments are the only mineralized u n i t on the
property, only they are described in detai l . The lacustrian sedi-
ments unconformably overlie the andesitic volcanics over most of
the Anderson Mine Property. However, to the east-central they
overlie the volcaniclastic sediments and further to the east they
onlap the fe l s i c to intermediate volcanics. Several d r i l l holes in
the center of the mine area have encountered the f e l s i c to inter-
mediate vol cani cs or the tuffaceous part of the vol cani cl as t i c
sediments immediately below the lacustrine sediments.

Evidence now suggests that deposition of the lacustrine sediments
occurred i n a restricted basin. Therefore, these sediments repre-
sent time-transgressi ve faci es deposi ted w i t h i n a narrow, probably
shall ow, basinal feature, Thi s type of depositional environment
exhibits complex re1 ationshi ps between individual facies; lensing
out, vertical and horizontal gradation, interfingeri ng , e tc .
The 1 ake sediments i ncl ude green s i 1 t s tones and mudstones, whi t e
cal careous s i l t s tones, and s i 1 t y 1 imes tone or cal careous tuff aceous
material. Much of this material i s s i l i c i f i ed t o varying extents
and was derived i n part from volcanic ashes and tuffs common
throughout the lake beds. Also present in the lacustrine sequence
are zones of carbonaceous s i 1 t s tone and l igni t i c materi a1 . A1 ong
the southern boundary w i t h Urangesell schaft, dri 11 holes encounter
the basal arkosic sandstone. To the south and southwest the
"typical" 1 ake beds interfinger with and eventual 'ly are rep1 aced by
a thick, medium t o coarse-grained, arkosic sandstone unit.
In addition to the organic material i n the carbonaceous zones,
abundant plant remains (including twigs, reeds, and small roots)
are present in the lacustrine sediments. Reyner, e t a1 (1956),
recognized abundant s i 1 i ci f ied palm- type wood. Fresh water moll us ks ,
up t o 1-1/2 inches in length, are locally common. T h i n laminated
cal careous s i l t s tone near the top of the 1 ake beds contain small
freshwater f ish foss i l s . A jaw of a rhinoceros reportedly found a t
Anderson Mine i s on display a t the Wickenburg Museum. The leg i,

bone of a duck found in the unit has been dated as Miocene by the
Los Angeles County Museum. William Breed (1977) of the Museum of
Northern Arizona, and his associates, co1 lected fossi Is a t Anderson
Mine in April of 1977. Included in their finds were freshwater
f ish (Eocene to Recent), a camel bone, and a rhinoceros tooth
(Miocene) .
All of the lake beds facies may exhibit some uranium mineralization.
However, the highest grade and most consistent mineralization i s
located in the carbonaceous si 1 tstones and 1 igni ti c materials.
Occasional mineralization has also been noted in the basal sand-
s tone of the 1 acus t r i ne sediments and i n the lower congl omerate.
Carbonaceous material i s known to interfinger with the basal sand-
stone, and carbon has been noted i n the Tower conglomerate. Re-
mobi 1 i zati on of the uranium has resulted in the deposition of
mineral as fracture f i 1 l ings around and below the main mineral ized
zones.
The mineral i zation i s syngeneti c as evidenced by the continuation
and offset of mineralization across faul ts . Carbon tends t o
immediately f i x uranium when soluble uranium comes i n contact w i t h
i t . Much of the mineralization i s a t the top o r bottom of the
carbonaceous facies; however, mineralization does occur in the
middle of some carbonaceous zones. This la ter relationship imp1 ies
that mineral ization occurred d u r i n g the deposi tion of the carbona-
i ceous materi a1 .

( S i l i c i f i c a t i o n o f va r ious p a r t s o f t h e Anderson Lake sediments
probably occurred soon a f t e r depos i t ion . D e v i t r i f i c a t i o n o f t h e
tu f faceous and ashy l a k e bed sediments and/or t h e f e l s i c vo l can i cs
were probably t h e p r imary sources o f s i 1 i c a . Th i s s i 1 i c i f i c a t i o n
would tend t o l o c k t h e uranium m i n e r a l i z a t i o n and p r o t e c t i t f rom
r e m o b i l i z a t i o n .
The f o l l o w i n g o r i g i n s have been suggested f o r t he uranium m i n e r a l i -
z a t i o n a t Anderson Mine.
a. Leaching of vo l can i c t u f f s
b. So lu t i on , m o b i l i z a t i o n and d e p o s i t i o n f rom
g r a n i t e s i n t h e area
c. Combination o f 1 and 2
d. Hypogene
e. Ho t sp r ings
Whatever t h e o r i g i n , i t was t he reduc ing environment o f t h e l a k e o r
swamp t h a t p rov ided t h e s t r u c t u r a l and s t r a t i g r a p h i c t r a p necessary
f o r t h e r e t e n t i o n o f t h e uranium.

5.2 O R E RESERVES
Anderson Mine reserves are based on radiometric and chemical data
taken from a total of 513 d r i l l holes of which 72 holes were cored
through the ore zone and sampled for chemical analysis. Radio-
metric data was submitted t o Digi tgraph Computer Systems for in-
terpretation and ore reserve evaluation. Ore reserves were es t i -
mated through perpendi cul ar bisector areas of inf 1 uence (polygons)
constructed for each dri 11 hole. Holes were evaluated on vertical
2-foot s l ices through the mineralized zone, and adjusted to the
closest even foot,
A cutoff grade of 0.04% U308 (based on estimated costs and re-
coveries) was used to determine the economic p i t 1 imi t s for design
purposes. Subsequent to defining the p i t l imits, a marginal cutoff
grade of 0.028% U308 was used to define the reserves existing within
the p i t 1 irni t s . A1 1 material less than 0.028% UU38 within the
mining zone i s classified as internal waste.
A1 1 tonnages expressed are dry weights. All ore grades have been
adjusted to ref lect the correct equilibrium factor for each area
of i nf 1 uence.
Based on the above restraints and procedures, a final ore reserve
estimate for the Anderson Mine was received from D i g i tgraph Com-
puter Systems. The reserves are l is ted in Table 5.2-1.

The mine w i 11 provide t h e mil 1 with an average feed grade of
approximately 0.08% U3O8 f o r t h e f i r s t two yea r s a t an approximate
average grade of 0.07% U308 f o r t h e remaining yea r s . The reserves
a r e s u f f i c i e n t t o maintain a mi l l throughput of 730,000 tons per
y e a r f o r 9.84 yea r s .


5.2.1 GEOTECHNICAL STUDY
Dames & Moore submitted a slope stabi 1 i ty report t o MEC in Apri 1 ,
1977. This report makes recommendations which have been used in
the p i t design.
A f ie ld investigation program was undertaken t o evaluate the geo-
technical problems posed by open p i t mining in the formations a t
the Anderson property. Two core holes were dri l led along the
southern boundary of the proposed open p i t from the surface t o a
point below the p i t floor. The recovered core was logged and
point load tests were run on 2-foot intervals to estimate corn-
pressive strength. Log information included rock qua1 i ty designa-
t ion, fractures per foot and core condition. i
A 1 aboratory testing program was performed on representative core
samples to determine the engineering properties which influence
slope stabi 1 i ty. Uniaxial compressive strength tes ts were per-
formed to ensure proper correlation with point load t e s t results.
Moisture and density determinations were made on selected core
samples used for direct shear testing.
Material properties for slope design, stich as bulk density, f r ict ion
angle and cohesion, were based on the above field and laboratory
testing, and on the results of previous slope designs and block
analyses of slope failures performed by Dames & Moore in comparable
materials. Results of the testing program are as follows:

Materi a1 Bulk Densit Friction An l e Cohesion 'd (lbs/sq ft)
Capping Conglomerate 1 40 40 4,080
We1 1 Cemented Sands tone 130 32 4,080 Congl omerate
Poorly Cemented Sandstone 130 32 2,808 Congl omerate
Lacus t r i ne Sediments 130 28 3,000
Limited surface mapping of the orientation of the various 1 i tho-
logic units was supplemented by the study of existing geolpgic
maps and sections. The orientation of major faul ts and other
potential fa i lure planes with respect to the major p i t slopes was
examined to determine the potential of fa i lure planes exposed
(, d u r i n g the m i n i ng operati on.
Faults in the mine area generally s t r ike North 35O-50° West and
dip steeply, general ly to the southwest. The p i t walls are so
oriented that slope fai lure will not resul t from the known faul t s .
Adequate control of water from a l l sources i s important for slope
s tabi 1 i ty . Control and diversion of surface runoff during rain-
storms will be accomplished with dams and ditches. The information
available on groundwater within the p i t indicates that an average
of 200 gpm will inflow from the lower conglomerate u n i t and from
the barren sand u n i t . Pump tes ts wi 11 be conducted to determine
ways t o obtain a fully drained slope. All slopes require a ful ly
drai ned condi t i on. i

Results of the slope design analyses indicate t h a t for a slope
800 fee t high, a stable design would be a 4O0 slope th rough the
lacustrine sediments and the lower half of the ter t iary sandstone
conglomerate unit , and a t 50° over i t s remaining height. A 100-
foot-wide bench will separate the two portions of the slope. T h a t
100-foot bench increases the s t ab i l i ty o f the slope and acts as
a useful catch bench. Slopes of less than 400 fee t are designed
a t higher angles. The present mine design requires only a short
time of highwall exposure before backfilling begins. Slopes are
designed with factors of safety of 1.1 to 1.2.
The design recommendations for the main southern slope should be
valid for any significant side slopes encountered during mining. (\
Footwall fai lure i s not anticipated because of the low angle of
bedding. Slope design conclusions are based on the assumption
t h a t the ultimate p i t slope wi 11 not have major horizontal curva-
ture. As mining progresses, the actual observation of the mine
slopes wi 11 provide important additional information through
backslope analyses procedures.
Safe operating slopes a t varying heights, obtained from interpol ation
between the recommended design sl opes, are represented below:
Slope Mei gh t ( f t) Operatingslope Angle
100 0.36:l 700 200 0.36:l 70° 3 00 0.68:l 56O 400 0.84:l . 50° 500 0.94:1 470
i 600 I . O O : I 450 700 1.04:1 44O 800 1 .06:1 430
5-1 4

f ',
5.2.2 B U L K DENSITY
B u l k densi t y val ues for primary stripping , secondary stripping ,
inter ior waste, and ore were determined from core specimens.
Samples of primary stripping material were taken from the geo-
technical holes which were dri l led for slope stabi 1 i t y deter-
minations. Secondary stripping, inter ior waste and ore samples
were taken during a l a t e r core dri l l ing program. ~xtreme care
was taken to preclude the possibility of error during the l a t t e r
testing program t o insure that material used for testing accurately
represented the inpl ace material s . Actual val ues represent
averages of a total sample population number i n excess o f 250.
Tabulated below are the b u l k density values used i n this feasi- \
b i l i ty study. The dry densities represent the ore reserves
calculations and the wet densities were used for equipment selec-
tion and operating costs.
Primary S t r i p p i n g
Secondary Stripping
Cubi c Feet/Tsn
E X Wet
Interior Waste 17.0 15.45 **
Ore

5.2.3 EQUILIBRIUM
Minerals has dril led a total of 72 core holes on the Anderson
Property. These core holes represent 14 percent of a l l explora-
tion d r i l l holes and are located on a 400-foot g r i d . Approximately
3,125 assays were run on core and cuttings by colorimetric and
f l uorimetric techniques.
The f i r s t 14 hol es were assayed by Chemi cal -Geol ogi cal Laboratory
of Casper, Wyoming, using the colorimetric assay. The next 19
holes were fluorimetrical ly assayed by Hazen Research of Golden,
Colorado. The remaining 39 holes were assayed by Skyline Labora-
tory of Tucson using the fluorimetric technique. All assays were
checked by either reassaying selected samples or pulps of the
original samples. Values may be considered accurate t o + 5 percent.
An equilibrium factor was calculated as a rat io between chemical
uranium and the gamma log. This rat io was determined from a
hole-by-hole total of values and by constructing a polygon map
and calculating pounds U308 for both chemical and gamma log. No
values were incl uded for either method unless both chemical and
log data was avai lab1 e for the given interval. The average
equilibrium factor for the entire property, with pounds U3Q8
weighted equally, i s 0.999. The average factor w i t h i n the open
p i t i s 1.05.

The equilibrium factor wi 11 vary depending on the proximity t o the
nearest faul t. Core hol es near faul t s are depl eted in urani urn
while holes isolated from faul ts are in equilibrium or enriched.
Because of this effect, each hole on the property has been assigned
a different equilibrium factor. These values were interpolated on
Figure 5.2.3-1.
Equilibrium varies with grade. Very h i g h grades (> .090% U308)
are 6 percent higher i n equilibrium than average, while low grades
(< 0.01 5% U308) are 1 percent lower than average. This grade
relationship was determined from the f i r s t 33 core holes using
chemical versus cl osed-can radi ometri cs . No cl osed-can assays
were run on the remaining 39 holes.

HYDROLOGY
Information regarding water a t Anderson Mine has been provided by
Water Development Corporation (WDC) studies, and by Dames &
Moore studies on slope s tabi l i ty and the tail ings impoundment
design.
Groundwater
The Bill Williams River Basin i s contained within the Central
Highlands and the Basin and Range Provinces, two major physio-
graphic regions in Arizona. In the Basin' and Range Province,
groundwater generally occurs i n unconfined or "water table" aquifers
formed i n a1 1 uvi a1 vall eys between mountain blocks. The a1 1 uvium,
which may be several thousand fee t thick, consists of interbedded
cl ays , s i 1 t s , sands, and gravel s . Recharge i s small and occurs
mainly along mountain fronts and the normally dry stream courses.
In the Central Highlands province, small vall eys between vol cani c
mountain blocks f i l l ed with unconsolidated sediments are the main
source of groundwater.
The alluvial valley of the Santa Maria River varies substantially
in width and depth to bedrock. The volume of alluvium, and parti-
cularly the depth of the material, influences the proportion of
surface flow to underflow in the river valley. The groundwater in
the alluvium consists of underflow that i s forced toward the sur-
face as the depth of the alluvium decreases.

i Within the immediate vicinity of the Anderson Property, the lower
sandstone conglomerate u n i t i s the only producing groundwater zone.
A pump t e s t in this zone yielded an average flow rate of 57 gpm.
The in i t i a l and final water depths in this t e s t were 56.2 and 78.6
f e e t , respectively, yielding a total drawdown of 22.4 fee t and a
specific capacity of 2.5 gpm/ft of drawdown. This low yield did
not warrant calculation of formation constants,
Another possible water producing zone, the Barren Sand Unit,
pinches out south of the Anderson property. From well pump t e s t
data obtained from Urangesellschaft, i t appears t h i s unit i s con-
fined with an artesian head in the range of 500 fee t and has a
specific capacity of approximately 1.4 gpm/ft of drawdown.
Considerable faul t i ng and fracturing in the vicini ty of the Ander-
son property has resulted i n sufficient movement of water between
units so that i t i s n o t appropriate to t r ea t the units as indepen-
dent. The water elevations for wells in the Barren Sand unit
generally decrease t o the west and north toward the Santa Maria
River. This movement i s in opposition t o the general dip of the
sediments to the south and the east.
Groundwater el evations i n we1 l s penetrating the 1 ower conglomerate
decrease to the west-southwest. A west-southwest decline in water
table elevations in this unit i s further substantiated by Grapevine
Springs , whi ch begins a t approximately 1400 fee t in elevation.

There appears to be a general west-southwesterly movement of
groundwater in the lower conglomerate u n i t that i s strongly i n -
f l uenced locally by the northwesterly-trending faul ts in the area.
The effects of these faul t s are indicated by local northwesterly-
trending anomalies i n water table elevations. Presumably such
anomalies are associated w i t h groundwater movements along the
faul t s .
The recharge potenti a1 , both d u r i n g active operation and af ter
project termination, i n the vicinity of the mill and tai l ing
di sposal areas i s cons i dered negl i gi bl e. Laboratory tes ts on cores
from the andesi t e f 1 ow under1 ayi ng the ore zone indicate vertical
and horizontal permeabilities to be one foot per year. The water-
bearing lower sandstone conglomerate overlaying the ore none has a
vertical and horizontal permeabi 1 i ty of forty and eighty fee t per
year, respectively. Water movement in this l a t t e r zone i s toward
the north and w i 11 flow i n to the p i t area. The average inflow
i n t o the p i t has been estimated by WDC to be 200 gpm although the
amount wi 11 fluctuate as new areas are exposed.
The major potenti a1 uses of groundwater i n the vi ci ni ty of the
Anderson property are wildlife and livestock watering and domestic
consumption. Groundwater in the area i s of fa i r ly good qua1 i t y for
these uses.

(\
5.3.2 Surface Water
The Bill Williams River Basin covers approximately 5140 square
miles. The Anderson property i s drained by tr ibutar ies to the
Santa Maria River. The Santa Maria watershed covers approximately
1520 square miles and constitutes about 30 percent of the Bill
Williams River Basin. Unit runoff for streams i n th is province
ranges from 1 t o about 10 inches. The res t of the Bill Williams
River Basin i s '1 ocated w i t h i n the Basin and Range Province.
Surface runoff in the low mountains and alluvial valleys o f this
province ranges from less than 0.1 inch to 0.5 inch.
Precipitation within the Bill Mi 11 iams River Basin i s strongly
influenced by elevation and ranges from u p to 20 inches per year i n
the higher mountains to the north and east to less than 10 inches
per year in the desert regions to the south. Throughout the basin,
precipitation normally occurs in the l a t e summer and early f a l l in
conjunction w i t h thunderstorm act ivi ty and d u r i n g the winter in the
f o r m of snow a t high elevations.
Evaporation rates i n the basin are influenced by elevation. The
average annual lake evaporation rate i s approximately 50 inches a t
regions.
The large rivers in the bas
Mi 11 i ams River , are 1 ocated
higher elevations, while i t reaches 80 inches in the hotter desert
i n , the Santa Maria, Big Sandy and Bill
in the hot, dry southern portion of the
basin. All of the rivers are intermittent. Smaller washes i n the
southern portion of the basin such as Date Creek, Bullard Wash,
Centenial Wash, and Castenada Wash are dry during most of the year.
The maximum monthly discharge for the streams in the basin normally
occurs i n February or March. This discharge i s i n response to
increased runoff resulting from snowmel t. The other major period
of flow in these streams occurs i n the l a t e summer and early fa1 l
in response to precipitation and runoff from thunderstorms.
Infi 1 tration plays an important role i n the surface hydrology of
the basin. Long reaches of the Santa Maria, Big Sandy and B i 11
Williams Rivers, and of the principal washes i n the basin, are
composed of coarse alluvium. The high permeability of this material,
coupled with groundwater l eve1 s we1 1 below the depth o f the stream
channel , can drasti cal ly reduce surface flows. Substanti al ground-
water flow, i n the form of underflow, occurs in these channel s
where the a1 luvium i s underlain by impervious material such as
bedrock. Consequently, surface flow in the major streams o f the
basin may be highly influenced by surface-subsurface water exchange
that i s regulated by the nature of the underlying sediments and the
degree of saturation of these sediments.
Surface flow seldom occurs in the drainages on the Anderson property
except for flash flooding. The dry soil of the washes and canyons
tends to seal when wet, inhibiting inf i l t ra t ion and resulting in
relatively h i g h runoff. This runoff i s normally quite erosive,
particularly in the steeper, narrower canyons.

Surface flow i n the vicinity of the Anderson Project normally
occurs for only short periods during and immediately af ter pre-
cipi tation. A single brief period of runoff was recorded on the
property during the study period; however, personnel were not
present t o obtain water samples. Consequently, surface water
quality data are n o t available for the property.
5.3.3 Pump Testing
The required mine water supply of 1000 gpm for 10 years can be
developed from two sources. One of these i s the recent alluvium
along the Santa Maria River a t Palmeri ta Ranch. The other i s the
sandstone and conglomerate uni t i n the southwest ha1 f of Secti an
16 , TllN, RlOW. There are f ive ( 5 ) irrigation wells a t Palrnerita
Ranch. One of these could supply the required 1000 gpm, and a
second could be used for standby reserve. Wells in the southwest
half of Section 16 need to be dri l led t o a depth of about 1500 fee t
and would be capable of yielding 350 gpm each. Four wells would be
needed, three for active use and one for standby.
Test Well AM-507 i s located i n Section 16. Basalt was encountered
a t a depth of 285-365 fee t , and the underlying sandstone and con-
glomerate unit extends from 365 fee t t o bedrock a t a depth of 1495
feet . The materials were examined, and with the exception of a
white s i l ts tone from 410 t o 485 fee t and a s i l t y clay from 1150 t o
1200 fee t , appeared t o be relatively unconsolidated with a f a i r
degree of porosity. The hole encountered water a t a depth of 485
fee t , giving a saturated thickness of 1010 feet . Based on the data
5-24

from AM-507, a decision was made to dri 11 and t e s t a larger dia-
meter we1 l , AM-516, located 101 feet south of AM-507. The hole was
rotary dri 1 led 20-inch diameter to bedrock a t a depth of 1490 fee t ,
and 14-inch preperforated casing was installed t o 1460 fee t .
Perforations were 11%-inch by 3-inch sawcut s lots extending from a
depth of 550 fee t to 1460 fee t below land surface. Total number of
perforations amounted to 44 per foot, giving an open area of 16.50
square inches per linear foot of casing. Following installation of
casing, the well was packed w i t h 1/8-inch t o 3/8-inch siliceous
gravel and then washed and jetted w i t h the rotary r ig .
A turbine t e s t pump, powered by a diesel engine, was installed i n
the we1 1 , and the we1 1 was further developed by surging and back-
washing. Maximum discharge d u r i n g the pump development work was
539 gpm. Near the end of development, discharges were i n the range
o f 500 to 520 gpm wi t h a gumpi ng water level in excess of 780 feet .
A t the 153 gpm rate , the transmissibility is i n the range of 1600
gpd per foot of aquifer width; and a t the 301 gprn ra te , the value
i s 1000 gpd per foot of aquifer width. Insufficient time was
available for stabilization a t the 350 gprn rate. However, the
transmissibility value for this rate would be something less than
1000 gpd per foot of aquifer width.
We1 1s a t the Palmeri ta Ranch, which are planned as an a1 ternate
source of m i 11 water, are developed i n the a1 1 uvium. One of these
wells yielded 2198 gpm with 17.49 fee t of drawdown in 24 hours.

There are f ive ( 5 ) large diameter wells a t the Palmeri ta Ranch
which could be used for mill water supply.
Production of 1000 gprn for 10 years from the alluvial f i l l a t
Palmerita Ranch would not affect surface flows i n the Santa Maria
River, and therefore would not affect natural inflow to the re-
creation pool of water stored i n the reservoir behind A1 amo Dam.
Production of 1000 gpm for 10 years from a well f ie ld that would
produce from the Sandstone and conglomerate u n i t i n Section 16,
could reduce flow a t Grapevine Springs, b u t would not affect water
levels in any other springs, nor i n wells within or beyond 11 miles
of the center of pumping.
Observations during dri l l ing indicates that faul ts within the p i t
area may carry sufficient water to require p i t dewatering. A we1 1
f ield has been constructed consisting of 6 wells and 12 observation
holes, b u t pump testing has not yet been carried out. Results from
this pumping will indicate how much water will be expected i n the
p i t , a1 though the average inflow i s not likely to exceed 200 gprn.
A possibility exists , however, that fa i r ly brief inflows, larger
than the average, might occur due to the dense fracture and faul t-
ing system in the mine area.
While m i n i n g i s in progress, seepage from the tai l ing impoundment
will be negligible and, i f any flow does exis t , i t will be captured
i n the pi t sump.

SECTION 6
MINING
Th i s s e c t i o n descr ibes t h e mine l o c a t i o n , m in ing procedures, p l ans and
cos ts . The general mine l a y o u t and sequence a re shown i n Drawing No.
MEC-001 o f E x h i b i t 1 1 4 . The t a i l i n g dam, l oca ted i n t h e mine area,
i s shown i n Drawing No. MEC-002.
6.1 OVERBURDEN REMOVAL
The general development theory behind t h e overburden removal ca lcu-
l a t i o n s i s t o , f i r s t , expose t h e i n i t i a l t a i l i n g s impoundment area,
and secondly, t o open up areas which c a r r y a s l i g h t l y h i ghe r grade
than t h e o re body as a whole t o maximize t h e cash f l ow . In no
" i ns tance was t h e min ing a l lowed t o ca t ch up w i t h t h e s t r i p p i n g t o
a l l o w f o r adequate work ing room t o ensure proper o r e grade c o n t r o l .
Table 6 . 1 4 , S t r i p p i n g and Min ing Balance, d e t a i l s t h e f l o w o f
waste and o re i n r e l a t i o n t o m i l l i n g requirements.
Pr imary s t r i p p i n g tonnages have been est imated a t f i v e percen t
water by weight and min ing wastes a t t en percen t water con ten t
f o r t h e d e r i v a t i o n of r equ i red equipment and r e s u l t i n g ope ra t i ng
cos ts . '

6.1.1 Preproduction Stripping
Ore a t the Anderson Mine i s overlain by an average of 400 plus
fee t of overburden. Removal of t h i s material will begin 15
months prior to mill s tar tup. This preproduction period will
allow suff ic ient time to s t r i p , mine and construct a t a i l ings
dam in an area of shallow overburden thickness located in the
north-center of the ore body. Excavated material will be used
for f i l l in the mill area, t a i l ings dam construction, or placed
i n surface waste dumps.
Prior to removal, overburden material will be blasted to f a c i l i -
t a t e loading. Two rotary d r i l l s will be used to d r i l l 10-inch
diameter holes which will be charged by a p r i l l truck with an
i explosive mixture of ammonium n i t r a t e and fuel oi I . Betonati on
of the charged holes will then provide the desired fragmentation.
Removal of overburden material will be accomplished using two
17-cu yd e l ec t r i c shovels loading into 120-ton capacity haulage
trucks. Eleven 120-ton capacity haulage trucks will be needed
to meet production requirements during preproduction.
Pioneer ramp construction will be handled by two track-type
dozers and an ai r - t rack d r i l l . Roads will be maintained by a
waterwagon and a motor grader. Surface dumps will be maintained
by a track-type dozer.
6 .1 .2 Production Stripping
Overburden removal during the production phase of mine l i f e will
require the addition of a few pieces of equipment to the exist ing
6 -3

mine f l e e t . One additional 120-ton capacity haulage truck will
be needed in the f i r s t year t o meet s t a t i c production demands
coupled with increasing truck cycle times and an additional truck
will be required in the sixth year.
Working p i t slopes will be maintained a t 2 1 . Final p i t slopes
wi 11 be excavated to the steeper slopes recommended in the Dames &
Moore Slope S tab i l i ty Report. Waste material will be placed in
surface waste dumps, used for t a i l ings dam construction, or used
to backfill abandoned p i t sequences.
Overburden removal ac t iv i t i e s will terminate s ix months prior
to the end of mill production.

6.2 O R E AND WASTE MATERIALS HANDLING
Upon completion of the high volume stripping requirements, the
ore zone material will be mined a t a much slower ra te to allow for
precise dif ferent ia t ion between ore and waste. Approximately
14,000 t p d , 250 dpy, of mining i s scheduled based on an average
waste to ore ra t io of 3.6:l and a 2,000 t p d , 365 dpy, milling
feed ra te . A c t u a h a t e s may vary with differences in mining
character is t ics such as ore thickness and hardness and also a s
the waste to ore r a t i o varies between sequences.
6.2.1 Secondary Stripping
For purposes of evaluation, secondary stripping material i s con-
sidered to be any waste, 10 fee t or greater in thickness, which
i s encountered in the ore zone. Material c lass i f ied as secondary
stripping will be loaded using a 5-cu yd front shovel loading
into 35-ton capacity haulage trucks. Close survey control will
allow maximum removal of such waste material during mining.
6.2.2 Inter ior Waste Removal
Inter ior waste i s considered to be ore zone waste material which
i s less than 10 f ee t thick. Inter ior waste will be removed by
a combination of a 3-cu yd capacity hydraulic backhoe or a
5-cu yd front shovel loading into 35-ton capacity haulage
trucks. Removal of t h i s material will be closely coordinated
with survey control and probe men. Ore zone material will go
through the probe tower i f there i s any doubt as to i t c l a s s i f i -
cation. Upon completion of the ta i l ings impoundment, both the

f / secondary stripping and in te r ior waste wi 11 be backfi 1 led into
mined out p i t sequences.
6.2.3 Ore Mining
Based on current economics for the Anderson Mine, ore i s identi-
f ied as uranium bearing material having a grade of , or greater
than, 0.028 percent U308. This material will be select ively
removed, probed and hauled to stockpiles a t the mill s i t e . A
3-cu yd capacity hydraulic backhoe will load the ore into
35-ton capacity haulage trucks. In certain instances where
thick lenses of ore occur, the front shovel may be used to acceler-
a t e ore mining production. Occasional hard lenses of limestone
and s i l i c i f i e d material are expected to occur in the ore zone.
/ \
These materials will be ripped by a large track type dozer prior
to loading. Most of the mining i s anticipated to be direct ly
excavated by the backhoe without previously being ripped. Roads
and working areas in the mining area will be maintained by a motor
grader and a waterwagon which will be shared with the str ipping
operations.
Ore mining will commence 9 months prior t o mill s tar tup and
i s scheduled for 10.5 years. Ore will be stockpiled a t the mill
s i t e to provide the necessary f l ex ib i l i t y in mill feed grade
control .

6.3 O R E GRADE CONTROL
Given the normal e r r a t i c nature of uranium deposits and coupled
with the extensive fault ing and varying equilibrium factors found
a t the Anderson Mine, a precise system of ore control i s required
to maintain the desired mill feed grade.
Prior to excavation of the final str ipping bench, each p i t sequence
will be dr i l l ed out on a minimum of !&foot centers. The holes
will be probed and the information used for controlling the bottom
of str ipping above the f i r s t ore intercept and in locating the
deeper intercepts t ha t mining will progress through. During actual
mining operations, survey crews and probe men, equipped with
Geiger-Mueller tube-type detectors, will locate ore-waste boundaries
and give the loader operators guidance in making ore-waste deter-
minations. Two probe men will be assigned to the tractor-ripper
whenever i t i s working in or near an ore area.
Subsequent t o loading the ore and subgrade material into haulage
trucks, a determination of ore grade for each truckload will be
made a t a centrally located probe tower. This f a c i l i t y will be
equipped with a high resolution gamma ray spectrometer with two
movable probes which will penetrate the load, providing an accurate
radiometric assay of each load. After grade determination the
truck will be assigned to a stockpile area or sent to a waste area.
As a cross-check to the probes accuracy, selected samples will be
assayed daily in the mill lab to provide any correction factors
tha t might be required.
/
(, 6.4 STOCKPILING PROCEDURE
After the ore trucks pass through the probe tower and the individual
loads are assayed, the units will be radio dispatched to one of
three stockpile areas. Each area will be of a dif ferent average
grade to provide the means for controlling mill feed grade. One
area will be maintained a t average mill grade with a smaller
area of the high grade ore t o be blended with the low grade
area. The grade dis t r ibut ion, in respect t o the to ta l ore
production, a t any given time should be approximately 40 to 50
percent low grade, 30 t o 40 percent mill run and 10 to 15 percent
high grade. The grade dis t r ibut ion of the to ta l ore body i s shown
on Table 6.4-1.
(, Preproduction mining wi 11 create a tota l stockpi l e inventory of
approximately 550,000 tons of ore grade material. This stockpile
will be maintained a t roughly the same s ize unti l the l a s t years
of production a t which time i t s s ize gradually diminishes t o zero
a t project ' s end.
During mill operation, ore will be withdrawn from a l l three stock-
p i le areas and blended to produce the required feed grade.

TABLE 6.4-1
ANDERSON MINE ORE RESERVE
GRADE DISTRIBUTION
% % To ta l T o h 1 Tons L bs Ore "30% Tons Ore Lbs U3O8

6.5 MINING SEQUENCE
Sequential p i t layout for the Anderson Mine has been developed
around four c r i t e r i a :
' a. Obtaining an early ta i l ings pond s i t e
b. Maximizing i n i t i a l mill feed grade
c. A1 lowing reasonable f lex ib i l i t y in constructing ta i l ings dam
stages
d . Maximizing material vol umes to backfi 1 l areas
In i t i a l mining will provide an early short term ta i l ings repository.
The f i r s t stage t a i l i ngs dam will allow time for excavating the
main ta i l ing impoundment s i t e and for i n i t i a l construction of the
main stage dam. Upon completion of str ipping in Sequence # I ,
ac t iv i ty will be directed to Sequence #2, which i s in the northwest
section of the ore body. This p i t sequence i s not required for
the ta i l ings dam b u t will serve to maintain a higher mill feed
grade than the ta i l ings pond area. Mining of Sequence #2 will be
completed in suff ic ient time to allow the str ipping and mining
of Sequences #3 and #4 to be completed, providing for additional
t a i l ings area. Upon completion of Sequence #4, mine development
will proceed south and then west. Due to the low grade and log is t ics
associated with the East and West p i t s , they will be mined a t the
end of the project.

6.6 SCHEDULE A N D CONSTRAINTS
6.6.1 A c t i v i t y Schedule
a . S i t e p repara t ion work f o r t h e admin i s t r a t i on bu i ld ing , shop,
garage and warehouse f a c i l i t i e s w i l l commence on January 1 ,
1979. Mine s t r i p mate r ia l w i l l be used f o r engineered f i l l .
Construct ion of t h e s e mine f a c i l i t i e s w i l l commence on
April 1 , 1979, and be completed by October 1, 1979.
b. Pioneer ing t o begin on J u l y 1 , 1979, and cont inue through
September 1979.
c. Preproduction s t r i p p i n g t o begin on October 1 , 1979, and con-
t i n u e through December 1980.
d. Ore development f o r s t o c k p i l i n g and subsequent production t o
begin on March 1 , 1980, and cont inue through September 1990.
e . Mill opera t ion t o begin i n t h e f i r s t q u a r t e r of 1981, and
cont inue i n t o t h e fou r th q u a r t e r of 1990.
f. Mine s t r i p p i n g product ion i s based on 350 days per yea r .
g. Mine o r e product ion i s based on 250 days per yea r .
h. Mil 1 t o ope ra t e 365 days per y e a r .
6.6.2 S t r i p p i n g
Three per iods of t ime have been e s t a b l i s h e d f o r t h e l i f e o f the
mine: Preproduction of 15 months p lus 3 months of pioneer ing
work; Production I , extending f o r 4 .5 y e a r s a f t e r s t a r t of pro-
duc t ion ; and Production 11, con t inu ing for 4.75 y e a r s .

Preproduct ion i s t h e t i m e necessary t o s t r i p , mine and prepare
t he t a i l i n g dam area. The s t r i p p i n g shovels and t h e i r r espec t i ve
f l e e t o f t r u c k s w i l l opera te 35 shovel s h i f t s p e r week.
Produc t ion I i s scheduled a t 35 shovel s h i f t s p e r week. I n
Produc t ion 11, t he schedule i s reduced t o 25 shovel s h i f t s pe r
week.
Based on t h i s schedule, t h e peaks o c c u r r i n g as t h e ope ra t i on
advances toward t he h i g h tonnage areas t o t h e south a re minimized.
The 3 5 - s h i f t week i s composed o f 7 crews; 4 crews r o t a t i n g t o
generate 20 s h i f t s p e r week and 3 crews r o t a t i n g t o y i e l d 15
s h i f t s p e r week. The s p e c i f i c manpower f o r ope ra t i ng u n i t s are
d e t a i l e d i n Manpower Required Tables 6.9-1 through 6.9-9.
M in ing
The m in i ng i s scheduled t o work 3 crews r o t a t i n g t o generate
15 m in ing s h i f t s p e r week throughout t h e mine l i f e . See Tables
6.9-2 through 6.9-4.
Mine Parameters
a, Road t r a v e l w i d t h - 90 f e e t
b. Ramp grades - s t r i p p i n g 8%
- min ing 12%
c . Bench h e i g h t - 50 f e e t
d. Sa fe t y bench w i d t h - 100 f e e t (one bench)

e . Net highwall s l opes ( s a f e t y f a c t o r of 1 .1 : 1 )
Hei gh t
200 f e e t
400 f e e t
600 f e e t
800 f e e t
Sl ope
6.6 .5 Material Production Rates
a . Preproduction
( 1 ) 15 months of s t r i p p i n g t o t a l i n g 36.5 mi l l i on tons of
overburden
( 2 ) 9 months of secondary and i n t e r i o r waste remove1 of
2.03 mi l l i on tons of waste and 547,500 t ons of o r e
b. Production I
(1 ) S t r i p a t 29.2 mi 11 ion tons of overburden per y e a r
( 2 ) Secondary and i n t e r i o r waste removal of 2.71 mi l l i on
tons per y e a r and mine a t 730,000 t ons of o r e per y e a r
c . Production I1
( 1 ) S t r i p a t 20.8 mi l l i on tons of overburden
( 2 ) Secondary and i n t e r i o r waste , and o r e mining remains
a t t h e same r a t e a s i n y e a r s 1 through 4.5
6 .6 .6 Equipment Operat ing Parameters
a . Shovel d ipper f i l l f a c t o r - 0.90
b. Use of ava i l a b i 1 i t y (excavat ion equipment) - 83% preproduct ion
t o y e a r 5 , 60% y e a r 6 t o 10

c. Mechanical ava i lab i l i ty (haulage truck) - 75%
d . Rolling resistance:
Roads - 2%
Ramps - 3% plus 1 % per 1% grade
Loading area and dump - 4%
Mine Maintenance
The mine maintenance crew i s on a parallel schedule with the
mine, 4 rotating crews on 20 s h i f t s per week. Tables 6.9-5
through 6.9-8 show the required manpower by category. The number
of men required was obtained by applying historical factors t o
the tota l machine operating hours.

6.7 M I N E EQUIPMENT LIST
I tern
Stripping:
Shovel s
Trucks - Preproduction 1 s t year add 6 t h year add
Dril ls
Pr i l l Truck
Air Trac. & Compressor
Dozers with Rippers
Mining:
Front Shovel/Backhoe
Trucks
Dozer with Ripper
No. Units
Ore Control :
Probe Tower 1
Spectrometer
Probes
Dri 11
Support:
Motorgraders
Rubber Tire Dozer 1
Waterwagons 2

I t e m
M i s c e l l aneous :
L i g h t P l a n t s
Bank Spray System
Sump Pumps
Pickup Trucks
No. I tems

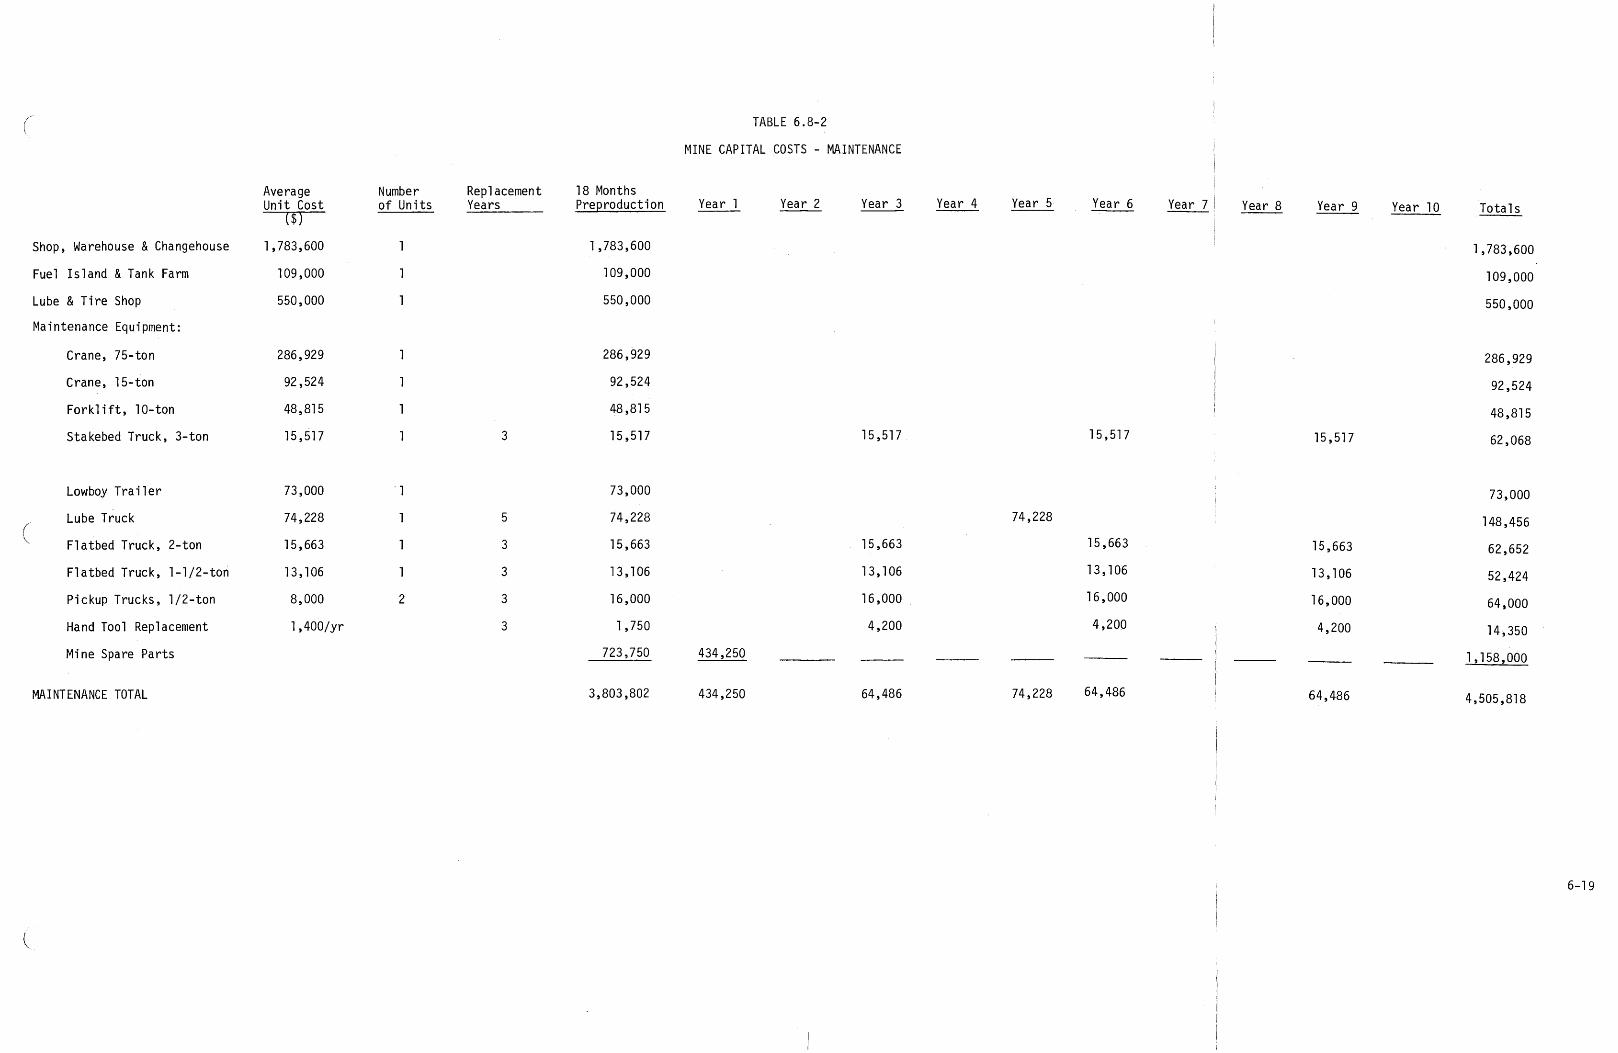
6.8 MINE CAPITAL COST
Mine equipment capital costs were derived by taking the average of
over 60 written quotations received from approximately 13 local
equipment dealers. The costs are based on standard budgetary
pricing per unit without any multiple order or competitive market
di scounts. Transportation ( F O B minesi t e ) and erection costs have
been estimated and included whenever appropriate. The quotes
re f lec t June 1 , 1978 prices, and are presented in Tables 6.8.1
(Operations Equipment), 6.8.2 (Maintenance Equipment), and
6.8.3 (Administrative Function Equipment).

6.9 MANPOWER REQUIREMENTS
The mine and maintenance manpower requirements are itemized in
Tables 6.9-1 through 6.9-9. The stripping, mining, ore control
and support manpower are derived direct ly from the required operating
units. The maintenance requirements were obtained by applying
historical factors t o the to ta l unit operating hours.
The mine and maintenance supervision are addressed i n Table 6.9-9.
The labor pool manpower requirement has been estimated a t s ix per-
cent of the minimum total manpower requirement t o account for
vacations and absenteeism.


Crews --
T A B L E 6.9-2
MINE MANPOWER - PREPRODUCTION (1 5 MONTHS)
Stripping Shovel - A Shovel - B Truck - A Truck - 5 Dri l ls Explosives Pr i l l Truck Dozers - Pioneer Dozers - Dump
Mi ni ng Front Shovel
i Truck Dozer Prober Drill - Ore Control Probe Tower
Support Grader - A Grader - 5 Rubber Tire Dozer Waterwagon - A Waterwagon - 5 Dump Spotters Pipe Tenders
Labor Pool
TOTAL
Total Personnel
* These people will be required a f t e r the twenty-fifth (25) . week of preproduction.

TABLE 6.9-3
MINE MANPOWER - PRODUCTION I (4.5 YEARS)
Crews
Stri%ppi ng Shovel - A Shovel - B Truck - A Truck - B Drill Expl os i ves P r i l l Truck Dozers - Pioneer Dozers - Dump
Mining Front Shovel Truck Dozer Prober Drill - Ore Control Probe Tower
Su pport Grader - A Grader - B Rubber Tire Dozer Waterwagon - A Waterwagon - B Dump Spotters - A Dump Spotters - B Pipe Tender
Labor Pool
Shif ts/Meek Total Personnel
TOTAL

T A B L E 6.9-4
MINE MANPOWER - PRODUCTION I1 (4 .75 Y E A R S )
Crews
Stripping Shovel - A Shovel - B Truck - A Truck - B Drill Explosives Pri11 Truck Dozers - Pioneer Dozers - Dump
Mining Front Shovel Truck D~zer Prober Drill - Ore Control Probe Tower
Support Grader - A Grader - 5 Rubber Tire Dozer Waterwagon - A Waterwagon - 5 Dump Spotters - A Dump Spotters - B Pipe Tenders
Labor Pool
TOTAL
* 3 shi f t s per week crew
Shifts/Week Total Personnel
covers the track d r i l l .

TABLE
MAINTENANCE MANPOWER -
Dozer & D r i l l Waterwagon
PIONEERING (13 WEEKS)
Small & Grader Se rv i ce Veh ic l e
Mechanics 1.3 0.9 0.3 0.6
Mechanics & Welders He1 pers
We1 ders 0.6 0.4 0.2 0.3
Lube Mechanics
To ta l Men By Category
He1 pers
TOTAL 9
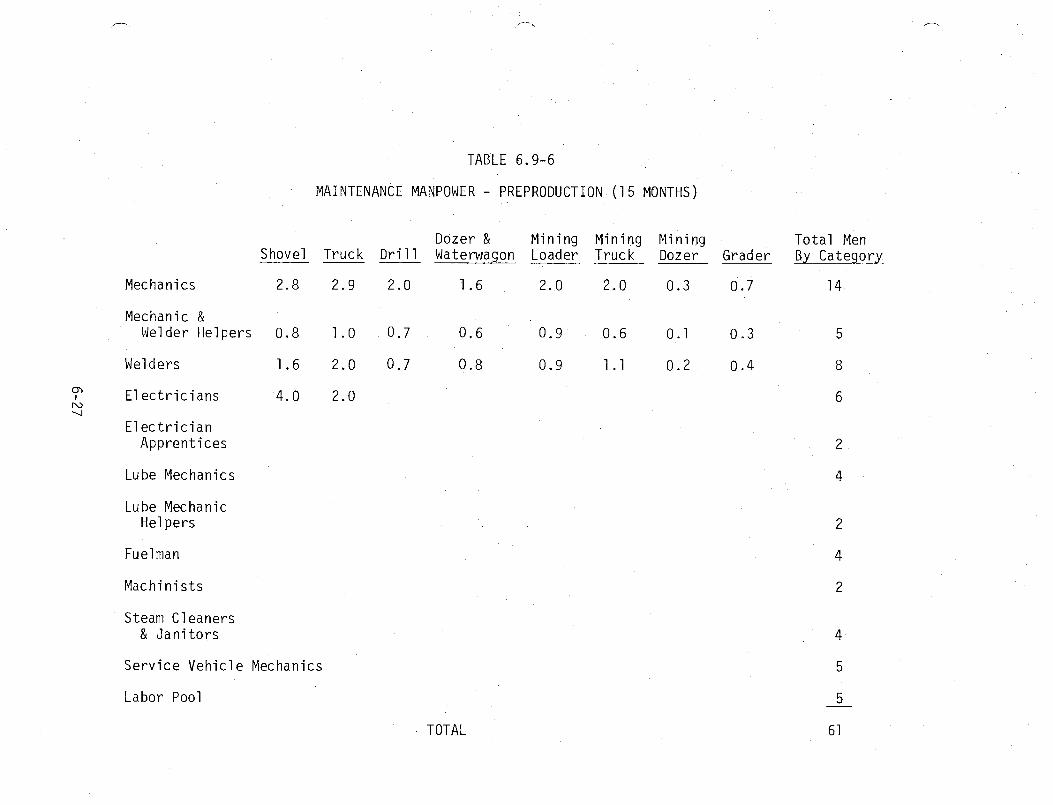
TABLE 6.9-6
MAINTENANCE MANPOWER - PREPRODUCTION (15 MONTHS)
Dozer & M in ing Min ing Min ing Shovel -- Truck D r i l l Waterwagon Loader Truck Dozer Grader
Mechanics
Mechanic & We1 der He1 pers
We1.d e r s
m I IV
E l e c t r i c i a n s w
E l e c t r i c i a n Appren t i ces
Lube Mechanics
Lube Mechanic He1 pers
Fuelman
Mach in i s t s
Steam C l eaners & J a n i t o r s
S e r v i c e Veh i c l e Mechanics
Labor Pool
TOTAL
T o t a l Men By Category
14

TABLE 6.9-7
MAINTENANCE MANPOWER - PRODUCTION I (4.5 YEARS)
Dozer & M in ing Min ing Min ing To ta l Men Shovel -- Truck D r i l l Waterwagon Loader Truck Dozer Grader By Category
Mechanics
Mechanic & Welder He1 pers
Welders
m I E l e c t r i c i a n s IV 03
E l e c t r i c i a n Apprent ices
Lube Mechanics
Lube Mechanic He1 pers
Fuel men
Mach in is ts
Steam Cleaners & J a n i t o r s
Se rv i ce Veh ic l e Mechanics 5
Labor Pool 5
TOTAL 62

TABLE 6.9-8
MAINTENANCE MANPOWER - PRODUCTION I I (4 .75 YEARS)
Dozer & M in ing Min ing Min ing T o t a l Men Shovel -- Truck D r i 1 1 Waterwagon Loader Truck Dozer Grader By Category
Mechanics 2.0 3.6 2.0 1.6 2.0 2.0 0.3 0.5 14
Mechanic & Welder Helpers 0.6 1.3 0.7 0.6 0.9 0.6 0.1 0.2 5
Welders
~n E l e c t r i c i a n s 2.8 2.6 5 N
E l e c t r i c i a n Apprent i ces 0.6 0.5 1
Lube Mechanics 2
Lube Mechanic He1 pers 2
Fuelman 4
Mach in is ts 2
Steam C l eaners & J a n i t o r s 4
Se rv i ce Veh i c l e Mechanics 5
Labor Pool 4
TOTAL 56

TABLE 6.9-9
MINE AND MAINTENANCE SUPERVISION
Mine
Mine Superintendent 1
Mine General Foreman 1
Shif t Foreman 4
Mine P l anning Engineer 1
Ore Foreman 1
Chief Mine Engineer 1
Mine Geologist
Clerk
Ore Control Engi neer 7
Mine Surveyor 1
Surveyor He1 per 1
Draftsman 1
TOTAL 15
Maintenance (Mine and Mi 11 )
Maintenance Superintendent
General Maintenance Foreman
Shif t Foreman
Mechanical Engineer
Maintenance Clerk 1
TOTAL 10
6.10 OPERATING A N D MAINTENANCE COSTS
Operating costs for the Anderson Mine are based on equipment
numbers and operating hours developed for equipment selection
and just i f icat ion. Hourly equipment operating costs were developed
by estimating costs for individual pieces of equipment. Itemized
operating costs re f lec t :
a . Fuel and f luid consumption
b. Parts and supplies
c. Maintenance labor
d . Major repairs
e. Operating labor
Costs are appl ied'only to actual machine operating hours. T h i s
( I, excludes time for lunch breaks, and time while operator i s in
t r ans i t to or from the machine. Operating labor i s based on an
eight-hour day b u t i s factored into the operating cost so as t o
re f lec t the actual operating hours ( typical ly: 8 hr day t 7 or
7-1/2 hr operated x hourly wage).
Wages for maintenance personnel are bu i l t into the operating
costs with the exception o f the following categories:
a. Fuel ing personnel
b. Machinists
c . Steam cleaners and jani tors
d . Service vehicle personnel
e . Miscellaneous labor

These categories and engineering and supervision have been itemized
separately. Table 6.10-1 summarizes the operating costs by
periods.
Tables 6.10-2 through 6.10-12 provide mine operating cost estimate
detai ls .
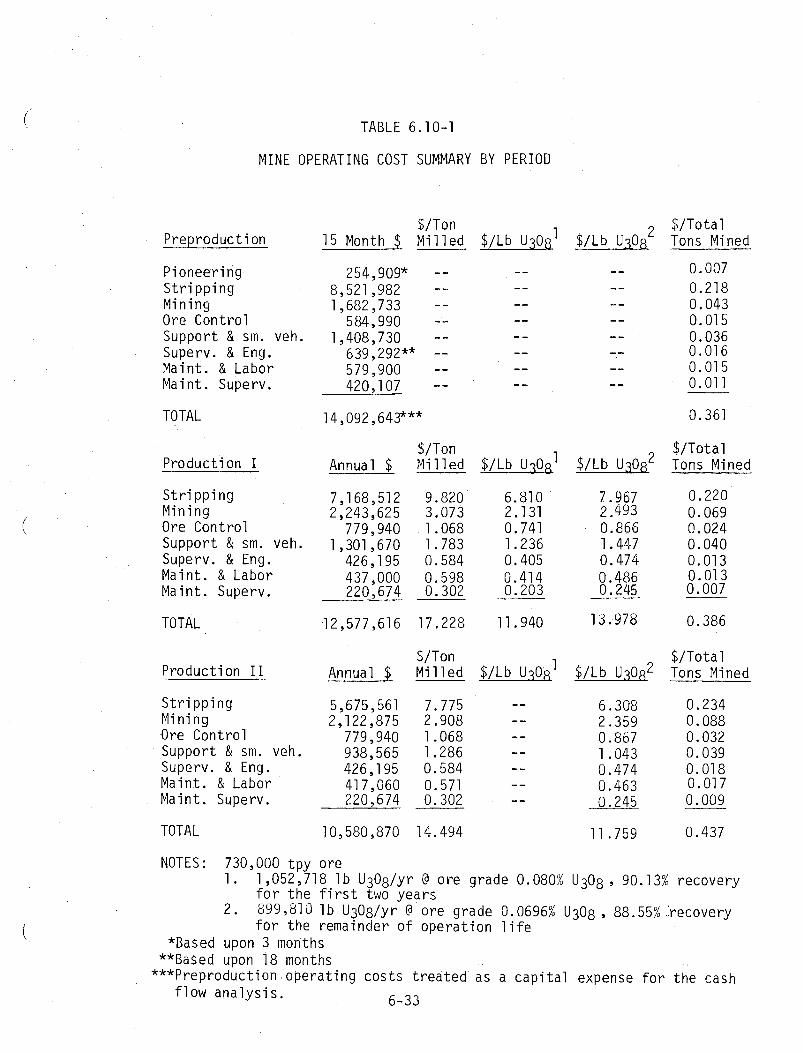
TABLE 6.10-1
M I N E OPERATING COST SUMMARY BY P E R I O D
Preproduct ion
Pioneer ing S t r i p p i n g Min ing Ore Cont ro l Support & sm. veh. Superv. & Eng. Maint . & Labor Maint . Superv.
$/Ton 75 Month $ M i l l e d
$ /To ta l $/Lb U3@31 $/Lb u3h2 Tons Mined
TOTAL 14,092,64?** 0.361
$/Ton $/Tota l Product ion I Annual $ M i l l e d $/Lb U ~ O ~ $/Lb ti308' Tons Mined
S t r i p p i ng 7,168,512 9.820 6.810 7.967 0.220 Min ing 2,243,625 3.073 2.131 2.493 0.069 Ore Cont ro l 779,940 1.068 0.741 0.866 0.024 Support & sm. veh. 1,301,670 1.783 1.236 1.447 0.040 Superv. & Eng. 426,195 0.584 0.405 0.474 0.013 Maint . & Labor 437,000 0.598 0.41 4 0.486 0.013 Maint . Superv. 220,674 0.302 0.203 -- 0.245 0.007
TOTAL 12,577,616 17.228 11.940 13.978 0.386
Produc t i on I I
S t r i p p i n g Min ing Ore Cont ro l Support & sm. veh. Superv. 81 Eng. Maint . & Labor Maint . Superv.
Annual $ $/Ton M i l l e d
$/To t a 1 Tons Mined
TOTAL 10,580,870 14.494 11.759 0.437
NOTES: 730,000 t p y ore 1 . 1,052,718 Tb U308/yr @ o re grade 0.080% U308 , 90.13% recovery
f o r t h e f i r s t two years 2. 899,81a 1 b U&/yr @ o re grade 0.0696% U308, 88.55%:recovery
f o r t he remainder o f ope ra t i on l i f e *Based upon 3 months
**Based upon 18 months ***Preproduction.operating cos ts t r e a t e d as a c a p i t a l expense f o r t h e cash
f low ana l ys i s . 6-33

TABLE 6.10-2
OPERATING HOURS - PIONEERING
Hours/Shi f t U n i t s
Dozers-Pi oneer 7.5 2
A i r T rac D r i l l 7.5 1
Compressor 7.5 1
D r i l l s 7 .5 2
P r i 1 1 T ruck 7 . 5 1
i Moto r Grader 7.5 1
Waterwagon 7.5 1
Small Veh ic les 7.5 2
Powderman 8 1
Labor 8 2
Sh i f ts/Week
10
10
10
10 x 4 wks.
5 x 4 wks.
1 s
10
10
5 x 4 wks.
5 x 4 wks.
T o t a l Hours
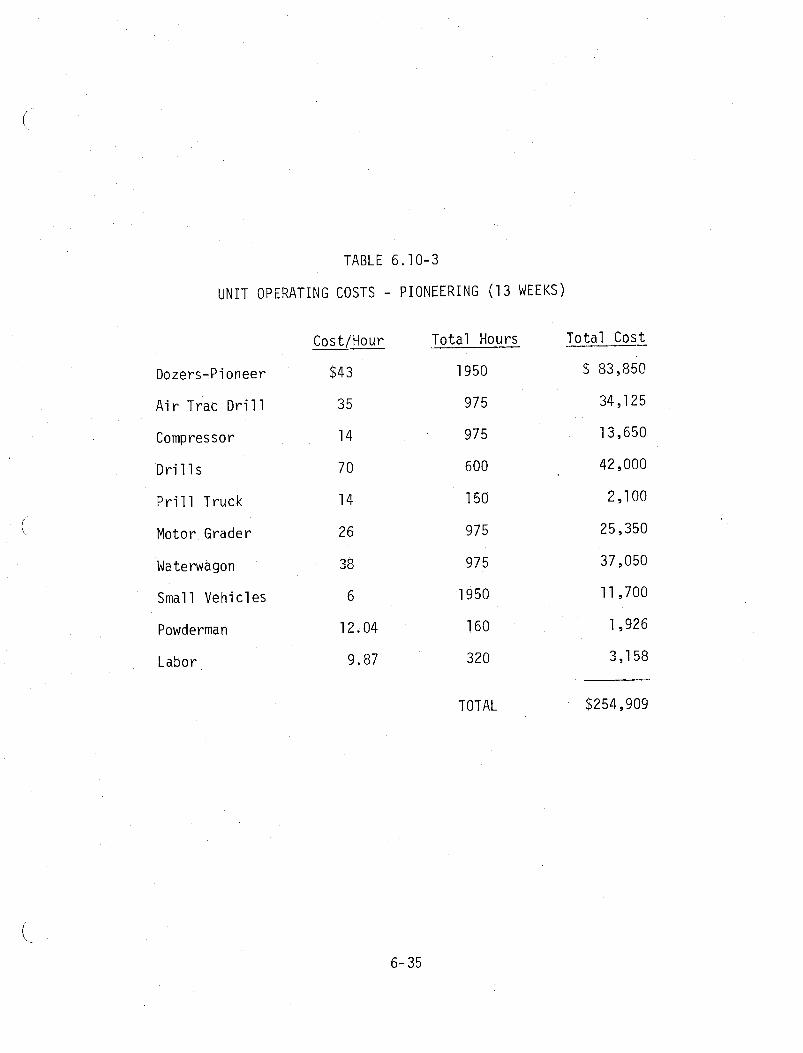
TABLE 6.10-3
U N I T OPERATING COSTS - P I O N E E R I N G (13 WEEKS)
Cost/Hour Total Hours
Dozers-Pi oneer $43 1950
Air Trac D r i l l 35 975
Compressor 14 975
D r i l l s 70 600
P r i l l Truck 14 150
Motor Grader 26 975
Waterwagon
Small Vehicles 6 1950
Powderman 12.04 160
Labor
TOTAL
Total Cost

TABLE 6.10-4
OPERATING HOURS - PREPRODUCTION (1 5 MONTHS)
S t r i p p i n g Shovel s Trucks D r i l l s Powdermen P r i l l Truck A i r Trac D r i l l Compressor Dozers-Pioneer Dozers-Dump
Mining Front Shovel s Trucks Dozer-Ri pper
Uni t s Shifts/Week Total Hours
Ore Control Probe Tower 8 1 1 5 4,500 Probe Men 8 5 1 5 22,500 D r i l l -Ore Control 7 1 7 5 3,938
Support Motor Grader A 7 . 5 1 20 9,375 Motor Grader B 7 . 5 1 1 5 4,219 D o z e r - R u b b e r T i r e 7 . 5 1 20 9,375 Waterwagon A 7.5 1 20 9,375 Waterwagon B 7 .5 1 10 2,813 Dump S p o t t e r s 8 4 5 10,000 Pipe Tender 8 1 5 2,500
Small Vehicles 23,437
Labor Primary S t r i pp ing 8 5 5 12,500 Mining 8 3 5 4,500
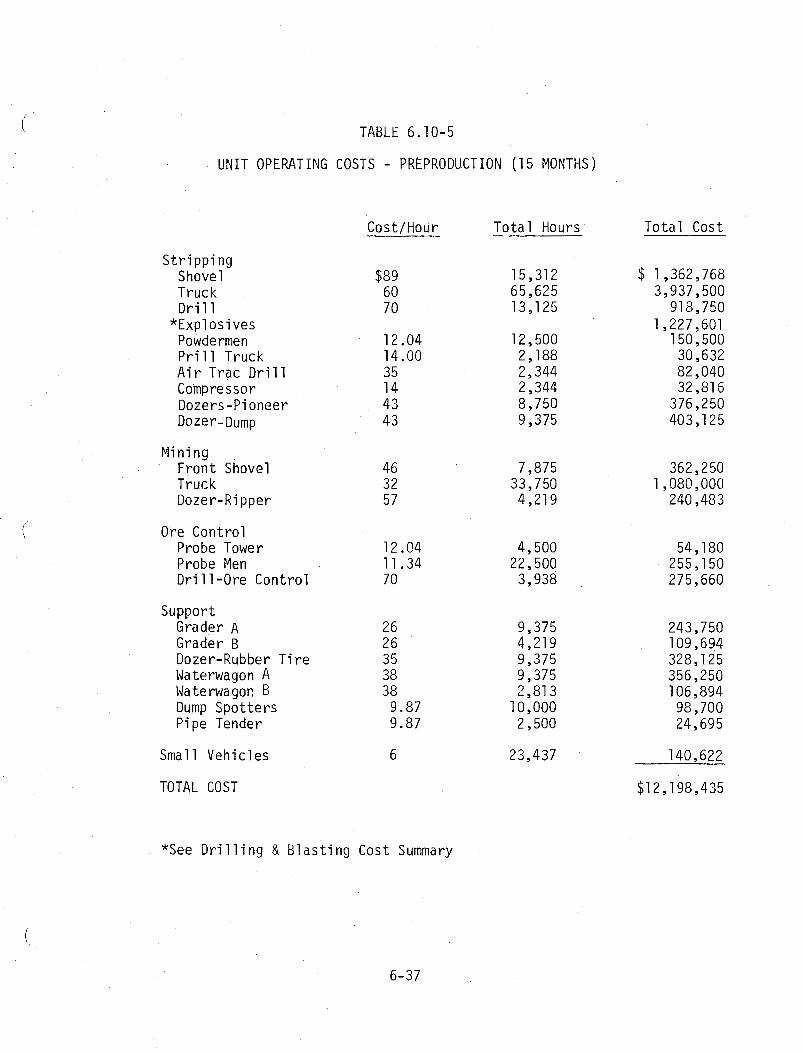
TABLE 6.10-5
UNIT OPERATING COSTS - PREPRODUCTION (15 MONTHS)
S t r i pp ing Shovel Truck Dr i l l
*Expl os i ves Powdermen P r i l l Truck Air Trac D r i l l Compressor Dozers-Pi oneer Dozer-Dump
Mining Front Shovel Truck Dozer-Ri pper
Total Hours
Ore Control Probe Tower 12.04 Probe Men 11.34 Dri 11 -Ore Control 70
Support Grader A 26 Grader B 26 Dozer-Rubber T i r e 35 Waterwagon A 38 Waterwagon B 38 Dump Spo t t e r s 9.87 Pipe Tender 9.87
Small Vehicles 6
TOTAL COST
*See D r i l l i n g & Blas t ing Cost Summary
Total Cost
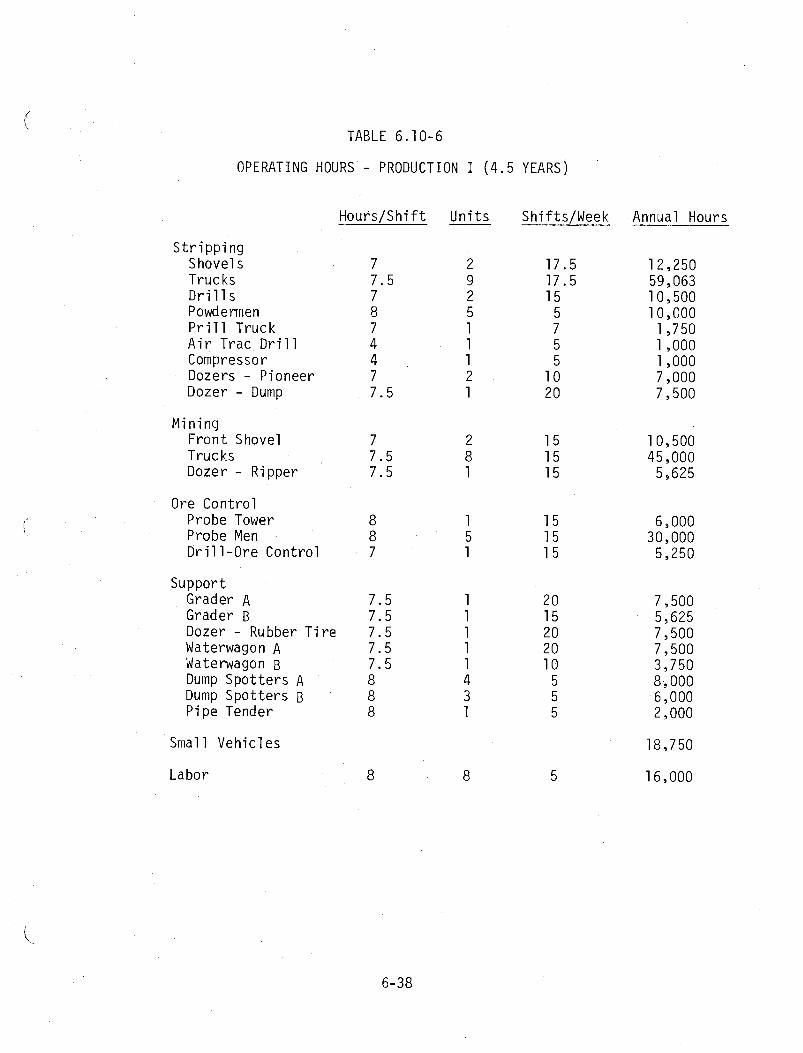
T A B L E 6.10-6
OPERATING HOURS - PRODUCTION I (4 .5 YEARS)
Hours/Shift Units Shifts/Week Annual Hours
Str ipping Shovel s Trucks D r i l l s Powdermen P r i l l Truck Air Trac Dri l l Compressor Dozers - Pioneer Dozer - Dump
Mining Front Shovel Trucks Dozer - Ripper
Ore Control Probe Tower Probe Men Dri l l -Ore Control
Support Grader A Grader B Dozer - Rubber Ti r e Waterwagon A Waterwagon B Dump Spot ters A Dump Spot ters g Pipe Tender
Small Vehicles
Labor

TABLE 6.10-7
UNIT OPERATING COSTS - PRODUCTION I (4 .5 YEARS)
S t r i pp ing Shovel Truck Dr i l l
*Expl o s i ves Powdermen P r i l l Truck Air Trac Dr i l l Compressor Dozer-Pioneer Dozer-Dump
Mining Front Shovel Truck Dozer-Ripper
Cost/Hour Total Hours
Ore Control Probe Tower 12.04 6,000 Probe Man 11.34 30,000 Dri l l -Ore Control 70 5,250
Support Motor Grader A 26 Motor Grader B 26 Dozer-Rubber T i r e 35 Waterwagon A 38 Waterwagon B 38 Dump S p o t t e r A 9.87 Dump S p o t t e r B 9.87 Pl'pe Tender 9.87
Small Vehicle 6 18,750
TOTAL COSTIYEAR
Annual Cost
*See D r i l l i n g & Blas t ing Cost Summary

TABLE 6.10-8
OPERATING HOURS - PRODUCTION I 1 (4 .75 YEARS)
Hours/Shif t Un i t s ShiftsIWeek Annual Hours
S t r i p p i n g Shovel s Trucks D r i l l s Powdermen P r i l l Truck P r i l l Truck Driver Air Trac D r i l l Compressor Dozer-P ioneer Dozer-Dump
Mining Fron t Shovel s Trucks Dozer-Ri pper
Ore Control Probe Tower Probe Men Dri 1 I -Ore Control
Support Motor Grader A Motor Grader B Dozer - Rubber T i r e Waterwagon A Waterwagon B Dump S p o t t e r s A Dump S p o t t e r s B Pipe Tender
Small Vehicl e s
Labor

TABLE 6.10-9
UNIT OPERATING COSTS - PRODUCTION I1 (4.75
S t r i pp ing Shovel Truck D r i l l s
*Expl os ives Powdermen P r i l l Truck Ai r Trac D r i l l Compressor Dozer-Pioneer Dozer-Dump
Mining Front Shovel Truck Dozer-Ri pper
Ore Control Probe Tower Probe Men Dri l l -Ore Control
Support Motor Grader A 26 Motor Grader B 26 Dozer - R u b b e r T i r e 35 Waterwagon A 38 Waterwagon B 38 Dump Spo t t e r A 9.87 Dump S p o t t e r B 9.87 Pipe Tender 9.87
Small Vehicl e 6
Total Hours
TOTAL COST/YEAR
* See D r i l l i n g & Blas t ing Cost Summary
Annual Cost

TABLE 6.10-10
SUPERVISION & ENGINEERING ANNUAL COST
1 Mine Superintendent
1 Mine General Foreman
4 S h i f t Foremen @ $24,200
1 Mine Planning Engineer
Ore Foreman
Chief Mine Engineer
Mine Geologist
Clerk
(. 1 Ore Control Engineer
1 Mine Surveyor
1 Surveyor Helper
1 Draftsman
Burden @ 23%
TOTAL
NOTES: 730,000 tpy Ore 1 . 1,O52,7l 8 1 b U308/yr @ ore grade 0.080% U 08, Yo. 13% recovery 2. 899,810 1 b k$&r @ ore grade 0.0696% u3J8, 88.55% recovery
*Preproduction (18 months) cos t i s $639,292 or 1.5 x $426,195

TABLE 6.10-11
MAINTENANCE OPERATING COST, LABOR AND MOBILE EQUIPMENT
The mechanics, welders, e l e c t r i c i a n s , l u b r i c a t i o n mechanics, and he lpers
a r e i nc l uded i n the u n i t h o u r l y ope ra t i ng costs . The f o l l o w i n g ca tegor ies
a re n o t inc luded i n those cos ts :
Annual Costs
Fuel Men
Mach in is ts
Steam Cleaner & J a n i t o r s
Preproduct ion Product ion I Product ion I 1
$ 90,720 $ 90,720 $ 90,720
Labor Pool 99,700 99,700 79,760
Labor Cost/,Year
Per 15 Months
Mobi le Equipment Cost/Year $1 34,620 $107,700 $107,700
TOTAL LABOR AND MOBILE EQUIPMENT COST/YEAR $463,920 $437,000 $41 7,060
PER 15 MONTHS
*Used i n Table 6.10-1
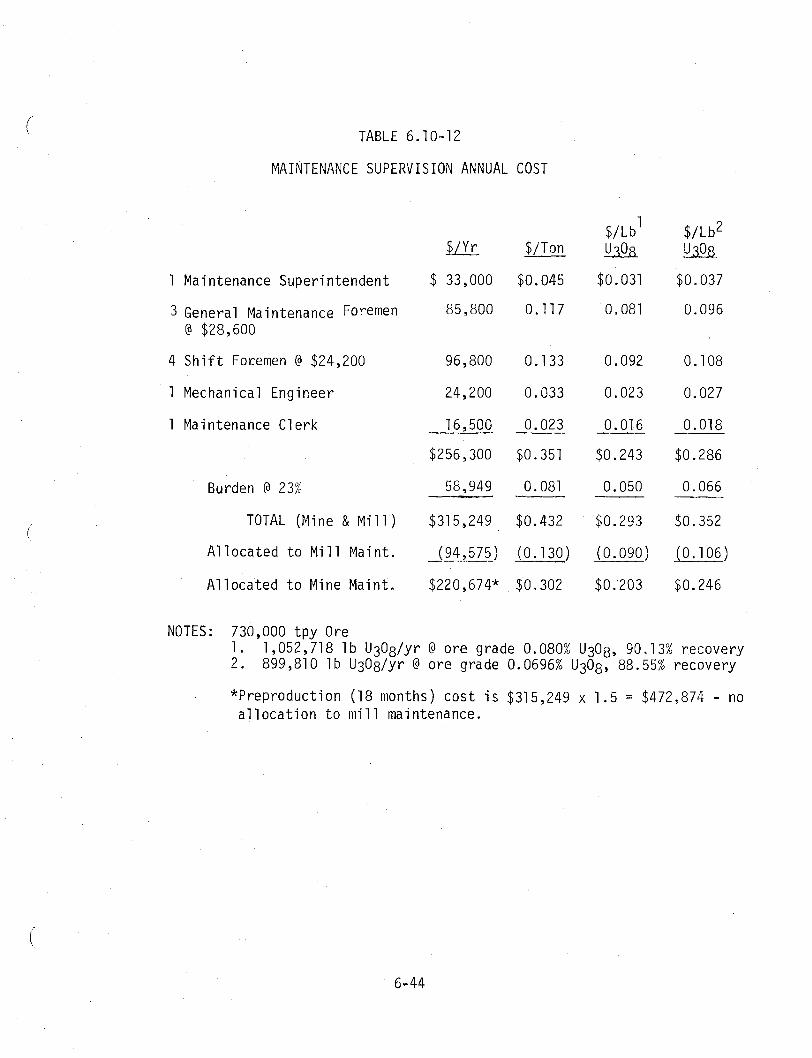
TABLE 6.10-12
MAINTENANCE SUPERVISION ANNUAL COST
Maintenance Superintendent
General Maintenance R m m e n @ $28,600
Shift Foremen @ $24,200
Mechanical Engineer
Maintenance Clerk
Burden @ 23%
TOTAL (Mine & Mill)
Allocated to Mi71 Maint.
Allocated to Mine Maint.
NOTES: 730,000 tpy Ore 1. 1,052,718 1 b U308/yr @ ore grade 0.080% U303, 90.13% recovery 2 . 899,810 lb U308/yr @ ore grade 0.0696% U3O8, 88.55% recovery
*Preproduction (18 months) cost is $315,249 x 1.5 = $472,874 - no allocation to mill maintenance.

6.11 MAINTENANCE PROCEDURES
F i e l d Maintenance
F i e l d maintenance serv ices c o n s i s t o f those tasks which cannot
be performed i n t h e maintenance shop. Th is w i l l be l i m i t e d t o
those equipment i tems which a re t o o l a r g e o r slow t o t r a n s p o r t
t o t h e shop. For t h e Anderson Mine, t h i s w i l l r e f e r o n l y t o
r e p a i r s and serv ices f o r t h e two e l e c t r i c shovels and t o
s e r v i c i n g t racked equipment. Major r e p a i r s on a l l equipment,
except the e l e c t r i c shovels, w i l l be performed a t t h e shop.
Equipment w i l l be t r anspo r ted t o t h e shop on a lowboy t r a i l e r
i f necessary. The f i e l d s e r v i c e f l e e t w i l l c o n s i s t o f a 2- ton
shovel s e r v i c e t ruck , a we ld ing and compressor t r uck , 15-ton
rough t e r r a i n and 75-ton l a t t i c e boom cranes and a 10-ton f o r k -
l i f t .
Shop Maintenance
Maintenance shops w i l l p rov ide a work area f o r equipment s e r v i c i n g ,
mechanical r e p a i r s and major component replacement. Rebu i ld ing
o f major components w i l l be performed by t he var ious vendors a t
t h e i r f a c i l i t i e s . A minimum s tock o f components w i l l be ware-
housed due t o t he c l ose p r o x i m i t y o f vendor warehouses. Shop
ope ra t i on w i l l be mainta ined 20 s h i f t s pe r week. Equipment
w i l l be r o t a t e d through t h e shop f o r p reven ta t i ve maintenance
on a r e g u l a r bas is .

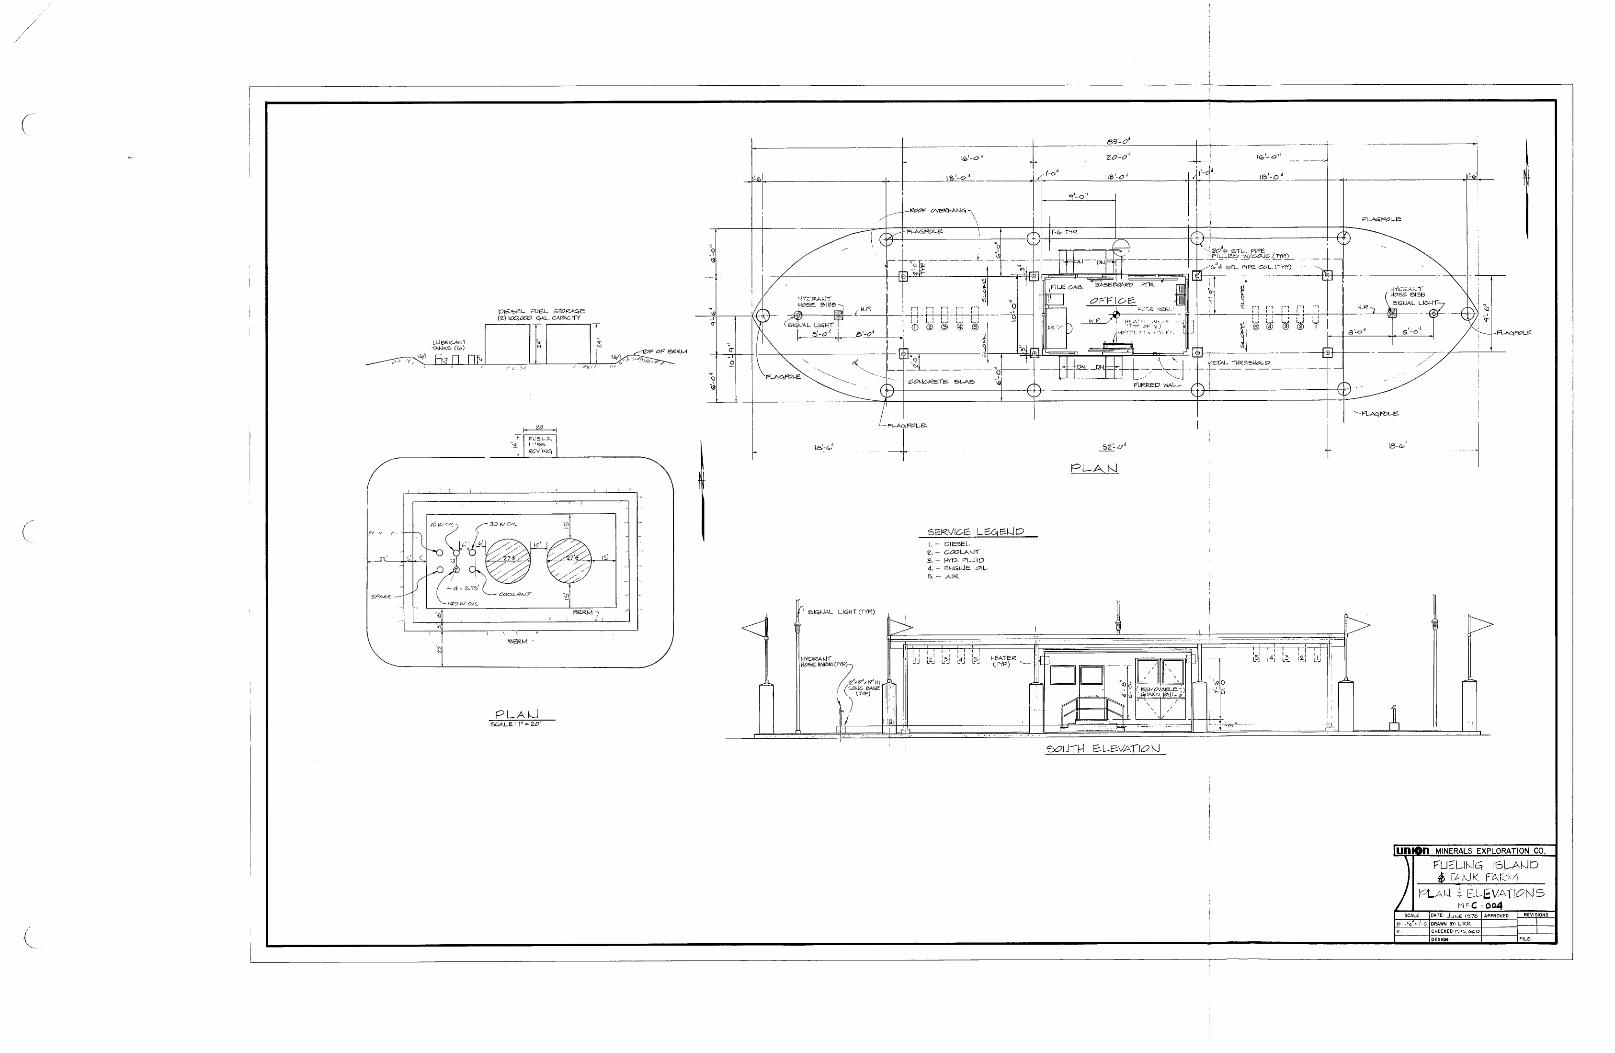
SECTION 7
MINING FACILITIES
This section incorporates the portion of the plant s i t e relating to
administration, maintenance and mine-related f a c i l i t i e s . Addressed
are the administration building, maintenance and service shops, fuel
storage and distribution which are depicted on Drawing 21-53-0-104,
Mill and Mine Facil i ty Plot Plan.
7.1 ADMINISTRATION BUILDING
The f loor plan and elevation of t h i s building i s found on Drawing
No. 21-53-0-011. The building contains 12,800 square fee t and i s
a pre-engineered s t ructure encl osed by factory-f i nished and insu-
( lated metal wall and roof panels.
The overall plan of the building was designed to group personnel by
functions. Office locations and hal ls were arranged t o minimize
t r a f f i c and noise. The off ice portion of the building includes
admini s t r a t i ve off ices , technical service off ices , and a safety and
f i r s t aid area. The laboratory portion of the building contains
the metallurgical and analytical laboratories, including a balance
room, atomic absorption room and sample preparation area. The
balance room and the sample preparation room wid1 be bu i l t on
v i bration-free pads.
Parti t ions will be of steel stud and gypsum board construction.
The wall separators, mechanical equipment room, and the sample

preparation room shall be constructed of 8-inch conrete block and
have a four-hour f i r e rating.
The heating and a i r condi tioning system will have three zones. The
sample preparation system will be equipped with dust control. The
laboratory area will be equipped with fume control. The remainder .
o f the building will be combined into a common system. The heating
system will be tota l e l ec t r i c .

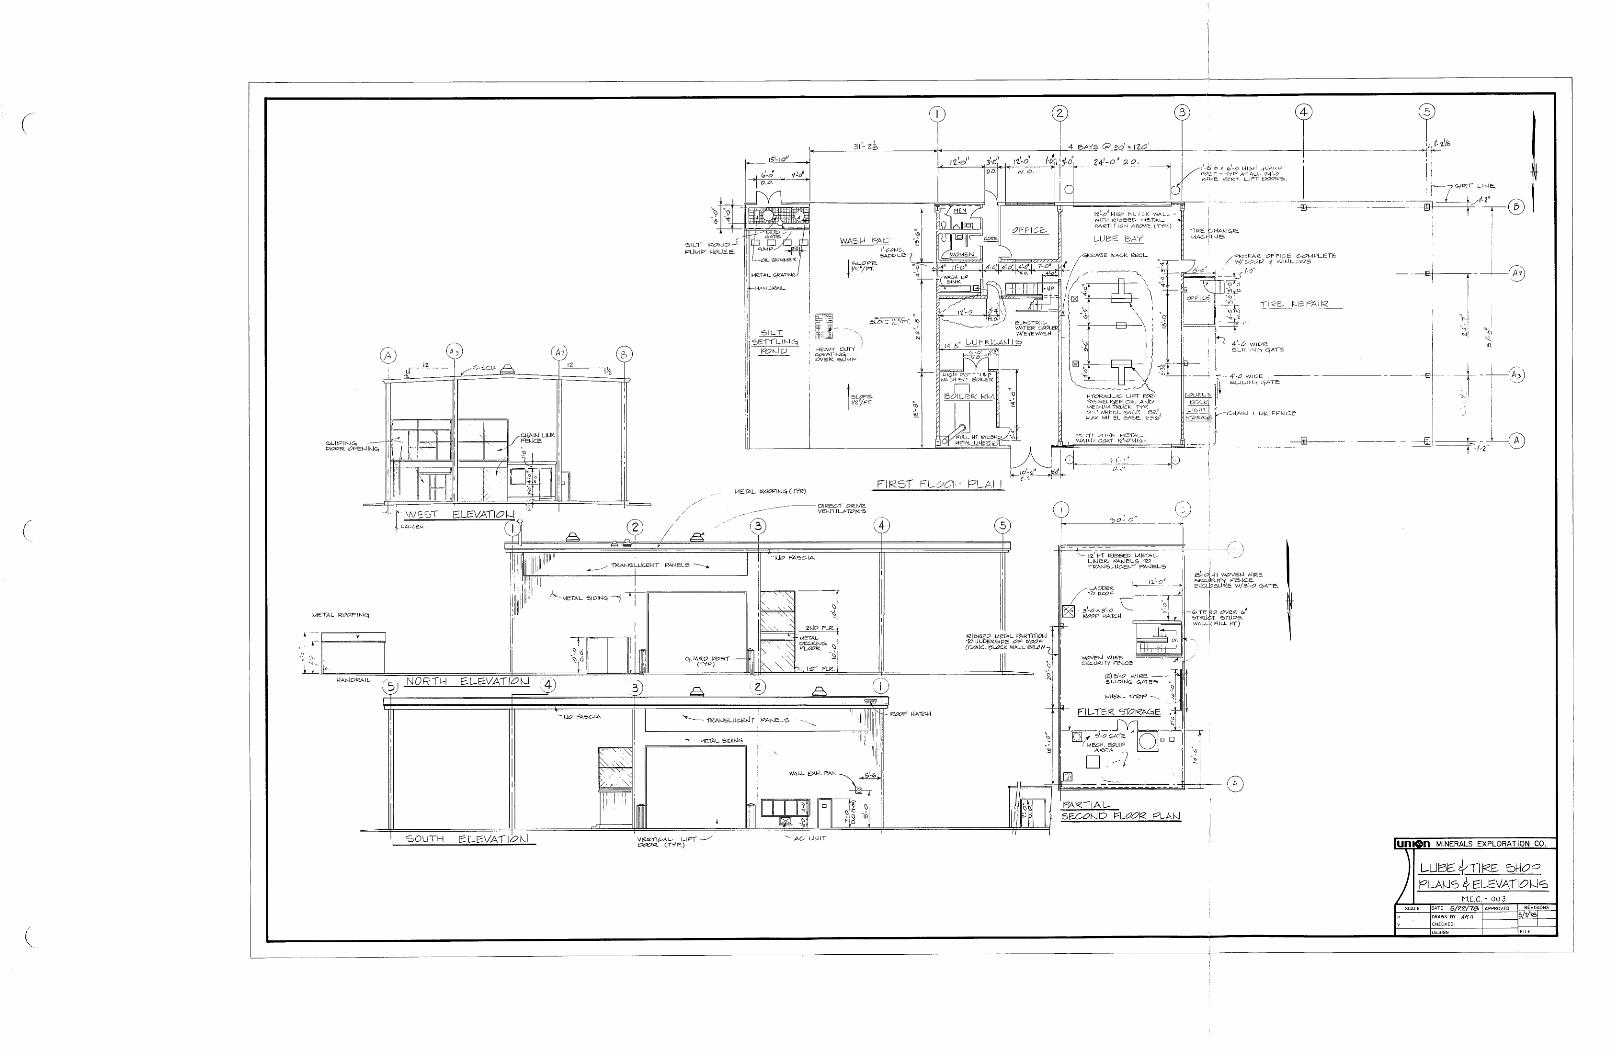
7.2 MAINTENANCE AND SERVICE SHOPS
Two p r e f a b r i c a t e d b u i l d i n g s w i l l house a l l t he maintenance and
s e r v i c e f a c i l i t i e s . One b u i l d i n g w i l l i n co rpo ra te t he mainten-
ance shop, warehouse and change rooms. (Drawing No. 21 -51 -0-01 2 ) .
The o t h e r h u i l d i n g w i l l i n c l u d e t i r e r e p a i r , l u b r i c a t i o n and
wash f a c i 1 i t i e s . (Drawing No. MEC-003).
The heavy equipment r e p a i r area cons i s t s o f f i v e ( 5 ) r e p a i r bays,
a weld ing bay and a bay f o r m i l l r e p a i r . These f a c i l i t i e s cover
12,400 square f e e t , The 54- foo t he igh t w i l l accommodate a 20-ton
overhead b r i dge crane. An a d d i t i o n a l 12,400 square f e e t w i l l be
b u i l t t o 24 f e e t i n he igh t . Th i s area w i l l i n c l u d e t h e warehouse,
change rooms, u t i l i t y v e h i c l e shop, e l e c t r i c a l shop, lunch room
and maintenance o f f i c e s . The warehouse covers 5500 square f e e t
w i t h e x t r a s torage coming from a l o f t cover ing h a l f t h e area,
and a 6900 square f o o t fenced area immediately ad jacen t t o t h e
warehouse. The change rooms a re designed t o p rov ide f a c i l i t i e s
f o r 225 people a t an 80 percen t men/20 percent women r a t i o .
The heavy equipment r e p a i r bays w i l l use r a d i a n t t ype heaters .
The remaining areas w i l l u t i l i z e baseboard heaters .
The t i r e r e p a i r and l u b r i c a t i o n b u i l d i n g covers 7300 square
f e e t , and i s 32 f e e t h igh. The t i r e r e p a i r area i s 3600 square
f e e t . The l u b r i c a t i o n bay i s designed t o handle s e r v i c i n g f o r
a l l veh i c l es and i s equipped w i t h a h y d r a u l i c l i f t t o handle
smal l veh i c l es and medium s i z e t r ucks . A 1800 square f o o t area
ad jacen t t o t he b u i l d i n g i s p rov ided w i t h equipment wash f a c i l i t i e s .

7.3 FUEL STORAGE
The fueling island i s eas t of the lube and t i r e repair shop.
I t s location provides access on e i ther side. I t s function i s
t o provide diesel fue l , engine coolant, hydraulic f l u ids ,
engine oi l and a i r t o the mine equipment.
The tank farm i s designed for two weeks storage of the major
lubricants for the mine and two weeks diesel fuel storage for
the en t i re mine and mill complex. Lubricants were standardized
to three principle grades and stored in 300 to 500 gallon pre-
fabrjcated vertical tanks. Bulk storage of lubricants include:
Engine oi l (2-500 gal ) ; transmission and hydraul i c o i l (2-500
ga l ) , and final drive (1-300 ga l ) . Engine coolant i s also
contained in a 500 gallon tank. Greases, solvents and special-
purpose lubricants consumed in smaller quanti t ies will be p u r -
chased and stored in 55 gallon drums. Two 100,000 gallon vertical
fuel tanks will s tore #2 diesel fuel . Local manufacturers suppl ied
capital cost f igures including appropriate site-preparation and
erection expenditures. Layout of the tank farm and fuel island
i s shown in Drawing No. MEC-004.


EXHIBIT 11-B EQUIPMENT OPERATING COST CALCULATIONS

(- EXHIBIT 11-B
MINE EQUIPMENT HOURLY COST CALCULATIONS
17 Cu Yd S t r i p p i n g Shovel
Cost/Operat ing Hour
E l e c t r i c Power 450 kwh x 0.04 $/kwh
Repai r s , Maintenance & Suppl i e s O $0.018/ton, 2,380 t / h r x 0.018
Labor Operator 14.64 O i l e r 13.76
$89.24
USE $89.00
Reference P & H Cost ing Method

("- EXHSBIT 11-B PAGE 2 OF 10
120-Ton Haul e r
Cost/Operat ing Hour
Maintenance, Serv ice & Repai r Fc[Pf + ( L f x Mw)] Fuel Consumption (Fc) = 29.29 g a l / h r P a r t Fac to r ( P f ) = 0.443 Labor Fac to r ( L f ) = 0.0292 Mechanic Wage (Mw) = 8.6 x 1.40 = $12.04
T i r es L i f e - 3,500 h r s 30 x 51-52 p l y = $6,282/ t i re x 6 = $37,698 10.77
Fuel Consumption = 29.2 g a l / h r U n i t Cost = $0.38/gal
Preven ta t i ve Maintenance 1.73
Opera t o r 12.84
$59.71
USE $60.00
Reference Wabco Cost ing Method

Rotary Dr i l l
EXHIBIT 11-B PACE 3 OF 10
Fuel 18.8 g a l l h r @ $0.38/gal
Lube Oil
T i r e s
Pa r t s & Supplies 6.90 x ( 5 hp + 3 hp)
Labor Operator @ 718 hrs - 13.76 Helper @ 718 hrs - 12.96
Subtotal Operating
(%* Bi t s 10" @ $600 @ 3,000 f t @ 80 f t l h r x 0.83
Dr i l l Pipe $12,000 set 100,000 f t l i f e $5,000 rebui ld ( 2 ) x 0.83
Stabi 1 i z e r s $3,000 - 40,000 f t l i f e
Subtotal Consumabl es
TOTAL OPERATING COSTS
Cost loperat ing Hour
USE $70.00
Reference Updated Ingersol 1 -Rand T-4 Dri 11 ing Costs
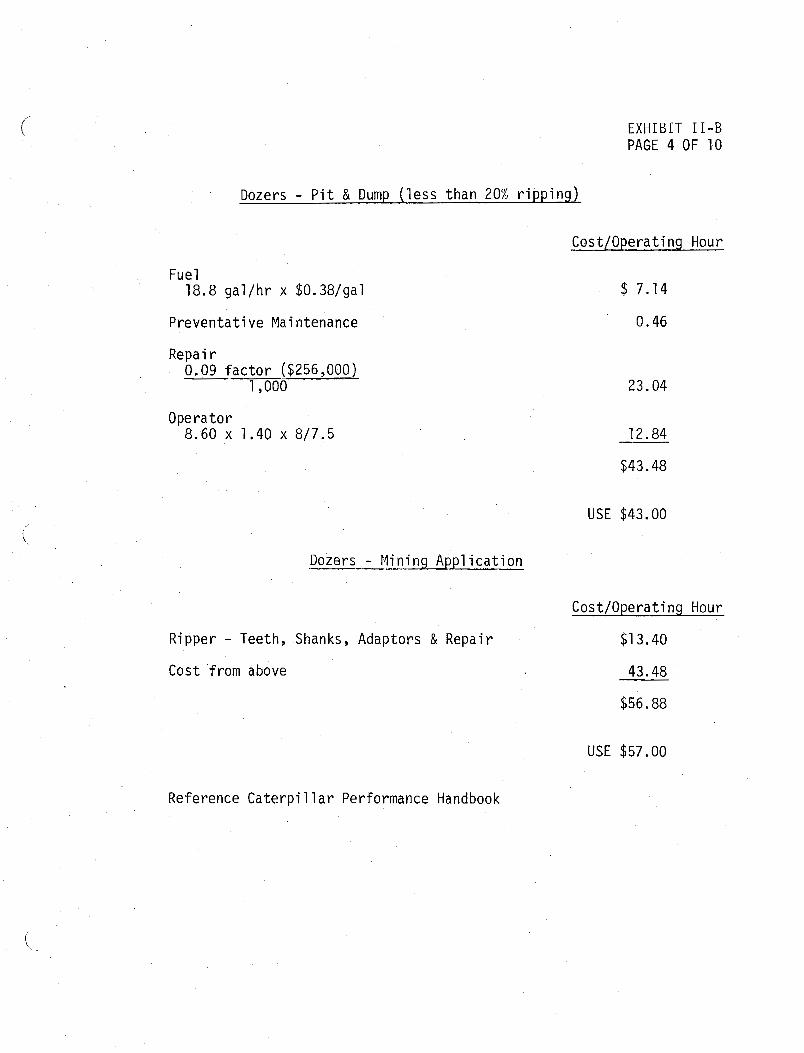
Dozers - P i t & Dump ( l e s s than 20% r i p p i n g )
Fuel 18.8 g a l / h r x $0.38/gal
E X H I B I T 11-B PAGE 4 OF 10
Cost /Operat i ng Hour
P reven ta t i ve Mai ntenance 0.46
Repai r 0.09 f a c t o r ($256,000)
1,000
Operator 8.60 x 1.40 x 8 / 7 3
USE $43.00
Dozers - Min ing A p p l i c a t i o n
Ripper - Teeth, Shanks, Adaptors & Repai r
Cost f rom above
Cost/Operat ing Hour
USE $57.00
Reference C a t e r p i l l a r Performance Handbook
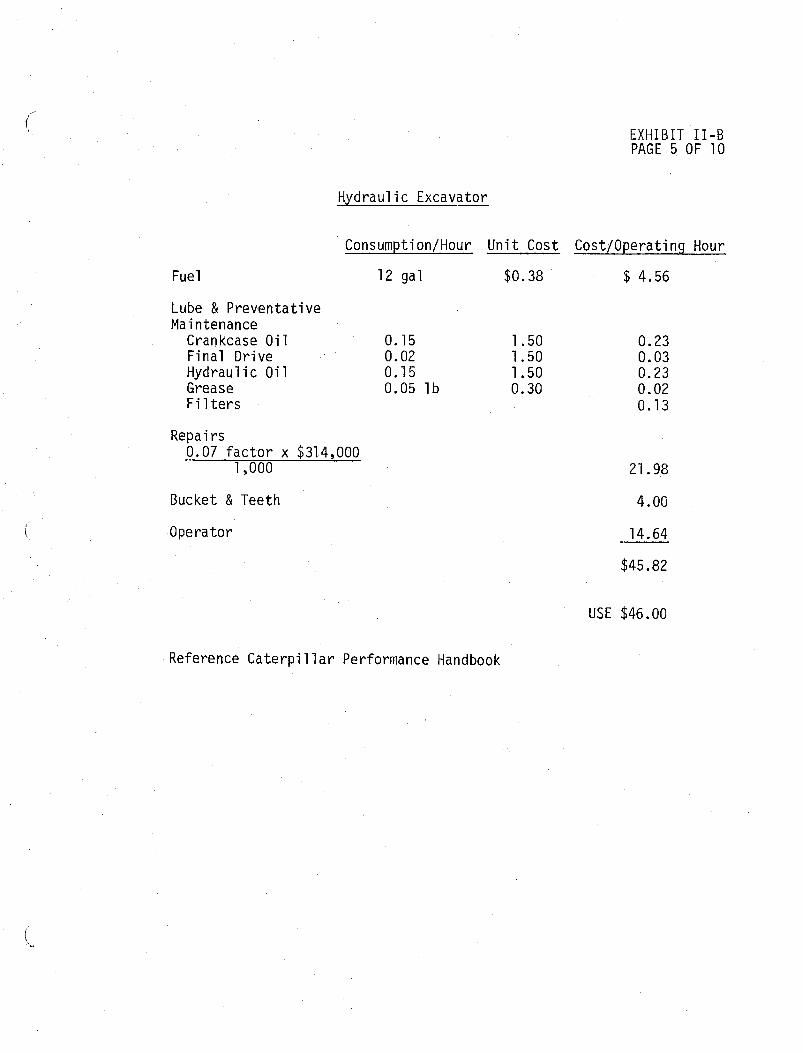
EXHIBIT 11-B PAGE 5 OF 10
Hvd rau l i c Excavator
Fuel
Lube & P reven ta t i ve Maintenance
Crankcase O i 1 F i n a l D r i ve Hyd rau l i c O i l Grease F i 1 t e r s
Repa i r s 0.07 f a c t o r x $314,000
1,000
Bucket & Teeth
i Opera t o r
Consumption/Hour U n i t Cost Cost/Operat ing Hour
12 ga l $0.38 $ 4.56
USE $46.00
Reference C a t e r p i l l a r Performance Handbook

EXHIB IT 11-B PAGE 6 OF 10
35-Ton Hauler
Fuel 10.2 g a l / h r x $0.38/ga1
Cost/Operat ing Hour
$ 3.88
Lube 0.93
Repairs Maintenance & Repair Fc[Pf + ( L f x MW)] ' Fc = 10.2 P f = 0.577 L f = 0.0527 Mw = 8.60 x 1.40 = 12.04 M&R 10.2[0.577 + (0.0527 x 12.04)] 12.36
T i r e s L i f e = 4,000 h rs Cost = 1,098 x 6 = $6,588
Opera t o r 12.84
USE $32.00
Reference Wabco Cost ing Method

E X H I B I T 11-B PAGE 7 OF 10
Motorgrader - 16 F t Moldboard
Consumption/Hour U n i t Cost Cost/Operating Hour
Fuel 9 .5 gal $0.38 $ 3.61
Lube & Preventat ive Maintenance
Crankcase Oi 1 Transmission Fl uid Final Drive Hydraul i c Oi 1 Grease Fi 1 t e r s
Ti res $6,437 @ 3,500 hrs
Operator 12.84
$26.48
USE $26.00
Reference C a t e r p i l l a r Performance Handbook

i EXHIBIT II-B PAGE 8 OF 10
Rubber-Tired Dozer
Cost/Operating Hour
Fue 1 11.2 ga l /h r x $0.38/ga1
Preventat ive Maintenance
T i r e s Life = 3,500 hrs Cost = $12,000
Repai r 0.09 ($150,600)
1,000
Opera t o r
$34.64
i USE $35.00
Reference C a t e r p i l l a r Performance Handbook

EXHIBIT 11-5 PAGE 9 OF 10
Fuel
Engine Oil
Transmission Oil
Final Drive
Hydraul i c O i 1
Grease
Fi 1 t e r s
Ti r e s Li fe = 4,000 hrs Cost = $11,840
Operator
50-Ton Water Truck
Consumption/Hour U n i t Cost Cost/Operating Hour
17.0 gal $0.38 $ 6.46
0.10 l b s 0.42 0.04
USE $38.00
Reference In terna t ional Earthmoving P r inc ip l e s

("" EXHIBIT 11-B PAGE 10 OF 10
Miscel laneous Equipment
Cost/Operat ing Hour
A i r Track D r i l l ( i nc l udes ope ra to r ) $34.56
Compressor
USE $35.00
$14.23
USE $14.00
12-Ton P r i 11 Truck (opera to r n o t i n c l uded) $13.93
USE $14.00
Reference "P re l im ina ry F e a s i b i l i t y Study, 12/77", Morrison-Knudsen i
Small Vehic les USE $ 6.00
Reference "Cost Reference Guide", Equipment Guide-Book Company
Medium S ize Vehic les $10.06
USE $10.00
Reference "Cost Reference Guide", Equipment Guide-Book Company

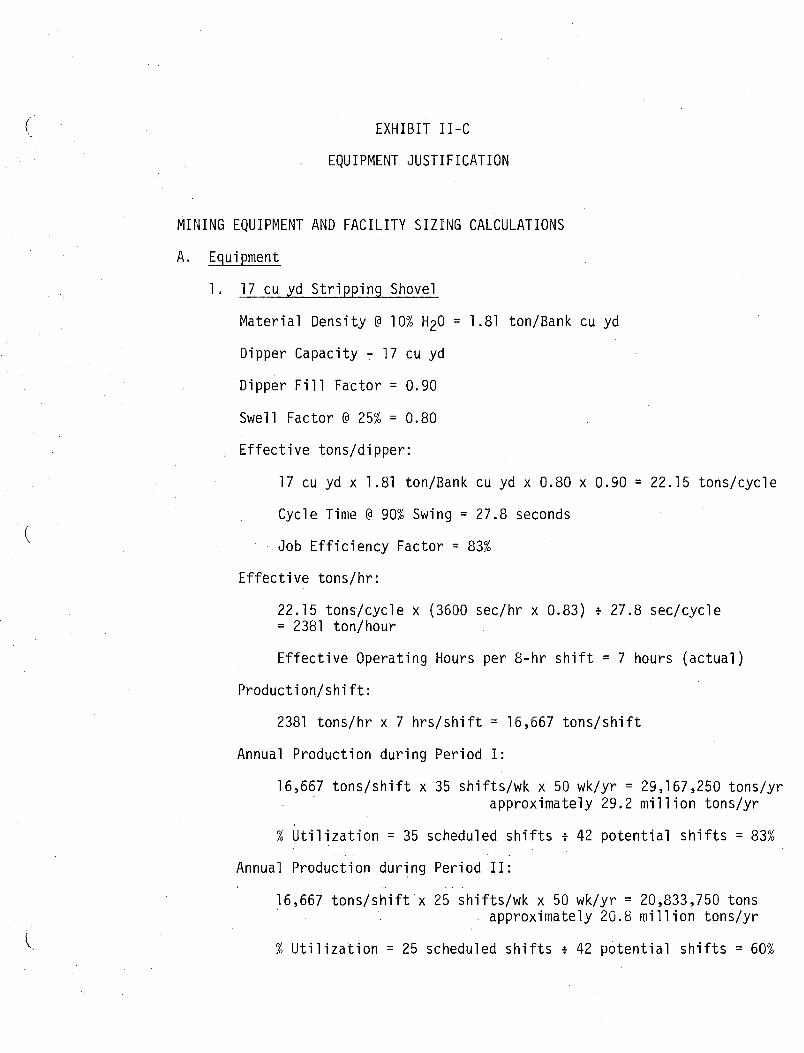
EQU I P
EXHIBIT 11-C
'MENT JUSTIFIC ATION
MINING EQUIPMENT AND FACILITY SIZING CALCULATIONS
A. Equipment
1. 17 cu yd Stripping Shovel
Material Density @ 10% Hz0 = 1.81 ton/Bank cu yd
Dipper Capacity - 17 cu yd
Dipper Fill Factor = 0.90
Swell Factor @ 25% = 0.80
Effective tons/dipper:
Cycle Time @ 90% Swing = 27.8 seconds
Job Efficiency Factor = 83%
Effective tons/hr:
Effective Operating Hours per 8-hr shift = 7 hours (actual )
Annual Production during Period I:
16,667 tons/shift x 35 shifts/wk x 50 wk/yr = 29,167,250 tonslyr approximately 29.2 million tons/yr
% utilization = 35 scheduled shifts t 42 potential shifts = 83%
Annual Production during Period 11:
16,667 tons/shift x 25 shifts/wk x 50 wk/yr = 20,833,750 tons . . approximately 26.8 m
% Utilization = 25 scheduled shifts t 42 potent
11 ion tonslyr
a1 shifts = 60%

Page 2 o f 15
i 2. F ron t Shovel
M a t e r i a l Weight: 2.71 m i l l i o n tons @ 15.45 cu f t / t o n 0.73 m i l l i o n tons @ 20.46 cu f t / t o n 3.44 m i l l i o n tons @ 16.51 cu f t / t o n
M a t e r i a l r equ i red per s h i f t = 4590 tons
Dipper F i l l ' Fac to r = 700% assumed
% Swel l Factor = 25%
Working t ime per s h i f t = 7 h r x 60 min x 60 sec = 25,200 sec
Tons per cu yd = 27 cu y d i (16.51 x 1.25)
F r o n t Shovel Product ion:
5 cu yd d i ppe r = 5 cu y d x 1.31 tons/bank cu y d = 6.55 tons ld ippeu
3 cu y d d i ppe r = 3 cu y d x 1.31 tons/bank cu y d = 3.93 tons/d ipper
Work e f f i c i e n c y = 0.83
c y c l e t ime = 35 sec
i a v a i l a b i l i t y = 0.75
5 cu yd: 6.55 x (25,200 x 0.83) i 35 x 0.75 = 2936 t o n s l s h i f t
3 cu yd: 3.93 x (25,200 x 0.83) i 35 x 0.75 = 1761 t o n s / s h i f t
4697 t o t a l t o n s / s h i f t
Sa fe t y f a c t o r : 4697 tons + 4590 tons = 1.02

Exhibit 11-42 Page 3 of 15
3. 120-ton Truck Fleet Estimation
Assumptions:
Material Density = 14,95 cu ft/ton
Shovel Production = 16,685 ton/shift x 2 = 33,700 total tons/shift
Truck Capacity = 120 tons
Time Available per Shift - 354 minutes per shift
Calculations:
tons/shift per unit = (min/shift x 120 tons/cycle) + mi
units required = (33,700 tons/shift shovel production) tons/shift/uni t
120-Ton Truck Requirements for Project Life
i Years of Accumulated Stripping Years Increments
Cycl e Time
Tons/ Shift
Units Requ i red
7.80
7.38
8.38
8.37
9.53
10.06
9,91
9.72
9.49
9.49
Units Req. (3 75% Avail.

E x h i b i t 11-C Page 4 o f 15
4. Rotary D r i l l s
10- inch, t r u c k mounted
Assumptions:
Preproduct ion and Product ion I: 29.2 x l o 6 t ons l yea r (years 1-5)
Product ion I I : 20.8 x l o 6 t ons l yea r (years 6-10)
Densi ty : , 14.95 ft3/ton
Schedul ed weekslyear: 50 weekslyear
D r i l l P r o d u c t i v i t y : 550 f e e t / s h i f t (maximum es t . d r i l l i n g r a t e )
Feet/hole: 50 f t bench p l u s 5 f t subgrade = 55 f t
D r i l l Pa t te rn : 25 f t (burden) x 30 f t (spac ing) p a t t e r n
x 50 f t bench
Ca l cu la t i ons :
(- Tons/hole = (25 f t x 30 f t x 50 f t ) + 14.95 ft3 t o n = 2,508.36 t o n s h o l e
Product ion Annual Tons
Required Required Scheduled U t i l i z a t i o n o f Tons/Week Shifts/Week Shifts/Week Scheduled S h i f t s
S t r i p p i n g a c t i v i t y w i l l r e q u i r e two r o t a r y d r i l l s scheduled f o r 30 s h i f t s
per week du r i ng Preproduct ion and Product ion I, and o n l y 17 s h i f t s pe r
week du r i ng Produc t ion 11.

Exhibit 11-C Page 5 of 15
(' 5. Ore Control D r i l l
Basis: 1 . Required Productivi ty = 2.71 mil 1 ion tons lyear secondary and i n t e r i o r waste
0.73 mi 11 ion tons lyear o re
2 . Average Density = 16.51 f t3 / ton
3 . Estimated average d r i l l pa t te rns = B x S x Depth
(A,) 10x1 0x1 0 (B) 15x15~15 ( c ) 20x20~20
4. Dr i l l Productivi ty ( f a i l ing 1000)
480 f t / 8 hr s h i f t ac tua l product iv i ty , includes a low job
e f f i c i ency due t o the many shallow holes and i r r e g u l a r nature
of d r i l l i n g . (Does not include machine a v a i l a b i l i t y ) .
5. 50 scheduled weekslyr
6. Required d r i l l holes per year = 3.44 mi l l ion tons/yr x 16.51
f t3 / ton + cu f t per d r i l l hole
56,794 16,828 7,099
7. F t d r i l l i n g l y r = d r i l l holes lyr x depth
8. Required d r i l l shif ts /wk = annual f t d r i l l i n g I 50 wk/yr
Recommendation:
Based upon an estimated average d r i l l pa t te rn of 15x15~15 and
applying an 85% machine a v a i l a b i l i t y , required shif ts /week a r e
Concl usion:
\ 1 (one) ore control d r i l l scheduled 15 shifts/wk

6. Min ing Dozer (R ipp ing)
E x h i b i t 11-C Page 6 o f 15
Basis: 1. 68,800 t /wk o r 4,587 t / s h i f t
2. 7 ope ra t i ng hours/8 hour schedule
3. 83% j o b e f f i c i e n c y
4. E f f e c t i v e a v a i l a b l e t i m e / s h i f t = 350 min
5. 2.71 m i l l i o n t o n s l y r secondary @ 15.45 BCF/ton 0.73 m i l l i o n t ons / y r o r e @ 20.46 BCF/ton
Weighted average m a t e r i a l d e n s i t y = 16.51 BCF/ton
6. Required panel per s h i f t 4,587 t o n s / s h i f t x 16.51 cu f t / t o n - 75,731 f t 3 / s h i f t @ 2 f t r i p p i n g depth = 37,866 sq f t / s h i f t 250 f t x 150 f t panel
7. C y c l e s / s h i f t based upon 2 f t r ' p p i g w id th ) 150 ft + 2 ft c y c l e + 250 ft + 3 f t 3 c y c l e = 200 c y c l e s l s h i f t
8. L i nea r f t r i p p i n g / s h i f t
75 cyc les x 250 f t + 125 cyc les x 150 f t = 37,500 f t / s h i f t
9. To ta l c y c l e t i m e / s h i f t r e q u i r e d
a ) F ixed t ime based on a maneuver t ime o f 0.5 m i n l c y c l e 0.50 rnin/cycle x 200 c y c l e s / s h i f t = 100 m i n / s h i f t
b ) Travel t ime based on average r i p p i n g speed o f 150 f t / m i n 37,500 f t / s h i f t 4 150 f t / m i n = 250 m i n / s h i f t
Required c y c l e t i m e l s h i f t = 350 min
Recommendation:
U n i t s r e q u i r e d per s h i f t = Required c y c l e t i m e / s h i f t + e f f e c t i v e a v a i l a b l e t i m e / s h i f t
Down t ime due t o machine a v a i l a b i l i t y (est imated a t 75%) can be adequate ly covered du r i ng t h e non-schedul ed min ing s h i f t s , ( i . e. , machine u t i l i z e d o n l y 15 o u t o f 21 p o t e n t i a l s h i f t s ) . Backup i s a v a i l a b l e f rom t h e dozers assigned t o p ioneer work.
Concl us i o n :
c. 1 (one) t r a c k dozer w i t h r i p p e r scheduled 15 s h i f t s per week

Exhibit 11-C Page 7 of 15
('- 7. Track Dozer and Rubber-Tired Dozer
( 3 dozers)
1. Rubber-tired dozer i s allocated for pushing newly blasted material
and will also clean u p rock s p i l l s on haul roads and mining areas,
and the working area around the shovel.
2. Dump Dozer - 1 dozer will be required on the waste dump t o push the
material over the side and create a safety berm. I t will also be
util ized to maintain the level dumping area.
3. Pioneer Dozer - 2 dozers are scheduled to prepare access d r i l l roads
and preliminary levels. These two dozers will provide backup for the
dump and mining dozers. In the l a t t e r years of the mine l i f e , one
dozer will be transferred to the mining backfill dump.

Exhibit I I-C Page 8 of 15
8. 35-Ton Truck F lee t Estimation
Assumptions:
Annual Production = 3.44 mi l l ion tons
S h i f t Production = 3 . 4 4 m i l l i o n tons t 5 0 w k l y r 15 sh i f t s lwk
= 4590 t o n s l s h i f t
Truck Capacity = 35 tons
Time Available/ s h i f t = 354 min/shif t
Average cycle time = 20.4 min (Orelwaste haul s )
Calculat ions:
Units required = 4,590 t o n s / s h i f t + 607.4 = 7.56 o r 8 units (
Units required @ 75% f l e e t .
a v a i l a b i l i t y = 10.08 o r 10 units

( 9. Motorgrader
E x h i b i t I L C Page 9 o f 15
1. Length o f Hauls:
Width S t r i p p i n g 6,000 f t ( 2 shovels) 90 f t Min ing-ore r u n 5,600 f t 90 f t Mining-waste 3,300 f t 90 f t
TOTAL 14,900 f t = 2.82 m i l e s 90 f t
2. T rave l Speed:
1 s t gear forward = 2.4 mph 1 s t gear reverse = 3.9 mph
Average Travel Speed (4.8 x 3.9) i (2.4 + 3.9) = 18.72 = 2.97 rnph 6.3
3. Required B lad ing (assume 12 f t o f b lade sur face) :
(2.82 m i l e s ) ( 9 0 f t / 1 2 f t ) = 21.15 m i l e s
4. Blade P roduc t i on /Sh i f t (assume 83% j o b e f f i c i e n c y ) : i
(2.97 mph) (7%hr /sh i f t ) (0 .83) = 18.49 m i l e s / s h i f t
5. Blades Requ i red /Sh i f t :
21 . I 5 m i l e s + 18.49 m i l e s / s h i f t = 1 . I 4 blades
6. Blades Required @ 75% A v a i l a b i l i t y :
1 . I 4 I 0.75 = 1.53 blades
:-. Use 2 Motorgraders

E x h i b i t 11-C Page 10 o f 15
10. Water Truck
Area r e q u i r e d t o cover:
Area ( ~ t ~ ) S t r i p p i n g
Roads 6,000 f t x 60 f t 360,000 Dumps 1,000 P i t s 2,000
Min ing Roads - Ore 5,600 f t x 50 f t Roads - B a c k f i l l 3,300 f t x 50 f t Stockpi 1 e
TOTAL 809,000
Coverage = 25 f t l p a s s :
2 L i nea r Coverage = 809,000 f t x 3 passes = 97,080 f t
7r; f f
Speed - 17 mph
Spray Time = 10,000 ga l t (1,500 g a l l m i n x 0.5) = 13 min
Time Required per Pass:
F i x and f i l l t ime @ 400 gpm 30 min Travel t ime 15 Spray t ime 13
TOTAL 58 m i n / t r i p
Water Schedul e:
Day S h i f t 4 Swing 3 Graveyard - 2
Average 3 passes (used above)
U n i t s Required:
Coverage/Trip = 13 min x 17 mph x 5,280 f t / m i x h r /60 min = 19,448 f t / t r i p
Time t o cover - 97,080 f t r 19,448 f t / t r i p x 58 m i n l t r i p = 290 min
Add 3 h r s (180 min) t o cover m i l 1 and o f f i c e
U n i t s Required (75% a v a i l a b i l i t y ) = (290 min t 180 min ) I 373 m i n l s h i f t + 0.75 = 1.68 u n i t s l s h i f t
,'r Use 2 U n i t s

Exhibit I I-C Page 11 of 15
11. 12-Ton Pri l l Truck
Basis: 1. Preproduction and Production I (highest stripping period)
2 . 11,641 holeslyr + 50 wklyr = 233 holes/wk
3. Capacity based upon certain periods when loading 100% dry holes.
4. Tons ANFOIwk = 838 iblhole x 233 holeslwk t 2000 lb/ton = 97.63 tonslwe
5. Pri l l truck scheduled 5 shiftslwk = 19.53 tons/shift - OR 10 tons ANFO/shift/blast-site
Recommendations :
A pr i l l truck with a 10-ton tank would adequately cover each d r i l l with a single t r i p under ful ly dry loading conditions during the highest productivity periods of the mine.
The following points just i fy going t o the next larger commercial t a n k size,which i s a 12 ton :
1 . A t 98% capacity with a 10-ton tank when servicing each blast ( s i t e with a single t r ip . Any change in rock type and powder
factor may require an additional t r i p .
2 . Amerind-MacKissic's capital cost sheets indicate the extra 20% capacity will cost only 1% over the smaller 10 ton truck.
Concl usion:
1 (one) 12-ton pr i l l truck

E x h i b i t 11 -C Page 12 o f 15
B. F a c i l i t i e s
1 AN P r i l l Storage
Basis:
1. 1-week s torage
2. Highest s t r i p p i n g p e r i o d (p reproduc t ion & p roduc t i on I)
3. Dry l oad ing c o n d i t i o n s - b l a s t i n g 100% ANFO
4. Required Tons AN P r i l l / w k = 91.7 (233 holes/wk x 787 1 bs AN/hole t 2000 1 b/ ton)
Recommendations:
1. Mu1 t i p l e tanks - a l l ows t h e c a p a b i l i t y o f p e r i o d i c a l l y c l ean ing and r e p a i r i n g one w h i l e o thers remain i n serv ice . S t r u c t u r a l damage which would b r i n g t h e s torage tank o u t o f s e r v i c e i s much l e s s l i k e l y w i t h m u l t i p l e tanks.
2. Storage capac i t y f a c t o r - 20%
. (. Considers t h e p o s s i b l e inc rease i n powder consumption du r i ng t h e s t r i p p i n g o f harder than average rock cond i t i ons . 91.7 tons/wk x 1.20 = 110 t o n c a p a c i t y
3. Design cons idera t ions - Amerind-Mackissic recommends two i d e n t i c a l s torage u n i t s o f 60-ton capac i t y each.
Conclusion:
( two) 2 60-ton v e r t i c a l s torage u n i t s

Exhibit 11-C Page 13 of 15
2 . Explosives Magazine
Basis:
I . I-week of storage of slurry
2 . 2 weeks storage of anci l lary explosives, most specif ical ly primers and primer cord.
3. Highest str ipping period (preproduction 81 production I )
4. Loading condition - temporary severe conditions of wet holes, estimated a t 2x the average 25% giving 2 x 25% x 233 holes/wk = 117 holes/wk
5. Blasting caps are stored separate and d is tan t from the above explosive magazine. Cap storage i s necessary b u t incidental.
6. Slurry storage: 117 holes/wk x 1072 lbs/hole s 65.6 Ibs/cu f t = 1912 cu f t 1912 cu f t i 6 f t high pi les = 319 sq f t
7. Primers and Primer cord storage:
Primer storage = 932 primers t 60/case x 4.5 cu f t /case = 70 cu f t 70 cu f t t 6 f t high p i les = I2 sq f t
Primer cord12 wk = 466 holes12 wk x 105 f t /ho le = 48,930 f t
Primer cord storage = 48,930 f t i 1000 f t l ca se x 1 cu f t / case = 49 cu f t 49 cu f t + 6 f t high pi les = 8 sq f t
Total primers and primer cord storage = 20 sq f t
Recommendation:
(based on Tab1 e 30-3, D u P o n t Blaster ' s Handbook, p. 463)
Concrete block magazine, 16 x 26 f t outside dimensions with 336 cu f t of inside space.
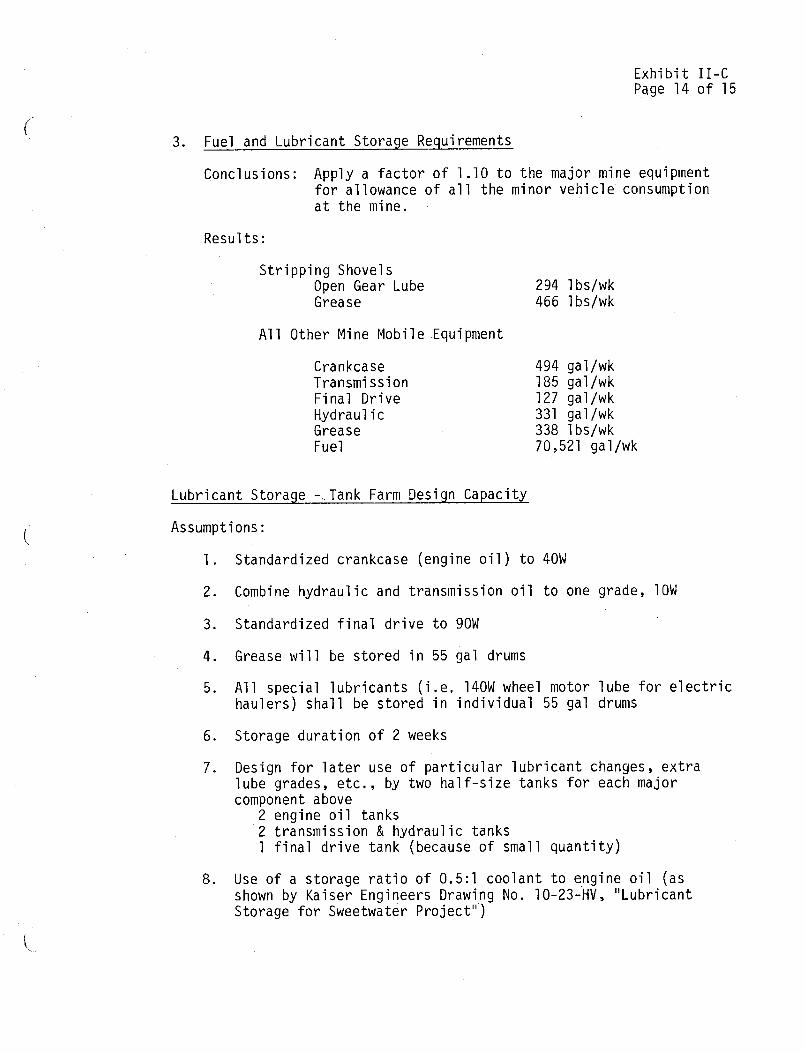
Exhi bi t I I-C Page 14 of 15
3. Fuel and Lubricant Storage Requirements
Conclusions: Apply a factor of 1 . I0 t o the major mine equipment for allowance of a l l the minor vehicle consumption a t the mine.
Results:
Stripping Shovel s Open Gear Lube Grease
All Other Mine Mobile Equipment
Crankcase Transmi ssion Final Drive Hydraul i c Grease Fuel
494 gal/wk 185 gallwk 127 gal/wk 331 gal/wk 338 lbs/wk 70,521 gal /wk
Lubricant Storage -,Tank Farm Design Capacity
Assumptions:
1. Standardized crankcase (engine o i l ) t o 40W
2. Combine hydraulic and transmission o i l t o one grade, 10W
3 . Standardized f inal drive to 90W
4. Grease will be stored in 55 gal drums
5. All special lubricants ( i .e . 140W wheel motor lube for el haulers) shall be stored in individual 55 gal drums
ec t r i c
6 . Storage duration of 2 weeks
7. Design for l a t e r use of particular lubricant changes, extra lube grades, e t c . , by two half-size tanks for each major component above
2 engine o i l tanks 2 transmission & hydraulic tanks 1 final drive tank (because of small quantity)
8. Use of a storage r a t i o of 0.5:l coolant t o engine o i l (as shown by Kaiser Engineers Drawing No. 10-23-HV, "Lubricant Storage for Sweetwater Project" )

E x h i b i t 11-C Page 15 o f 15
Lub r i can t Storage - Tank Farm Design Capaci ty (con t inued)
Tanks Lub r i can t U n i t Capaci ty To ta l Capac i ty ga l ga l
2 Engine O i l (40W) 500 1000
2 Transmission and Hydrau l i c O i l (10W) 500
1 F i n a l D r i v e (90W) 300
1 Coolant 500 500
Fuel Storase - Pro.iect Consum~t ion
P o i n t o f Use Two Weeks Supply Fuel Type gal
Mine Mob i le Equipment 141,042 #2
M i l l B o i l e r s * 52,752 #2
ANFO Exp los ive Mix 3,357 #2
*Ramon P izar ro , Morrison-Knudsen Used Ross M i l l i n g Report, p.523 as bas i s M i l l consumption - average f o r leaching, so l ven t e x t r a c t i o n ,
p r e c i p i t a t i o n , e t c . 157 g a l / h r x 24 h r x 14 days = 42,752 gal12 wks #2 D iese l Fuel (140,000 B tu / ya l )
Fuel Storage - Tank Farm Design Capaci ty
Tanks Fuel Type U n i t Capaci ty T o t a l Capaci ty ga l
2 Diesel #2 100,000 200,000

E X H I B I T 11-D MIN ING ASSUMPTIONS AND FACTORS

EXHIBIT 11-D
MINING ASSUMPTIONS A N D FACTORS
Densities:
The following assumptions and factors were used t o s ize equipment and
calculate operating costs for the Anderson Project:
a. Equipment Production Factors
(1) SAE Dipper Capacity Ratings were used.
( 2 ) Dipper Fi l l Factors:
17-yd stripping shovels = 0.90 3- & 5-yd mine excavators = 1.00
( 3 ) Job Efficiency Factor = 0.83
(4) Haulage Truck Fleet Availabil i ty = 0.75
(5) Percent Util ization = Schedule Shif ts Potential Shif ts
(6 ) Effective Operating Hours per Shif t :
Scheduled hours per s h i f t - (112 hr lunch and change of s h i f t and travel t o work s i t e and l o s t time)
( 7 ) Haulage Truck Cycle Times:
Phase I haulage cycle times were used and adjusted according t o new increments and approximate times were generated
(8) Loading Cycle Times:
17-yd stripping shovel: 27.8 seconds 3- & 5-yd mine excavators: 35 seconds
b. Material Factors
Condition
Primary Stripping: 14.95 cu f t / ton Secondary Stripping: 15.45 cu f t / ton
Bank, wet (10% H20) Bank, wet (10% H20)

EXHIBIT 11-D PAGE 2 OF 2
Condition
I n t e r i o r Waste: 15.45 cu f t / t o n Bank, wet (10% H20) Ore @ 20.46 cu f t / t o n In Bank, dry
Swell Factor @ 25% = 0.80 ( f o r a l l above c l a s s e s of m a t e r i a l )
Equipment Cost Estimating Factors:
(1 ) Fuel Cost: 38$/gal
( 2 ) Operator, pa r t s and mai ntenance normal l y i ncl uded i n operat ing cos t per hour
( 3 ) Hourly Wage Rates:
Craftsman - $9.15 Operator-Repairman - 8.60 He1 per - 8.10 Trai nee - 7.05
c. Labor Burden
Hourly: 40% Salary: 23%
d. Mine Spare Par t s
8% of i n i t i a l mine c a p i t a l