accessing the anti-proliferating activity of tankyrase-2...
TRANSCRIPT
© 2017 Mervat H. El-Hamamsy. This is an open access article distributed under the terms of the Creative Commons Attribution License -NonCommercial-ShareAlikeUnported License (http://creativecommons.org/licenses/by-nc-sa/3.0/).
Journal of Applied Pharmaceutical Science Vol. 7 (12), pp. 014-027, December, 2017
Available online at http://www.japsonline.com
DOI: 10.7324/JAPS.2017.71203
ISSN 2231-3354
Accessing the Anti-Proliferating Activity of Tankyrase-2 Inhibitors
via 2D, 3D-QSAR and Molecular Docking: Assessment of Structure
Activity Relationships
Mervat H. El-Hamamsy
Department of Pharmaceutical Chemistry, Faculty of Pharmacy, Tanta University, El Giesh street, 31527, Tanta, Egypt.
ARTICLE INFO
ABSTRACT
Article history:
Received on: 11/07/2017
Accepted on: 12/09/2017
Available online: 30/12/2017
Tankyrases (TNKSs) have been implicated in many biological processes and have been proposed as a drug
target for cancer therapy. The human genome encodes two homologous isoforms, TNKS-1 and TNKS-2. This
study reported the first theoretical study of three-dimensional, two-dimensional quantitative structure activity
relationships and a docking analysis of a series of 2-arylquinazolin-4-one, 3-arylisoquinolin-1-one,
arylnaphthyridinone and aryltetrahydronaphthyridinone derivatives with remarkable TNKS-2 inhibiting
activities reported recently in literatures. The predictive ability of the QSAR models was assessed using internal
and external validation. 3D-QSAR model showed that the substituents R1 and R2 in studied compounds are key
modulators to enhance the TNKS-2 inhibition. The 2D-QSAR model, was based mainly on three 2D descriptors
and nine 3D descriptors. This suggested that TNKS-2 inhibition is predominantly controlled by steric properties
of the inhibitors. Docking study was carried out by using ligands docking on the active site of three different
crystal structures of TNKS-2 to understand the binding mode of these compounds as TNKS-2 inhibitors. We
discussed the structural requirements for selective and potent TNKS-2 inhibitors. Four potent inhibitors were
designed to be synthesized in the future.
Key words:
Tankyrase, QSAR, Docking,
2-arylquinazolin-4-one, 3-
arylisoquinolin-1-one,
arylnaphthyridinone.
INTRODUCTION
Tankyrase (TNKS) was first identified in 1998 and
found to interact with telomeric repeat binding factor (TRF1), a
protein that binds to and protects the telomeric DNA. The human
genome encodes two homologous isoforms, TNKS-1 and TNKS-
2 (Karlberg et al., 2010; Lehtiö et al., 2008). TNKSs are PARP
(poly ADP-ribose polymerase) enzymes that produce poly(ADP-
ribose) (PAR) to regulate multiple distinct cellular processes,
including telomereelongation (De Rycker and Price, 2004; Riccio
et al., 2016), control of the mitotic checkpoint and mediation of
insulin-stimulated glucose uptake (Chi and Lodish, 2000).
TNKSs serve as an associated protein in the Wnt signal
transduction pathway (Martino-Echarri et al., 2016). As soon as
TNKSs are positive telomerase regulators, inhibiting them
reduces telomerase activity, enhances telomere shortening, and
* Corresponding Author
E-mail: mhamamsy @ pharm.tanta.edu.eg
may have an overall inhibitory effect on cancer (Lehtiö et al.,
2008; Martino-Echarri et al., 2016). XAV939 was the first high
potency TNKS inhibitory molecule identified (Haikarainen1 et al.,
2016; Karlberg et al., 2010). TNKS-1 and TNKS-2 share 82%
sequence identity and similar secondary structure (Barkauskaite et
al., 2015; Haikarainen1 et al., 2016). TNKS-2 exists as dimmer
with two identical subunits. Each subunit is comprised of four
distinct domains: catalytic, ankyrin-repeat, sterile alpha motif, and
N-terminal domains. The catalytic domain of TNKSs consists of
two anti-parallel β-sheets surrounded by four α-helices
(Haikarainen1 et al., 2016; Lehtiö et al., 2008). The catalytic
domain of TNKSs consists of a donor site and an acceptor site. The
donor site can be divided into two parts, the nicotinamide and
adenosine subsites. The catalytic domain includes three central
amino acids (the conserved HYX triad) that are situated near the
nicotinamide subsite. These residues are His1031, Tyr1060,
Glu1138 for TNKS-2 (Haikarainen1 et al., 2016; Karlberg et al.,
2010).

Mervat H. El-Hamamsy / Journal of Applied Pharmaceutical Science 7 (12); 2017: 014-027 015
TNKSs have been implicated in many biological
processes and has been proposed as a drug target for cancer
therapy. Altered levels of TNKSs expression have been reported in
lung cancer (Wang et al., 2016), breast cancer (Gelmini et al.,
2004), gastric cancer (Gao et al., 2011), bladder cancer (Gelmini et
al., 2007), brain tumors (La Torre et al., 2013), colon carcinoma
(Waaler et al., 2012) and pancreatic adenocarcinoma (Lehtiö et al.,
2013). TNKSs inhibitors were classified into three main groups
(Liscio et al., 2014);i) compounds that bind to nicotinamide
subside and working as nicotinamide isosteres (Wahlberg et al.,
2012) such as lactam-based pyrimidin-4-one (XAV939) (Huang et
al., 2009) and non-lactam inhibitors (Shultz et al., 2013), ii)
compounds that bind to adjacent induced pocket of the enzymes,
adenoside sub-site, (Gunaydin and Huang, 2012; Bregman et al.,
2013) and iii) dual binder compounds that simultaneously occupy
both sites aforementioned (Hua et al., 2013).
Quantitative structure activity relationships (QSAR) are a
mathematical model of statistical correlation between the variation
in chemical structure (represented by molecular descriptors) and
biological activity profile of a series of compounds. Molecular
descriptors are either two-dimensional (2D) or three-dimensional
(3D) (Todeschini et al., 2009). 2D and 3D-QSAR models help to
understand the non-bonding interaction characteristics between the
drug molecule and active site of the target site (Li et al., 2013). On
the other hand, molecular docking studies provide the possible
binding conformations of the ligands in a receptor. Combined with
QSAR, they can provide information for designing new potential
drugs (Jain et al., 2012; Villalobos et al., 2013).
In this computer-aided drug design study, a series of 2-
arylquinazolin-4-one (A) (Nathubhai et al., 2016), 3-
arylisoquinolin-1-one(B)(Paine et al., 2015), arylnaphthyridinone
(C) and aryltetrahydronaphthyridinone (D)derivatives (Kumpan
et al., 2015)with remarkable TNKS-2 inhibiting activities reported
recently in literatures together with XAV939 (E) (Figure 1) were
chosen to perform the first combined 2D, 3D-QSAR and docking
studies. The aim of this work is to establish the first reliable 2D
and3D-QSAR models to assess the structure activity relationships
and to provide a guideline for designing novel anticancer TNKS-2
inhibiting drugs.
MATERIALS AND METHODS
Dataset
The dataset of 62 compounds, including XAV939 was
retrieved from literatures (Kumpan et al., 2015; Nathubhai et al.,
2016; Paine et al., 2015). The selected compounds for the data set
shared the same assay procedure, with significant variations in
their structures and potency profiles. They had IC50 values varying
from 1.1 to 6200 nM (Kumpan et al., 2015; Nathubhai et al., 2016;
Paine et al., 2015). These were then converted into their negative
logarithmic units, pIC50, values [pIC50= -Log IC50 (M)].3D
structures were drawn and geometry optimized using Marvin
Sketch V5.11.5 (ChemAxon, 2017).
3D-QSAR, CoMFA
The optimized structures were imported to SYBYL-X 2.1
(Sybyl, 2017) in *Mol2 file format. All compounds were
minimized under the Tripos standard (TS) force field (Clark et al.,
1989) with Gasteiger-Marsili atomic partial charges (Gasteiger and
Marsili, 1980). Minimizations were done using the Powell method,
in which calculations were set to terminate at an energy gradient
value of 0.01 kcal/mol. A genetic algorithm with linear assignment
of hypermolecular alignment of datasets (GALAHAD®) is
regarded as a superior tool for molecular alignment compared with
classical common structural alignment (Zhao et al., 2011).
Fig. 1: General structures of 2-arylquinazolin-4-one (A), 3-arylisoquinolin-1-one derivatives (B) arylnaphthyridinone (C), aryltetrahydronaphthyridinone (D)
and XAV939 (E) used in this modelling study.

016 Mervat H. El-Hamamsy / Journal of Applied Pharmaceutical Science 7 (12); 2017: 014-027
The optimized structures were aligned using the “flexible
alignment of ligands to each other” option in GALAHAD and set
template molecule area to No template. The other parameters for
calculation were set to default values. The chemical structures and
biological activities of our dataset are shown in Table 1. For the
development of 3D-QSAR model the dataset (62 compounds) was
divided into a training set (44 compounds) to generate the model
and a test set (18compounds) to evaluate the predictive ability of
the resulting model.
2D-QSAR
Data preparation and descriptor selection
The 3D-geometry of the compounds were built and
energy minimized with Marvin 5.11.5software (ChemAxon 2017),
and then further optimized by Molecular Operating Environment
software (MOE version 2014.0901) (MOE, 2017). 2D and internal
3D descriptors for which alignment is not required were calculated
for the data set using QuaSAR module of MOE software (MOE,
2017; Zhao et al., 2011). 2D descriptors only use the atoms and
connection information of the molecule for the calculation while
3D coordinates and individual conformations are not considered.
Internal 3D descriptors use 3D coordinate information about each
molecule; however, they are invariant to rotations and translations
of the conformation. To select the predominant descriptors
affecting the activity of our data set, the descriptors (150 2D + 90
3D-descriptors) were calculated for each molecule in the series and
were reduced by eliminating out the descriptors with constant and
near-constant values. Seven QuaSAR models were generated for
each set of 2D-descreptors. Four QuasAr models were generated
for each set of i3D-descreptors. Seven compounds with Z-score
more than 2.5 were in the outlier and were eliminated from the
data set. To reduce the number of descriptors considered for the
study, both descriptors-contingency (a statistical application
designed to assist in the selection of descriptors for QSAR) and
correlation matrix were performed to limit the number
of descriptors. A final set of three 2D-descriptors and nine i3D-
descriptors were identified to be significantly affecting pIC50 and
was used in the construction of our QSAR model (Lakhlili, et al.,
2016). The QuaSAR- module in MOE was used to generate the
PLS QSAR model (MOE, 2017). Finally, the report of calculation
was obtained and the model was saved as (*.FIT) file and was
used to predict the activities of the test data set for external
validation.
Model validation
Each obtained model (2D-QuaSAR and CoMFA models)
was subjected to internal and external validation using the reported
validation parameters of QSAR models (Gramatica, 2007; Roy,
2007). These parameters include root mean square error (RMSE),
cross-validated RMSE, squared correlation coefficient(R2) and
cross-validated R2 (Q
2 in case of CoMFA) for the training set in
addition to R2 value of the test set.
Molecular docking
Molecular docking study was performed on selected
inhibitors using two different softwares, FlexX module in LeadIT
2.2.0package (BioSolveIT, 2017) and MOE 2014.0901(MOE,
2017). The ligands were docked within the active site of 3
different crystal structures of TNK-2 available in the PDB (PDB
code: 3U9H) (Protein data bank, 2017), (PDB code: 4UX4)
(Protein data bank, 2017), and (PDB code: 3KR8) (Protein data
bank, 2017).
The native ligand was removed, and the nicotinamide
binding site was defined as all atoms within 8˚A of the
crystallographic ligand. Hydrogens were added to amino acid
residues and all crystallographic water molecules were removed.
Docking with flexible ligands and rigid protein was performed
using standard parameters except that the number of runs was 20.
The scoring function is used for ranking the docked ligands into
the active site (Tables 1a, b & c).
Table 1a: Experimental and predicted biological activities and residual values obtained by the CoMFA and 2D-QuaSAR models from training set and (test) set of
compounds 1-8.
Dock score*
(clash)
Resid
Value
QuaS- AR
Pred. pIC50
QuaS- AR
Resid
Value
CoM- FA
Pred.
pIC50
CoM- FA
pIC50
IC50
nM R1 X,V, Y NC
General chemical
structure
-33.34(3.00) -0.26 5.56 -0.22 outlier 5.30 5×10³ H X=N 1
- -0.16 6.04 0.25 5.64 5.89 1.3×10³ H V=N 2
- - outlier -0.20 outlier 5.21 6.2×10³ CH3 Y=N 3
-31.59(4.12) - outlier 0.00 7.01 7.01 97 H 4
-32.92(3.72) -0.90 9.86 (test) -0.37 9.33 (test) 8.96 1.1 OCH3 5
- -0.10 8.92 (test) 0.08 8.74(test) 8.82 1.5 CF3 6
-32.49(4.19) -0.17 7.85 -0.13 7.81 7.68 21 Cl 7
-32.51(4.18) 0.12 8.09 0.31 7.90 8.21 6.1 Br 8
NC: number of compounds.
test set compounds are indicated for each model under the predicted values for each between practices.
*docking scores and (clashes) of some compounds docked on crystal structure 3KR8 using LeadIt.

Mervat H. El-Hamamsy / Journal of Applied Pharmaceutical Science 7 (12); 2017: 014-027 017
Table 1b: Experimental and predicted biological activities and residual values obtained by the CoMFA and 2D-QuaSAR models from training set and (test) set of compounds 9-49.
Dock
score* (clash)
Resid
Value
QuaSAR
Pred.
pIC50
QuaSAR
Resid
Value
CoMFA
Pred.
pIC50
CoMFA
pIC50 IC50nM R2 R1 NC General chemical
structure
-33.87(2.70) 0.04 5.95(test) -0.29 6.28(test) 5.99 1029 OCH3 H 9
- -0.44 7.22 -0.20 6.98 6.78 167 OCH3 CH3 10
- -0.30 7.36 0.03 7.03 7.06 87 OCH3 CF3 11 -33.18(1.84) -0.199 7.40 0.49 6.72 7.21 62 OCH3 Cl 12
- -0.101 7.07 -0.13 7.10 6.97 106 OCH3 Br 13
- -0.19 6.53(test) -0.07 6.41(test) 6.34 459 OCH3 F 14 - 0.137 5.92 -0.14 6.20 6.06 863 OCH3 NO2 15
-35.32(4.75) -0.27 6.23 -0.62 6.59 5.97 1076 OCH3 NH2 16
-32.99(2.53) 0.55 6.33 -0.07 6.96 6.89 128 OCH3 OCH3 17 -32.83(2.45) -0.62 6.28 -0.27 5.93 5.66 2200 H H 18
- -0.008 6.28(test) 0.10 6.17(test) 6.27 540 H CH3 19
-34.00(2.24) -0.37 7.52 0.24 6.64 6.88 133 H CF3 20
-33.32(2.45) 0.44 6.83(test) 0.49 6.78(test) 7.27 54 H Cl 21
- -0.22 7.21 0.11 6.88 6.99 101 H Br 22
- 0.002 5.96(test) -0.18 6.14(test) 5.96 1102 H F 23 - 0.496 6.09 -0.27 6.86 6.59 259 H NO2 24
- 0.04 6.12(test) -0.45 6.61(test) 6.16 690 H NH2 25
- -0.48 6.69 0.12 6.09 6.21 611 H OCH3 26 -31.42(3.95) 0.25 6.19 0.60 6.12 6.72 189 H OH 27
-36.46(2.10) 0.26 7.08 0.07 7.28 7.35 45 H CH2NH-Cbz 28
-30.61(2.92) -0.25 6.99 0.29 6.45 6.74 180 OH H 29 - -0.16 7.51 0.51 6.85(test) 7.36 44 OH CH3 30
-31.72(3.17) 0.04 7.56 0.27 7.33(test) 7.60 25 OH CF3 31
-31.07(2.93) 0.03 7.27 0.02 7.29 7.31 49 OH Cl 32 -31.18(2.93) -0.03 7.85 0.41 7.41 7.82 15 OH Br 33
- -0.30 6.88 -0.07 6.65 6.58 263 OH F 34
- -0.27 6.99 -0.38 7.01 6.72 191 OH NO2 35 -33.58(4.16) 0.26 6.39 -0.10 6.76 6.66 219 OH NH2 36
- 0.13 6.94(test) -0.18 7.25(test) 7.07 86 OH OH 37
- -0.25 7.62 0.05 7.33 7.38 42 CH3 H 38 -35.21(4.19) 0.41 7.73 0.10 8.05 8.15 7 CH3 CH3 39
-34.37(4.12) 0.11 7.88 -0.07 8.07 8.00 10 CH3 CF3 40
-33.14(5.74) outlier -0.68 8.16 7.48 33 CH3 Cl 41 -33.49(3.80) 0.38 7.83 -0.06 8.28(test) 8.22 6 CH3 Br 42
- 0.08 7.30 -0.15 7.55 7.40 40 CH3 F 43
- 0.32 7.19 0.24 7.28 7.52 30 CH3 NO2 44 -39.17(3.07) - outlier 1.04 7.48 8.52 3 CH3 NH2 45
- 0.76 7.15 -0.12 8.04 7.92 12 CH3 OCH3 46
-35.34(3.99) 0.67 7.54 0.24 7.98 8.22 6 CH3 OH 47 -37.16(3.64) -0.30 7.43 -0.16 7.30 7.14 73 CH3 CH2NH-Cbz 48
- -0.23 7.59 0.00 7.37 7.37 43 CH3 CH2N+H3Br- 49
NC: number of compound. test set compounds are indicated for each model under the predicted values for each between practices.
*docking scores and (clashes) of some compounds docked on crystal structure 3KR8 using LeadIt.
Table 1c: Experimental and predicted biological activities and residual values obtained by the CoMFA and 2D-QuaSAR models from training set and (test) set of compounds 50-62.
Dock score*
(clash)
Resid
Value
QuaSAR
Pred.
pIC50
QuaSAR
Resid
Value
CoMFA
Pred.
pIC50
CoMFA PIC50 IC50nM R2 R1 NC
- 0.10 7.36 -0.36 7.83 7.47 34 NH2 4-MePh 50
- 0.28 8.61(test) 0.24 8.65(test) 8.89 1.3 CH3 4-MePh 51
- 0.02 8.02 -0.23 8.28(test) 8.05 9 CH3 4-F3CPh 52 - 0.31 6.73(test) -0.30 7.34(test) 7.04 91 CH3 3-ClPh 53
- - outlier -0.35 7.84(test) 7.49 32 CH3 4-ClPh 54
-25.56(10.08) - outlier -0.15 6.23 6.08 836 CH3 2,6-Cl2Ph 55 -39.56(4.01) -0.29 8.31 0.32 7.70 8.02 9.6 CH3 4-PhC≡CPh 56
-34.26(3.18) 0.90 6.64(test) 0.44 7.10(test) 7.54 29 CH3 Pyridin-4-yl 57
-29.40(2.61) -0.17 7.89 -0.07 7.79 7.72 19 CH3 Thiophen-3-yl 58
-33.99(2.02) 0.47 7.94 0.55 7.87(test) 8.42 3.8 F 4-MePh 59
- - outlier -0.29 8.58 8.29 5.1 OCH3 4-MePh 60
- 0.35 7.36 0.66 7.06 7.72 19 CH3 Ph 61 -30.88(3.40) -0.24 8.02 0.56 7.17 7.82 15 XAV939 62
NC: number of compound.
test set compounds are indicated for each model under the predicted values for each between practices. *docking scores and (clashes) of some compounds docked on crystal structure 3KR8 using LeadIt.
018 Mervat H. El-Hamamsy / Journal of Applied Pharmaceutical Science 7 (12); 2017: 014-027
RESULTS AND DISCUSSION
3D-QSAR CoMFA
OptiSim Diversity Algorithm, which is one of
dissimilarity-based algorithms in the Tripos module in SYBYL
software, was used for selection of structurally diverse sets of
compounds in our data set to ensure coverage of the largest
possible expanse of chemical space in the search for bioactive
molecules (Clark, 1997). For the development of CoMFA model,
the complete set of these molecules (62 compounds) were divided
into a training set (44 compounds) to generate the models and a
test set (18 compounds) to evaluate the predictive ability of the
resulting models. The general structural formulae of the studied
compounds are shown in Tables 1a, b and c.
A statistically significant 3D-QSAR model was obtained
by using the CoMFA method in SYBYL X-2.1.1 to construct the
model. In the CoMFA model, initial PLS analysis of the aligned
training set was done using a default data filter of 2.0 kcal/mol and
the Tripos standard field. After omitting two outliers,
(compounds1 and 3), & using MOLPROP-AREA (1D-descriptor)
as an additional independent variable in 3D-QSAR models, better
internal validation parameters (R2, Q
2and standard error) were
obtained from a training set of 42 compounds as opposed to the
model derived from 44 compound (Tables 1a,b & c).
Validating the model
Internal validation of the final CoMFA model showed a
cross-validation coefficient (Q2) of 0.588 for eight components
used. The non-cross-validated PLS analysis results in a
conventional R2 of 0.889 and an estimated standard error of 0.189.
Also, the steric field descriptors explain 77.80 % of the variance,
the electrostatic descriptors explain 2.27% of the variance and the
MOLPROP-AREA descriptors explain 19.93% of the variance.
External validation (Gramatica, 2007; Tropsha, 2010) of the
developed model is achieved by calculating the predicted
biological activity for training and test sets using CoMFA model.
The calculated residual values revealed a satisfactory predictive
ability of our developed model as shown in Tables 1 (a, b & c).
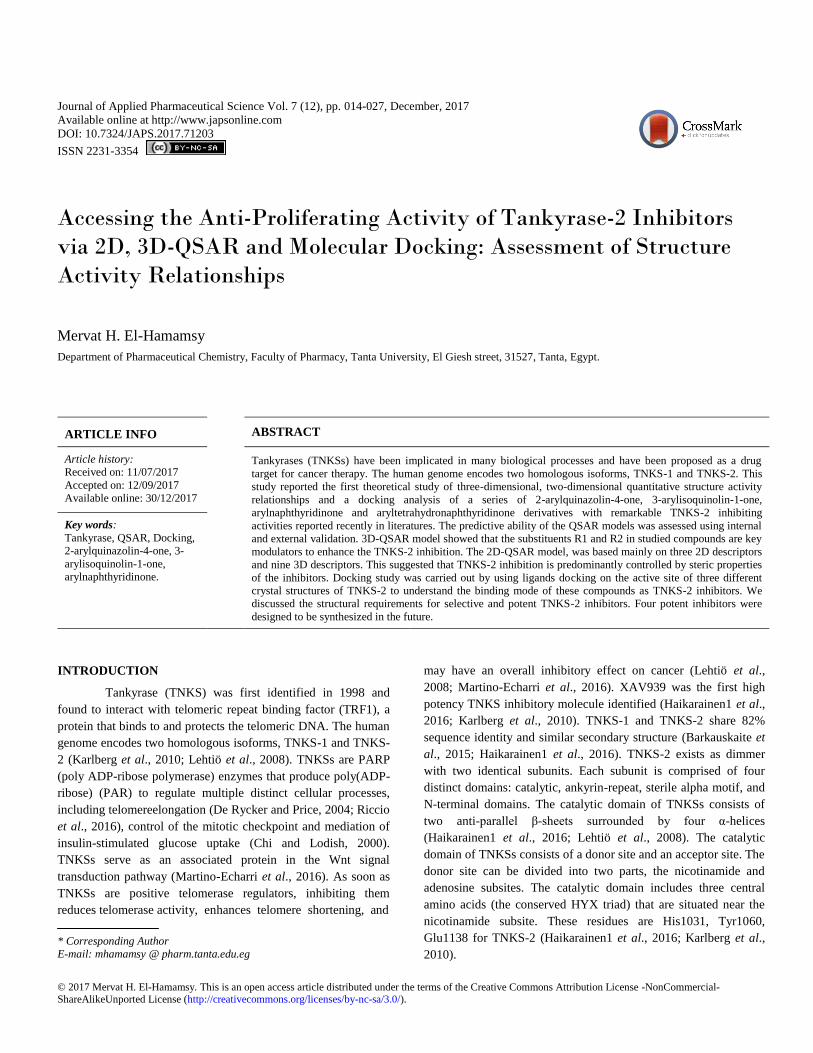
Scatter correlation plots for experimental and predicted
activities of ligands elicited significant linear correlation and
moderate differences between the experimental and predicted
values as shown in Figure 2 (a and b).
Graphical interpretation of CoMFA model: To visualize
the information contained in the 3D-QSAR model, maps for
CoMFA contours was generated, which provided a major
understanding of the biological activities of studied compounds.
The steric and electrostatic CoMFA contour fields are shown in
Figures 3 and 4. In the steric field CoMFA, the green contours
represent regions where bulky groups enhance the biological
activity, while bulky groups decrease activity in contact with
yellow regions. Furthermore, in the electrostatic fields CoMFA,
blue contours indicate regions where the positive charge is
desirable (electron withdrawing group enhances the activity) and
red contours indicate the regions where negative charge is
desirable (electron donating group enhances the activity)
(Villalobos et al., 2013; Li et al., 2013). The contour maps of our
model included two green steric regions at R1 and R2 positions
(Figure 1, A and B) and a yellow steric region at 2 and 6 position
of the phenyl group (two ortho positions). The electrostatic map
showed a predominant red contour which indicated that negatively
charged substituent is desirable (electron donating group enhance
activity). The molecular structure of compounds23 and 55have
been displayed in the fields as shown in Figures 3 and 4.
Compound (23) with ap-flourophenyl group (R1=F)
showed low activity because the steric bulky atom is desirable
(green contour) and electron donor is favored (red contour) at this
para position. That is why analogues with R1=Br (compounds 8,
22, 33, 42) and R1=OCH3 (compounds 5, 17, 46) are more active
than corresponding isomers with R1=H (compounds 4, 9, 18, 29,
38), R1=F (14, 23, 34, 34) and isomers with R1=Cl (compounds 7,
21, 32, 41) because the steric contribution with desirable bulky
group at this region (green contour) represent 77.80 % of the
variance, while electrostatic contribution is only 2.27% and the
MOLPROP-AREA descriptors explain 19.93% of the variance.
Consequently, both bulky electron donors and acceptors enhance
the activity as shown in Figure 3.
A B
Y =0.8887 X + 0.8348 Y =0.908 X + 0.716
Fig. 2: Correlation plot between predicted pIC50versus experimental pIC50for (a) the training set and (b) the test set using CoMFA model.

Mervat H. El-Hamamsy / Journal of Applied Pharmaceutical Science 7 (12); 2017: 014-027 019
2,6-dichlorophenyl group in the compound (55) lowered
the potency because steric bulk is undesirable (yellow contour)
around the two ortho positions. On the other hand, electron donor
is favored (red contour) at this position. At the isoquinolinonering
where, R2 = methyl, short, bulky group electron donor is favored
and increase the biological activity because this position
surrounded by green (with yellow contour beneath it)and red
contours. Since short electron donor is desirable in this region, it
was observed that all compounds with R2 = CH3 (compounds, 38-
49), NH2(compound 50) or OH (compounds 29-37) showed high
biological activity compared to analogues with R2 = H
(compounds, 18-27) as well as R2= OCH3groups (compounds, 9-
17) as shown in figure 4.
2D-QSAR
For the development of 2D-QuaSAR model the data set
of 55 compounds, after eliminating seven outlier compounds with
z-score more than 2.5 (compounds 3, 4, 41, 45, 54, 55, 60), were
divided into a training set (43 compounds) to generate the model
and a test set (12 compounds) to evaluate the predictive ability of
the resulting model. The test compounds were selected manually
in order to consider the structural diversity and a wide range of
anti-malarial activity. The in vitro TNKS-2 Inhibition
Concentration [IC50 (nM)] values were converted
to the logarithmic scale pIC50 and used as dependent variables in
2D-QSAR analysis as shown in Tables 1a, b & c. Twenty-five
models were constructed. The best model was chosen based on its
statistical validation parameters and represented by the following
equation:
pIC50 = 58.99146 + 0.55492 * AM1_IP – 8.56710 * FASA+ -
0.41808 * FCASA+ +1.78262 * PM3_HOMO + 11.24403 *
VAdjEq – 21.39089 * vsurf_CW1 + 3.73822 * vsurf_CW2 –
0.14832 * vsurf_CW3 + 8.21106 * vsurf_CW5 – 7.91040 *
vsurf_CW6 – 7.86719 * BCUT-SMR_1 + 6.67410 *
BCUT_PEOE_2
The involved molecular descriptors are:
VAdjEq: Atom Counts and Bond Counts, 2D descriptor
BCUT_PEOE_2 and BCUT_SMR_1: Adjacency and Distance
Matrix,2D descriptors
AM1_IP and PM3_HOMO: MOPAC, 3D descriptors
vsurf_CW*:Surface Area, Volume and Shape, 3Ddescriptors
FASA+ and FCASA+: Conformation Dependent Charge,3D
descriptors
The developed 2D model was based mainly on three 2D
descriptors and nine 3D descriptors. This suggested that TNKS-2
inhibition is predominantly controlled by steric properties of the
inhibitors, which is also supported by our developed CoMFA
model. The vsurf_CW* descriptors depend on the structure
connectivity and conformation. These descriptors have been
Fig. 3: Steric contour map (left side), electrostatic contour map (middle)
and overlay of contour maps (right side) of CoMFA model using compound (23) as a model.
Fig. 4: Steric contour map (left side), electrostatic contour map (middle)
and overlay of contour maps (right side) of CoMFA model using compound (55) as a model.

020 Mervat H. El-Hamamsy / Journal of Applied Pharmaceutical Science 7 (12); 2017: 014-027
shown to be useful in pharmacokinetics property prediction
(Cruciani et al., 2000). The conformation dependent charge
descriptors, FASA+ and FCASA+, depend upon the stored partial
charges of the molecules and their conformations. They measure
the relative fractional water accessible surface area of all atoms
with positive partial charge and a positive charge weighted surface
area respectively (Stanton and Jurs, 1990), which revealed the
importance of partial positive charge and presence of electron
donors on activity as provided by our CoMFA model as well.
Validating the model
The internal validation parameters for the developed
model was found to be accepted, where the R2 = 0.795, R
2 (cv) =
0.607, RMSE = 0.336, and RMSE (cv) = 0.483. The difference
between the R2 and R
2 (cv) value is 0.188 which indicates that the
number of descriptors involved in the QSAR model is acceptable.
The number of descriptors is not acceptable if the difference is
more than 0.3 (Veerasamy et al., 2011). External validation
of the model is achieved by calculating the predicted pIC50 for the
training and test sets compounds. The residual values were
calculated and were less than 1 as shown in Tables (1 a, b and c)
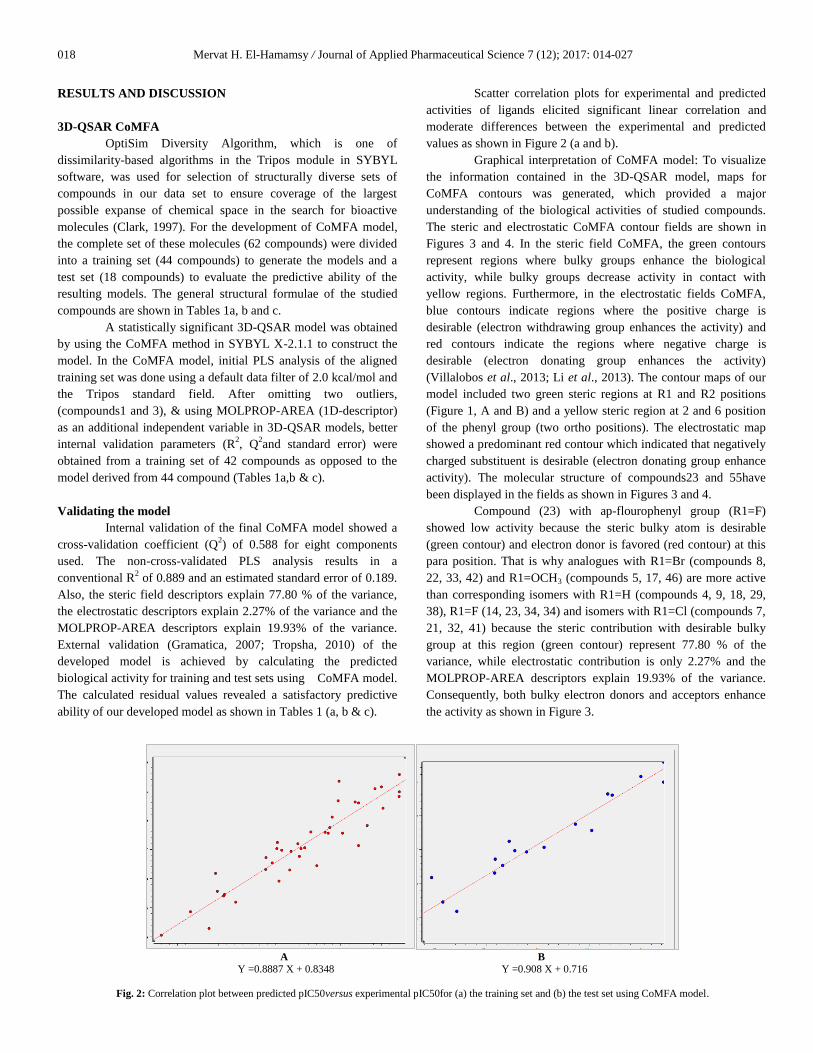
and Figures (5 and 6). The model’s predictive power was
evaluated using R2 value of the test set and was the highest (0.795)
compared to other models, as shown in the correlation plot of
actual pIC50 versus predicted pIC50 for test set as shown in
Figure 7. Moreover, the correlation plot between actual pIC50 and
residual values for test set showed the lowest correlation value
(0.385) i.e. it has good predictively, Figure8.
Both models revealed the importance of topological
properties of the ligands especially the surface area
(MOPLPROP_AREA descriptor in CoMFA and MOPAC, vsurf
CW*descriptors in QuaSAR). By calculating the total surface area,
polar surface area, solvent accessible surface area logP for the four
different nuclei included in this study exemplified by compounds
1, 4, 38 and 61 as shown in Table 2, we can conclude that
isoquinolin-1-one is the most active ring. It has large logP value, a
large molecular surface area in 3D and the smallest polar surface
area as shown in Table 2.
Fig. 5: The correlation plot between the actual pIC50 and predicted pIC50 for training set.
Fig. 6: External validation of the developed model, diagram between the actual (black line)
and predicted (blue line) pIC50 for the training set where residual values were less than 1.
Mervat H. El-Hamamsy / Journal of Applied Pharmaceutical Science 7 (12); 2017: 014-027 021
Fig. 7: External validation of the developed QuaSAR model, the correlation plot of actual pIC50 versus predicted pIC50 for test set.
Fig. 8: External validation of the model, the correlation plot between actual pIC50 and residual values for test set.
Table 2: Calculated topological parameters for four heterocyclic nucleus included in this study showing the influence of lipophilicity, dipole moment and surface area properties on biological activity.
Parameters Compound 1 Compound 4 Compound 38 Compound 61
o IC50 nM 5000 97 42 19
o logP 1.64 1.46 3.14 3.14 o Dipole moment 6.45 7.53 4.05 4.17
o Molecular surface area (Van der Waals (3D)) 289.33 344.47 326.69 329.16
o Polar surface area (2D) 41.99 32.34 41.46 29.10 o ASA 395.29 427.40 438.18 434.10
o ASA+ 230.81 295.57 261.55 265.32
o ASA- 163.86 131.84 176.62 168.69 o ASA_H 336.05 388.98 395.10 390.14
o ASA_P 58.24 38.42 43.08 43.87
ASA: water accessible surface area, ASA+: Water accessible surface area of all atoms with positive partial charge, ASA-: Water accessible surface area of all
atoms with negative partial charge, ASA_H: Water accessible surface area of all hydrophobic atoms, ASA_P: Water accessible surface area of all polar atoms. All parameters were calculated by Marvin sketch.

022 Mervat H. El-Hamamsy / Journal of Applied Pharmaceutical Science 7 (12); 2017: 014-027
Molecular Docking Analysis
Docking study was carried out by using ligands docking
on the active site of three different crystal structures of TNKS-2
(PDB: 3U9H, 4UX4 and 3KR8) using two different softwares,
MOE (MOE, 2017) and LeadIt (BioSolveIT, 2017),to understand
the binding mode of 2-arylquinazolin-4-one (A), 3-
arylisoquinolin-1-one (B) arylnaphthyridinone (C) and
aryltetrahydronaphthyridinone (D) derivatives as TNKS-2
inhibitors. To validate the ligands docking, the protein was docked
with nicotinamide and XAV939. Nicotinamide as well as all tested
compounds has the essential nicotinamide pharmacophore
requirement for inhibiting TNKS-2.They form three H-bonds with
Gly1032 and Ser1068. Hydrophobic interaction with Tyr1060 and
Tyr1071 was also observed. Figure 9 gives details of their docking
analysis.
The aforementioned binding interactions were not
enough for potent inhibitors. Strong inhibitor, XAV939, was
docked in the active site of the catalytic domain of TNKS-2 as
shown in Figure 10. The 3D pose showed the nicotinamide subsite
as a deep pocket having Gly1032 and Ser1068 at the bottom of the
pocket where XAV939 form three H-bonds mimic nicotinamide.
It binds to the HYD triad of the active site by forming H-
bond between sulfur and Glu1138 and hydrophobic attraction
force with His1031 and Tyr1060. The lipophilicity of the active
site is due to Pro1034 and Phe1035 in the F-loop as well as
Ile1075 in the G-loop (Haikarainen1 et al., 2014). XAV939
formed π-π stacking with Tyr1071. Hydrophobic attraction forces
with Phe1035, His1048, Tyr1071 and Ile1075 were also observed.
The contour drawn around the ligand is not broken (black dotted
curved line) and is indicative of the presence of enough steric
room for the ligand inside the binding pocket.
Analysis of the docking interaction of potent inhibitors,
compounds 27, 45 and 47, on TNKS-2 crystal structures, 4UX4,
3U9H and 3KR8, demonstrated the same ordinary binding
interactions mimic nicotinamide by using MOE program. On the
other hand, LeadIt program captured H-bond between both NH2
and OH, in compounds 45 and 47respectively, and Ala1049 which
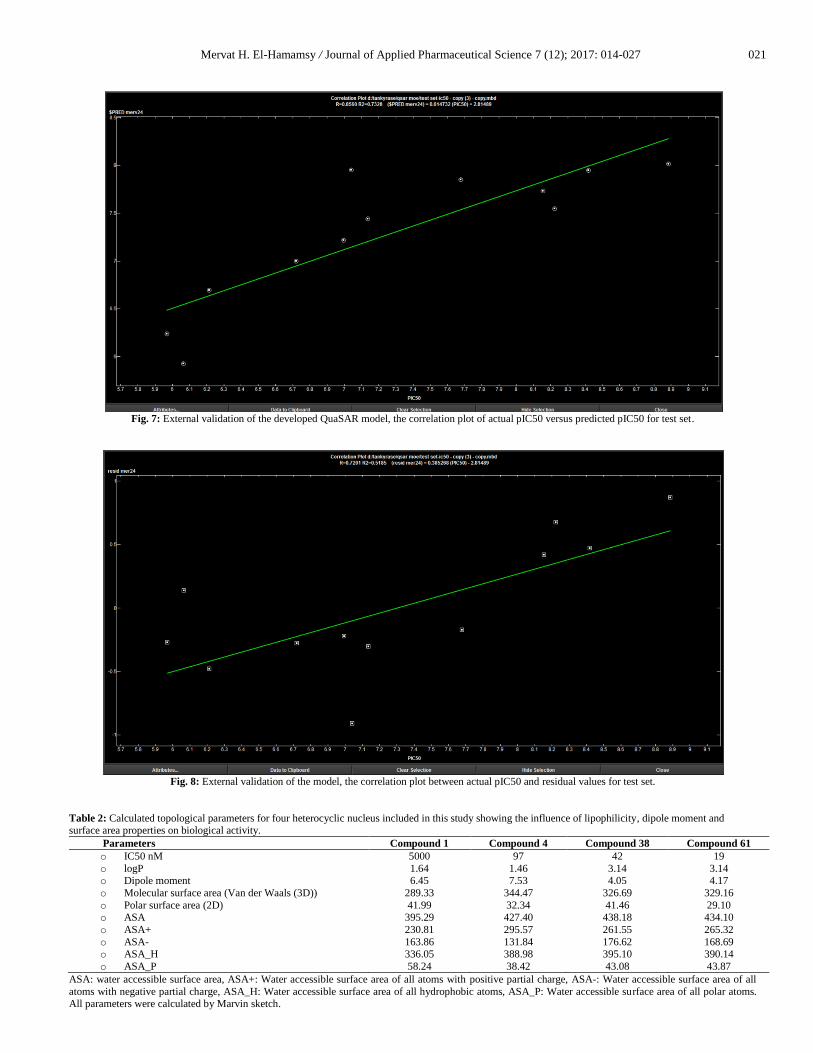
explained their high activity as shown in Figure 11.Analysis of the
docking mode of compounds,29-37 and 50, showed an additional
H-bond interaction of hydroxyl and amino groups, respectively,
with Met1113 which explained their high potency as shown in
Figure 12.
Fig. 9: 2D-pose of the interaction made by nicotinamide (left) and compound 1(very week inhibitor) (right), on 3U9H using MOE.
H-bonds are indicated as dotted arrows. Both are showing hydrogen bond interaction with Gly1032, Ser1068. Both had hydrophobic attraction force indicated as a blue shadow around the amino acid residue, with Tyr1060, Tyr1071. Compound 1 showed π-π stacking, as indicated by green dotted line, with Tyr1071.
Fig. 10: 3D-pose (left, by leadIt) and 2D-pose (right, by MOE) of the interaction made by XAV939, on 3U9H.
3H-bonds are indicated as dotted arrows with Gly1032, Ser1068, Glu1138, hydrophobic attraction force indicated as light-blue halos around the amino acid
residue, with His1031, Phe1035, His1048, Tyr1060, Ile1075, π-π stacking, as indicated by green dotted line, with Tyr1071, 2 fluoride atoms with high solvent
accessible surface area (blue smudge) are in the interior region of the binding pocket filled with water
Mervat H. El-Hamamsy / Journal of Applied Pharmaceutical Science 7 (12); 2017: 014-027 023
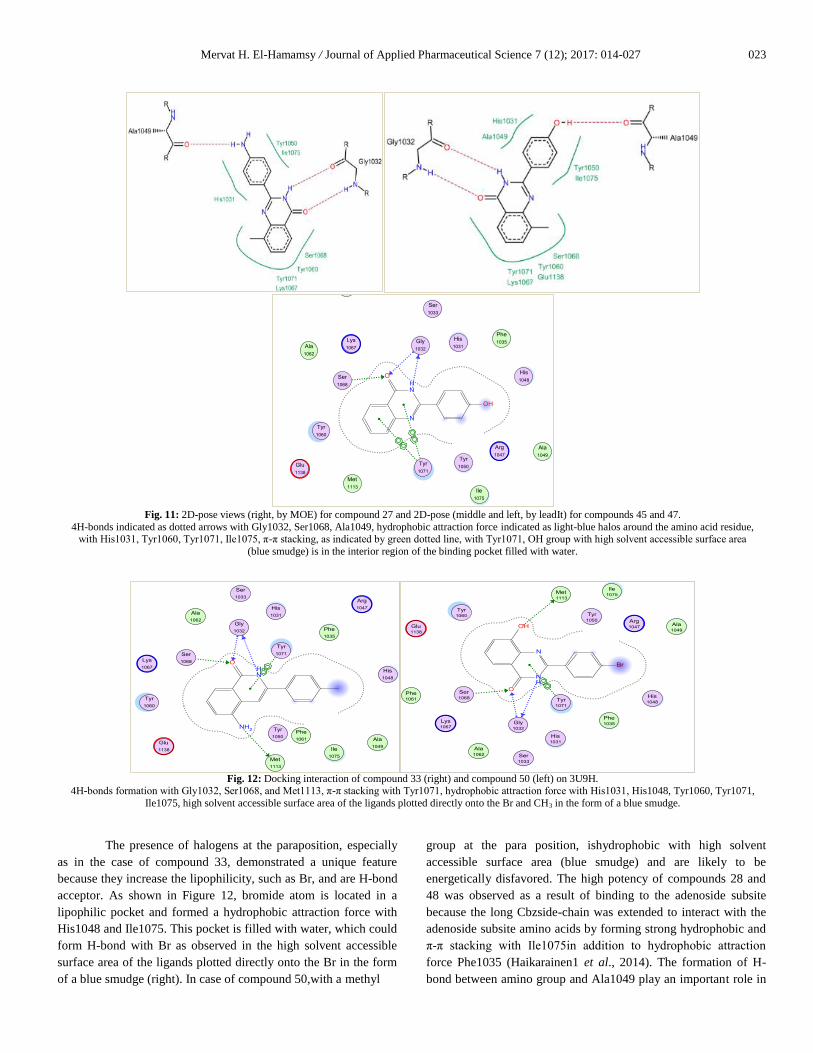
The presence of halogens at the paraposition, especially
as in the case of compound 33, demonstrated a unique feature
because they increase the lipophilicity, such as Br, and are H-bond
acceptor. As shown in Figure 12, bromide atom is located in a
lipophilic pocket and formed a hydrophobic attraction force with
His1048 and Ile1075. This pocket is filled with water, which could
form H-bond with Br as observed in the high solvent accessible
surface area of the ligands plotted directly onto the Br in the form
of a blue smudge (right). In case of compound 50,with a methyl
group at the para position, ishydrophobic with high solvent
accessible surface area (blue smudge) and are likely to be
energetically disfavored. The high potency of compounds 28 and
48 was observed as a result of binding to the adenoside subsite
because the long Cbzside-chain was extended to interact with the
adenoside subsite amino acids by forming strong hydrophobic and
π-π stacking with Ile1075in addition to hydrophobic attraction
force Phe1035 (Haikarainen1 et al., 2014). The formation of H-
bond between amino group and Ala1049 play an important role in
Fig. 11: 2D-pose views (right, by MOE) for compound 27 and 2D-pose (middle and left, by leadIt) for compounds 45 and 47.
4H-bonds indicated as dotted arrows with Gly1032, Ser1068, Ala1049, hydrophobic attraction force indicated as light-blue halos around the amino acid residue, with His1031, Tyr1060, Tyr1071, Ile1075, π-π stacking, as indicated by green dotted line, with Tyr1071, OH group with high solvent accessible surface area
(blue smudge) is in the interior region of the binding pocket filled with water.
Fig. 12: Docking interaction of compound 33 (right) and compound 50 (left) on 3U9H.
4H-bonds formation with Gly1032, Ser1068, and Met1113, π-π stacking with Tyr1071, hydrophobic attraction force with His1031, His1048, Tyr1060, Tyr1071,
Ile1075, high solvent accessible surface area of the ligands plotted directly onto the Br and CH3 in the form of a blue smudge.

024 Mervat H. El-Hamamsy / Journal of Applied Pharmaceutical Science 7 (12); 2017: 014-027
increasing their activity as shown in Figures 13 and 14.Although it
had the required nicotinamide pharmacophore, low potency of
inhibitor 55 with 2,6-dichloro substituents is explained byits
sterically disfavored orientation in active site which resulted in the
absence of H-bond interaction with Ser1068 as shown in Figure
15. The presence of two chlorosubstituents at the ortho positions
may make strong electrostatic repulsion with an important amino
acid residue Glu1138, which decreased the complex stability.
Docking calculations showed that compound 55 has the worst
docking score and protein-ligand clash of 10.08as shown in Tables
(1a, b & c).
This could be the reason for lowering the potency of
compound 55 compared to XAV939 which is in a good agreement
with the experimental value. In case of inhibitor 58 with
thiophenyl ring, its high potency may be explained by the
observed H-bond with Ser1033 as shown in Figure 16. In
conclusion, the results obtained from the established models, 2D,
3D-QSAR, and docking analysis, we can assess the structural
requirements for selective, potent TNKS-2 inhibitor as follows: (1)
nicotinamide pharmacophore is essential for activity and form .
important 3H-bonds with Ala1032 and Ser1068. (2) H-bond donor
group like OH, NH2 in R1 position improves the biological activity
by interacting with Ala1049 as well as in R2 position by forming
H-bond with Met1113 in the active site. (3) Both electron donors
like OCH3 and bulky electron acceptors such as Br in R1 position
increase the inhibitory activity as explained by the electrostatic
and steric fields of the developed CoMFA and docking results. (4)
Long chain, like Cbz, in R1 position increase activity by extending
outside the nicotinamide subside and binding to the adenoside
subsite. (5) Thiophen ring at 3 position with sulfur as heteroatom
increase activity by forming H-bond with Ser1033. (6) The
molecular docking highlights the hydrophobic interactions
between aromatic structure and amino acids, Tyr1060, Tyr1071,
Ile1075. Substitution at the 2' and 6' position with chlorides at 3-
phenyl ring is not tolerated as explained with the CoMFA and
docking analysis. Depending on the results of this study, new
TNKS-2 inhibitors were designed to be synthesized and are
expected to be potent inhibitors. PIC50 of proposed compounds
were calculated by our developed QSAR models as shown in
Table 3.
Fig. 13: The putative 2D-binding modes and molecular interactions of compound 28 in the active site of TNKS-2 by MOE on 3U9H (right) and LeadIt on 4UX4
(middle). 3D mode of interaction by LeadIt (left) showed the protein by molecular surface and 28 was depicted by sticks. MOE captured 3H-bonds with
Gly1032 and Ser1068, π-π stacking with Tyr1071 and Ile1075, strong hydrophobic attraction forces with Phe1035, Tyr1060, Tyr1071 and Ile1075, weaker
hydrophobic attraction force with His1031, Tyr1050, Gly1074, and Gly1078, a hydrophobic benzyl group with high solvent accessible surface area (blue smudge) are extended outside the nicotinamide binding pocket and bind to the adenoside subside (right and left). LeadIt captured 3H-bonds with Gly1032 and
Ala1049 (middle).
Fig. 14: 2D-binding interactions of compound 48 in the active site of TNKS-2 by MOE on 3U9H (right) and LeadIt on 3KR8 (left). 4H-bonds with Gly1032, Ser1068 and Ala11049, π-π stacking with Tyr1071, strong hydrophobic attraction forces with Tyr1050, Tyr1060, Tyr1071 and
Ile1075, weaker hydrophobic attraction force with His1031, Phe1035, and His1045, a hydrophobic benzyl group with high solvent accessible surface area (blue
smudge) are extended outside the nicotinamide binding pocket and bind to the adenoside subside (right).

Mervat H. El-Hamamsy / Journal of Applied Pharmaceutical Science 7 (12); 2017: 014-027 025
CONCLUSIONS
A modeling study of a series of TNKS-2 inhibitors was
carried out using CoMFA, 2D-QSAR, methods and docking
analysis. CoMFA model included steric, electrostatic fields,
MOLPROP-AREA descriptors & showed a satisfactory statistical
quality and predictive abilities as show the R2
and Q2
values.
Meanwhile, the 2D-QuaSAR model generated indicating that both
2 D-descriptors (VAdjEq, BCUT_PEOE_2, BCUT_ SMR_1) and
3D-descriptors (AM1_IP, PM3_HOMO, vsurf_CW*, FASA+, .
FCASA+) have important influences on the ligand–receptor
interaction. The predictive ability of the QuaSAR model (R2 =
0.795, R2 (cv) = 0.607, RMSE = 0.336, and RMSE (cv) = 0.483)
was also as good as the CoMFA model. The molecular docking
study discussed the appropriate binding differences between
these series of compounds when interacting with TNKS-2 active
side.
We discussed the structural requirements for selective,
potent TNKS-2 inhibitor and designed four potent inhibitors to be
synthesized in the future.
Fig. 15: 2D interaction of compound 55 in the active site of 4UX4 using LeadIT(right) and MOE (middle and left).
Improper orientation of the ligand in the active site with the absence of interaction with Ser1068 and/or Gly1032, probable repulsion with Glu1138 (left).
Fig. 16: 2D pose view of compound 58 in the active site of TNKS-2, 3U9H using MOE.
4H-bonds with Gly1032, Ser1068 and Ser1033, π-π stacking with Tyr1071, hydrophobic attraction force with His1031, His1048, Tyr1060, Tyr1071 and Ile1075.
Table 3: New designed potent TNKS-2 inhibitors and their predict biological activity using our developed CoMFA and QuaSAR models.
Pred PIC50
QuaSAR
Pred PIC50
CoMFA R1 X Compound Chemical structure
8.02 8.20 CH3 CH2 63
6.82 7.74 CH3 O 64 7.77 8.07 CH3
+NH2 65
7.75 7.53 CH3 S 66

026 Mervat H. El-Hamamsy / Journal of Applied Pharmaceutical Science 7 (12); 2017: 014-027
Financial support and sponsorship: Nil.
Conflict of Interests: There are no conflicts of interest.
REFERENCES
Barkauskaite E, Jankevicius G, Ahel1 I. Structures and
mechanisms of enzymes employed in the synthesis and degradation of
PARP-dependent protein ADP-ribosylation. Mol Cell, 2015; 58:935-946.
BioSolveIT GmbH "LeadIT." Available at
https://www.biosolveit.de/LeadIT/ [Accessed 7 February 2017].
Bregman H, Chakka N, Guzman-Perez A, Gunaydin H, Gu Y,
Huang X, Berry V, Liu J, Teffera Y, Huang L, Egge B, Mullady EL,
Schneider S, Andrews PS, Mishra A, Newcomb J, Serafino R, Strathdee
CA, Turci SM, Wilson C, Dimauro EF. Discovery of novel, induced-
pocket binding oxazolidinones as potent, selective, and orally bioavailable
tankyrase inhibitors. J Med Chem, 2013; 56:4320-4342.
ChemAxon®. "MarvinSketch.": Available at:
http://www.chemaxon.com/products/marvin/. [Accessed 10 January 2017]. Chi N-W, Lodish HF. Tankyrase is a Golgi-associated mitogen-
activated protein kinase substrate that interacts with IRAP in GLUT4
vesicles. J Biol Chem, 2000; 275:38437-38444.
Clark MC, Cramer RD, Opdenbosch NV. Validation of the
general purpose Tripos 5.2 force field. J Comp Chem, 1989; 10:982–1012.
Clark RD. OptiSim: An extended dissimilarity selection method
for finding diverse representative subsets. J Chem Inform Comp Sci, 1997;
37:1181-1188.
Cruciani G, Crivori P, Carrupt P-A, Testa B. Molecular fields in
quantitative structure-permeation relationships: The VolSurf approach. J
MolStruct (Theochem), 2000; 503:17–30.
De Rycker M, Price CM. Tankyrase polymerization is
controlled by its sterile alpha motif and poly(ADP-ribose) polymerase
domains. Mol Cell Biol, 2004; 24:9802-9812.
Gao J, Zhang J, Long Y, Tian Y, Lu X. Expression of tankyrase
1 in gastric cancer and its correlation with telomerase activity.
PatholOncol Res, 2011; 17:685 – 690.
Gasteiger J, Marsili M. Iterative partial equalization of orbital
electronegativity—a rapid access to atomic charges. Tetrahedron, 1980;
36:3219–3228.
GelminiS, PoggesiM, DistanteV, BianchiS, SimiL, LuconiM,
RaggiCC, CataliottiL, PazzagliM, OrlandoC. Tankyrase, a positive
regulator of telomere elongation, is over expressed in human breast cancer.
Cancer let, 2004; 216:81–87.
Gelmini S, Quattrone S, Malentacchi F, Villari D, Travaglini F,
Giannarini G, Melina AD, Pazzagli M, Nicita G, Selli C, Orlando C.
Tankyrase-1 mRNA expression in bladder cancer and paired
urine sediment: preliminary experience. ClinChem Lab Med, 2007; 45:
862-866.
Gramatica P. Principles of QSAR model validation: Internal and
external. QSAR Comb Sci, 2007; 26:694-701.
Gunaydin H, Gu Y, Huang X. Novel binding mode of a potent
and selective tankyrase inhibitor. PLoS One, 2012; 7: e33740.
Haikarainen1 T, Krauss S, Lehtiö L. Tankyrases: structure,
function and therapeutic implications in cancer. Curr Pharm Des, 2014;
20:6472-6488.
Hua Z, Bregman H, Buchanan JL, Chakka N, Guzman-Perez A,
Gunaydin H, Huang X, Gu Y, Berry V, Liu J, Teffera Y, Huang L, Egge
B, Emkey R, Mullady EL, Schneider S, Andrews PS, Acquaviva L, Dovey
J, Mishra A, Newcomb J, Saffran D, Serafino R, Strathdee CA, Turci SM,
Stanton M, Wilson C, Dimauro EF. Development of novel dual binders as
potent, selective, and orally bioavailable tankyrase inhibitors. J Med
Chem, 2013; 56:10003-10015.
Huang SM, Mishina YM, Liu S, Cheung A, Stegmeier F,
Michaud GA, Charlat O, Wiellette E, Zhang Y, Wiessner S, Hild M, Shi
X, Wilson CJ, Mickanin C, Myer V, Fazal A, Tomlinson R, Serluca F,
Shao W, Cheng H, Shultz M, Rau C, Schirle M, Schlegl J, Ghidelli S,
Fawell S, Lu C, Curtis D, Kirschner MW, Lengauer C, Finan PM,
Tallarico JA, Bouwmeester T, Porter JA, Bauer A, Cong F. Tankyrase
inhibition stabilizes axin and antagonizes Wntsignalling. Nature, 2009;
461:614-620.
Huang S-MA, Mishina YM, Liu S, Cheung A, Stegmeier F,
Michaud GA, Charlat O, Wiellette E, Zhang E, Wiessner S, Hild M, Shi
X, Wilson CJ, Mickanin C, Myer V, Fazal A, Tomlinson R, Serluca F,
Shao W, Cheng H, Shultz M, Rau C, Schirle M, Schlegl J, Ghidelli S,
Fawell S, Lu C, Curtis D, Kirschner MW, Lengauer C, Finan PM,
Tallarico JA, Bouwmeester T, Porter JA, Bauer A, Cong F. Tankyrase
inhibition stabilizes axin and antagonizes Wnt signaling. Nature, 2009;
461:614-620.
Jain S, Ghate M, Bhadoriya K, Bari S, Chaudhari A, Borse J.
2D, 3D-QSAR and docking studies of 1,2,3-thiadiazole thioacetanilides
analogues as potent HIV-1 non-nucleoside reverse transcriptase inhibitors.
Org Med Chem Lett, 2012; 2:1–13.
Karlberg L, Markova N, Johansson I, Hammarstrom M, Schutz
P, Weigelt J, Schulert H. Structural Basis for the Interaction between
Tankyrase-2 and a potent Wnt-signaling inhibitor. J Med Chem, 2010;
53:5352-5255.
Kumpan K, Nathubhai A, Zhang C, Wood PJ, Lloyd MD,
Thompson AS, Haikarainen T, Lehtiö L, Threadgill MD. Structure-based
design, synthesis and evaluation in vitro of arylnaphthyridinones,
arylpyridopyrimidinones and their tetrahydro derivatives as inhibitors of
the tankyrases. Bioorg Med Chem, 2015; 23:3013–3032.
La Torre D, Conti A, Aguennouz M, De Pasquale MG, Romeo
S, Angileri FF, Cardali S, Tomasello C, Alafaci C, Germanò A. Telomere
length modulation in human astroglial brain tumors. PLOS ONE, 2013; 8
(5): e64296.
Lakhlili W, Yasri A, Ibrahimi Z. Structure–activity relationships
study of mTOR kinase inhibition using QSAR and structure-based drug
design approaches. Onco Targets Ther, 2016; 9:7345–7353.
Lehtiö L, Chi N-W, Krauss S. Tankyrases as drug targets. FEBS
Journal, 2013; 280:3576–3593.
Lehtiö L, Collins R, van den Berg S, Johansson A, Dahlgren L-
G, Hammarström M, Helleday T, Holmberg-Schiavone L, Karlberg T,
Weigelt J. Zinc binding catalytic domain of human tankyrase. J MolBiol,
2008; 379:136–145.
Li Y-P, Weng X, Ning F-X, Ou J-B, Hou J-Q, Luo H-B, Li D,
Huang Z-S, Huang S-L, Gu L-Q. 3D-QSAR studies of
azaoxoisoaporphine, oxoaporphine, and oxoisoaporphine derivatives as
anti-AChE and anti-AD agents by the CoMFA method. J Mol Graph
Model, 2013; 41:61–67.
Liscio P, Carotti A, Asciutti S, Ferri M, Pires MM, Valloscuro
S, Ziff J, Clark NR, Macchiarulo A, Aaronson SA, Pellicciari R, Camaioni
E. Scaffold hopping approach on the route to selective tankyrase
inhibitors. Eur J Med Chem, 2014; 87:611-623. Martino-Echarri E, Brocardo MG, Mills KM, Henderson BR.
Tankyrase inhibitors stimulate the ability of tankyrases to bind axin and
drive assembly of β-catenin degradation-competent axin puncta. PLOS
ONE, 2016; 11(3):e0150484.
MOE: Molecular Operating Environment. 2014. Available at
http://www.chemcomp.com/MOE-
Molecular_Operating_Environment.htm. [Accessed 17 February 2017].
Nathubhai A, Haikarainen T, Hayward PC, Munoz-Descalzo S,
Thompson AS, Lloyd MD, Lehtiö L, Threadgill MD. Structure-activity
relationships of 2-arylquinazolin-4-ones as highly selective and potent
inhibitors of the tankyrases. Eur J Med Chem, 2016; 118:316-327.
Paine HA, Nathubhai A, Woon ECY, Sunderland PT, Wood PJ,
Mahon MF, Lloyd MD, Thompson AS, Haikarainen T, Narwal M, Lehtiö
L, Threadgill MD. Exploration of the nicotinamide-binding site of the
tankyrases, identifying 3-arylisoquinolin-1-ones as potent and selective
inhibitors in vitro. Bioorg Med Chem, 2015; 23:5891–5908.
Protein data bank "PDB Id 3KR8." Available at
http://www.rcsb.org/pdb/explore/explore.do?structureId=3KR8 [Accessed
11 February 2017].
Protein data bank "PDB Id 3U9H'' Available at
http://www.rcsb.org/pdb/explore/explore.do?structureId=3U9H. [Accessed
7 February 2017].
Mervat H. El-Hamamsy / Journal of Applied Pharmaceutical Science 7 (12); 2017: 014-027 027
Protein data bank "PDB Id 4UX4." Available at
http://www.rcsb.org/pdb/explore/explore.do?structureId=4UX4 [Accessed
9 February 2017].
Riccio AA, McCauley M, Langelier MF, Pascal JM. Tankyrase
sterile α motif domain polymerization is required for its role in Wnt
signaling, Structure. 2016; 24:1573–1581.
Roy K. On some aspects of validation of predictive quantitative
structure-activity relationship models. Expert Opin Drug Discov, 2007;
2:1567-1577.
Shultz MD, Majumdar D, Chin D, Fortin PD, Feng Y, Gould T,
Kirby CA, Stams T, Waters NJ, Shao W. Structure efficiency relationship
of [1,2,4]triazol-3-ylamines as novel nicotinamide isosteres that inhibit
tankyrases. J Med Chem, 2013; 56:7049-7059.
Stanton D, Jurs P. Development and use of charged partial
surface-area structural descriptors in computer-assisted quantitative
structure-property relationship studies. Anal Chem, 1990; 62:2323–2329.
SYBYL-X2.1.1, 2012, Tripos International, 1699 South Hanley
Rd., St. Louis, Missouri, 63144, USA.
.http://downloads.informer.com/sybyl-x/2.1/ [Accessed 10 January 2017]. Todeschini R, Consonni V, Gramatica P. Chemometrics in
QSAR. Comprehensive chemometrics. ChemBiochem Data Anal, 2009;
4:129–172.
Tropsha A. Best practices for QSAR model development,
validation, and exploitation, MolInf, 2010; 29:476–488.
Veerasamy R, Rajak H, Jain A, Sivadasan S, Varghese CP,
Agrawal RK. Validation of QSAR models-strategies and importance. Int J
Drug Des Disc, 2011; 3:511-519.
Villalobos TPJ, Ibarra1 RG, Acosta JJM. 2D, 3D-QSAR and
molecular docking of 4(1H)-quinolones analogues with antimalarial
activities. J Mol Graph Model, 2013; 46:105–124.
Waaler J, Machon O, Tumova L, Dinh H, Korinek V, Wilson
SR, Paulsen JE, Pedersen NM, Eide TJ, Machonova O, Gradl D,
Voronkov A, von Kries JP, Krauss S. A novel tankyrase inhibitor
decreases canonical Wnt signaling in colon carcinoma cells and reduces
tumor growth in conditional APC mutant mice. Cancer Res, 2012;
72:2822-2832.
Wahlberg E, Karlberg T, Kouznetsova E, Markova N,
Macchiarulo A, Thorsell AG, Pol E, Frostell A, Ekblad T, Oncü D, Kull B,
Robertson GM, Pellicciari R, Schüler H, Weigelt J. Family-wide chemical
profiling and structural analysis of PARP and tankyrase inhibitors. Nat
Biotechnol, 2012; 30:283-288.
Wang H, Lu B, Castillo1 J, Zhang Y, Yang Z, McAllister G,
Lindeman A, Reece-Hoyes J, Tallarico J, Russ C, Hoffman G, Xu W,
Schirle M, Cong F. Tankyrase inhibitor sensitizes lung cancer cells to
EGFR inhibition via stabilizing angiomotins and inhibiting YAP signaling.
J BiolChem, 2016; 291:15256-15266.
Zhao X, Chen M, Huang B, Ji H, Yua M. Comparative
Molecular Field Analysis (CoMFA) and Comparative Molecular
Similarity Indices Analysis (CoMSIA) Studies on α1A-adrenergic receptor
antagonists based on pharmacophore molecular alignment. Int J MolSci,
2011; 12:7022-7037.
How to cite this article:
El-Hamamsy MH. Accessing the Anti-Proliferating Activity of
Tankyrase-2 Inhibitors Via 2d, 3d-Qsar and Molecular Docking:
Assessment of Structure Activity Relationships. J App Pharm Sci,
2017; 7 (12): 014-027.