acclimation to iron limitation in the haptophyte cm.pdfacclimation to iron limitation in the...
TRANSCRIPT
Acclimation to Iron Limitation in the Haptophyte
Coccolithus pelagicus: A Molecular Investigation
Christopher Moffat
School of Biological and Environmental Sciences
The University of Stirling
December 2008

ACKNOWLEDGEMENTS
This research was funded by the Natural Environment Research Council. I would like to thank: Dr Michael Wyman for his patience, supervision and support.
Dr Rachel Jones, Dr Alan Patterson, Nick Meakin, Sylvia Hodgson, Pauline Monteith
and Dr Clare Bird for their encouragement, assistance and general office banter.
My friends and family.
Lastly, I would like to thank the person who has had to tolerate me the most, provide
late night lifts and pretend to be interested in iron limitation – Elaine Stewart.
i
Abstract
Phytoplankton growth is iron limited in at least 20% of the world’s oceans. Iron is an
important nutrient required to synthesise enzymes necessary for photosynthesis,
respiration, and nitrogen assimilation. Due to its low solubility in seawater, iron
limitation of phytoplankton production has been the focus of much recent research.
These organisms secrete ligands in order to solubilise the available iron, but not all of
the iron dissolved in seawater is biologically available. In this study a molecular
based approach was employed to investigate the acclimation of the marine haptophyte
Coccolithus pelagicus to iron limitation.
Using two dimensional electrophoresis, subtractive cDNA hybridisation, and RT real
time PCR, changes in the proteome and in gene expression were examined. Iron
limited cells were characterised by slower specific growth rates, lower chlorophyll a
concentrations per unit biomass and less extensive calcification relative to iron replete
cells. Addition of iron to iron limited cultures resulted in increased specific growth
rates and increased chlorophyll a concentration per unit biomass.
A subtracted cDNA library revealed seventeen identifiable sequences of which
photosystem I protein E (PsaE), a fucoxanthin binding protein transcript, two
chlorophyll binding proteins and a predicted membrane protein were shown to be up-
regulated in iron-limited cells to varying extents. Two dimensional SDS PAGE
revealed 11 differentially expressed proteins in iron limited cells and 1 highly
ii

expressed protein exclusive to iron replete cells. The potential utility of each of these
as biomarkers of iron-limitation/iron sufficiency for natural populations of
coccolithophorids like Coccolithus pelagicus is discussed.
iii

Declaration
To whom it may concern
This thesis is the sole work of the author. The work reported in this thesis
is the result of the author’s own research and has not been reported in
another thesis. Where material from other sources has been used it has
been duly acknowledged in the text and fully listed in the references.
Signed:
Christopher Moffat
School of Biological and Environmental Sciences
The University of Stirling
December 2008
iv
CONTENTS Acknowledgements…………………………………………………………………..i Abstract………………………………………………………………………………ii Declaration…………………………………………………………………………...iv Contents……………………………………………………………………………...v List of Figures and Tables…………………………………………………………...viii Chapter 1 – Introduction 1.1 Phytoplankton………………………………………………………………………….1 1.1.1 The coccolihophorids………………………………………………………………..3 1.1.2 The importance of iron in biological systems……………………………………..6 1.1.3 Marine iron limitation………………………………………………………………..7 1.1.4 Iron supply to the ocean……………………………………………………………...8 1.2 Iron uptake by phytoplankton………………………………………………………..9 1.2.1 The effect of Iron limitation on Nitrogen assimilation………………………….13 1.2.2 Effects of iron limitation on photosynthesis and pigment composition……….15 1.3 Flavodoxin and Ferredoxin as Potential Biomarkers of Iron Limitation…….19 1.4 Aims of this study…………………………………………………………………….22 Chapter 2 – Materials and Methods 2.1 Coccolithus pelagicus – maintenance of stock cultures and experimental
cultures………………………………………………………………………………..23 2.1.2 Determination of chlorophyll a concentrations………………………………….25 2.1.3 Growth experiments to confirm iron limitation………………………………… 25 2.1.4 Microscopic examination of Coccolithus pelagicus cells………………………26 2.2 RNA extractions……………………………………………………………………...26 2.2.1 Buffers and solutions used for RNA extractions and electrophoresis……….. 26 2.2.2 Extraction of RNA……………………………………………………………………27 2.2.3 Spectrophotometric determination of RNA concentration……………………..29 2.2.4 Electrophoresis of RNA……………………………………………………………..29 2.2.5 Purification of mRNA……………………………………………………………….29 2.3 cDNA subtraction……………………………………………………………………31 2.3.1 Buffers and solutions used for cDNA subtraction……………………………….34 2.3.2 First-strand cDNA synthesis……………………………………………………….34 2.3.3 Second-strand cDNA synthesis…………………………………………………….35 2.3.4 Rsa I digestion………………………………………………………………………..37 2.3.5 Adaptor ligation……………………………………………………………………...38 2.3.6 Subtractive hybridisation…………………………………………………………...40 2.3.7 PCR amplification of subtracted cDNA samples……………………………….. 43 2.3.8 Sequences of Clontech primers and adaptors used in cDNA subtraction……46 2.4 Cloning and sequencing of subtracted cDNA sequences……………………….46 2.5 Blast analysis, multiple sequence alignments of subtracted cDNA sequences
and primer design…………………………………………………………….48 2.5.1 Design of degenerate primers to target flavodoxin and Glyceraldehyde 3-
phosphate dehydrogenase (GAPDH)……………………………………………...51
v
2.6 Primer optimisation for real-time PCR…………………………………………...52 2.6.1 cDNA production for real-time PCR………………………………………………54 2.6.2 Testing primers using cDNA as a template…………………………………..55 2.7 Real time PCR………………………………………………………………………..56 2.7.1 Data handling: normalising RT real time PCR results to GAPDH transcript
abundance and determining up-regulation of genes in response to iron limitation……………………………………………………………………………...57
2.8 1-Dimensional and 2-Dimensional SDS-PAGE………………………………….58 2.8.1 Automated protein spot detection and analysis of 2-D gels…………………....61 2.8.2 Mass spectroscopic analysis of iron replete 2D-SDS PAGE spot FeR1……...62 2.8.3 Western blotting………………………………………………………………………62 Chapter 3 – Growth experiments and proteomic analysis 3.1 Coccolithus pelagicus growth experiments……………………………………....65 3.1.1 Iron addition experiments…………………………………………………………..69 3.1.2 Growth data for cultures used in RNA extractions……………………………...73 3.2 Microscopic examination of iron replete and iron limited cultures…………..74 3.3 1 Dimensional SDS PAGE analysis of Coccolithus pelagicus proteins………79 3.3.1 2 Dimensional SDS PAGE analysis of Coccolithus pelagicus proteins………80 3.3.2 Mass spectroscopic analysis of iron replete protein spot FeR1and western blotting………………………………………………………………………………....84 3.4 Discussion……………………………………………………………………………..86 Chapter 4 – Analysis of differentially expressed sequences in the iron replete and iron limited subtracted libraries 4.1 Chapter introduction…………………………..……………………………………93 4.1.1 Composition of the subtracted cDNA library…………………………………....93 4.1.2 Blast analysis of the subtracted cDNA library…………………………………..97 4.2 Multiple sequence alignments of fucoxanthin binding protein sequences (FucoBP) detected in the subtracted library…………………………………....102 4.2.1 Multiple sequence alignments for Flavodoxin and GAPDH………………....105 4.3 Discussion…………………………………………………………………………..107 Chapter 5 – RNA extractions, DNase digests, primer optimisation and real time PCR results 5.1 Chapter introduction……………………………………………….……………...113 5.1.1 Examination of extracted DNase treated RNA on agarose gels……………..113 5.2 Thermal gradient PCR primer optimisation……………………………………114 5.2.1 Testing primers for use in RT real time PCR with cDNA templates…………120 5.3 RT Real time PCR results………………………………………………………....123 5.3.1 Analysis of RT real time PCR products on agarose gels…………………….. 127
vi
5.4 Discussion…………………………………………………………………………...130 Chapter 6 – Conclusions and future work 6.1…………………………………………………………………………………...135 References………………………………………………………………………….143 APPENDIX…………………………………………………………………………163
vii
List of Figures and Tables Chapter 1 Figure 1.1……………………………………………………………………………………….4 A = Artificially coloured SEM of calcified Emiliania huxleyi cell,
www.uga.edu/protozoa/portal/coccolithophores.html (05.08.2009). B = SEM of
calcified Coccolithus pelagicus cell, www.botany.unimelb.edu.au/RW/media/5.html
(05.08.2009).
Chapter 2
Figure 2.1……………………………………………………………………………..……….31
Diagram illustrating the principles underlying the Clontech PCR-Select™ cDNA
Subtraction Kit (Adapted from the Clontech PCR-Select™ cDNA Subtraction Kit user
manual, published 15 September, 1999).
Chapter 3 Table 3A……………………………………………………………………………………….67
Mean ± SE (n=3) specific growth rates, generation times and iron limited specific
growth rates as a percentage of iron replete rates of Coccolithus pelagicus cultures
treated with the iron chelators deferoxamine (DF) and EDTA at various
concentrations.
Table 3B…………………………………………………………………………………….70
Mean SE ± (n3) specific growth rates, generation times and iron limited growth rates
as a percentage of iron replete growth rates of Coccolithus pelagicus cultures used in
the iron addition experiment.
Table 3C……………………………………………………………………………………..74
Specific growth rates, generation times and iron limited growth rates expressed as a
percentage of their respective iron replete control growth rates of replicate cultures of
Coccolithus pelagicus used to produce cDNA for RT real time PCR experiments.
viii
Figure 3.1……………………………………………………………………………………66
Growth curves showing mean ± SE (n=3) increase in biomass of Coccolithus
pelagicus cultures grown in the presence of various concentrations of the iron
chelators deferoxamine and EDTA as determined by optical density measurements at
750 nm.
Figure 3.2…………………………………………………………………………………….68
Mean ± SE (n=3) change in chlorophyll concentration over time in cultures of
Coccolithus pelagicus grown in media containing various concentrations of the iron
chelators EDTA and deferoxamine.
Figure 3.3…………………………………………………………………………………….68
Temporal change in mean ± SE (n=3) chlorophyll a concentration per unit biomass
in cultures of Coccolithus pelagicus cultures grown under iron replete conditions and
in the presence of various concentrations of EDTA or deferoxamine.
Figure 3.4…………………………………………………………………………………….69
Growth curves showing mean ± SE (n=3) increase in biomass of Coccolithus
pelagicus cultures grown under iron replete conditions and in the presence of 150 µM
deferoxamine before and after the addition of iron
Figure 3.5…………………………………………………………………………………….71
Mean ± SE (n=3) change in chlorophyll concentration over time in cultures of
Coccolithus pelagicus grown under iron replete conditions and in the presence 150
µM deferoxamine before and after addition of additional iron.
Figure 3.6……………………………………………………………………………………72
Curves showing change in chlorophyll a concentration per unit biomass in cultures of
Coccolithus pelagicus cultures grown under iron replete conditions and in the
presence of 150 µM deferoxamine before and after the addition of iron.
Figure 3.7……………………………………………………………………………………73
Growth curves for Coccolithus pelagicus replicate cultures from which RNA was
extracted. The growth curves show increase in biomass over time when grown under
iron replete conditions and in media containing 150 µM deferoxamine. The Fe
Replete (4) and Fe Limited (4) replicates were inoculated with a different stock from
the other replicates shown.
Figure 3.8……………………………………………………………………………………76
Micrograph of iron replete cells of Coccolithus pelagicus at 630 x magnification
under a light microscope.
ix
Figure 3.9……………………………………………………………………………………76
Micrograph of iron limited cells of Coccolithus pelagicus at 630 x magnification
under a light microscope.
Figure 3.10…………………………………………………………………………………..77
Micrograph of an iron replete cell of Coccolithus pelagicus at 630 x magnification
under a light microscope.
Figure 3.11…………………………………………………………………………………..78
Micrograph of an iron limited cell of Coccolithus pelagicus at 630 x magnification
under a light microscope.
Figure 3.12…………………………………………………………………………………..79
Coomassie blue stained 1D SDS-PAGE gel showing two proteins detected only in
cells of four iron limited Coccolithus pelagicus cultures and one protein detected only
in iron replete cultures
Figure 3.13…………………………………………………………………………………..81
2D-SDS PAGE gel showing proteins in the cells of an iron replete culture of
Coccolithus pelagicus detected by the ImageMaster software.
Figure 3.14…………………………………………………………………………………..81
2D-SDS PAGE gel showing proteins in the cells of an iron limited culture of
Coccolithus pelagicus detected by the ImageMaster software.
Figure 3.15…………………………………………………………………………………..82
2D-SDS PAGE gel showing proteins present in the cells of an iron replete culture of
Coccolithus pelagicus with reference proteins annotated (A-J) and differentially
expressed proteins annotated (FeR1-FeR4).
Figure 3.16………………………………………………………………………………….83
2D-SDS PAGE gel showing proteins present in the cells of an iron limited culture of
Coccolithus pelagicus with reference proteins annotated (A-J) and differentially
expressed proteins annotated (1-11).
Figure 3.17……………………………………………………………………………………85
Western blot showing crude cell extracts from iron replete and iron limited
Coccolithus pelagicus cells probed with rabbit anti-actin antibody (1:400), (secondary
antibody – goat anti-rabbit HRP, 1:10,000). 3 lanes were loaded with 20 µg, 10µg
and 5 µg of iron replete crude cell lysate, and another 3 lanes were loaded with 20 µg,
10µg and 5 µg of iron limited crude cell lysate. M = SeeBlue® pre-stained standard
protein markers (Invitrogen™).
x
Chapter 4
Table 4A……………………………………………………………………………………...94
Table showing the overall sequence composition of the iron limited subtracted library.
Table 4B……………………………………………………………………………………….95
List of the full names of identified sequences in the iron limited subtracted library and
the abbreviated names used to refer to them throughout the text and in figures 4.1 and
4.2.
Figure 4.1…………………………………………………………………………………...96
Relative proportion of each RT real time PCR analysed iron limited sequence in the
iron limited subtracted cDNA library.
Figure 4.2……………………………………………………………………………………96
Relative proportion of each RT real time PCR analysed iron limited sequence within
the 19% of the sequences in the library that were examined.
Figure 4.3…………………………………………………………………………………..102
Results from BlastX analysis performed on unique sequences found in the iron limited
subtracted library. Each sequence from the library is shown and the EcoR1 restriction
sites from the cloning vector and adaptors from the subtraction cloning are
highlighted in yellow. The presence of different adaptors on each end of the
nucleotide sequence confirms that they are differentially expressed or highly up-
regulated sequences.
Figure 4.4…………………………………………………………………………………...103
Multiple sequence alignment of fucoxanthin binding protein (FucoBP) sequences
detected in the iron limited subtracted library showing 5 different nucleotide
sequences each highlighted with a different colour. Also shown is the position of the
stop codons in each sequence (highlighted in yellow). Sequences highlighted in the
same colour are homologous.
xi
Figure 4.5……………………………………………………………………………….....105
Multiple peptide sequence alignment for flavodoxin. The binding sites for two
alternative degenerate forward primers are highlighted in green and yellow while the
binding site for the reverse primer is highlighted in blue. The sequences used in the
alignment are from Emiliania huxleyi, Karenia brevis Phaeodactylum tricornutum,
Ostreococcus tauri and Thalassiosira pseudonana.
Figure 4.6……………………………………………………………………………….....107
Multiple peptide sequence alignment for GAPDH. The forward and reverse primer
binding sites are highlighted in yellow. The organisms from which the sequences
were derived are Phaeodactylum tricornutum, Thalassiosira pseudonanna
Ascophylum nodosum, Gonyaulux poledra, Emiliania huxleyi, Isochrysis galbana and
Pavlova lutheri.
Chapter 5
Table 5A………………………………………………………………………………………115
Figure 5.1……………………………………………………………………………………114
1.5% agarose gels showing RNA extractions before and after treatment with the
Turbo DNA-free kit. In all four gels the lanes were loaded as follows: 1 – Hind III λ
phage markers, 2 – iron replete RNA before DNase treatment, 3 – iron replete RNA
after DNase treatment, 4 – iron limited RNA before DNase treatment, 5 – iron limited
RNA after DNase treatment. In each gel showing Fe replete and Fe limited RNA
samples prior to and after DNase treatment (A,B,C and D) the contaminating DNA
(highest molecular weight band) is greatly reduced or absent in the samples after
DNase treatment compared to those samples without DNase treatment.
Figure 5.2…..………………………………………………………………………………116
1% agarose gels showing products from 57oC – 67oC thermal gradient PCR. Gel A =
PMP, Gel B = Fuco (3). On both gels: 1 = Hind III λ phage markers, 2 = negative
controls. The temperature gradient was: 3 = 57oC, 4 = 59 oC, 5 = 62.6 oC,
6 = 64.9 oC, 7 = 66 oC, 8 = 67 oC.
xii
Figure 5.3…………………………………………………………………………………....117
1% agarose gels showing products from 60oC – 70oC thermal gradient PCR. Lanes 1
– 6 = Fuco (7), Lanes 7 – 9 and 12 – 14 = Thio, Lanes 15 – 20 = Fuco (6). Lanes 10
and 11 = Hind III λ phage markers. All 3 reactions were run on gradients with the
following increments: 60 oC, 62 oC, 64.4 oC, 65.6 oC, 68 oC, 70 oC.
Figure 5.4……………………………………………………………………………………118
1% agarose gels showing products from 60oC – 70oC thermal gradient PCR. A = Cyt
bc1, B = Fuco (2), C = Fuco (4), D = UCE, E = Fuco (1), F = Fuco (3) G = Fuco (5).
On both gels: 1 = Hind III λ phage markers, 2 = negative controls. The temperature
gradient was: 3 = 60 oC, 4 = 62 oC, 5 = 64.4 oC, 6 = 65.6 oC, 7 = 68 oC, 8 = 70 oC.
Figure 5.5……………………………………………………………………………...........119
1% agarose gels showing products from 62oC – 72oC thermal gradient PCR. A =
PsaE, B = 20s Prot, C = CM4E12, D = Cyt b5, E = Chl LHP. On all of the gels: 1 =
Hind III λ phage markers, 2 = negative controls. The temperature gradient was: 3 =
62.9 oC, 4 = 65.2 oC, 5 = 66.4 oC, 6 = 67.6 oC, 7 = 69.9 oC, 8 = 72 oC
Figure 5.6…………………………………………………………………………………...120
1% agarose gels showing products from 38oC – 48oC thermal gradient PCR with
GAPDH primers. 1 = Hind III λ phage markers, 2 = negative control, 3 = 38C, 4 =
40 oC, 5 = 42.4 oC, 6 = 44.8 oC, 7 = 48 oC.
Figure 5.7……………………………………………………………………………………121
1% agarose gels showing products from PCR reactions with cDNA templates used to
optimise primers for real time PCR. The gels were loaded as follows: In all gels M =
Hind III λ phage markers. For each target transcript 3 PCRs were run. These 3
reactions were a negative control, the PCR product from iron replete cDNA and the
PCR product from iron limited cDNA. In all of the gels every set of 3 lanes were
loaded in that sequence from left to right. The gels show the PCR products from the
following reactions: A = PsaE, 20s Prot, Cyt b5. B = Chloroplast LHP, CM4E12. C
= Thioredoxin, Fucoxanthin BP (2), Fucoxanthin BP (4). D = Fucoxanthin BP (5),
Cyt bc1, Fucoxanthin BP (1). E = Fucoxanthin BP (6). F = Fucoxanthin BP (7),
PMP. G = DnaJ, UCE. H = Fucoxanthin BP (3). I = Ferredoxin. J = GAPDH.
xiii
xiv
Figure 5.8……………………………………………………………………………………124
Histograms showing mean SE± (n=3) abundance of transcripts in iron limited
Coccolithus pelagicus cultures relative to iron replete controls. A value of 1.0
indicates that a transcript is neither up nor down-regulated. A value greater than 1.0
indicates that a transcript is up-regulated in the iron limited cultures.
Figure 5.9……………………………………………………………………………………128
1% agarose gel showing PCR product from RT real time PCR experiment using
predicted membrane protein (PMP) primers. 1 - Hind III λ phage markers, 2-7 –
Single PCR products of expected size (152 bp).
Figure 5.10………………………………………………………………………………….128
1% agarose gel showing PCR product from RT real time PCR experiment using
Ferredoxin primers. 1 - Hind III λ phage markers, 2 – Single PCR product of
expected size (103 bp).
Figure 5.11………………………………………………………………………………….129
1% agarose gel showing primer dimers and PCR product from RT real time PCR
experiment using GAPDH degenerate primers. 1 - Hind III λ phage markers, 2 + 3 –
Single PCR products of expected size.
Figure 5.12…………………………………………………………………………………..129
1% agarose gel showing PCR product from RT real time PCR experiment using Chl
LHP primers. 1 - Hind III λ phage markers, 2 + 3 – Single PCR products of expected
size (198 bp).
CHAPTER 1: Introduction
1.1 – Phytoplankton
Phytoplankton are free floating photo-autotrophic and mixotrophic micro-organisms
that are responsible for the bulk of primary production in the oceans. Phytoplankton
photosynthesis accounts for approximately 50% of annual global carbon fixation
(Falkowski and Raven 1997). Their taxonomical classification is based on the type of
energy storage molecules they produce, their pigment composition, the structure and
composition of their cell walls, and their locomotory apparatus and cellular
morphology. There are seven major taxonomic groups of phytoplankton. These
include two divisions of the kingdom Protozoa: Euglenophyta and Dinophyta
(Dinoflagellates), the chlorophyceae and prasinophyceae within the kingdom Plantae,
and three divisions of the kingdom Chromista: Cryptophyta, Haptophyta, and the
Heterokonts which include the Bacillariophyceae (Diatoms). In addition there are
several members of the cyanobacteria, which include the smallest of the
phytoplankton (Synechococcus, Prochlorococcus) and the only members of the
phytoplankton capable of fixing atmospheric nitrogen (e.g. Trichodesmium spp.).
While each of these groups is unique, they all exercise a combined influence over the
marine environment and the global climate. Phytoplankton are ubiquitous throughout
the oceans, form the base of marine food webs and are responsible for much of the
biological drawdown of atmospheric CO2 and oxygen production on Earth, thereby
playing a critical role in the regulation of climate.
1
As well as exercising a strong influence over climate and being critical to marine
nutrient cycling, phytoplankton activities can also have other important ecological and
economic implications. Certain species of phytoplankton can form harmful algal
blooms (HABs) when conditions favour their growth. These blooms can be hugely
problematic to marine organisms and elevated levels of toxins can accumulate higher
up the food web. Furthermore, even those species which do not produce toxic
compounds can still be problematic, such is the case when large amounts of foam is
produced by the mucilage surrounding cells of the coccolithophorid Phaeocystis
globosa when it blooms (Seuront et al., 2006; Spilmont et al., 2009). The ecological
and economic implications of such blooms are clear, in particular within the context
of the tourist, fishing, and aquaculture industries. Like many aspects of
phytoplankton biology and ecology, the exact conditions and regulatory mechanisms
controlling harmful algal blooms are not well understood.
The phytoplankton are an extremely diverse group of organisms and do not represent
a monophyletic group, different lineages appear to have evolved independently on
several different occasions, each time independently acquiring chloroplasts by
endosymbiosis events (Falkowski, 2004; Tomitani, 2006; Simon et al., 2008). This is
reflected in the variety of phytoplankton species known. One of the most dominant
phytoplankton groups the diatoms, are fundamentally important to the cycling of
silica in the marine environment, while the coccolithophorids exercise huge influence
over the cycling of carbonate in the ocean.
2
1.1.1 – The coccolithophorids
The coccolithophorids are members of the division Haptophyta, which are
distinguished primarily by the possession of a unique organelle: the haptonema which
is situated between the two flagella. On a superficial level the haptonema appears to
be a flagella-like organelle, however it is structurally different. The haptonema is
composed of a different arrangement of microtubules (Manton, 1964; Gregson, 1993)
than the typical nine plus two arrangement commonly found in the flagella of
eukaryotes. The haptonema can range in length from 160 µm in Chrysochromulina
camella for example, with the ability to coil and uncoil (Leadbeater & Manton, 1969)
or it can also be short and inflexible, minimised to a few microtubules inside the cell
or absent in some rare cases. There is not yet a consensus on the function of the
haptonema, however it has been suggested that it may serve a role in food gathering
and attachment to surfaces (Inouye & Kawachi, 1994). Among the haptophytes the
coccolithophorids are arguably the most important members in terms of influence
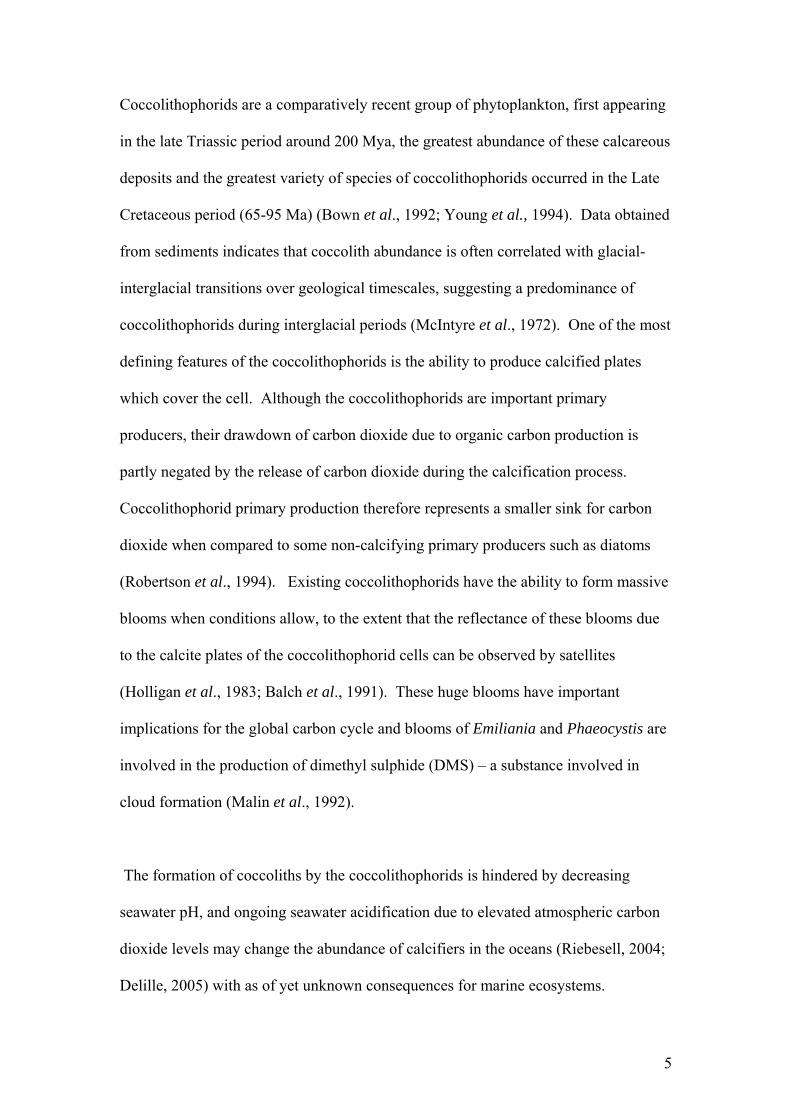
over climate, carbon fixation and certainly calcium carbonate formation. The
coccolithophorids produce calcified scales (coccoliths) which surround the cell and
form the coccosphere as can be seen in figure 1.1. The calcite scales are released
upon cell death and transported to the sea floor where they eventually form the major
constituent of chalk formations.
3
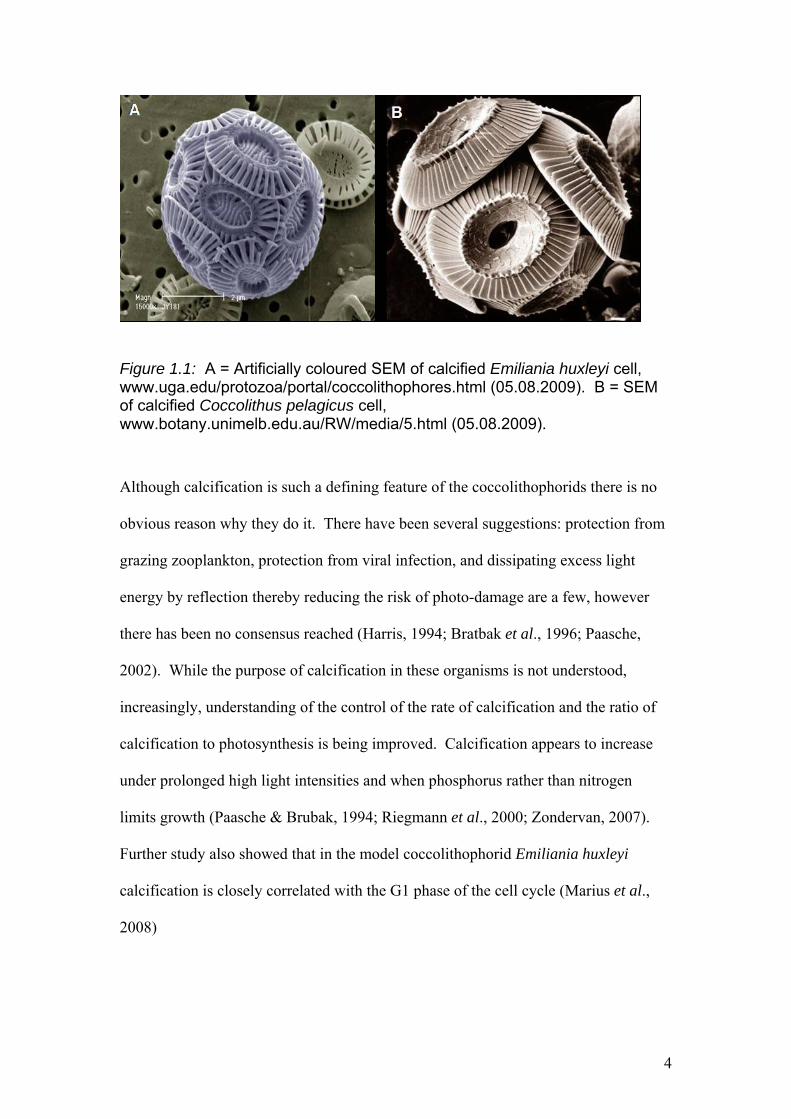
Figure 1.1: A = Artificially coloured SEM of calcified Emiliania huxleyi cell, www.uga.edu/protozoa/portal/coccolithophores.html (05.08.2009). B = SEM of calcified Coccolithus pelagicus cell, www.botany.unimelb.edu.au/RW/media/5.html (05.08.2009).
Although calcification is such a defining feature of the coccolithophorids there is no
obvious reason why they do it. There have been several suggestions: protection from
grazing zooplankton, protection from viral infection, and dissipating excess light
energy by reflection thereby reducing the risk of photo-damage are a few, however
there has been no consensus reached (Harris, 1994; Bratbak et al., 1996; Paasche,
2002). While the purpose of calcification in these organisms is not understood,
increasingly, understanding of the control of the rate of calcification and the ratio of
calcification to photosynthesis is being improved. Calcification appears to increase
under prolonged high light intensities and when phosphorus rather than nitrogen
limits growth (Paasche & Brubak, 1994; Riegmann et al., 2000; Zondervan, 2007).
Further study also showed that in the model coccolithophorid Emiliania huxleyi
calcification is closely correlated with the G1 phase of the cell cycle (Marius et al.,
2008)
4
Coccolithophorids are a comparatively recent group of phytoplankton, first appearing
in the late Triassic period around 200 Mya, the greatest abundance of these calcareous
deposits and the greatest variety of species of coccolithophorids occurred in the Late
Cretaceous period (65-95 Ma) (Bown et al., 1992; Young et al., 1994). Data obtained
from sediments indicates that coccolith abundance is often correlated with glacial-
interglacial transitions over geological timescales, suggesting a predominance of
coccolithophorids during interglacial periods (McIntyre et al., 1972). One of the most
defining features of the coccolithophorids is the ability to produce calcified plates
which cover the cell. Although the coccolithophorids are important primary
producers, their drawdown of carbon dioxide due to organic carbon production is
partly negated by the release of carbon dioxide during the calcification process.
Coccolithophorid primary production therefore represents a smaller sink for carbon
dioxide when compared to some non-calcifying primary producers such as diatoms
(Robertson et al., 1994). Existing coccolithophorids have the ability to form massive
blooms when conditions allow, to the extent that the reflectance of these blooms due
to the calcite plates of the coccolithophorid cells can be observed by satellites
(Holligan et al., 1983; Balch et al., 1991). These huge blooms have important
implications for the global carbon cycle and blooms of Emiliania and Phaeocystis are
involved in the production of dimethyl sulphide (DMS) – a substance involved in
cloud formation (Malin et al., 1992).
The formation of coccoliths by the coccolithophorids is hindered by decreasing
seawater pH, and ongoing seawater acidification due to elevated atmospheric carbon
dioxide levels may change the abundance of calcifiers in the oceans (Riebesell, 2004;
Delille, 2005) with as of yet unknown consequences for marine ecosystems.
5
When the life cycles of some coccolithophorid species were examined it was found
that in Emiliania huxleyi and Phaeocystis spp. there are motile and non-motile phases
which possess a haploid and diploid genome respectively (Course et al., 1994; Vaulot
et al., 1994; Green et al., 1996). In a study by Rayns (1962) it was found that in
Coccolithus pelagicus the heterococcolith-bearing phase was diploid while the
holococcolith bearing phase was haploid.
1.1.2 – The importance of iron in biological systems
Due to its ability to function in a diverse array of biochemical roles in the cell, iron is
required by many biological systems. By virtue of its ability to undergo oxidation-
reduction transitions at physiological pH, it is primarily involved in enzymatic redox
reactions. Iron can also modify the reactivity of active site residues within an enzyme
or serve in a structural role. The photosynthetic and nitrogen assimilatory pathways
are critically dependent on iron availability as are many of the enzymes / electron
carriers involved in respiration. Paradoxically, however, given its importance in the
biochemistry of the cell, the solubility of iron at seawater pH (~8.2) is low. The
ferrous (Fe2+) form becomes oxidised to Fe3+ and iron is precipitated because the
ferric ion (Fe3+) is highly insoluble in aqueous solution under oxic conditions.
Consequently, one of the most abundant metals on Earth is relatively unavailable to
the organisms occupying the environment that covers most of the planet’s surface.
6
1.1.3 – Marine iron limitation
Understanding the factors that control the size and composition of phytoplankton
communities in the marine environment is critical if the contribution that the ocean
biota makes to the Earth’s climate is to be properly understood. Until the
development of sensitive trace metal sampling techniques in the 1980s, the regulation
of phytoplankton biomass, species composition and primary production by iron was
largely overlooked. As knowledge of the nutrient inventories of the world ocean
developed, however, the late John Martin put forward the “iron hypothesis”. He
suggested that large areas of the ocean where there was high nutrient availability but
low chlorophyll concentrations were the result of iron limited surface waters (Martin,
1990), and not a lack of another nutrient such as phosphate or nitrate. Large
expanses of the world ocean such as the equatorial Pacific, the high Arctic Pacific,
areas of the South Pacific gyre and Southern Ocean have been found to contain
concentrations of iron that are low enough to severely limit primary productivity
(Behrenfield & Kolber, 1999). In the central and eastern equatorial Pacific Ocean
there are sufficient macronutrients in the surface waters to support several doublings
of the phytoplankton standing stock (Barber, 1992). It was suggested that a
significant influx of iron to these iron limited areas could result in a dramatic increase
in phytoplankton biomass. Martin conjectured that the resulting increase in CO2
fixation could perhaps exert enough influence on the climate to contribute to the onset
of an ice age with the previously iron limited areas acting as large carbon sinks
(Martin, 1990). Iron fertilisation experiments in high nutrient – low chlorophyll
(HNLC) regions, namely in the equatorial Pacific (IRONEX I) (Martin et al., 1994)
and IRONEX II (Coale et al., 1996)) and the Southern Ocean (SOIREE and
EISENEX 1) (Boyd et al., 2000; Boyd & Law., 2001), have confirmed that increasing
7
the concentration of iron in surface waters causes a dramatic increase in
phytoplankton biomass. In IRONEX I a single enrichment of an experimental patch
of the equatorial Pacific Ocean with 4 nM dissolved iron was carried out. A large
increase in phytoplankton biomass was observed and yet nitrate drawdown was less
than 0.2 µM and the biogeochemical response over the patch was of a lesser
magnitude than expected (Martin et al., 1994). IRONEX II was carried out in 1996 to
test hypotheses developed from IRONEX I to explain the lack of a biogeochemical
response. Secondary limitation due to the depletion of a second nutrient, and iron
being quickly lost from the fertilised area were among the hypotheses. In IRONEX II
successive iron enrichments were carried out over a longer period of time in order to
maintain elevated iron concentrations, while other potentially limiting nutrients and
zooplankton grazing were carefully monitored. As with IRONEX I, a large increase
in phytoplankton biomass was observed. In the second experiment, however, large
quantities of nitrate and CO2 were drawn down during the development of the bloom
(Coale et al., 1996) thus confirming that the phytoplankton were iron limited.
1.1.4 – Iron supply to the ocean
Since there is no marine source of iron, open ocean phytoplankton are dependent upon
iron supplied from aeolian dust originating from continental landmasses and deposited
in the marine surface layer through wind-driven transport. Estimates of the amounts
of iron that are deposited in the oceans as a result of aeolian deposition are varied. In
1991 it was estimated that the total iron flux to the ocean was 3.2 x 10¹³g of iron per
year, assuming a total iron content in the dust of 3.5% by weight (Duce & Tindale,
1991). In 1994 it was proposed that the estimate of Duce and Tindale (1991) was too
high by a factor of five (Rea, 1994). The data gathered by Rea (1994) were based on
8
analyses of marine sediment cores while the data generated by Duce and Tindale
(1991) were the result of a series of field measurements that assumed a dust iron
content of 3.5% in the air. Despite uncertainties surrounding the exact amount of iron
deposited in the ocean, many studies agree that the largest deposition rates are located
adjacent to areas of desert (Duce & Tindale, 1991; Tegen & Fung, 1994, 1995;
Mahowald et al., 1999). However, there is uncertainty surrounding the percentage of
aeolian iron that is soluble upon entering the ocean water (Moore et al., 2002).
1.2 – Iron uptake by phytoplankton
Iron acquisition strategies vary among phytoplankton. Prokaryotes transport iron via
a mechanism which requires the formation of coordination complexes such as
siderophores that can be found localised on the cell membrane or freely in the
surrounding environment after being secreted (Ratledge et al., 1982; Neilands, 1984).
While the secretion of Fe3+ - chelating substances into the environment is not unique
to prokaryotic phytoplankton, eukaryotic members studied to date appear to favour a
ferric-reductase based mechanism such as that found in Chlamydomonas reinhardtii
(Lynnes et al., 1998) and Thalassiosira oceanica (Maldonado & Price, 2001). It has
been reported by Anderson and Morel (1980) that iron limited cells of Thalassiosira
weisflogii, a marine diatom, reduce Fe3+ - EDTA complexes to Fe2+. Lynnes et al.
(1998) found that Fe3+ reductase activity increased rapidly upon switching cultures of
the green alga Chlamydomonas reinhardtii grown in Fe sufficient media to media that
was free of Fe. Maldonado and Price (2001) reported that in the marine diatom
Thalassiosira oceanica an Fe limitation-induced cell surface reductase carries out an
extracellular reduction step on Fe3+ chelated by desferrioxamine B. This occurs prior
to uptake of the inorganic iron into the cell and it was suggested that Fe(II) may be re-
9
oxidised to the ferric form before it is taken into the cell following the reduction step
(Maldonado & Price, 2001).
The exact mechanisms by which eukaryotic algae utilise chelator bound iron is
unclear but appears to be varied. While Anderson and Morel (1980) reported that iron
limited cells of the marine diatom Thalassiosira weisfloggi reduce Fe3+- EDTA to
Fe2+, Soria-Degg and Hortsman (1995) found that the marine diatom Phaeodactylum
tricornutum could access both ferrioxamine B and ferrioxamine E-chelated iron as
sources of iron. Intriguingly, evidence from this study indicated that the iron bound
by each chelator was accessed through different uptake mechanisms. Utilisation of
ferrioxamine B bound iron resembles higher-plant strategy I, while utilisation of
ferrioxamine E resembles strategy II (Soria-Degg & Hortsman, 1995). All plants with
the exception of grasses utilise iron acquisition strategy I which is a reduction based
approach which involves acidifying the soil by secreting H+ from their roots, this has
the effect of solubilising iron (Marschner & Romheld, 1994; Schmidt, 2003; Kim &
Guerinot, 2007). Strategy II is a chelation based approach in which iron deficiency
results in the release of small molecular weight Fe3+ binding phytosiderophores from
the plant roots, the Fe3+ - phytosiderophore complexes are then actively taken up by
means of specific transport mechanisms (Marschner & Romheld, 1994; Schmidt,
2003; Kim & Guerinot, 2007). Grasses tend to survive under more drastically iron
deficient conditions as the chelation strategy is more effective than the reduction
strategy, particularly in well buffered calcareous soils (Mori, 1999). It has been
observed that in the green alga Chlamydomonas reinhardtii the activity of the ferric-
chelate reductase enzyme increases with severity of Fe-limited growth rates (Lynnes
et al., 1998; Weger, 1999). The study by Weger (1999) also showed that rates of
10
cupric reductase enzyme activity increased in parallel with those of ferric-chelate
reductase activity as the iron-limited growth became more severe. It was found that
addition of 250 µM Cu(II)-citrate to a culture of Chlamydomonas reinhardtii that was
reducing Fe(III)-EDTA, stimulated cupric reduction while Fe(III)-EDTA reduction
was subsequently inhibited (Weger, 1999). Following addition of 250 µM each of
Cu(II)-citrate and Fe(III)-EDTA to iron limited cultures of Chlamydomonas
reinhardtii, only cupric reduction was observed, suggesting that the same enzyme was
responsible for the reduction of both Fe(III) and Cu(II) or perhaps that two separate
enzymes compete for the same source of reducing power within the cell (Weger,
1999).
Studies on several eukaryotic species have indicated that it is dissolved inorganic iron
that is transported by the cell's Fe transporters (Anderson & Morel, 1982; Hudson &
Morel, 1990, 1993). As the vast majority of Fe in seawater is complexed by organic
chelators (Rue & Bruland, 1995; Wu & Luther, 1995; Witter & Luther, 1998), it is
essential that phytoplankton are able to access at least some of these chelated sources
of iron. The ferric reductase mechanism to dissociate Fe(III) from organic chelators
confers this ability to some eukaryotic phytoplankton that secrete iron chelating
substances. A laboratory study by Boye & van den Berg (2000) found that the
coccolithophore Emiliania huxleyi secreted iron complexing ligands in excess of the
concentrations of iron in the culture medium. The same study showed that these
ligands are released in response to iron addition rather than when iron levels had
declined to limiting concentrations. This response is distinct from siderophore
production in prokaryotes. In prokaryotes siderophores are produced during periods
11
when available iron concentrations are low as opposed to when a fresh input of iron is
experienced.
As well as the release of iron chelators by phytoplankton in response to freshly added
or low levels of iron, there is a further mechanism by which a variety of iron chelators
can enter seawater. Viral lysis (Gobler et al., 1997) and zooplankton grazing
(Hutchins & Bruland, 1994) result in the release of intracellular iron chelating
compounds such as porphyrins, cytochromes and haem proteins into the external
environment. The decomposition of metazoan and protozoan faecal pellets also
releases iron ligands into the water column (Strom, 1993; Head & Harris, 1994)
adding to the pool of organic iron chelators that keep the nutrient potentially
accessible in the euphotic zone of oxic marine environments. Unlike siderophores,
however, such iron chelating substances are not secreted deliberately to solubilise
iron. Potentially, any micro-organism in the marine environment is able to access this
chelated iron. However, it was demonstrated that while Thalassiosira weissflogii and
Skeletonema costatum, two diatom species, could easily utilise porphyrin bound iron
(Hutchins et al., 1999), two species of the cyanobacterium Synechococcus were
relatively less efficient at accessing iron bound to three different porphyrins. By
contrast, cyanobacteria can utilise iron bound to siderophores much more efficiently
than eukaryotic phytoplankton. The ferric-reductase system (Jones et al., 1987;
Weger, 1999; Lynnes et al., 1998; Maldonado & Price, 2001) found in eukaryotes
preferentially accesses iron bound by tetra-dentate porphyrin chelators as opposed to
the typically hexadentate siderophores secreted by prokaryotes (Hutchins et al.,
1999). Hence, the ability of prokaryotes and eukaryotes to access iron bound by
12
different chelators in iron-limited regions may allow for a degree of ecological niche
separation and their co-existence in competition for the same resource.
It has been recently demonstrated that the bloom forming pennate diatoms Pseudo-
nitzschia and Fragilariopsis are able to produce the iron concentrating protein -
ferritin (Marchetti et al., 2009). Ferritin has not been reported previously in any other
algal species and phylogenetic analysis from the study suggested that this small subset
of diatoms obtained the gene by means of lateral transfer. The ability to concentrate
iron during times of iron input in chronically iron limited areas of ocean would allow
for cell division to continue for a time even after the supply of extra-cellular iron was
depleted. It is probable that the ability to utilise ferritin to safely concentrate iron
within the cell contributes to the success of certain pennate diatoms in areas of ocean
characterised by low iron concentrations and infrequent, intermittent inputs (Marchetti
et al., 2009).
1.2.1 – The effect of Iron limitation on Nitrogen assimilation
Two biochemical processes which are highly dependent on iron availability are
nitrogen assimilation and photosynthesis. Iron is a vital component in several
proteins in the photosynthetic electron transport chain and is a co-factor for both
nitrate reductase and nitrite reductase. The nitrate assimilatory pathway is very
demanding of the cell's iron supply. Nitrate reductase which reduces nitrate (NO3-) to
nitrite (NO2-) requires two iron atoms (Campbell, 1999), while nitrite reductase
requires five iron atoms. By contrast, the use of ammonium (NH4+) as a nitrogen
source is far less demanding of a cell's Fe supply. NH4+ can be incorporated into
amino acids directly after uptake by the cell.
13
It has been hypothesised (Raven et al., 1992) and experimental studies have shown
that nitrate assimilation is severely impaired in marine phytoplankton under iron
limited conditions (Maldonado & Price, 1996). Raven et al. (1992) estimated that
phytoplankton growing on nitrate would require 60% more iron than those growing
on ammonium. The later study by Maldonado & Price (1996) found that cultures of
marine diatoms grown with NO3- as a sole nitrogen source required 1.8 times more Fe
than those cultures provided with NH4+. However, the study showed that
Thalassiosira oceanica and Thalassiosira weissflogii were able to maintain faster
growth rates in NO3- supplemented media compared to NH4
+ under moderate iron
limiting conditions that would be expected to impair the growth rate of cells utilising
oxidised forms of nitrogen. Despite the fact that Fe was limiting in both the NH4+ and
NO3- cultures, the cells grown on NO3
- were able to acquire the extra Fe that nitrate
reductase and nitrite reductase demand by enhanced Fe uptake which suggests a close
relationship between NO3- utilisation and Fe acquisition. Under severe Fe limitation,
however T. oceanica cultures grew faster with NH4+ as sole nitrogen source
(Maldonado & Price, 1996).
A later study examined the ability of the marine diatom T. weissflogii to assimilate
NO3- under iron replete and iron limited conditions (Milligan & Harrison, 2000).
Under iron replete conditions it was found that the rate limiting step in NO3-
assimilation was the reduction of NO3- by nitrate reductase, since the activity of
nitrite reductase was fifty times higher than that of nitrate reductase (Milligan &
Harrison, 2000). By contrast, during iron limited growth, the activity of nitrite
reductase fell dramatically and became rate limiting to NO3- assimilation. Despite
14
this, the activities of both enzymes were maintained at a rate that exceeded nitrogen
incorporation rates during the period of iron limited growth. As a consequence of the
decreased nitrite reductase activity, nitrite was excreted by cells at a rate of 100 fmol
NO2- cell-1 day-1 which accounted for approximately 10% of the total incorporated
nitrogen (Milligan & Harrison, 2000).
Despite NO2- reduction being the rate limiting step in NO3
- assimilation during severe
iron limited growth, the C:N ratios of iron limited cells were found to be similar to
iron replete cultures (Milligan & Harrison, 2000). This led Milligan & Harrison
(2000) to suggest that the impairment of NO3- assimilation during Fe limited growth
is not a consequence of an inadequate supply of iron cofactor to the enzymes of the
NO3- assimilatory pathway, but is brought about by the shortage of photosynthetically
derived reductant that is essential if oxidised forms of nitrogen are to be utilised. The
same unaltered C:N ratios under Fe limited conditions were observed in the diatom
Chaetoceros muelleri (Davey & Geider, 2001) and Scenedesmus quadricauda
(Chlorophyceae) (Rueter & Ades,1987), leading both groups of investigators to
conclude that iron limited phytoplankton are essentially energy limited. It appears
that in several species of phytoplankton an inability to process photons due to a
shortage of iron results in the shift to NO2- reduction as the rate limiting step in NO3
-
assimilation.
1.2.2 – Effects of iron limitation on photosynthesis and pigment composition
An inability to process photons and generate photosynthetically derived reductant
indicates that the photosynthetic pathway is impaired by iron limitation. Iron is
required by enzymes employed in the production of chlorophyll such as
15
protochlorophyllide reductase. Thus a shortage of cellular Fe may limit the overall
rate of chlorophyll biosynthesis. A reduction in chlorophyll content per cell is not
unique to Fe limited cells. It is also observed under conditions of N, S and P
limitation and thus may be a general stress response to nutrient depletion. The
reduction in chlorophyll a content per cell may be compensated for to an extent by an
accompanying reduction in cell size as has been found in the Antarctic
prymnesiophyte, Phaeocystis sp. (van Leeuwe & Stefels, 1998). Van Leeuwe &
stefels (1998) found that in Phaeocystis sp. the concentration of accessory light
harvesting pigments per cell was similar in both Fe replete and Fe limited cells:
however, the ratio of chl a : accessory light harvesting pigments was greater in Fe
replete cells under both high and low irradiance.
The photosynthetic pathway appears to be the primary target of iron limitation with
photosystem I being the most affected component due to the fact that it is highly iron
enriched. Photosystem I utilises the iron enriched ferredoxin protein as its terminal
electron acceptor under iron replete conditions and several studies have examined the
docking and subsequent electron transfer which takes place between photosystem I
and ferredoxin (Fischer et al., 1998; Setif et al., 2002; Fromme et al., 2003). It has
been demonstrated that the PsaD and PsaE subunits of photosystem I facilitate the
docking of ferredoxin and its functional homolog flavodoxin with photosystem I
(Rousseau et al., 1993; Fischer et al., 1998; Setif et al., 2002). Photosystem I
particles isolated from a psaE deleted mutant of Synechocystis sp. were shown to be
capable of reducing ferredoxin, however they did so at a rate at least 25 times less
than the wild type (Rousseau et al., 1993). It is believed that docking of the
negatively charged ferredoxin with photosystem I is mediated by electrostatic
16
interactions with positively charged residues on the PsaE, PsaD and PsaC subunits
(Fischer et al., 1998). In iron limited cultures of the diatom Chaetoceros muelleri it
was found that under light saturated conditions there was a greater decline in
photosynthetic oxygen evolution than in mitochondrial oxygen consumption rates in
the dark. This suggests that Fe limitation impairs the activity of the photosynthetic
electron transport chain to a greater extent than mitochondrial electron transport
(Davey & Geider, 2001). The study concluded that the primary target of iron
limitation in Chaetoceros muelleri was the photosynthetic electron transport chain,
resulting in a shortage of reducing power in the cell that leads to limited carbon
fixation, reduced nitrogen assimilation and less pigment accumulation. This agrees
with the findings of Milligan and Harrison (2000) who proposed that the nearly
constant C:N ratios found over a range of iron deprived conditions in T. weissflogii
was symptomatic of energy limited nitrite reductase activity.
One way in which Fe limitation affects the photosynthetic apparatus is by causing an
alteration in the pigment composition of the cell. In the diatom Phaeodactylum
tricornutum it was observed by Greene et al. (1991, 1992) that there was an increase
in the ratio of light harvesting pigments to chlorophyll a as was found in Phaeocystis
(van Leeuwe & Stefels, 1998). The study by van Leeuwe & Stefels (1998) found that
in Phaeocystis, synthesis of the light harvesting pigments
19’-butanoyloxyfucoxanthin and 19’-hexanoyloxyfucoxanthin was induced under iron
limitation at the expense of fucoxanthin synthesis which is the main carotenoid
present under Fe replete conditions. A later study reported that addition of iron to
iron limited Phaeocystis antarctica cultures caused a decrease in the ratio of 19’-
hexanoyloxyfucoxanthin to chlorophyll a and an increase in the ratio of fucoxanthin
17
to chlorophyll a (DiTullio et al., 2007). As Fe limited cells effectively suffer from an
excess of absorbed light energy the change in composition of the light harvesting
pigments may be a photo-protective response. A switch in the light harvesting
pigments from fucoxanthin under iron replete conditions to acyloxyfucoxanthins
under iron limited conditions may reduce the efficiency of energy transfer to the
photosystems. This would ensure that the redox balance of the photosynthetic
electron transport chain is maintained thereby reducing the likelihood of free radical
formation (van Leeuwe & Stefels, 1998; DiTullio et al., 2007).
Fucoxanthin is not the only photosynthesis related molecule that changes in
abundance under iron limited conditions. A study by Greene et al. (1992) reported
that the chloroplast proteins cyt f, subunit IV – the PQ docking protein in the cyt b6/f
complex and the photosystem II reaction centre protein D1of the chlorophyte
Dunaliella tertiolecta and the marine diatom Phaeodactylum tricornutum all
increased in abundance over various timescales when iron was added to iron limited
cells. Smaller but notable increases in the large subunit of Rubisco and light
harvesting proteins (2-fold and 1.5-fold respectively) were also detected. It has been
observed that supplementing iron limited cells with iron does not result in an
immediate increase in chlorophyll concentrations. Cells recover from chlorosis only
after the redox protein flavodoxin has been replaced by its Fe-S containing functional
homolog ferredoxin (McKay et al., 1999). This delay in chlorophyll biosynthesis
following relief of iron limitation suggests that the cells place a higher priority on
repairing components of the photosynthetic electron transport chain to enhance
photon processing potential per reaction centre than on returning light harvesting
pigments to iron replete levels (McKay et al., 1999). The delay in the accumulation
18
of light harvesting pigments following addition of iron to iron limited phytoplankton
has also been observed in other studies of various phytoplankton species (Greene et
al., 1992; Geider & La Roche, 1994; Coale et al., 1996). Such studies agree with the
observation that chlorophyll biosynthesis and the repair of components of the electron
transport chain are processes that are independent of one another (Guikema, 1987).
1.3 – Flavodoxin and Ferredoxin as Potential Biomarkers of Iron Limitation
If the role of iron in the production ecology of the oceans is to be understood, it is
desirable to develop a means of determining the extent of iron limitation in
phytoplankton in the field that is ideally quick, relatively simple and reliable. An
approach likely to fit these criteria is the use of biomarkers; molecules within
phytoplankton cells that would signal that the cell is suffering from a shortage of iron
and has become physiologically impaired. An appropriate protein or its mRNA
transcript is likely to be the most convenient candidate for a biomarker of iron
limitation and much work has been done to investigate the potential of the ferredoxin
and flavodoxin proteins as biomarkers of iron limitation (LaRoche et al., 1995; Erdner
et al., 1999; McKay et al., 1999). In some species of phytoplankton, iron limited
conditions induce the replacement of the iron containing protein, ferredoxin, with a
functional homolog flavodoxin that does not require iron. Ferredoxin is an important
electron transport protein which is involved in redox reactions in photosynthesis,
respiration, nitrogen assimilation and a variety of other cellular activities.
The various means of confirming iron limitation in the field such as mesoscale
enrichment experiments and bottle assays are associated with various disadvantages
ranging from the risk of contamination with iron to cost and logistical issues. The use
19
of an iron regulated cellular response as an indicator of iron nutritional status could
potentially eliminate these problems. Flavodoxin (LaRoche et al., 1995) and the ratio
of ferredoxin:flavodoxin (Doucette et al., 1996) have been proposed as bio-markers of
iron nutritional status in marine phytoplankton. A study by Erdner et al. (1999) found
that flavodoxin induction was a response specific to iron limitation across a range of
phytoplankton classes and was insensitive to light stress, phosphate, nitrate, silicate
and zinc deficiency. The study suggests that measuring the ratio of ferredoxin to
flavodoxin may be a sensitive method of determining the severity of iron stress.
Replacement of ferredoxin with flavodoxin under iron limited conditions is not a
universal response. Despite suffering from iron limitation, phytoplankton species
across a range of taxonomic groups (dinoflagellates, diatoms and prymnesiophytes)
did not produce flavodoxin (Erdner et al., 1999). While most of the non-flavodoxin
inducing phytoplankton in the study were of coastal rather than oceanic origin, the
majority of the coastal species in the study did produce flavodoxin under iron
limitation.
Ferredoxin and flavodoxin can be purified and readily detected by HPLC / Mass
spectroscopy although other means of detecting and quantifying these proteins have
been examined. An immunological approach was utilised by McKay et al. (1999) in
an attempt to detect ferredoxin in marine phytoplankton and cyanobacteria. The
antibody employed was raised against ferredoxin purified from the marine diatom
Thalassiosira weisflogii. While the approach was effective at detecting a band with a
molecular mass similar to T. weisflogii ferredoxin in a variety of other iron replete
diatoms and some more phylogenetically distant algae, cross reacting proteins were
20
not found in Aureococcus anophagefferens or the coccolithophore Emiliania huxleyii.
Suspected ferredoxin bands were observed in extracts of the green algae Dunaliella
tertiolecta and Chlamydomnas reinhardtii but the reactions were weak. The apparent
limited range of the reactivity of anti-ferredoxin across a spectrum of phytoplankton
classes is likely to result in difficulty in assessing ferredoxin presence and absence in
mixed natural samples. This compounded with the observation that a variety of
eukaryotic phytoplankton species do not appear to produce flavodoxin in response to
iron limitation (Erdner et al., 1999) may have the potential to limit the usefulness of
ferredoxin:flavodoxin ratios as biomarkers of iron nutritional status in the field. In the
study by Erdner et al. (1999) species in which flavodoxin could not be detected
originated mainly from coastal areas where they are highly unlikely to encounter the
low levels of iron observed in the high nutrient low chlorophyll (HNLC) areas of the
open marine environment.
It has been suggested that phytoplankton that are unable to induce flavodoxin in a low
iron environment would be uncompetitive in iron limited water and would form a
very small fraction of the overall biomass. Ferredoxin:flavodoxin ratios, therefore,
might be a useful indicator of iron limitation for the majority of species in an iron
limited phytoplankton community. While this may be the case in most instances, it
has been reported that a Synechocystis PCC 6803 mutant with a disrupted isiB gene
(encoding flavodoxin) can still grow in conditions that result in flavodoxin expression
in the wild type (Kutzki et al., 1998). To compound the potential problems associated
with using a ferredoxin : flavodoxin index to assess the extent of iron limitation, it
was found that the marine diatoms Thalassiosira weissflogii and Phaeodactylum
tricornutum expressed flavodoxin as an early response to low iron concentrations in
21
the environment which did not necessarily correspond to the onset of physiological
impairment and slower growth rate (McKay et al., 1997).
Given the uncertainties and potential pitfalls of relying on a single biomarker it would
be useful to develop alternative biomarkers for iron limitation. Perhaps the most
useful of these might be other proteins associated with photosynthetic electron
transport, the main target for iron limitation, that are common to flavodoxin and non-
flavodoxin producing phytoplankton species.
1.4 – Aims of this study
This investigation aims to study the acclimation of Coccolithus pelagicus to iron
limitation by utilising molecular techniques such as subtractive cDNA hybridisation,
reverse transcription (RT) real time PCR and two dimensional SDS PAGE to probe
gene expression changes and changes in the proteome occurring between iron replete
and iron limited cells. A secondary objective of this study is to use the
aforementioned techniques to attempt to identify potential biomarkers of iron
limitation in C. pelagicus.
22
CHAPTER 2: Materials and Methods
2.1 – Coccolithus pelagicus – maintenance of stock cultures and experimental
cultures
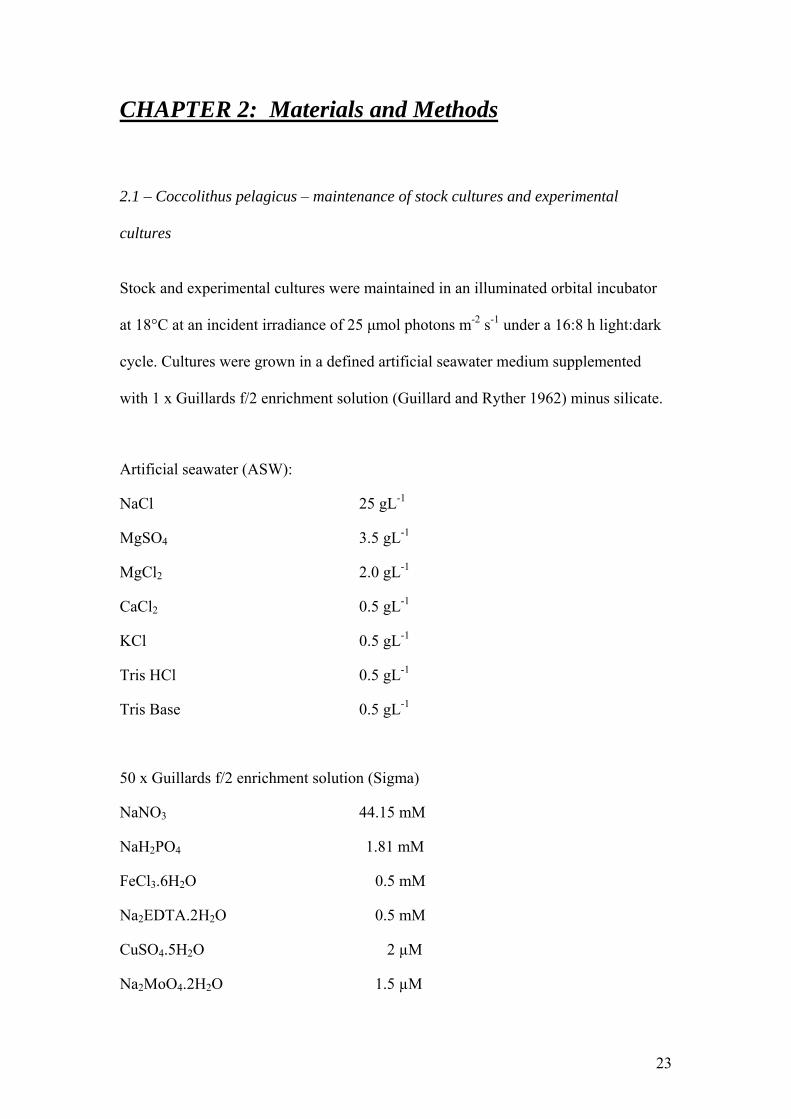
Stock and experimental cultures were maintained in an illuminated orbital incubator
at 18°C at an incident irradiance of 25 μmol photons m-2 s-1 under a 16:8 h light:dark
cycle. Cultures were grown in a defined artificial seawater medium supplemented
with 1 x Guillards f/2 enrichment solution (Guillard and Ryther 1962) minus silicate.
Artificial seawater (ASW):
NaCl 25 gL-1
MgSO4 3.5 gL-1
MgCl2 2.0 gL-1
CaCl2 0.5 gL-1
KCl 0.5 gL-1
Tris HCl 0.5 gL-1
Tris Base 0.5 gL-1
50 x Guillards f/2 enrichment solution (Sigma)
NaNO3 44.15 mM
NaH2PO4 1.81 mM
FeCl3.6H2O 0.5 mM
Na2EDTA.2H2O 0.5 mM
CuSO4.5H2O 2 µM
Na2MoO4.2H2O 1.5 µM
23
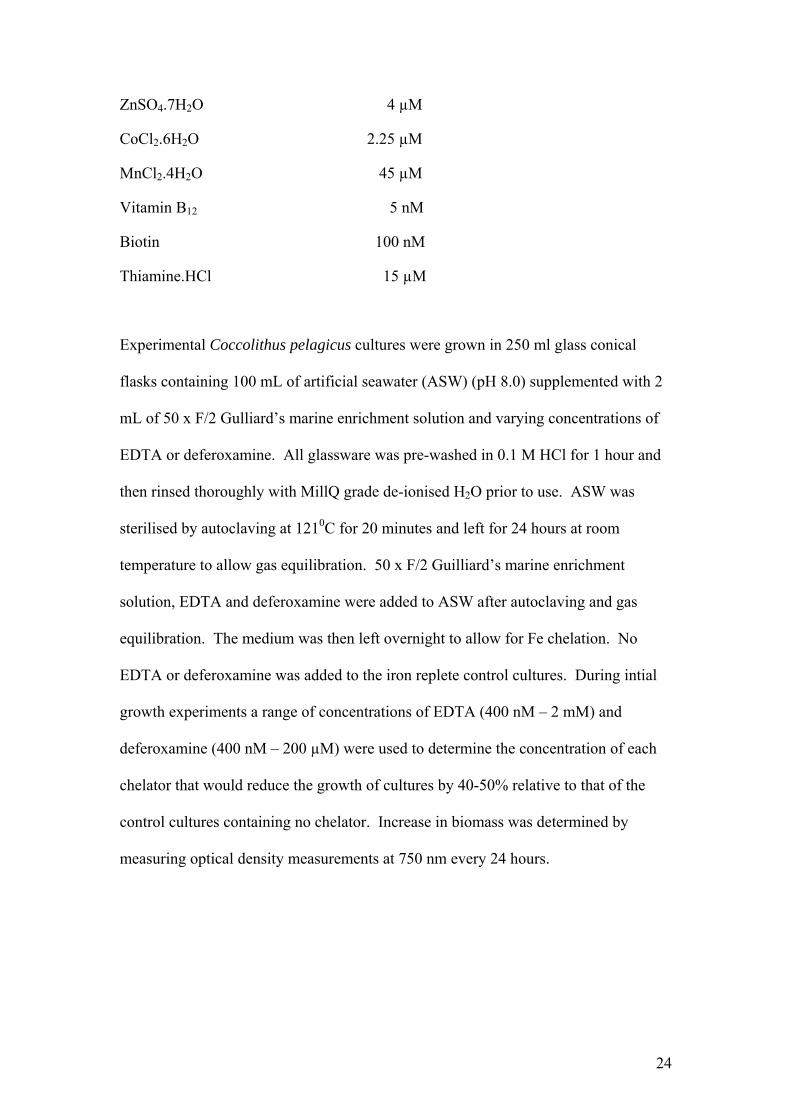
ZnSO4.7H2O 4 µM
CoCl2.6H2O 2.25 µM
MnCl2.4H2O 45 µM
Vitamin B12 5 nM
Biotin 100 nM
Thiamine.HCl 15 µM
Experimental Coccolithus pelagicus cultures were grown in 250 ml glass conical
flasks containing 100 mL of artificial seawater (ASW) (pH 8.0) supplemented with 2
mL of 50 x F/2 Gulliard’s marine enrichment solution and varying concentrations of
EDTA or deferoxamine. All glassware was pre-washed in 0.1 M HCl for 1 hour and
then rinsed thoroughly with MillQ grade de-ionised H2O prior to use. ASW was
sterilised by autoclaving at 1210C for 20 minutes and left for 24 hours at room
temperature to allow gas equilibration. 50 x F/2 Guilliard’s marine enrichment
solution, EDTA and deferoxamine were added to ASW after autoclaving and gas
equilibration. The medium was then left overnight to allow for Fe chelation. No
EDTA or deferoxamine was added to the iron replete control cultures. During intial
growth experiments a range of concentrations of EDTA (400 nM – 2 mM) and
deferoxamine (400 nM – 200 µM) were used to determine the concentration of each
chelator that would reduce the growth of cultures by 40-50% relative to that of the
control cultures containing no chelator. Increase in biomass was determined by
measuring optical density measurements at 750 nm every 24 hours.
24
2.1.2 – Determination of chlorophyll a concentrations
Chlorophyll a concentrations were determined by centrifuging 1 mL of culture at
13,000 rpm for 5 minutes and then re-suspending the cell pellet in 1 ml of 90%
methanol. The methanol – cell pellet re-suspension was left in the dark for 1 hour.
The sample was then centrifuged at 13,000 rpm for 5 minutes and 0.8 ml of the
supernatant was recovered. The absorbance of the supernatant at 665 nm was
determined and chlorophyll a concentrations were estimated using the extinction
coefficient: chlorophyll a (g/ml) = 13.9 x A665nm.
2.1.3. – Growth experiments to confirm iron limitation
Experimental cultures containing EDTA or deferoxamine that were in the exponential
growth phase at growth rates that were approximately 40-50% lower than that of the
corresponding control cultures were used to inoculate fresh 100 ml cultures. ASW
was prepared exactly as described in section 2.1 and supplemented with F/2
Gulliard’s marine enrichment solution to serve as iron replete cultures. The same
culture was also used to inoculate 100 ml of ASW supplemented with F/2 Gulliard’s
marine enrichment solution and containing an additional 200 nM FeCl3 and either
1.25 mM EDTA or 150 µM deferoxamine. Growth rates were determined by
measuring optical density at 750 nm every 24 hours. Cultures were grown at 180C on
a continuous cycle of 16 hours light, 8 hours dark. All glassware used in the growth
experiments was washed in 0.1 M HCl for 1 hour and then rinsed thoroughly with
Milli-Q grade H2O prior to use.
25
2.1.4 – Microscopic examination of Coccolithus pelagicus cells
10 µl of culture was placed on a glass slide and examined under a light microscope
equipped with a CCD camera. The cells were examined at 630 x magnification.
Counts of flagellated / non-flagellated cells were performed at 630 x magnification.
Fresh culture was placed on the microscope slide every 2.5 minutes to avoid any
artefacts due to heating by the light source and counts were resumed.
2.2 – RNA extractions
All glassware and equipment used in the extraction and handling of RNA was sterile
and where possible was washed with diethylpyrocarbonate (DEPC) treated MilliQ
grade distilled water. Where possible all reagents (i.e. those not containing Tris.HCl
or known to be RNase-free) involved in RNA extraction protocols were treated with
DEPC.
DEPC treatment was performed by adding DEPC to solutions at a concentration of
1µl ml-1. The solution was then shaken vigorously and left in a fume cupboard
overnight with the lid left loose. The solution was then autoclaved in order to sterilise
it and to evaporate any residual ethanol formed from the breakdown of DEPC.
2.2.1- Buffers and solutions used for RNA extractions and electrophoresis
DEPC (1 µL ml-1) treated distilled water.
10 x TAE buffer (400 mM Tris-Acetate, 10 mM EDTA)
26
Agarose gels were made by dissolving 1% (w:v) agarose in 1 x TAE buffer
and ethidium bromide was added to a concentration of 0.002%. All apparatus
used in the preparation of gels was soaked in 0.1 M NaOH for 1 hour and then
rinsed extensively with DEPC treated distilled water prior to use.
TE buffer (10 mM Tris-HCl pH 8, 1 mM EDTA)
2.2.2 – Extraction of RNA
RNA was extracted from cultures in exponential growth phase. Cells from 30 ml of
each culture were harvested by centrifugation and either processed immediately or
stored in RNAlater™ (Ambion) at -20oC until RNA was extracted. Cells were
centrifuged at 8,000 x g at 18oC in a bench top centrifuge for 3 minutes and then re-
suspended in 5 ml of RNAlater™ (Ambion). The optical density of the harvested
cultures at 750 nm were as follows: Fe replete (1, 2 & 3) = 0.327, Fe replete (4) =
0.396, 150 µM DF (1) = 0.185, 150 µM DF (2) = 0.206, 150 µM DF (3) = 0.203, 150
µM DF (4) = 0.175.
RNA extractions were performed using the RNAqueous™ kit from Ambion©. Cells
stored in RNAlater™ (Ambion) were centrifuged at 15,000 x g for 5 minutes in order
to pellet the cells. The supernatant was discarded and the cell pellet was quickly re-
suspended in 300–700 µl of RNAqueous™ lysis/binding buffer. The solution was
gently pipetted up and down several times in order to facilitate lysis of the cells.
Once lysis had occurred (as indicated by the increased viscosity of the solution and
the absence of any solid material), an equal volume of 64% ethanol was added and the
tube was gently inverted several times in order to mix the contents. A filter cartridge /
27
collection tube (provided with the kit) was assembled and the lysate / ethanol mixture
was applied to the filter cartridge. The filter cartridge / collection tube assembly was
centrifuged at RCF 15,000 x g in a bench top centrifuge at room temperature for 1
minute to draw the lysate / ethanol solution through the filter. The flow-through was
discarded and the collection tube was re-used in the following washing steps. 700 µl
aliquots of any remaining lysate / ethanol mixture were loaded onto the filter and the
process of drawing the mixture through the filter was repeated in exactly the same
manner as previously described. Once the entire sample had been drawn through the
filter, 700 µl of Wash Solution #1 (supplied with the kit) was applied to the filter
cartridge and drawn through the filter by centrifugation at RCF 15,000 x g in a bench
top centrifuge at room temperature for 1 minute. The flow-through was discarded and
the filter was washed twice with 500 µl Wash Solution #2/3 (supplied with the kit)
using the same procedure as the previous wash step. After the second 500 µl wash,
the wash solution was discarded and the filter cartridge assembly was centrifuged
briefly (10-30 seconds) to draw through any remaining Wash Solution #2/3. The
filter cartridge was then placed inside a fresh collection tube and 40-50 µl of
preheated Elution Solution (75oC) (supplied with the kit) was added to the filter. The
filter cartridge assembly was centrifuged at RCF 15,000 x g for 30 seconds at room
temperature. A second aliquot (10-20 µl) of 75oC Elution Solution was added to the
filter and centrifuged again using the same conditions. Eluted RNA that was not used
immediately was kept at -20oC for short term storage and at -70oC for long term
storage.
28
2.2.3– Spectrophotometric determination of RNA concentration
A dilution of RNA (1:500 – 1:200) was made in DEPC treated MQ and the
absorbance was read at 260 nm and 280 nm. RNA concentrations were calculated
based on an absorbance of 1.0 being equal to 40 µg ml-1 RNA. The DEPC treated
MQ used to dilute the RNA samples was used to blank the spectrophotometer at each
wavelength. The quartz cuvettes used were soaked in concentrated HCl / methanol
(50:50) and then rinsed with DEPC treated MQ before use.
2.2.4 – Electrophoresis of RNA
All glassware and apparatus used in the preparation and running of RNA agarose gels
were soaked in 0.1 M NaOH for 1 hour and then rinsed extensively with DEPC
treated MQ. RNA was run on 1% agarose gels amended to 0.002% ethidium bromide
(room temperature) at 150 V for 10 – 15 minutes and then at 100 V for a further 15
minutes. Samples were run alongside 10µl of Hind III λ phage digest markers.
2.2.5 – Purification of mRNA
mRNA was purified from total cellular RNA samples using the Dynabeads® mRNA
purification kit from Dynal Biotech®.
Assuming that mRNA accounts for between 1 – 5% of total cellular RNA, 100 µg of
RNA should contain between 1.0 – 5.0 µg of mRNA. Total cellular RNA samples
were diluted with DEPC treated MQ to 100 µg in a total volume of 100 µl. RNA
samples were heated at 65oC for 2 minutes and then placed on ice. 200 µl (1 mg) of
29
Dynabeads Oligo (dT)25 were washed once in 100 µl of binding buffer (20 mM Tris-
HCl (pH 7.5), 1.0 M LiCl, 2mM EDTA) (supplied with the kit). The Dynabeads
Oligo (dT)25 were placed on a magnet to separate them from the solution and after 30
seconds the supernatant was removed. The Dynabeads Oligo (dT)25 were then re-
suspended in 100 µl of binding buffer. The Dynabeads Oligo (dT)25 were added to
RNA samples and mixed thoroughly by pipetting before being allowed to anneal to
polyadenylated mRNAs for 5 minutes at room temperature (RT). A magnet was used
to remove the Dynabeads Oligo (dT)25 - mRNA from solution and the supernatant was
removed and discarded before the Dynabeads Oligo (dT)25 were washed twice with
200 µl of Washing Buffer B (provided with kit) (10 mM Tris-HCl (pH 7.5), 0.15 M
LiCl, 1 mM EDTA). The Dynabeads Oligo (dT)25 were re-suspended in 10 µl 10 mM
Tris-HCl pH 7.5 and then heated to 75oC for 2 minutes. The 1.5 ml eppendorf tube
containing the Dynabeads Oligo (dT)25 and mRNA in 10 mM Tris-HCl was then
placed against a magnet and the supernatant (mRNA) was transferred to a fresh,
RNase free tube. The mRNA was used immediately to produce a subtracted cDNA
library.
30
2.3 – cDNA subtraction
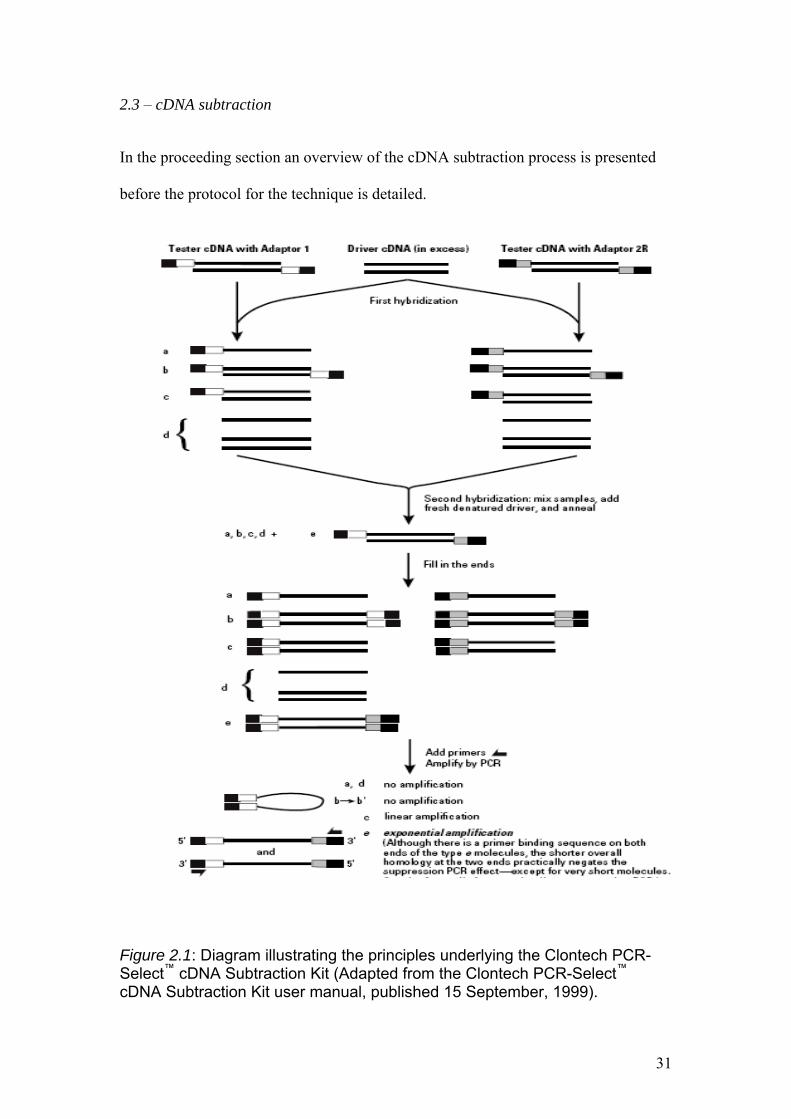
In the proceeding section an overview of the cDNA subtraction process is presented
before the protocol for the technique is detailed.
Figure 2.1: Diagram illustrating the principles underlying the Clontech PCR-Select™ cDNA Subtraction Kit (Adapted from the Clontech PCR-Select™ cDNA Subtraction Kit user manual, published 15 September, 1999).
31
In the first stage of the cDNA subtraction process both populations of mRNA to be
subtracted are converted into double stranded cDNA. The cDNA that contains
specific differentially expressed transcripts is referred to as “tester” cDNA and the
reference cDNA is referred to as “driver” cDNA.
Both the tester and driver cDNAs are disgested by Rsa I and after digestion the tester
cDNA is subdivided into two portions, and each is ligated with a different cDNA
adaptor. The adaptors are de-phosphorylated so that additional adaptors cannot be
ligated to the 5' end of the initial adaptor that is attached to the cDNA. The two
adaptors contain stretches of identical sequence to allow annealing of the PCR primer
once the recessed ends have been filled in. No adaptors are ligated to the driver
cDNAs.
After the adaptor ligations two hybridisations are performed in which each sample of
tester cDNA is mixed with an excess of driver cDNA. The samples are denatured by
heating and allowed to anneal. This generates the type a, b, c, and d molecules in each
sample (see figure 2.1). The single stranded type a molecules are significantly
enriched for differentially expressed sequences, as the cDNAs that are not
differentially expressed form type c molecules with the driver (see figure 2.1).
In the second hybridisation step, the two primary hybridisation samples are mixed
together but are not denatured. Now, only the remaining equalised and subtracted
single stranded tester cDNA molecules are capable of re-associating and forming new
type e hybrids (see figure 2.1). These type e hybrids are double stranded cDNA
molecules with ends which correspond to the sequences of adaptors 1 and 2R (see
section 2.3.8). Thus the type e molecules are the only combination which can undergo
exponential amplification during PCR as the PCR primers target the sequences on the
32
two adaptors. In order to further enrich fraction e for differentially expressed
transcripts freshly denatured driver cDNA is added again (without denaturing the
subtraction mix) and the molecules are allowed to hybridise. After DNA polymerase
has filled in the ends of the type e molecules they will have different annealing sites
for the nested primers on their 5' and 3' ends. These type e molecules represent
differentially expressed sequences.
PCR is carried out on the entire mix to overwhelmingly enrich the sample for
differentially expressed sequences. During PCR, the type a and d molecules are
missing primer annealing sites, and thus cannot be amplified. Due to the suppression
PCR effect, most type b molecules form a pan-like structure (see figure 2.1) that
prevents their exponential amplification. The type c molecules have only one primer
annealing site and thus amplification is only linear. Only the type e molecules, which
have two different adaptors and therefore forward and reverse priming sites, are
capable of undergoing exponential amplification. These amplified sequences are the
equalised, differentially expressed transcripts.
In order to further reduce any background PCR products and to further enrich for
differentially expressed sequences a secondary, nested PCR amplification is
performed. Upon completion of this nested PCR the amplified sequences can be
cloned into a vector and sequenced or can be utilised in a variety of other downstream
applications such as hybridisation probing DNA libraries.
cDNA subtraction was carried out using the PCR-select™ cDNA subtraction kit from
Clontech Laboratories. Both the forward and reverse subtractions were carried out in
accordance with the protocol provided in the PCR-select™ cDNA subtraction kit user
manual. The protocol is detailed here.
33
2.3.1 – Buffers and solutions used for cDNA subtraction
The following solutions were used in the cDNA subtractive hybridisation procedure
but were not provided with the Clontech PCR-Select™ cDNA Subtraction kit. All
other solutions, buffers or enzymes used in the cDNA subtractive hybridisation
procedure were provided with the Clontech PCR-Select™ cDNA Subtraction kit.
Aqua phenol (pH 8.0) (QBioGene)
80% Ethanol
95% Ethanol
Phenol (pH 8.0) : chloroform : isoamyl alcohol (25 : 24 : 1 v/v)
Chloroform : Isoamyl alcohol (24 : 1 v/v)
2.3.2 – First-strand cDNA synthesis
The following components were added to a sterile PCR tube:
Reaction component Per reaction
mRNA 2 - 4 µl
cDNA synthesis primer (10µM) 1 µl
2 µl (containing 2µg of mRNA) of the control mRNA (human skeletal muscle mRNA
provided with the kit) and approximately 1µg of experimental mRNA (mRNA
extracted from Fe replete and Fe limited cultures) were used in the reverse
transcription reactions. dH2O was added to each reaction so that the final volume in
each tube was 5 µl. In total there were 3 reactions set up – a control reaction with
skeletal muscle mRNA, and two reactions to produce the cDNA for the forward and
reverse subtractions. The contents of the PCR tubes were mixed gently by flicking
the tubes and then centrifuged for 10 seconds in a microcentrifuge prior to incubation
34
at 70oC for 2 minutes in a thermal cycler. Following incubation the reactions were
cooled on ice for 2 minutes and then centrifuged briefly.
To each reaction the following components were added:
Per reaction
5X First-strand buffer 2 µl
dNTP mix (10 mM each) 1 µl
Sterile H2O 1 µl
AMV Reverse transcriptase (20 units / µl) 1 µl
The reactions were mixed gently by vortexing and then centrifuged briefly. The
reactions were then incubated at 42oC for 1.5 hours in a thermal cycler with the cycler
lid temperature set to 105oC to prevent any evaporation of the reaction mix. After the
incubation the reactions were placed on ice immediately in order to terminate first
strand cDNA synthesis.
2.3.3 – Second-strand cDNA synthesis
To each of the first-strand cDNA synthesis reactions from section 2.3.2 (containing 10
µl) the following components were added:
per reaction
Sterile H2O 48.4 µl
5X Second–strand buffer 16.0 µl
dNTP mix (10 mM each) 1.6 µl
20X Second-strand enzyme cocktail 4.0 µl
35
The contents of each reaction were mixed gently by flicking the tube and spinning
briefly in a microcentrifuge. The reactions were incubated at 16oC for 2 hours in a
thermal cycler. After the incubation 2 µl (6 U) of T4 DNA polymerase was added to
each reaction and the contents were mixed gently. The reactions were then incubated
at 16oC for a further 30 minutes in a thermal cycler. To terminate the reactions 4 µl of
20X EDTA / Glycogen mix was added to each tube.
100 µl of phenol (pH 8.0) : chloroform : isoamyl alcohol (25 : 24 : 1 v/v) was added
to each reaction. The reactions were then vortexed and centrifuged at 14,000 rpm at
room temperature. The top aqueous layer from each tube was collected and placed in
sterile 0.5 ml microcentrifuge tubes. 100 µl of chloroform : isoamyl alcohol (24 :1
v/v) was added to each of the 0.5 ml tubes and the previous vortexing and
centrifugation steps were repeated in order to separate the phases. Following
centrifugation, the top aqueous phases were collected and placed in sterile 0.5 ml
microcentrifuge tubes. 40 µl of 4M NH4OAc and 300 µl of 95% ethanol was added
to each 0.5 ml tube before vortexing and then centrifugation at 14,000 rpm for 20
minutes at room temperature. The supernatant was carefully removed from each 0.5
ml tube and the cDNA pellet was overlayed with 500 µl of 80% ethanol. Each tube
was centrifuged at 14,000 rpm for 10 minutes at room temperature. The supernatant
was removed taking care not to disturb the pellet and the tubes were left with the caps
open at room temperature for 30 minutes to allow for evaporation of any residual
ethanol. Each pellet was dissolved in 50 µl of sterile H2O and 6 µl from each reaction
was transferred to a fresh PCR tube and stored at -20oC until it was needed to be run
alongside Rsa I digested cDNA.
36
2.3.4 – Rsa I digestion
The remaining cDNA samples produced as described in sections 2.3.2 and 2.3.3 were
digested with the restriction endonuclease Rsa I. The restriction digest was carried
out by combining the following components in PCR tubes for each cDNA sample (3
in total – Skeletal muscle control, iron replete cDNA and iron limited cDNA):
per reaction
ds cDNA 43.5 µl
10X Rsa I restriction buffer 5.0 µl
Rsa I (10 U / µl) 1.5 µl
The reactions were mixed by vortexing and were then centrifuged briefly. The
reactions were then incubated at 37oC for 1.5 hours in a thermal cycler. After the
incubation 5 µl of each restriction digest was set aside on ice to be run on a 1%
agarose gel alongside the un-digested cDNA set aside in section 2.3.3 in order to
observe whether the restriction digest had been successful. 2.5 µl of 20X EDTA /
glycogen mix was added to each restriction digest to terminate the reaction. Digested
cDNA was purified by means of phenol (pH 8.0) : chloroform : isoamyl alcohol (25 :
24 : 1 v/v) purification followed by a further chloroform : isoamyl alcohol (24 : 1 v/v)
step before the cDNA was precipitated by adding 25 µl of 4M NH4OAc and 187.5 µl
of 95% ethanol to each tube. Each tube was centrifuged at 14,000 rpm for 10 minutes
at room temperature in order to pellet the cDNA. The supernatant was carefully
removed and each pellet was overlayed with 200 µl of 80% ethanol. The tubes were
centrifuged at 14,000 rpm for 5 minutes and the supernatants were removed. The
37
cDNA pellets were allowed to dry at room temperature for 30 minutes before they
were each dissolved in 5.5 µl of sterile H2O and stored overnight at -20oC.
The Rsa I digested and un-digested cDNA samples were run out on 1% agarose gels
alongside Hind III digested λ phage markers. The cDNA was visualised on a UV
trans illuminator and the success of the Rsa I restriction digest was confirmed by a
shift in the mean molecular weight of the digested cDNA smear compared to the un-
digested cDNA.
2.3.5 – Adaptor ligation
Blunt ended adaptors were ligated to diluted samples of the cDNAs produced as part
of the subtractive hybridisation procedure. Each tester cDNA sample (3 samples) was
split into two tubes and a different adaptor was ligated to each. After adaptor ligation
there were 3 tubes for each of the original Rsa I digested cDNA samples. The skeletal
muscle tester control was labelled “1” and thus sample 1 with adaptor 1 ligated cDNA
was labelled 1-1 while adaptor 2R ligated cDNA was labelled 1-2 and a tube
containing a mixture of both adaptor ligated cDNA populations was labelled 1C. The
tubes containing the equivalent iron replete and iron limited adaptor ligated cDNAs
were labelled 2-1, 2-2, 2C, 3-1, 3-2 and 3C respectively.
1µl of each Rsa I digested cDNA sample was diluted with 5 µl of sterile H2O and the
remaining cDNA was stored at -20oC to be used later as driver cDNA. Control
skeletal muscle tester cDNA was prepared by diluting Hae III digested ΦX174 DNA
(Sigma-Aldrich) to a final concentration of 150 ng / ml with sterile H2O and then
mixing 5 µl of this with 1 µl of the Rsa I digested control skeletal muscle cDNA.
This control skeletal muscle tester cDNA contained approximately 0.2% Hae III
digested ΦX174 DNA (Sigma-Aldrich), each fragment of which corresponded to
38
approximately 0.02% of the total cDNA. It is these fragments which should be
subtracted by the end of the skeletal muscle control subtraction.
Adaptor ligated tester cDNA was prepared as follows:
A ligation master mix was prepared by mixing the following components together in a
PCR tube. Enough master mix was prepared for all ligations plus one additional
reaction.
Per reaction
Sterile H2O 3 µl
5X Ligation buffer 2 µl
T4 DNA Ligase 400 U / µl) 1 µl
For each experimental tester cDNA (iron replete and limited samples) and for the
control skeletal muscle tester cDNA, the following reagents were combined in the
order shown:
Tube number
1 2
Tester 1-1* Tester 1-2*
Diluted tester cDNA 2 µl 2 µl
Adaptor 1 (10 µM) 2 µl ------
Adaptor 2R (10 µM) ------- 2 µl
Ligation master mix 6 µl 6 µl
Final volume 10 µl 10 µl
The same setup was used for testers 2-1, 2-2, 3-1 and 3-2.
39
In a fresh PCR tube 2 µl of tester 1-1 was mixed with 2 µl of tester 1-2 and after the
completion of the ligation reaction this served as an un-subtracted tester control, it
was labelled 1C. The same was done for the other two cDNA samples 2 and 3 (iron
replete and iron limited cDNAs) and they were labelled 2C and 3C respectively. All 9
of the ligation reactions were centrifuged briefly and then incubated at 16oC overnight
in a thermal cycler. After the overnight incubation 1µl of EDTA / glycogen mix was
added to each tube to terminate the ligation reactions. The reactions were then heated
to 72oC for 5 minutes in a thermal cycler in order to inactivate the ligase. The tubes
were then centrifuged briefly and 1 µl from each un-subtracted tester control reaction
(1C, 2C and 3C) was diluted in 1 ml of sterile H2O. These three diluted samples were
stored at -20oC until required later for PCR. All other ligations were used
immediately in the next stage of the subtractive hybridisation procedure or stored at -
20oC.
2.3.6 – Subtractive hybridisation
In the first hybridisation step an excess of driver (without adaptors) cDNA was mixed
with tester cDNA (adaptor ligated) and the samples were heat denatured together and
then allowed to anneal. Non-target cDNAs common to the driver and tester cDNA
form hybrids under these conditions and the remaining single stranded cDNAs are
enriched for differentially expressed sequences. The first hybridisation was carried
out as follows:
40
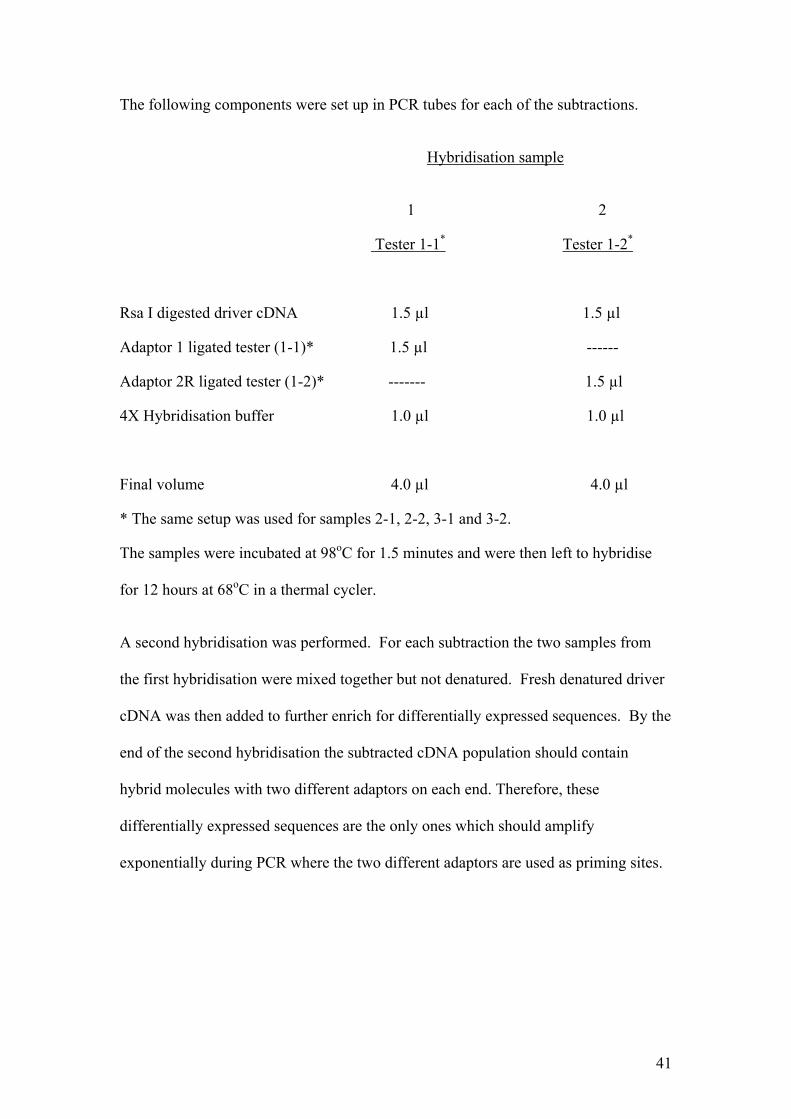
The following components were set up in PCR tubes for each of the subtractions.
Hybridisation sample
1 2
Tester 1-1* Tester 1-2*
Rsa I digested driver cDNA 1.5 µl 1.5 µl
Adaptor 1 ligated tester (1-1)* 1.5 µl ------
Adaptor 2R ligated tester (1-2)* ------- 1.5 µl
4X Hybridisation buffer 1.0 µl 1.0 µl
Final volume 4.0 µl 4.0 µl
* The same setup was used for samples 2-1, 2-2, 3-1 and 3-2.
The samples were incubated at 98oC for 1.5 minutes and were then left to hybridise
for 12 hours at 68oC in a thermal cycler.
A second hybridisation was performed. For each subtraction the two samples from
the first hybridisation were mixed together but not denatured. Fresh denatured driver
cDNA was then added to further enrich for differentially expressed sequences. By the
end of the second hybridisation the subtracted cDNA population should contain
hybrid molecules with two different adaptors on each end. Therefore, these
differentially expressed sequences are the only ones which should amplify
exponentially during PCR where the two different adaptors are used as priming sites.
41
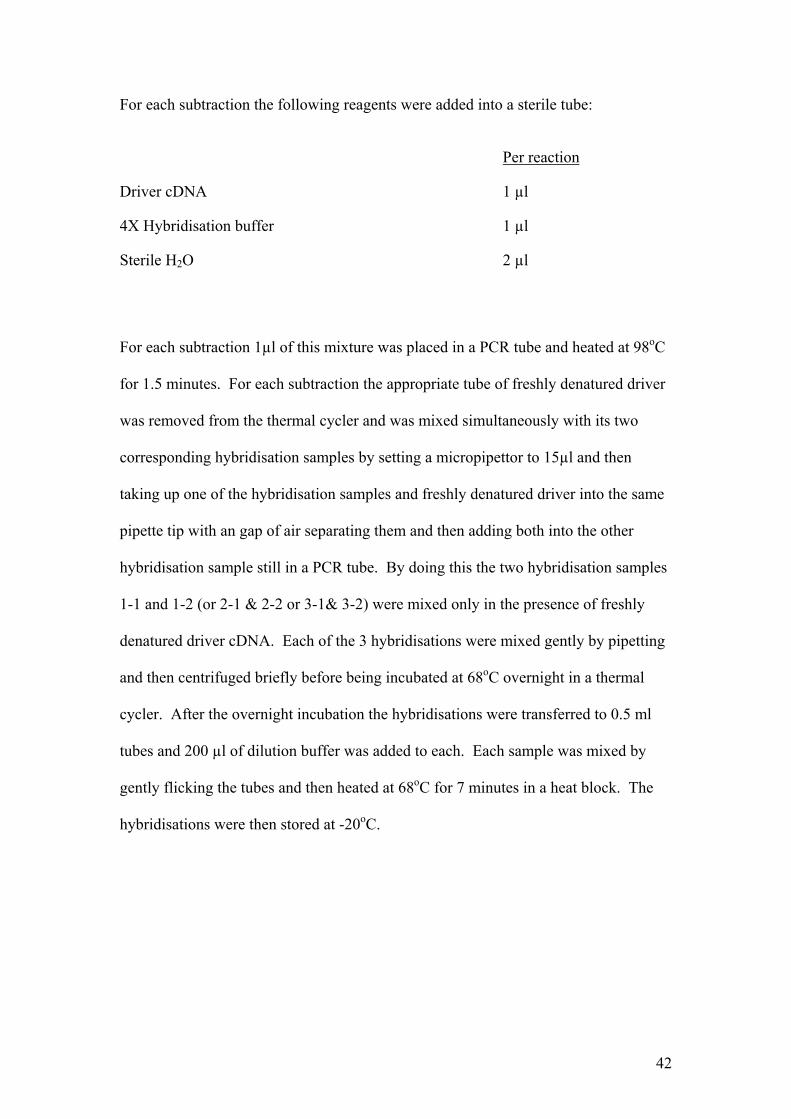
For each subtraction the following reagents were added into a sterile tube:
Per reaction
Driver cDNA 1 µl
4X Hybridisation buffer 1 µl
Sterile H2O 2 µl
For each subtraction 1µl of this mixture was placed in a PCR tube and heated at 98oC
for 1.5 minutes. For each subtraction the appropriate tube of freshly denatured driver
was removed from the thermal cycler and was mixed simultaneously with its two
corresponding hybridisation samples by setting a micropipettor to 15µl and then
taking up one of the hybridisation samples and freshly denatured driver into the same
pipette tip with an gap of air separating them and then adding both into the other
hybridisation sample still in a PCR tube. By doing this the two hybridisation samples
1-1 and 1-2 (or 2-1 & 2-2 or 3-1& 3-2) were mixed only in the presence of freshly
denatured driver cDNA. Each of the 3 hybridisations were mixed gently by pipetting
and then centrifuged briefly before being incubated at 68oC overnight in a thermal
cycler. After the overnight incubation the hybridisations were transferred to 0.5 ml
tubes and 200 µl of dilution buffer was added to each. Each sample was mixed by
gently flicking the tubes and then heated at 68oC for 7 minutes in a heat block. The
hybridisations were then stored at -20oC.
42
2.3.7 – PCR amplification of subtracted cDNA samples
Seven PCR reactions were carried out. (1) The forward subtracted experimental
cDNA, (2) the un-subtracted tester control (tube 2C – see section 2.3.5), (3) the
reverse subtracted experimental cDNA, (4) the un-subtracted tester control for the
control subtraction (tube 3C – see section 2.3.5), (5) the subtracted control skeletal
muscle cDNA, (6) the un-subtracted tester control for the control subtraction (tube 1C
– see section 2.4.5) and (7) the PCR control subtracted cDNA (provided with the
Clontech PCR-Select™ cDNA Subtraction Kit).
During PCR, differentially expressed cDNAs were selectively amplified over primary
and nested PCRs. A brief incubation at 75oC was necessary prior to commencing
PCR in order to fill in the sections of missing ends complementary to the adaptors in
order to produce the binding sites for the primers. Only cDNAs with a different
adaptor on each strand should be amplified exponentially thus enriching the PCR for
subtracted cDNA sequences. A second amplification using nested PCR was carried
out in order to reduce the background cDNAs and further enrich the sample for
subtracted sequences.
PCR templates were prepared on ice by aliquoting 1 µl of each diluted subtracted
cDNA sample (from section 2.3.6) and the corresponding diluted un-subtracted tester
control (from section 2.3.5) into an appropriately labelled PCR tube. 1 µl of the
control subtracted cDNA (provided with the Clontech PCR-Select™ cDNA
Subtraction Kit) was aliquoted into an appropriately labelled tube. A master mix was
prepared as follows:
43
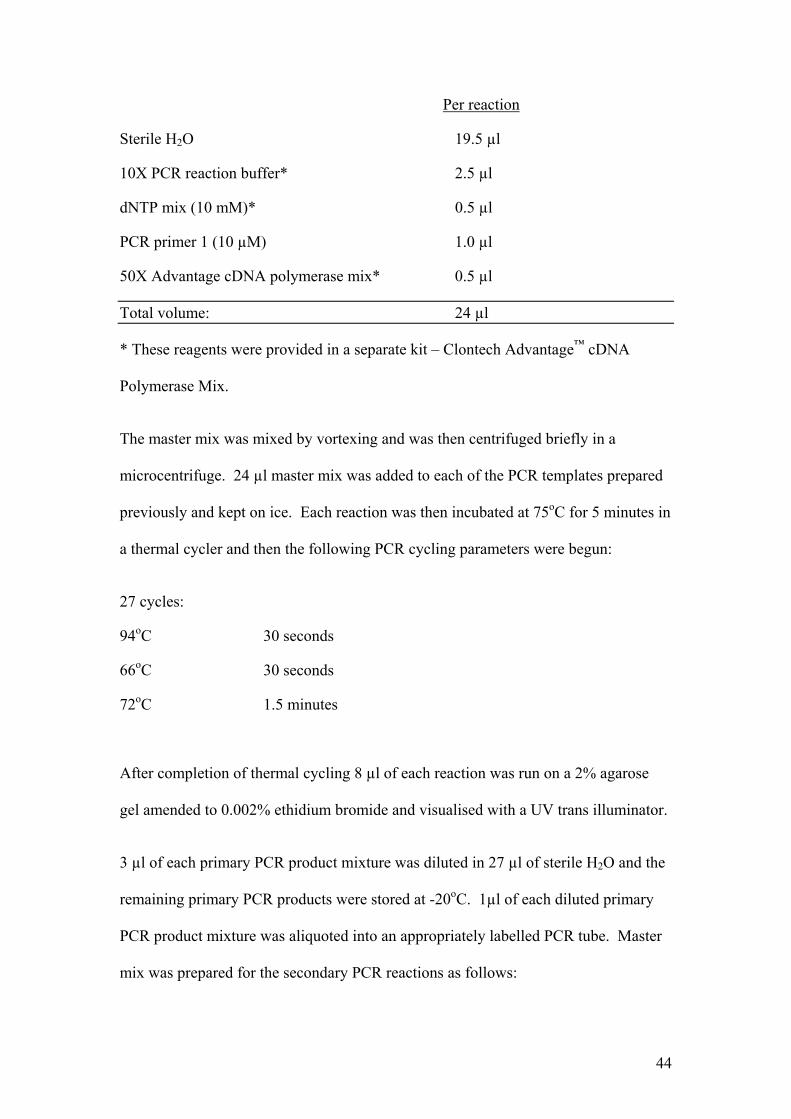
Per reaction
Sterile H2O 19.5 µl
10X PCR reaction buffer* 2.5 µl
dNTP mix (10 mM)* 0.5 µl
PCR primer 1 (10 µM) 1.0 µl
50X Advantage cDNA polymerase mix* 0.5 µl
Total volume: 24 µl
* These reagents were provided in a separate kit – Clontech Advantage™ cDNA
Polymerase Mix.
The master mix was mixed by vortexing and was then centrifuged briefly in a
microcentrifuge. 24 µl master mix was added to each of the PCR templates prepared
previously and kept on ice. Each reaction was then incubated at 75oC for 5 minutes in
a thermal cycler and then the following PCR cycling parameters were begun:
27 cycles:
94oC 30 seconds
66oC 30 seconds
72oC 1.5 minutes
After completion of thermal cycling 8 µl of each reaction was run on a 2% agarose
gel amended to 0.002% ethidium bromide and visualised with a UV trans illuminator.
3 µl of each primary PCR product mixture was diluted in 27 µl of sterile H2O and the
remaining primary PCR products were stored at -20oC. 1µl of each diluted primary
PCR product mixture was aliquoted into an appropriately labelled PCR tube. Master
mix was prepared for the secondary PCR reactions as follows:
44
Per reaction
Sterile H2O 18.5 µl
10X PCR reaction buffer* 2.5 µl
Nested PCR primer 1 (10 µM) 1.0 µl
Nested PCR primer 2R (10 µM) 1.0 µl
dNTP mix (10 mM)* 0.5 µl
50X Advantage cDNA Polymerase Mix* 0.5 µl
Final volume: 24.0 µl
* These reagents are provided in a separate kit – Clontech Advantage™ cDNA Polymerase Mix.
The secondary PCR master mix was mixed by vortexing and was then briefly
centrifuged. 24 µl of secondary PCR master mix was added to each of the secondary
PCR templates prepared previously and the following thermal cycling parameters
were commenced immediately:
12 cycles:
94oC 30 seconds
68oC 30 seconds
72oC 1.5 minutes
8 µl of the secondary PCR products were then run a 2% agarose gel amended to
0.002% ethidium bromide and visualised with a UV trans illuminator and the
remaining PCR products were stored at -20oC.
45
2.3.8 – Sequences of Clontech primers and adaptors used in cDNA subtraction
cDNA synthesis primer:
TTTTGTACAAGCTT30N1N
Adaptor 1:
CTAATACGACTCACTATAGGGCTCGAGCGGCCGCCCGGGCAGGT
Adaptor 2R:
CTAATACGACTCACTATAGGGCAGCGTGGTCGCGGCCGAGGT
PCR primer 1:
CTAATACGACTCACTATAGGGC
Nested primer 1:
TCGAGCGGCCGCCCGGGCAGGT
Nested primer 2R:
AGCGTGGTCGCGGCCGAGGT
2.4. – Cloning and sequencing of subtracted cDNA sequences
The TOPO TA cloning kit from Invitrogen™ was used to ligate cDNA fragments
from both the forward and reverse subtracted libraries into pCR®II-TOPO®. The
ligated plasmids were then used to transform chemically competent and electro-
competent TOP10 One Shot® E.coli cells. Transformants were selected at 37oC for
16 hours on LB agar spread plates containing 100 µg ml-1 ampicillin and 40 µl of a 40
mg ml-1 X-GAL stock spread evenly across the plate. The LB plates contained the
following – tryptone 10 g L-1, NaCl 10 g L-1, Yeast extract 5 g L-1, Bacto agar 15 g L-
1. The LB agar was autoclaved and, once cool enough to handle, approximately 25 ml
was used to pour each agar plate. After 16 hours of growth the plates containing the
E .coli transformants were stored at 4oC overnight.
46
As many successfully transformed recombinant colonies as possible were picked
using sterile pipette tips and each was grown in 250 µl of terrific broth (Yeast extract
24 g L-1, Bacto Tryptone 12 g L-1, K2HPO4 12.5 g L-1, KH2PO4 g L-1) in 96 well
sequencing plates provided with the Edge BioSystems™ SeqPrep™ 96 Plasmid Prep
Kit. The terrific broth contained 100 µg ml-1 ampicillin. The 96 well plates
containing the picked colonies were incubated at 37oC and shaken at 200 rpm for 16
hours prior to plasmid purification.
After the 16 hour incubation the 96 well plates were centrifuged at 2,500 rpm for 3
minutes. The supernatant was decanted by inverting the plate and blotting it on a
paper towel. Cells were resuspended in the remaining terrific broth (approximately 5-
15 µl) by covering the plate with an adhesive sealer and vortexing while ensuring not
to cause any splashing from the wells. 100 µl of lysis solution / enzyme mix
(provided with the kit) was added to each well and plates were shaken gently at room
temperature for 2 minutes. The plates were then allowed to incubate on the bench top
at room temperature for 3 minutes. The lysate in the wells was removed by inverting
the plates and decanting the liquid. 100 µl of wash solution (provided with the kit)
was added to each well and the plates were shaken gently on the bench top. The wash
solution was removed by inverting the plates and decanting the liquid. The contents
of the wells were washed twice with 100 µl of 70% isopropanol. During each 70%
isopropanol wash step the plates were shaken gently on the bench top for 1 minute.
On each occasion the 70% isopropanol was removed by inverting the plates. The
plates were then inverted onto a paper towel and centrifuged at 2000 rpm for 1 minute
in order to remove any residual isopropanol. The plates were left at room temperature
for at least 2 hours to ensure that all isopropanol had evaporated before 40 µl of dH2O
was added to each well. The plates were shaken gently for 2 minutes on the bench top
47
and then allowed to sit for 10 minutes at room temperature before they were covered
with an adhesive sealer and stored at -20oC.
The plasmids were sequenced at the NERC Molecular Genetic Facility at Edinburgh
University by means of automated sequencing (ABI 3730 capillary sequencer).
2.5 – Blast analysis, multiple sequence alignments of subtracted cDNA sequences and
primer design.
The Fe replete and Fe limited sequences obtained from the forward and reverse
subtracted libraries were subjected to BLAST analysis using the BLAST tool facilities
available at the NCBI website (www.ncbi.nlm.nih.gov).
Sequences from the Fe limited subtracted library which returned a strong hit when
subjected to BLAST analysis (Blastn or BlastX) were selected and primers were
designed to amplify those cDNA sequences of interest. The primers were designed
using the Primer3 software available at the Primer3 website (http://frodo.wi.mit.edu/).
In total 17 sets of primers were designed in order to target each sequence of interest.
The primers were as follows:
20s Proteasome subunit (20S Prot) Forward: TGTCTATGAACAGCCGATGC Reverse: GGGCTGCGTCTCATACAGAT Cytochrome b5 like heme / steroid binding domain containing Protein (Cyt b5): Forward: ATAAAACCCGTGCCACTCAG Reverse: ACCGACGAACTCAAGCTGTT
48
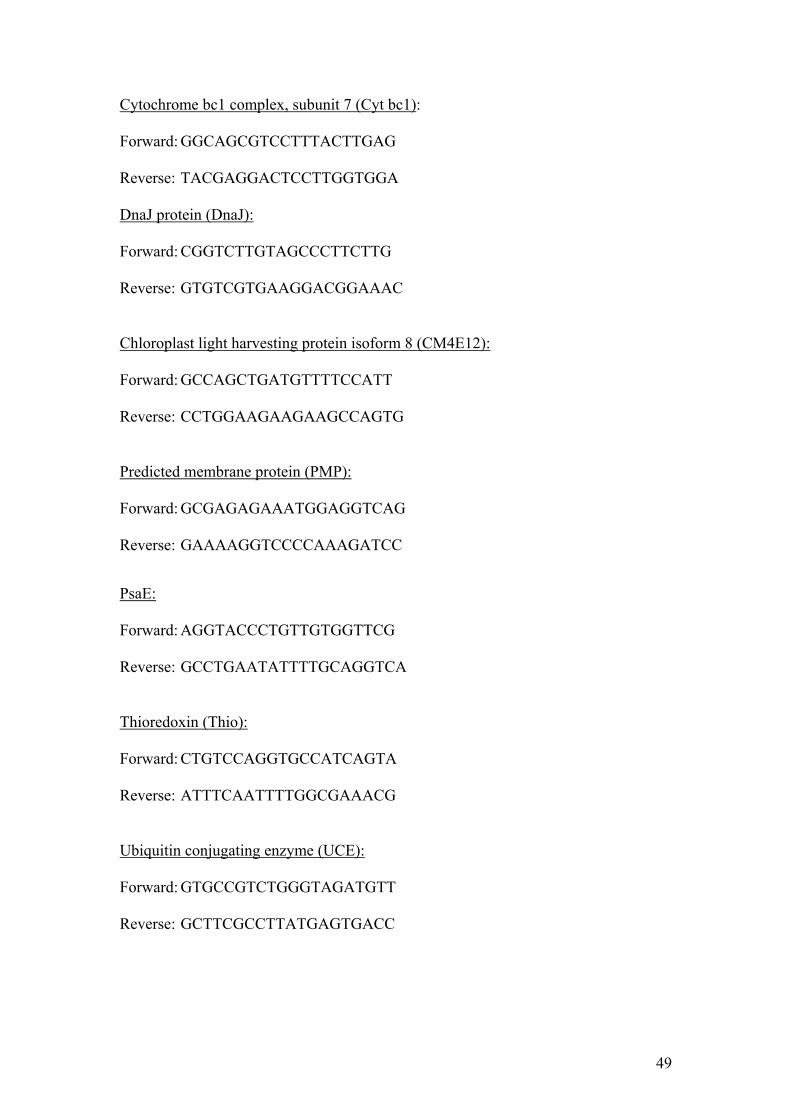
Cytochrome bc1 complex, subunit 7 (Cyt bc1): Forward: GGCAGCGTCCTTTACTTGAG Reverse: TACGAGGACTCCTTGGTGGA DnaJ protein (DnaJ): Forward: CGGTCTTGTAGCCCTTCTTG Reverse: GTGTCGTGAAGGACGGAAAC Chloroplast light harvesting protein isoform 8 (CM4E12): Forward: GCCAGCTGATGTTTTCCATT Reverse: CCTGGAAGAAGAAGCCAGTG Predicted membrane protein (PMP): Forward: GCGAGAGAAATGGAGGTCAG Reverse: GAAAAGGTCCCCAAAGATCC PsaE: Forward: AGGTACCCTGTTGTGGTTCG Reverse: GCCTGAATATTTTGCAGGTCA Thioredoxin (Thio): Forward: CTGTCCAGGTGCCATCAGTA Reverse: ATTTCAATTTTGGCGAAACG Ubiquitin conjugating enzyme (UCE): Forward: GTGCCGTCTGGGTAGATGTT Reverse: GCTTCGCCTTATGAGTGACC
49
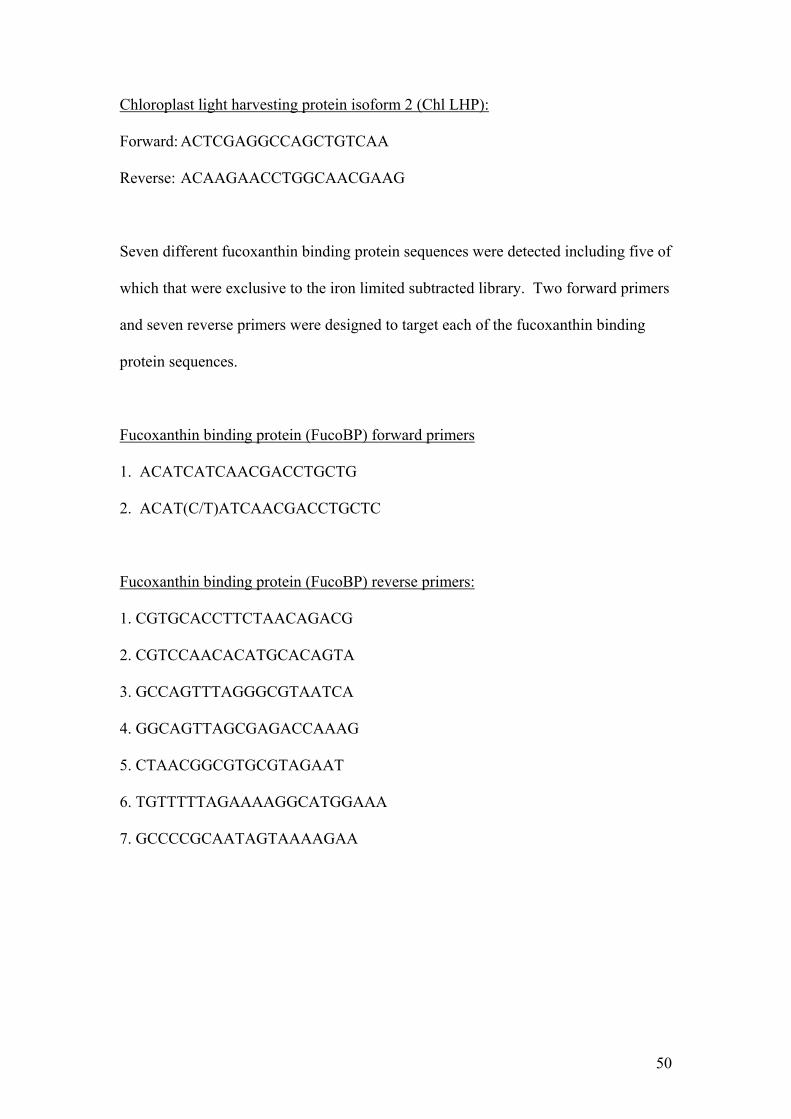
Chloroplast light harvesting protein isoform 2 (Chl LHP): Forward: ACTCGAGGCCAGCTGTCAA Reverse: ACAAGAACCTGGCAACGAAG
Seven different fucoxanthin binding protein sequences were detected including five of
which that were exclusive to the iron limited subtracted library. Two forward primers
and seven reverse primers were designed to target each of the fucoxanthin binding
protein sequences.
Fucoxanthin binding protein (FucoBP) forward primers
1. ACATCATCAACGACCTGCTG
2. ACAT(C/T)ATCAACGACCTGCTC
Fucoxanthin binding protein (FucoBP) reverse primers:
1. CGTGCACCTTCTAACAGACG
2. CGTCCAACACATGCACAGTA
3. GCCAGTTTAGGGCGTAATCA
4. GGCAGTTAGCGAGACCAAAG
5. CTAACGGCGTGCGTAGAAT
6. TGTTTTTAGAAAAGGCATGGAAA
7. GCCCCGCAATAGTAAAAGAA
50
2.5.1 – Design of degenerate primers to target ferredoxin, flavodoxin and
Glyceraldehyde 3-phosphate dehydrogenase (GAPDH)
Degenerate primers were designed based on conserved sequence motifs identified
from multiple sequence alignments to target flavodoxin. Two alternative forward
primers and one reverse primer were designed for flavodoxin. Ferredoxin primers
were designed based on conserved regions of nucleotide sequence between part of a
ferredoxin transcript identified in the iron replete subtracted library from Coccolithus
pelagicus and the ferredoxin sequence of Pavlova lutheri. Degenerate primers were
also designed for the housekeeping gene, glyceraldehyde 3-phosphate dehydrognease
(GAPDH) to be used as a reference to normalise real time PCR results between iron
replete and iron limited cDNA templates. Primers were designed from multiple
sequence alignments of sequences from a range of phytoplankton taxa. The multiple
sequence alignments were produced using the CLUSTALX multiple sequence
alignment software.
Sequences returning the same hits when subjected to BLAST analysis were aligned
using the CLUSTALX multiple sequence alignment software to ensure that the
sequences were identical and that the primers designed would recognize all of the
cDNA fragments which return the same BLAST results. The primer sequences for
Ferredoxin, Flavodoxin and GAPDH were as follows:
Ferredoxin:
Forward: TACGCGGTCACCCTCGTCAC
Reverse: ACGGCAGGTCCAGGCCCTC
51
Flavodoxin:
Forward 1:
GGNAAYACNGARACNGTNGC
Forward 2:
CCNACNTGGMAYACNGGNGC
Reverse:
CCRAANAYNGCNACYTTYTTNCC
GAPDH:
Forward:
TAYGTNTGYGARWSNACNGGN
Reverse:
NGTNGGNACNCKRAANGCCAT
2.6 – Primer optimisation for real-time PCR
Primers were optimised using a gradient thermal cycler (Biometra T-Gradient –
Thistle Scientific). The templates used for optimisation were 1:10 dilutions of the
original plasmids containing the target cDNA fragment as an insert. All PCR
reactions contained 2.5 mM MgCl2 and 2X ReddyMix™ available from Thermo
Scientific was used as master mix. All thermal gradient PCR reactions were run
alongside negative controls. PCR products were run out on 1.0% agarose gels
containing 0.002% ethidium bromide and viewed with a UV trans illuminator. The
PCR reactions and cycling conditions for the thermal gradient PCR primer
optimisations were as follows:
52
PCR Reaction:
Sterile H2O 10 µl (11 µl in negative control reactions)
MgCl2 (25mM) 1 µl
Forward primer 0.25 µl (100 pmol µl-1 stock)
Reverse primer 0.25 µl (100 pmol µl-1 stock)
Template 1 µl
ReddyMix (1.5mM MgCl2) 12.5 µl
Cycling Parameters:
95oC 2 minutes
26 CYCLES:
94oC 30 seconds
Thermal gradient 30 seconds
72oC 1 minute
72oC 10minutes
The optimum annealing temperature determined for each target transcript was as
follows:
38oC = GAPDH
62oC = Fucoxanthin BP (6), Predicted membrane protein, Fucoxanthin BP (3).
65oC = Thioredoxin, Fucoxanthin BP (7), DnaJ, Fucoxanthin BP (2), Fucoxanthin BP
(4), Ubiquitin conjugating enzyme, Fucoxanthin BP (5), Ferredoxin.
67oC = psaE, Chl LHP, 20S proteasome subunit, Cyt b5, CM4E12, Cyt bc1,
Fucoxanthin BP (1) + (3).
53
2.6.1 – cDNA production for real-time PCR
RNA extractions were carried out on Fe replete and Fe limited cultures of
Coccolithus pelagicus. The RNA extractions were carried out using the RNAqueous®
kit employing exactly the same method as described in section 2.2.2 and nucleic acid
concentrations were estimated using the spectrophotometric method described in
section 2.2.3.
The extracted RNA was treated with the TURBO DNA-free™ kit from Applied
Biosystems in order to remove any genomic DNA that was carried over from the
RNA extraction process. Each treatment was carried out in 50 µl volumes with 1 µl
of Turbo DNase enzyme (2U of enzyme) at 37oC for 30 minutes. Samples of the
untreated RNA and the treated RNA were run out on a 1% agarose gel in order to
confirm that any genomic DNA was no longer visible on a gel and that the RNA had
not been degraded during the DNase treatment. The concentration of RNA after
DNase treatment was determined spectrophotometrically.
Approximately 1 µg of RNA was used in each reverse transcription reaction. The
QuantiTect® Reverse Transcription kit available from Qiagen was used to produce
cDNA for use as template in real time PCR reactions. A genomic DNA elimination
reaction was carried out, the reaction contained the following components:
gDNA wipeout buffer, 7x: 4 µl
Template RNA: approximately 2 µg (variable volume)
RNase-free water: variable
TOTAL VOLUME: 28 µl
54
The genomic DNA elimination reaction was incubated in a heat block at 42oC for 2
minutes and was then placed immediately on ice. A reverse transcription master mix
was prepared on ice. The reverse transcription master mix was comprised as follows:
Quantiscript Reverse Transcriptase 2 µl
Quantiscript RT Buffer, 5x 8 µl
RT Primer Mix 2 µl
12 µl of reverse transcription master mix was added to the 28 µl genomic DNA
elimination reaction containing the template RNA. This reaction was incubated for
30 minutes at 42oC in a thermal cycler. Parallel reactions for each template were
carried out omitting Quantiscript reverse transcriptase as a control for any residual
DNA contamination. After the 30 minute incubation the reaction was heated to 95oC
for 3 minutes in a thermal cycler to inactivate the Quantiscript reverse transcriptase.
The reactions were then either used immediately as template in real time PCR
reactions or stored at -20oC. If it was necessary reactions were scaled up linearly to a
maximum reaction volume of 100 µl.
2.6.2 – Testing primers using cDNA as a template
In order to assess the effectiveness of the primers detailed in sections 2.5 and 2.5.1
PCRs were carried out using cDNA as template to check for non-specific products
since the optimum primer annealing temperatures were determined using plasmids
with the target insert as templates. The only possibile non-specific products using
plasmid DNA would have been from complementary sequences within the vector
whereas the complexity of the cDNA was far greater. PCR reactions were run using
55
exactly the same reaction conditions as described in section 2.6 with the exception
that two reactions were run for each primer set, one using iron replete cDNA as
tempate and another using iron limited cDNA as template. The optimum annealing
temperatures determined as described in section 2.6 were used and all reactions were
run alongside negative controls containing no template. The products from the
reactions were run out on 1% agarose gels and PCR products were visualised under
UV radiation.
2.7 – Real time PCR
The cDNA produced as described in section 2.6.1 was used as a template in real time
PCR reactions utilising the primers detailed in sections 2.5 and 2.5.1 in order to
quantitate the relative abundances of the transcripts detected in the iron limited
subtracted library. The cycler used for real time PCR was the Stratagene Mx3000P
real time thermal cycler. PCR tube strips with optical caps were used in all real time
PCR reactions. The PCR reaction composition and thermal cycling parameters were
as follows:
PCR components:
Sterile H2O 10 µl (11 µl in negative control reactions)
Forward primer 0.25 µl (100 pmol µl-1 stock)
Reverse primer 0.25 µl (100 pmol µl-1 stock)
Template 1 µl
Master mix* 12.5 µl
*The master mix used for RT real time PCR was Brilliant® SYBR Green QPCR
Master Mix (Stratagene) containing a final concentration of 2.5 mM MgCl2.
56
95oC 10 minutes
40 cycles:
94oC 30 seconds
Appropriate annealing temperature (see below) 30 seconds
72oC 1 minute
The instrument was set to detect fluorescence at the end of the extension step at 72oC.
Dissociation curves were plotted using fluorescence measurements at 1oC intervals
over a temperature range from 55 oC to 95oC.
Annealing temperatures used for each target transcript were as follows:
38oC = GAPDH
62oC = Fucoxanthin BP (6), Predicted membrane protein, Fucoxanthin BP (3).
65oC = Thioredoxin, Fucoxanthin BP (7), DnaJ, Fucoxanthin BP (2), Fucoxanthin BP
(4), Ubiquitin conjugating enzyme, Fucoxanthin BP (5), Ferredoxin.
67oC = PsaE, 20s proteasome subunit, Cyt b5, CM4E12, Cyt bc1, Fucoxanthin BP (1)
+ (3).
2.7.1 – Data handling: normalising RT real time PCR results to GAPDH transcript
abundance and determining up-regulation of genes in response to iron limitation.
The relative abundance of mRNAs represented in the iron replete and iron limited
cDNA samples was normalised to the transcript abundance of the housekeeping gene
glyceraldehyde 3-phosphate dehydrogenase (GAPDH) in each reaction and the extent
57
to which the target transcript was up-regulated in the iron limited cDNA samples was
calculated. The equation used was:
2(Ct Fe Limited cDNA – Ct GAPDH) / 2(Ct Fe Replete cDNA – Ct GAPDH)
(Wyman & Bird, 2007)
In the equation Ct Fe Limited cDNA and Ct Fe Replete cDNA are the threshold
cycles for the target transcript in the iron limited and iron replete samples respectively
and Ct GAPDH is the threshold cycle of the corresponding GAPDH transcripts in the
iron limited and iron replete cDNA samples. For experiments run in triplicate the
threshold cycle values for each sample were averaged and the mean value obtained
was used in the equation. All GAPDH real time PCR experiments were run in
triplicate.
2.8 – 1-Dimensional and 2-Dimensional SDS-PAGE
Cells were pelleted by centrifugation at 8,000 x g for 3 minutes in a bench-top
centrifuge. The pellets were washed with a sucrose solution (250 mM sucrose, 10
mM Tris pH 8.0) by re-suspending the cells in the sucrose solution and repeating the
centrifugation step. Cells were re-suspended in 100 µl of lysis buffer (0.1 M Tris-
HCl, pH 7.4, 1 mM EDTA, 8 M Urea, 0.05 M dithiothreitol (DTT), 10% glycerol,
5% NP-40, 2% IPG buffer of appropriate pH) and incubated at room temperature for
1 hour. Non-soluble cellular debris was removed from the lysate by centrifugation at
15,000 x g for 5 minutes. Protein was purified from the lysate using the 2D-Clean up
kit (Amersham) according to the manufacturer’s instructions. Purified protein was re-
suspended in an appropriate volume of rehydration buffer (8 M urea, 2% NP-40, 60
58
mM dithiothreitol (DTT), 0.5% IPG buffer of appropriate pH) and protein
concentrations were determined using the 2D Quant Kit (Amersham) according to the
manufacturer’s instructions. Samples were adjusted to the same protein
concentrations and bromophenol blue was added to a concentration of 0.002%. The
protein sample was applied to the immobilised pH gradient (IPG) strip by means of
re-hydration loading. The IPG strip was laid in a channel in a re-swelling tray
containing the protein sample in re-hydration buffer. The strip and protein sample
were sealed off from the air with dry strip cover fluid (Amersham) and left overnight
at room temperature. Immobilised protein gradient (IPG) strips are strips of
acrylamide containing either a linear or non-linear pH gradient mounted on a plastic
backing. They provide a less laborious and more reproducible means of running 2D
SDS-PAGE.
The volume of re-hydration buffer used to re-suspend the protein sample varied
depending on the length of IPG strip that was to be used for isoelectric focussing.
Two different IPG strips were used in this investigation and the lengths of the strips
and the sample volumes were:
IPG strip length Volume of re-hydration buffer applied 7 cm strip (pH 3-10) 125 µl 13 cm strip (pH 4-7) 250 µl
All isoelectric focussing was carried out at 20oC with a maximum current of 50 µA
per IPG strip. The voltage parameters used varied depending on the length of the IPG
strip being used. The voltage parameters for each IPG strip length were as follows:
59
7 cm pH 3-10 IPG strips Voltage mode Voltage (V) Time KVh Step and hold 300 30 minutes 0.2 Gradient 1000 30 minutes 0.3 Gradient 5000 1 hr 20 mins 4.0 Step and hold 5000 25 minutes 2.0 Total 2 hr 45 mins 6.5 13 cm pH 4-7 IPG strips Voltage mode Voltage (V) Time KVh Step and hold 500 1 hr 0.5 Gradient 1000 1 hr 0.8 Gradient 8000 2 hr 30 mins 11.3 Step and hold 8000 55 minutes 7.4 Total 5 hr 25 mins 20.0
After isoelectric focussing IPG strips were equilibrated for second dimension SDS-
PAGE by incubation at room temperature for 15 minutes in 10 ml SDS equilibration
buffer (75 mM Tris-HCl, pH 8.8, 6 M Urea, 30% glycerol, 2% SDS, bromophenol
blue 0.002%, 10 mg ml-1 DTT). A second equilibration was then performed using 10
ml of an equilibration buffer containing iodoacetamide instead of DTT - (75 mM Tris-
HCl, pH 8.8, 6 M Urea, 30% glycerol, 2% SDS, bromophenol blue 0.002%, 25 mg
ml-1 iodoacetamide). The second equilibration was also for 15 minutes at room
temperature. For both equilibrations the IPG strips were placed in sterile tubes
containing the appropriate equilibration buffer and then placed on a rocking platform
for the duration of the incubation.
Equilibrated IPG strips were run out on 12% Tris-Glycine polyacrylamide gels
alongside Mark 12™ unstained protein standards. The IPG strips were placed directly
on top of the resolving gel and sealed in place using a 2% agarose stacking gel.
For 1-D SDS-PAGE a 4% acrylamide stacking gel was used made as follows:
60
Sterile H2O 3.05 ml 0.5Tris HCl, pH 6.8 1.25 ml 10% SDS 50 µl 30 % acrylamide 650 µl 10% Ammonium persulphate 25 µl TEMED 5 µl
The 12% Tris-Glycine polyacrylamide running gels used for 1-D SDS-PAGE and
second dimension electrophoresis of 2-D gels contained the following:
Sterile H2O 3.35 ml 1.5 M Tris HCl, pH 8.0 2.5 ml 10% SDS 100 µl 30 % acrylamide 4.0 ml 10% Ammonium persulphate 50 µl TEMED 5 µl SDS-PAGE electrophoresis was carried out at a constant voltage of 100 V at 4oC in a
cold room. The gels were then stained using the Colloidal Blue Staining Kit
(Invitrogen™) according to the manufacturer’s instructions. Glass containers used to
stain gels were cleaned with de-con in sterile H2O and then with ethanol before
staining. The gel staining containers were covered with cling film and then placed on
bench top rocking platforms in order to facilitate the staining. After 6 hours staining
gels were de-stained overnight in sterile H2O.
2.8.1 – Automated protein spot detection and analysis of 2-D gels.
The gels were scanned and analysis of 2-D gels was carried out using the
ImageMaster 2D Platinum Software (version 5.0). Protein spots were detected
automatically on 2-D gels by the ImageMaster software using the following settings:
Saliency 1.0 Minimum area 5.0 Smooth 2.0
61
The spot detection was scrutinised by eye and the molecular weight marker proteins
were deleted from the detected spots as well as any detected regions that were clearly
not protein spots such as dark areas of the dye front or specks of dust that had not
been eliminated by the minimum area filter.
Reference spots were selected by eye to align the iron replete and iron limited gels in
order to guide the software to highlight differentially expressed proteins. Spot pairs
identified by the software were confirmed by eye and differentially expressed proteins
on both the iron replete and iron limited gel were annotated using the ImageMaster
software.
2.8.2 – Mass spectroscopic analysis of iron replete 2D-SDS PAGE spot FeR1
The prominent spot FeR1 in the iron replete 2D-SDS gel (figure 3.15) was excised
using a micropipette with a sterile 200 µl tip. The excised protein was then stored in a
sterile 1.5 ml tube at -20oC until it was sent for mass spectroscopic and bioinformatic
analysis at the Fingerprints proteomics facility, Post-genomics and Molecular
Interactions Centre, University of Dundee.
2.8.3 – Western blotting
Cells were harvested from Coccolithus pelagicus cultures in exponential growth phase
and lysed by immersion in 500 µl of SDS loading buffer (250 mM Tris-HCl pH 6.8,
2% SDS, 10% glycerol, 20 mM dithiothreitol, 0.01% bromophenol blue). The
samples were incubated at 90oC for 1 minute in a water bath. Protein concentrations
were determined using the 2D Quant Kit (Amersham) according to the manufacturer’s
62
instructions. The SDS gel was run at room temperature, 150 V constant voltage for
90 minutes. Seeblue® (Invitrogen) standard markers were loaded on the gel.
The separated proteins were electroblotted for 2 hours onto a PVDF membrane using
PVDF transfer buffer (25 mM Tris base pH 7.4, 192 mM glycine, 10% methanol) at
room temperature, 65 V (constant voltage). The SDS gel was stained with Coomassie
blue to ensure that the proteins had been transferred to the PVDF membrane and were
no longer present in the gel.
The blot was blocked with blocking buffer (5% goat serum albumin (Sigma), 0.1%
Tween 20, 10 mM Tris base pH 7.4, 0.9% NaCl) at room temperature for 1.5 hours
with constant agitation. The blot was then incubated with a 1:400 dilution of rabbit
anti-actin antibody (Sigma) in blocking buffer. The primary antibody incubation was
conducted for 16 hours at 4oC with constant agitation. After the primary incubation
three 5 minute washes were performed at room temperature using wash buffer (10
mM Tris base pH 7.4, 0.9% NaCl, 0.1% Tween 20) with constant agitation.
The blot was incubated with the secondary antibody (HRP-conjugated goat anti-
rabbit) diluted to 1:10,000 in blocking buffer. The incubations were performed at
room temperature for 30 minutes with constant agitation. After the secondary
antibody incubation the blot was washed four times with wash buffer each time for 5
minutes with constant agitation. A final 5 minute wash in distilled water was
performed in order to remove any residual Tween 20 prior to chemiluminescent
detection.
63

The SuperSignal® West Pico Chemiluminescent Substrate (Pierce) was used to detect
antibody binding according to the manufacturer’s instructions. Optimum exposure
times were determined empirically and found to be 30 seconds.
64
Chapter 3 – Growth experiments and proteomic analysis
3.1 – Coccolithus pelagicus growth experiments
The iron chelating compounds EDTA and deferoxamine were assessed for their
ability to induce iron limitation in cultures of Coccolithus pelagicus. The extent to
which each chelator produced iron limited conditions in cultures was dependent on
the concentration of the chelator. It was found that much greater concentrations of the
divalent cation chelator EDTA were required to produce an iron limited response
compared to deferoxamine which binds ferric iron exclusively. The effects of various
concentrations of each chelator on growth rates and chlorophyll a concentration per
unit biomass, and the response of iron limited cultures to the addition of iron are
presented. Apparent morphological changes associated with both iron replete cells
and iron limited cells are also presented alongside the growth data. The effectiveness
of the chelators at artificially inducing iron limitation in Coccolithus pelagicus
cultures and the possible disadvantages of using such a system are discussed. SDS-
PAGE data and two-dimensional SDS-PAGE gels are presented as evidence that the
proteome of iron limited cells is different from that of their iron replete counterparts
indicating that there are changes occurring at the molecular level which coincide with
iron limitation-induced slower growth rates. Data resulting from attempts to identify
a differentially expressed protein by means of mass spectroscopy and western blotting
are also presented.
The growth of Coccolithus pelagicus in triplicate cultures in artificial sea water
(ASW) containing various concentrations of iron chelators was monitored using
optical density measurements at 750 nm. In conjunction with these growth
65
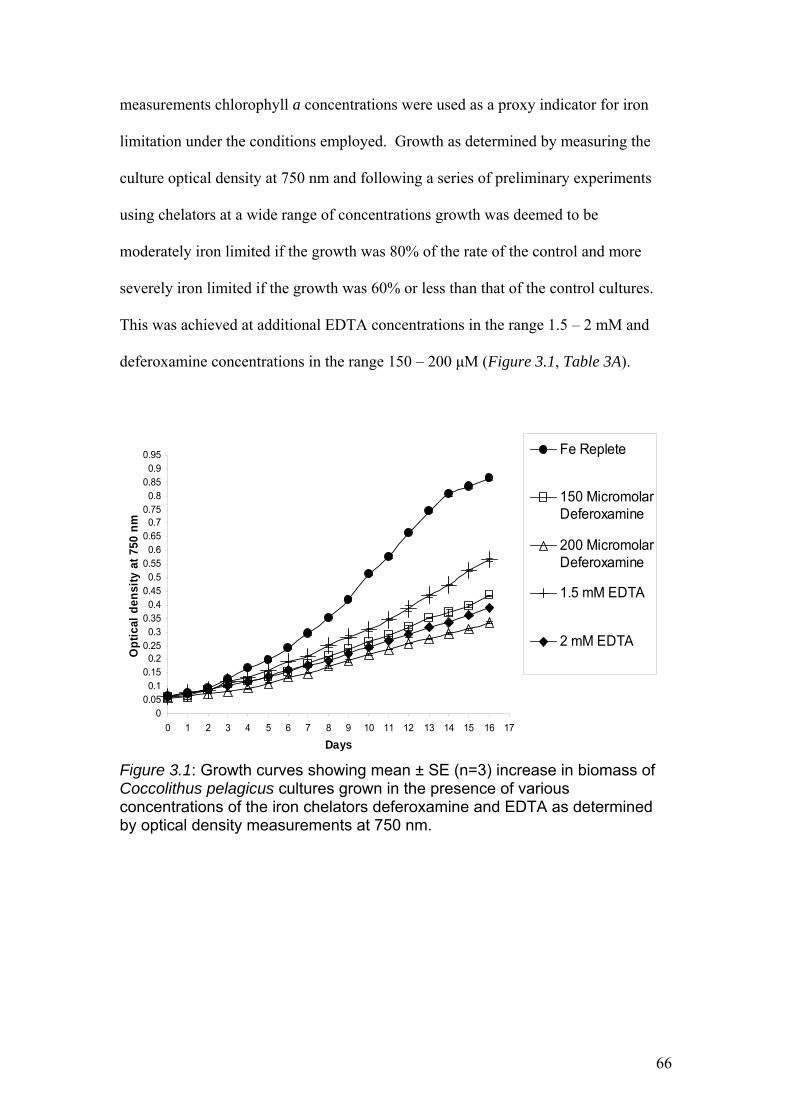
measurements chlorophyll a concentrations were used as a proxy indicator for iron
limitation under the conditions employed. Growth as determined by measuring the
culture optical density at 750 nm and following a series of preliminary experiments
using chelators at a wide range of concentrations growth was deemed to be
moderately iron limited if the growth was 80% of the rate of the control and more
severely iron limited if the growth was 60% or less than that of the control cultures.
This was achieved at additional EDTA concentrations in the range 1.5 – 2 mM and
deferoxamine concentrations in the range 150 – 200 μM (Figure 3.1, Table 3A).
00.050.1
0.150.2
0.250.3
0.350.4
0.450.5
0.550.6
0.650.7
0.750.8
0.850.9
0.95
0 1 2 3 4 5 6 7 8 9 10 11 12 13 14 15 16 17
Days
Op
tica
l d
ensi
ty a
t 75
0 n
m
Fe Replete
150 MicromolarDeferoxamine
200 MicromolarDeferoxamine
1.5 mM EDTA
2 mM EDTA
Figure 3.1: Growth curves showing mean ± SE (n=3) increase in biomass of Coccolithus pelagicus cultures grown in the presence of various concentrations of the iron chelators deferoxamine and EDTA as determined by optical density measurements at 750 nm.
66
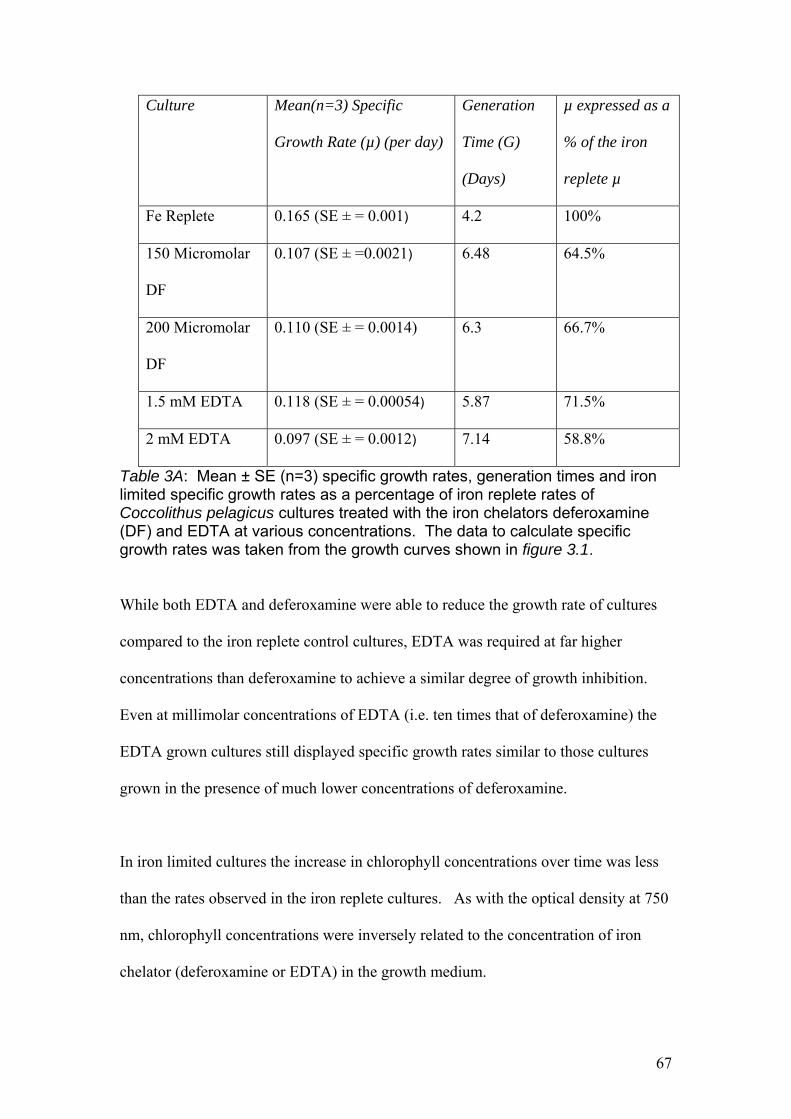
Culture Mean(n=3) Specific
Growth Rate (µ) (per day)
Generation
Time (G)
(Days)
µ expressed as a
% of the iron
replete µ
Fe Replete 0.165 (SE ± = 0.001) 4.2 100%
150 Micromolar
DF
0.107 (SE ± =0.0021) 6.48 64.5%
200 Micromolar
DF
0.110 (SE ± = 0.0014) 6.3 66.7%
1.5 mM EDTA 0.118 (SE ± = 0.00054) 5.87 71.5%
2 mM EDTA 0.097 (SE ± = 0.0012) 7.14 58.8%
Table 3A: Mean ± SE (n=3) specific growth rates, generation times and iron limited specific growth rates as a percentage of iron replete rates of Coccolithus pelagicus cultures treated with the iron chelators deferoxamine (DF) and EDTA at various concentrations. The data to calculate specific growth rates was taken from the growth curves shown in figure 3.1.
While both EDTA and deferoxamine were able to reduce the growth rate of cultures
compared to the iron replete control cultures, EDTA was required at far higher
concentrations than deferoxamine to achieve a similar degree of growth inhibition.
Even at millimolar concentrations of EDTA (i.e. ten times that of deferoxamine) the
EDTA grown cultures still displayed specific growth rates similar to those cultures
grown in the presence of much lower concentrations of deferoxamine.
In iron limited cultures the increase in chlorophyll concentrations over time was less
than the rates observed in the iron replete cultures. As with the optical density at 750
nm, chlorophyll concentrations were inversely related to the concentration of iron
chelator (deferoxamine or EDTA) in the growth medium.
67
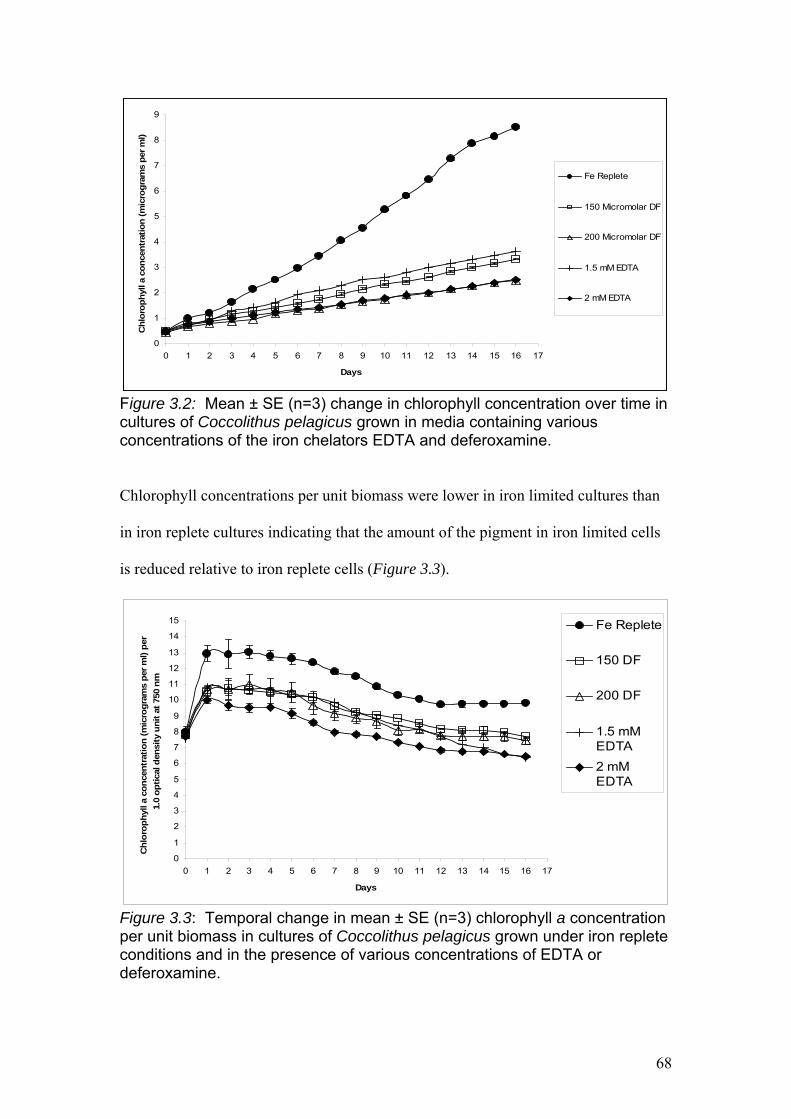
0
1
2
3
4
5
6
7
8
9
0 1 2 3 4 5 6 7 8 9 10 11 12 13 14 15 16 17
Days
Ch
loro
ph
yll a
co
nce
ntr
atio
n (
mic
rog
ram
s p
er m
l)
Fe Replete
150 Micromolar DF
200 Micromolar DF
1.5 mM EDTA
2 mM EDTA
Figure 3.2: Mean ± SE (n=3) change in chlorophyll concentration over time in cultures of Coccolithus pelagicus grown in media containing various concentrations of the iron chelators EDTA and deferoxamine.
Chlorophyll concentrations per unit biomass were lower in iron limited cultures than
in iron replete cultures indicating that the amount of the pigment in iron limited cells
is reduced relative to iron replete cells (Figure 3.3).
0
1
2
3
4
5
6
7
8
9
10
11
12
13
14
15
0 1 2 3 4 5 6 7 8 9 10 11 12 13 14 15 16 17
Days
Ch
loro
ph
yll a
co
nce
ntr
atio
n (
mic
rog
ram
s p
er m
l) p
er
1.0
op
tica
l den
sity
un
it a
t 75
0 n
m
Fe Replete
150 DF
200 DF
1.5 mMEDTA
2 mMEDTA
Figure 3.3: Temporal change in mean ± SE (n=3) chlorophyll a concentration per unit biomass in cultures of Coccolithus pelagicus grown under iron replete conditions and in the presence of various concentrations of EDTA or deferoxamine.
68
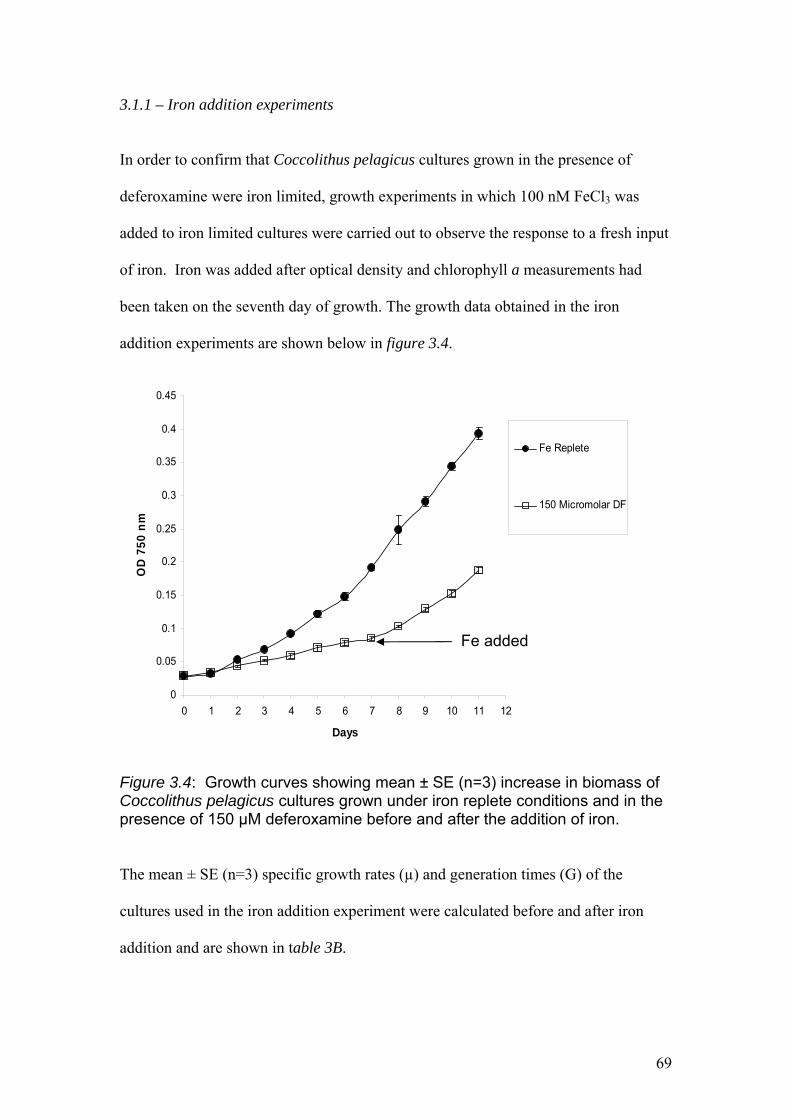
3.1.1 – Iron addition experiments
In order to confirm that Coccolithus pelagicus cultures grown in the presence of
deferoxamine were iron limited, growth experiments in which 100 nM FeCl3 was
added to iron limited cultures were carried out to observe the response to a fresh input
of iron. Iron was added after optical density and chlorophyll a measurements had
been taken on the seventh day of growth. The growth data obtained in the iron
addition experiments are shown below in figure 3.4.
0
0.05
0.1
0.15
0.2
0.25
0.3
0.35
0.4
0.45
0 1 2 3 4 5 6 7 8 9 10 11 12
Days
OD
75
0 n
m
Fe Replete
150 Micromolar DF
Fe added
Figure 3.4: Growth curves showing mean ± SE (n=3) increase in biomass of Coccolithus pelagicus cultures grown under iron replete conditions and in the presence of 150 µM deferoxamine before and after the addition of iron.
The mean ± SE (n=3) specific growth rates (µ) and generation times (G) of the
cultures used in the iron addition experiment were calculated before and after iron
addition and are shown in table 3B.
69
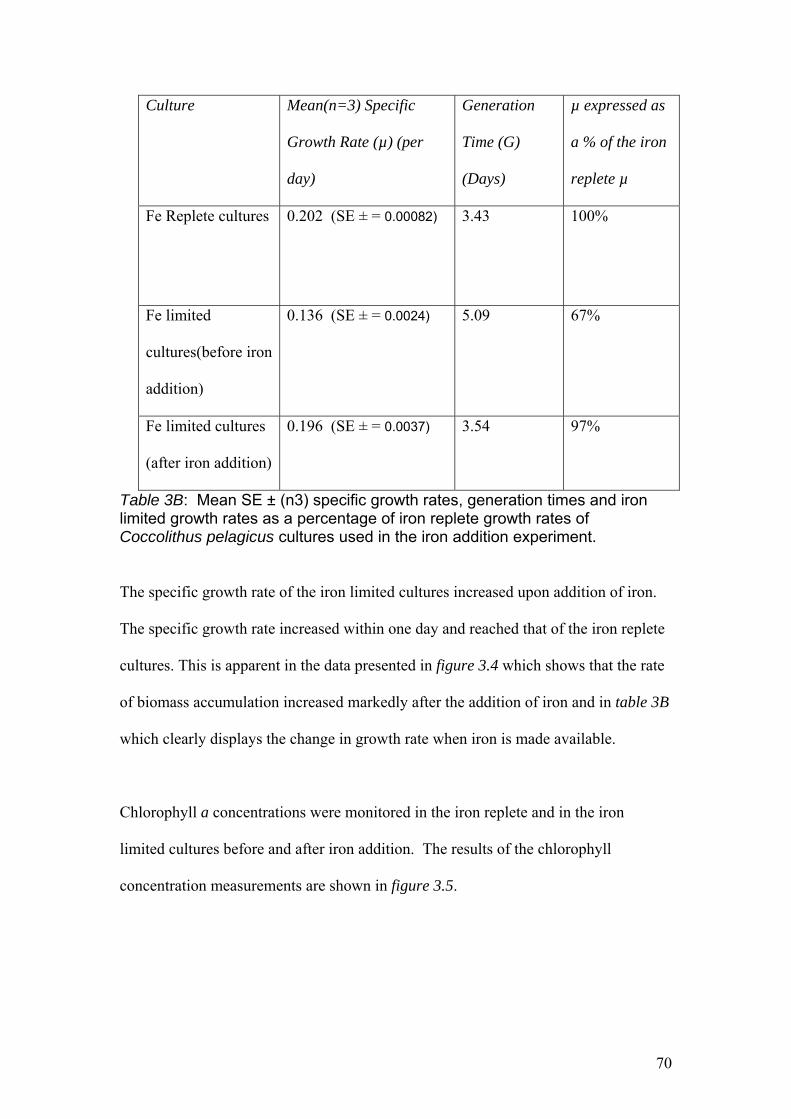
Culture Mean(n=3) Specific
Growth Rate (µ) (per
day)
Generation
Time (G)
(Days)
µ expressed as
a % of the iron
replete µ
Fe Replete cultures 0.202 (SE ± = 0.00082)
3.43 100%
Fe limited
cultures(before iron
addition)
0.136 (SE ± = 0.0024) 5.09 67%
Fe limited cultures
(after iron addition)
0.196 (SE ± = 0.0037) 3.54 97%
Table 3B: Mean SE ± (n3) specific growth rates, generation times and iron limited growth rates as a percentage of iron replete growth rates of Coccolithus pelagicus cultures used in the iron addition experiment.
The specific growth rate of the iron limited cultures increased upon addition of iron.
The specific growth rate increased within one day and reached that of the iron replete
cultures. This is apparent in the data presented in figure 3.4 which shows that the rate
of biomass accumulation increased markedly after the addition of iron and in table 3B
which clearly displays the change in growth rate when iron is made available.
Chlorophyll a concentrations were monitored in the iron replete and in the iron
limited cultures before and after iron addition. The results of the chlorophyll
concentration measurements are shown in figure 3.5.
70
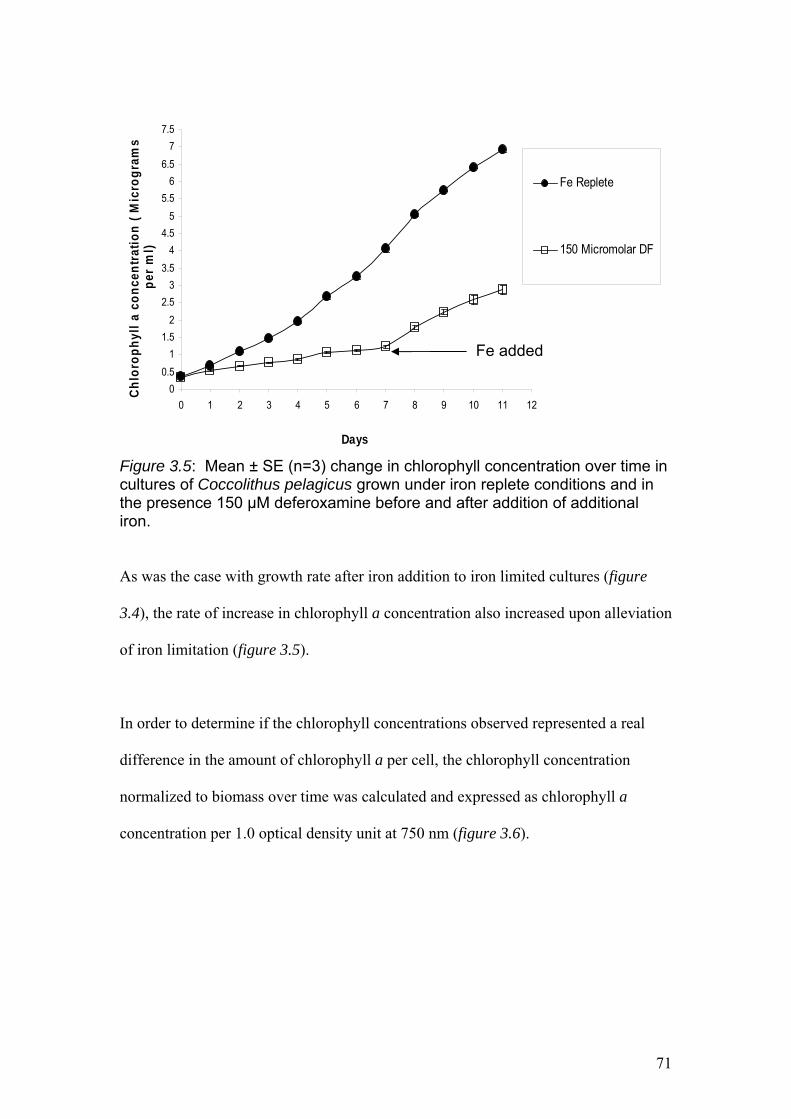
0
0.5
1
1.5
2
2.5
3
3.5
4
4.5
5
5.5
6
6.5
7
7.5
0 1 2 3 4 5 6 7 8 9 10 11 12
Days
Ch
loro
ph
yll
a co
nce
ntr
atio
n (
Mic
rog
ram
s p
er m
l)
Fe Replete
150 Micromolar DF
Fe added
Figure 3.5: Mean ± SE (n=3) change in chlorophyll concentration over time in cultures of Coccolithus pelagicus grown under iron replete conditions and in the presence 150 µM deferoxamine before and after addition of additional iron.
As was the case with growth rate after iron addition to iron limited cultures (figure
3.4), the rate of increase in chlorophyll a concentration also increased upon alleviation
of iron limitation (figure 3.5).
In order to determine if the chlorophyll concentrations observed represented a real
difference in the amount of chlorophyll a per cell, the chlorophyll concentration
normalized to biomass over time was calculated and expressed as chlorophyll a
concentration per 1.0 optical density unit at 750 nm (figure 3.6).
71
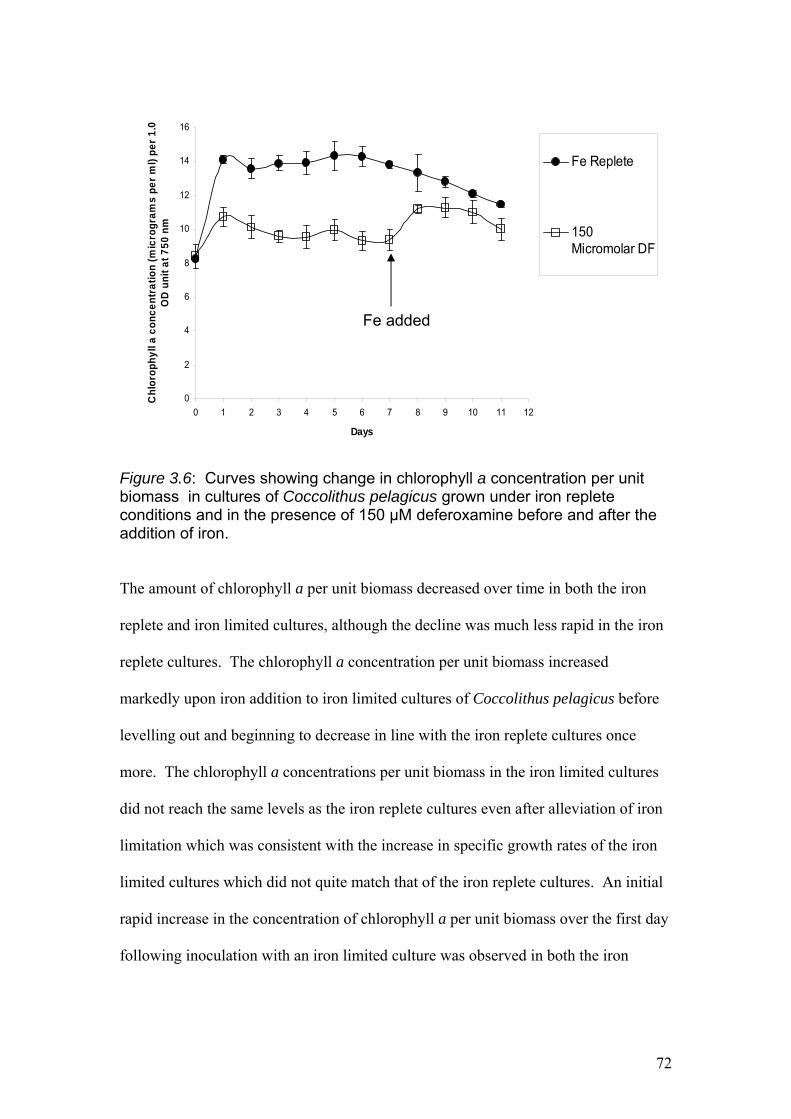
0
2
4
6
8
10
12
14
16
0 1 2 3 4 5 6 7 8 9 10 11 12
Days
Ch
loro
ph
yll
a c
on
ce
ntr
ati
on
(m
icro
gra
ms
pe
r m
l) p
er
1.0
OD
un
it a
t 7
50
nm
Fe Replete
150Micromolar DF
Fe added
Figure 3.6: Curves showing change in chlorophyll a concentration per unit biomass in cultures of Coccolithus pelagicus grown under iron replete conditions and in the presence of 150 µM deferoxamine before and after the addition of iron.
The amount of chlorophyll a per unit biomass decreased over time in both the iron
replete and iron limited cultures, although the decline was much less rapid in the iron
replete cultures. The chlorophyll a concentration per unit biomass increased
markedly upon iron addition to iron limited cultures of Coccolithus pelagicus before
levelling out and beginning to decrease in line with the iron replete cultures once
more. The chlorophyll a concentrations per unit biomass in the iron limited cultures
did not reach the same levels as the iron replete cultures even after alleviation of iron
limitation which was consistent with the increase in specific growth rates of the iron
limited cultures which did not quite match that of the iron replete cultures. An initial
rapid increase in the concentration of chlorophyll a per unit biomass over the first day
following inoculation with an iron limited culture was observed in both the iron
72
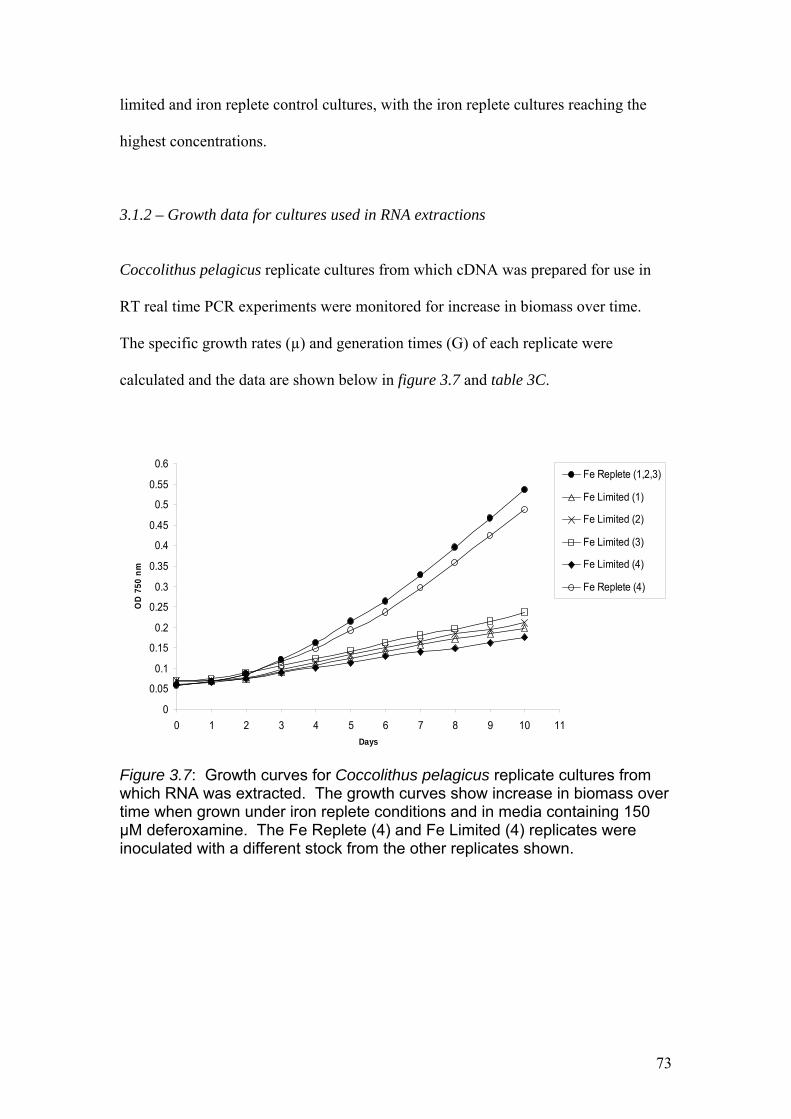
limited and iron replete control cultures, with the iron replete cultures reaching the
highest concentrations.
3.1.2 – Growth data for cultures used in RNA extractions
Coccolithus pelagicus replicate cultures from which cDNA was prepared for use in
RT real time PCR experiments were monitored for increase in biomass over time.
The specific growth rates (µ) and generation times (G) of each replicate were
calculated and the data are shown below in figure 3.7 and table 3C.
0
0.05
0.1
0.15
0.2
0.25
0.3
0.35
0.4
0.45
0.5
0.55
0.6
0 1 2 3 4 5 6 7 8 9 10 11
Days
OD
750
nm
Fe Replete (1,2,3)
Fe Limited (1)
Fe Limited (2)
Fe Limited (3)
Fe Limited (4)
Fe Replete (4)
Figure 3.7: Growth curves for Coccolithus pelagicus replicate cultures from which RNA was extracted. The growth curves show increase in biomass over time when grown under iron replete conditions and in media containing 150 µM deferoxamine. The Fe Replete (4) and Fe Limited (4) replicates were inoculated with a different stock from the other replicates shown.
73
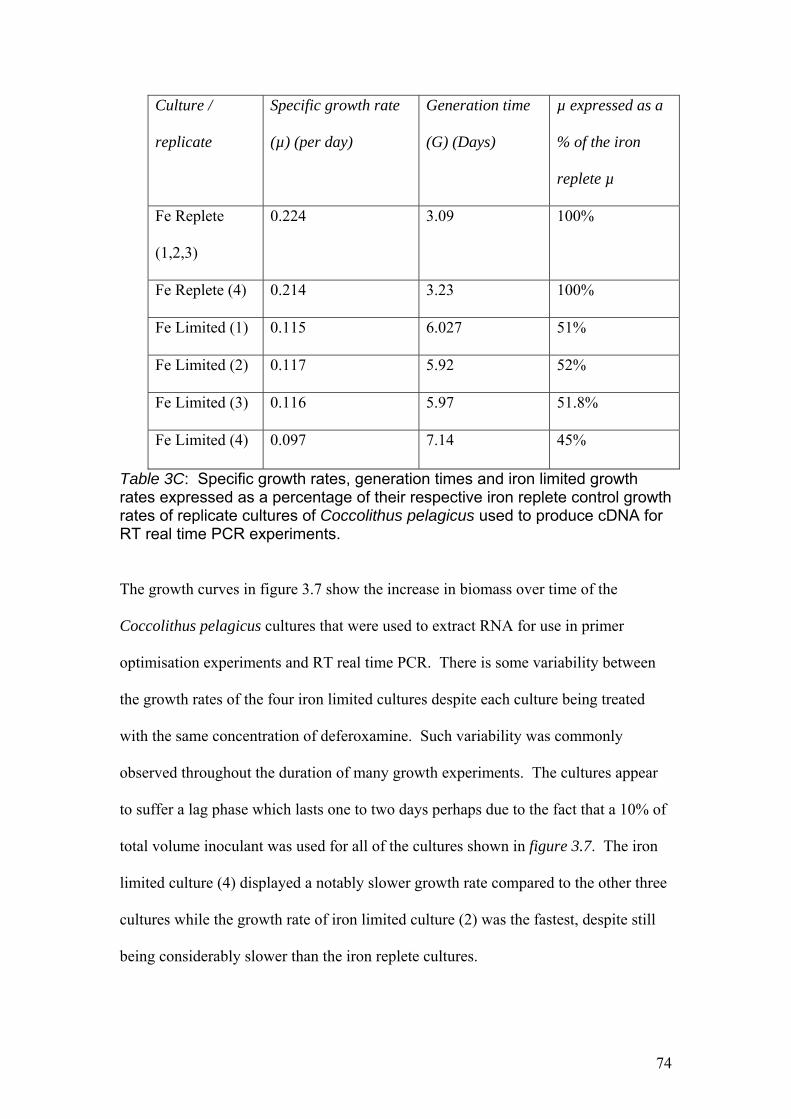
Culture /
replicate
Specific growth rate
(µ) (per day)
Generation time
(G) (Days)
µ expressed as a
% of the iron
replete µ
Fe Replete
(1,2,3)
0.224 3.09 100%
Fe Replete (4) 0.214 3.23 100%
Fe Limited (1) 0.115 6.027 51%
Fe Limited (2) 0.117 5.92 52%
Fe Limited (3) 0.116 5.97 51.8%
Fe Limited (4) 0.097 7.14 45%
Table 3C: Specific growth rates, generation times and iron limited growth rates expressed as a percentage of their respective iron replete control growth rates of replicate cultures of Coccolithus pelagicus used to produce cDNA for RT real time PCR experiments.
The growth curves in figure 3.7 show the increase in biomass over time of the
Coccolithus pelagicus cultures that were used to extract RNA for use in primer
optimisation experiments and RT real time PCR. There is some variability between
the growth rates of the four iron limited cultures despite each culture being treated
with the same concentration of deferoxamine. Such variability was commonly
observed throughout the duration of many growth experiments. The cultures appear
to suffer a lag phase which lasts one to two days perhaps due to the fact that a 10% of
total volume inoculant was used for all of the cultures shown in figure 3.7. The iron
limited culture (4) displayed a notably slower growth rate compared to the other three
cultures while the growth rate of iron limited culture (2) was the fastest, despite still
being considerably slower than the iron replete cultures.
74
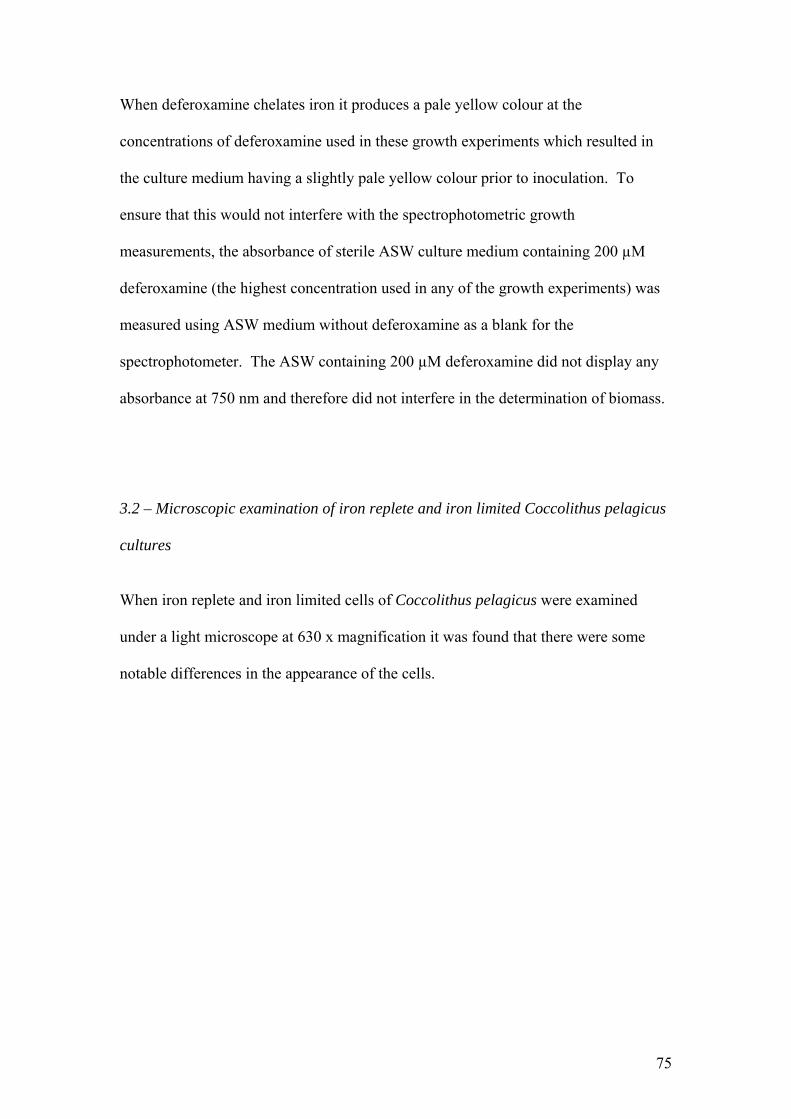
When deferoxamine chelates iron it produces a pale yellow colour at the
concentrations of deferoxamine used in these growth experiments which resulted in
the culture medium having a slightly pale yellow colour prior to inoculation. To
ensure that this would not interfere with the spectrophotometric growth
measurements, the absorbance of sterile ASW culture medium containing 200 µM
deferoxamine (the highest concentration used in any of the growth experiments) was
measured using ASW medium without deferoxamine as a blank for the
spectrophotometer. The ASW containing 200 µM deferoxamine did not display any
absorbance at 750 nm and therefore did not interfere in the determination of biomass.
3.2 – Microscopic examination of iron replete and iron limited Coccolithus pelagicus
cultures
When iron replete and iron limited cells of Coccolithus pelagicus were examined
under a light microscope at 630 x magnification it was found that there were some
notable differences in the appearance of the cells.
75
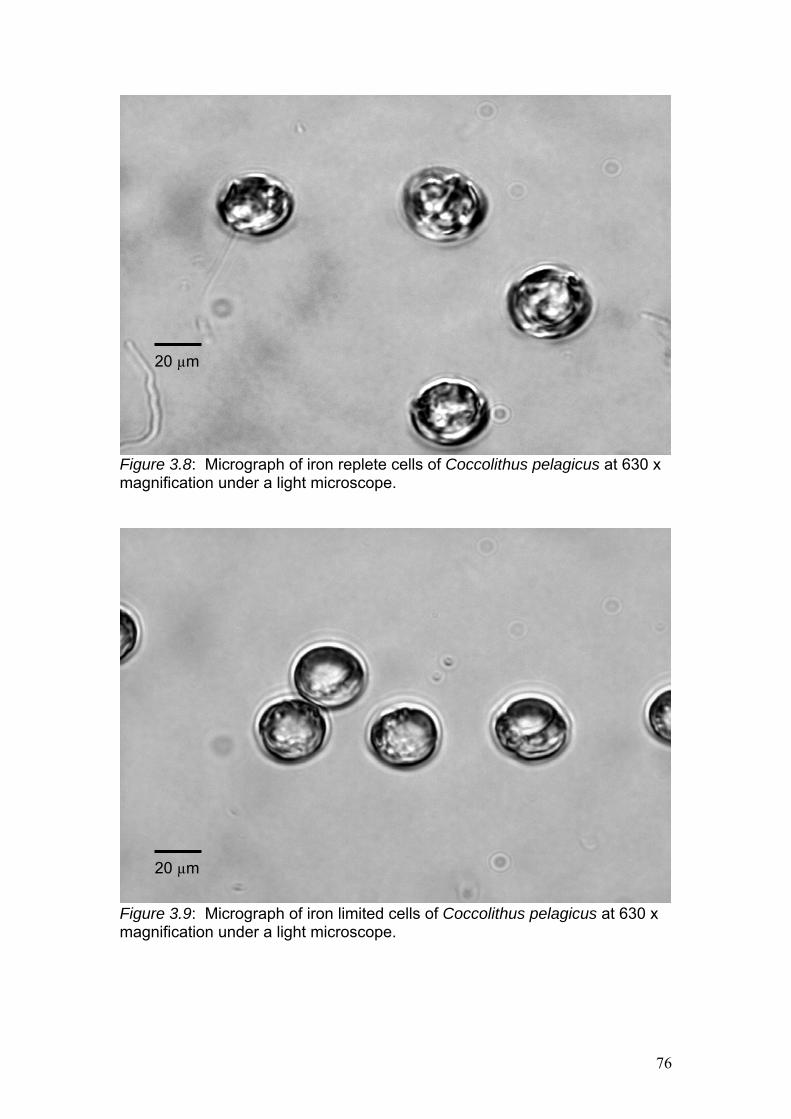
Figure 3.8: Micrograph of iron replete cells of Coccolithus pelagicus at 630 x magnification under a light microscope.
20 µm
Figure 3.9: Micrograph of iron limited cells of Coccolithus pelagicus at 630 x magnification under a light microscope.
20 µm
76
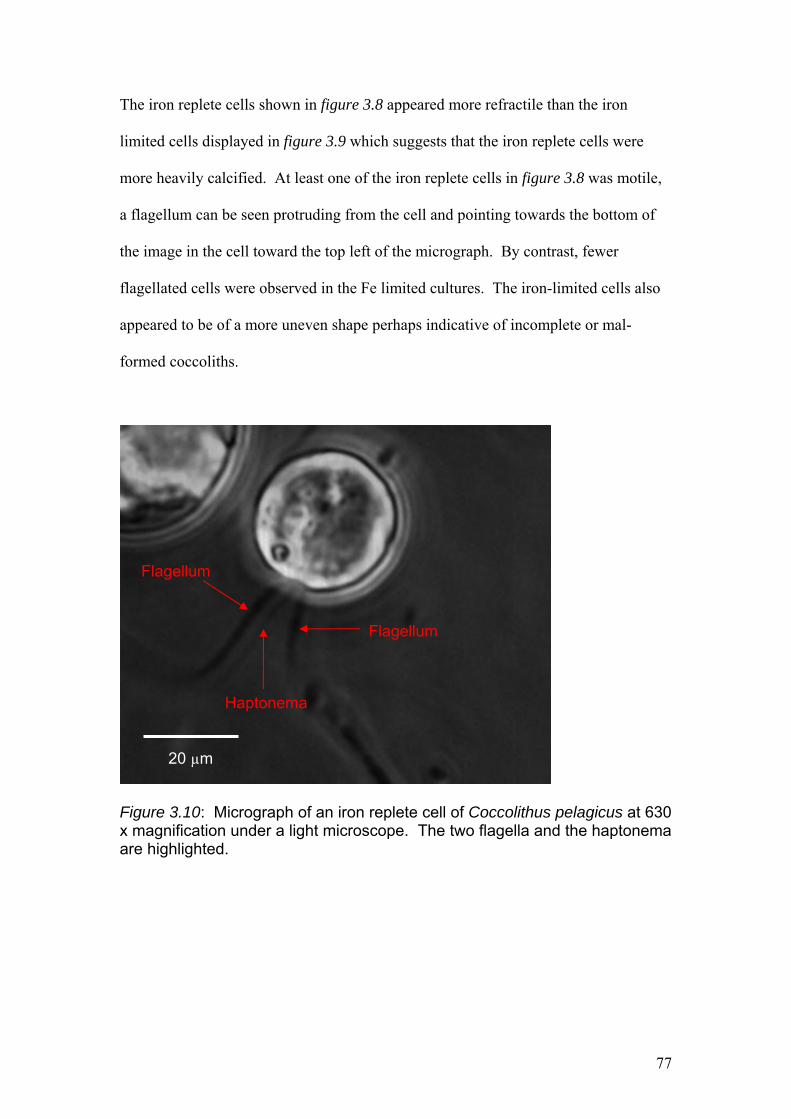
The iron replete cells shown in figure 3.8 appeared more refractile than the iron
limited cells displayed in figure 3.9 which suggests that the iron replete cells were
more heavily calcified. At least one of the iron replete cells in figure 3.8 was motile,
a flagellum can be seen protruding from the cell and pointing towards the bottom of
the image in the cell toward the top left of the micrograph. By contrast, fewer
flagellated cells were observed in the Fe limited cultures. The iron-limited cells also
appeared to be of a more uneven shape perhaps indicative of incomplete or mal-
formed coccoliths.
20 µm
Flagellum
Flagellum
Haptonema
Figure 3.10: Micrograph of an iron replete cell of Coccolithus pelagicus at 630 x magnification under a light microscope. The two flagella and the haptonema are highlighted.
77
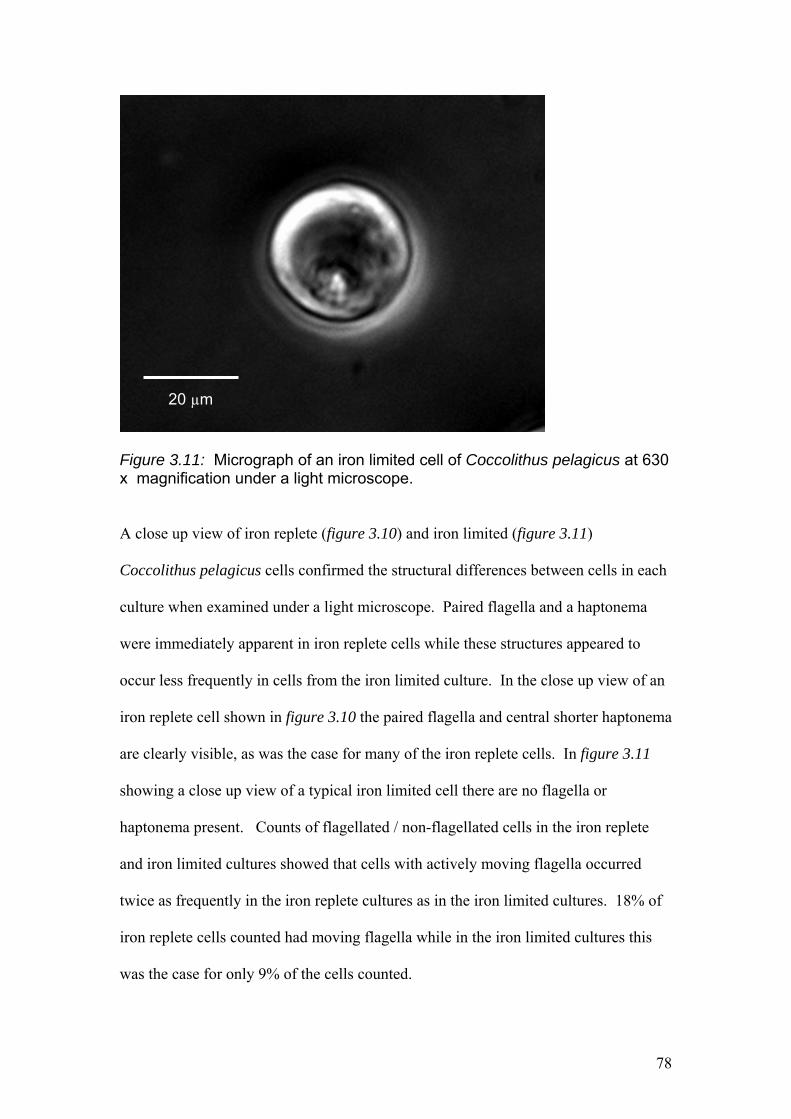
20 µm
Figure 3.11: Micrograph of an iron limited cell of Coccolithus pelagicus at 630 x magnification under a light microscope. A close up view of iron replete (figure 3.10) and iron limited (figure 3.11)
Coccolithus pelagicus cells confirmed the structural differences between cells in each
culture when examined under a light microscope. Paired flagella and a haptonema
were immediately apparent in iron replete cells while these structures appeared to
occur less frequently in cells from the iron limited culture. In the close up view of an
iron replete cell shown in figure 3.10 the paired flagella and central shorter haptonema
are clearly visible, as was the case for many of the iron replete cells. In figure 3.11
showing a close up view of a typical iron limited cell there are no flagella or
haptonema present. Counts of flagellated / non-flagellated cells in the iron replete
and iron limited cultures showed that cells with actively moving flagella occurred
twice as frequently in the iron replete cultures as in the iron limited cultures. 18% of
iron replete cells counted had moving flagella while in the iron limited cultures this
was the case for only 9% of the cells counted.
78
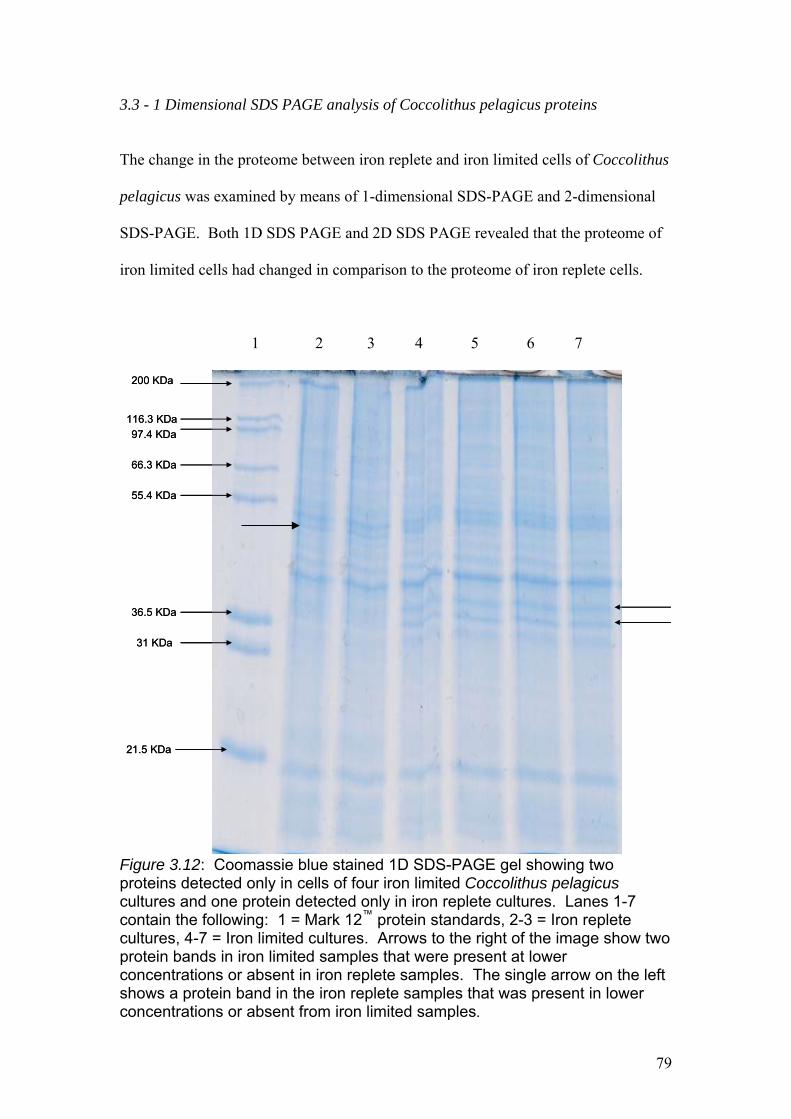
3.3 - 1 Dimensional SDS PAGE analysis of Coccolithus pelagicus proteins
The change in the proteome between iron replete and iron limited cells of Coccolithus
pelagicus was examined by means of 1-dimensional SDS-PAGE and 2-dimensional
SDS-PAGE. Both 1D SDS PAGE and 2D SDS PAGE revealed that the proteome of
iron limited cells had changed in comparison to the proteome of iron replete cells.
1 2 3 4 5 6 7
200 KDa
116.3 KDa
97.4 KDa
66.3 KDa
55.4 KDa
36.5 KDa
31 KDa
21.5 KDa
200 KDa
116.3 KDa
97.4 KDa
66.3 KDa
55.4 KDa
36.5 KDa
31 KDa
21.5 KDa
Figure 3.12: Coomassie blue stained 1D SDS-PAGE gel showing two proteins detected only in cells of four iron limited Coccolithus pelagicus cultures and one protein detected only in iron replete cultures. Lanes 1-7 contain the following: 1 = Mark 12™ protein standards, 2-3 = Iron replete cultures, 4-7 = Iron limited cultures. Arrows to the right of the image show two protein bands in iron limited samples that were present at lower concentrations or absent in iron replete samples. The single arrow on the left shows a protein band in the iron replete samples that was present in lower concentrations or absent from iron limited samples.
79
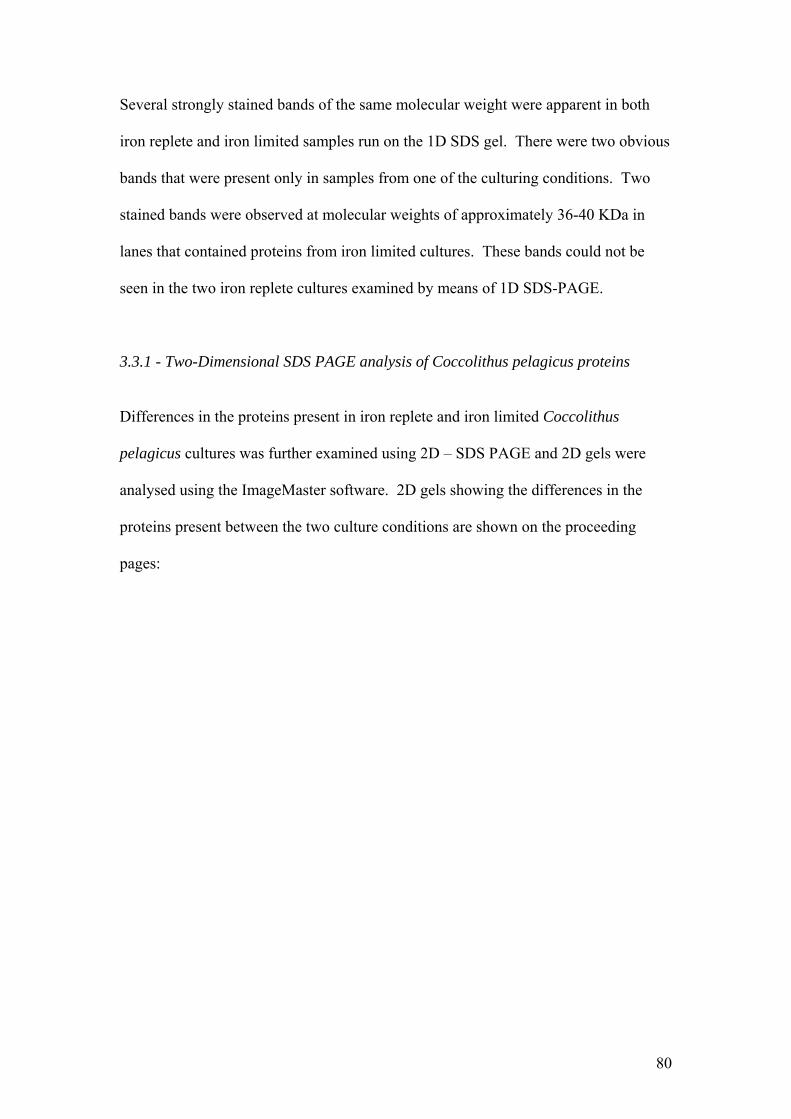
Several strongly stained bands of the same molecular weight were apparent in both
iron replete and iron limited samples run on the 1D SDS gel. There were two obvious
bands that were present only in samples from one of the culturing conditions. Two
stained bands were observed at molecular weights of approximately 36-40 KDa in
lanes that contained proteins from iron limited cultures. These bands could not be
seen in the two iron replete cultures examined by means of 1D SDS-PAGE.
3.3.1 - Two-Dimensional SDS PAGE analysis of Coccolithus pelagicus proteins
Differences in the proteins present in iron replete and iron limited Coccolithus
pelagicus cultures was further examined using 2D – SDS PAGE and 2D gels were
analysed using the ImageMaster software. 2D gels showing the differences in the
proteins present between the two culture conditions are shown on the proceeding
pages:
80
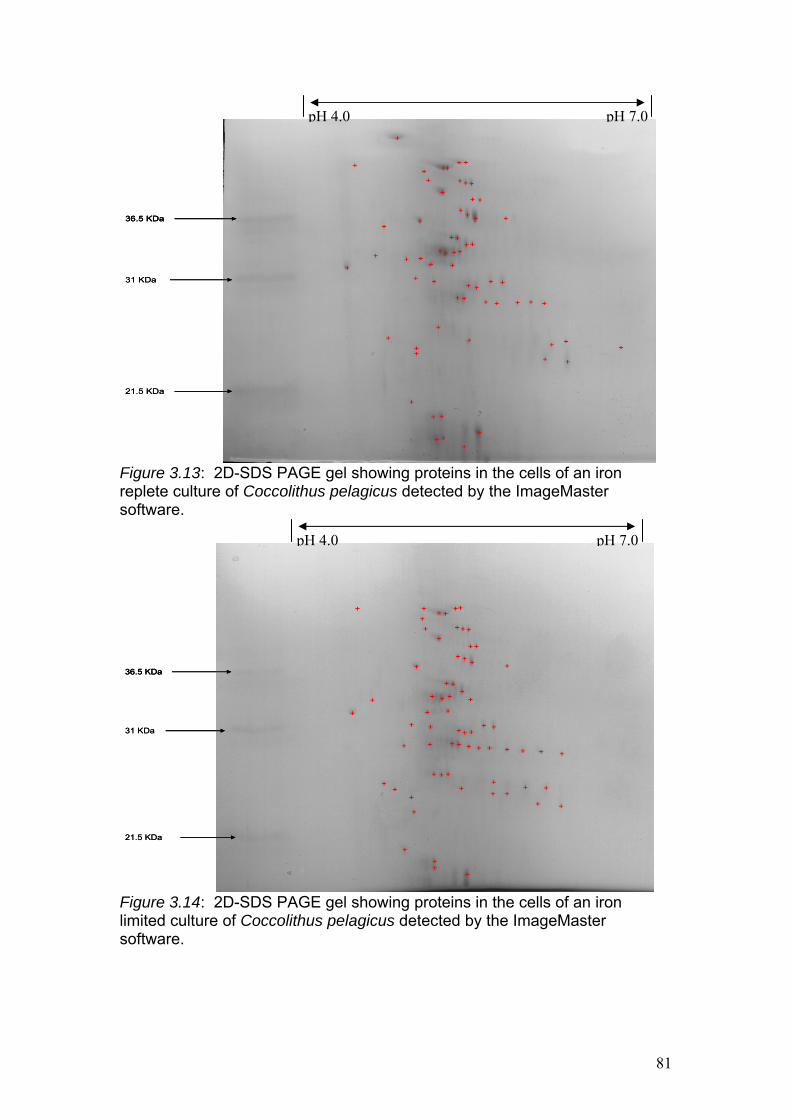
Figure 3.13: 2D-SDS PAGE gel showing proteins in the cells of an iron replete culture of Coccolithus pelagicus detected by the ImageMaster software.
Figure 3.14: 2D-SDS PAGE gel showing proteins in the cells of an iron limited culture of Coccolithus pelagicus detected by the ImageMaster software.
36.5 KDa
31 KDa
21.5 KDa
36.5 KDa36.5 KDa
31 KDa
21.5 KDa
pH 4.0 pH 7.0
36.5 KDa
31 KDa
pH 7.0 pH 4.0
36.5 KDa36.5 KDa
31 KDa
21.5 KDa21.5 KDa
81
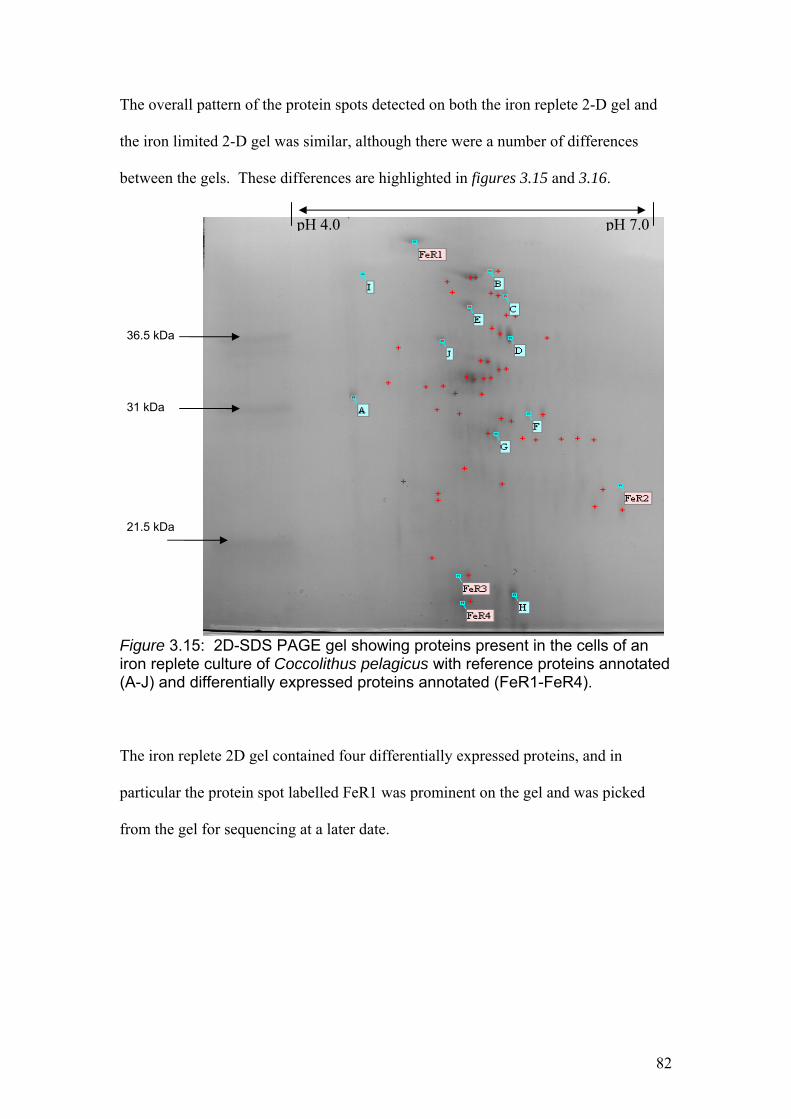
The overall pattern of the protein spots detected on both the iron replete 2-D gel and
the iron limited 2-D gel was similar, although there were a number of differences
between the gels. These differences are highlighted in figures 3.15 and 3.16.
36.5 kDa
31 kDa
21.5 kDa
pH 7.0 pH 4.0
Figure 3.15: 2D-SDS PAGE gel showing proteins present in the cells of an iron replete culture of Coccolithus pelagicus with reference proteins annotated (A-J) and differentially expressed proteins annotated (FeR1-FeR4).
The iron replete 2D gel contained four differentially expressed proteins, and in
particular the protein spot labelled FeR1 was prominent on the gel and was picked
from the gel for sequencing at a later date.
82
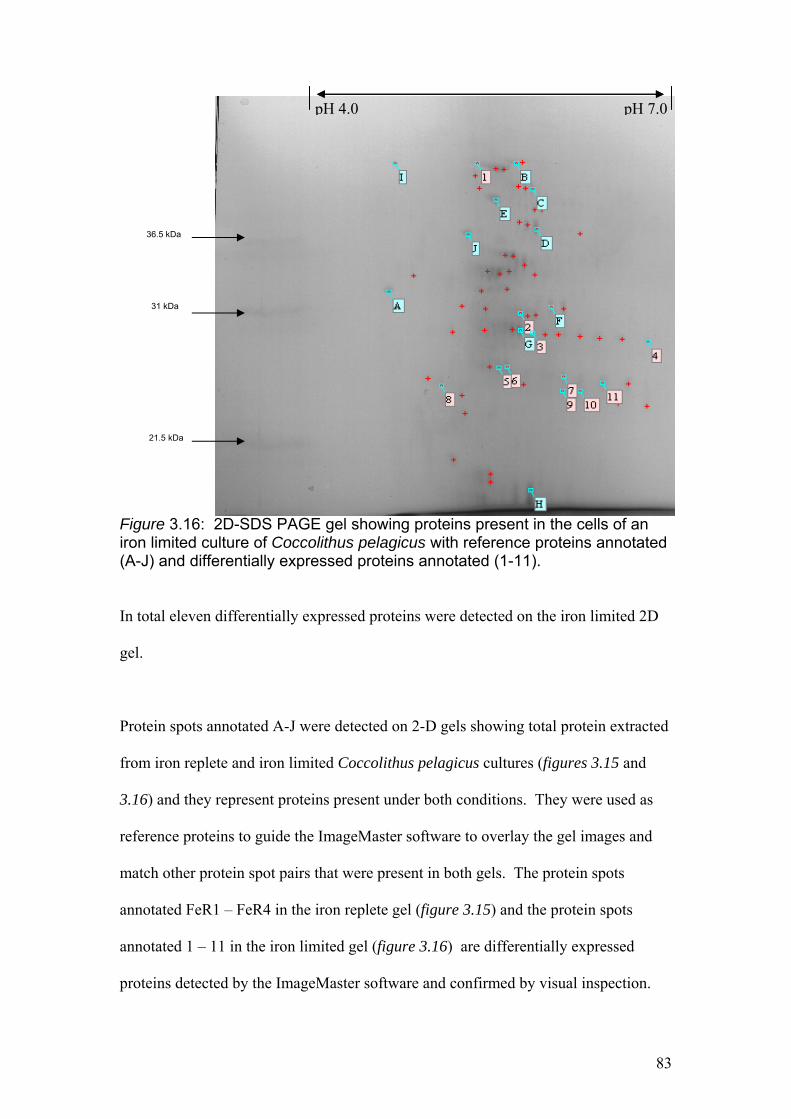
Figure 3.16: 2D-SDS PAGE gel showing proteins present in the cells of an iron limited culture of Coccolithus pelagicus with reference proteins annotated (A-J) and differentially expressed proteins annotated (1-11).
pH 4.0 pH 6.0pH 4.0 pH 7.0
21.5 kDa
31 kDa
36.5 kDa
In total eleven differentially expressed proteins were detected on the iron limited 2D
gel.
Protein spots annotated A-J were detected on 2-D gels showing total protein extracted
from iron replete and iron limited Coccolithus pelagicus cultures (figures 3.15 and
3.16) and they represent proteins present under both conditions. They were used as
reference proteins to guide the ImageMaster software to overlay the gel images and
match other protein spot pairs that were present in both gels. The protein spots
annotated FeR1 – FeR4 in the iron replete gel (figure 3.15) and the protein spots
annotated 1 – 11 in the iron limited gel (figure 3.16) are differentially expressed
proteins detected by the ImageMaster software and confirmed by visual inspection.
83
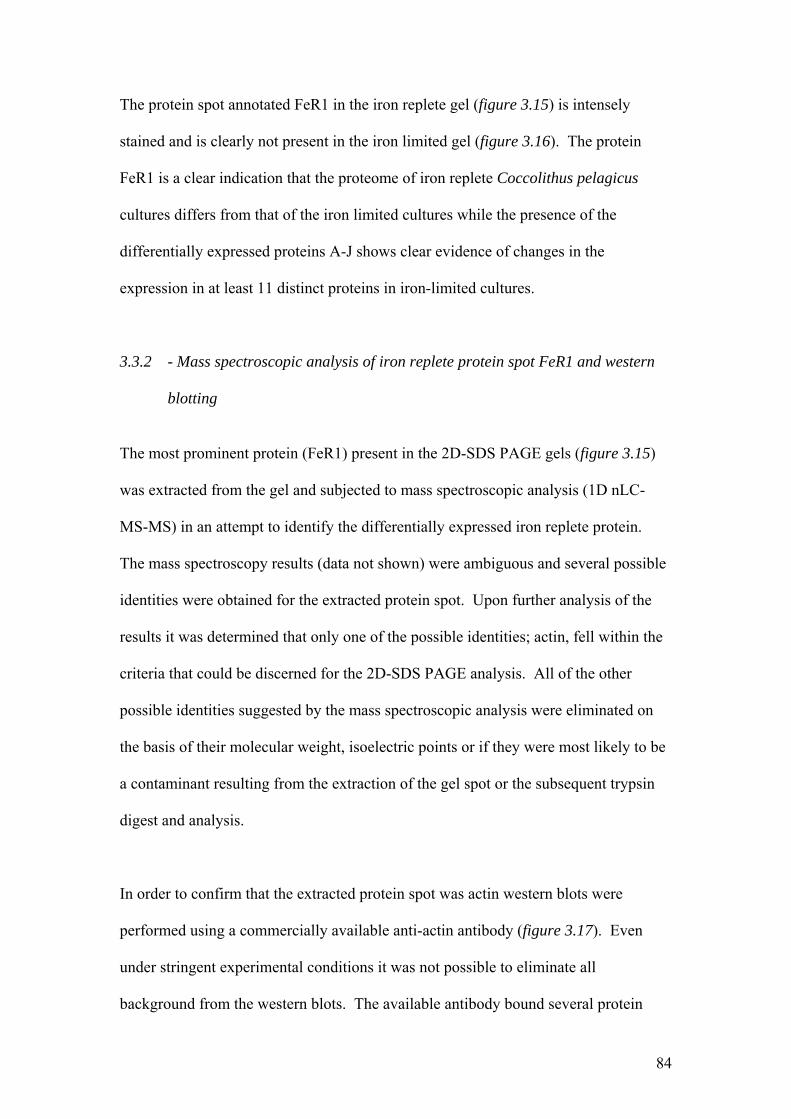
The protein spot annotated FeR1 in the iron replete gel (figure 3.15) is intensely
stained and is clearly not present in the iron limited gel (figure 3.16). The protein
FeR1 is a clear indication that the proteome of iron replete Coccolithus pelagicus
cultures differs from that of the iron limited cultures while the presence of the
differentially expressed proteins A-J shows clear evidence of changes in the
expression in at least 11 distinct proteins in iron-limited cultures.
3.3.2 - Mass spectroscopic analysis of iron replete protein spot FeR1 and western
blotting
The most prominent protein (FeR1) present in the 2D-SDS PAGE gels (figure 3.15)
was extracted from the gel and subjected to mass spectroscopic analysis (1D nLC-
MS-MS) in an attempt to identify the differentially expressed iron replete protein.
The mass spectroscopy results (data not shown) were ambiguous and several possible
identities were obtained for the extracted protein spot. Upon further analysis of the
results it was determined that only one of the possible identities; actin, fell within the
criteria that could be discerned for the 2D-SDS PAGE analysis. All of the other
possible identities suggested by the mass spectroscopic analysis were eliminated on
the basis of their molecular weight, isoelectric points or if they were most likely to be
a contaminant resulting from the extraction of the gel spot or the subsequent trypsin
digest and analysis.
In order to confirm that the extracted protein spot was actin western blots were
performed using a commercially available anti-actin antibody (figure 3.17). Even
under stringent experimental conditions it was not possible to eliminate all
background from the western blots. The available antibody bound several protein
84
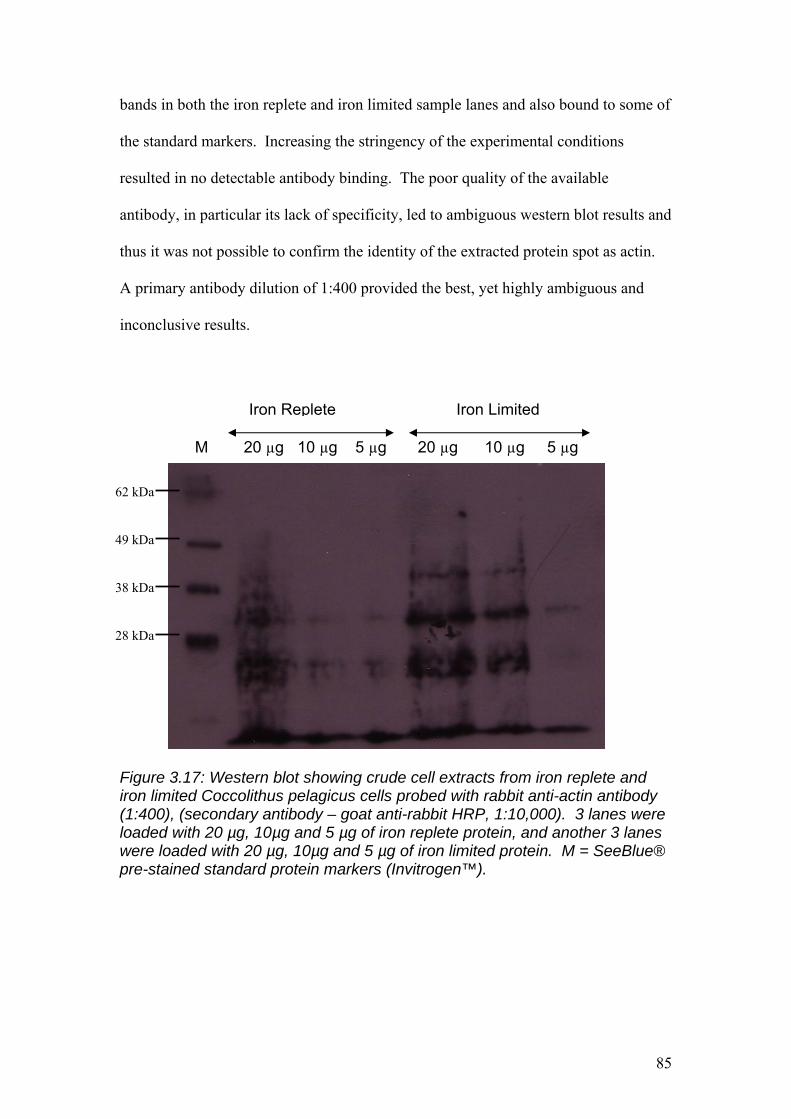
bands in both the iron replete and iron limited sample lanes and also bound to some of
the standard markers. Increasing the stringency of the experimental conditions
resulted in no detectable antibody binding. The poor quality of the available
antibody, in particular its lack of specificity, led to ambiguous western blot results and
thus it was not possible to confirm the identity of the extracted protein spot as actin.
A primary antibody dilution of 1:400 provided the best, yet highly ambiguous and
inconclusive results.
Iron Replete Iron Limited M 20 µg 10 µg 5 µg 20 µg 10 µg 5 µg
62 kDa
28 kDa
38 kDa
49 kDa
Figure 3.17: Western blot showing crude cell extracts from iron replete and iron limited Coccolithus pelagicus cells probed with rabbit anti-actin antibody (1:400), (secondary antibody – goat anti-rabbit HRP, 1:10,000). 3 lanes were loaded with 20 µg, 10µg and 5 µg of iron replete protein, and another 3 lanes were loaded with 20 µg, 10µg and 5 µg of iron limited protein. M = SeeBlue® pre-stained standard protein markers (Invitrogen™).
85
3.4 – Discussion
The results from the growth experiments demonstrate that the use of deferoxamine to
chelate iron in growth media is an effective method of producing iron limited cultures
of Coccolithus pelagicus. Deferoxamine overwhelmingly chelates iron and earlier
studies suggest that it has no impact on the uptake of other biologically important
metals (Wells, 1999). To date it has not been reported as being detrimental to the
growth of phytoplankton in laboratory or field studies, other than growth inhibition
resulting from its ability to chelate iron (Hutchins et al., 1999(A) Wells, 1999;
Eldridge et al., 2004; Naito et al., 2008). During ship-board laboratory studies in
which deferoxamine was added to size fractionated samples of natural phytoplankton
communities it was found that while iron uptake rates slowed, short term uptake of
carbon was not affected even at the somewhat higher concentrations of deferoxamine
used in the study (500 nM). This suggested that the inhibitory effect of deferoxamine
on phytoplankton productivity was not due to general toxicity (Wells & Trick, 2004)
but was a sole consequence of its effective chelation of iron. The same study found
that across all phytoplankton size classes the addition of 3 nM deferoxamine to
natural populations reduced iron uptake rates by at least 90% relative to that of
controls with no chelator added. Interestingly, the iron uptake rates in the larger size
class (>5µm) were more severely reduced by deferoxamine, while the smaller size
class (>0.2 – 5µm) appeared to be able to access deferoxamine bound iron to varying
extents. This suggests that deferoxamine may be a particularly suitable chelator for
studies of iron limitation in the larger eukaryotic phytoplankton as was found to be the
case with Coccolithus pelagicus in this investigation. Furthermore, it has been
reported that addition of deferoxamine to samples of natural iron replete
86
phytoplankton communities results in changes in biological parameters including
biomass and nutrient concentrations which are similar to those observed in iron
limited populations in high nutrient low chlorophyll areas (Hutchins et al., 1999(A);
Wells, 1999; Eldridge et al., 2004). At least with the larger size classes of
phytoplankton, deferoxamine appears to be an effective means of mimicking low iron
levels in the marine environment within a laboratory setting.
The considerably reduced specific growth rates observed in Coccolithus pelagicus
grown in the presence of deferoxamine suggest effective iron limitation was achieved
in this study. Deferoxamine-treated cultures also display proportionately lower
chlorophyll concentrations per unit biomass than their iron replete counterparts and it
was found that lower specific growth rates were overcome upon alleviation of iron-
limitation through iron supplementation. The change from reduced to higher specific
growth rates and from low to higher chlorophyll concentrations per unit biomass in
iron limited cultures after iron addition strongly indicates that it was the relative un-
availability of iron in the medium rather than any other factor such as deferoxamine
toxicity that produced the differences between the iron limited and iron replete
cultures.
The observation that iron replete cells have a different microscopic appearance
compared to iron limited cells both in the apparent extent of calcification and in the
irregularity of the shape of iron limited cells, further suggests that there are
significant differences between the cells under the two conditions. The larger number
of iron replete cells possessing moving flagella may be indicative of a larger
proportion of cells being in the motile phase of the Coccolithus pelagicus life cycle.
87
The smaller proportion of flagellated cells in the iron limited culture may also reflect
a need to conserve energy when a reduced concentration of iron is available. The
operation of a flagellum is a metabolic process that demands a great deal of the cell’s
energy and elimination of this organelle may represent a considerable energy saving
to iron limited cells. As iron limited cells are essentially energy limited owing to the
critical role of iron in both photosynthesis and respiration, the additional energy
demands of maintaining an active flagellum may render it un-sustainable in cells
unable to operate at their metabolic optimum.
Coccolithus pelagicus is known to have a non-motile haploid phase in its life cycle
which is less calcified than the motile diploid phase (Rayns, 1962). Therefore, one
reason for the difference in microscopic appearance observed in deferoxamine-treated
cultures is that a higher proportion of the cells are in the non-motile haploid phase in
comparison to iron-replete cultures. Maintaining cells in a haploid phase of the life
cycle offers a potential means of conserving energy in iron limited cells, owing to the
reduced biosynthetic costs associated with maintaining a haploid genome.
The eleven differentially expressed proteins detected in the iron limited 2D gel and
the four differentially expressed proteins in the iron replete 2D gel in conjunction with
the differences observed on the 1D SDS gel confirm that the proteome of the cells is
different between the two growth conditions. This proteomic evidence in conjunction
with optical density, chlorophyll a concentration measurements, iron addition
experiments and microscopic observation confirms that Coccolithus pelagicus
cultures grown in f/2 enriched ASW media in the presence of 150 µM deferoxamine
88
results in a level of iron limitation sufficient to cause changes at the molecular level
and provides suitably iron limited cells for further study.
Due to its greater specificity deferoxamine was selected as the preferred iron chelator
to be used to produce iron limited cells for this study. EDTA was also effective at
producing slower specific growth rates and lower chlorophyll concentrations relative
to iron replete controls, but it was required at far higher concentrations. This was
probably due to the fact that EDTA not only chelates iron but also chelates other
divalent cations while deferoxamine has an overwhelming affinity for iron. Some of
the additional EDTA will chelate copper, manganese, magnesium and zinc for
example, which may account for the far higher concentrations of EDTA needed to
produce the same extent of iron limitation that is observed when deferoxamine is
used. EDTA is a less suitable chelator for studies of iron limitation in Coccolithus
pelagicus as the promiscuous nature of this chelator and the millimolar concentrations
required in order to cause significant iron limitation mean that changes in gene
expression due to chelation of other trace metals cannot be ruled out. Nevertheless, a
number of previous studies of iron-limitation with both natural populations and
laboratory cultures have used EDTA as a chelator (reviewed by Gerringa et al., 2000)
Although using deferoxamine in growth media to chelate iron was consistently
effective at producing iron limited cultures of Coccolithus pelagicus there was
variability between cultures in terms of the severity of iron limitation observed. The
severity of iron limitation was judged based on the specific growth rates of cultures,
slower specific growth rates indicating more severe iron limitation. Specific growth
rates varied over a range of 17% between the iron limited cultures used to produce
cDNA for real time PCR experiments and this variation was evident in the gene
89
expression data obtained using RT real time PCR (see chapter 5). When dealing with
low concentrations of trace metals such as iron it is often difficult to maintain equal
concentrations in all cultures. When cultures are sampled for growth measurements,
for example, dust from the air can contribute additional iron to the media. Despite
minimising contamination through the use of aseptic technique and acid washing
glassware that was used in the preparation of growth media, it was difficult to
completely eradicate all contaminating trace metals from the growth media. When
these factors were considered, a variation of 17% in specific growth rate over the
range of iron limited cultures used for experimentation was deemed to be acceptable.
Even the most rapidly growing of these cultures were still growing far more slowly
than the iron replete controls.
Although the 2D gels showed that eleven novel proteins were present in the iron
limited cells, none were present at high concentration making them difficult targets as
a biomarker. By contrast FeR1 would be a good candidate protein as a marker of iron
replete cells although at the time of analysis this was not the main objective of this
study. The sensitivity of the Colloidal Coomassie stain is within the range of 38 ng
per band or 250 ng per mm2. This stain was selected for use as opposed to the more
sensitive silver stain, as silver stain makes mass spectral analysis impossible. The
sensitivity of the Colloidal Coomassie blue was deemed sufficient to detect proteins
which would be present in concentrations high enough to make them suitable
potential biomarkers for iron limitation, worthy of further investigation. Any protein
present at concentrations below the threshold of Colloidal Coomassie blue sensitivity
are unlikely to prove good biomarkers for iron limitation owing to the fact that an
90
ideal biomarker should show a large difference in abundance between the two iron
conditions.
Chlorophyll a concentrations per unit biomass did not appear to remain constant
throughout the duration of iron limited growth. This may indicate that iron limited
cells of Coccolithus pelagicus prioritise cell division over chlorophyll a biosynthesis
under these conditions. If there is a reduction in cell size and an increase in the ratio
of accessory pigments : chlorophyll a this may allow the cultures to continue growing
with reduced chlorophyll a concentrations and account for the trend observed. A
reduction in chlorophyll / cell of up to 54% has been reported for Thallassiosira
weissflogi grown in EDTA buffered seawater with iron additions across a range of 10
– 1000 nm (McKay et al., 1997). This is consistent with the findings for Coccolithus
pelagicus in this study. After an initial increase in chlorophyll per unit biomass upon
inoculation into fresh growth media, there was a relatively rapid decline in the
cultures grown at low iron concentrations as cells divide but were unable to rapidly
synthesise chlorophyll. Reduction in cell size in response to iron limitation has been
reported in other species (Stefels & van Leeuwe, 2002, Leynaert et al., 2004). A
moderate reduction in the chlorophyll a concentration per unit biomass over time was
also observed in the iron-replete cultures but this is unlikely to be the result of an
inability to produce chlorophyll over the period of growth. It may be the case that
shed coccoliths affect the optical density measurements and exaggerate the cell
number to an extent sufficient to slightly skew the chlorophyll a per unit biomass
measurements. It may also be the case that at later stages of growth another nutrient
in the iron replete cultures becomes limiting due to rapid growth of the cultures,
91
resulting in lower chlorophyll biosynthesis but not affecting cell division as appears to
be the case for iron limited cells at a much earlier point.
Highly ambiguous western blot results made it impossible to confirm the identity of
the iron replete protein spot FeR1 (figure 3.17). Actin was pursued as a possible
identity for the differentially expressed protein because it most closely fitted the
criteria that could be observed from the 2D SDS gel from which it was obtained.
Human actin is approximately 43 kDa and isoelectric points of the various isoforms
range from 5.4 to 6.0, this is similar in other species ranging from mammals to slime
moulds (Zechel & Weber, 1978). Unfortunately the commercially available anti-actin
antibody appears to have poor specificity and may be binding to several different
actin isoforms in the western blots. The antibody also bound many of the marker
proteins in the blots even under stringent conditions which further illustrates its lack
of specificity. The amino acid sequence for actin is unusually well conserved
throughout different organisms, ranging from humans and other animals to plants and
unicellular organisms (reviewed by Sheterline & Sparrow, 1994). It is likely this high
degree of sequence conservation that reduces the ability of any anti-actin antibodies to
distinguish between different actin isoforms. Until such time as a better quality anti-
actin antibody is available it may prove difficult to achieve conclusive western blot
results for protein spot FeR1, if it is in fact actin.
92
Chapter 4 – Analysis of differentially expressed
sequences in the iron replete and iron limited subtracted
libraries.
4.1 – Chapter introduction
In the proceeding chapter the results obtained from sequencing the iron replete and
iron limited subtracted libraries are presented and analysed. Sequences unique to
either the iron replete or iron limited subtracted libraries were subjected to BLAST
analysis in an attempt to identify or assign a putative identity to each. Only a fraction
of the sequences from the iron limited subtracted library could be identified with a
degree of confidence and an overview of the iron limited subtracted library is given
here. The relative proportion of each identified sequence as a fraction of the entire
subtracted library is presented. The subtracted iron limited cDNA sequences are
presented alongside their BLAST analysis results and the implications of the assigned
identities are discussed. Multiple sequence alignments that were used to design
degenerate primers to target the GAPDH and flavodoxin transcripts (Chapter 5) are
also shown.
4.1.1 – Composition of the subtracted cDNA library
Nucleotide sequences obtained from the iron replete and iron limited subtracted
libraries returned a variety of hits with acceptable e-values from the NCBI database
upon being subjected to BLAST analysis. Both the Blastn and BlastX analysis tools
were used to identify the sequences. While there were several BLAST hits which
provided strong matches to sequences in the NCBI database, most of the sequences in
93
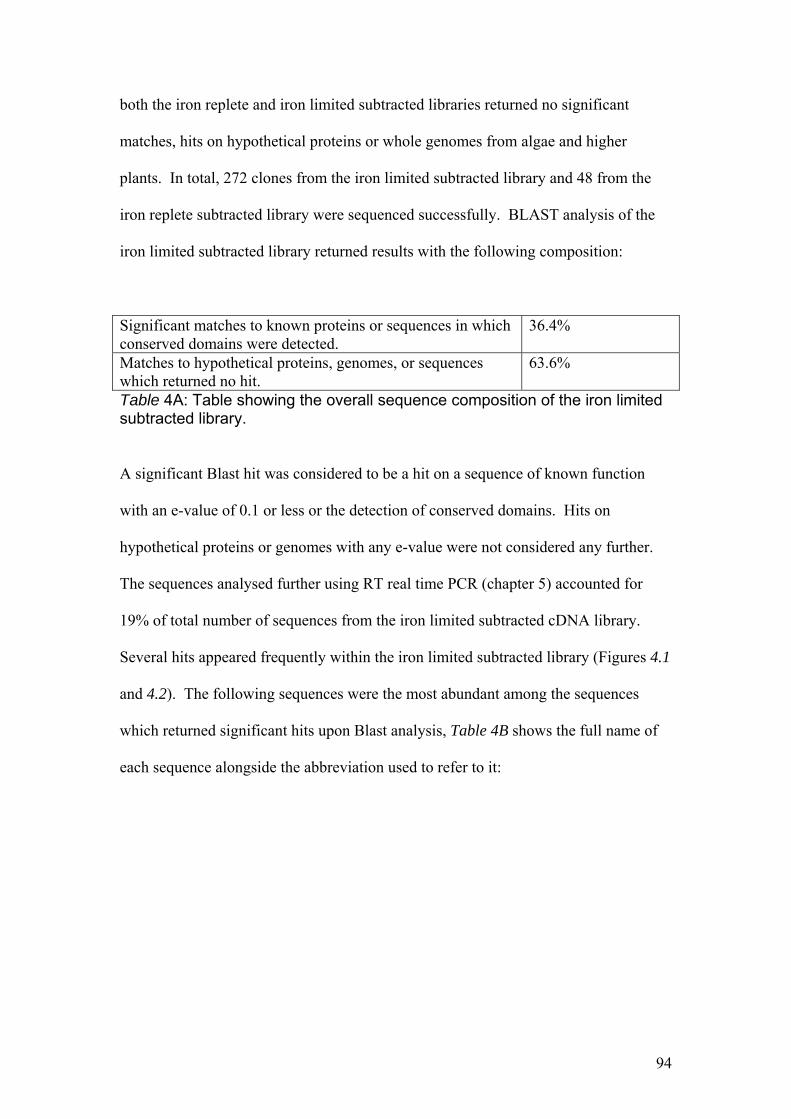
both the iron replete and iron limited subtracted libraries returned no significant
matches, hits on hypothetical proteins or whole genomes from algae and higher
plants. In total, 272 clones from the iron limited subtracted library and 48 from the
iron replete subtracted library were sequenced successfully. BLAST analysis of the
iron limited subtracted library returned results with the following composition:
Significant matches to known proteins or sequences in which conserved domains were detected.
36.4%
Matches to hypothetical proteins, genomes, or sequences which returned no hit.
63.6%
Table 4A: Table showing the overall sequence composition of the iron limited subtracted library.
A significant Blast hit was considered to be a hit on a sequence of known function
with an e-value of 0.1 or less or the detection of conserved domains. Hits on
hypothetical proteins or genomes with any e-value were not considered any further.
The sequences analysed further using RT real time PCR (chapter 5) accounted for
19% of total number of sequences from the iron limited subtracted cDNA library.
Several hits appeared frequently within the iron limited subtracted library (Figures 4.1
and 4.2). The following sequences were the most abundant among the sequences
which returned significant hits upon Blast analysis, Table 4B shows the full name of
each sequence alongside the abbreviation used to refer to it:
94
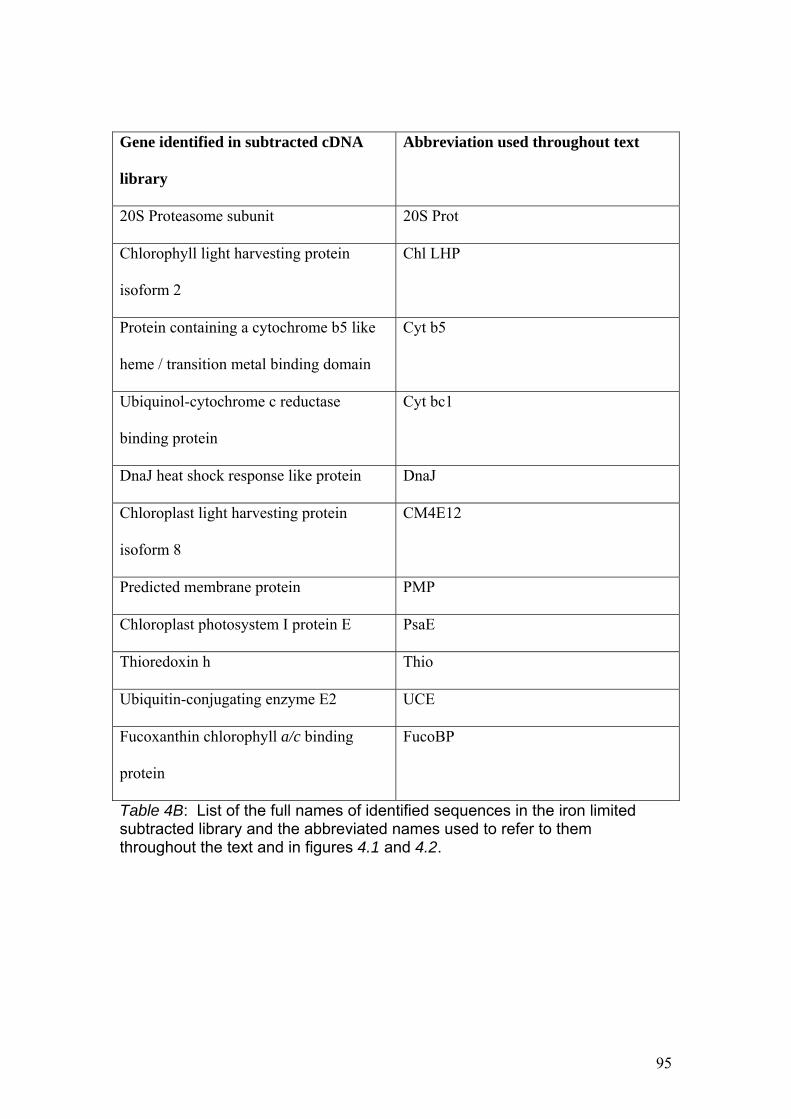
Gene identified in subtracted cDNA
library
Abbreviation used throughout text
20S Proteasome subunit 20S Prot
Chlorophyll light harvesting protein
isoform 2
Chl LHP
Protein containing a cytochrome b5 like
heme / transition metal binding domain
Cyt b5
Ubiquinol-cytochrome c reductase
binding protein
Cyt bc1
DnaJ heat shock response like protein DnaJ
Chloroplast light harvesting protein
isoform 8
CM4E12
Predicted membrane protein PMP
Chloroplast photosystem I protein E PsaE
Thioredoxin h Thio
Ubiquitin-conjugating enzyme E2 UCE
Fucoxanthin chlorophyll a/c binding
protein
FucoBP
Table 4B: List of the full names of identified sequences in the iron limited subtracted library and the abbreviated names used to refer to them throughout the text and in figures 4.1 and 4.2.
95

(20S Prot)
(Chl LHP)
(Cyt b5)
(Cyt bc1)
(CM4E12)
FucoBP [all transcriptvariants](PMP)
(PsaE)
(Thio)
(UCE)
Rest of library
Figure 4.1: Relative proportion of each RT real time PCR analysed iron limited sequence in the iron limited subtracted cDNA library. The abbreviations used to identify each sequence are listed alongside the full sequence name with the nucleotide sequences listed in section 4.1.1.
(20S Prot)
(Chl LHP)
(Cyt b5)
(Cyt bc1)
(CM4E12)
FucoBP [all transcriptvariants]
(PMP)
(PsaE)
(Thio)
(UCE)
Figure 4.2: Relative proportion of each RT real time PCR analysed iron limited sequence within the 19% of the sequences in the library that were examined. The abbreviations used to identify each sequence are listed alongside the full sequence name with the nucleotide sequences listed in section 4.1.1.
96
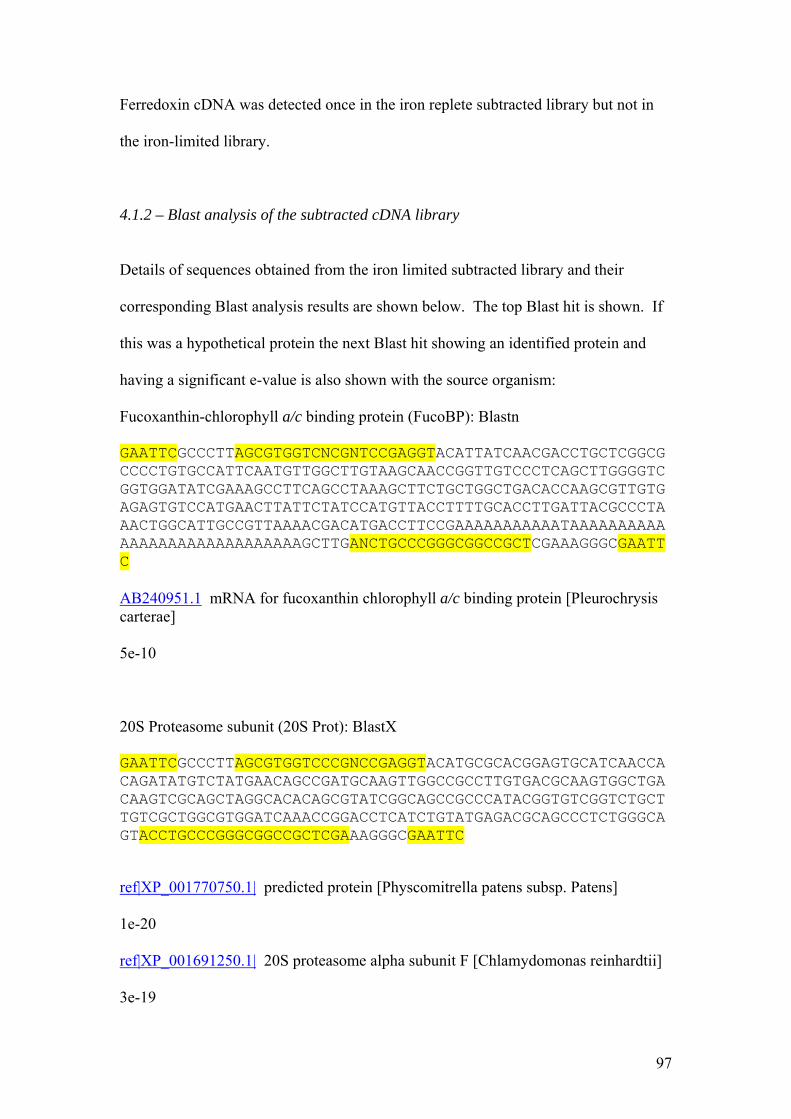
Ferredoxin cDNA was detected once in the iron replete subtracted library but not in
the iron-limited library.
4.1.2 – Blast analysis of the subtracted cDNA library
Details of sequences obtained from the iron limited subtracted library and their
corresponding Blast analysis results are shown below. The top Blast hit is shown. If
this was a hypothetical protein the next Blast hit showing an identified protein and
having a significant e-value is also shown with the source organism:
Fucoxanthin-chlorophyll a/c binding protein (FucoBP): Blastn
GAATTCGCCCTTAGCGTGGTCNCGNTCCGAGGTACATTATCAACGACCTGCTCGGCGCCCCTGTGCCATTCAATGTTGGCTTGTAAGCAACCGGTTGTCCCTCAGCTTGGGGTCGGTGGATATCGAAAGCCTTCAGCCTAAAGCTTCTGCTGGCTGACACCAAGCGTTGTGAGAGTGTCCATGAACTTATTCTATCCATGTTACCTTTTGCACCTTGATTACGCCCTAAACTGGCATTGCCGTTAAAACGACATGACCTTCCGAAAAAAAAAAATAAAAAAAAAAAAAAAAAAAAAAAAAAAAAGCTTGANCTGCCCGGGCGGCCGCTCGAAAGGGCGAATTC AB240951.1 mRNA for fucoxanthin chlorophyll a/c binding protein [Pleurochrysis carterae] 5e-10
20S Proteasome subunit (20S Prot): BlastX
GAATTCGCCCTTAGCGTGGTCCCGNCCGAGGTACATGCGCACGGAGTGCATCAACCACAGATATGTCTATGAACAGCCGATGCAAGTTGGCCGCCTTGTGACGCAAGTGGCTGACAAGTCGCAGCTAGGCACACAGCGTATCGGCAGCCGCCCATACGGTGTCGGTCTGCTTGTCGCTGGCGTGGATCAAACCGGACCTCATCTGTATGAGACGCAGCCCTCTGGGCAGTACCTGCCCGGGCGGCCGCTCGAAAGGGCGAATTC ref|XP_001770750.1| predicted protein [Physcomitrella patens subsp. Patens]
1e-20
ref|XP_001691250.1| 20S proteasome alpha subunit F [Chlamydomonas reinhardtii]
3e-19
97
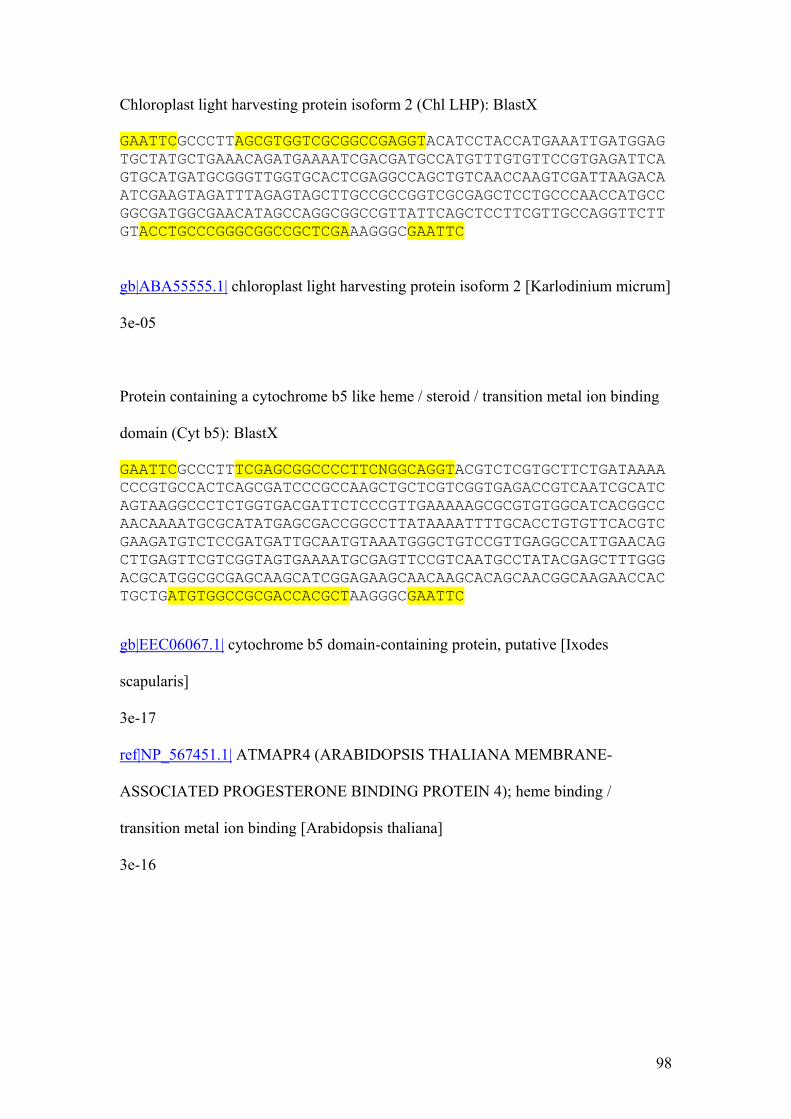
Chloroplast light harvesting protein isoform 2 (Chl LHP): BlastX
GAATTCGCCCTTAGCGTGGTCGCGGCCGAGGTACATCCTACCATGAAATTGATGGAGTGCTATGCTGAAACAGATGAAAATCGACGATGCCATGTTTGTGTTCCGTGAGATTCAGTGCATGATGCGGGTTGGTGCACTCGAGGCCAGCTGTCAACCAAGTCGATTAAGACAATCGAAGTAGATTTAGAGTAGCTTGCCGCCGGTCGCGAGCTCCTGCCCAACCATGCCGGCGATGGCGAACATAGCCAGGCGGCCGTTATTCAGCTCCTTCGTTGCCAGGTTCTTGTACCTGCCCGGGCGGCCGCTCGAAAGGGCGAATTC gb|ABA55555.1| chloroplast light harvesting protein isoform 2 [Karlodinium micrum]
3e-05
Protein containing a cytochrome b5 like heme / steroid / transition metal ion binding
domain (Cyt b5): BlastX
GAATTCGCCCTTTCGAGCGGCCCCTTCNGGCAGGTACGTCTCGTGCTTCTGATAAAACCCGTGCCACTCAGCGATCCCGCCAAGCTGCTCGTCGGTGAGACCGTCAATCGCATCAGTAAGGCCCTCTGGTGACGATTCTCCCGTTGAAAAAGCGCGTGTGGCATCACGGCCAACAAAATGCGCATATGAGCGACCGGCCTTATAAAATTTTGCACCTGTGTTCACGTCGAAGATGTCTCCGATGATTGCAATGTAAATGGGCTGTCCGTTGAGGCCATTGAACAGCTTGAGTTCGTCGGTAGTGAAAATGCGAGTTCCGTCAATGCCTATACGAGCTTTGGGACGCATGGCGCGAGCAAGCATCGGAGAAGCAACAAGCACAGCAACGGCAAGAACCACTGCTGATGTGGCCGCGACCACGCTAAGGGCGAATTC
gb|EEC06067.1| cytochrome b5 domain-containing protein, putative [Ixodes
scapularis]
3e-17
ref|NP_567451.1| ATMAPR4 (ARABIDOPSIS THALIANA MEMBRANE-
ASSOCIATED PROGESTERONE BINDING PROTEIN 4); heme binding /
transition metal ion binding [Arabidopsis thaliana]
3e-16
98
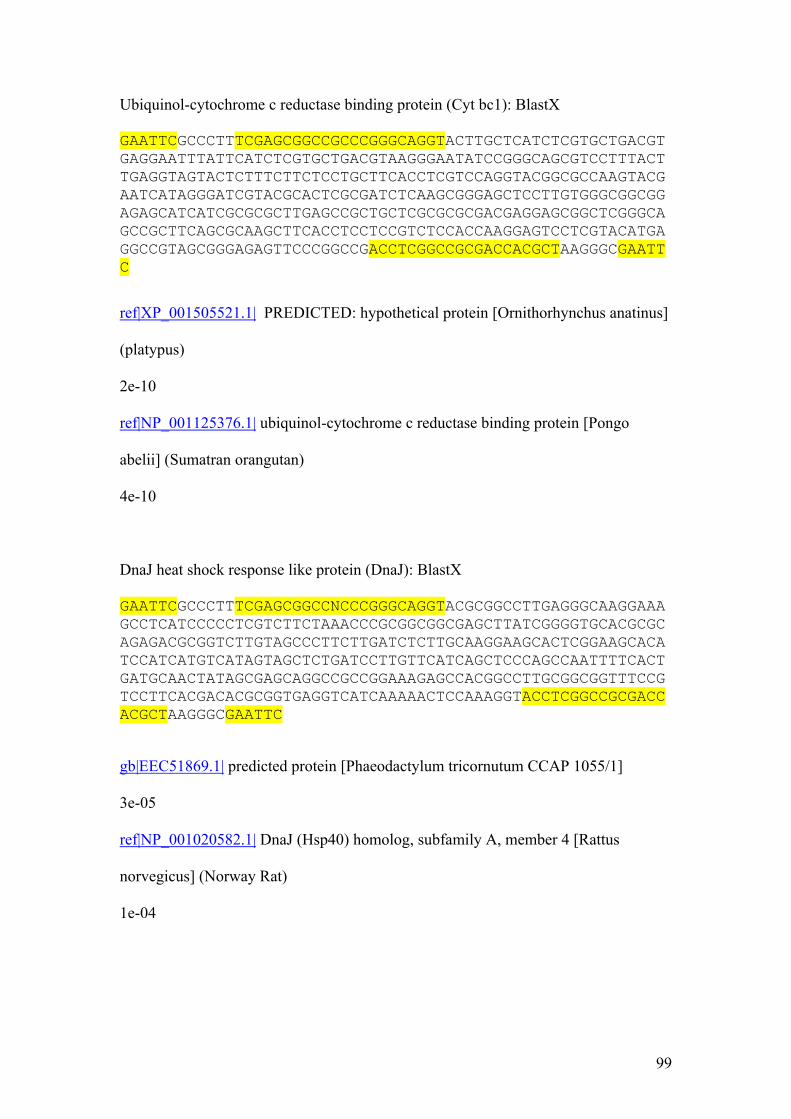
Ubiquinol-cytochrome c reductase binding protein (Cyt bc1): BlastX GAATTCGCCCTTTCGAGCGGCCGCCCGGGCAGGTACTTGCTCATCTCGTGCTGACGTGAGGAATTTATTCATCTCGTGCTGACGTAAGGGAATATCCGGGCAGCGTCCTTTACTTGAGGTAGTACTCTTTCTTCTCCTGCTTCACCTCGTCCAGGTACGGCGCCAAGTACGAATCATAGGGATCGTACGCACTCGCGATCTCAAGCGGGAGCTCCTTGTGGGCGGCGGAGAGCATCATCGCGCGCTTGAGCCGCTGCTCGCGCGCGACGAGGAGCGGCTCGGGCAGCCGCTTCAGCGCAAGCTTCACCTCCTCCGTCTCCACCAAGGAGTCCTCGTACATGAGGCCGTAGCGGGAGAGTTCCCGGCCGACCTCGGCCGCGACCACGCTAAGGGCGAATTC ref|XP_001505521.1| PREDICTED: hypothetical protein [Ornithorhynchus anatinus]
(platypus)
2e-10
ref|NP_001125376.1| ubiquinol-cytochrome c reductase binding protein [Pongo
abelii] (Sumatran orangutan)
4e-10
DnaJ heat shock response like protein (DnaJ): BlastX GAATTCGCCCTTTCGAGCGGCCNCCCGGGCAGGTACGCGGCCTTGAGGGCAAGGAAAGCCTCATCCCCCTCGTCTTCTAAACCCGCGGCGGCGAGCTTATCGGGGTGCACGCGCAGAGACGCGGTCTTGTAGCCCTTCTTGATCTCTTGCAAGGAAGCACTCGGAAGCACATCCATCATGTCATAGTAGCTCTGATCCTTGTTCATCAGCTCCCAGCCAATTTTCACTGATGCAACTATAGCGAGCAGGCCGCCGGAAAGAGCCACGGCCTTGCGGCGGTTTCCGTCCTTCACGACACGCGGTGAGGTCATCAAAAACTCCAAAGGTACCTCGGCCGCGACCACGCTAAGGGCGAATTC gb|EEC51869.1| predicted protein [Phaeodactylum tricornutum CCAP 1055/1]
3e-05
ref|NP_001020582.1| DnaJ (Hsp40) homolog, subfamily A, member 4 [Rattus
norvegicus] (Norway Rat)
1e-04
99
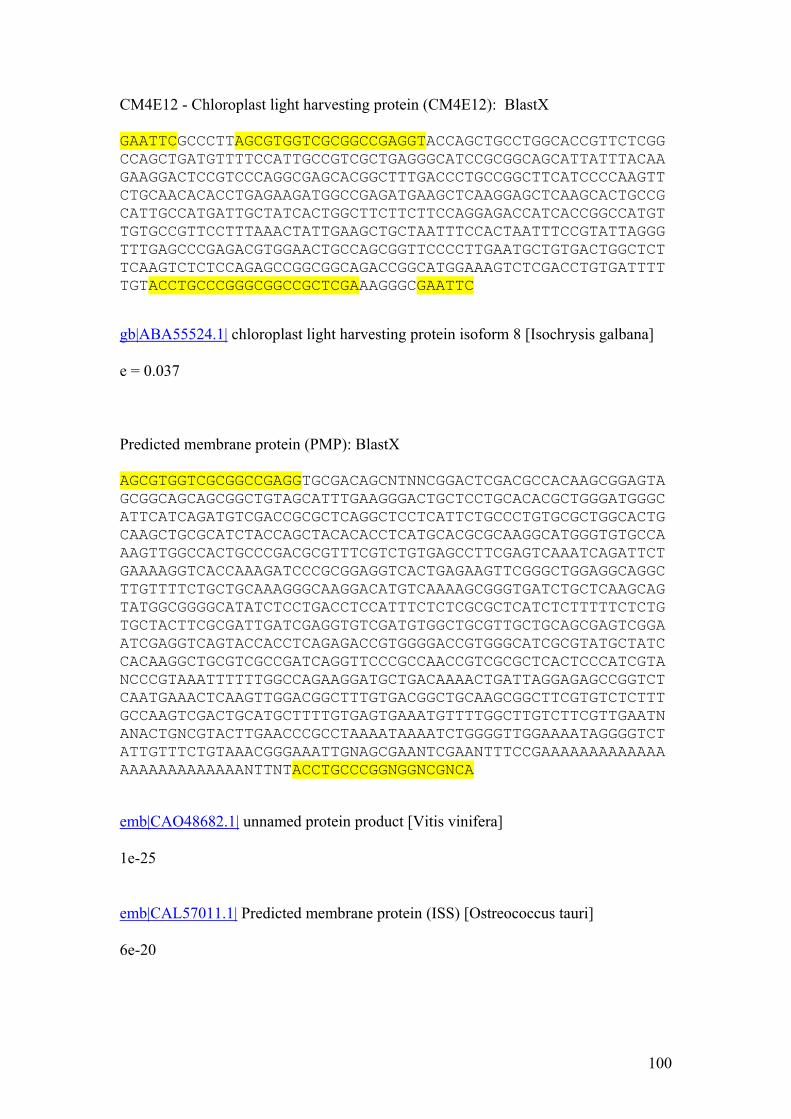
CM4E12 - Chloroplast light harvesting protein (CM4E12): BlastX GAATTCGCCCTTAGCGTGGTCGCGGCCGAGGTACCAGCTGCCTGGCACCGTTCTCGGCCAGCTGATGTTTTCCATTGCCGTCGCTGAGGGCATCCGCGGCAGCATTATTTACAAGAAGGACTCCGTCCCAGGCGAGCACGGCTTTGACCCTGCCGGCTTCATCCCCAAGTTCTGCAACACACCTGAGAAGATGGCCGAGATGAAGCTCAAGGAGCTCAAGCACTGCCGCATTGCCATGATTGCTATCACTGGCTTCTTCTTCCAGGAGACCATCACCGGCCATGTTGTGCCGTTCCTTTAAACTATTGAAGCTGCTAATTTCCACTAATTTCCGTATTAGGGTTTGAGCCCGAGACGTGGAACTGCCAGCGGTTCCCCTTGAATGCTGTGACTGGCTCTTCAAGTCTCTCCAGAGCCGGCGGCAGACCGGCATGGAAAGTCTCGACCTGTGATTTTTGTACCTGCCCGGGCGGCCGCTCGAAAGGGCGAATTC gb|ABA55524.1| chloroplast light harvesting protein isoform 8 [Isochrysis galbana]
e = 0.037
Predicted membrane protein (PMP): BlastX AGCGTGGTCGCGGCCGAGGTGCGACAGCNTNNCGGACTCGACGCCACAAGCGGAGTAGCGGCAGCAGCGGCTGTAGCATTTGAAGGGACTGCTCCTGCACACGCTGGGATGGGCATTCATCAGATGTCGACCGCGCTCAGGCTCCTCATTCTGCCCTGTGCGCTGGCACTGCAAGCTGCGCATCTACCAGCTACACACCTCATGCACGCGCAAGGCATGGGTGTGCCAAAGTTGGCCACTGCCCGACGCGTTTCGTCTGTGAGCCTTCGAGTCAAATCAGATTCTGAAAAGGTCACCAAAGATCCCGCGGAGGTCACTGAGAAGTTCGGGCTGGAGGCAGGCTTGTTTTCTGCTGCAAAGGGCAAGGACATGTCAAAAGCGGGTGATCTGCTCAAGCAGTATGGCGGGGCATATCTCCTGACCTCCATTTCTCTCGCGCTCATCTCTTTTTCTCTGTGCTACTTCGCGATTGATCGAGGTGTCGATGTGGCTGCGTTGCTGCAGCGAGTCGGAATCGAGGTCAGTACCACCTCAGAGACCGTGGGGACCGTGGGCATCGCGTATGCTATCCACAAGGCTGCGTCGCCGATCAGGTTCCCGCCAACCGTCGCGCTCACTCCCATCGTANCCCGTAAATTTTTTGGCCAGAAGGATGCTGACAAAACTGATTAGGAGAGCCGGTCTCAATGAAACTCAAGTTGGACGGCTTTGTGACGGCTGCAAGCGGCTTCGTGTCTCTTTGCCAAGTCGACTGCATGCTTTTGTGAGTGAAATGTTTTGGCTTGTCTTCGTTGAATNANACTGNCGTACTTGAACCCGCCTAAAATAAAATCTGGGGTTGGAAAATAGGGGTCTATTGTTTCTGTAAACGGGAAATTGNAGCGAANTCGAANTTTCCGAAAAAAAAAAAAAAAAAAAAAAAAAANTTNTACCTGCCCGGNGGNCGNCA emb|CAO48682.1| unnamed protein product [Vitis vinifera]
1e-25
emb|CAL57011.1| Predicted membrane protein (ISS) [Ostreococcus tauri]
6e-20
100
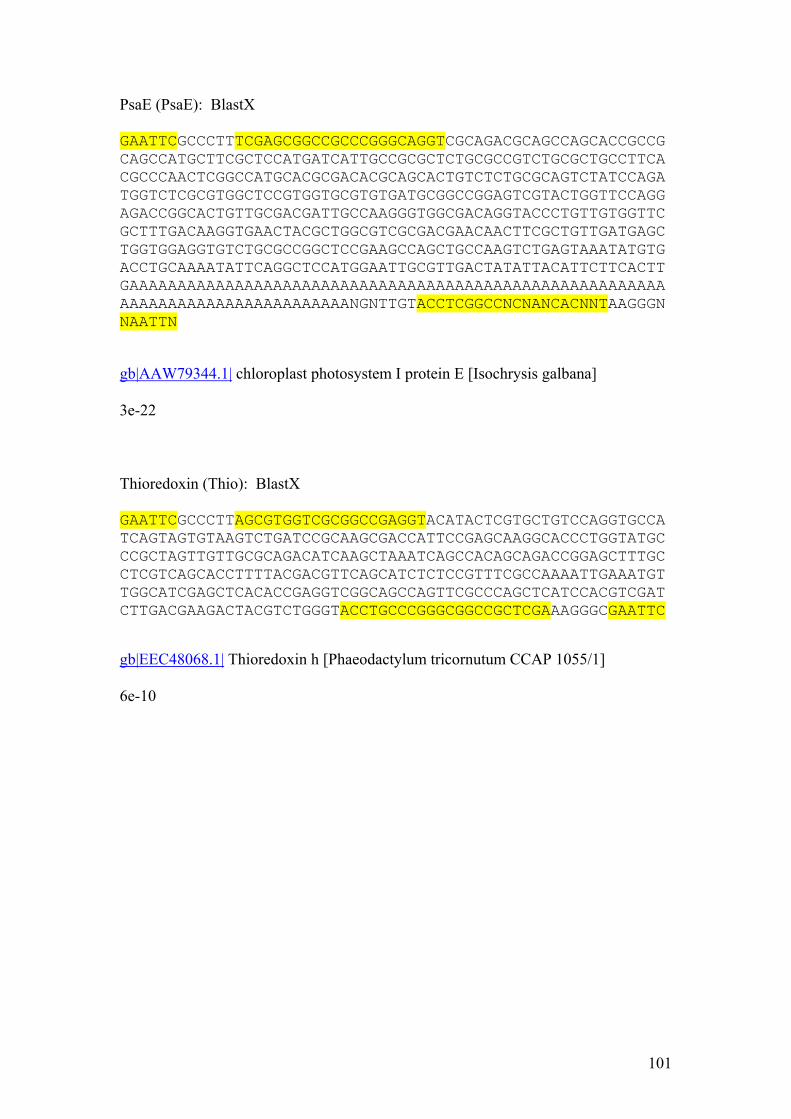
PsaE (PsaE): BlastX GAATTCGCCCTTTCGAGCGGCCGCCCGGGCAGGTCGCAGACGCAGCCAGCACCGCCGCAGCCATGCTTCGCTCCATGATCATTGCCGCGCTCTGCGCCGTCTGCGCTGCCTTCACGCCCAACTCGGCCATGCACGCGACACGCAGCACTGTCTCTGCGCAGTCTATCCAGATGGTCTCGCGTGGCTCCGTGGTGCGTGTGATGCGGCCGGAGTCGTACTGGTTCCAGGAGACCGGCACTGTTGCGACGATTGCCAAGGGTGGCGACAGGTACCCTGTTGTGGTTCGCTTTGACAAGGTGAACTACGCTGGCGTCGCGACGAACAACTTCGCTGTTGATGAGCTGGTGGAGGTGTCTGCGCCGGCTCCGAAGCCAGCTGCCAAGTCTGAGTAAATATGTGACCTGCAAAATATTCAGGCTCCATGGAATTGCGTTGACTATATTACATTCTTCACTTGAAAAAAAAAAAAAAAAAAAAAAAAAAAAAAAAAAAAAAAAAAAAAAAAAAAAAAAAAAAAAAAAAAAAAAAAAAAAAAAANGNTTGTACCTCGGCCNCNANCACNNTAAGGGNNAATTN gb|AAW79344.1| chloroplast photosystem I protein E [Isochrysis galbana]
3e-22
Thioredoxin (Thio): BlastX GAATTCGCCCTTAGCGTGGTCGCGGCCGAGGTACATACTCGTGCTGTCCAGGTGCCATCAGTAGTGTAAGTCTGATCCGCAAGCGACCATTCCGAGCAAGGCACCCTGGTATGCCCGCTAGTTGTTGCGCAGACATCAAGCTAAATCAGCCACAGCAGACCGGAGCTTTGCCTCGTCAGCACCTTTTACGACGTTCAGCATCTCTCCGTTTCGCCAAAATTGAAATGTTGGCATCGAGCTCACACCGAGGTCGGCAGCCAGTTCGCCCAGCTCATCCACGTCGATCTTGACGAAGACTACGTCTGGGTACCTGCCCGGGCGGCCGCTCGAAAGGGCGAATTC
gb|EEC48068.1| Thioredoxin h [Phaeodactylum tricornutum CCAP 1055/1] 6e-10
101
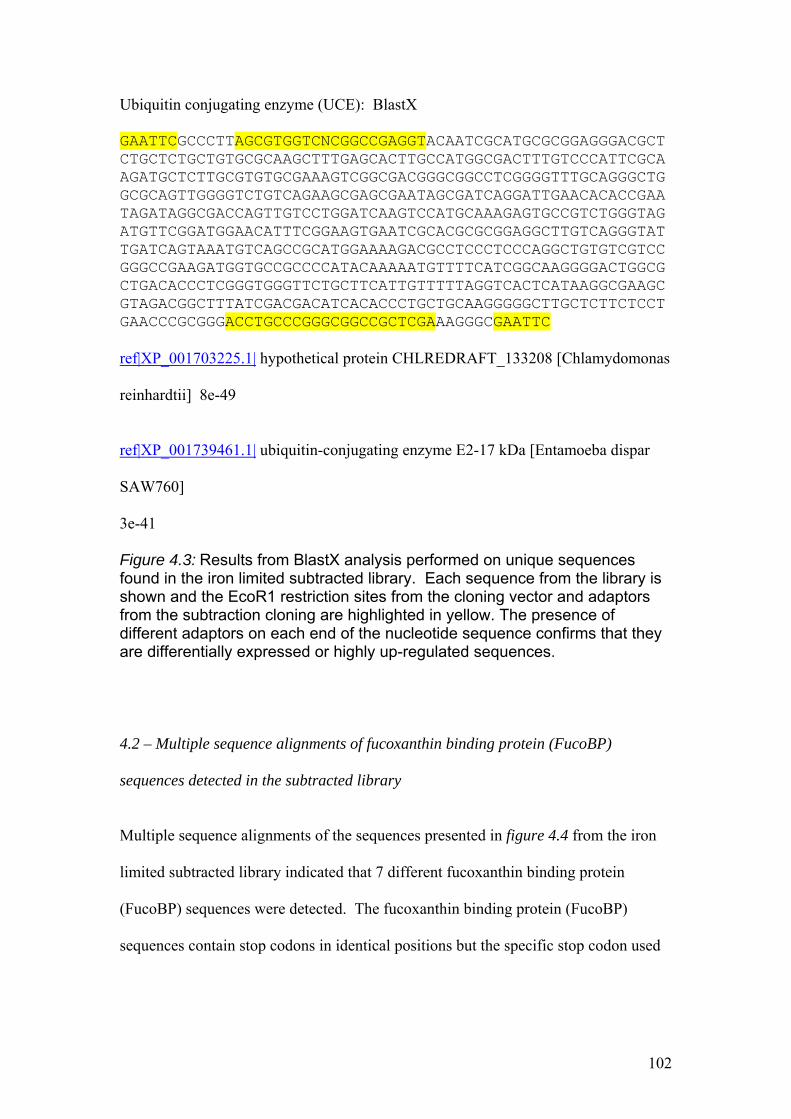
Ubiquitin conjugating enzyme (UCE): BlastX GAATTCGCCCTTAGCGTGGTCNCGGCCGAGGTACAATCGCATGCGCGGAGGGACGCTCTGCTCTGCTGTGCGCAAGCTTTGAGCACTTGCCATGGCGACTTTGTCCCATTCGCAAGATGCTCTTGCGTGTGCGAAAGTCGGCGACGGGCGGCCTCGGGGTTTGCAGGGCTGGCGCAGTTGGGGTCTGTCAGAAGCGAGCGAATAGCGATCAGGATTGAACACACCGAATAGATAGGCGACCAGTTGTCCTGGATCAAGTCCATGCAAAGAGTGCCGTCTGGGTAGATGTTCGGATGGAACATTTCGGAAGTGAATCGCACGCGCGGAGGCTTGTCAGGGTATTGATCAGTAAATGTCAGCCGCATGGAAAAGACGCCTCCCTCCCAGGCTGTGTCGTCCGGGCCGAAGATGGTGCCGCCCCATACAAAAATGTTTTCATCGGCAAGGGGACTGGCGCTGACACCCTCGGGTGGGTTCTGCTTCATTGTTTTTAGGTCACTCATAAGGCGAAGCGTAGACGGCTTTATCGACGACATCACACCCTGCTGCAAGGGGGCTTGCTCTTCTCCTGAACCCGCGGGACCTGCCCGGGCGGCCGCTCGAAAGGGCGAATTC ref|XP_001703225.1| hypothetical protein CHLREDRAFT_133208 [Chlamydomonas
reinhardtii] 8e-49
ref|XP_001739461.1| ubiquitin-conjugating enzyme E2-17 kDa [Entamoeba dispar
SAW760]
3e-41
Figure 4.3: Results from BlastX analysis performed on unique sequences found in the iron limited subtracted library. Each sequence from the library is shown and the EcoR1 restriction sites from the cloning vector and adaptors from the subtraction cloning are highlighted in yellow. The presence of different adaptors on each end of the nucleotide sequence confirms that they are differentially expressed or highly up-regulated sequences.
4.2 – Multiple sequence alignments of fucoxanthin binding protein (FucoBP)
sequences detected in the subtracted library
Multiple sequence alignments of the sequences presented in figure 4.4 from the iron
limited subtracted library indicated that 7 different fucoxanthin binding protein
(FucoBP) sequences were detected. The fucoxanthin binding protein (FucoBP)
sequences contain stop codons in identical positions but the specific stop codon used
102
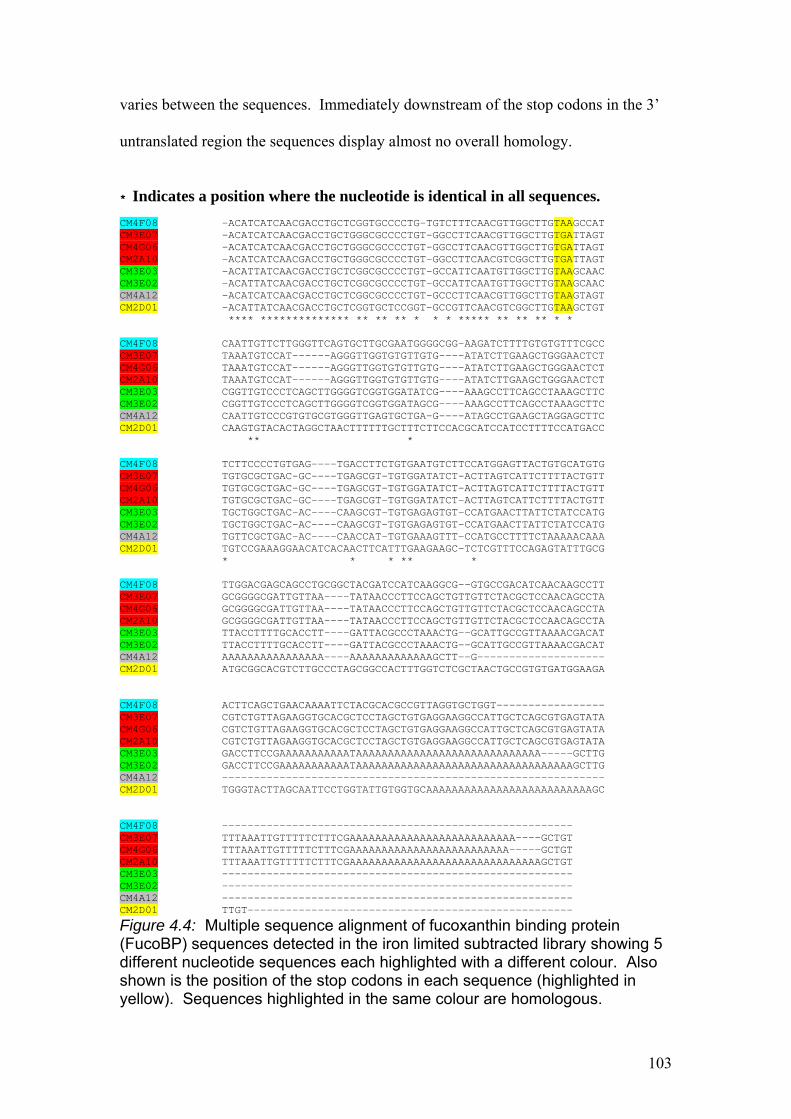
varies between the sequences. Immediately downstream of the stop codons in the 3’
untranslated region the sequences display almost no overall homology.
* Indicates a position where the nucleotide is identical in all sequences. CM4F08 -ACATCATCAACGACCTGCTCGGTGCCCCTG-TGTCTTTCAACGTTGGCTTGTAAGCCAT CM3E07 -ACATCATCAACGACCTGCTGGGCGCCCCTGT-GGCCTTCAACGTTGGCTTGTGATTAGT CM4G06 -ACATCATCAACGACCTGCTGGGCGCCCCTGT-GGCCTTCAACGTTGGCTTGTGATTAGT CM2A10 -ACATCATCAACGACCTGCTGGGCGCCCCTGT-GGCCTTCAACGTCGGCTTGTGATTAGT CM3E03 -ACATTATCAACGACCTGCTCGGCGCCCCTGT-GCCATTCAATGTTGGCTTGTAAGCAAC CM3E02 -ACATTATCAACGACCTGCTCGGCGCCCCTGT-GCCATTCAATGTTGGCTTGTAAGCAAC CM4A12 -ACATCATCAACGACCTGCTCGGCGCCCCTGT-GCCCTTCAACGTTGGCTTGTAAGTAGT CM2D01 -ACATTATCAACGACCTGCTCGGTGCTCCGGT-GCCGTTCAACGTCGGCTTGTAAGCTGT **** ************** ** ** ** * * * ***** ** ** ** * * CM4F08 CAATTGTTCTTGGGTTCAGTGCTTGCGAATGGGGCGG-AAGATCTTTTGTGTGTTTCGCC CM3E07 TAAATGTCCAT------AGGGTTGGTGTGTTGTG----ATATCTTGAAGCTGGGAACTCT CM4G06 TAAATGTCCAT------AGGGTTGGTGTGTTGTG----ATATCTTGAAGCTGGGAACTCT CM2A10 TAAATGTCCAT------AGGGTTGGTGTGTTGTG----ATATCTTGAAGCTGGGAACTCT CM3E03 CGGTTGTCCCTCAGCTTGGGGTCGGTGGATATCG----AAAGCCTTCAGCCTAAAGCTTC CM3E02 CGGTTGTCCCTCAGCTTGGGGTCGGTGGATAGCG----AAAGCCTTCAGCCTAAAGCTTC CM4A12 CAATTGTCCCGTGTGCGTGGGTTGAGTGCTGA-G----ATAGCCTGAAGCTAGGAGCTTC CM2D01 CAAGTGTACACTAGGCTAACTTTTTTGCTTTCTTCCACGCATCCATCCTTTTCCATGACC ** * CM4F08 TCTTCCCCTGTGAG----TGACCTTCTGTGAATGTCTTCCATGGAGTTACTGTGCATGTG CM3E07 TGTGCGCTGAC-GC----TGAGCGT-TGTGGATATCT-ACTTAGTCATTCTTTTACTGTT CM4G06 TGTGCGCTGAC-GC----TGAGCGT-TGTGGATATCT-ACTTAGTCATTCTTTTACTGTT CM2A10 TGTGCGCTGAC-GC----TGAGCGT-TGTGGATATCT-ACTTAGTCATTCTTTTACTGTT CM3E03 TGCTGGCTGAC-AC----CAAGCGT-TGTGAGAGTGT-CCATGAACTTATTCTATCCATG CM3E02 TGCTGGCTGAC-AC----CAAGCGT-TGTGAGAGTGT-CCATGAACTTATTCTATCCATG CM4A12 TGTTCGCTGAC-AC----CAACCAT-TGTGAAAGTTT-CCATGCCTTTTCTAAAAACAAA CM2D01 TGTCCGAAAGGAACATCACAACTTCATTTGAAGAAGC-TCTCGTTTCCAGAGTATTTGCG * * * ** * CM4F08 TTGGACGAGCAGCCTGCGGCTACGATCCATCAAGGCG--GTGCCGACATCAACAAGCCTT CM3E07 GCGGGGCGATTGTTAA----TATAACCCTTCCAGCTGTTGTTCTACGCTCCAACAGCCTA CM4G06 GCGGGGCGATTGTTAA----TATAACCCTTCCAGCTGTTGTTCTACGCTCCAACAGCCTA CM2A10 GCGGGGCGATTGTTAA----TATAACCCTTCCAGCTGTTGTTCTACGCTCCAACAGCCTA CM3E03 TTACCTTTTGCACCTT----GATTACGCCCTAAACTG--GCATTGCCGTTAAAACGACAT CM3E02 TTACCTTTTGCACCTT----GATTACGCCCTAAACTG--GCATTGCCGTTAAAACGACAT CM4A12 AAAAAAAAAAAAAAAA----AAAAAAAAAAAAAGCTT--G-------------------- CM2D01 ATGCGGCACGTCTTGCCCTAGCGGCCACTTTGGTCTCGCTAACTGCCGTGTGATGGAAGA CM4F08 ACTTCAGCTGAACAAAATTCTACGCACGCCGTTAGGTGCTGGT----------------- CM3E07 CGTCTGTTAGAAGGTGCACGCTCCTAGCTGTGAGGAAGGCCATTGCTCAGCGTGAGTATA CM4G06 CGTCTGTTAGAAGGTGCACGCTCCTAGCTGTGAGGAAGGCCATTGCTCAGCGTGAGTATA CM2A10 CGTCTGTTAGAAGGTGCACGCTCCTAGCTGTGAGGAAGGCCATTGCTCAGCGTGAGTATA CM3E03 GACCTTCCGAAAAAAAAAAATAAAAAAAAAAAAAAAAAAAAAAAAAAAAA-----GCTTG CM3E02 GACCTTCCGAAAAAAAAAAATAAAAAAAAAAAAAAAAAAAAAAAAAAAAAAAAAAGCTTG CM4A12 ------------------------------------------------------------ CM2D01 TGGGTACTTAGCAATTCCTGGTATTGTGGTGCAAAAAAAAAAAAAAAAAAAAAAAAAAGC CM4F08 ------------------------------------------------------- CM3E07 TTTAAATTGTTTTTCTTTCGAAAAAAAAAAAAAAAAAAAAAAAAAA----GCTGT CM4G06 TTTAAATTGTTTTTCTTTCGAAAAAAAAAAAAAAAAAAAAAAAAA-----GCTGT CM2A10 TTTAAATTGTTTTTCTTTCGAAAAAAAAAAAAAAAAAAAAAAAAAAAAAAGCTGT CM3E03 ------------------------------------------------------- CM3E02 ------------------------------------------------------- CM4A12 ------------------------------------------------------- CM2D01 TTGT---------------------------------------------------
Figure 4.4: Multiple sequence alignment of fucoxanthin binding protein (FucoBP) sequences detected in the iron limited subtracted library showing 5 different nucleotide sequences each highlighted with a different colour. Also shown is the position of the stop codons in each sequence (highlighted in yellow). Sequences highlighted in the same colour are homologous.
103
In addition to cDNAs encoding proteins involved in light-harvesting (fucoxanthin
binding proteins and chloroplast light-harvesting protein) one further differentially
expressed photosynthesis-related cDNA was recovered several times from iron-
limited cultures. This cDNA showed strong homology to the psaE gene, the product
of which is involved in stabilising the docking of ferredoxin (and flavodoxin) to
photosystem I. A number of cDNAs related to sequences encoding proteins known to
be up-regulated in response to stress (including oxidative stress) were also recovered.
These included DnaJ, thioredoxin, and a number of proteins involved in protein
turnover such as a ubiquitin-conjugating enzyme and 20S proteosome subunit. None
of these cDNAs were recovered in the limited number of cDNAs analysed from iron-
replete cells.
Despite reports of substantial up-regulation of flavodoxin by iron limitation in other
phytoplankton, no cDNAs were recovered that were related to this protein from either
iron-replete or limited cells. To assess whether C. pelagicus contains a flavodoxin
gene, degenerate primers were designed based on multiple sequence comparisons of
the protein from other chromophyte algae.
104
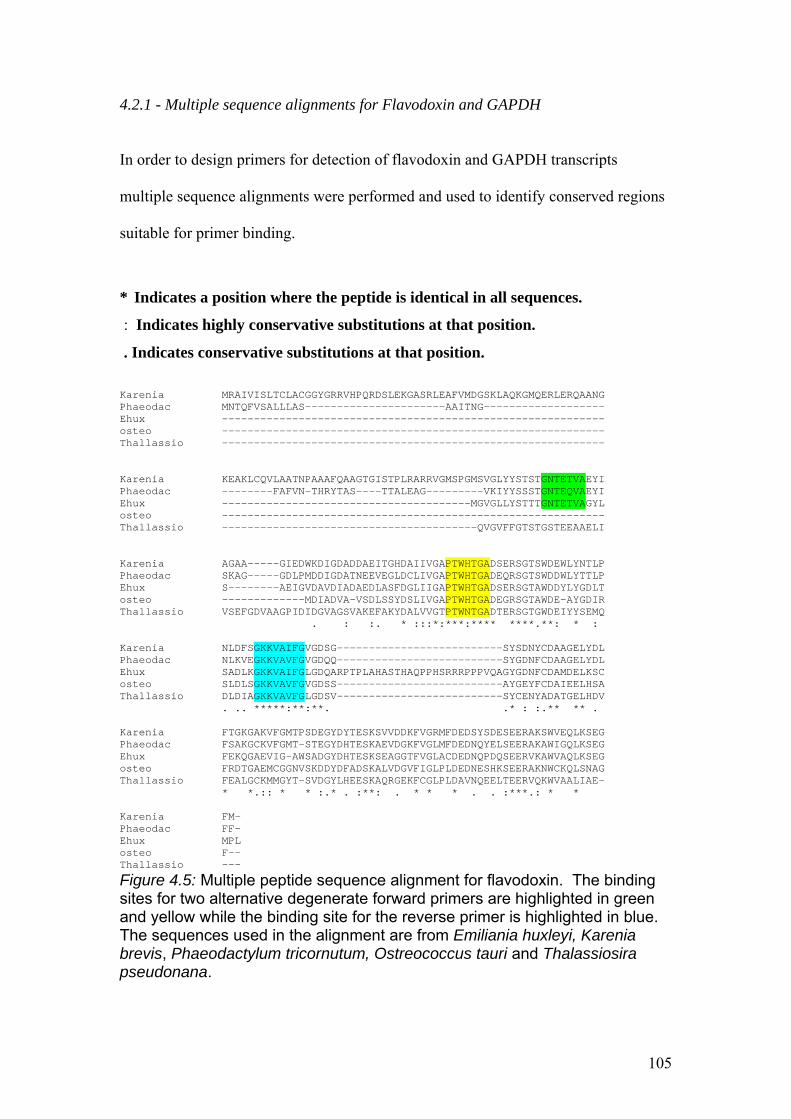
4.2.1 - Multiple sequence alignments for Flavodoxin and GAPDH In order to design primers for detection of flavodoxin and GAPDH transcripts
multiple sequence alignments were performed and used to identify conserved regions
suitable for primer binding.
* Indicates a position where the peptide is identical in all sequences.
: Indicates highly conservative substitutions at that position.
. Indicates conservative substitutions at that position.
Karenia MRAIVISLTCLACGGYGRRVHPQRDSLEKGASRLEAFVMDGSKLAQKGMQERLERQAANG Phaeodac MNTQFVSALLLAS----------------------AAITNG------------------- Ehux ------------------------------------------------------------ osteo ------------------------------------------------------------ Thallassio ------------------------------------------------------------ Karenia KEAKLCQVLAATNPAAAFQAAGTGISTPLRARRVGMSPGMSVGLYYSTSTGNTETVAEYI Phaeodac --------FAFVN-THRYTAS----TTALEAG---------VKIYYSSSTGNTEQVAEYI Ehux ---------------------------------------MGVGLLYSTTTGNTETVAGYL osteo ------------------------------------------------------------ Thallassio ----------------------------------------QVGVFFGTSTGSTEEAAELI Karenia AGAA-----GIEDWKDIGDADDAEITGHDAIIVGAPTWHTGADSERSGTSWDEWLYNTLP Phaeodac SKAG-----GDLPMDDIGDATNEEVEGLDCLIVGAPTWHTGADEQRSGTSWDDWLYTTLP Ehux S--------AEIGVDAVDIADAEDLASFDGLIIGAPTWHTGADSERSGTAWDDYLYGDLT osteo -------------MDIADVA-VSDLSSYDSLIVGAPTWHTGADEGRSGTAWDE-AYGDIR Thallassio VSEFGDVAAGPIDIDGVAGSVAKEFAKYDALVVGTPTWNTGADTERSGTGWDEIYYSEMQ . : :. * :::*:***:**** ****.**: * : Karenia NLDFSGKKVAIFGVGDSG--------------------------SYSDNYCDAAGELYDL Phaeodac NLKVEGKKVAVFGVGDQQ--------------------------SYGDNFCDAAGELYDL Ehux SADLKGKKVAIFGLGDQARPTPLAHASTHAQPPHSRRRPPPVQAGYGDNFCDAMDELKSC osteo SLDLSGKKVAVFGVGDSS--------------------------AYGEYFCDAIEELHSA Thallassio DLDIAGKKVAVFGLGDSV--------------------------SYCENYADATGELHDV . .. *****:**:**. .* : :.** ** . Karenia FTGKGAKVFGMTPSDEGYDYTESKSVVDDKFVGRMFDEDSYSDESEERAKSWVEQLKSEG Phaeodac FSAKGCKVFGMT-STEGYDHTESKAEVDGKFVGLMFDEDNQYELSEERAKAWIGQLKSEG Ehux FEKQGAEVIG-AWSADGYDHTESKSEAGGTFVGLACDEDNQPDQSEERVKAWVAQLKSEG osteo FRDTGAEMCGGNVSKDDYDFADSKALVDGVFIGLPLDEDNESHKSEERAKNWCKQLSNAG Thallassio FEALGCKMMGYT-SVDGYLHEESKAQRGEKFCGLPLDAVNQEELTEERVQKWVAALIAE- * *.:: * * :.* . :**: . * * * . . :***.: * * Karenia FM- Phaeodac FF- Ehux MPL osteo F-- Thallassio ---
Figure 4.5: Multiple peptide sequence alignment for flavodoxin. The binding sites for two alternative degenerate forward primers are highlighted in green and yellow while the binding site for the reverse primer is highlighted in blue. The sequences used in the alignment are from Emiliania huxleyi, Karenia brevis, Phaeodactylum tricornutum, Ostreococcus tauri and Thalassiosira pseudonana.
105
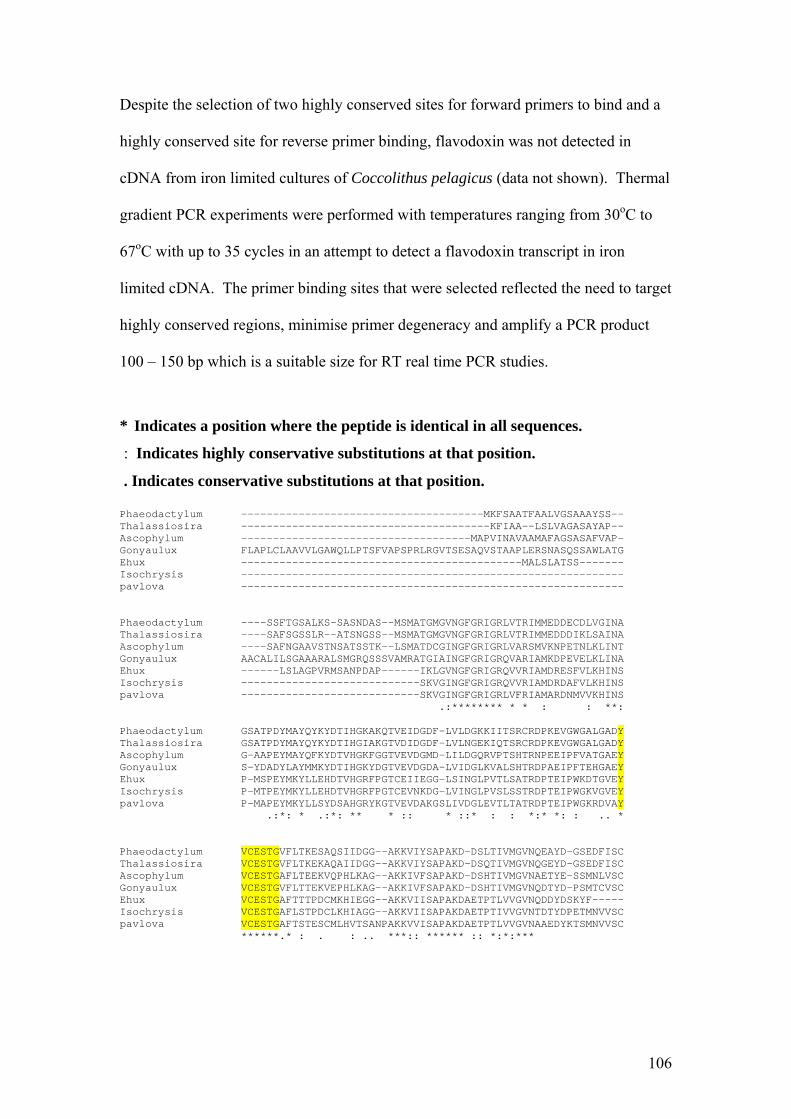
Despite the selection of two highly conserved sites for forward primers to bind and a
highly conserved site for reverse primer binding, flavodoxin was not detected in
cDNA from iron limited cultures of Coccolithus pelagicus (data not shown). Thermal
gradient PCR experiments were performed with temperatures ranging from 30oC to
67oC with up to 35 cycles in an attempt to detect a flavodoxin transcript in iron
limited cDNA. The primer binding sites that were selected reflected the need to target
highly conserved regions, minimise primer degeneracy and amplify a PCR product
100 – 150 bp which is a suitable size for RT real time PCR studies.
* Indicates a position where the peptide is identical in all sequences.
: Indicates highly conservative substitutions at that position.
. Indicates conservative substitutions at that position.
Phaeodactylum --------------------------------------MKFSAATFAALVGSAAAYSS-- Thalassiosira ---------------------------------------KFIAA--LSLVAGASAYAP-- Ascophylum ------------------------------------MAPVINAVAAMAFAGSASAFVAP- Gonyaulux FLAPLCLAAVVLGAWQLLPTSFVAPSPRLRGVTSESAQVSTAAPLERSNASQSSAWLATG Ehux --------------------------------------------MALSLATSS------- Isochrysis ------------------------------------------------------------ pavlova ------------------------------------------------------------ Phaeodactylum ----SSFTGSALKS-SASNDAS--MSMATGMGVNGFGRIGRLVTRIMMEDDECDLVGINA Thalassiosira ----SAFSGSSLR--ATSNGSS--MSMATGMGVNGFGRIGRLVTRIMMEDDDIKLSAINA Ascophylum ----SAFNGAAVSTNSATSSTK--LSMATDCGINGFGRIGRLVARSMVKNPETNLKLINT Gonyaulux AACALILSGAAARALSMGRQSSSVAMRATGIAINGFGRIGRQVARIAMKDPEVELKLINA Ehux ------LSLAGPVRMSANPDAP------IKLGVNGFGRIGRQVVRIAMDRESFVLKHINS Isochrysis ----------------------------SKVGINGFGRIGRQVVRIAMDRDAFVLKHINS pavlova ----------------------------SKVGINGFGRIGRLVFRIAMARDNMVVKHINS .:******** * * : : **: Phaeodactylum GSATPDYMAYQYKYDTIHGKAKQTVEIDGDF-LVLDGKKIITSRCRDPKEVGWGALGADY Thalassiosira GSATPDYMAYQYKYDTIHGIAKGTVDIDGDF-LVLNGEKIQTSRCRDPKEVGWGALGADY Ascophylum G-AAPEYMAYQFKYDTVHGKFGGTVEVDGMD-LILDGQRVPTSHTRNPEEIPFVATGAEY Gonyaulux S-YDADYLAYMMKYDTIHGKYDGTVEVDGDA-LVIDGLKVALSHTRDPAEIPFTEHGAEY Ehux P-MSPEYMKYLLEHDTVHGRFPGTCEIIEGG-LSINGLPVTLSATRDPTEIPWKDTGVEY Isochrysis P-MTPEYMKYLLEHDTVHGRFPGTCEVNKDG-LVINGLPVSLSSTRDPTEIPWGKVGVEY pavlova P-MAPEYMKYLLSYDSAHGRYKGTVEVDAKGSLIVDGLEVTLTATRDPTEIPWGKRDVAY .:*: * .:*: ** * :: * ::* : : *:* *: : .. * Phaeodactylum VCESTGVFLTKESAQSIIDGG--AKKVIYSAPAKD-DSLTIVMGVNQEAYD-GSEDFISC Thalassiosira VCESTGVFLTKEKAQAIIDGG--AKKVIYSAPAKD-DSQTIVMGVNQGEYD-GSEDFISC Ascophylum VCESTGAFLTEEKVQPHLKAG--AKKIVFSAPAKD-DSHTIVMGVNAETYE-SSMNLVSC Gonyaulux VCESTGVFLTTEKVEPHLKAG--AKKIVFSAPAKD-DSHTIVMGVNQDTYD-PSMTCVSC Ehux VCESTGAFTTTPDCMKHIEGG--AKKVIISAPAKDAETPTLVVGVNQDDYDSKYF----- Isochrysis VCESTGAFLSTPDCLKHIAGG--AKKVIISAPAKDAETPTIVVGVNTDTYDPETMNVVSC pavlova VCESTGAFTSTESCMLHVTSANPAKKVVISAPAKDAETPTLVVGVNAAEDYKTSMNVVSC ******.* : . : .. ***:: ****** :: *:*:***
106
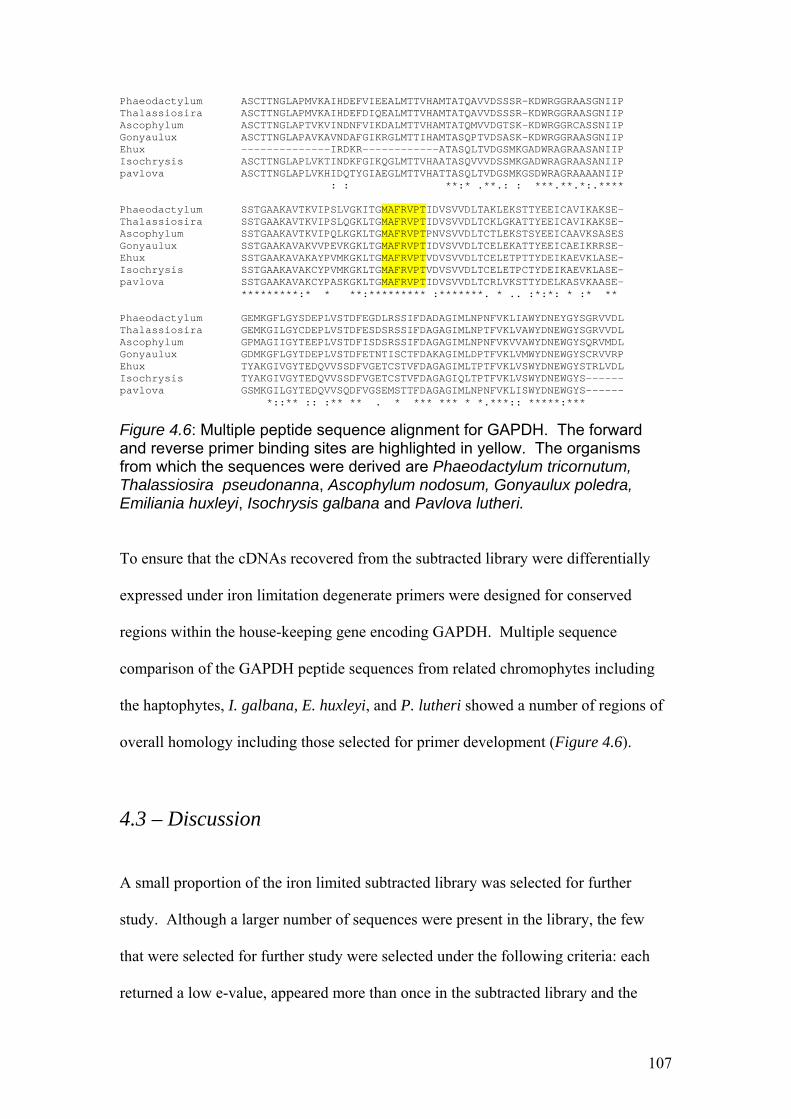
Phaeodactylum ASCTTNGLAPMVKAIHDEFVIEEALMTTVHAMTATQAVVDSSSR-KDWRGGRAASGNIIP Thalassiosira ASCTTNGLAPMVKAIHDEFDIQEALMTTVHAMTATQAVVDSSSR-KDWRGGRAASGNIIP Ascophylum ASCTTNGLAPTVKVINDNFVIKDALMTTVHAMTATQMVVDGTSK-KDWRGGRCASSNIIP Gonyaulux ASCTTNGLAPAVKAVNDAFGIKRGLMTTIHAMTASQPTVDSASK-KDWRGGRAASGNIIP Ehux --------------IRDKR------------ATASQLTVDGSMKGADWRAGRAASANIIP Isochrysis ASCTTNGLAPLVKTINDKFGIKQGLMTTVHAATASQVVVDSSMKGADWRAGRAASANIIP pavlova ASCTTNGLAPLVKHIDQTYGIAEGLMTTVHATTASQLTVDGSMKGSDWRAGRAAAANIIP : : **:* .**.: : ***.**.*:.**** Phaeodactylum SSTGAAKAVTKVIPSLVGKITGMAFRVPTIDVSVVDLTAKLEKSTTYEEICAVIKAKSE- Thalassiosira SSTGAAKAVTKVIPSLQGKLTGMAFRVPTIDVSVVDLTCKLGKATTYEEICAVIKAKSE- Ascophylum SSTGAAKAVTKVIPQLKGKLTGMAFRVPTPNVSVVDLTCTLEKSTSYEEICAAVKSASES Gonyaulux SSTGAAKAVAKVVPEVKGKLTGMAFRVPTIDVSVVDLTCELEKATTYEEICAEIKRRSE- Ehux SSTGAAKAVAKAYPVMKGKLTGMAFRVPTVDVSVVDLTCELETPTTYDEIKAEVKLASE- Isochrysis SSTGAAKAVAKCYPVMKGKLTGMAFRVPTVDVSVVDLTCELETPCTYDEIKAEVKLASE- pavlova SSTGAAKAVAKCYPASKGKLTGMAFRVPTIDVSVVDLTCRLVKSTTYDELKASVKAASE- *********:* * **:********* :*******. * .. :*:*: * :* ** Phaeodactylum GEMKGFLGYSDEPLVSTDFEGDLRSSIFDADAGIMLNPNFVKLIAWYDNEYGYSGRVVDL Thalassiosira GEMKGILGYCDEPLVSTDFESDSRSSIFDAGAGIMLNPTFVKLVAWYDNEWGYSGRVVDL Ascophylum GPMAGIIGYTEEPLVSTDFISDSRSSIFDAGAGIMLNPNFVKVVAWYDNEWGYSQRVMDL Gonyaulux GDMKGFLGYTDEPLVSTDFETNTISCTFDAKAGIMLDPTFVKLVMWYDNEWGYSCRVVRP Ehux TYAKGIVGYTEDQVVSSDFVGETCSTVFDAGAGIMLTPTFVKLVSWYDNEWGYSTRLVDL Isochrysis TYAKGIVGYTEDQVVSSDFVGETCSTVFDAGAGIQLTPTFVKLVSWYDNEWGYS------ pavlova GSMKGILGYTEDQVVSQDFVGSEMSTTFDAGAGIMLNPNFVKLISWYDNEWGYS------ *::** :: :** ** . * *** *** * *.***:: *****:***
Figure 4.6: Multiple peptide sequence alignment for GAPDH. The forward and reverse primer binding sites are highlighted in yellow. The organisms from which the sequences were derived are Phaeodactylum tricornutum, Thalassiosira pseudonanna, Ascophylum nodosum, Gonyaulux poledra, Emiliania huxleyi, Isochrysis galbana and Pavlova lutheri.
To ensure that the cDNAs recovered from the subtracted library were differentially
expressed under iron limitation degenerate primers were designed for conserved
regions within the house-keeping gene encoding GAPDH. Multiple sequence
comparison of the GAPDH peptide sequences from related chromophytes including
the haptophytes, I. galbana, E. huxleyi, and P. lutheri showed a number of regions of
overall homology including those selected for primer development (Figure 4.6).
4.3 – Discussion
A small proportion of the iron limited subtracted library was selected for further
study. Although a larger number of sequences were present in the library, the few
that were selected for further study were selected under the following criteria: each
returned a low e-value, appeared more than once in the subtracted library and the
107
putative identities of the proteins were reasonable within the context of iron
limitation.
Multiple fucoxanthin / chlorophyll binding proteins were detected in the iron limited
subtracted library. Five different fucoxanthin binding protein sequences were
detected which shared a certain degree of homology in the coding region but differed
dramatically in their 3′ untranslated regions and in their stop codons. These
differences suggest the differential expression of individual members of a multigene
family in response to iron limitation.
Up-regulation / differential expression of accessory pigments may result in a higher
ratio of accessory pigments : chlorophyll a than would be observed under iron replete
conditions. This has been reported in iron limited cultures of the diatom
Phaeodactylum tricornutum (Greene et al., 1991, 1992) and the haptophyte
Phaeocystis (van Leeuwe & Stefels, 1998). In the case of Phaeocystis, synthesis of
19’-butanoyloxyfucoxanthin and 19’-hexanoyloxyfucoxanthin was increased at the
expense of fucoxanthin which is the main carotenoid under iron replete conditions.
This response may help to dissipate excess energy absorbed by the cells by reducing
the efficiency of energy transfer to the photosystems when low iron availability has
impaired the effectiveness of the electron transport chains. This would help to
maintain the redox balance of the photosynthetic electron transport chain and reduce
the likelihood of formation of reactive oxygen species (van Leeuwe & Stefels, 1998).
As the Coccolithus pelagicus cultures in this investigation are highly unlikely to have
suffered any light limitation, requiring additional pigments to gather light under the
growth conditions in the incubator, it is conceivable that up-regulation / differential
108
expression of fucoxanthin binding protein transcripts in iron limited cells could be a
photo-protective response.
Unfortunately the fucoxanthin binding protein sequences obtained in the subtracted
cDNA library were only a small segment of the 3′ end of the transcript with only 51
nucleotides of the coding region present. Based on a multiple sequence alignment it
was found that there were 5 different fucoxanthin binding protein transcripts that were
exclusive to the iron limited subtracted cDNA library. Most of the variance in the
sequences was in the 3′ untranslated regions. Sequence homology in the coding
region but not in the 3′ untranslated region may indicate that the 5 fucoxanthin
binding protein sequences are the result of differential expression of a multigene
family in response to iron limitation.
psaE detected in the iron limited subtracted library is a photosystem I protein which
facilitates the docking of soluble electron acceptors (particularly
ferredoxin/flavodoxin) to the photosystem in order to allow efficient electron transfer
(Rousseau et al., 1993). It has also been reported to be involved in protecting the cell
from photo-oxidative damage by preventing the formation of reduced oxygen species
in the cyanobacterium Synechocystis sp. PCC 6803 (Jeanjean et al., 2008). This study
found that in PsaE-null mutants of Synechocystis sp. PCC 6803 expression of genes
encoding iron superoxide dismutase (sodB) and catalase (katG) were up-regulated
relative to the wild type. The resultant increased activity of these enzymes which are
involved in combating reactive oxygen species was thought to be a compensatory
response to the increased generation of reactive oxygen species in the psaE-null
mutant. The study concluded that the presence of the PsaE protein at the reducing
109
side of photosystem I serves to prevent the formation of toxic oxygen species
resulting from electron leakage to oxygen in the light. Since iron limited
phytoplankton cells essentially suffer from an excess of absorbed light energy due to
the reduced efficiency of the photosynthetic electron transport chains it is likely that
in Coccolithus pelagicus up-regulation of the psaE transcript is a photo-protective
response. Increased amounts of the PsaE protein may increase the efficiency of
electron transfer to soluble electron acceptors docked with photosystem I and reduce
the risk of electrons being leaked from the system and reacting with oxygen species at
this point in the electron transport chain.
The predicted membrane protein transcript (PMP) was selected for further study due
to the fact that it returned a very low e value although the exact function of this
protein has not been determined. One possibility is that it may represent an enzyme in
the cell membrane involved in iron acquisition. However, this is based only on the
fact that it appeared in the iron limited subtracted library presented in this
investigation and is predicted to be associated with a membrane. The function of the
predicted membrane protein was not investigated further and within the scope of this
investigation its up-regulation under iron limited conditions was the extent to which it
was examined.
Thioredoxin is a ubiquitous redox signalling enzyme involved in a multitude of
signalling activities throughout the cell. It is known that thioredoxins play a major
role in responses to oxidative stress either through redox signalling or more directly
by acting as electron donors to the members of the peroxiredoxins (Dietz, 2003). The
role of thioredoxins in regulating cellular activities is so varied that it is unlikely to
make a good biomarker for iron limitation due to the fact that iron limitation /
110
oxidative stress is unlikely to be the only conditions under which up-regulation of
thioredoxins will occur. Interestingly thioredoxin has been shown to be involved in
catalase regulation in Chlamydomonas reinhardtii, a situation which has not been
reported for higher plants on which most studies of thioredoxins have been focussed
(Lemaire et al., 2004). As catalase is an enzyme involved in combating oxidative
stress – a problem which iron limited phytoplankton cells inevitably must deal with, it
is conceivable that the detection of thioredoxin in the iron limited subtracted library
may indicate that it is involved in the regulation of the response of Coccolithus
pelagicus cells to iron limitation induced oxidative stress. Interestingly the
thioredoxin detected in the iron limited subtracted library is thioredoxin h which is a
cytosolic isoform whose reduction proceeds via an NADPH-dependent thioredoxin
reductase enzyme, as opposed to a ferredoxin-dependent thioredoxin reductase (Besse
et al., 1996; Cho et al., 1999). This may indicate a preference for thioredoxins that do
not demand a share of the cell’s reduced ferredoxin supply under iron limited
conditions.
Ubiquitin conjugating enzyme (UCE) was the most abundant of the sequences
detected in the iron limited subtracted library representing 4.78% of the total clones
sequenced. The 20s proteasome subunit accounted for 2.2% of the clones sequenced
and was the third most abundant identifiable transcript in the library. Such a large
proportion of the iron limited subtracted library being represented by enzymes
involved in protein degradation may be an indication of the use of the protein
degradation machinery to continuously recycle proteins in the cell. This may be in
order to recycle iron containing proteins and keep the cellular iron pool in a flexible
state or it may also be a more general response resulting from the need to recycle
111
amino acids due to a lack of iron cofactor for enzymes involved in amino acid
biosynthesis. A need to recycle the cellular pool of amino acids may also be related
to a reduced supply of ammonium for incorporation into amino acids. The
impairment of nitrogen assimilation in phytoplankton cells imposed by iron limitation
has been reported in several species (Raven et al., 1992; Maldonado & Price, 1996;
Milligan & Harrison, 2000). If the ability of the cell to supply reduced forms of
nitrogen is impaired then this is likely to result in less ammonium being available to
the cell for incorporation into amino acids. It may also be the case that there is a need
to rapidly break down and reassemble the photosynthetic and respiratory electron
transport chains during periods of light and dark in order to maintain a flexible iron
pool in the cell.
112
Chapter 5 – RNA extractions, DNase digests, primer
optimisation and real time PCR results
5.1 – Chapter introduction Agarose gels from RNA extraction and primer optimisation experiments are presented
to demonstrate the quality of experimental and sample preparation for reverse
transcription real time PCR (RT Q-PCR) experiments. High quality RNA extraction,
thorough DNase treatment and primer optimisation are essential for accurate RT Q-
PCR experiments and the data shown in this chapter demonstrates that such criteria
was met. The data showing the optimum annealing temperatures for each set of
primers used in RT Q-PCR are shown and the evidence that each primer set amplifies
only a single product from a mixed cDNA template is also shown. RT Q-PCR gene
expression data is presented as a series of histograms which detail the extent to which
transcripts were up or down regulated in iron limited Coccolithus pelagicus cells.
Where there was any ambiguity in the RT Q-PCR fluorescence profiles, suggesting
the possibility of multiple products resulting from DNA contamination, the reactions
were run out on agarose gels to demonstrate the presence of a single product only.
That data is presented here.
5.1.1 – Examination of extracted DNase treated RNA on agarose gels All RNA extracted for use in subtraction cloning and reverse transcription PCR to
generate template for real time PCR was run on 1.5% agarose gels to assess the
integrity of the ribosomal RNA bands and the level of DNA contamination. In total 4
RNA extractions were conducted on separate iron replete and iron limited cultures of
Coccolithus pelagicus:
113
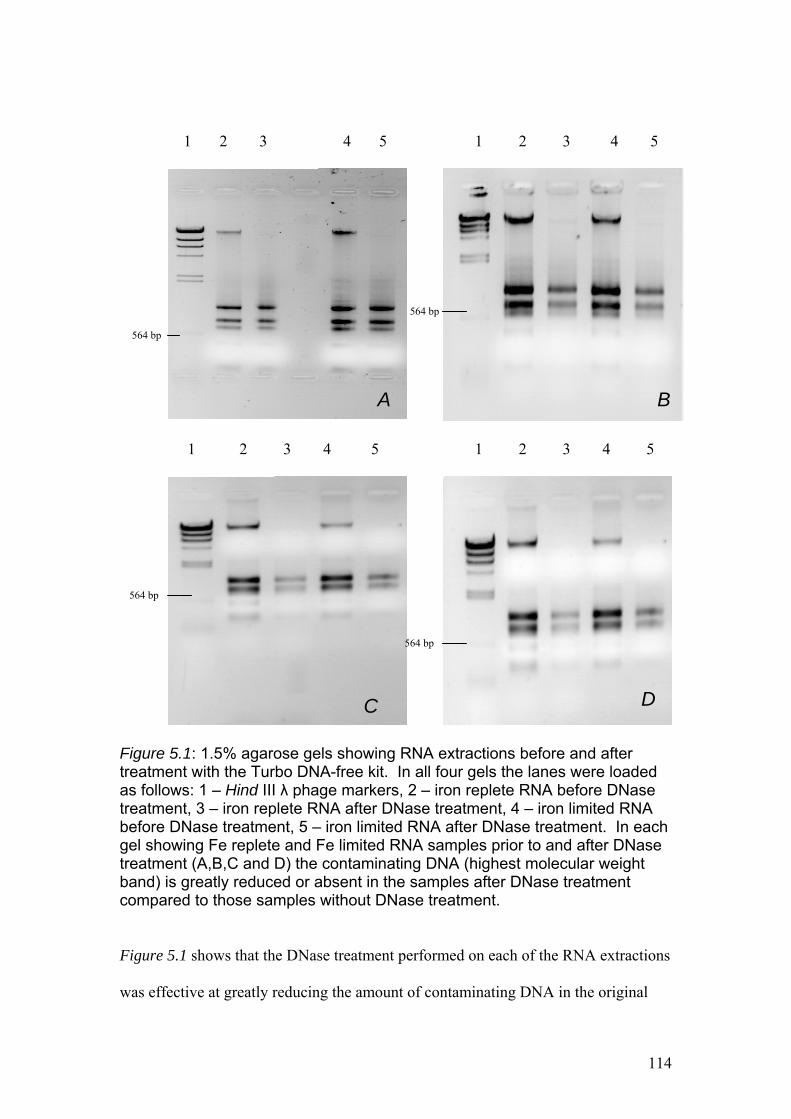
1 2 3 4 5 1 2 3 4 5
1 2 3 4 5 1 2 3 4 5
A B
564 bp
C
564 bp
D
564 bp
564 bp
Figure 5.1: 1.5% agarose gels showing RNA extractions before and after treatment with the Turbo DNA-free kit. In all four gels the lanes were loaded as follows: 1 – Hind III λ phage markers, 2 – iron replete RNA before DNase treatment, 3 – iron replete RNA after DNase treatment, 4 – iron limited RNA before DNase treatment, 5 – iron limited RNA after DNase treatment. In each gel showing Fe replete and Fe limited RNA samples prior to and after DNase treatment (A,B,C and D) the contaminating DNA (highest molecular weight band) is greatly reduced or absent in the samples after DNase treatment compared to those samples without DNase treatment.
Figure 5.1 shows that the DNase treatment performed on each of the RNA extractions
was effective at greatly reducing the amount of contaminating DNA in the original
114
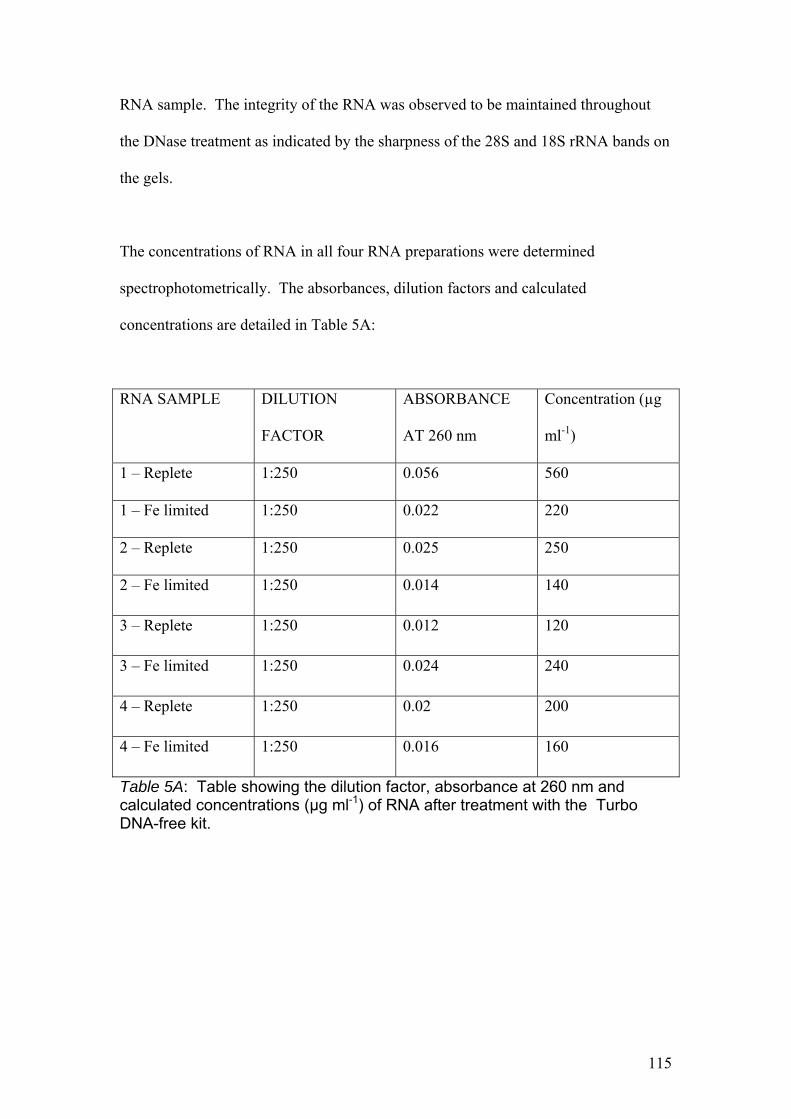
RNA sample. The integrity of the RNA was observed to be maintained throughout
the DNase treatment as indicated by the sharpness of the 28S and 18S rRNA bands on
the gels.
The concentrations of RNA in all four RNA preparations were determined
spectrophotometrically. The absorbances, dilution factors and calculated
concentrations are detailed in Table 5A:
RNA SAMPLE DILUTION
FACTOR
ABSORBANCE
AT 260 nm
Concentration (µg
ml-1)
1 – Replete 1:250 0.056 560
1 – Fe limited 1:250 0.022 220
2 – Replete 1:250 0.025 250
2 – Fe limited 1:250 0.014 140
3 – Replete 1:250 0.012 120
3 – Fe limited 1:250 0.024 240
4 – Replete 1:250 0.02 200
4 – Fe limited 1:250 0.016 160
Table 5A: Table showing the dilution factor, absorbance at 260 nm and calculated concentrations (µg ml-1) of RNA after treatment with the Turbo DNA-free kit.
115
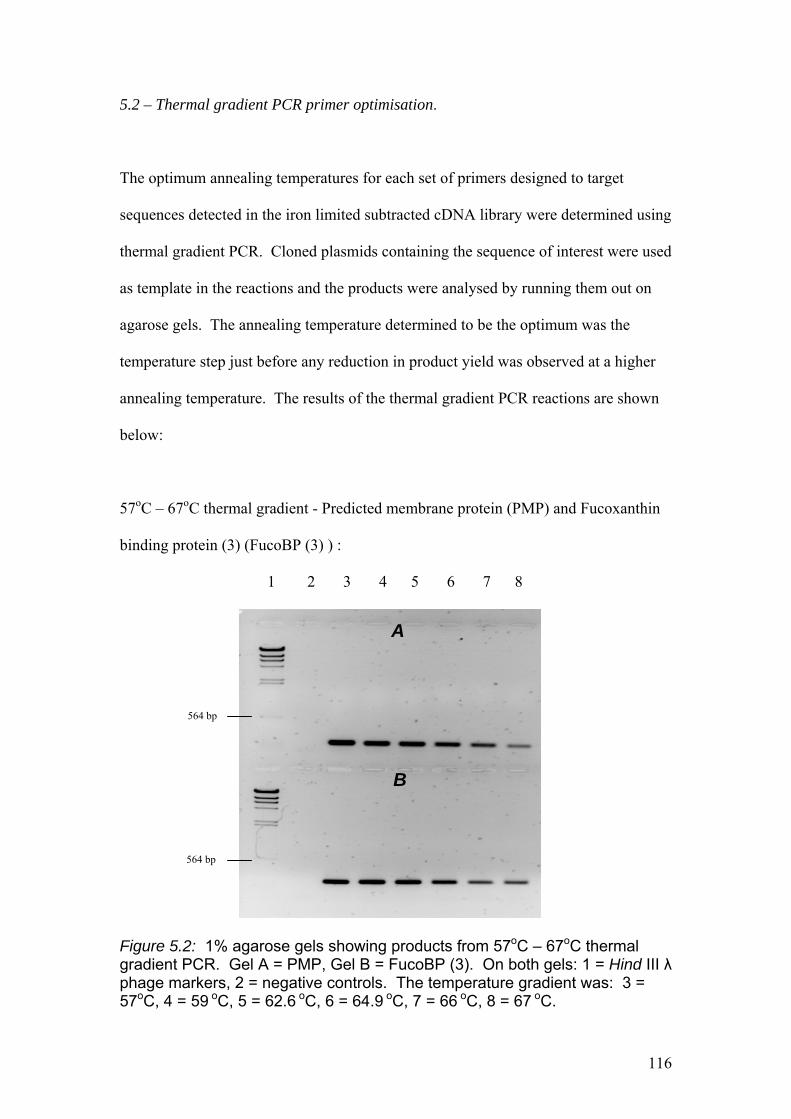
5.2 – Thermal gradient PCR primer optimisation.
The optimum annealing temperatures for each set of primers designed to target
sequences detected in the iron limited subtracted cDNA library were determined using
thermal gradient PCR. Cloned plasmids containing the sequence of interest were used
as template in the reactions and the products were analysed by running them out on
agarose gels. The annealing temperature determined to be the optimum was the
temperature step just before any reduction in product yield was observed at a higher
annealing temperature. The results of the thermal gradient PCR reactions are shown
below:
57oC – 67oC thermal gradient - Predicted membrane protein (PMP) and Fucoxanthin
binding protein (3) (FucoBP (3) ) :
1 2 3 4 5 6 7 8
564 bp
564 bp
B
A
Figure 5.2: 1% agarose gels showing products from 57oC – 67oC thermal gradient PCR. Gel A = PMP, Gel B = FucoBP (3). On both gels: 1 = Hind III λ phage markers, 2 = negative controls. The temperature gradient was: 3 = 57oC, 4 = 59 oC, 5 = 62.6 oC, 6 = 64.9 oC, 7 = 66 oC, 8 = 67 oC.
116
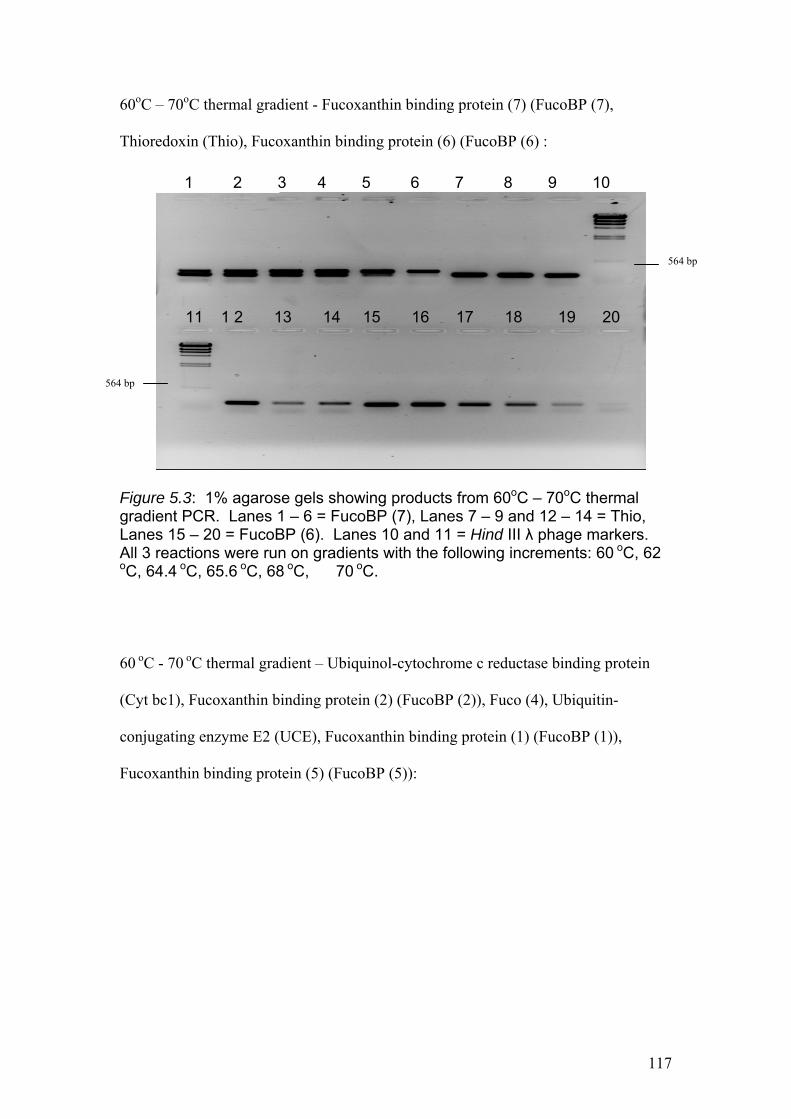
60oC – 70oC thermal gradient - Fucoxanthin binding protein (7) (FucoBP (7),
Thioredoxin (Thio), Fucoxanthin binding protein (6) (FucoBP (6) :
1 2 3 4 5 6 7 8 9 10
11 1 2 13 14 15 16 17 18 19 20
564 bp
564 bp
Figure 5.3: 1% agarose gels showing products from 60oC – 70oC thermal gradient PCR. Lanes 1 – 6 = FucoBP (7), Lanes 7 – 9 and 12 – 14 = Thio, Lanes 15 – 20 = FucoBP (6). Lanes 10 and 11 = Hind III λ phage markers. All 3 reactions were run on gradients with the following increments: 60 oC, 62
oC, 64.4 oC, 65.6 oC, 68 oC, 70 oC.
60 oC - 70 oC thermal gradient – Ubiquinol-cytochrome c reductase binding protein
(Cyt bc1), Fucoxanthin binding protein (2) (FucoBP (2)), Fuco (4), Ubiquitin-
conjugating enzyme E2 (UCE), Fucoxanthin binding protein (1) (FucoBP (1)),
Fucoxanthin binding protein (5) (FucoBP (5)):
117
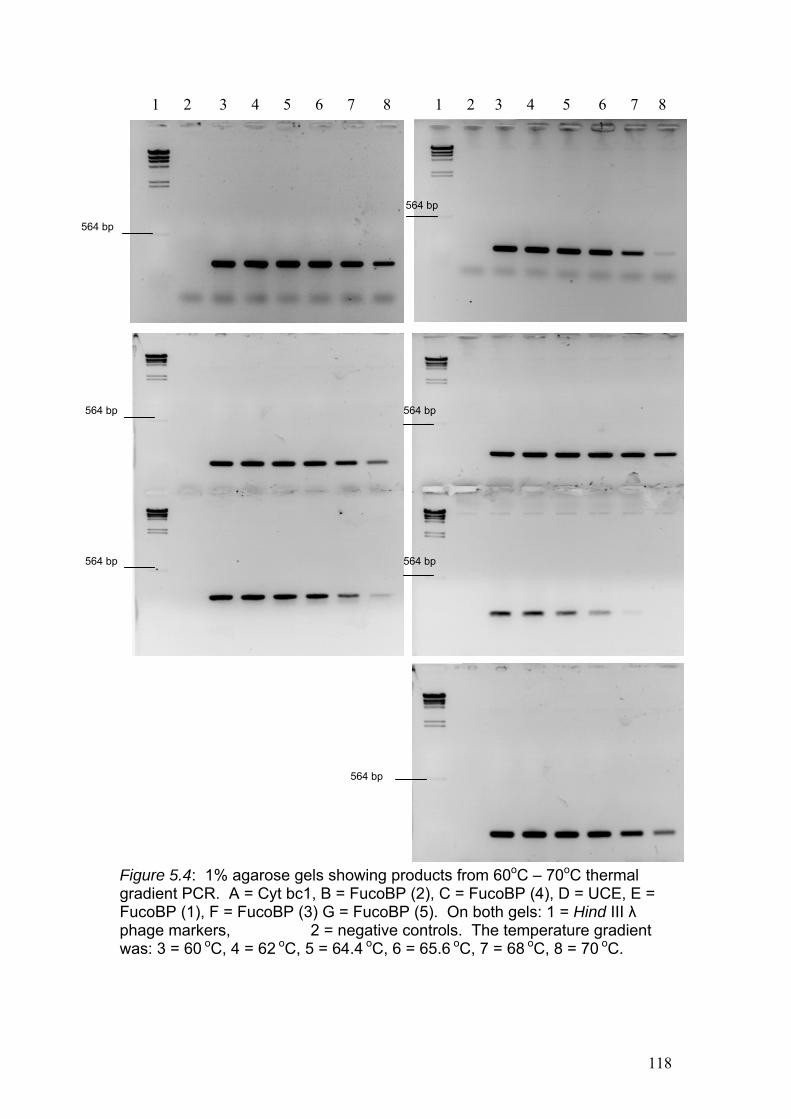
1 2 3 4 5 6 7 8 1 2 3 4 5 6 7 8
564 bp
564 bp
564 bp
564 bp
564 bp
564 bp
564 bp
Figure 5.4: 1% agarose gels showing products from 60oC – 70oC thermal gradient PCR. A = Cyt bc1, B = FucoBP (2), C = FucoBP (4), D = UCE, E = FucoBP (1), F = FucoBP (3) G = FucoBP (5). On both gels: 1 = Hind III λ phage markers, 2 = negative controls. The temperature gradient was: 3 = 60 oC, 4 = 62 oC, 5 = 64.4 oC, 6 = 65.6 oC, 7 = 68 oC, 8 = 70 oC.
118
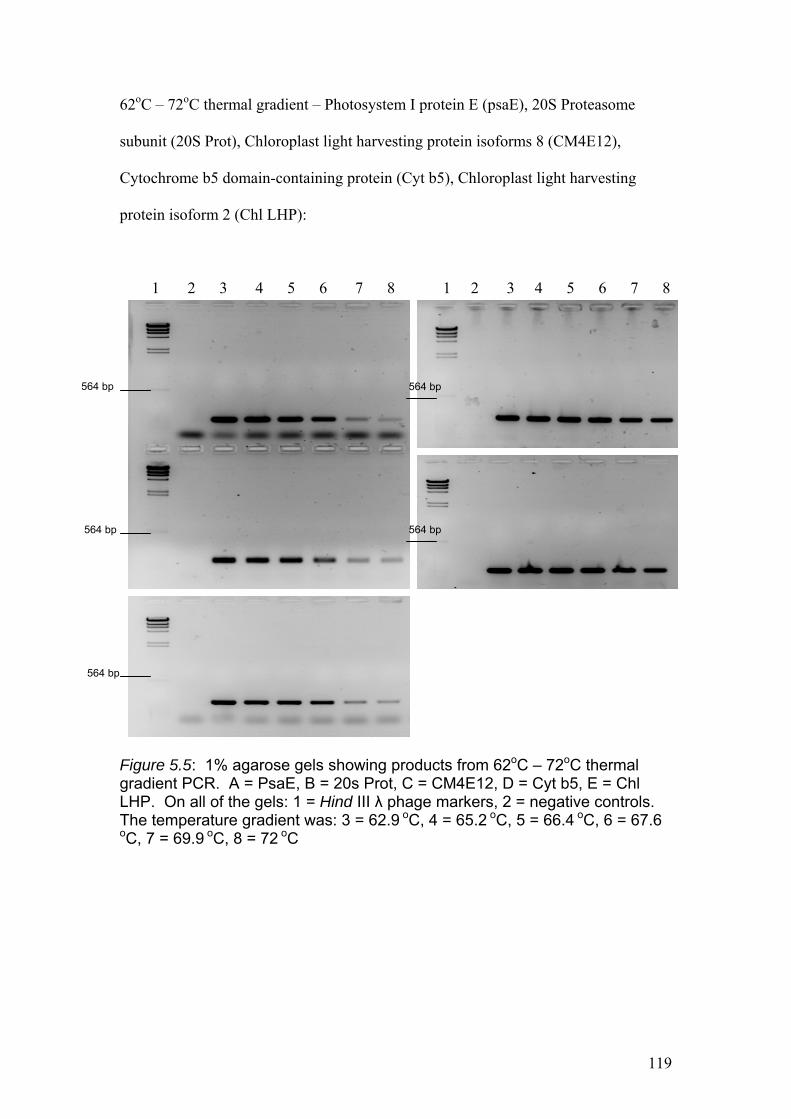
62oC – 72oC thermal gradient – Photosystem I protein E (psaE), 20S Proteasome
subunit (20S Prot), Chloroplast light harvesting protein isoforms 8 (CM4E12),
Cytochrome b5 domain-containing protein (Cyt b5), Chloroplast light harvesting
protein isoform 2 (Chl LHP):
1 2 3 4 5 6 7 8 1 2 3 4 5 6 7 8
564 bp
564 bp
564 bp
564 bp
564 bp
Figure 5.5: 1% agarose gels showing products from 62oC – 72oC thermal gradient PCR. A = PsaE, B = 20s Prot, C = CM4E12, D = Cyt b5, E = Chl LHP. On all of the gels: 1 = Hind III λ phage markers, 2 = negative controls. The temperature gradient was: 3 = 62.9 oC, 4 = 65.2 oC, 5 = 66.4 oC, 6 = 67.6
oC, 7 = 69.9 oC, 8 = 72 oC
119
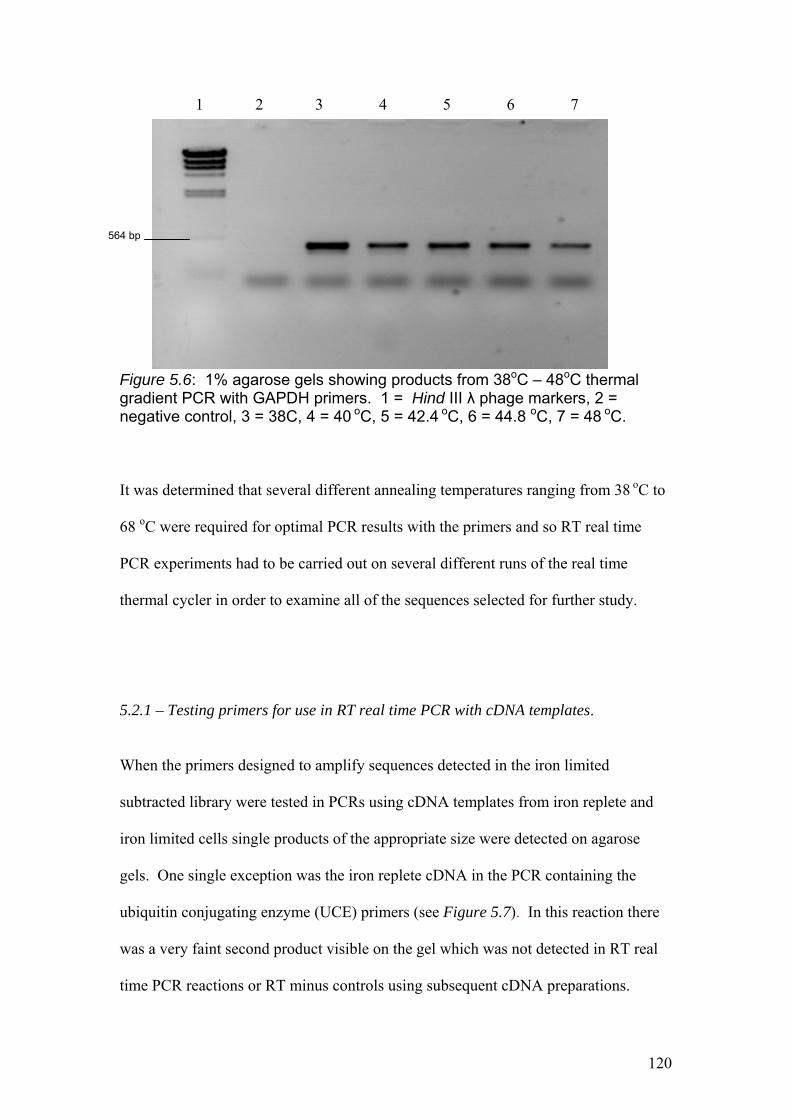
1 2 3 4 5 6 7
564 bp
Figure 5.6: 1% agarose gels showing products from 38oC – 48oC thermal gradient PCR with GAPDH primers. 1 = Hind III λ phage markers, 2 = negative control, 3 = 38C, 4 = 40 oC, 5 = 42.4 oC, 6 = 44.8 oC, 7 = 48 oC.
It was determined that several different annealing temperatures ranging from 38 oC to
68 oC were required for optimal PCR results with the primers and so RT real time
PCR experiments had to be carried out on several different runs of the real time
thermal cycler in order to examine all of the sequences selected for further study.
5.2.1 – Testing primers for use in RT real time PCR with cDNA templates.
When the primers designed to amplify sequences detected in the iron limited
subtracted library were tested in PCRs using cDNA templates from iron replete and
iron limited cells single products of the appropriate size were detected on agarose
gels. One single exception was the iron replete cDNA in the PCR containing the
ubiquitin conjugating enzyme (UCE) primers (see Figure 5.7). In this reaction there
was a very faint second product visible on the gel which was not detected in RT real
time PCR reactions or RT minus controls using subsequent cDNA preparations.
120
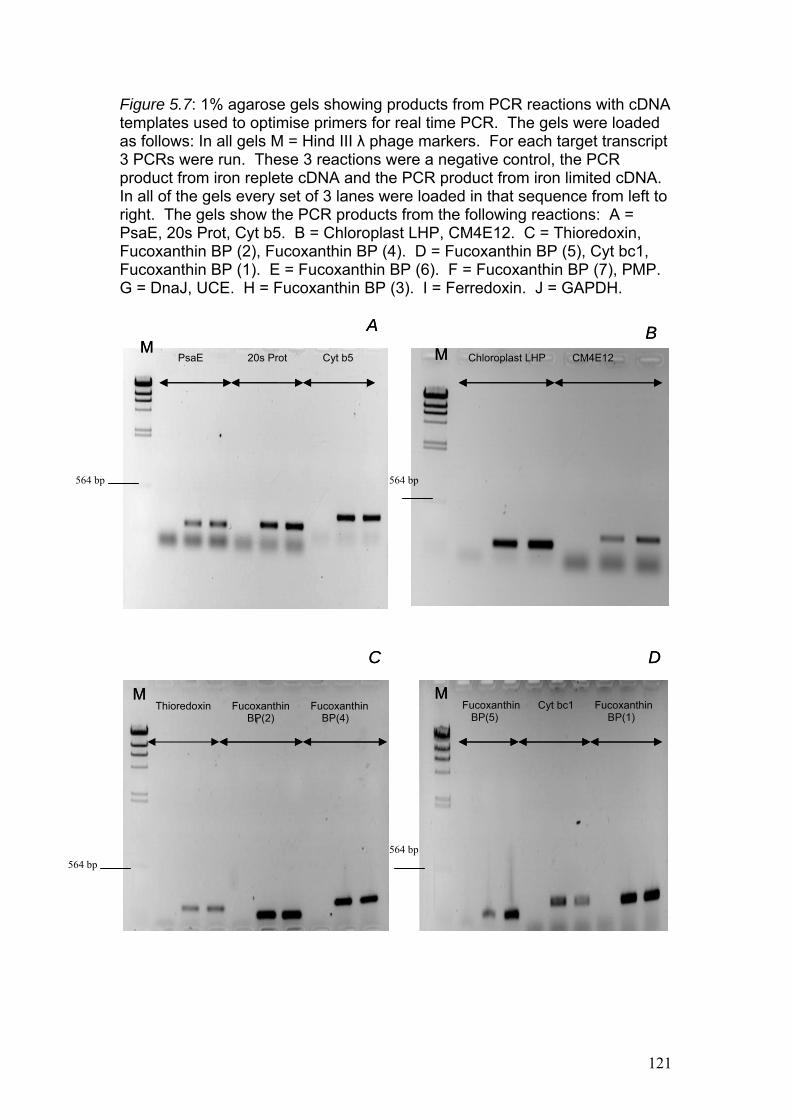
Figure 5.7: 1% agarose gels showing products from PCR reactions with cDNA templates used to optimise primers for real time PCR. The gels were loaded as follows: In all gels M = Hind III λ phage markers. For each target transcript 3 PCRs were run. These 3 reactions were a negative control, the PCR product from iron replete cDNA and the PCR product from iron limited cDNA. In all of the gels every set of 3 lanes were loaded in that sequence from left to right. The gels show the PCR products from the following reactions: A = PsaE, 20s Prot, Cyt b5. B = Chloroplast LHP, CM4E12. C = Thioredoxin, Fucoxanthin BP (2), Fucoxanthin BP (4). D = Fucoxanthin BP (5), Cyt bc1, Fucoxanthin BP (1). E = Fucoxanthin BP (6). F = Fucoxanthin BP (7), PMP. G = DnaJ, UCE. H = Fucoxanthin BP (3). I = Ferredoxin. J = GAPDH.
564 bp
564 bp
564 bp
564 bp
M M
A B
C
M
D
Thioredoxin Fucoxanthin Fucoxanthin BP(2) BP(4)
M
M M
A B PsaE 20s Prot Cyt b5 Chloroplast LHP CM4E12
C D
MM Fucoxanthin Cyt bc1 Fucoxanthin BP(5) BP(1)
121
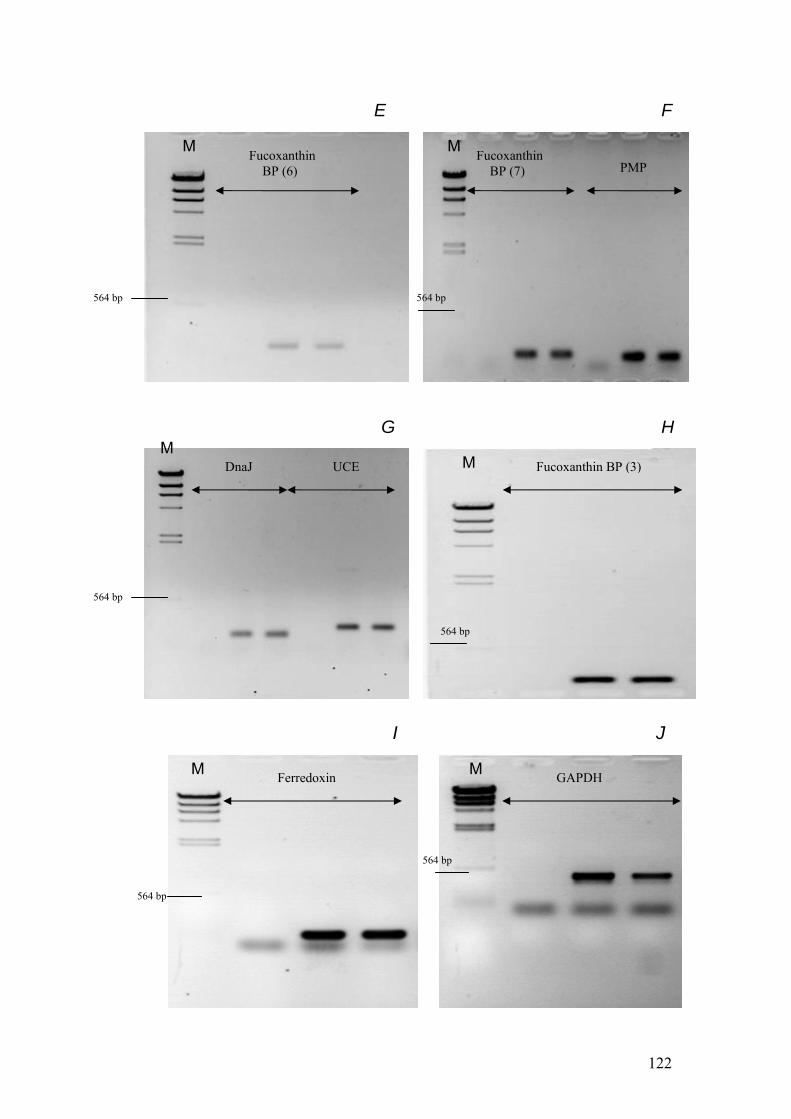
E F
Fucoxanthin BP (6)
M
564 bp
PMP Fucoxanthin BP (7)
M
564 bp
DnaJ UCEM
G H
564 bp
Fucoxanthin BP (3) M
564 bp
I J
564 bp
M
564 bp
GAPDH FerredoxinM
122
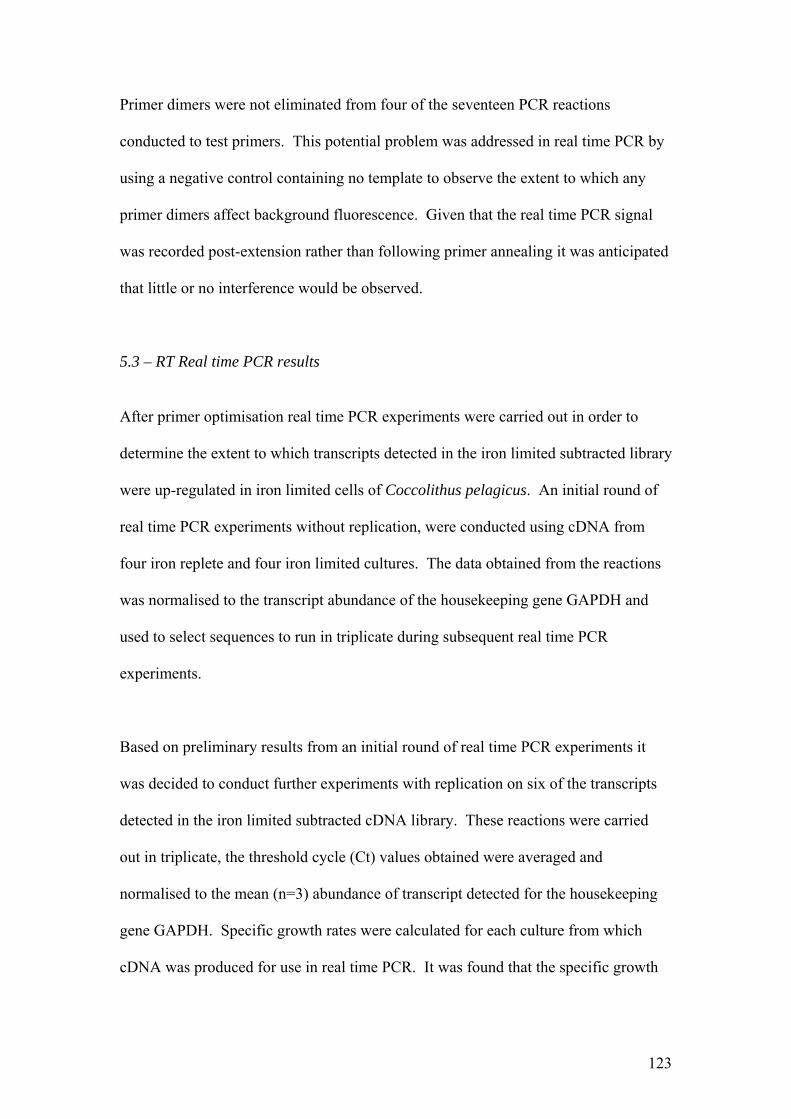
Primer dimers were not eliminated from four of the seventeen PCR reactions
conducted to test primers. This potential problem was addressed in real time PCR by
using a negative control containing no template to observe the extent to which any
primer dimers affect background fluorescence. Given that the real time PCR signal
was recorded post-extension rather than following primer annealing it was anticipated
that little or no interference would be observed.
5.3 – RT Real time PCR results
After primer optimisation real time PCR experiments were carried out in order to
determine the extent to which transcripts detected in the iron limited subtracted library
were up-regulated in iron limited cells of Coccolithus pelagicus. An initial round of
real time PCR experiments without replication, were conducted using cDNA from
four iron replete and four iron limited cultures. The data obtained from the reactions
was normalised to the transcript abundance of the housekeeping gene GAPDH and
used to select sequences to run in triplicate during subsequent real time PCR
experiments.
Based on preliminary results from an initial round of real time PCR experiments it
was decided to conduct further experiments with replication on six of the transcripts
detected in the iron limited subtracted cDNA library. These reactions were carried
out in triplicate, the threshold cycle (Ct) values obtained were averaged and
normalised to the mean (n=3) abundance of transcript detected for the housekeeping
gene GAPDH. Specific growth rates were calculated for each culture from which
cDNA was produced for use in real time PCR. It was found that the specific growth
123
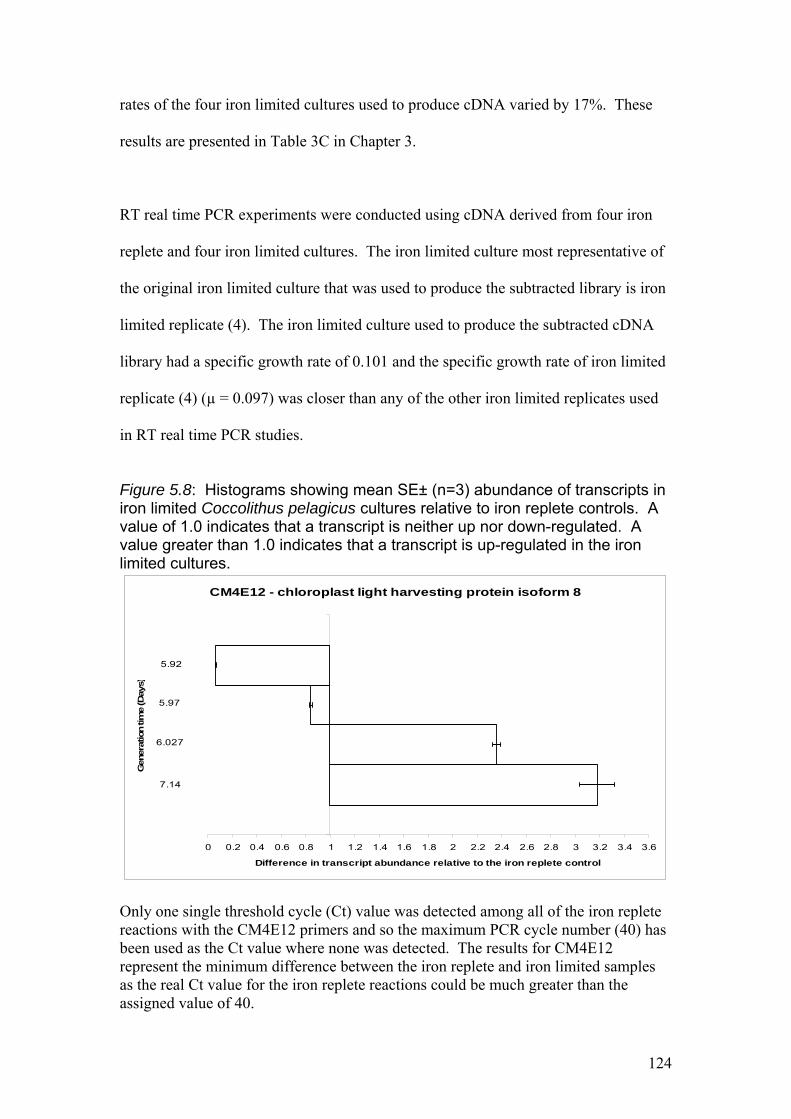
rates of the four iron limited cultures used to produce cDNA varied by 17%. These
results are presented in Table 3C in Chapter 3.
RT real time PCR experiments were conducted using cDNA derived from four iron
replete and four iron limited cultures. The iron limited culture most representative of
the original iron limited culture that was used to produce the subtracted library is iron
limited replicate (4). The iron limited culture used to produce the subtracted cDNA
library had a specific growth rate of 0.101 and the specific growth rate of iron limited
replicate (4) (µ = 0.097) was closer than any of the other iron limited replicates used
in RT real time PCR studies.
Figure 5.8: Histograms showing mean SE± (n=3) abundance of transcripts in iron limited Coccolithus pelagicus cultures relative to iron replete controls. A value of 1.0 indicates that a transcript is neither up nor down-regulated. A value greater than 1.0 indicates that a transcript is up-regulated in the iron limited cultures.
CM4E12 - chloroplast light harvesting protein isoform 8
7.14
6.027
5.97
5.92
0 0.2 0.4 0.6 0.8 1 1.2 1.4 1.6 1.8 2 2.2 2.4 2.6 2.8 3 3.2 3.4 3.6
Genera
tion tim
e (D
ays)
Difference in transcript abundance relative to the iron replete control
Only one single threshold cycle (Ct) value was detected among all of the iron replete reactions with the CM4E12 primers and so the maximum PCR cycle number (40) has been used as the Ct value where none was detected. The results for CM4E12 represent the minimum difference between the iron replete and iron limited samples as the real Ct value for the iron replete reactions could be much greater than the assigned value of 40.
124
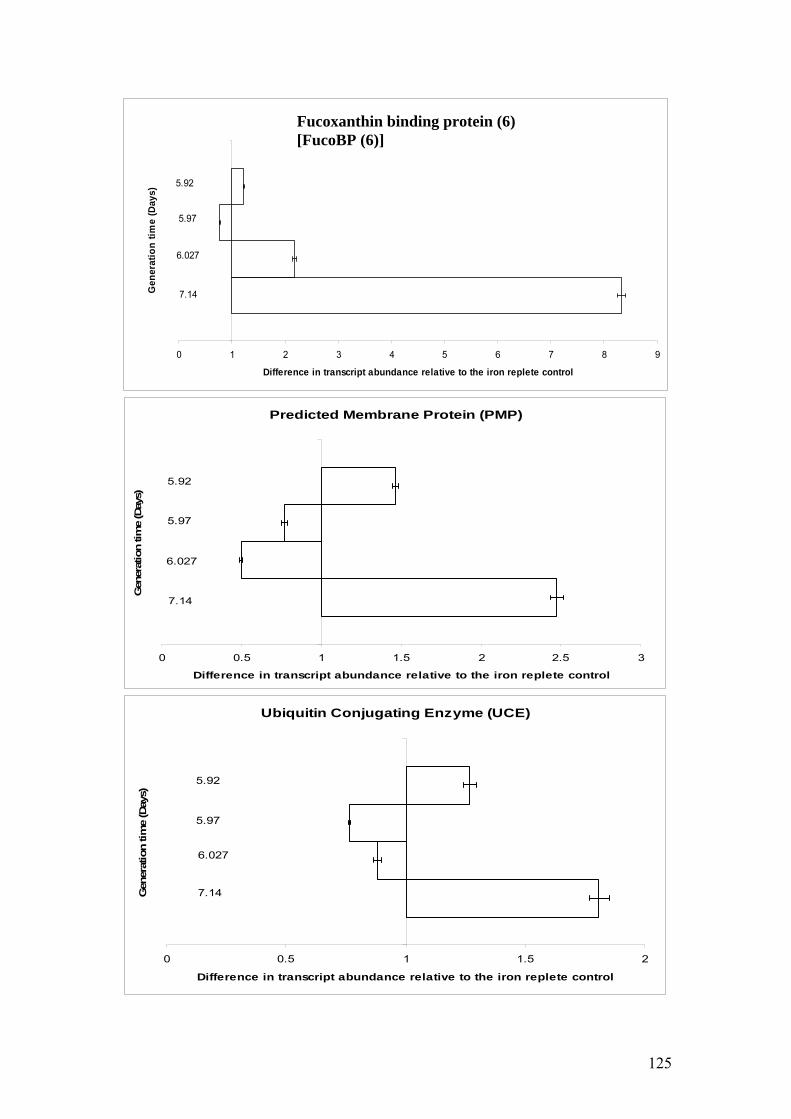
Fucoxanthin (6)
7.14
6.027
5.97
5.92
0 1 2 3 4 5 6 7 8 9
Gen
erat
ion
tim
e (D
ays)
Difference in transcript abundance relative to the iron replete control
Predicted Membrane Protein (PMP)
7.14
6.027
5.97
5.92
0 0.5 1 1.5 2 2.5 3
Gen
erat
ion tim
e (D
ays)
Difference in transcript abundance relative to the iron replete control
Ubiquitin Conjugating Enzyme (UCE)
7.14
6.027
5.97
5.92
0 0.5 1 1.5
Gen
erat
ion tim
e (D
ays)
Difference in transcript abundance relative to the iron replete control
Fucoxanthin binding protein (6) [FucoBP (6)]
2
125
Ferredoxin
7.14
6.027
5.97
5.92
0.7 0.8 0.9 1 1.1 1.2 1.3 1.4 1.5 1.6
Gen
erat
ion tim
e
Difference in transcript abundance relative to the iron replete control
PsaE
7.14
6.027
5.97
5.92
0 0.5 1 1.5 2 2.5 3 3.5
Gen
erat
ion tim
e (D
ays)
Difference in transcript abundance relative to the iron replete control
4
C h lo ro p las t L igh t H a rves ting P ro te in (C h l LH P )
D iffe rence in transcrip t abundance re la tive to the iron rep le te con tro l
0 5 10 15 20 25 30 35 40 45 50 200 210 220 230 240 250
Gen
era
tion
time
(D
ays)
7 .14
6 .027
5 .97
5 .92
126
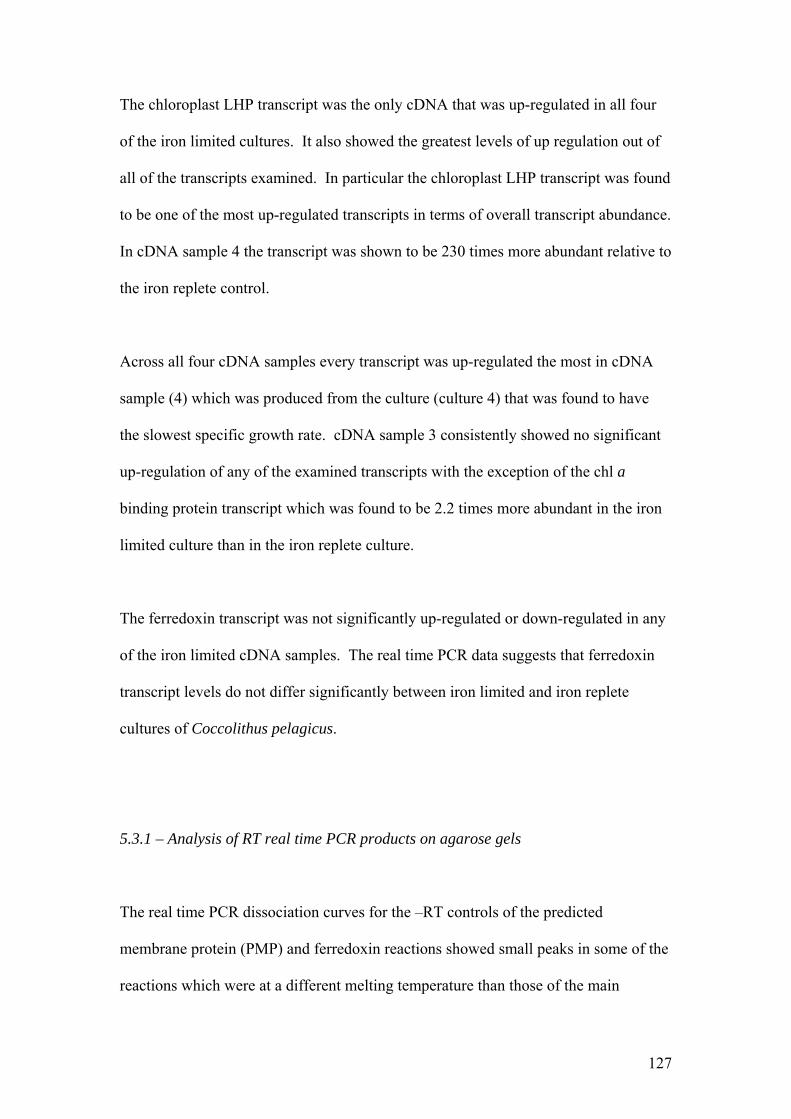
The chloroplast LHP transcript was the only cDNA that was up-regulated in all four
of the iron limited cultures. It also showed the greatest levels of up regulation out of
all of the transcripts examined. In particular the chloroplast LHP transcript was found
to be one of the most up-regulated transcripts in terms of overall transcript abundance.
In cDNA sample 4 the transcript was shown to be 230 times more abundant relative to
the iron replete control.
Across all four cDNA samples every transcript was up-regulated the most in cDNA
sample (4) which was produced from the culture (culture 4) that was found to have
the slowest specific growth rate. cDNA sample 3 consistently showed no significant
up-regulation of any of the examined transcripts with the exception of the chl a
binding protein transcript which was found to be 2.2 times more abundant in the iron
limited culture than in the iron replete culture.
The ferredoxin transcript was not significantly up-regulated or down-regulated in any
of the iron limited cDNA samples. The real time PCR data suggests that ferredoxin
transcript levels do not differ significantly between iron limited and iron replete
cultures of Coccolithus pelagicus.
5.3.1 – Analysis of RT real time PCR products on agarose gels
The real time PCR dissociation curves for the –RT controls of the predicted
membrane protein (PMP) and ferredoxin reactions showed small peaks in some of the
reactions which were at a different melting temperature than those of the main
127
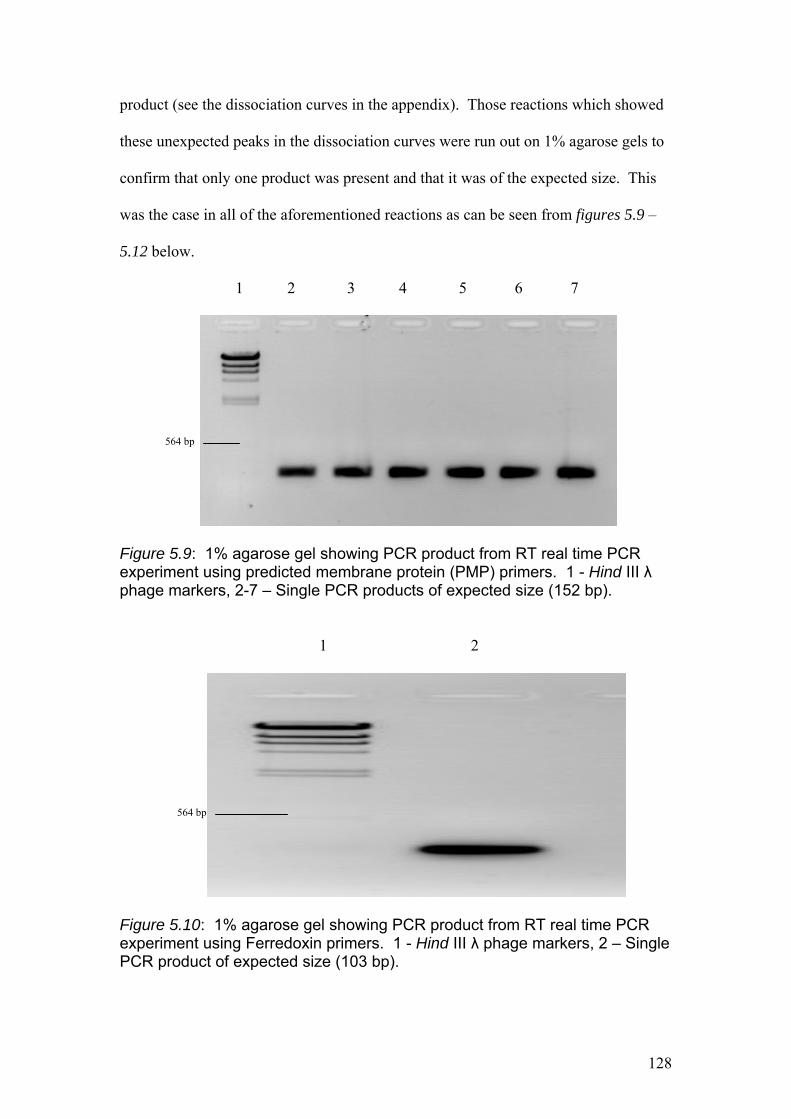
product (see the dissociation curves in the appendix). Those reactions which showed
these unexpected peaks in the dissociation curves were run out on 1% agarose gels to
confirm that only one product was present and that it was of the expected size. This
was the case in all of the aforementioned reactions as can be seen from figures 5.9 –
5.12 below.
1 2 3 4 5 6 7
564 bp
Figure 5.9: 1% agarose gel showing PCR product from RT real time PCR experiment using predicted membrane protein (PMP) primers. 1 - Hind III λ phage markers, 2-7 – Single PCR products of expected size (152 bp).
1 2
564 bp
Figure 5.10: 1% agarose gel showing PCR product from RT real time PCR experiment using Ferredoxin primers. 1 - Hind III λ phage markers, 2 – Single PCR product of expected size (103 bp).
128
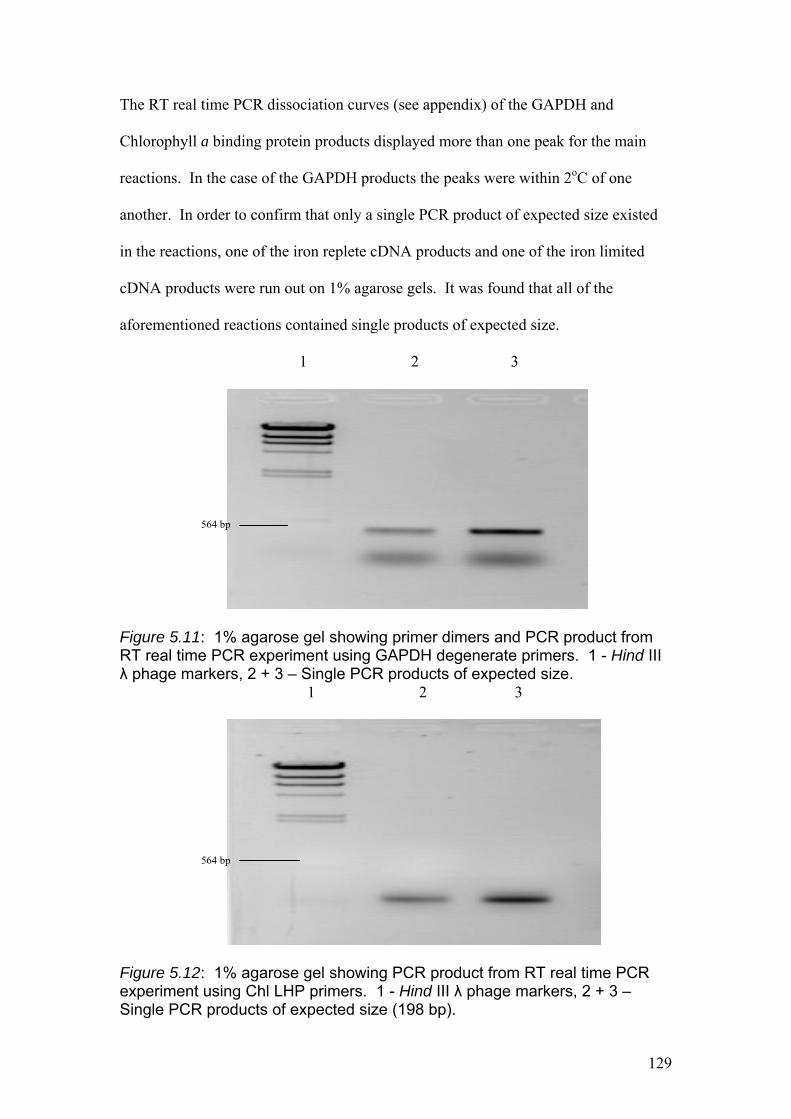
The RT real time PCR dissociation curves (see appendix) of the GAPDH and
Chlorophyll a binding protein products displayed more than one peak for the main
reactions. In the case of the GAPDH products the peaks were within 2oC of one
another. In order to confirm that only a single PCR product of expected size existed
in the reactions, one of the iron replete cDNA products and one of the iron limited
cDNA products were run out on 1% agarose gels. It was found that all of the
aforementioned reactions contained single products of expected size.
1 2 3
564 bp
Figure 5.11: 1% agarose gel showing primer dimers and PCR product from RT real time PCR experiment using GAPDH degenerate primers. 1 - Hind III λ phage markers, 2 + 3 – Single PCR products of expected size.
1 2 3
564 bp
Figure 5.12: 1% agarose gel showing PCR product from RT real time PCR experiment using Chl LHP primers. 1 - Hind III λ phage markers, 2 + 3 – Single PCR products of expected size (198 bp).
129
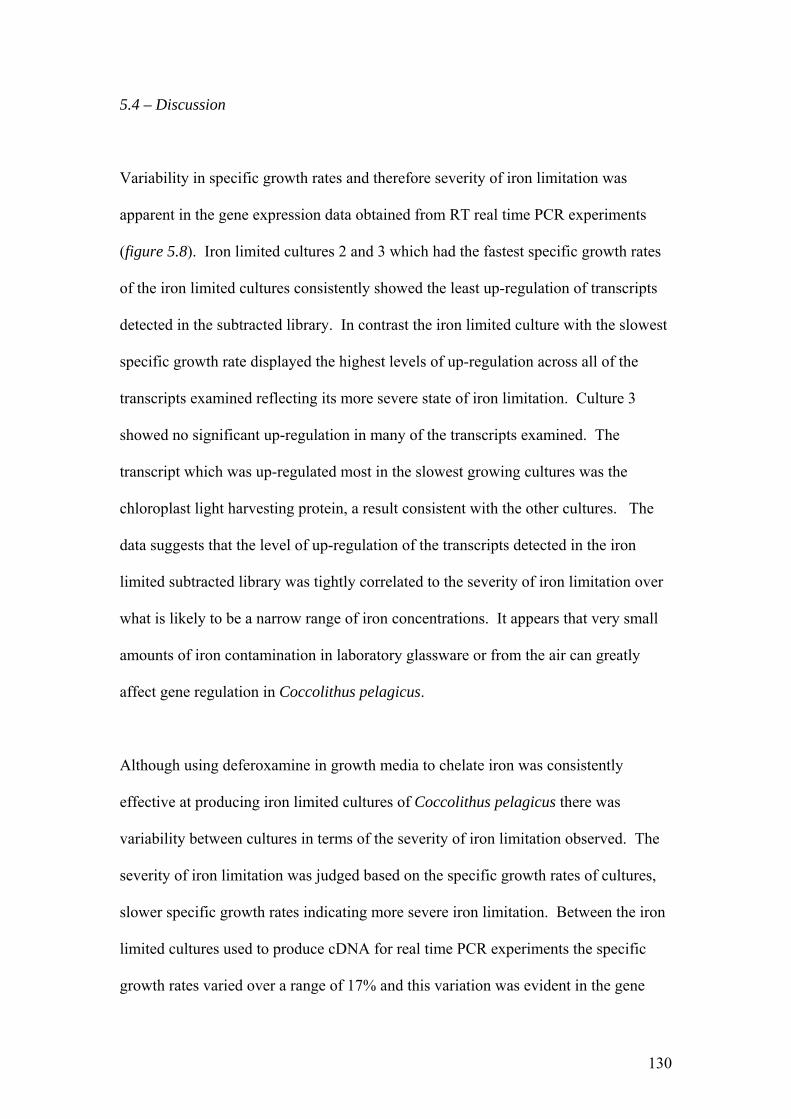
5.4 – Discussion
Variability in specific growth rates and therefore severity of iron limitation was
apparent in the gene expression data obtained from RT real time PCR experiments
(figure 5.8). Iron limited cultures 2 and 3 which had the fastest specific growth rates
of the iron limited cultures consistently showed the least up-regulation of transcripts
detected in the subtracted library. In contrast the iron limited culture with the slowest
specific growth rate displayed the highest levels of up-regulation across all of the
transcripts examined reflecting its more severe state of iron limitation. Culture 3
showed no significant up-regulation in many of the transcripts examined. The
transcript which was up-regulated most in the slowest growing cultures was the
chloroplast light harvesting protein, a result consistent with the other cultures. The
data suggests that the level of up-regulation of the transcripts detected in the iron
limited subtracted library was tightly correlated to the severity of iron limitation over
what is likely to be a narrow range of iron concentrations. It appears that very small
amounts of iron contamination in laboratory glassware or from the air can greatly
affect gene regulation in Coccolithus pelagicus.
Although using deferoxamine in growth media to chelate iron was consistently
effective at producing iron limited cultures of Coccolithus pelagicus there was
variability between cultures in terms of the severity of iron limitation observed. The
severity of iron limitation was judged based on the specific growth rates of cultures,
slower specific growth rates indicating more severe iron limitation. Between the iron
limited cultures used to produce cDNA for real time PCR experiments the specific
growth rates varied over a range of 17% and this variation was evident in the gene
130
expression data obtained. When dealing with nanomolar concentrations of trace
metals such as iron it is often difficult to maintain equal concentrations in all cultures.
When cultures are sampled for growth measurements dust from the air can contribute
iron to the media. Despite minimising contamination through the use of sterile
technique and acid washing glassware that is used in the preparation of growth media,
it is difficult to completely eradicate all contaminating trace metals from the growth
media. When these factors were considered, a variation of 17% in specific growth
rate over the range of iron limited cultures was deemed to be acceptable. These
cultures were still growing far slower than the iron replete controls.
It was found that the abundance of the ferredoxin transcript did not vary significantly
between the iron replete and iron limited cultures. Furthermore no flavodoxin
transcript was detected in the iron limited subtracted library and the flavodoxin gene
could not be detected in iron limited cDNA with degenerate primers. This
observation is suggestive of several possibilities. It may be the case that Coccolithus
pelagicus does not possess the flavodoxin gene and therefore has no alternative but to
continue expressing ferredoxin even when iron limited. If flavodoxin was being
expressed in the iron limited cultures it would be highly unlikely that it would not
appear in the iron limited subtracted library. Many species of eukaryotic
phytoplankton do not produce flavodoxin when suffering iron limitation (Erdner et
al,. 1999). While not conclusive, the results of this investigation suggest that
Coccolithus pelagicus may not have the capacity to produce flavodoxin under
conditions of moderate iron limitation.
131
Another possibility is that the Coccolithus pelagicus cultures in this study were not
iron limited enough to induce expression of flavodoxin, being only iron limited as
opposed to iron starved. However, a laboratory study in which two diatoms were
examined found that induction of flavodoxin expression is a response to declining
iron concentrations in the environment and was detected before any apparent
physiological impairment or growth rate inhibition had occurred (McKay et al.,
1997). As the iron limited Coccolithus pelagicus cultures in this study were suffering
from chlorosis and impaired growth rates it would be expected, based on the
observations from other studies, that these conditions would be sufficient to induce
expression of the flavodoxin gene if it were present.
Iron limitation in Coccolithus pelagicus does not appear to have a repressive effect on
the transcription of the ferredoxin gene. Ferredoxin protein levels may not be the
same between iron limited and iron replete cells, however. Iron availability may
regulate the translation of the ferredoxin mRNA resulting in levels of ferredoxin
under the two conditions that would not be in equal proportions, as the transcript
levels would seem to imply. A laboratory study (Laudenbach et al., 1988) found that
in the cyanobacterium Anacystis nidulans R2 the ferredoxin transcript was detected in
cells grown in iron concentrations which also induced flavodoxin expression.
Although the ferredoxin transcript was present regardless of the iron concentration of
the growth medium, it was only translated under conditions that were not iron
limiting. Under iron limitation the flavodoxin transcript was transcribed and
translated. Addition of iron to the A. nidulans cultures resulted in the degradation of
flavodoxin transcripts within one hour and the reappearance of ferredoxin protein in
the cells. This implies that iron has a repressing effect on flavodoxin transcription
132
and that it may also regulate the translation of the continually present ferredoxin
transcript.
There is a contradiction between the proportions of the sequences in the subtracted
library possessing both Clontech adaptors and their up-regulation as determined by
RT real time PCR. In particular the UCE was not found to be up-regulated to any
great extent despite being the most abundant identifiable transcript in the subtracted
library. As the RNA used to create the subtracted library was not the same RNA used
in the RT real time PCR experiments – owing to the problem of obtaining sufficient
quantities from biomass that does not take excessive time periods to produce in
cultures. While the specific growth rates of the cultures used in RT real time PCR
studies did not differ dramatically from the one used in the production of the
subtracted cDNA library, it would be advisable in any future experiments to conduct
real time PCR experiments on the same RNA sample from which a subtracted library
was created. This likely explains the differences observed between implied
abundance and differential expression of transcripts in the subtracted library and the
RT real time PCR results.
Some of the RT real time PCR reaction products which yielded dissociation curves
which were not as ideal as the other reactions were run on agarose gels to confirm that
only one single product was present. Some small peaks may be present in –RT
controls due to minute levels of DNA contamination. However, it is extremely
unlikely that this contamination exists in the reactions being measured as the samples
in these reactions had undergone an additional DNase digest as part of the reverse
transcription protocol (gDNA wipeout). The Chl LHP dissociation curves appeared to
133

show two peaks with close melting temperatures. This would normally indicate two
different products. However, when observed on an agarose gel there was clearly only
a single product. Such an observation may be indicative of multiple copies of this
gene with slightly differing sequences being represented in the cDNA template,
perhaps as a result of alternative splicing.
134
CHAPTER 6 – CONCLUSIONS AND FUTURE WORK
The aim of this study was to investigate the acclimation of Coccolithus pelagicus to
iron limitation from a molecular viewpoint. It has been demonstrated that the fungal
siderophore deferoxamine is a suitable ferric iron chelator for use in studies of iron
limitation (Chapter 3). Growth of Coccolithus pelagicus in the presence of
deferoxamine results in changes in gene expression (figure 5.8) and in the proteome
of the cells (figures 3.12, 3.15, 3.16). It induces classic signs of iron limitation –
slower growth rates (figure 3.1 & table 3A) and reduced chlorophyll a concentrations
per unit biomass (figure 3.3). A secondary aim of this investigation was to identify
potential biomarkers of iron limitation in Coccolithus pelagicus. Several up-regulated
transcripts (fucoxanthin binding protein (6), PMP, CM4E12, psaE) and one highly up-
regulated transcript (Chl LHP) were identified (figure 5.8) and these may prove
worthy of further examination for their potential as biomarkers to complement the
already existing approaches used to confirm iron limitation in the field (LaRoche et
al., 1995; van Leeuwe & Stefels, 1998; Erdner et al., 1999; McKay et al., 1999; Inda
& Peleato, 2003; DiTullio et al., 2007; Hernandez et al., 2008).
In order to prove suitable as biomarkers these transcripts should be significantly up-
regulated under conditions of iron limitation in a multitude of phytoplankton species
and should display an up-regulated response specific to iron limitation as opposed to
being up-regulated as a general stress response.
PsaE is a potentially useful target for use as a biomarker of iron limitation. It is
present in the photosystem I complexes of phytoplankton (Rhiel & Bryant, 1993; Yu
135
et al., 1993; Zhao et al., 1993; Fromme et al., 2003), and it is highly conserved
(Golbeck & Bryant, 1991), indicating that it serves an important role. Its highly
conserved sequence and presence throughout a range of phytoplankton taxa may
make it useful for confirming iron limitation in mixed phytoplankton communities, if
it can be established that up-regulation in response to iron limitation is common
among phytoplankton. Its high degree of sequence conservation may also potentially
make it easier to develop PCR or immunological based methods for detecting it in the
majority of species of a mixed community were it to be used as a biomarker.
The high level of up-regulation detected for the chlorophyll binding protein (Chl
LHP) in this study indicates that it may hold potential as a biomarker. If the up-
regulation of Chl LHP shows the same magnitude in response to iron limitation in
other phytoplankton then the clear contrast in expression levels between iron limited
and iron replete conditions makes it an attractive candidate as a biomarker.
Chlorophyll binding protein expression is not unique to iron limitation however, they
are up-regulated in other circumstances such as light limitation and it would have to
be confirmed that Chl LHP up-regulation was a response exclusive to iron limitation
before it could be employed as an indicator of iron limitation.
The data presented in this study suggest that iron limitation results in up-regulated
expression of mRNAs which encode proteins involved in photosynthesis and protein
degradation (figures 4.3 & 5.8). The reduced chlorophyll a concentrations per unit
biomass (figure 3.3) and the significant up-regulation of transcripts encoding proteins
of the photosynthetic apparatus indicate that photosynthesis is the primary target of
iron limitation in Coccolithus pelagicus. This is consistent with other studies of iron
136
limited phytoplankton species which reported photosynthesis as the main target of
iron limitation (Milligan & Harrison, 2000; Davey & Geider, 2001).
The significant up-regulation of one of several alternative fucoxanthin binding protein
transcripts in response to iron limitation, reported in this investigation, compliments
the findings that elevated levels of alternative types of fucoxanthin such as 19’-
hexanoyloxyfucoxanthin are present in iron limited cells of Phaeocystis antarctica
(van Leeuwe & Stefels, 1998; DiTullio et al., 2007). It was reported that high ratios
of 19’-hexanoyloxyfucoxanthin to other pigments such as chlorophyll c, chlorophyll a
and fucoxanthin were observed in iron limited Phaeocystis antarctica. The ratios of
these pigments may be potential indicators of iron limitation. Considering
chlorophyll a per unit biomass is reduced relative to iron replete levels in iron limited
Coccolithus pelagicus, the up-regulated iron limited fucoxanthin : chlorophyll a ratio
may be higher than the iron replete control and this may be consistent with the
findings in Phaeocystis antarctica. If production of alternative types of the main
fucoxanthin carotenoid and its corresponding binding proteins is a response to iron
limitation among phytoplankton as evidence from this investigation and other studies
suggests (van Leeuwe & Stefels, 1998; DiTullio et al., 2007), then this may prove to
be a worthwhile candidate as a biomarker of iron limitation.
Expression of chlorophyll binding proteins in response to iron limitation has been
reported in other studies. In Dunaliella salina iron limitation results in enlarged
photosystem I complexes and the expression of a chlorophyll binding protein
homolog (Varsano et al., 2006). The chlorophyll binding protein IsiA is expressed in
cyanobacteria in response to iron limitation (Geiβ et al., 2001; Sarcina & Mullineaux,
137
2004; Yeremenko et al., 2004; Liu et al., 2006; Singh & Sherman, 2007). The protein
has been shown to form aggregates associated with photosystem I which aid in the
dissipation of excess light energy (Boekema et al., 2001; Yeremenko et al., 2004;
Ihalainen et al., 2005). Evidence from the subtracted library produced in this study
(figure 4.3), and aforementioned studies of iron limitation in other phytoplankton
species suggest that induction of chlorophyll binding proteins may be a common
response to iron limitation. The findings of this investigation are in agreement with
the wider literature that significant changes are made to photosystem I in response to
iron limitation.
Iron limited Coccolithus pelagicus cells maybe attempting to enhance protein
turnover rates as evidenced by the detection of ubiquitin-conjugating enzyme E2
(UCE) and the 20S proteasome subunit (20S Prot) in the iron limited subtracted
library (figure 4.3). While to date the up-regulation in response to iron limitation of
either of these transcripts has not been reported in the literature, other studies have
provided evidence that protein degradation is enhanced in iron limited cells in order to
recycle cellular materials as rates of photosynthesis, nitrogen assimilation and
mitochondrial electron transport are impaired (Allen et al., 2008). Lower protein
contents in iron limited cells of the diatom Cyclotella meneghiniana relative to iron
replete cells were also reported (Lewandowska & Kosakowska, 2004), this may imply
an elevated rate of protein degradation which would be consistent with the function of
some of the transcripts detected in the C. pelagicus subtracted library, namely the
ubiquitin conjugating enzyme and the 20S proteasome subunit which both serve
functions in protein degradation.
138
Curiously, no identifiable transcription factors or transcripts relating to calcification,
iron acquisition or nitrogen assimilation were detected in the subtracted library. It is
unlikely that Coccolithus pelagicus does not express any genes involved in enhanced
iron uptake under conditions of iron limitation, it is more likely that these genes are
present in the bulk of the subtracted library that could not be identified due to the
limited nature of the data available not just for Coccolithus pelagicus but for iron
limited phytoplankton in general. Further examination of the iron replete subtracted
library may identify transcripts encoding proteins involved in calcification which are
down regulated or absent in iron limited cells; this would concur with the observation
that iron limited cells appear to be less extensively calcified (figure 3.9) and may be
worth investigating in future. However, examination of genes differentially expressed
under iron replete conditions was not the aim of this investigation.
Based on the sequence data and other observations from this investigation, some
conclusions can be drawn regarding some of the ways in which Coccolithus pelagicus
becomes acclimated to iron limitation. There is a reduction in the concentration of
chlorophyll a per cell (figure 3.3) which is a general response among phytoplankton
not only to iron limitation but to limitation by other nutrients also (Graziano et al.,
1996) and in the case of C. pelagicus iron limitation appears to result in malformed
coccoliths or a lesser degree of calcification. This may be due to impairment of
chlorophyll biosynthesis or it may be a coordinated cellular response to reduce the
level of chlorophyll when the photosynthetic electron transport chain cannot process
the light energy that is already entering the system. This would be consistent with the
up-regulation of proteins which may serve in a photoprotective capacity such as
fucoxanthin binding proteins (FucoBP), Chloroplast light harvesting protein isoform 2
139
(Chl LHP), Chloroplast light harvesting protein isoform 8 (CM4E12), Photosystem I
protein E (PsaE). In addition to this it appears that there may be an attempt by the
cells to recycle iron cofactor and amino acids through the enhancement of the protein
degradation machinery as indicated by the detection of ubiquitin conjugating enzyme
E2 (UCE) and 20S proteasome subunit (20S Prot) in the subtracted library.
Unfortunately, due to the limited number of sequences that could be identified a more
detailed and conclusive description of Coccolithus pelagicus acclimation to iron
limitation is difficult to provide.
Differences in specific growth rate (and hence the degree of iron limitation) can alter
gene expression patterns dramatically under iron limited conditions. Although there
was negligible difference in growth rate between cultures 1, 2 and 3 – culture 1
showed considerably greater up-regulation of transcripts detected in the subtracted
library (table 3C and figures 3.7 & 5.8). This may be due to iron contamination
sufficient to alter gene expression but not to significantly alter growth or chlorophyll
a concentrations in cultures 2 and 3. This implies that only small differences in iron
concentration are required to affect gene expression and may indicate a staggered
response in gene expression alteration from low level iron deficiency to out-right iron
limitation over a narrow iron concentration range. This is opposed to an all out
response in which a multitude of genes are up-regulated upon iron availability
dropping below a certain point.
Further study is required to examine the relationship between gene expression and
specific growth rates in iron limited Coccolithus pelagicus cultures. The use of iron
limited chemostats to provide a constant supply of culture maintained in a state of iron
140
limitation would be a suitable approach to examine this further. Examining the
differences in gene expression and differences in the proteome of iron limited and
out-right iron starved cells may also help to further elucidate the extent of the
molecular changes that occur when cells are deprived of iron.
Almost two thirds of the iron limited subtracted library could not be identified by
Blast analysis (table 4A & figure 4.1). Among this part of the library there may be
sequences worthy of further investigation to assess their potential as biomarkers of
iron limitation. Use of RT real time PCR and northern blots to establish the extent to
which the unidentified sequences in the library are up-regulated are required, followed
by studies to determine the function of these unknown proteins.
While identifying potential iron replete biomarkers was not within the scope of this
investigation, the FeR1 protein (figure 3.15) excised from an iron replete 2D gel is
absent from the iron limited 2D gel and present at quite high abundance in the iron
replete gel. Despite the fact the western blotting approach described in this thesis was
unsuccessful; it would be worthwhile pursuing further efforts to identify this protein
in the hope of examining its expression and furthering the current understanding of
the molecular changes that occur in Coccolithus pelagicus between states of iron
sufficiency and iron limitation. In addition to this, it may be useful to produce 2D
SDS gels with purified iron limited and iron replete chloroplast proteins, as some of
the most up-regulated transcripts presented in this study encode proteins involved in
photosynthesis. Proteomic analysis of chloroplast proteins may reveal molecular
changes in response to iron limitation controlled at the translational level which could
be largely un-altered at the transcriptional level. Since there is the potential for
141

differentially expressed chloroplast proteins regulated at the translational level to be
masked by other non-chloroplast proteins in 2D SDS gels which attempt to examine
the entire cell proteome, procedures to isolate intact chloroplasts from C. pelagicus
should be optimized.
142
REFERENCES:
Allen, A. E., LaRoche, J., Maheswari, U., Lommer, M., Schauer, N., Lopez, P. J.,
Finazzi, G., Fernie, A. R. & Bowler, C. 2008. Whole-cell response of the pinnate
diatom Phaeodactylum tricornutum to iron starvation. PNAS. 105 (30), 10438 –
10443.
Anderson, M. A. & Morel, F. M. M. 1980. Uptake of Fe(II) by a diatom in oxic
culture medium. Marine Biology Letters. 1, 263-268.
Anderson, M. A. & Morel, F. M. M. 1982. The influence of aqueous iron chemistry
on the uptake of iron by the coastal diatom Thalassiosira weissflogii. Limnology &.
Oceanography. 27, 789-813.
Balch, W.M.., Holligan, P.M., Ackleson, S.G & Voss, K.J. 1991. Biological and
potical properties of mesoscale coccolithophore blooms in the Gulf of Maine.
Limnology & Oceanography. 36, 692-643.
Barber, R. T., 1992. Introduction to the WEC88 cruise: an investigation into why the
equator is not greener. Journal of Geophysical Research. 97 (C1), 09-610.
Behrenfield, M. J. & Kolber, Z. S., 1999. Widespread iron limitation of
phytoplankton in the South Pacific ocean. Science. 283, 840-843.
143
Besse, I., Wong, J. H., Kobrehel, K. & Buchanan, B. B. 1996. Thiocalsin: A
thioredoxin-linked, substrate-specific protease dependent on calcium. PNAS. 93,
3169-3175.
Boekema, E. J., Hifney, A., Yakushevska, A. E., Piotrowski, M., Keegstra, W.,
Berry, S., Michel, K. P., Pistorius, E. K. & Kruip, J. 2001. A giant chlorophyll-
protein complex induced by iron deficiency in cyanobacteria. Nature. 412, 745 –
748.
Boyd, P. W., A. J. Watson, C. S. Law, E. R. Abraham, T. Trull, R. Murdoch, D. C. E.
Bakker, A. R. Bowie, K. O. Buesseler, H. Chang, M. Charette, P. Croot, K. Downing,
R. Frew, M. Gall, M. Hadfield, J. Hall, M. Harvey, G. Jameson, J. LaRoche, M.
Liddlcoat, R. Ling, M. T. Maldonado, R. M. McKay, S. Nodder, S. Pickmere, R.
Pridmore, S. Rintoul, K. Safi, P. Sutton, R. Strzepek, K., Tanneberger, S. Turner, A.
Waite, and J. Zeldis. 2000. A Mesoscale Phytoplankton Bloom in the Polar Southern
Ocean Stimulated by Iron fertilization. Nature, 407, 695-702.
Boyd, P. W. & Law, C. S. 2001. The Southern Ocean Iron RElease Experiment
(SOIREE) – introduction and summary. Deep Sea Reasearch II. 48, 2425 – 2438.
Boye, M., vand den Berg, C.M.G. 2000. Iron availability and the release of iron-
complexing ligands by Emiliania huxleyi. Marine Chemistry. 70, 277-287.
Bratbak, G., Wilson, W. & Heldal, M. 1996. Viral control of Emiliania huxleyi
blooms? Journal of Marine Systems. 9, 78-81.
144
Brown, P.R., Burnett, J.A. & Gallagher, L.T. 1992. Calcareous nannoplankton
evolution. Memorie di Scienze Geologiche. 43, 1-17.
Campbell, W. H., 1999. Nitrate reductase structure, function and regulation: bridging
the gap between biochemistry and physiology. Annual Review of Plant Physiology.
Plant Molecular Biology. 50, 277-303.
Cho, M., Wong, J. H., Marx, C., Jiang, W., Lemaux, P. G. & Buchanan, B. B. 1999.
Overexpression of thioredoxin h leads to enhanced activity of starch debranching
enzyme (pullulanase) in barely grain. PNAS. 96, No. 25, 14641-14646.
Coale, K. H., Johnson, K. S., Fitzwater, S. E., Gordon, R. M., Tanner, S., Chavez, F.
P., Ferioli, L., Sakamoto, C., Rogers, P., Millero, F., Steinberg, P., Nightingale, P.,
Cooper, D., Cochlan, W. P., Landry, M. R., Constantinou, J., Rollwagen, G.,
Trasvina, A. & Kudela, R. 1996. A massive phytoplankton bloom induced by an
ecosystem scale iron fertilisation experiment in the equatorial Pacific Ocean. Nature.
383, 495-501.
Course, P.A., Tarran, G.A. & Green, J.C. 1994. The life history of Emiliania huxleyi:
evidence for haploid and diploid states using flow cytometry. Phycologist. 37, 25.
Davey, M., Geider, R. J. 2001. Impact of iron limitation on the photosynthetic
apparatus of the diatom Chaetoceros muelleri (Bacillariophyceae). Journal of
Phycology. 37, 987-1000.
145
Delille, B. 2005. Response of primary production and calcification to changes of
pCO2 during experimental blooms of the coccolithophorid Emiliania huxleyi. Global
Biogeochemical Cycles. 19, GB2023, doi: 10.1029/2004GB002318.
Dietz, K. 2003. Plant peroxiredoxins. Annual Review of Plant Biology. 54, 93-107.
DiTullio, G., Garcia, N., Riseman, S. & Sedwick, P. 2007. Effects of iron
concentration on pigment composition in Phaeocystis antarctica grown at low
irradiance. Biogeochemistry. 83, No. 1-3, 71-81(11).
Doucette, G.J, Erdner, D.L., Peleato, M.L., Hartman, J.J., Anderson, D.M. 1996.
Quantitative analysis of iron stress related proteins in Thalassiosira weissflggii:
measurement of flavodoxin and ferredoxin using HPLC. Marine Ecology Progress
Series. 130, 269-276.
Duce, R.A., & Tindale, N.W., 1991. Atmospheric transport of iron and its deposition
in the ocean. Limonology and Oceanography. 36, 1715-1726.
Eldridge, M.L., Trick, C.G., Alm, M.B., Ditullio, G.R., Rue, E.L., Bruland, K.W.,
Hutchins, D.A., & Wilhelm, S.W. 2004. Phytoplankton community response to a
manipulation of bioavailable iron in HNLC waters of the subtropical Pacific Ocean.
Aquatic Microbial Ecology. 35 (1), 79-91.
146
Erdner, D.L., Price, N.M., Doucette, G.J., Peleato & Anderson, D.M. 1999.
Characterization of ferredoxin and flavodoxin as markers of iron limitation in marine
phytoplankton. Marine Ecology Progress Series. 184, 43-53.
Falkowski, P.G. and Raven J.A. 1997. Aquatic Photosynthesis. Blackwell. pp.375
Falkowski, P.G., Katz, M.E., Knoll, A.H., Quigg, A., Raven, J.A., Schofield, O., &
Taylor F.J.R. 2004. The evolution of modern eukaryotic phytoplankton. Science.
305, 354-360.
Fischer, N., Hippler, M., Setif, P. Jacquot, J. P. & Rochaix, J. D. 1998. The PsaC
subunit of photosystem I provides an essential lysine residue for fast electron transfer
to ferredoxin. The EMBO Journal. 17 (4), 849-858.
Fromme, P., Melkozernov, A., Jordan, P. & Krauss, N. 2003. Structure and funtion
of photosystem I: interaction with its soluble electron carriers and external antenna
systems. FEBS Letters. 555, 40-44.
Geider, R.J. & La Roche, J. 1994. The role of iron in phytoplankton photosynthesis,
and the potential for iron-limitation of primary productivity in the sea. Photosynthesis
Research. 39: 275-301.
Geiβ, U., Vinnemeier, J., Kunert, A., Lindner, I., Gemmer, B., Lorenz, M.,
Hagemann, M., Schoor, A. 2001. Detection of the isiA gene across cyanobacterial
strains. Applied and Environmental Microbiology. 67 (11), 5247-5253.
147
Gerringa, L. J. A., de Baar, H. J. W., & Timmermans, K. R. 2000. A comparison of
iron limitation of phytoplankton in natural oceanic waters and laboratory media
conditioned with EDTA. Marine Chemistry. 68, 335-346.
Gobler, C. J. et al. 1997. Elemental release and bioavailability following viral lysis
of a marine chrysophyte. Limnology &Oceanography. 42, 1492-1504 .
Golbeck, J.H., & Bryant, D.A. 1991. Photosystem I. Current Topics in
Bioenergetics. 16, 83-177.
Graziano, L.M., La Roche, J., Geider, R.J. 1996. Physiological responses to
phosphorus limitation in batch and steady state cultures of Dunaliella tertiolecta
(chlorophyta): a uniqe stress protein as an indicator of phosphate deficiency. Journal
of Phycology. 32 (5), 825-838.
Greene, R. M., Geider, R. J. & Falkowski, P. G. 1991. Effect of iron limitation on
photosynthesis in a marine diatom. Limnology &Oceanography. 36:1772–82.
Greene, R. M., Geider, R. J., Kolber, Z. & Falkowski, P. G. 1992. Iron-induced
changes in light harvesting and photochemical energy conversion processes in
eukaryotic marine algae. Plant Physiology. 100:565–75.
Green, J.C., Course, P.A. & Tarran, G.A. 1996. The life cycle of Emiliania huxleyi:
a brief review and a study of relative ploidy levels analysed by flow cytometry.
Journal of Marine Systems. 9: 33-44.
148
Gregson, A.J., Green, J.C., Leadbeater, B.S.C. 1993. Structure and physiology of the
haptonema in Chrysochromulina (Prymnesiophyceae). I. Fine structure of the
flagella/haptonemal root system in C. acantha and C. simplex. Journal of Phycology.
29 (5), 674-686.
Guikema, J. A. 1987. Differential effects of iron and chlorophyll in the control of
membrane synthesis in Anacystis nidulans. In. Diggins, J. [Ed.] Progress in
Photosynthesis Research, Vol. 4. Martinus Nijhoff Publishers, Dordrecht, The
Netherlands, pp.785-788.
Harris, R. 1994. Zooplankton grazing on the coccolithophore Emiliania huxleyi and
its role in inorganic carbon flux. Marine Biology. 119, 431-439.
Head, E. J. H. & Harris, L. R. 1994. Feeding selectivity by copepods grazing on
natural mixtures of phytoplankton determined by HPLC analysis of pigments. Marine
Ecology Progress Series. 110, 75-83.
Hernandez, M.T., Mills, R.A., & Pancost, R.D. 2008. Algal biomarkers in surface
waters around the Crozet plateau. Organic Geochemistry. 39 (8), 1051-1057.
Hoge, F., Swift, R., Yungel, J., Turner, S., Nightingale, P., Hatton, A., Liss, P. &
Tindale, N. W. 1994. Testing the iron hypothesis in ecosystems of the equatorial
Pacific Ocean. Nature. 371, 123–129.
149
Holligan, P.M., Viollier, M., M., Harbour, D.S., Camus, P. & Champagne-Phillipe,
M. 1983. Satellite and ship studies of coccolithophore production along a continental
shelf edge. Nature 304, 339-342.
Hudson, R. J. M. & Morel, F. M. M. 1990. Iron transport in marine phytoplankton:
kinetics of cellular and medium coordination reactions. Limnology & Oceanography.
35, 1002-1020.
Hudson, R. J. M. & Morel, F. M. M. 1993. Trace metal transport by marine
microorganisms: implications of metal coordination kinetics. Deep Sea Research I.
40, 129-150.
Hutchins, D. A. & Bruland, K. W. 1994. Grazer-mediated regeneration and
assimilation of Fe, Zn and Mn from plnaktonic prey. Marine Ecology Progress
Series. 110, 259-269.
Hutchins, D. A., Witter, A. E., Butler, A. & Luther III, G. W. 1999. Competition
among marine phytoplankton for different chelated iron species. Nature. 400, 858-
861.
Hutchins, D. A, Franck, V. M., Brzezinski, M. A. & Bruland, K. W. 1999(A).
Inducing phytoplankton iron limitation in iron-replete coastal waters with a strong
chelating ligand. Limnology and Oceanography. 44(4), 1009-1018.
150
Ihalainen, J. A., D’Haene, S., Yeremenko, N., van Roon, H., Arteni, A. A., Boekema,
E. J., van Grondelle, R., Matthijs, H. C. P. & Dekker, J. P. 2005. Aggregates of the
chlorophyll binding protein IsiA (CP43’) dissipate energy in cyanobacteria.
Biochemistry. 44, 10846 – 10853.
Inda, L.A., & Peleato, M.L. 2003. Development of an ELISA approach for the
determination of flavodoxin and ferredoxin as markers of iron deficiency in
phytoplankton. Phytochemistry. 63 (3), 303-308.
Inouye, I., & Kawachi, M. 1994. The haptonema. In: Green J.C., Leadbeater, B.S.C.
(eds) The haptophyte algae. The Systematics Association Special Volume No 51,
Clarendon Press, Oxford, 73-89.
Jeanjean, R., Latifi, A., Matthijs, H.C.P. & Havaux, M. 2008. The PsaE subunit of
photosystem I prevents light-induced formation of reduced oxygen species in the
cyanobacterium Synechocystis sp. PCC 6803. Biochemica et Biophysica Acta. 1777,
308 - 316
Jones, G.J., Palenik B.P. & Morel F.M.M. 1987. Trace metal reduction by
phytoplankton: The role of plasmalemma redox enzymes. Journal of Phycology. 23,
237-244.
Kim, S.A., & Guerinot, M.L. 2007. Mining iron: Iron uptake and transport in plants.
FEBS Letters. 581, 2273-2280.
151
Kutzki, C. Masepohl, B. & Bohme, H. 1998. The isiB gene encoding flavodoxin is
not essential for photoautotrophic iron limited growth of the cyanobacterium
Synechocystis sp. strain PCC 6803. FEMS microbiology letters. 160, 231-235.
LaRoche, J., Murray, H., Orellana, M., Newton, J. 1995. Flavodoxin expression as
an indicator of iron limitation in marine diatoms. Journal of Phycology. 31, 520-530.
Laudenbach, D.E., Reith, M.E & Straus, N.A. 1988. Isolation, sequence analysis,
and transcriptional studies of the flavodoxin gene from Anacystis nidulans R2.
Journal of Bacteriology. Vol 170, No.1: 258-265.
Leadbeater, B.S.C., & Manton, I. 1969. Chrysochromulina camella sp. nov. and C.
cymbium sp. nov., two new relatives of C. strobilus Parke and Manton. Archives of
Microbiology. 68 (2), 116-132.
Lemaire, S. D., Guillon, B., Le Marechal, P., Keryer, E., Miginiac-Maslow, M. &
Decottignies, P. 2004. New thioredoxin targets in the unicellular photosynthetic
eukaryote Chlamydomonas reinhardtiii. PNAS. 101, 19, 7475-7480.
Leynaert, A., Bucciarelli, E., Claquin, P., Dugdale, R. C., Martin-Jezequel, V.,
Podaven, P. & Ragueneau, O. 2004. Effect of iron deficiency on diatom cell size and
silicic acid uptake kinetics. Limnology and Oceanography. 49(4), 1134-1143.
Liu, X., Zhao, J., Wu, Q. 2006. Biogenesis of chlorophyll binding proteins under
iron stress in Synechocystis sp. PCC 6803. Biochemistry (Moscow). 71 (1), 101-104.
152
Lynnes, J. A., Derzaph, T. L. M. & Weger, H. G. 1998. Iron limitation results in
induction of ferricyanide reductase and ferric chelate reductase activities in
Chlamydomonas reinhardtii. Planta. 204, 360-365.
Mahowald, N., Kohfield, M., Hansson, Y., Balkanski, Y., Harrison, S., Prentice, C.,
Schulz, M. & Rodhe, H. 1999. Dust sources and deposition during the last glacial
maximum and current climate: A comparison of model results with paleodata from ice
cores and marine sediments. Journal of Geophysical Research. 104, 15895 – 15916.
Maldonado, M. T. & Price, N. M., 1996. Influence of N substrate on Fe requirements
of marine centric diatoms. Marine Ecology Progress Series. 141, 161-72.
Maldonado, M. T. & Price, N. M. 2001. Reduction and transport of organically
bound iron by Thalassiosira oceanica (bacillariophyceae). Journal of Phycology. 37,
298-309.
Malin, G., Turner, S.M. & Liss, P.S. 1992. Sulfur: the plankton/climate connection.
Journal of Phycology. 28, 590-597.
Marius, N., Muller, Avan, N., Anita, & LaRoche, J. 2008. Influence of cell cycle
phase on calcification in the coccolithophore Emiliania huxleyi. Limnology and
Oceanography. 53 (2), 506-512.
Manton, I. 1964. Further observations on the fine structure of the haptonema in
Prymnesium parvum. Archives of Microbiology. 49 (4), 315-330.
153
Marchetti, A., Parker, M. S., Moccia, L. P., Lin, E. O., Arrieta, A. L., Ribalet, F.,
Murphy, M. E. P., Maldonado, M. T & Armbrust, V. E. 2009. Ferritin is used for
iron storage in bloom-forming marine pennate diatoms. Nature. 457, 467-470.
Marschner, H., & Romheld, V. 1994. Strategies of plants for acquisition of iron.
Plant and Soil. 165 (2), 261-274.
Martin, J. H., 1990. Glacial-interglacial CO2 change: the iron hypothesis.
Paleooceanography. 5, 1-13.
Martin, J. H., Coale, K. H., Johnson, K. S., Fitzwater, S. E., Gordon, R. M., Tanner,
S. J., Hunter, C. N., Elrod, V. A., Nowicki, J. L., Coley, T. L., Barber, R. T., Lindley,
S., Watson, A. J., Van Scoy, K., Law, C. S., Liddicoat, M. I., Ling, R., Stanton, T.,
Stockel, J., Collins, C., Anderson, A., Bidigare, R., Ondrusek, M., Latasa, M.,
Millero, F. J., Lee, K., Yao, W., Zhang, J. Z., Friederich, G., Sakamoto, C., Chavez,
F., Buck, K., Kolber, Z., Greene, R., Falkowski, P., Chisholm, S. W., Hoge, F., Swift,
R., Yungel, J., Turner, S., Nightingale, P., Hatton, A., Liss, P. & Tindale, N. W.
1994. Testing the iron hypothesis in ecosystems of the equatorial Pacific Ocean.
Nature. 371, 123–129.
McIntyre, A., Ruddiman, W.F., Jantzen, R. 1972. Southward penetration of the
North Atlantic Polar Front: faunal and floral evidence of large-scale surface water
mass movements over the last 225,000 years. Deep Sea Research. 19, 61-77.
154
McKay, R. M. L., Geider, R. J. & La Roche, J. 1997. Physiological and biochemical
response of the photosynthetic apparatus of two marine diatoms to Fe stress. Plant
Physiology. 114, 615-622.
McKay, R. M. L., Geider, R. J. & La Roche, J. 1997. Physiological and biochemical
response of the photosynthetic apparatus of two marine diatoms to Fe stress. Plant
Physiology. 114, 615-622.
McKay, R.L., La Roche, J., Yakunin, A.F., Durnford, D.G. & Geider, R.J. 1999.
Accumulation of ferredoxin and flavodoxin in a marine diatom in response to Fe.
Journal of Phycology, 35, 510-519.
Moore, K.J., Doney, S.C., Glover, D.M., Fung, I.Y., 2002. Iron cycling and nutrient
patterns in surface waters of the World Ocean. Deep – Sea Research II. 49, 463-507.
Naito, K., Imai, I & Nakahara, H. 2008. Complexation of iron by microbial
siderophores and effects of iron chelates on the growth of marine microalgae causing
red tides. Phycological Research. 56 (1), 58-67.
Mori, S. 1999. Iron acquisition by plants. Current Opinion in Plant Biology. 2, 250-
253.
Neilands, J. B. 1984. Methodology of siderophores. Structure. Bonding. 58, 1-24.
155
Paasche, E. & Brubak, S. 1994. Enhanced calcification in the coccolithophorid
Emiliania huxleyi (Haptophyceae) under phosphorus limitation. Phycologia. 33,
324-330.
Paasche, E. 2002. A review of the coccolithophorid Emiliania huxleyi
(Prymnesiophyceae), with particular reference to growth, coccoliths formation, and
calcification-photosynthesis interactions. Phycologia. 40 (6), 503-529.
Ratledge, C., P. V. Patel & J. Mundy. 1982. Iron transport in Mycobacterium
smegmatis: The location of mycobactin by electron microscopy. Journal of General
Microbiology. 128, 1559-1565.
Raven, J. A., Wollenwever, B. & Handley, L. L., 1992. A comparison of ammonium
and nitrate as nitrogen sources for photolithotrophs. New Phytol. 121, 19-32.
Rayns, D.G. 1962. Alternation of generations in a coccolithophorid, Cricoshaera
carterae (Braarud and Fagerl.) Braarud. Journal of the Marine Biological
Association. 42: 481-484.
Rea, D.K. 1994. The paleoclimatic record provided by eolian deposition in the deep
sea: the geologic history of wind. Reviews of Geophysics. 32, 159-195.
Rhiel, E., & Bryant, D.A. 1993. Nucleotide sequence of the psaE gene of
cyanobacterium Synechococcus sp. PCC 6301. Plant Physiology. 101, 701-702.
156
Riebesell, U. 2004. Effects of CO2 enrichment on marine phytoplankton. Journal of
Oceanography. 60, 719-729.
Riegmann, R., Stolte, W., Noordeloos, A., & Slezak, D. 2000. Nutrient uptake and
alkaline phosphatase (EC 3:1:3:1) activity of Emiliania huxleyi (Prymnesiophyceae).
Journal of Phycology. 36, 87-96.
Robertson, J.E., Robinson, C., Turner, D.R., Holligan, P., Watson, A.J., Boyd, P.,
Fernandez, E., & Finch, M. 1994. The impact of a coccolithophore bloom on oceanic
carbon uptake in the northeast Atlantic during summer 1991. Deep Sea Research. 41
(2), 297-314.
Rousseau, F., Setif, P. & Lagoutte, B. 1993. Evidence for the involvement of PSI-E
subunit in the reduction of ferredoxin by photosystem I. The EMBO Journal. 12 (5),
1755 – 1765.
Rue, E. L. & Bruland, K. W. 1995. Complexation of iron(III) by natural organic
ligands in the Central North Pacific as determined by a new competitive ligand
equilibration / adsorptive cathodic stripping voltametric method. Marine chemistry.
50, 117-138.
Rueter, J. G. & Ades, D. R. 1987. The role of iron nutrition in photosynthesis and
nitrogen assimilation in Scenedesmus quadricauda (Chlorophyceae). Journal of
Phycology, 23, 452-457.
157
Sarcina, M., & Mullineaux, C.W. 2004. Mobility of the IsiA chlorophyll-binding
protein in cyanobacterial thylakoid membranes. Journal of Biological Chemistry.
279 (35), 36514-36518.
Schmidt, W. 2003. Iron solutions: acquisition strategies and signalling pathways in
plants. Trends in Plant Science. 8 (4), 188-193.
Seuront, L., Lacheze, C., Doubell, M.J., Seymour, J.R., Van Dongen-Vogels, V.,
Newton, K., Alderkamp, A.C., & Mitchell, J.G. 2007. The influence of Phaeocystis
galbosa on microscale spatial patterns of chlorophyll a and bulk-phase seawater
viscosity. Biogeochemistry. 83, 173-188.
Setif, P., Fischer, N., Lagoutte, B., Bottin, H. & Rochaix, J. D. 2002. The ferredoxin
docking site of photosystem I. Biochemica et Biophysica Acta. 1555, 204-209.
Sheterline, P., & Sparrow, J.C. 1994. Actin. Protein profile. 1, 1-121.
Simon, N., Cras, A., Fouldon, E., & Lemee, R. 2009. Diversity and evolution of
marine phytoplankton. Comptes Rendus Biologies. 332 (2-3), 159-170.
Singh, A.K., & Sherman, L.A. 2007. Reflections on the function of IsiA, a
cyanobacterial stress-inducible, chl-binding protein. Photosynthesis Research. 93,
17-25.
158
Soria-Dengg S, Horstmann U. 1995. Ferrioxamines B and E as iron sources for the
marine diatom Phaeodactylum tricornutum. Marine Ecology Progress Series. 127,
269-277.
Spilmont, N., Denis, L., Artigas, L.F., Caloin, F., Courcot, L., Creach, A., Desroy, N.,
Gevaert, F., Hacquebart, P., Hubas, C., Janquin, M., Lemoine, Y., Luczak, C., Migne,
A., Rauch, M., & Davoult, D. 2009. Impatc of the Phaeocystis galbosa spring bloom
on the intertidal benthic compartment in the eastern English Channel: A synthesis.
Marine Pollution Bulletin. 58 (1), 55-63.
Stefels, J. & van Leeuwe, M., A. 2002. Effects of iron and light stress on the
biochemical composition of antarctic Phaeocystis sp. (prymnesiophyceae. I.
Intracellular DMSP concentrations. Journal of Phycology. 34(3), 486-495.
Strom, S. L. 1993. Production of phaeopigments by marine protozoa: results of
laboratory experiments analyzed by HPLC. Deep Sea Research I. 40, 57-80.
Tegen, I., Fung, I.y., 1994. Modelling of mineral dust in the atmosphere: sources,
transport and optical thickness. Journal of Geophysical Research. 99, 22897-22914.
Tegen, I., Fung, I.Y., 1995. Contribution to the atmospheric mineral aerosol load
from land surface modifications. Journal of Geophysical Research. 100, 18707-
18726.
159
Tomitani, A. 2006. Origin and early evolution of chloroplasts. Paleontological
Research. 10 (4), 283-297.
van Leeuwe, M. A. & Stefels, J. 1998. Effects of iron and light stress on the
biochemical composition of Antarctic Phaeocystis sp. (Prymnesiophyceae). II.
pigment composition. Journal of Phycology. 34, 496 – 503.
Varsano, T., Wolf, S. G., & Pick, U. 2006. A chlorophyll a/b-binding protein
homolog that is induced by iron deficiency is associated with enlarged photosystem I
units in the eucaryotic alga Dunaliella salina. The Journal of Biological Chemistry.
281 (15), 10305 – 10315.
Vaulot, D., Birrien, J.L., Marie, D., Cassotti, R., Veldhuis, M.J.W., Kraay, G.W. &
Chretiennot-Dinet, M.J. 1994. Morphology, ploidy, pigment composition, and
genome size of cultured strains of Phaeocystisi (Prymnesiophyceae). Journal of
Phycology. 30, 1022-1035.
Weger, H. G., 1999. Ferric and cupric reductase activities in the green alga
Chlamydomonas reinhardtii: experiments using iron limited chemostats. Planta. 207,
377-384.
Wells, M.L., 1999. Manipulating iron availability in nearshore waters. Limnology
and Oceanography. 44, 1002– 1008.
160
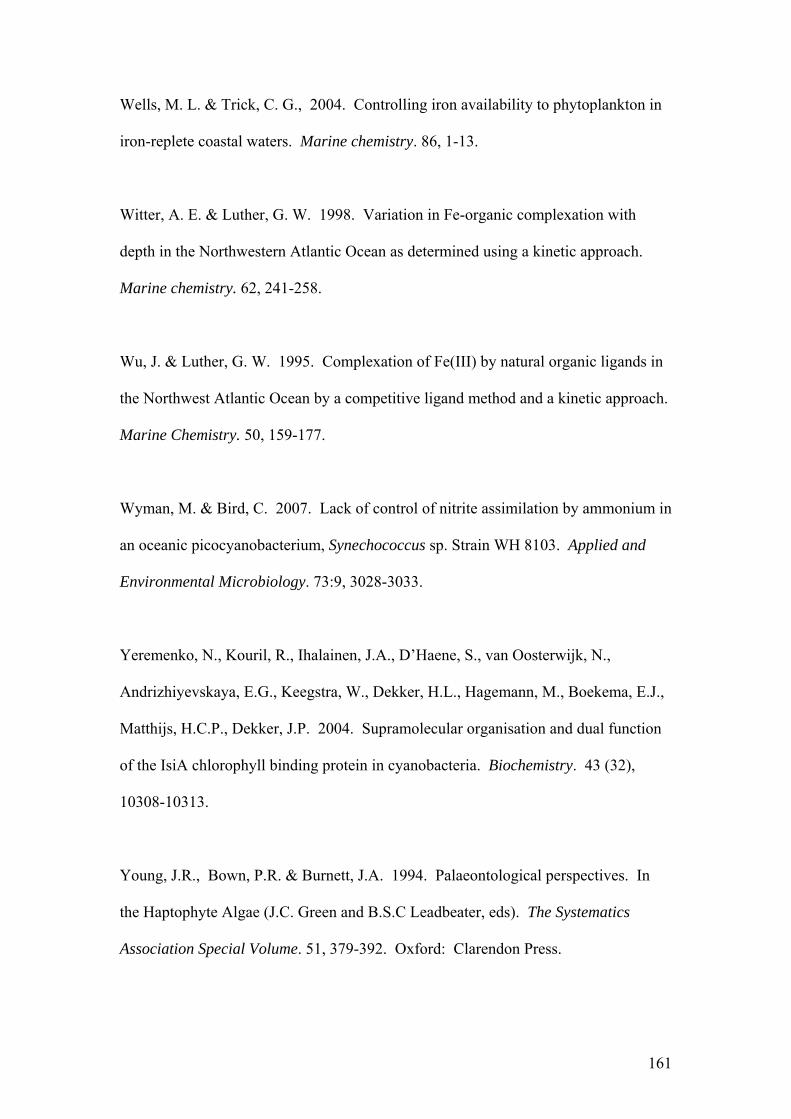
Wells, M. L. & Trick, C. G., 2004. Controlling iron availability to phytoplankton in
iron-replete coastal waters. Marine chemistry. 86, 1-13.
Witter, A. E. & Luther, G. W. 1998. Variation in Fe-organic complexation with
depth in the Northwestern Atlantic Ocean as determined using a kinetic approach.
Marine chemistry. 62, 241-258.
Wu, J. & Luther, G. W. 1995. Complexation of Fe(III) by natural organic ligands in
the Northwest Atlantic Ocean by a competitive ligand method and a kinetic approach.
Marine Chemistry. 50, 159-177.
Wyman, M. & Bird, C. 2007. Lack of control of nitrite assimilation by ammonium in
an oceanic picocyanobacterium, Synechococcus sp. Strain WH 8103. Applied and
Environmental Microbiology. 73:9, 3028-3033.
Yeremenko, N., Kouril, R., Ihalainen, J.A., D’Haene, S., van Oosterwijk, N.,
Andrizhiyevskaya, E.G., Keegstra, W., Dekker, H.L., Hagemann, M., Boekema, E.J.,
Matthijs, H.C.P., Dekker, J.P. 2004. Supramolecular organisation and dual function
of the IsiA chlorophyll binding protein in cyanobacteria. Biochemistry. 43 (32),
10308-10313.
Young, J.R., Bown, P.R. & Burnett, J.A. 1994. Palaeontological perspectives. In
the Haptophyte Algae (J.C. Green and B.S.C Leadbeater, eds). The Systematics
Association Special Volume. 51, 379-392. Oxford: Clarendon Press.
161
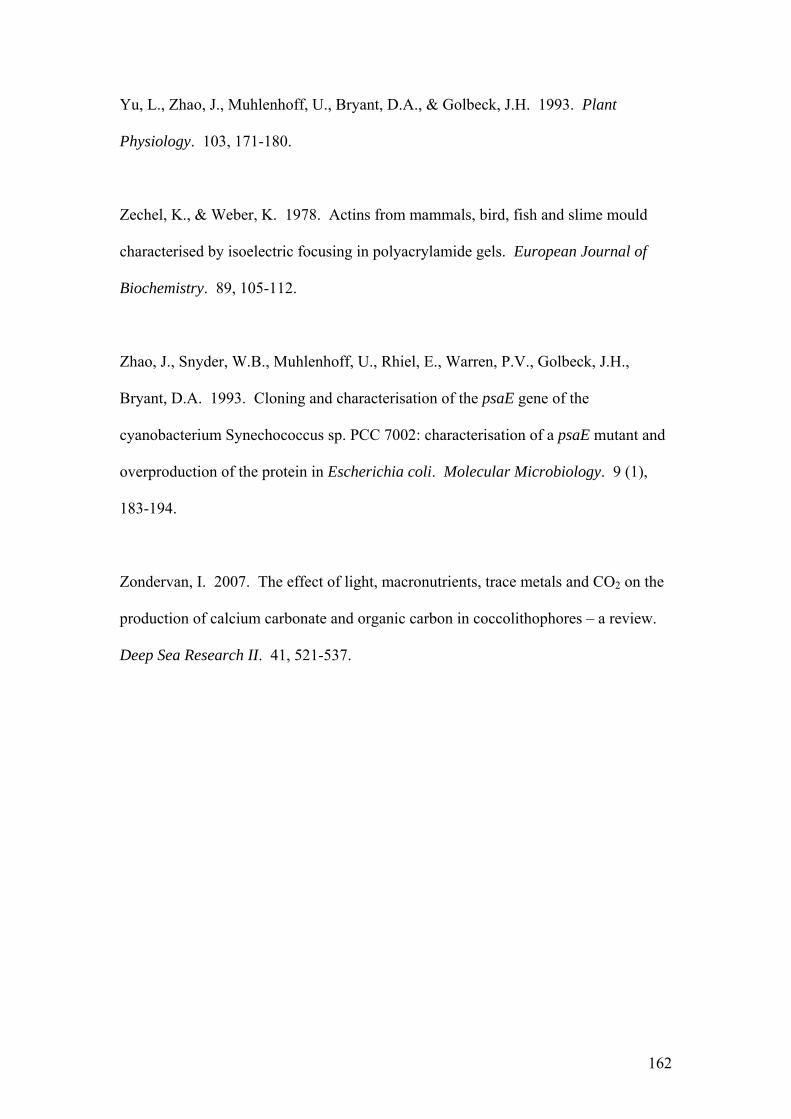
Yu, L., Zhao, J., Muhlenhoff, U., Bryant, D.A., & Golbeck, J.H. 1993. Plant
Physiology. 103, 171-180.
Zechel, K., & Weber, K. 1978. Actins from mammals, bird, fish and slime mould
characterised by isoelectric focusing in polyacrylamide gels. European Journal of
Biochemistry. 89, 105-112.
Zhao, J., Snyder, W.B., Muhlenhoff, U., Rhiel, E., Warren, P.V., Golbeck, J.H.,
Bryant, D.A. 1993. Cloning and characterisation of the psaE gene of the
cyanobacterium Synechococcus sp. PCC 7002: characterisation of a psaE mutant and
overproduction of the protein in Escherichia coli. Molecular Microbiology. 9 (1),
183-194.
Zondervan, I. 2007. The effect of light, macronutrients, trace metals and CO2 on the
production of calcium carbonate and organic carbon in coccolithophores – a review.
Deep Sea Research II. 41, 521-537.
162
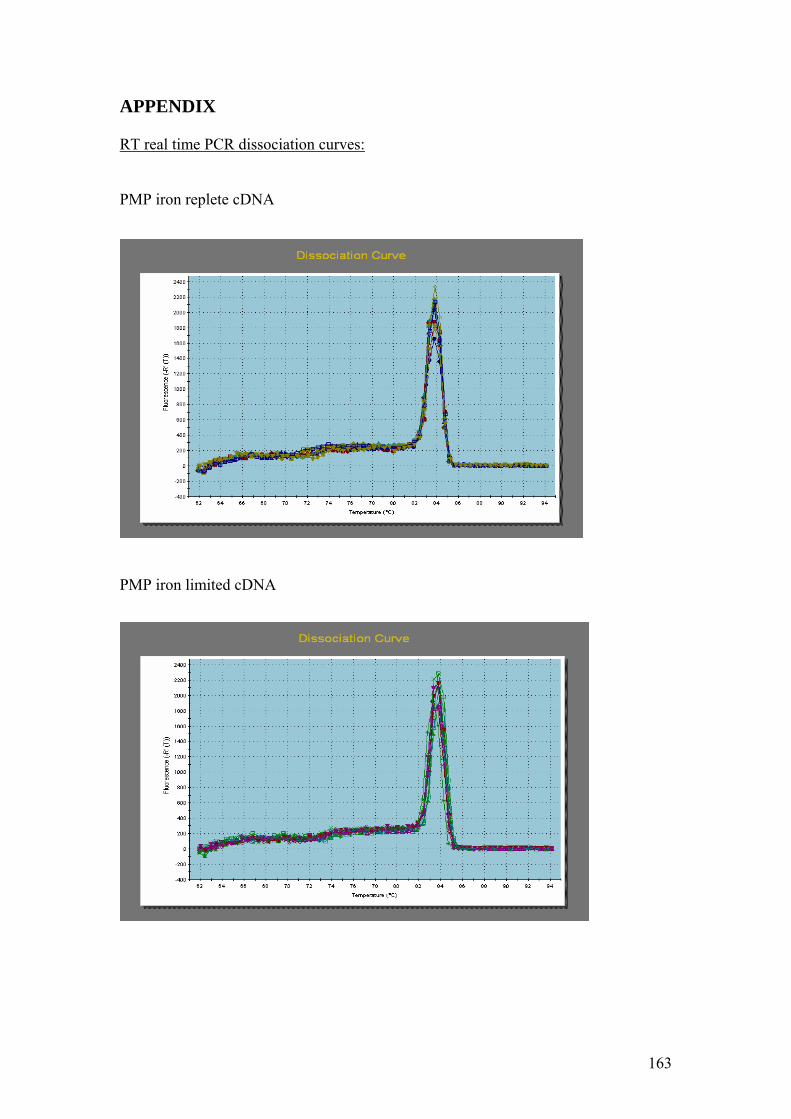
APPENDIX RT real time PCR dissociation curves: PMP iron replete cDNA PMP iron limited cDNA
163
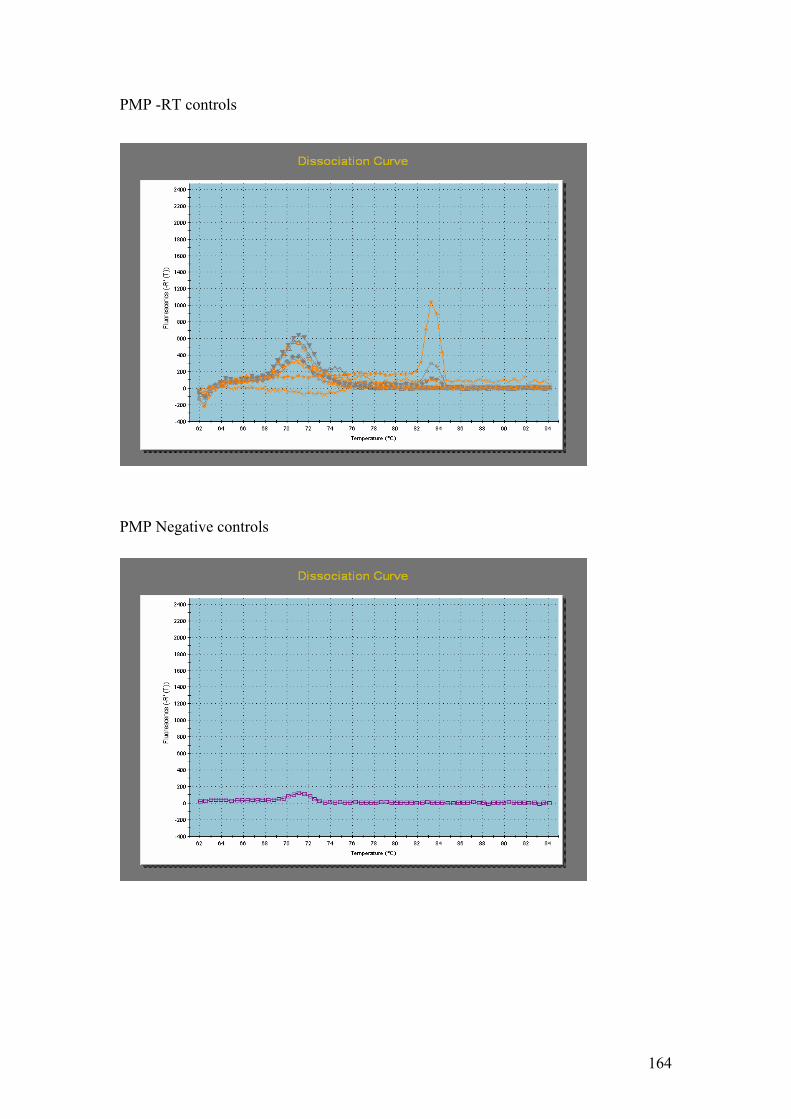
PMP -RT controls PMP Negative controls
164
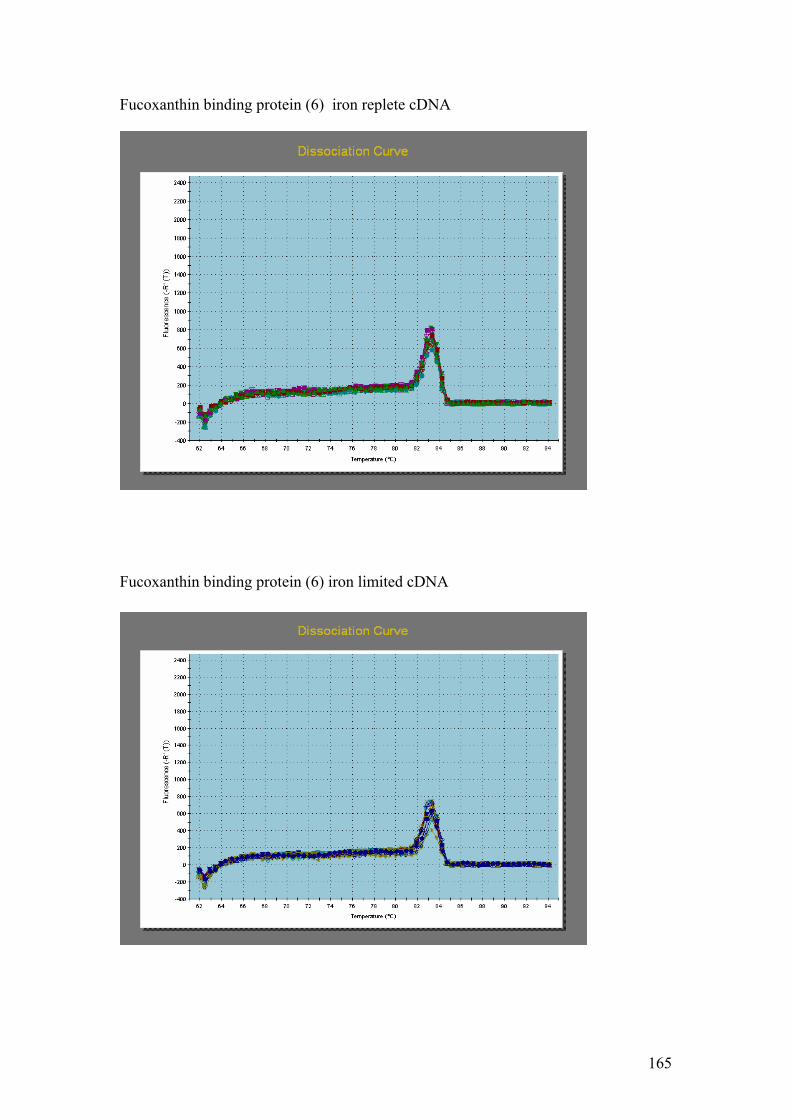
Fucoxanthin binding protein (6) iron replete cDNA Fucoxanthin binding protein (6) iron limited cDNA
165
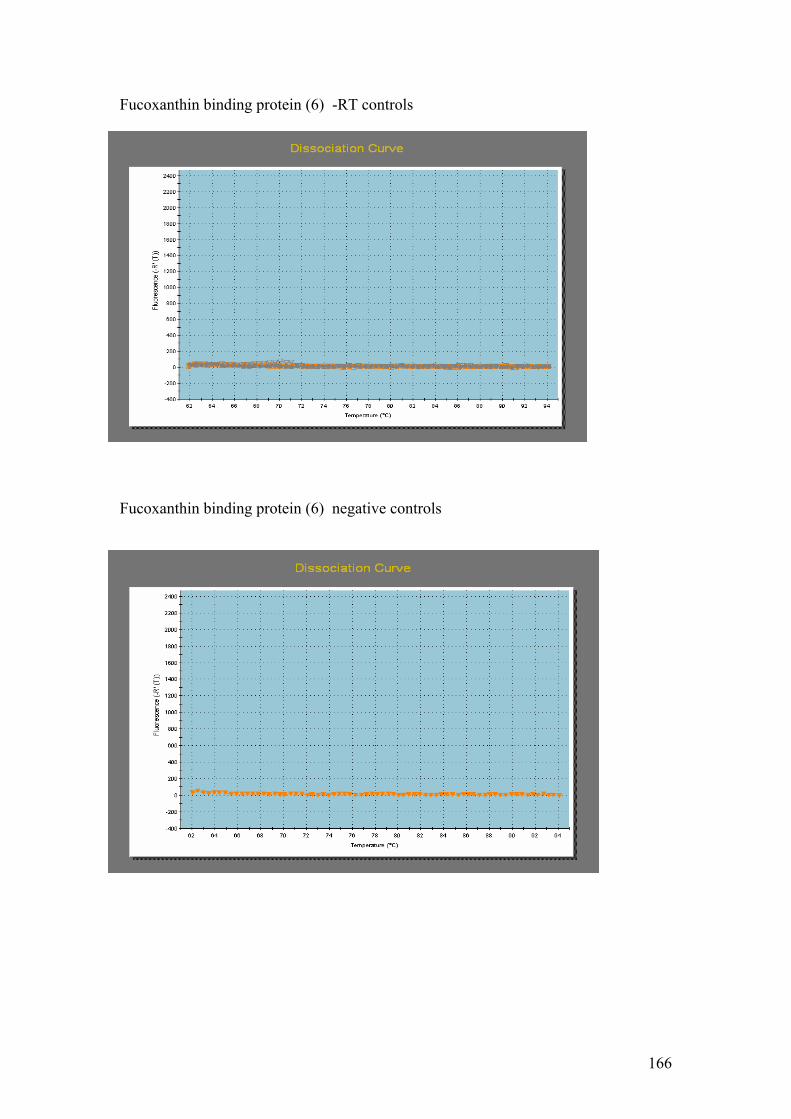
Fucoxanthin binding protein (6) -RT controls Fucoxanthin binding protein (6) negative controls
166
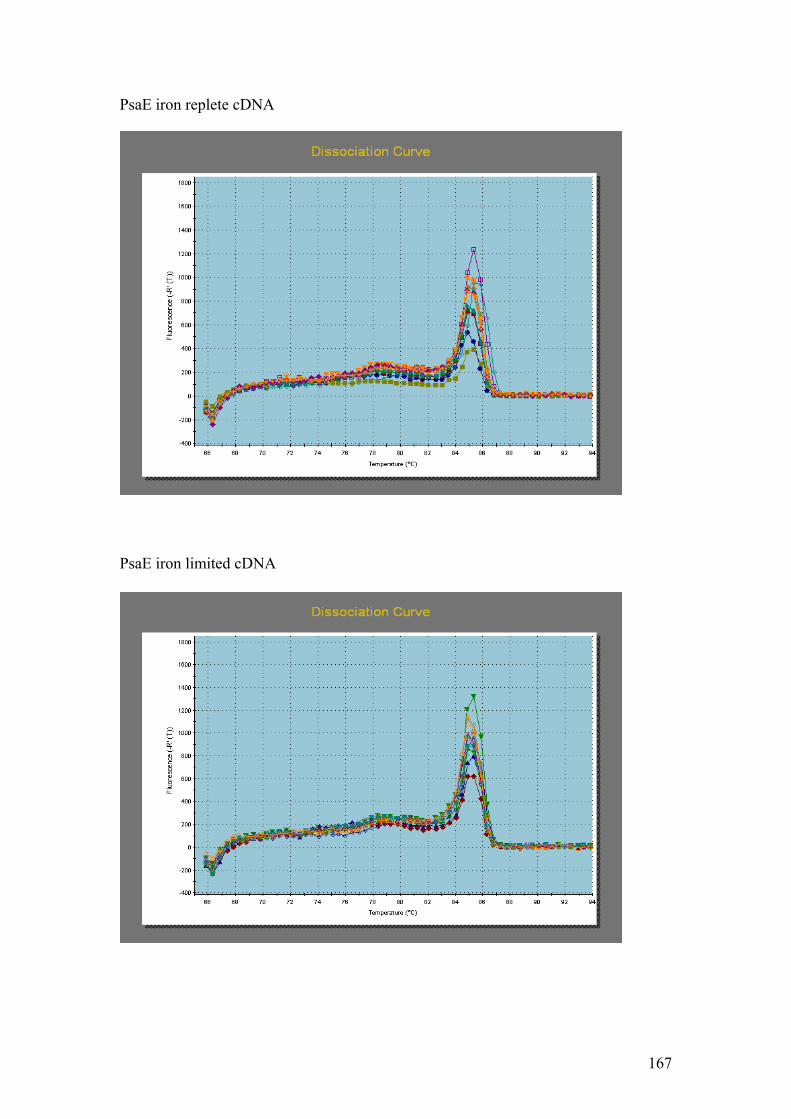
PsaE iron replete cDNA PsaE iron limited cDNA
167
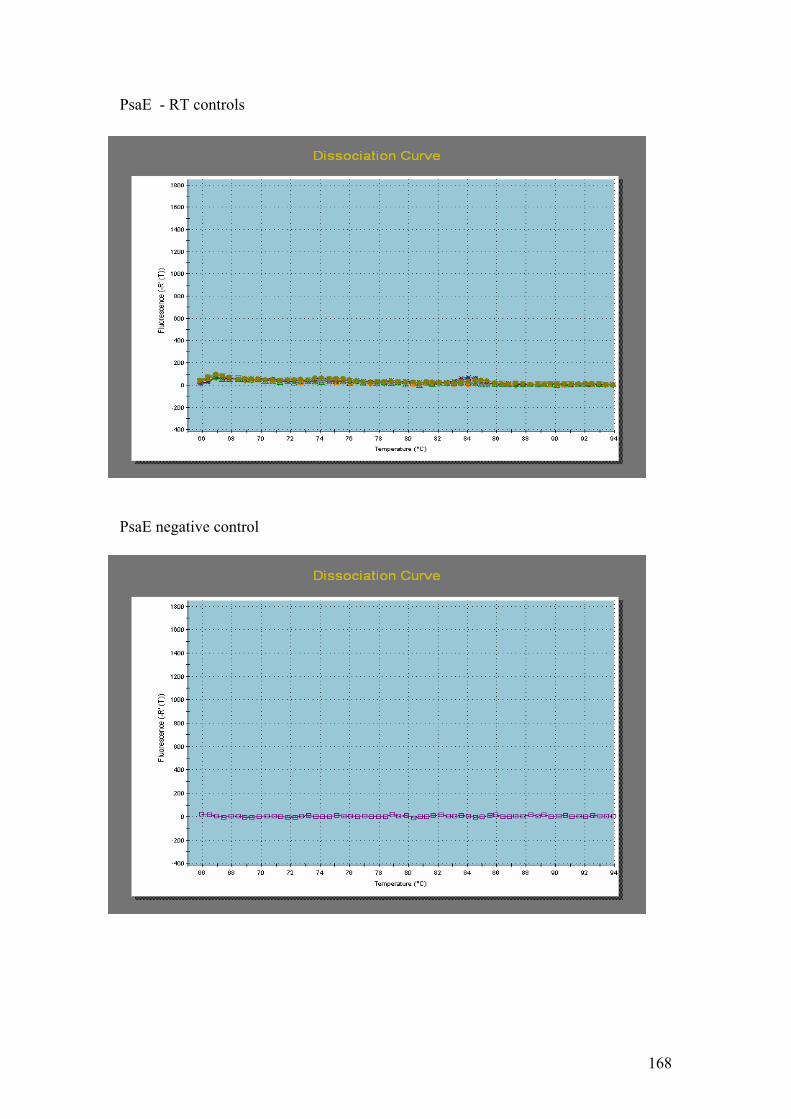
PsaE - RT controls PsaE negative control
168
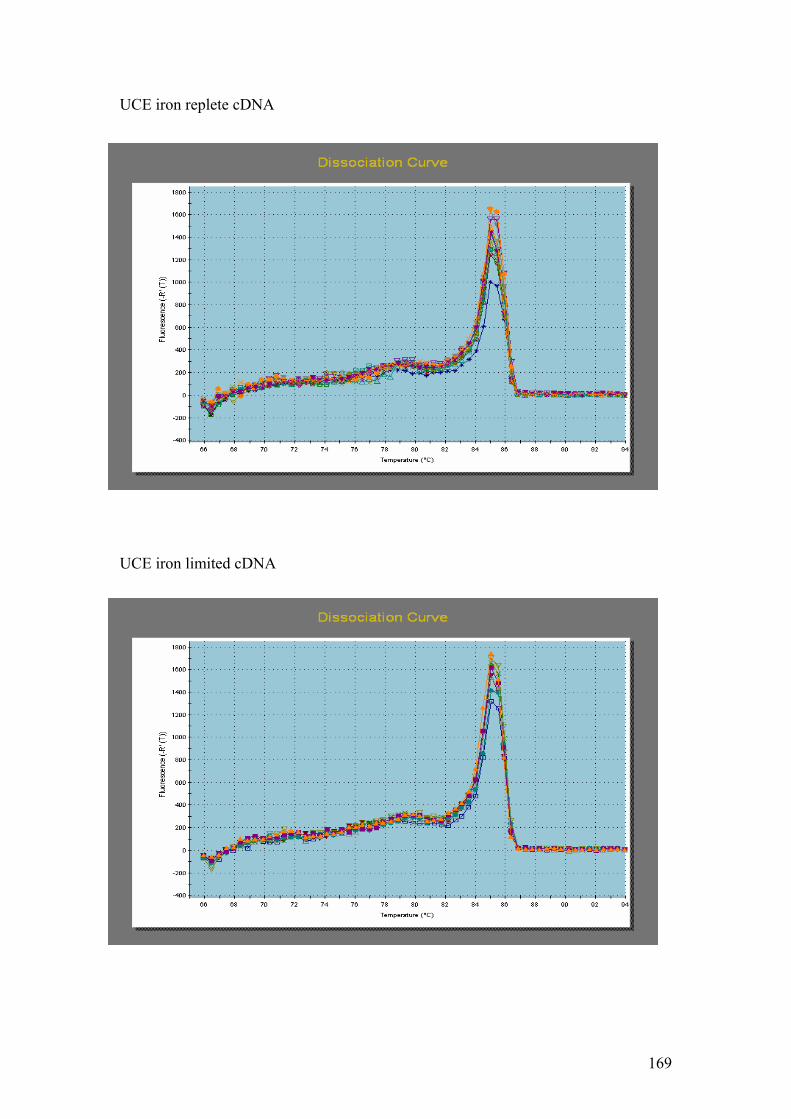
UCE iron replete cDNA UCE iron limited cDNA
169
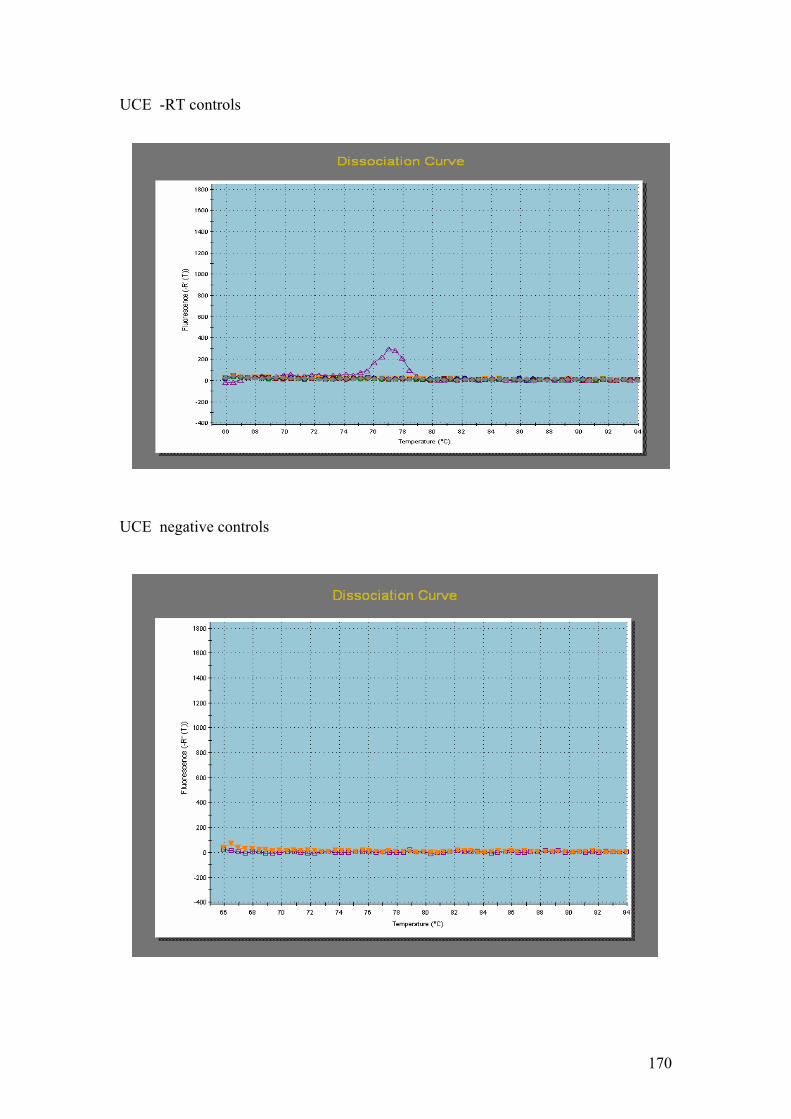
UCE -RT controls UCE negative controls
170
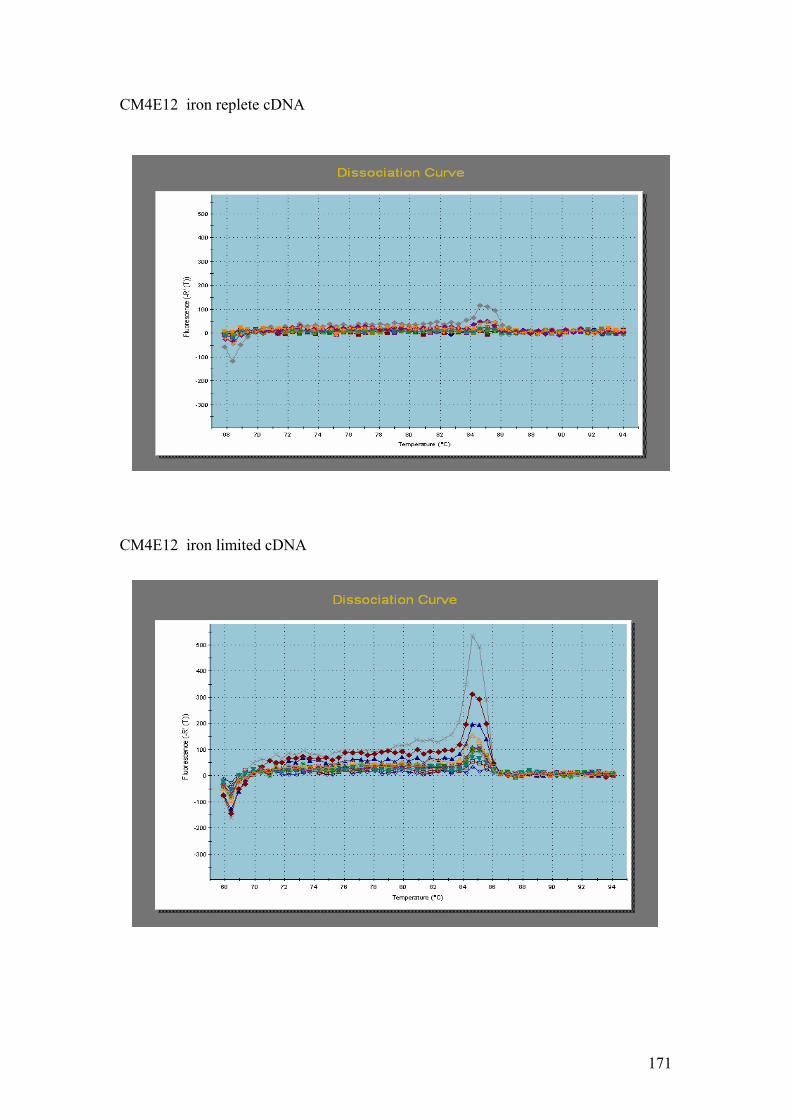
CM4E12 iron replete cDNA CM4E12 iron limited cDNA
171
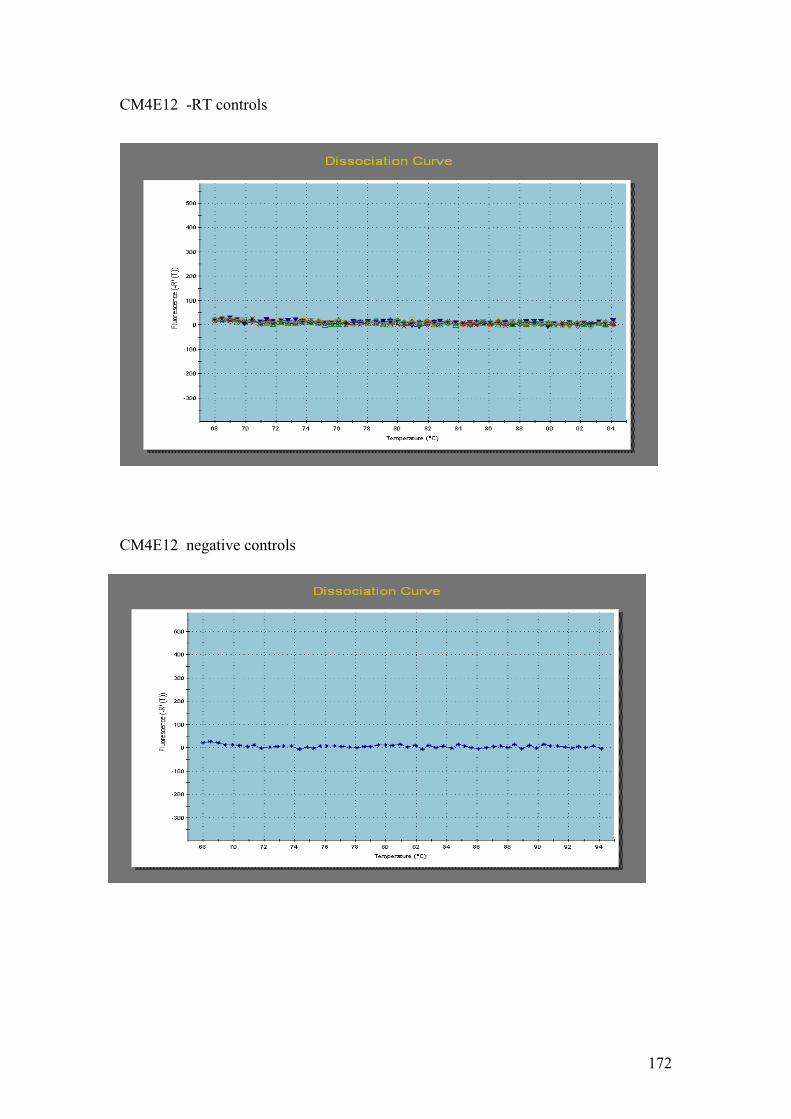
CM4E12 -RT controls CM4E12 negative controls
172
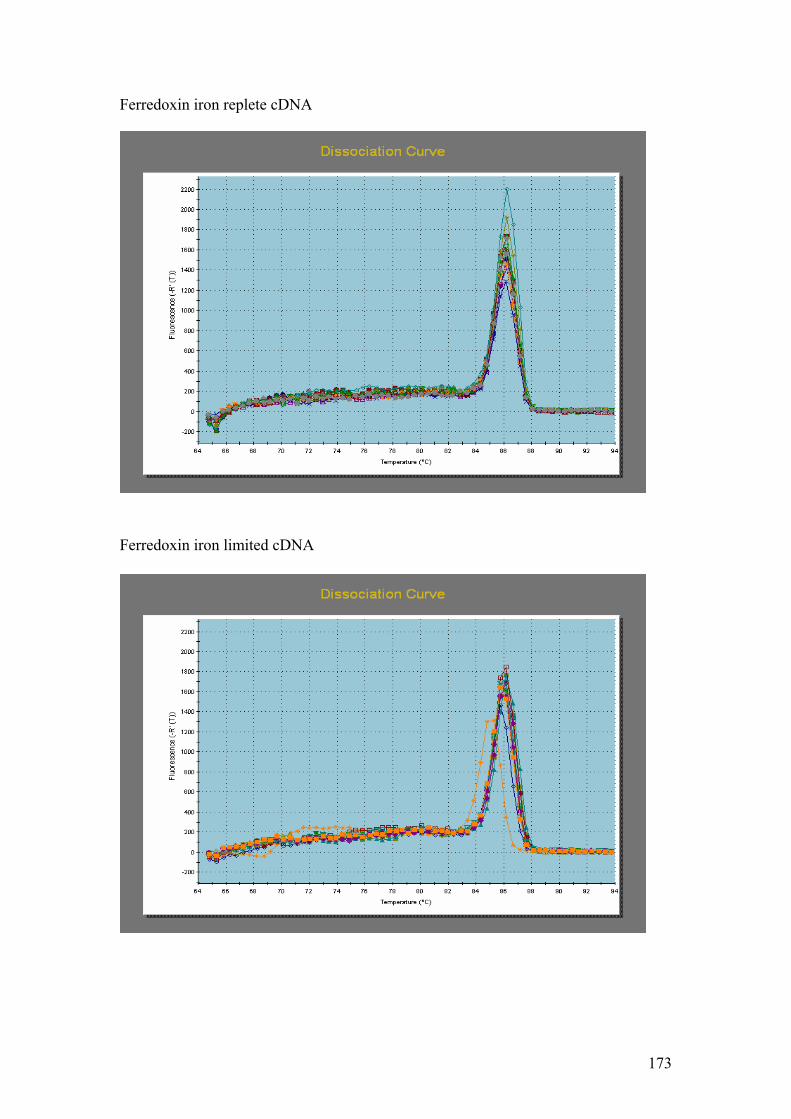
Ferredoxin iron replete cDNA Ferredoxin iron limited cDNA Ferredoxin iron replete -RT controls
173
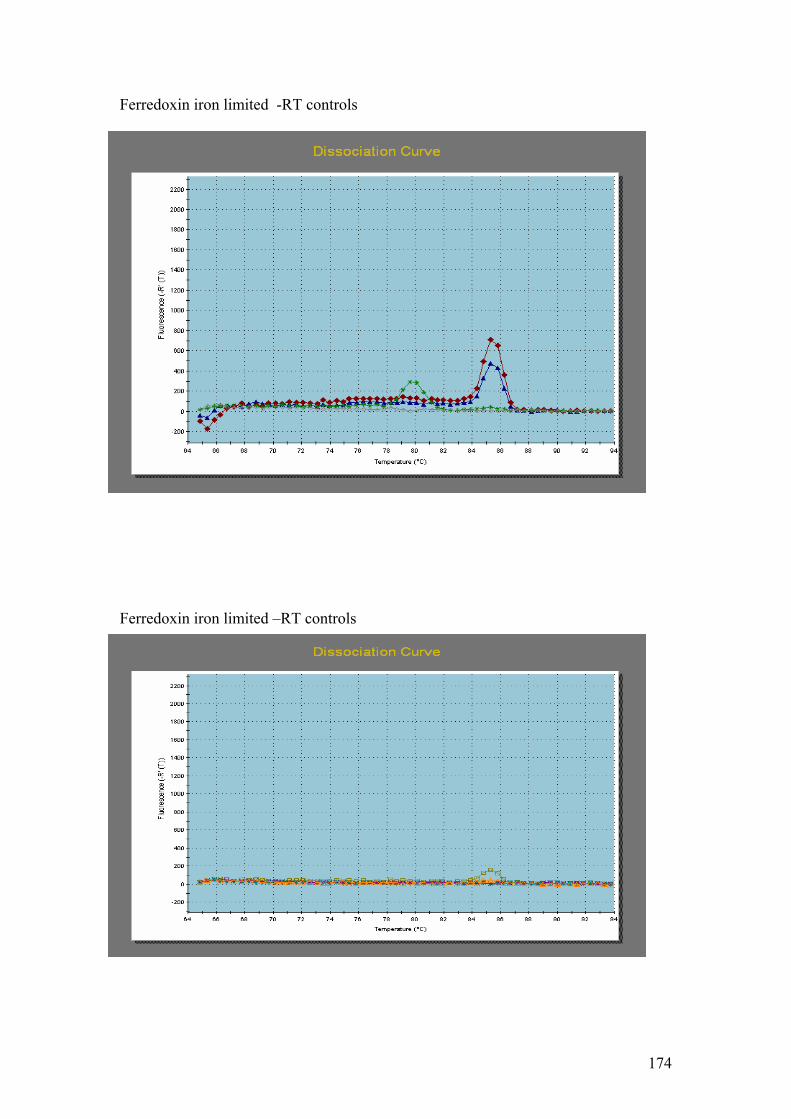
Ferredoxin iron limited -RT controls Ferredoxin iron limited –RT controls
174
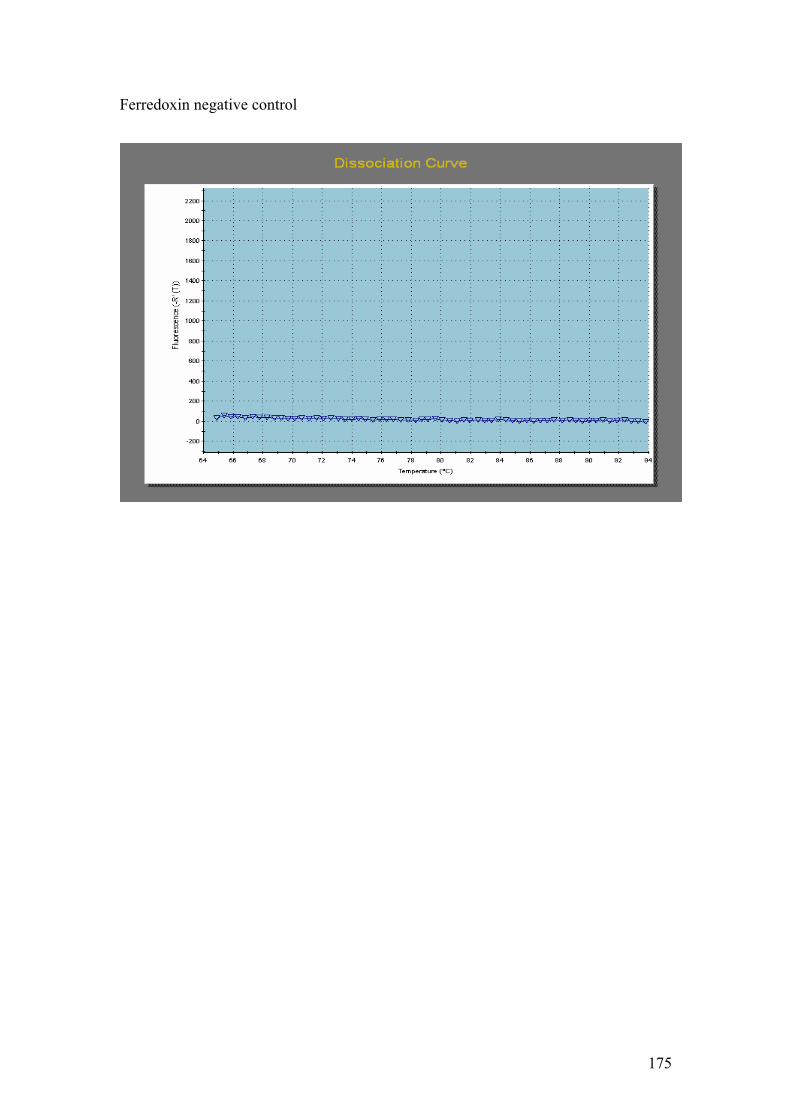
Ferredoxin negative control
175
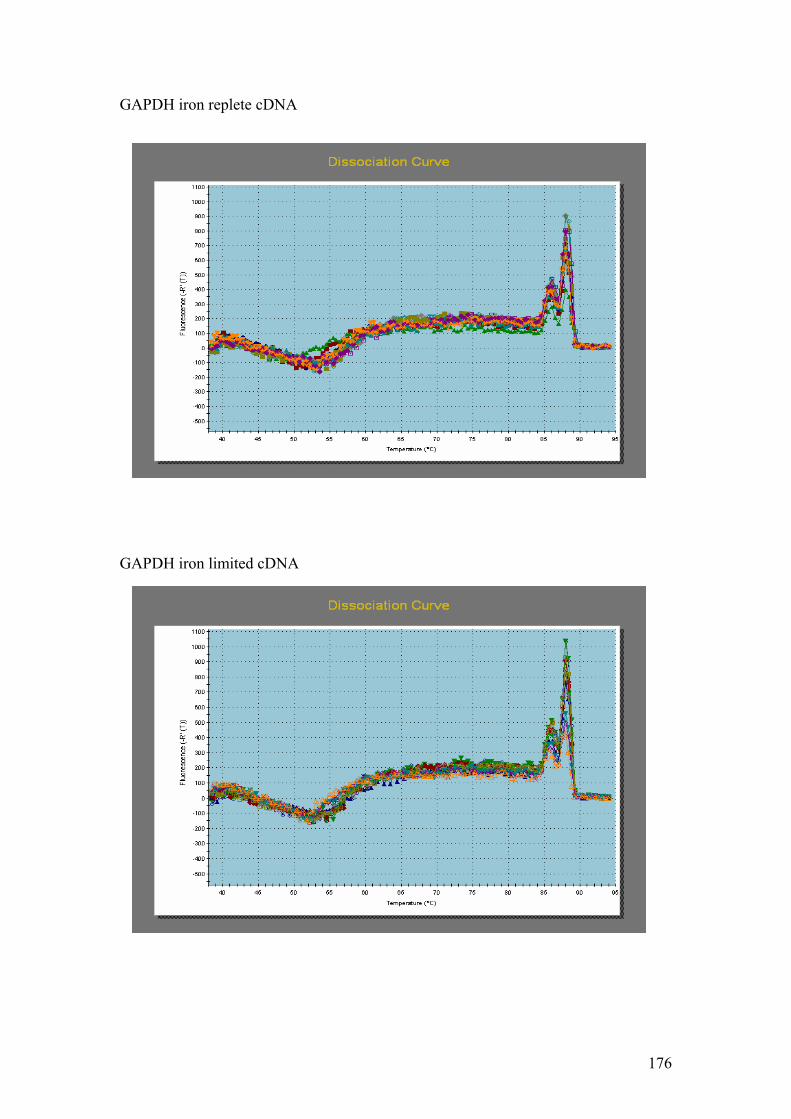
GAPDH iron replete cDNA GAPDH iron limited cDNA
176
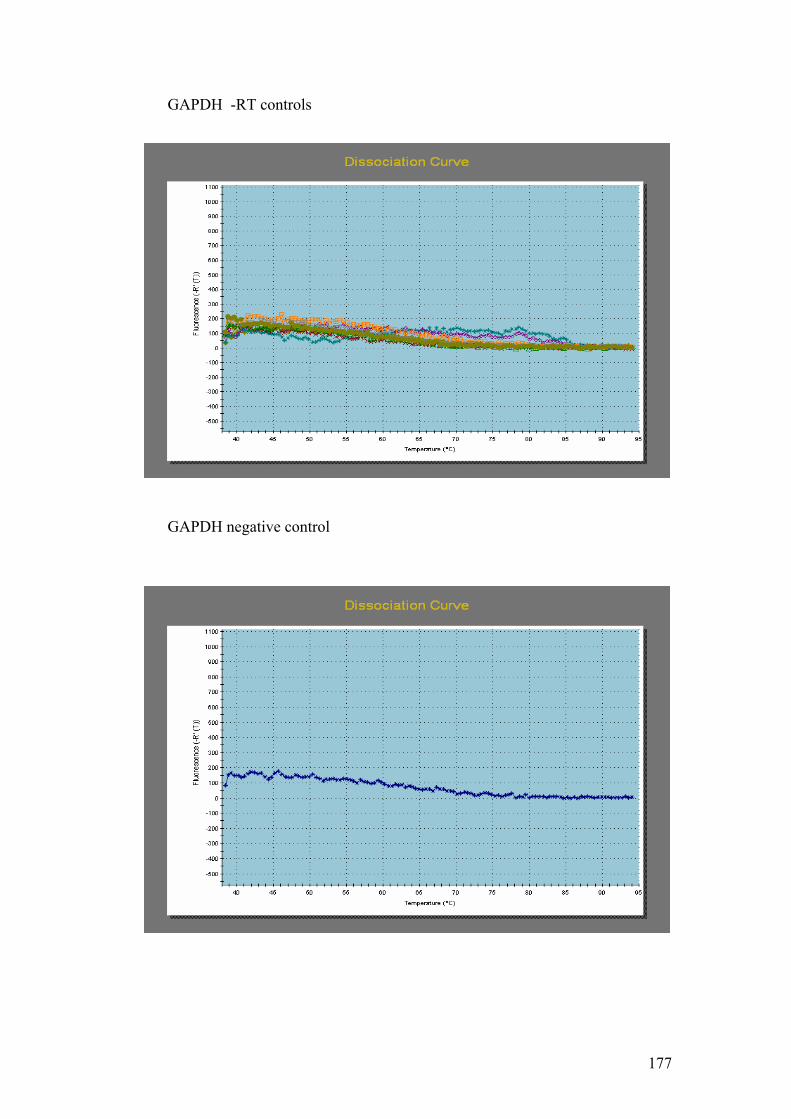
GAPDH -RT controls GAPDH negative control
177
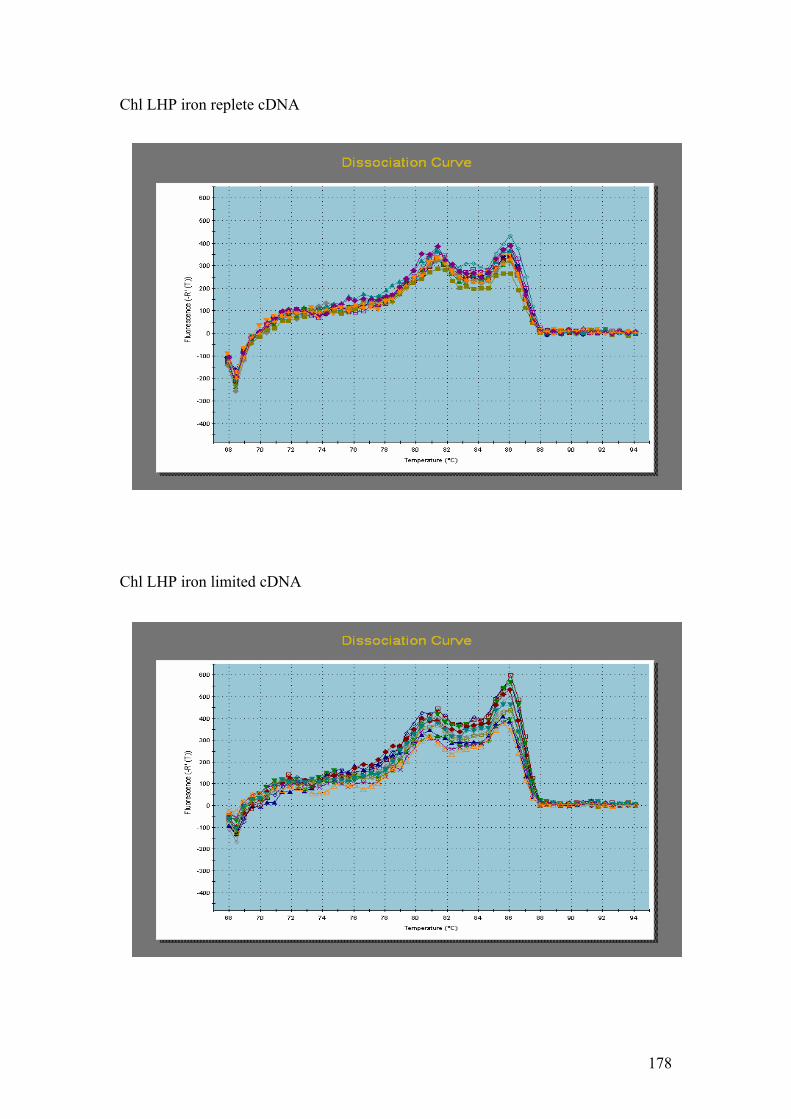
Chl LHP iron replete cDNA Chl LHP iron limited cDNA
178
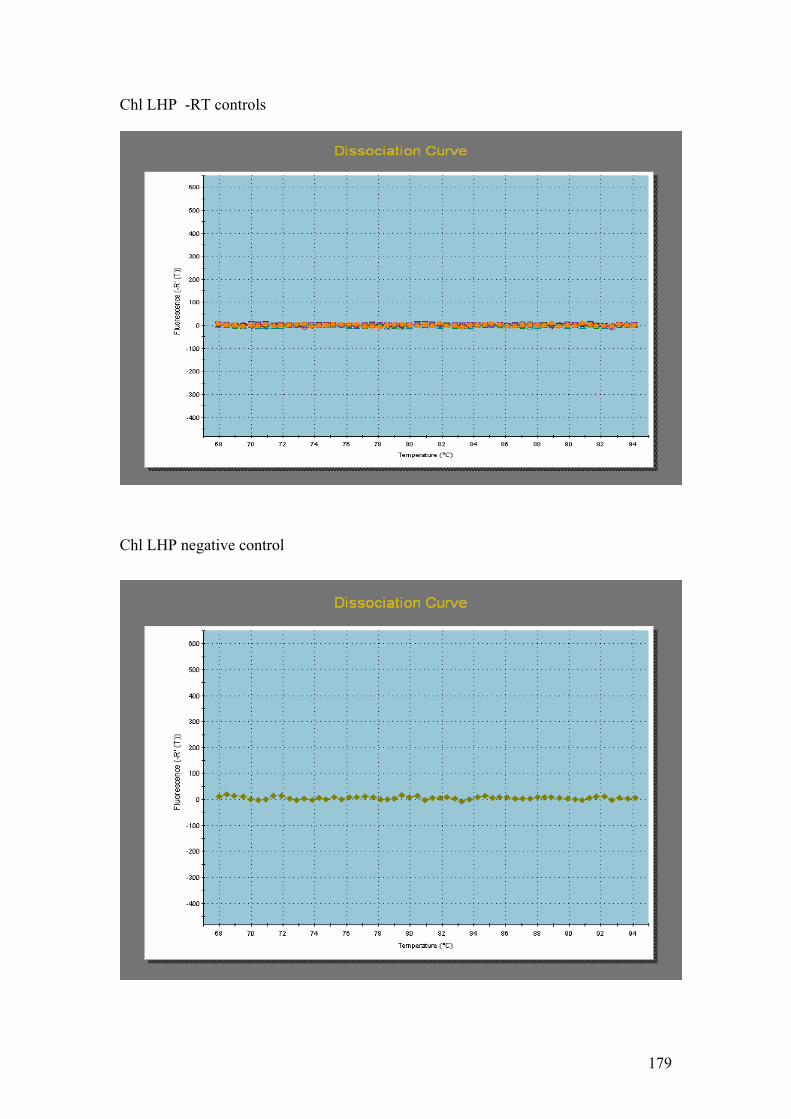
Chl LHP -RT controls Chl LHP negative control
179