accountability - colorado state university · colorado state university and the foundation of all...
TRANSCRIPT

ACCOUNTABILITY2016 Colorado State University Annual Report

T ransparency, responsibility, and integrity are core values of Colorado State University and the foundation of all we do. As one of the nation’s leading research universities and the campus that
enrolls and graduates more Colorado high school students than any other, we take seriously our obligation to play by the rules and uphold the public trust.
In doing so, we also work hard to return value to Colorado, in the form of skilled and educated citizens, statewide economic prosperity, and support for innovation and discovery.
This annual Accountability Report showcases how Colorado State University manages the assets in its care – and how we are leveraging those assets to benefit Colorado citizens. Included in these pages is a summary of our audited financial records: revenues, expenditures, liabilities, and assets. In addition, we provide information on our progress in private fund-raising now that we are well into a successful $1 billion comprehensive campaign (giving.colostate.edu).
Perhaps most important, this report highlights how well we are doing in fulfilling our mission as a public research university with a summary of performance and assessment data that includes information on student success and satisfaction. This year, we are happy to be able to include the latest data on our statewide economic impact, thanks to the research and analysis of Drs. Rebecca Hill, Harvey Cutler, Martin Shields, and doctoral student Bryanna Dixon.
We welcome your interest and are proud to share this information with you.
Sincerely,
Dr. Tony Frank President

COLORADO STATE University 1
Colorado State University is the
Top Choice in Colorado.More Colorado high-school graduates choose Colorado State than any other
college or university in the state.
For seven years, Colorado’s neediest students have paid
zero in tuition and fees to attend CSU,
thanks to our Commitment to Colorado program.
44% of CSU studentsgraduating in 2014-15 had
zero student loan debtwhen they earned their diplomas.
National studies show Colorado public research universities are
The Most Efficient in the Countrywhen it comes to the cost
of educating students.1
Less than 5% of CSU’s budget
is spent on institutional support (administration).
1: The National Center for Higher Education Management Systems; http://www.higheredinfo.org/dbrowser/?level=nation&mode=graph&state=0&submeasure=393
Accountable and AFFORDABLE

2 ACCOUNTABILITYReport 2016
ACCOUNTABILITY at Colorado StateThis annual report is intended to provide widespread public access to the financial results of Colorado State University. Additional resources are available online:
• CSU Accountability Website http://accountability.colostate.edu
• Budget Updates and Communications http://www.president.colostate.edu/budget/index.aspx
• CSU Policies and Compliance http://opc.prep.colostate.edu
• Institutional Research http://www.ir.colostate.edu
CONTENTSAccountability in Focus ............................................................................................................ 3
Institutional Quality .................................................................................................................... 4
Research Impact ........................................................................................................................ 5
Outcomes: A Stronger Colorado Economy .................................................................... 6
Service to the State .................................................................................................................. 8
The Shifting Burden for Public Higher Education ........................................................ 9
The Life Cycle of Colorado’s Investment in Higher Education .............................. 10
Your Tuition Check: Where Do Your Tuition Dollars Go? ............................................ 11
Funding Trends ......................................................................................................................... 12
State Support ............................................................................................................................. 17
The Cost to Students .............................................................................................................. 18
Private Support .......................................................................................................................... 19
Cash Transfer ............................................................................................................................. 21
Salary Trends ............................................................................................................................ 22
Revenues and Expenditures ............................................................................................... 23
Revenue ...................................................................................................................................... 25
Revenue Trends 2012-2016 ................................................................................................. 26
Expenditures ............................................................................................................................. 27
Expenditure Trends 2012-2016 .......................................................................................... 28
Assets .......................................................................................................................................... 29
Liabilities ....................................................................................................................................... 31
Budget and Planning Process ............................................................................................ 32

COLORADO STATE University 3
Accountability IN FOCUS
Affordability, Access, Success
44%of 2014-2015 graduates left CSU with
ZEROstudent debt
79%of CSU students who
graduate do so in
4.5 YRS
Affordability, Access, Success
86%of our graduates
secured employment or continuing education within
6 months of graduation.The average starting salary reported by graduates was approximately $47,000.
90%of CSU graduates said
they would choose
CSU AGAIN
Affordability, Access, Success
1 of 4CSU students isTHE FIRST in
their family to go to college
19%of CSU
students areDIVERSE
24%receivePELL
GRANTS
51%of CSU
students areWOMEN
77%receive
FINANCIAL AID
STUDENT: FACULTYratio is
18:1

4 ACCOUNTABILITYReport 2016
Institutional QUALITY
CSU graduate programsincluding occupational therapy,
veterinary medicine, engineering, business administration, and the
natural sciences rank among
The Best in the Country.
4 CSU faculty members in the National Academy of Sciences
6 CSU faculty members in the National Academy of Engineering
2 CSU faculty member in the American Academy of Arts and Sciences.
#1 CSU’s rank on the 2016 Sustainable Campus Index
– a ranking of the nation’s top-performing institutions
for sustainability.
CSU is one of only 16U.S. institutions that have
never had a major NCAA violation.
The University has
invested more than $1.3 billion
to improve campus academic, research, living, and events
facilities since 2010.
Colorado State University is a
Carnegie Research University(very high research activity) and a
Carnegie Community Engaged University
CSU is ranked in the
Top Tier of U.S. Universitiesin the U.S. News and World Report
annual ranking.
CSU is ranked among
The Top Universities in the World
in the Shanghai Jiao Tong Academic Ranking of
World Universities.
Colorado State is the
only university in Colorado designated as an Innovation and Economic Prosperity Universityby the Association of Public and
Land Grant Universities. This award recognizes extraordinary
contributions to advancing economic innovation and well-being in the
state, region, and country.
CSU tops all other Colorado campuses in
the state in private fundraising.
CSU has become
a national leader in its commitment to elevate
the stature of non-tenure- track (adjunct) facultythrough improvements to
compensation, work life, and representation in campus
governance.
#4 CSU’s rank on the Military Times Best for Vets
listing of all U.S. public universities for quality of veteran
education and services.
CSU graduates are
employed at a rate 10% higher than the
national average.

COLORADO STATE University 5
Research IMPACTColorado State University
continues to invest in entrepreneurship
and innovation– and our faculty
are national leaders in research productivity.
CSU ranks in the
Top 10%of research universities
nationwide for R&D,according to the National
Science Foundation.
FY 2016 Research Expenditures
> $332 millionColorado State continues to
rank second nationally in federal research funding
for universities without a medical school.
Awards from external sponsors for research were up 5% in Fiscal Year 2016 totaling
$282 millionCSU’s Vice President for Research has created a
Catalyst for Innovative Partnerships,
a program that now supports interdisciplinary teams tackling
grand societal and scientific challenges:
• Coalition for Development and Implementation of Sensor Systems
• Compatible Polymers Network
• Fort Collins Eco Districts
• Innovation Center for Sustainable Agriculture
• Institute for Genomic Architecture and Function
• Partnership for Air Quality, Climate, and Health
• Smart Village Microgrids
While the Federal government continues to provide 75% of
CSU’s research funding, other sectors (industry, nonprofits, higher education) continue to add diversity to our funding
portfolio. Non-federal research awards to CSU faculty research
•18.3% in 2016.
Since its creation 10 years ago, CSU Ventures has worked with students
and researchers to . . .
file 1,381 patent applications
sign 369 license agreements
establish 1,064 inventions
launch 49 start-up companies
CSU Ventures, the University’s tech-transfer
division, has tallied almost
$19 M in licensingincome over the last decade.

6 ACCOUNTABILITYReport 2016
Skilled Workforce
Nearly 1 in 25Colorado workers
has a CSU degree.
105,000 CSU alumnicurrently working in the state – in every Colorado county – earned an
estimated $5.54 billionfrom their jobs in 2015.
CSU alumni contribute more than
a quarter billion dollarsin income, sales, use, and excise tax
revenue to Colorado every year.
CSU operations and out-of-state student economic activity support
about 19K Colorado jobs and $188.3 million
in state income (individual and corporate) and sales tax revenue.
Of Colorado students graduating from CSU in the last 15 years,
nearly two-thirds remained in Colorado post-graduation.More than 40 percent of non-resident
students who graduated from CSU have remained in the state to work,
growing Colorado’s talent base.
Education fuels innovation:Entrepreneurs are more likely
to have a college degree.
Innovation and R&D
CSU research + innovationstrengthen a wide range of
Colorado businesses and industries.
CSU captures more than $300 million in annual research awards. This funding
translates into innovation that drives technological advances for Colorado businesses – and new discoveries in important, diverse sectors including
agriculture, engineering, biophysics, veterinary medicine, chemistry,
atmospheric sciences, and business.
In 2015, CSU-related research activities led to
49 patents awarded.
Over the past five years, CSU research activity has resulted in
200 licensing agreements with industry and nearly 30 new start-up corporations.
This level of productivity translates into
$34 million in additional state tax revenue.
Outcomes: A STRONGER COLORADO ECONOMY
COLORADO STATE University 7
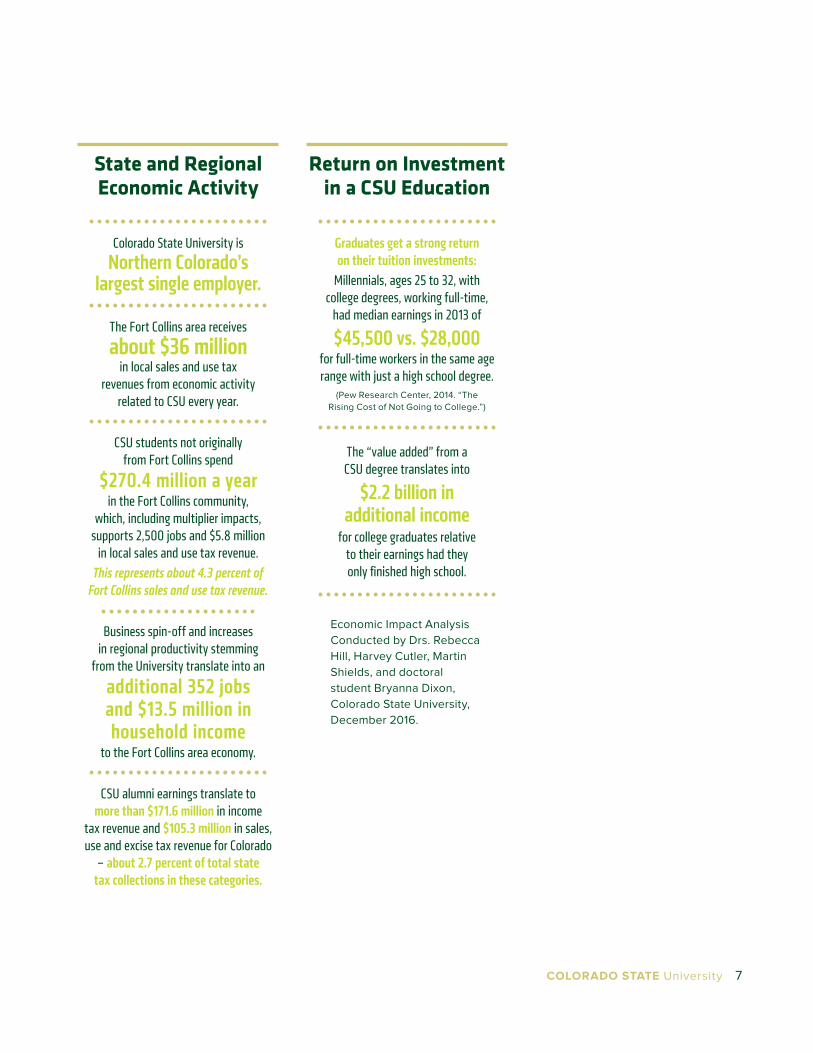
State and Regional Economic Activity
Colorado State University isNorthern Colorado’s
largest single employer.
The Fort Collins area receives
about $36 millionin local sales and use tax
revenues from economic activity related to CSU every year.
CSU students not originally from Fort Collins spend
$270.4 million a yearin the Fort Collins community,
which, including multiplier impacts, supports 2,500 jobs and $5.8 million
in local sales and use tax revenue.This represents about 4.3 percent of
Fort Collins sales and use tax revenue.
Business spin-off and increases in regional productivity stemming
from the University translate into an
additional 352 jobs and $13.5 million in household income
to the Fort Collins area economy.
CSU alumni earnings translate to more than $171.6 million in income
tax revenue and $105.3 million in sales, use and excise tax revenue for Colorado
– about 2.7 percent of total state tax collections in these categories.
Return on Investment in a CSU Education
Graduates get a strong return on their tuition investments:
Millennials, ages 25 to 32, with college degrees, working full-time,
had median earnings in 2013 of
$45,500 vs. $28,000for full-time workers in the same age range with just a high school degree.
(Pew Research Center, 2014. “The Rising Cost of Not Going to College.”)
The “value added” from a CSU degree translates into
$2.2 billion in additional income
for college graduates relative to their earnings had they only finished high school.
Economic Impact Analysis Conducted by Drs. Rebecca Hill, Harvey Cutler, Martin Shields, and doctoral student Bryanna Dixon, Colorado State University, December 2016.

8 ACCOUNTABILITYReport 2016
Service to THE STATE
The 2016 statewide survey of Colorado county commissioners indicated overall satisfaction with
CSU’s Extension programs. Although down slightly in 2016, scores in all four areas assessed have trended
consistently high since 2012. The areas assessed include: quality of CSU Extension programs and services; value of the services counties receive;
responsiveness and service levels of individual county offices; and overall satisfaction with service to citizens.
The county response rate to this year’s
survey was . . .
89%
CSU Extension now servesall 64 Colorado counties.

COLORADO STATE University 9
The Shifting Burden forPUBLIC HIGHER EDUCATION
Twenty years ago . . .
Today . . .
STATE’SCONTRIBUTION
STUDENT’SSHARE
STATE’SCONTRIBUTION
STUDENT’SSHARE
• The cost to educate a student at Colorado State University is only slightly higher than 20 years ago. (when adjusted for infl ation).
• But there has been a change in who pays: 20 years ago, the state of Colorado paid two-thirds of every student’s education, and students paid a third. Today, students and their families pay more than three quarters of the cost to attend a state university – and the state portion covers just under one quarter.
• In fact, private fundraising revenue has exceeded Colorado State University’s state funding since the 2012 fi scal year (in FY16, total private support exceeded $197 million, while state support was about $119 million). State funding makes up about 11.27 percent of CSU’s total operating budget.
• Strong state support of higher education is a great investment for Colorado. Over a lifetime, a CSU graduate will pay more than $10 in tax revenue for every dollar state taxpayers invest in his or her education.
• For the average student loan, The Brookings Institution reports that the return on investment is 15 percent annually – better than almost any other investment you can name.
10 ACCOUNTABILITYReport 2016
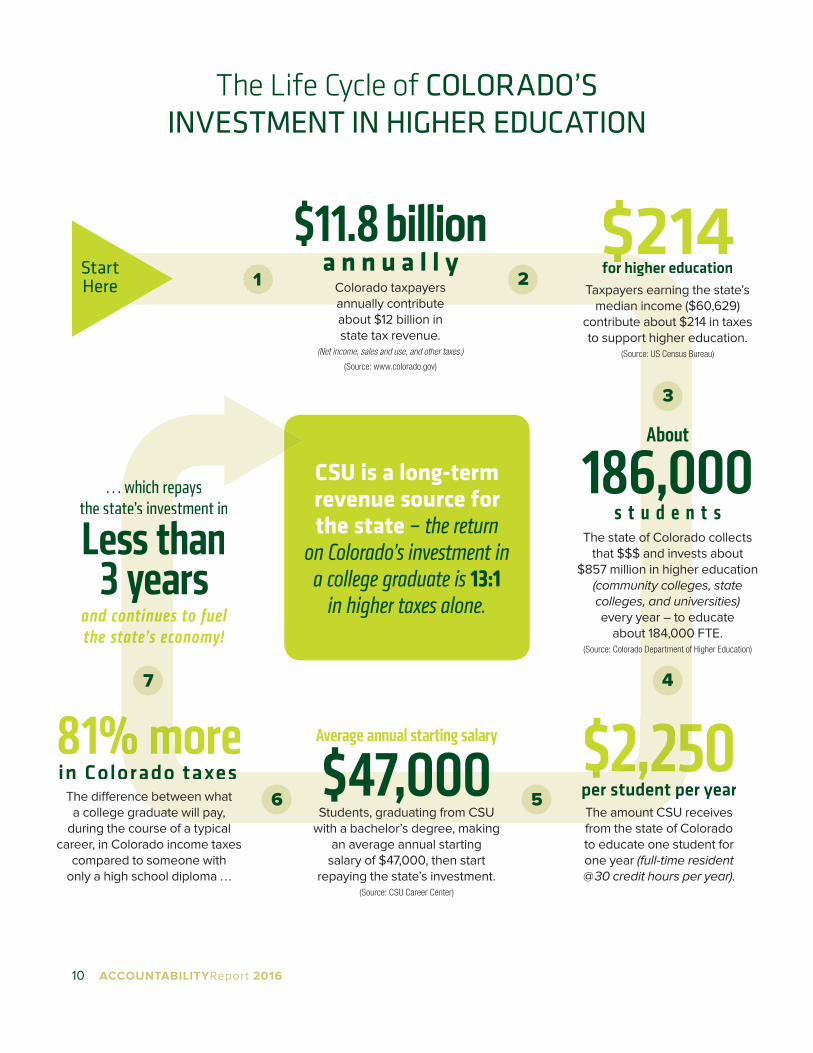
CSU is a long-termrevenue source for the state – the return
on Colorado’s investment in a college graduate is 13:1
in higher taxes alone.
The Life Cycle of COLORADO’S INVESTMENT IN HIGHER EDUCATION
. . . which repays. . . which repaysthe state’s investment inthe state’s investment in
Less thanLess than3 years3 years
and continues to fuel and continues to fuel the state’s economy!the state’s economy!
Colorado taxpayersannually contributeabout $12 billion instate tax revenue.
(Net income, sales and use, and other taxes.)
(Source: www.colorado.gov)
$11.8 billiona n n u a l l y
The amount CSU receives from the state of Colorado to educate one student for one year (full-time resident @ 30 credit hours per year).
$2,250$2,250$2,250$2,250$2,250$2,250$2,250$2,250per student per yearper student per year
The state of Colorado collects that $$$ and invests about
$857 million in higher education (community colleges, state colleges, and universities) every year – to educate
about 184,000 FTE.(Source: Colorado Department of Higher Education)
About
186,000s t u d e n t s
Students, graduating from CSU with a bachelor’s degree, making
an average annual starting salary of $47,000, then start
repaying the state’s investment.(Source: CSU Career Center)
Average annual starting salary
$47,000
1 2Taxpayers earning the state’s
median income ($60,629)contribute about $214 in taxes to support higher education.
(Source: US Census Bureau)
$214$214for higher educationfor higher education$214for higher education$214$214for higher education$214
3
4
5The di� erence between what a college graduate will pay,
during the course of a typical career, in Colorado income taxes
compared to someone with only a high school diploma . . .
81% 81% 81% 81% 81% 81% 81% 81% 81% 81% 81% 81% moremoremoremoremoremoremoremorein Colorado taxesin Colorado taxes
6
7
StartHere

COLORADO STATE University 11
Your Tuition Check:WHERE YOUR TUITION DOLLARS GO
Student Fees Support – Beyond the ClassroomStudent fees are charges that students choose to assess themselves for various services above and beyond what’s covered by tuition. Students retain some decision-making authority over how their fees are spent.
$1,664General Fees
Pays for student activities (concerts, lectures, movies); Student Recreation Center; Lory Student Center; CSU Health Network; athletics; veterans’ programs; student government; Transfort; counseling; and more.
$50University Tech Fee
Funds campus computer labs, library computing, and other technology services.
$623University Facility Fee
Funds classroom improvements, renovations, and construction of new, student-focused buildings.
Figures reflect annual costs for a full-time, resident student at 30 credit hours per year.
Your FY2016-2017 Tuition Check
$8,716(per year)
State Tax Support (COF)
$2,250(@ $75 per credit hour)
The Total CSU Receives
$10,966from tuition and the state to educate
one student for one year.
* Colorado State University FY16-17 Education and General Budget Data. This is a subset of the CSU Education and General Budget, from E&G Budget Data Book Expenditures by NACUBO Code. For total University expenditures, see Page 27.
The University spends this money on . . .
63% Instruction & Academic Support
9% Operation, Plant Maintenance, and Depreciation
10% Institutional Support
19% Student Services and Scholarships

12 ACCOUNTABILITYReport 2016
Public FTE Enrollment, Educational Appropriations, and Total Educational Revenue per FTE Colorado – Fiscal Years 1990-2015
Public universities in Colorado rely on two funding sources to educate students: tuition and taxpayer support provided through the state’s General Fund. The chart below shows how this balance has shifted over time.
NOTES: Data adjusted for inflation using the Higher Education Cost Adjustment (HECA). Full-time equivalent (FTE) enrollment equates student credit hours to full-time, academic year students, but excludes medical students. Educational appropriations are a measure of state and local support available for public higher education operating expenses including ARRA funds, and exclude appropriations for independent institutions, financial aid for students attending independent institutions, research, hospitals, and medical education. Net tuition revenue is calculated by taking the gross amount of tuition and fees, less state and institutional financial aid, tuition waivers or discounts, and medical student tuition and fees. Net tuition revenue used for capital debt service is included in the net tuition revenue figures above.
SOURCE: State Higher Education Executive O�cers
$0
$2,000
$4,000
$6,000
$8,000
$10,000
$12,000
$14,000
0
50
100
150
200
250
199
0
199
1
199
2
199
3
199
4
199
5
199
6
199
7
199
8
199
9
200
0
20
01
20
02
20
03
20
04
20
05
20
06
20
07
20
08
20
09
20
10
20
11
20
12
20
13
20
14
20
15
Dolla
rs p
er F
TE
Publ
ic F
TE E
nrol
lmen
t(T
hous
ands
)
Net Tuition Revenueper FTE (constant $)
Public FTE EnrollmentEducational Appropriationsper FTE (constant $)
$5
,82
9
$5
,70
1
$5
,474
$5
,417
$5
,46
6
$5
,56
9
$5
,89
3
$6
,09
1
$6
,166
$6
,169
$6
,22
9
$6
,370
$5
,96
3
$4,
531
$4,
121
$4,
184
$4,
50
0
$4,
615
$4,
726
$5
,112
$4,
82
5
$3,
871
$3,
22
8
$3,
195
$3,
420
$3,
95
6
$4,
106
$4,
329
$4,
59
6
$4,
88
4
$4,
92
5
$5
,09
7
$5
,28
5
$5
,275
$5
,273
$5
,30
4
$5
,137
$5
,22
1
$5
,35
0
$5
,272
$5
,98
8
$5
,715
$6
,167
$5
,838
$6
,26
1
$6
,637
$7,
08
1
$7,
547
$7,
841
$8
,32
3
$9
,182
$9
,06
1
Funding TRENDS

COLORADO STATE University 13
0%
5%
10%
15%
20%
25%
30%
35%
LOU
ISIA
NA
AR
IZO
NA
DEL
AW
AR
E
PEN
NS
YLV
AN
IA
NEV
AD
A
TEX
AS
NEW
HA
MP
SH
IRE
CO
LOR
AD
OO
KLA
HO
MA
NEW
JER
SEY
MIS
SIS
SIP
PI
TEN
NES
SEE
IDA
HO
CO
NN
ECTI
CU
T
KEN
TUC
KY
SO
UTH
CA
RO
LIN
A
VIR
GIN
IA
WA
SH
ING
TON
ALA
BA
MA
MIN
NES
OTA
WIS
CO
NS
IN
MIS
SO
UR
I
IOW
A
WES
T V
IRG
INIA
HA
WA
II
SO
UTH
DA
KO
TA
KA
NS
AS
VER
MO
NT
MIC
HIG
AN
FLO
RID
A
AR
KA
NS
AS
GEO
RG
IA
IND
IAN
A
U.S
.
MA
INE
NO
RTH
CA
RO
LIN
A
OR
EGO
N
MA
RY
LAN
D
RH
OD
E IS
LAN
D
NEW
YO
RK
UTA
H
OH
IO
MO
NTA
NA
ALA
SK
A
MA
SS
AC
HU
SET
TS
NEW
MEX
ICO
NEB
RA
SK
A
CA
LIFO
RN
IA
WY
OM
ING
NO
RTH
DA
KO
TA
ILLI
NO
IS¹
-2.4%
-28.5%
32.5%
NOTE: 1) For Illinois, a $1.08 billion back payment in FY 2015 to their historically underfunded higher education pension program resulted in past legacy pension funds accounting for 37% of all educational appropriations.
Dollars adjusted by 2015 HECA, Cost of Living Adjustment, and Enrollment Index.
SOURCE: State Higher Education Executive O�cers
-30%
-25%
-20%
-15%
-10%
-5%
Public Higher Education Educational Appropriations per FTEU.S. Percent Change – Fiscal Years 2010-2015
Funding TRENDS

14 ACCOUNTABILITYReport 2016
State Educational Appropriations per FTE Enrollment
2015 U.S. Average $6,966
2015 U.S. One-year Change $346
2015 U.S. Five-year Change – $170
2014 U.S. FTE Enrollment 11,136,560
Data are adjusted by HECA, COLA, and EMI.
$5,764
$5,248
$4,788
$7,379
$17,300
$8,522
$6,682
$6,062
$5,350
$14,112
$8,799
$8,405
$3,529
$7,766
$5,062
$8,202
$5,837
$7,521
$7,748
$5,695
$5,515
$6,102
$7,626
$5,564
$5,991
$5,097
$11,518 $5,142$5,078
$6,898
$7,051
$6,896 $5,774$7,490
$6,271
$5,077
$8,894
$5,542$4,911
$2,818
$8,830
$3,758
$8,024 $4,804
$5,766
$8,090$4,785$6,728
$2,591
$6,546
Funding TRENDS
SOURCE: State Higher Education Executive Officers

COLORADO STATE University 15
State Net Tuition Revenue per FTE Enrollment
2015 U.S. Average $6,006
2015 U.S. One-year Change $146
2015 U.S. Five-year Change $1,128
2014 U.S. FTE Enrollment 11,136,560
Data are adjusted by HECA, COLA, and EMI.
$5,503
$7,693
$5,535
$4,472
$4,150
$2,349$5,021
$3,033
$8,083
$7,331
$5,181
$3,725
$4,175
$6,688
$8,290
$5,372
$6,174
$5,904
$5,340
$7,740
$8,267
$5,498
$5,896
$5,349
$4,881
$5,237
$6,391
$11,413
$6,696$7,779
$6,722
$6,352
$10,098
$7,455$8,007
$4,583
$7,812
$4,365
$8,728
$13,496
$5,073
$9,843
$5,028$7,812
$8,077
$8,680
$13,763$7,819
$9,637
$3,188
Funding TRENDS
SOURCE: State Higher Education Executive Officers

16 ACCOUNTABILITYReport 2016
Educational Appropriations PER FTE (Constant Adjusted 2015 Dollars)
State FY 2008 (Pre-recession) FY 2010 FY 2014 FY 2015 1 Year %
ChangeIndex to US
Average5 Year % Change
% Change Since
RecessionALABAMA $9,300 $6,450 $5,732 $5,774 0.83 0.7% -10.5% -37.9%ALASKA $13,314 $13,238 $14,123 $14,112 2.03 -0.1% 6.6% 6.0%ARIZONA $8,325 $7,023 $5,404 $5,350 0.77 -1.0% -23.8% -35.7%ARKANSAS $8,150 $7,909 $7,571 $7,626 1.09 0.7% -3.6% -6.4%CALIFORNIA $9,024 $7,303 $7,837 $8,522 1.22 8.7% 16.7% -5.6%COLORADO $4,215 $4,304 $3,050 $3,529 0.51 15.7% -18.0% -16.3%CONNECTICUT $9,945 $9,374 $7,319 $8,090 1.16 10.5% -13.7% -18.6%DELAWARE $6,714 $6,145 $5,072 $4,804 0.69 -5.3% -21.8% -28.4%FLORIDA $8,622 $6,552 $5,881 $6,271 0.90 6.6% -4.3% -27.3%GEORGIA $9,428 $7,755 $7,239 $7,490 1.08 3.5% -3.4% -20.6%HAWAII $10,320 $9,049 $7,755 $8,405 1.21 8.4% -7.1% -18.6%IDAHO $10,647 $8,570 $7,083 $7,379 1.06 4.2% -13.9% -30.7%ILLINOIS1 $8,332 $8,695 $9,339 $11,518 1.65 23.3% 32.5% 38.2%INDIANA $5,592 $5,296 $5,319 $5,142 0.74 -3.3% -2.9% -8.0%IOWA $6,692 $5,985 $5,294 $5,515 0.79 4.2% -7.9% -17.6%KANSAS $7,025 $6,229 $5,725 $5,837 0.84 1.9% -6.3% -16.9%KENTUCKY $9,076 $7,905 $6,848 $6,898 0.99 0.7% -12.7% -24.0%LOUISIANA $9,470 $7,784 $5,521 $5,564 0.80 0.8% -28.5% -41.2%MAINE $7,323 $6,661 $6,380 $6,546 0.94 2.6% -1.7% -10.6%MARYLAND $8,721 $8,025 $7,666 $8,024 1.15 4.7% 0.0% -8.0%MASSACHUSETTS $8,028 $6,268 $6,167 $6,728 0.97 9.1% 7.3% -16.2%MICHIGAN $6,201 $5,339 $4,768 $5,097 0.73 6.9% -4.5% -17.8%MINNESOTA $7,141 $6,345 $5,379 $5,695 0.82 5.9% -10.2% -20.3%MISSISSIPPI $8,559 $8,059 $6,634 $6,896 0.99 3.9% -14.4% -19.4%MISSOURI $7,484 $6,628 $5,399 $6,102 0.88 13.0% -7.9% -18.5%MONTANA $5,169 $4,931 $4,901 $5,248 0.75 7.1% 6.4% 1.5%NEBRASKA $8,323 $7,465 $7,855 $8,202 1.18 4.4% 9.9% -1.5%NEVADA $10,194 $8,538 $7,023 $6,682 0.96 -4.9% -21.7% -34.5%NEW HAMPSHIRE $3,581 $3,198 $2,387 $2,591 0.37 8.5% -19.0% -27.6%NEW JERSEY $7,758 $6,757 $5,813 $5,766 0.83 -0.8% -14.7% -25.7%NEW MEXICO $10,696 $8,036 $8,245 $8,799 1.26 6.7% 9.5% -17.7%NEW YORK $9,065 $8,651 $8,577 $8,830 1.27 3.0% 2.1% -2.6%NORTH CAROLINA $11,112 $9,049 $8,695 $8,894 1.28 2.3% -1.7% -20.0%NORTH DAKOTA $5,748 $6,375 $7,861 $7,766 1.11 -1.2% 21.8% 35.1%OHIO $5,627 $4,780 $4,302 $5,078 0.73 18.0% 6.2% -9.8%OKLAHOMA $9,077 $8,874 $7,136 $7,521 1.08 5.4% -15.3% -17.1%OREGON $5,991 $4,840 $4,241 $4,788 0.69 12.9% -1.1% -20.1%PENNSYLVANIA $5,888 $4,806 $3,683 $3,758 0.54 2.0% -21.8% -36.2%RHODE ISLAND $6,226 $4,735 $4,665 $4,785 0.69 2.6% 1.1% -23.2%SOUTH CAROLINA $7,792 $5,807 $4,813 $5,077 0.73 5.5% -12.6% -34.8%SOUTH DAKOTA $6,063 $5,403 $4,916 $5,062 0.73 3.0% -6.3% -16.5%TENNESSEE $9,101 $8,212 $7,008 $7,051 1.01 0.6% -14.1% -22.5%TEXAS $9,548 $9,643 $8,132 $7,748 1.11 -4.7% -19.6% -18.8%UTAH $7,478 $5,780 $5,554 $6,062 0.87 9.2% 4.9% -18.9%VERMONT $3,180 $2,968 $2,827 $2,818 0.40 -0.3% -5.0% -11.4%VIRGINIA $6,547 $5,540 $4,832 $4,911 0.71 1.6% -11.3% -25.0%WASHINGTON $7,757 $6,480 $5,801 $5,764 0.83 -0.6% -11.0% -25.7%WEST VIRGINIA $7,490 $5,999 $5,489 $5,542 0.80 1.0% -7.6% -26.0%WISCONSIN $7,162 $6,552 $5,888 $5,991 0.86 1.8% -8.6% -16.3%WYOMING $16,716 $14,629 $15,820 $17,300 2.48 9.4% 18.3% 3.5%U.S. $8,220 $7,135 $6,620 $6,966 1.00 5.2% -2.4% -15.3%
NOTES:
1) For Illinois, a $1.08 billion back payment in FY 2015 to their historically underfunded higher education pension program resulted in past legacy pension funds accounting for 37% of all educational appropriations.
Educational appropriations are a measure of state and local support available for public higher education operating expenses including ARRA funds, and exclude appropriations for independent institutions, financial
aid for students attending independent institutions, research, hospitals, and medical education.
Adjustment factors, to arrive at constant dollar figures, include Cost of Living Adjustment (COLA), Enrollment Mix Index (EMI),and Higher Education Cost Adjustment (HECA).The Cost of Living Adjustment (COLA) is not a measure of inflation over time.
SOURCE: State Higher Education Executive Officers
COLORADO STATE University 17
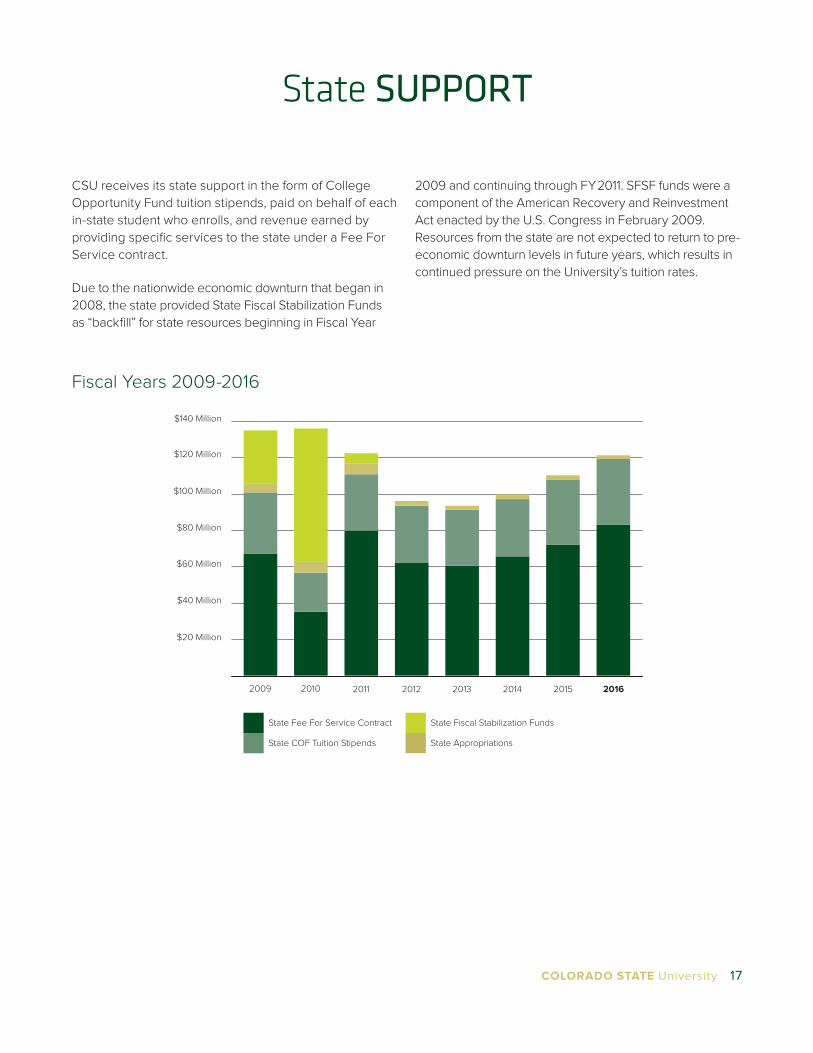
CSU receives its state support in the form of College Opportunity Fund tuition stipends, paid on behalf of each in-state student who enrolls, and revenue earned by providing specific services to the state under a Fee For Service contract.
Due to the nationwide economic downturn that began in 2008, the state provided State Fiscal Stabilization Funds as “backfill” for state resources beginning in Fiscal Year
2009 and continuing through FY 2011. SFSF funds were a component of the American Recovery and Reinvestment Act enacted by the U.S. Congress in February 2009. Resources from the state are not expected to return to pre-economic downturn levels in future years, which results in continued pressure on the University’s tuition rates.
Fiscal Years 2009-2016
2015 20162009 2010 2011 2012 2013 2014
$140 Million
$100 Million
$120 Million
$20 Million
$40 Million
$60 Million
$80 Million
State COF Tuition Stipends State Appropriations
State Fiscal Stabilization FundsState Fee For Service Contract
State SUPPORT

18 ACCOUNTABILITYReport 2016
The Cost to STUDENTS
PEER INSTITUTION COMPARISON: Tuition, Fees, Room and Board – Academic Year 2016-2017Based on 12 credit hours per term.
COLORADO FOUR-YEAR INSTITUTION COMPARISON: Tuition, Fees, Room and Board – Academic Year 2016-2017
TuitionFull-Time Undergraduate Total
Institution Resident Nonresident Fees Room and Board* Resident Nonresident
Colorado School of Mines 15,690 34,020 2,152 11,477 29,319 47,649
University of Colorado, Boulder 9,768 33,316 1,945 13,590 25,303 48,851
Colorado State University $8,716 $26,010 $2,212 $11,110 $22,038 $39,332
University of Colorado, Denver 7,536 23,232 1,348 12,061 20,945 36,641
University of Colorado, Colo. Spgs. 6,624 17,352 1,418 10,998 19,040 29,768
University of Northern Colorado* 6,606 17,652 1,892 10,969 19,467 30,513
Fort Lewis 6,360 16,072 1,744 10,904 19,008 28,720
Western State Colorado University 6,312 17,616 2,881 9,446 18,639 29,943
Colorado Mesa University 6,058 15,624 658 9,489 16,205 25,771
CSU - Pueblo 5,815 17,481 1,800 9,636 17,251 28,917
Adams State University 5,736 16,752 3,714 8,500 17,950 28,966
Metropolitan State University* 5,693 18,859 1,237 10,845 17,775 30,941
* Metro State is a commuter campus. Room and Board is represented by a private residential facility that also provides board options. The facility is linked on the Metro State website: (“The Regency” http://www.msudenver.edu/contact/faq/housing/). Also, as of FA15 CU Denver no longer requires students to reside at “Campus Village.” However, costs reported are for Campus Village.
Resident Nonresident
Institution Tuition and Fees
Room and Board
Cost of Attendance (TF+RB)
Tuition and Fees
Room and Board
Cost of Attendance (TF+RB)
University of Illinois, Urbana $15,698 $11,308 27,006 $31,320 $11,308 42,628
U.C. Davis* $14,046 $14,973 29,019 $40,728 $14,973 55,701
Virginia Tech $12,852 $8,624 21,476 $29,371 $8,624 37,420
University of Tennessee $12,724 $10,238 22,962 $30,914 $10,238 40,946
University of Colorado $11,713 $13,590 25,303 $35,261 $13,590 48,851
Michigan State University $11,306 $10,334 21,640 $30,368 $10,334 40,702
Oklahoma State University $11,023 $10,330 21,353 $25,145 $10,330 35,475
Washington State University $10,984 $11,356 22,340 $25,550 $11,356 36,906
Colorado State University $10,928 $11,110 $22,038 $28,222 $11,110 $39,332
Texas A & M University $10,030 $10,368 20,398 $30,208 $10,368 40,576
Purdue University $10,002 $10,258 20,260 $28,804 $10,258 39,062
North Carolina State U. $8,880 $9,650 18,530 $26,399 $9,650 36,049
Oregon State University* $8,683 $11,037 19,720 $23,608 $11,037 34,645
Iowa State University $8,219 $8,764 16,983 $21,583 $8,764 30,347
Kansas State University $8,071 $9,350 17,421 $19,992 $9,350 29,342
*Quarter system tuition and fees - AY based on Autumn/Fall, Winter, Spring quarters.Note: Texas A&M tuition and fees were unavailable individually. Also, University of Tennesseeand Virginia Tech have additional out-of-state fees that were added in to the cost of attendance.

COLORADO STATE University 19
Gifts$197,822,651
$111,568,051 $112,472,823
$143,239,094
$172,315,466
201620132012 20152014
Private SUPPORT
Private Support vs. State Support
0
$20 Million
$40 Million
$60 Million
$80 Million
$100 Million
$120 Million
$140 Million
$160 Million
$180 Million
$200 Million
FY11 FY12 FY13 FY14 FY15 FY16
State SupportPrivate Support
With the launch of the $1 billion “State Your Purpose” campaign in Fiscal Year 2016, Colorado State continued to shatter past
records for fundraising and alumni involvement. In the year ending June 30, 2016, 38,696 donors gave a record-breaking $197.8 million in cash, pledges, planned gifts, and gifts-in-kind to support the University.
Once again this year, CSU raised more private funds than any single campus in the history of Colorado. And at 10.71%, alumni participation is at its highest rate in the University’s lifetime.

20 ACCOUNTABILITYReport 2016
Alumni DonorsGifts from CSU undergraduate alumni have increased in each of the past five years.
10,89011,872
12,59013,765
17,408
20162012 2013 2014 2015
Donors
20162015201420132012
31,690
33,614 33,71634,199
38,696Accountability to donors is a high priority for Colorado State – when a donor gives to CSU, their donation goes only to the causes that they intend to support. At no time does the University re-direct gifts from one fund to another without donor approval. Like nearly all charitable organizations, including 60% of peer universities, Colorado State charges a small administrative fee on each gift to support the real cost of processing and managing the distribution of gift funds. The 5% CSU fee is in keeping with CSU’s goal that fundraising pay its own way so that we can keep state and tuition dollars focused on the classroom and student support.
Support by Purpose in FY2016
Research and Technology gifts enable the University to support research enterprise, promote scholarship and artistry, and address global challenges.
Through student organizations, internships, and education abroad, the Undergraduate Experience remains a top priority for both CSU and our donors.
Gifts to Student Support areas benefit our students through scholarships and graduate fellowships. As state support decreases and more of the burden of tuition falls to our students, scholarships continue to help maintain an avenue to access, an important part of our land-grant mission.
Private support for Facilities at CSU enables the University to provide an environment conducive to learning and research that keeps our students and faculty at the cutting edge of innovation and discovery.
Support by Source in FY2016 ( % in value)
Colorado State continues to rely more on gifts from individuals than any other source.
Individuals59%
Corporations18.6%
Foundations11.6%
Organizations10.3%
Other 0.5%
Facilities36.1%
Student Support25.3%
Researchand
Technology24%
UndergraduateExperience
14.6%

COLORADO STATE University 21
The Colorado State University Foundation is a not-for-profit corporation created to assist in the promotion, development, and enhancement of the facilities and educational programs and opportunities of the faculty, students, and alumni of Colorado State University. CSUF receives, manages, and invests contributions, gifts, and bequests and applies the principal or income generated therefrom exclusively for charitable, scientific, literary, or educational purposes that will, directly or indirectly, benefit Colorado State.
CSUF functions as Colorado State University’s bank. Its goal is to enhance the purchasing power of the University’s endowment while achieving the maximum total return consistent with the safety of the principal.
CSUF’s board of directors has the fiduciary responsibility for the management and investment of charitable gifts for Colorado State University. The investment objectives of CSUF are designed to respond to changes in the economic environment, philosophy of the University and CSUF, and market conditions.
Cash TRANSFER:From the Colorado State University Foundation
to Colorado State University
$23,839,044
$30,666,313
$41,335,939
$50,452,336 $52,384,743
$48,010,854
$10 Million
$20 Million
$30 Million
$40 Million
$50 Million
FY2011 FY2012 FY2013 FY2014 FY2015 FY2016

22 ACCOUNTABILITYReport 2016
The chart below shows how CSU’s salary dollars are allocated. In response to the economic downturn of the last decade, the University imposed a multiyear hiring freeze in 2008. Faculty and sta° did not receive pay increases in Fiscal Years 2010, 2011, and 2012; increases since that time have varied. The University’s permanent, full-time workforce was reduced by about 6 percent during the recession, largely through attrition.
Salary TRENDS
Fiscal Years 2012-2016
$50 Million
0
$100 Million
$150 Million
$200 Million
$250 Million
Auxiliary Enterprises
Instruction andAcademic Support
Public Service
Research
Institutional SupportOperations andPlant ManagementStudent ServicesScholarships andFellowships
2012 2013 2014 2015 2016

COLORADO STATE University 23
The charts in this section illustrate the University’s sources of funding and how those funds are spent in support of the University’s mission. As a land-grant university, Colorado State is charged to serve the state in three primary ways:
education of students, conduct of research to support the needs of our society and our world, and outreach to extend the University’s educational and research capacity to areas of statewide need.
Revenues and EXPENDITURES
Operating and Nonoperating Revenues(amounts expressed in thousands, as restated)
2016 2015 2012Operating revenues
Student tuition and fees (net of scholarship allowance) $ 354,8351 327,4232 253,8113
State COF tuition stipends 36,3281 36,1712 31,5943
State fee for service contract 82,681 71,706 62,054
Grants and contracts 278,955 261,659 318,878
Sales and service of educational activities 37,738 33,750 25,046
Auxiliary enterprises (net of scholarship allowance) 155,275 144,810 125,701
Other operating revenue 7,630 6,662 5,802
Total operating revenues $ 953,442 882,181 822,886
Nonoperating revenues
State appropriations $ 2,144 2,355 2,450
Gifts, capital gifts and grants 60,882 74,970 91,809
Federal nonoperating grants and contracts 23,693 23,989 24,006
State capital contributions 16,211 3,084 360
Other nonoperating 11,059 13,432 12,263
Total nonoperating revenues $ 113,989 117,830 130,888
Extraordinary items
Extraordinary items – – 1,153
Total extraordinary items – – 1,153
Total revenues $ 1,067,431 1,000,011 954,927
Total Tuition and Fees ∑1 = 391,163 ∑2 = 363,594 ∑3 = 285,405

24 ACCOUNTABILITYReport 2016
Operating Expenses(amounts expressed in thousands, as restated)
2016 2015 2012Operating expenses
Instruction $ 270,439 261,240 206,446
Research 194,049 186,132 186,384
Public service 101,571 90,495 131,909
Academic support 75,958 71,354 54,074
Student services 31,305 29,482 23,080
Institutional support 48,321 45,299 33,454
Operation and maintenance of plant 65,927 67,844 53,250
Scholarships and fellowships 10,832 9,952 8,098
Auxiliary enterprises 133,761 130,258 112,449
Depreciation 87,777 82,575 59,944
Other – – –
Total operating expenses $ 1,019,940 974,631 869,088
Revenue, Expenses, and Changes in Net Position(amounts expressed in thousands, as restated)
2016 2015 2012Operating revenues $ 953,442 882,181 822,886
Operating expenses 1,019,940 974,631 869,088
Operating loss (66,498) (92,450) (46,202)
Nonoperating revenues (net of expenses) 56,232 59,146 51,064
Income (loss) before other revenues (net of expenses) (10,266) (33,304) 4,862
Other revenues 28,563 33,115 60,237
Special items – – –
Extraordinary items – – 1,153
Increase in Net Position 18,297 (189) 66,252
Net Position, beginning of year 343,757 792,245 726,654
Change in accounting principle $ – (448,299) –
Net Position, end of year $ 362,054 343,757 792,906

COLORADO STATE University 25
Revenue
Colorado State University’s academic program is primarily funded by two sources: state support (in the form of College Opportunity Fund stipends and Fee For Service funding) and student tuition and fees.
Large segments of the total University budget (including research and donor funding) generate revenue that is directed to a specific activity – to fund a particular research project or to endow a chair or scholarship, for example – and so these funds do not flow directly to the education and general budget that supports the core teaching operations of the University.
The state provides the College Opportunity Fund stipends to all in-state college students, and these stipends are then paid out to the university in which each student chooses to enroll. The University also receives
state support in the form of revenue generated from the state Fee For Service contract. Under this contract, the University provides graduate education services, Professional Veterinary Medicine programs, and services to the citizens of the state from the CSU agencies that include CSU Extension, Agricultural Experiment Station, and the Colorado State Forest Service.
A small subset of University operations, including the Lory Student Center, Housing and Dining Services, and continuing and distance education, are self-supporting auxiliary enterprises funded through charges assessed to users of those services.
Fiscal Year 2016
Other Revenue 2%
State Support 11%
Gifts andCapital Gifts 6%
Auxiliary and OtherSales/Services Revenue18%
Student Share ofTuition and Fees
33%
Grants andContracts
28%
State CapitalContributions 2%

26 ACCOUNTABILITYReport 2016
Revenue Trends 2012-2016The distribution among revenue categories has remained relatively consistent from year to year, as demonstrated by the chart “Revenue by Percentage” below.
The areas reflected within the bottom chart experiencing the greatest changes are the combination of the Student
Share of Tuition and Fees along with State Support. Although when combined they are relatively stable, individually State Support is declining while the Student Share of Tuition is increasing.
Revenue by Amount
Student Share of Tuition and Fees(Net of scholarship allowances)
State Support
Grants
Auxiliary
Other Revenue
Gifts and Capital Gifts
State Capital Contributions
$200 Million
$400 Million
$600 Million
$800 Million
$1 Billion
$1.2 Billion
FY2013 FY2015FY2014FY2012 FY2016
FY2013
FY2014
FY2015
FY2016
FY2012
0% 20% 40% 60% 80% 100%
Revenue by Percentage
Student Share of Tuition and Fees(Net of scholarship allowances)
State Support
Grants
Auxiliary
Other Revenue
Gifts and Capital Gifts
State Capital Contributions

COLORADO STATE University 27
Even during tight budget times, Colorado State University has focused on academic priorities: teaching (funded by tuition and state support) and research (funded primarily by grants and contracts). Administrative costs – shown here as Institutional Support – account for 5 percent of the University’s budget.
Fiscal Year 2016
ExpendituresAs the University has grown over the past five years, the University’s total operating expenses have increased from $869.0 million to $1,019.9 million, an overall increase of about 17 percent from Fiscal Year 2012 to Fiscal Year 2016. The largest component of each category of expenditure is salary, which is depicted further in the two salary charts shown at the bottom of the page.
Academic Support 7%
Student Services 3%
Institutional Support 5%
Operation andMaintenance of Plant 6%
Scholarships 1%
Public Service 10%
Depreciation and Other 11%
Instruction 26%
Research 18%
Auxiliary Enterprises 13%
2012
Fiscal Years 2012 and 2016
Salary Expenditures by Functional Area
2016
Research 24%
Instruction andAcademic Support 42%
Auxiliary Enterprises 11%
Student Services 3%
Institutional Support 7%
Operation andMaintenance of Plant 6%
Public Service 7%
Research 24%
Instruction andAcademic Support 42%
Auxiliary Enterprises 11%
Student Services 3%
Institutional Support 7%
Operation andMaintenance of Plant 5%
Public Service 8%

28 ACCOUNTABILITYReport 2016
Expenditures by Percentage
Expenditure Trends 2012-2016
Expenditures by Amount
Although the expenditure base is growing, as demonstrated in the chart “Expenditures by Amount,” the distribution among the expenditure categories has remained relatively constant between 2012 and 2016, as shown by the chart “Expenditures by Percentage.”
$200 Million
$400 Million
$600 Million
$800 Million
$1 Billion
$1.2 Billion
Instruction
Academic Support
Research
Public Service
Student Services
Institutional Support
Operation and Maintenance of Plant
Scholarships
Auxiliary
Depreciation and Other
Unusual Items
FY2012 FY2013 FY2014 FY2015 FY2016
0% 20% 40% 60% 80% 100%
FY2013
FY2014
FY2015
FY2016
FY2012
Instruction
Academic Support
Research
Public Service
Student Services
Institutional Support
Operation and Maintenance of Plant
Scholarships
Auxiliary
Depreciation and Other
Unusual Items

COLORADO STATE University 29
AssetsWhile the charts and graphs of revenue and expenditures provide information about activities occurring within each fiscal year, the schedules of our assets, liabilities, and net
position, below and on Pages 30 and 31, provide a fiscal snapshot of the University as of the end of each fiscal year presented.
(amounts expressed in thousands, as restated)
2016 2015 2012Current assets
Cash and cash equivalents $ 360,603 289,898 331,247
Student accounts receivable, net 25,948 23,590 18,128
Grants and other accounts receivable, net 55,204 47,000 100,352
Student loans receivable, net 2,820 2,602 2,639
Inventories 8,154 8,205 8,572
Prepaid expenses 6,456 6,874 11,620
Total current assets $ 459,185 378,169 472,558
Noncurrent assets
Restricted cash and cash equivalents $ 293,203 362,956 193,463
Restricted investments 25,248 25,470 22,483
Student loans receivable, net 18,048 18,003 17,543
Other noncurrent assets 11,021 11,154 20,140
Nondepreciable capital assets
Land 36,982 31,634 24,240
Construction in progress 313,674 81,265 114,706
Collections 4,624 3,283 2,093
Total nondepreciable capital assets $ 355,280 116,182 141,039
Depreciable capital assets
Land improvements 29,734 28,373 27,211
Building and improvements 898,595 914,981 645,883
Leasehold improvements 870 2,182 889
Equipment 84,893 97,219 102,517
Library materials 5,087 5,763 10,182
Total depreciable capital assets, (net of A/D) $ 1,019,179 1,048,518 786,682
Total noncurrent assets $ 1,721,979 1,582,283 1,181,350
Deferred outflows of resources
Loss on bond refundings 32,215 34,266 7,562
Deferred outflows - pensions 60,709 21,829 -
Total deferred outflows of resources 92,924 56,095 7,562
Total assets and deferred outflows of resources $ 2,274,088 2,016,547 1,661,470

30 ACCOUNTABILITYReport 2016
Colorado State University includes:• The 586-acre Main Campus, which includes 101 acres
for the James L. Voss Veterinary Teaching Hospital• 1,433-acre Foothills Campus• 1,575-acre Agricultural Campus• 1,177-acre Pingree Park mountain campus• 4,038 acres of land for research centers and Colorado
State Forest Service stations outside of Larimer County.
The University has Library holdings including more than 2.3 million books, bound journals, and government documents, along with additional materials including computers. Given limits on the state’s ability to provide funding for capital construction and improvements in recent years, the University’s students voted in 2005 to assess themselves a University Facility Fee to support capital construction and renovations that enhance the quality of student life and learning. The allocation of that fee is governed by a student-run University Facility Fee Advisory Board (http://u°ab.colostate.edu).
Fiscal Year 2016 Total Assets
Fiscal Year 2016 Capital Assets
Capital Assets 60%
Cash 16%
Restricted Cash 14%
Receivables 5%
Other 1%
Deferred Outflows 4%
Buildings andImprovements 65%
Construction inProgress 23%
Equipment 6%
Library Materialsand Collections 1%
Land and Improvements 5%
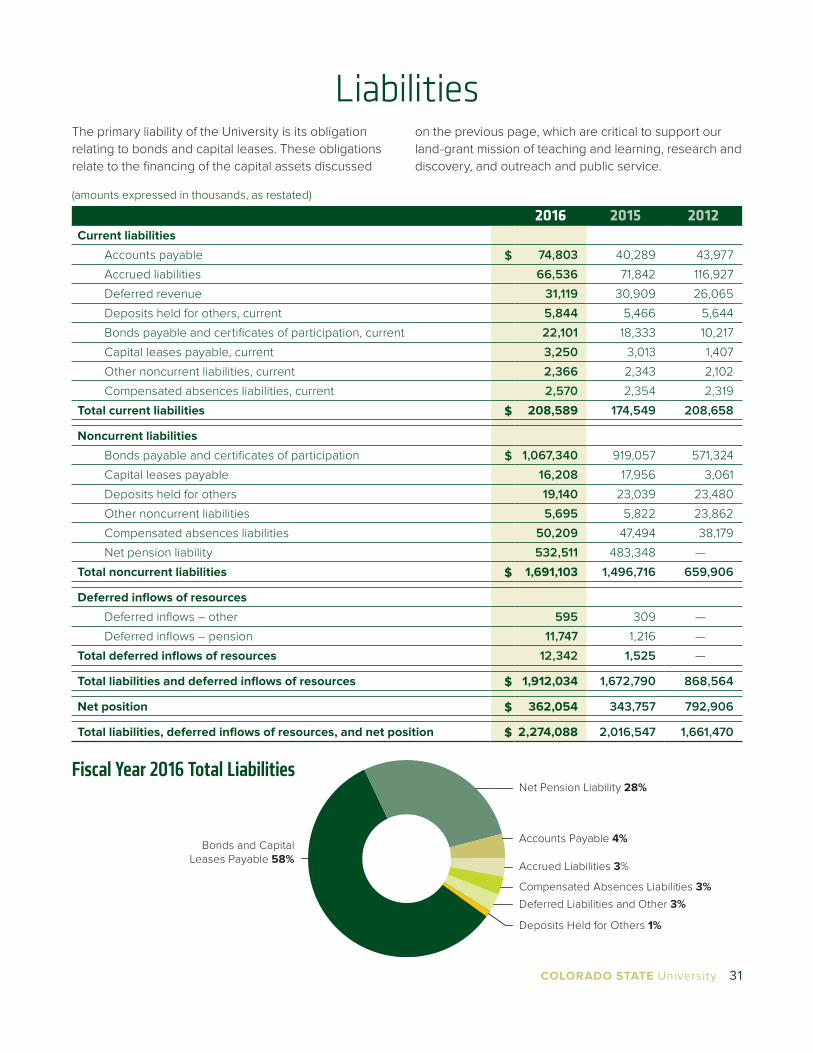
COLORADO STATE University 31
Fiscal Year 2016 Total Liabilities
LiabilitiesThe primary liability of the University is its obligation relating to bonds and capital leases. These obligations relate to the financing of the capital assets discussed
on the previous page, which are critical to support our land-grant mission of teaching and learning, research and discovery, and outreach and public service.
Accrued Liabilities 3%
Net Pension Liability 28%
Compensated Absences Liabilities 3%
Deposits Held for Others 1%
Deferred Liabilities and Other 3%
Accounts Payable 4%Bonds and Capital
Leases Payable 58%
(amounts expressed in thousands, as restated)
2016 2015 2012Current liabilities
Accounts payable $ 74,803 40,289 43,977
Accrued liabilities 66,536 71,842 116,927
Deferred revenue 31,119 30,909 26,065
Deposits held for others, current 5,844 5,466 5,644
Bonds payable and certificates of participation, current 22,101 18,333 10,217
Capital leases payable, current 3,250 3,013 1,407
Other noncurrent liabilities, current 2,366 2,343 2,102
Compensated absences liabilities, current 2,570 2,354 2,319
Total current liabilities $ 208,589 174,549 208,658
Noncurrent liabilities
Bonds payable and certificates of participation $ 1,067,340 919,057 571,324
Capital leases payable 16,208 17,956 3,061
Deposits held for others 19,140 23,039 23,480
Other noncurrent liabilities 5,695 5,822 23,862
Compensated absences liabilities 50,209 47,494 38,179
Net pension liability 532,511 483,348 —
Total noncurrent liabilities $ 1,691,103 1,496,716 659,906
Deferred inflows of resources
Deferred inflows – other 595 309 —
Deferred inflows – pension 11,747 1,216 —
Total deferred inflows of resources 12,342 1,525 —
Total liabilities and deferred inflows of resources $ 1,912,034 1,672,790 868,564
Net position $ 362,054 343,757 792,906
Total liabilities, deferred inflows of resources, and net position $ 2,274,088 2,016,547 1,661,470
32 ACCOUNTABILITYReport 2016
CSU’s Budget and Planning Process: Opportunities for Student, Parent, and Public Input
Budget and PLANNING PROCESS
Part of CSU’s commitment to accountability involves an open, public campus planning and budgeting process.
• The University publishes a rough draft budget in August for the next fiscal year. The goal of this draft budget is to give the Board of Governors and the President platforms for campus review and discussion – and for working with state lawmakers as they consider higher education’s funding needs.
• The campus and community have several opportunities to provide input into both the draft budget and the preparation of more final budgets in the winter and spring. Over this time period, the University also makes adjustments for changes and developments that have arisen.
• As various draft budgets are developed, they are tied to University strategic planning e°orts in a transparent and coherent way.
• The Colorado General Assembly and the O´ce of the Governor work together throughout the spring each year to finalize state budgets and appropriations, which determine the level of state support and tuition that the Board of Governors of the CSU System approves for each System campus.
• The CSU strategic plan is updated regularly to reflect new priorities, new environments, new opportunities, and new ideas.
As part of this process, the University Provost each spring hosts planning and budget hearings that are open to all interested members of the campus and community. Draft budgets and related communications are also regularly updated and posted online at http://www.president.colostate.edu/budget/index.aspx.


An equal-access and equal-opportunity University
accountability.colostate.edu