accounting for differential membership interests (“tax
TRANSCRIPT
Accounting for Differential Membership Interests(“Tax Equity Transactions”)

2
• Why is Tax Equity Important to NextEra?
• Overview of Typical Tax Equity Structures
• Baseline All-Equity (Unlevered) View
• Financial Statement Impact
• Appendix – Change in Income Statement Classification December 31, 2012
Agenda
3
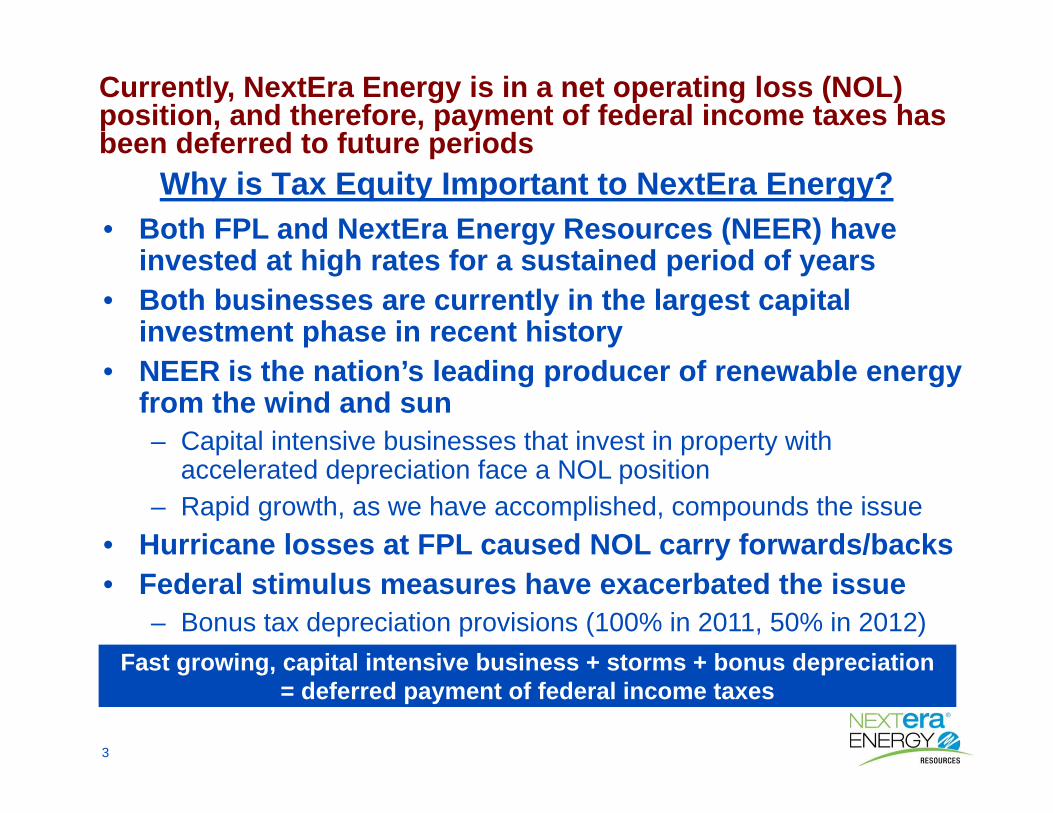
• Both FPL and NextEra Energy Resources (NEER) have invested at high rates for a sustained period of years
• Both businesses are currently in the largest capital investment phase in recent history
• NEER is the nation’s leading producer of renewable energy from the wind and sun– Capital intensive businesses that invest in property with
accelerated depreciation face a NOL position– Rapid growth, as we have accomplished, compounds the issue
• Hurricane losses at FPL caused NOL carry forwards/backs• Federal stimulus measures have exacerbated the issue
– Bonus tax depreciation provisions (100% in 2011, 50% in 2012)
Currently, NextEra Energy is in a net operating loss (NOL) position, and therefore, payment of federal income taxes has been deferred to future periods
Why is Tax Equity Important to NextEra Energy?
Fast growing, capital intensive business + storms + bonus depreciation = deferred payment of federal income taxes
4
• Why is Tax Equity Important to NextEra?
• Overview of Typical Tax Equity Structures
• Baseline All-Equity (Unlevered) View
• Financial Statement Impact
• Appendix – Change in Income Statement Classification December 31, 2012
Agenda
5
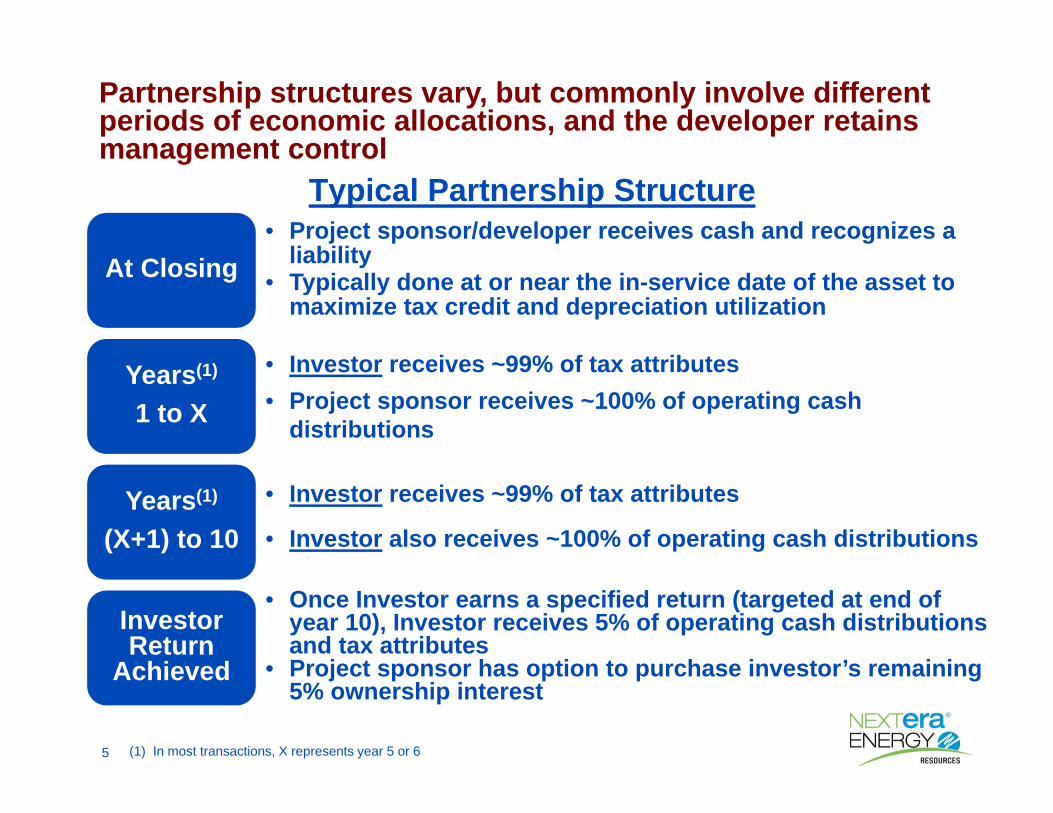
Partnership structures vary, but commonly involve different periods of economic allocations, and the developer retains management control
Typical Partnership Structure
(1) In most transactions, X represents year 5 or 6
At Closing
Years(1)
1 to X
Years(1)
(X+1) to 10
Investor Return
Achieved
• Project sponsor/developer receives cash and recognizes a liability
• Typically done at or near the in-service date of the asset to maximize tax credit and depreciation utilization
• Investor receives ~99% of tax attributes• Project sponsor receives ~100% of operating cash
distributions
• Once Investor earns a specified return (targeted at end of year 10), Investor receives 5% of operating cash distributions and tax attributes
• Project sponsor has option to purchase investor’s remaining 5% ownership interest
• Investor receives ~99% of tax attributes
• Investor also receives ~100% of operating cash distributions

6
• Why is Tax Equity Important to NextEra?
• Overview of Typical Tax Equity Structures
• Baseline All-Equity (Unlevered) View
• Financial Statement Impact
• Appendix – Change in Income Statement Classification December 31, 2012
Agenda

7
• Capital Costs: $175 MM
• PPA Price: $40 / MWh, flat
• O&M: ~$12 / MWh
• Net Capacity Factor: 43%
• Tax Rate: 35% Federal, 6% State
• Useful Life: 30 years
Illustrative Project Assumptions – 100 MW PTC Wind Farm
To illustrate the impacts on the financial statements, we will examine a hypothetical contracted PTC project
Actual project values vary materially; this example is used for illustrative purposes only

8
The tax efficiency, or lack thereof, is not apparent in the earnings profile of a typical wind project
Year: Closing 1 2 3 4 5 6 7 8 9 10
Revenue 15.1$ 15.1$ 15.1$ 15.1$ 15.1$ 15.1$ 15.1$ 15.1$ 15.1$ 15.1$
Operating expenses (5.0) (4.9) (4.7) (4.6) (4.4) (4.3) (4.2) (4.0) (3.9) (3.7)
Depreciation (5.8) (5.8) (5.8) (5.8) (5.8) (5.8) (5.8) (5.8) (5.8) (5.8)
Operating income 4.3 4.4 4.6 4.7 4.9 5.0 5.1 5.3 5.4 5.6
Income tax exp (ex PTCs) (1.6) (1.7) (1.8) (1.8) (1.9) (1.9) (2.0) (2.0) (2.1) (2.1)
Federal PTCs 8.3 8.7 8.7 9.0 9.0 9.0 9.4 9.4 9.8 9.8
Net income 11.0$ 11.4$ 11.5$ 11.9$ 12.0$ 12.1$ 12.5$ 12.7$ 13.1$ 13.3$
Capital employed 175.0$
Taxes:
Tax depreciation 35.0 56.0 33.6 20.2 20.2 10.1 - - - - -
State taxable income (35.0) (45.9) (23.4) (9.8) (9.7) 0.5 10.8 10.9 11.1 11.2 11.3
Federal taxable income (32.9) (43.2) (22.0) (9.2) (9.1) 0.5 10.1 10.3 10.4 10.5 10.7
Baseline Income Statement(1)
($ MM)
Note: Simplified to assume completion of project at December 31st of year 0(1) Baseline income statement reflects project funded with 100% equity (no tax equity or debt financing)

9
• Why is Tax Equity Important to NextEra?
• Overview of Typical Tax Equity Structures
• Baseline All-Equity (Unlevered) View
• Financial Statement Impact
• Appendix – Change in Income Statement Classification December 31, 2012
Agenda
10
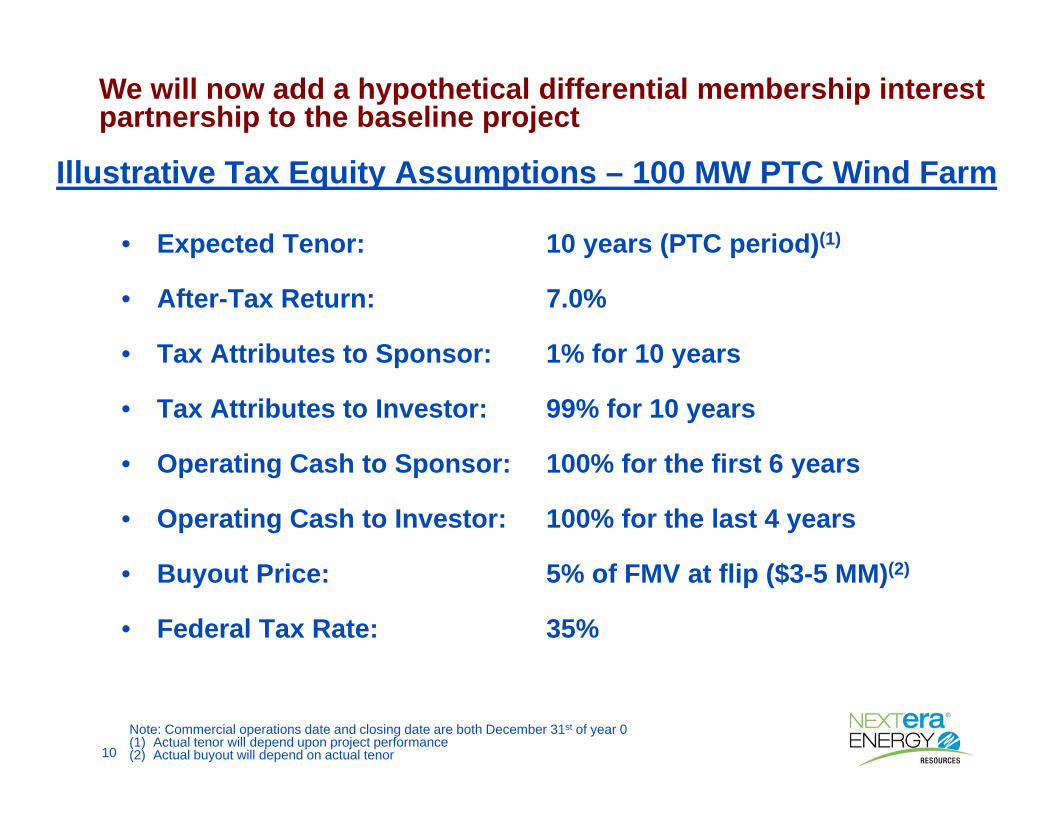
Illustrative Tax Equity Assumptions – 100 MW PTC Wind Farm
• Expected Tenor:
• After-Tax Return:
• Tax Attributes to Sponsor:
• Tax Attributes to Investor:
• Operating Cash to Sponsor:
• Operating Cash to Investor:
• Buyout Price:
• Federal Tax Rate:
10 years (PTC period)(1)
7.0%
1% for 10 years
99% for 10 years
100% for the first 6 years
100% for the last 4 years
5% of FMV at flip ($3-5 MM)(2)
35%
We will now add a hypothetical differential membership interest partnership to the baseline project
Note: Commercial operations date and closing date are both December 31st of year 0(1) Actual tenor will depend upon project performance(2) Actual buyout will depend on actual tenor
11
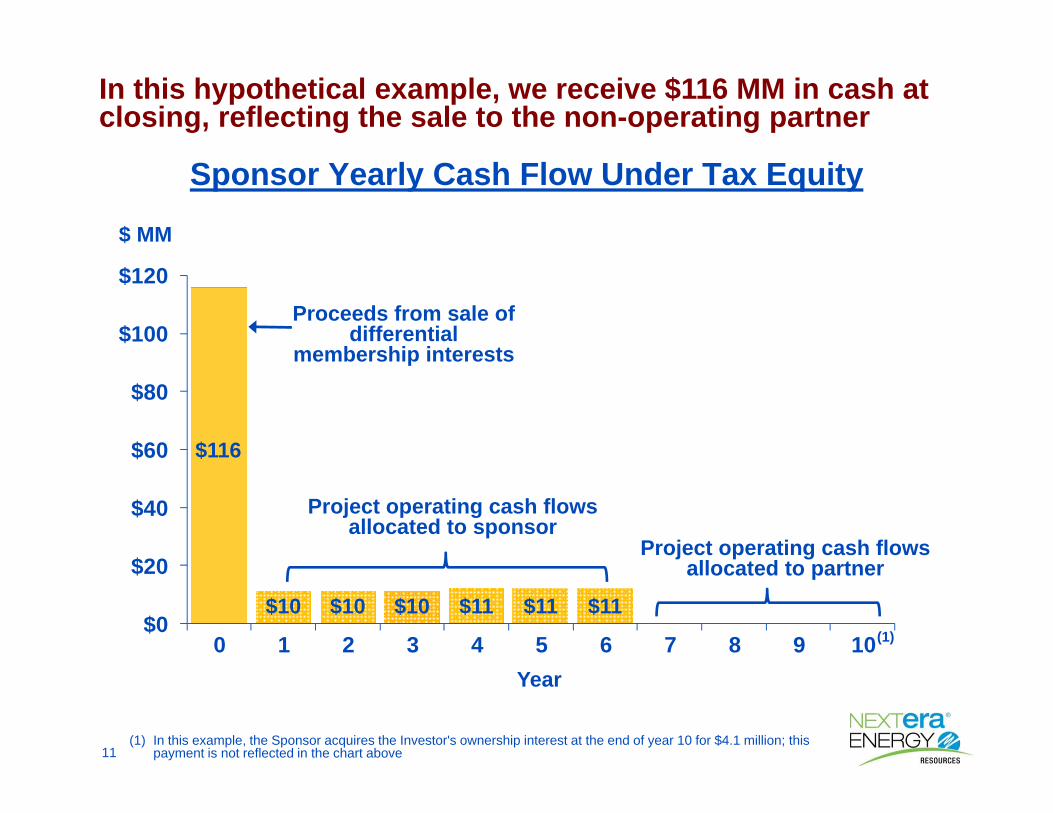
Sponsor Yearly Cash Flow Under Tax Equity
In this hypothetical example, we receive $116 MM in cash at closing, reflecting the sale to the non-operating partner
$0
$20
$40
$60
$80
$100
$120
0 1 2 3 4 5 6 7 8 9 10
$116
$10 $10 $10 $11 $11 $11
Proceeds from sale of differential
membership interests
Project operating cash flows allocated to sponsor
Project operating cash flows allocated to partner
$ MM
Year
(1)
(1) In this example, the Sponsor acquires the Investor's ownership interest at the end of year 10 for $4.1 million; this payment is not reflected in the chart above

12
The year-by-year view in more detail
Cash Flow Impact to Sponsor($ MM)
Closing 1 2 3 4 5 6 7 8 9 10
Baseline Cash Flow to Sponsor:Operating cash distributions -$ 10.1$ 10.2$ 10.3$ 10.5$ 10.6$ 10.8$ 10.9$ 11.1$ 11.2$ 11.3$ Federal taxes 11.5 15.1 7.7 3.2 3.2 (0.2) (3.5) (3.6) (3.6) (3.7) (3.7) State taxes 2.1 2.8 1.4 0.6 0.6 - (0.6) (0.7) (0.7) (0.7) (0.7) PTCs - 8.3 8.7 8.7 9.0 9.0 9.0 9.4 9.4 9.8 9.8 Deferred tax utilization(1) (11.5) (23.4) (16.4) (11.9) 63.2 - - - - - - After-tax cash flow 2.1$ 12.9$ 11.6$ 10.9$ 86.5$ 19.4$ 15.7$ 16.0$ 16.2$ 16.6$ 16.7$
Tax Equity Cash to Sponsor:Proceeds 116.0$ Operating cash distributions - 10.1$ 10.2$ 10.3$ 10.5$ 10.6$ 10.8$ -$ -$ -$ -$ Federal taxes 0.1 0.2 0.1 - - - - - - - - State taxes - - - - - - - - - - - PTCs - 0.1 0.1 0.1 0.1 0.1 0.1 0.1 0.1 0.1 0.1 Buyout - - - - - - - - - - (4.1) After-tax cash flow 116.1$ 10.4$ 10.4$ 10.4$ 10.6$ 10.7$ 10.9$ 0.1$ 0.1$ 0.1$ (4.0)$
114.0$ (2.5)$ (1.2)$ (0.5)$ (75.9)$ (8.7)$ (4.8)$ (15.9)$ (16.1)$ (16.5)$ (20.7)$ Change in Sponsor's Cash Flow:
Year:
(1) In this example, the sponsor is assumed to have no net cash federal tax liability in years 1 through 3; then is assumed to be a full tax payer in year 4 and thereafter

13
Tax equity investors are able to monetize income tax benefits more efficiently than the sponsor / developer
Cash Flow Impact to Tax Equity Investor($ MM)
Closing 1 2 3 4 5 6 7 8 9 10
Tax Equity Cash to Investor - Expected:(1)
Initial investment (116.0)$
- -$ -$ -$ -$ -$ -$ 10.9$ 11.1$ 11.2$ 11.4$
Federal taxes 11.4 14.9 7.6 3.2 3.2 (0.2) (3.5) (3.6) (3.6) (3.7) (3.7)
State taxes 2.1 2.8 1.4 0.6 0.6 - (0.6) (0.7) (0.7) (0.7) (0.7)
PTCs - 8.2 8.6 8.6 8.9 8.9 8.9 9.3 9.3 9.7 9.7
Buyout - - - - - - - - - - 4.1
After-tax cash flow (102.5)$ 25.9$ 17.6$ 12.4$ 12.7$ 8.7$ 4.8$ 15.9$ 16.1$ 16.5$ 20.8$
Year:
Operating cash distributions
(1) In this example, the contracted after-tax return to the tax equity investor is 7.0%, exclusive of state tax benefits and the buyout payment. As a result, the expected return is higher

14
Tax Equity Impact on Balance Sheet & Cash Flow Statement($ MM)
Balance Sheet View
Property, Plant and EquipmentCurrent Assets
Cash and Cash Equivalents $116Other Assets _____Total Assets $116
CapitalizationCurrent LiabilitiesOther Liabilities and Deferred Credits
Deferral Related to Differential $116Membership Interests – VIEs
Commitments and Contingencies _____Total Capitalization and Liabilities $116
Cash Flow Statement View
Cash Flow from Operating Activities
Cash Flow from Investing Activities
Cash Flow from Financing ActivitiesProceeds from Sale of DifferentialMembership Interests $116
_____Net Increase/ (Decrease) in Cash $116
Accounting for the receipt of cash at closing is straightforward
15
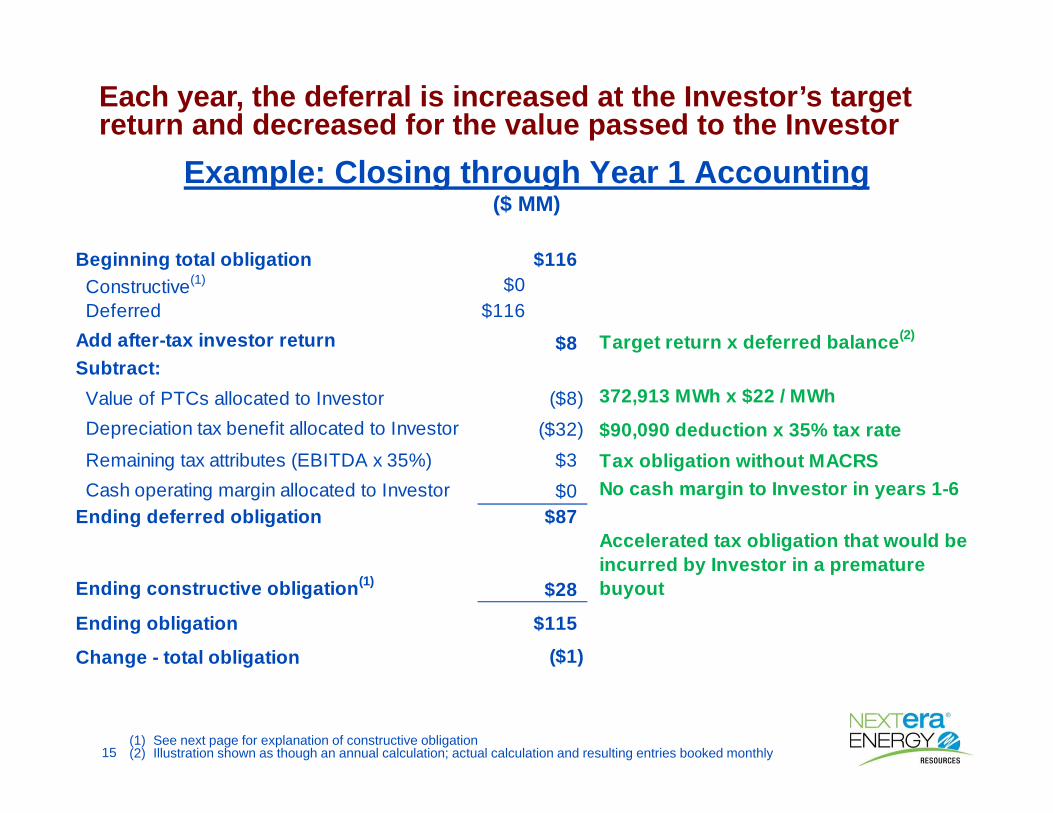
Example: Closing through Year 1 Accounting($ MM)
Each year, the deferral is increased at the Investor’s target return and decreased for the value passed to the Investor
Beginning total obligation $116Constructive(1) $0Deferred $116
Add after-tax investor return $8 Target return x deferred balance(2)
Subtract:Value of PTCs allocated to Investor ($8) 372,913 MWh x $22 / MWhDepreciation tax benefit allocated to Investor ($32) $90,090 deduction x 35% tax rateRemaining tax attributes (EBITDA x 35%) $3 Tax obligation without MACRSCash operating margin allocated to Investor $0 No cash margin to Investor in years 1-6
Ending deferred obligation $87
Ending constructive obligation(1) $28
Accelerated tax obligation that would be incurred by Investor in a premature buyout
Ending obligation $115
Change - total obligation ($1)
(1) See next page for explanation of constructive obligation(2) Illustration shown as though an annual calculation; actual calculation and resulting entries booked monthly
16
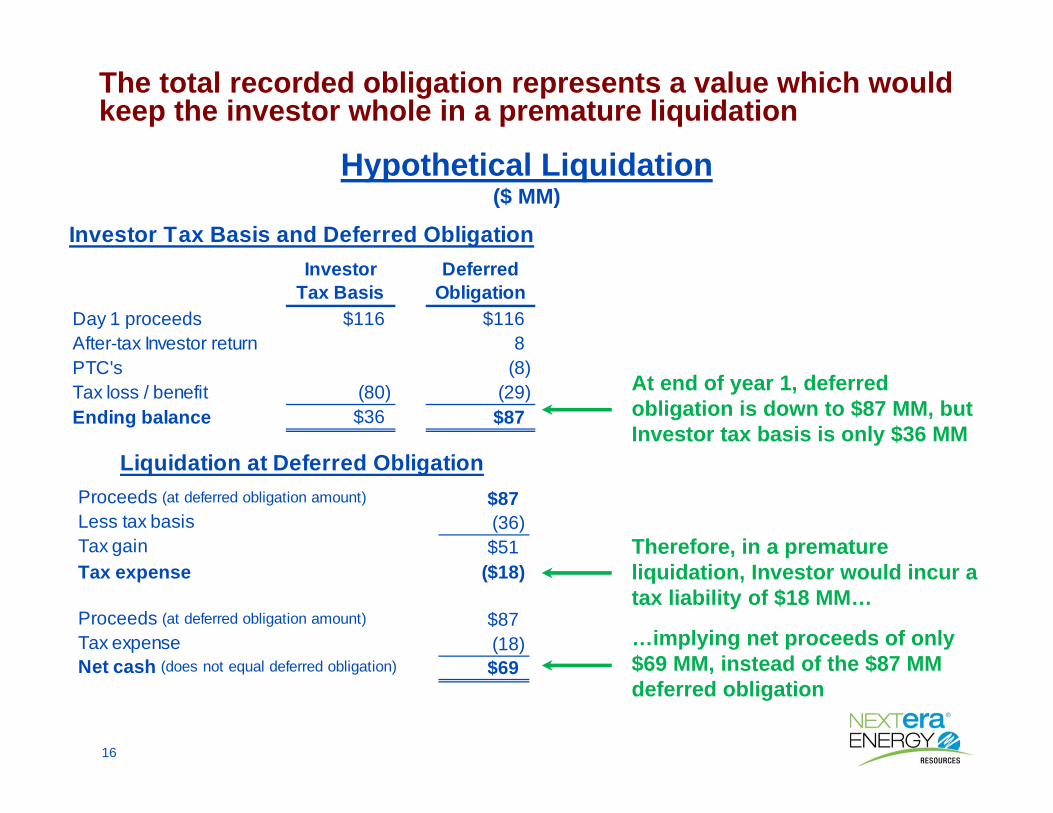
At end of year 1, deferred obligation is down to $87 MM, but Investor tax basis is only $36 MM
Investor DeferredTax Basis Obligation
Day 1 proceeds $116 $116After-tax Investor return 8 PTC's (8) Tax loss / benefit (80) (29) Ending balance $36 $87
Investor Tax Basis and Deferred Obligation
Hypothetical Liquidation($ MM)
Therefore, in a premature liquidation, Investor would incur a tax liability of $18 MM…
…implying net proceeds of only $69 MM, instead of the $87 MM deferred obligation
Proceeds (at deferred obligation amount) $87Less tax basis (36) Tax gain $51Tax expense ($18)
Proceeds (at deferred obligation amount) $87Tax expense (18) Net cash (does not equal deferred obligation) $69
Liquidation at Deferred Obligation
The total recorded obligation represents a value which would keep the investor whole in a premature liquidation
17
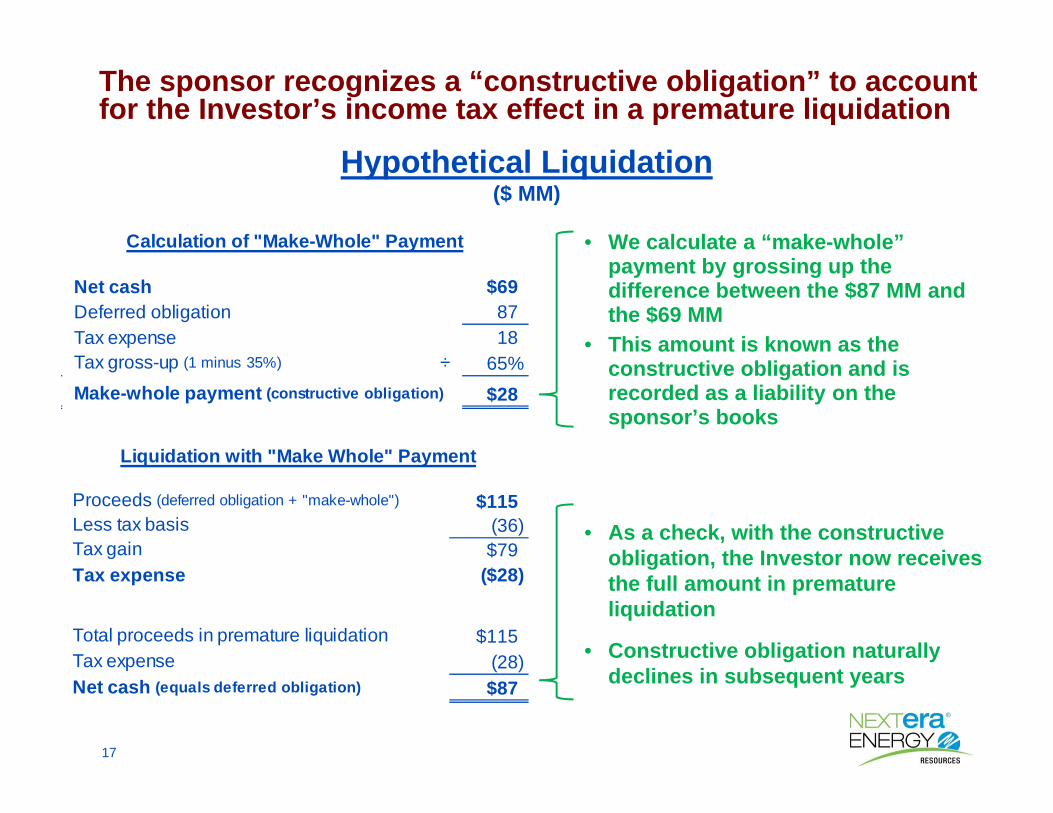
• We calculate a “make-whole” payment by grossing up the difference between the $87 MM and the $69 MM
• This amount is known as the constructive obligation and is recorded as a liability on the sponsor’s books
Net cash $69Deferred obligation 87 Tax expense 18 Tax gross-up (1 minus 35%) ÷ 65%Make-whole payment (constructive obligation) $28
Calculation of "Make-Whole" Payment
Proceeds (deferred obligation + "make-whole") $115Less tax basis (36) Tax gain $79Tax expense ($28)
Total proceeds in premature liquidation $115Tax expense (28) Net cash (equals deferred obligation) $87
Liquidation with "Make Whole" Payment
The sponsor recognizes a “constructive obligation” to account for the Investor’s income tax effect in a premature liquidation
Hypothetical Liquidation($ MM)
• As a check, with the constructive obligation, the Investor now receives the full amount in premature liquidation
• Constructive obligation naturally declines in subsequent years

18
Example: Year 6 Accounting (Simplified)($ MM)
After the depreciation tax benefit is exhausted, the constructive obligation declines. From an accounting perspective, all entries are reflected in debits and credits to Other Income/(Deductions)
Effect on Income StatementBeginning total obligation $93Constructive $35Deferred $58
Add after-tax Investor return $4 Increase benefits associated with differential membership interests - net
Subtract:
Value of PTCs, allocated to Investor ($9) Decrease benefits associated with differential membership interests - net
Depreciation tax benefit allocated to Investor $0 No change as MACRS expires after year 5
Remaining tax attributes (EBITDA x 35%) $4 Increase benefits associated with differential membership interests - net
Cash operating margin allocated to Investor $0Ending deferred obligation $57
Change in constructive obligation ($7) Decrease benefits associated with differential membership interests - net
Ending obligation $85Change - total obligation ($8)
Note: Illustration shown as though an annual calculation; actual calculation and resulting entries booked monthly
19
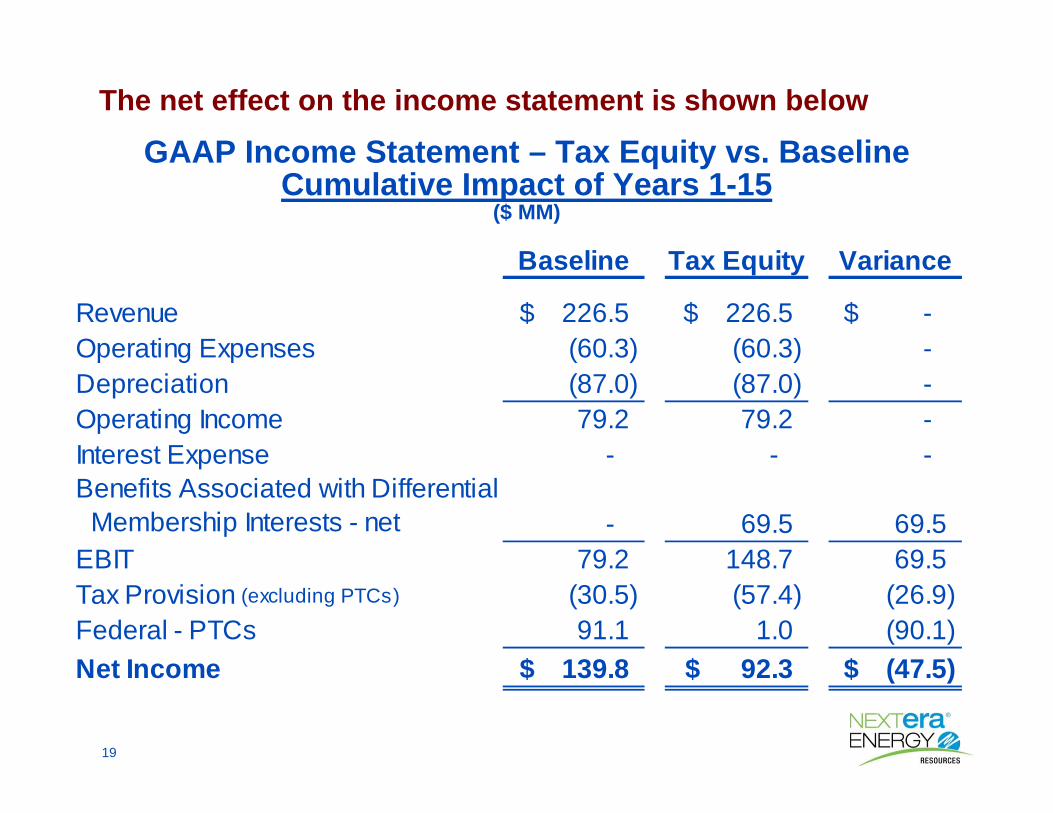
The net effect on the income statement is shown below
GAAP Income Statement – Tax Equity vs. BaselineCumulative Impact of Years 1-15
($ MM)
226.5$ 226.5$ -$ (60.3) (60.3) - (87.0) (87.0) - 79.2 79.2 -
- - -
Membership Interests - net79.2 148.7 69.5
(30.5) (57.4) (26.9) 91.1 1.0 (90.1)
139.8$ 92.3$ (47.5)$
- 69.5 69.5
Tax Provision (excluding PTCs)
Federal - PTCsNet Income
DepreciationOperating IncomeInterest ExpenseBenefits Associated with Differential
EBIT
Baseline Tax Equity Variance
RevenueOperating Expenses
20
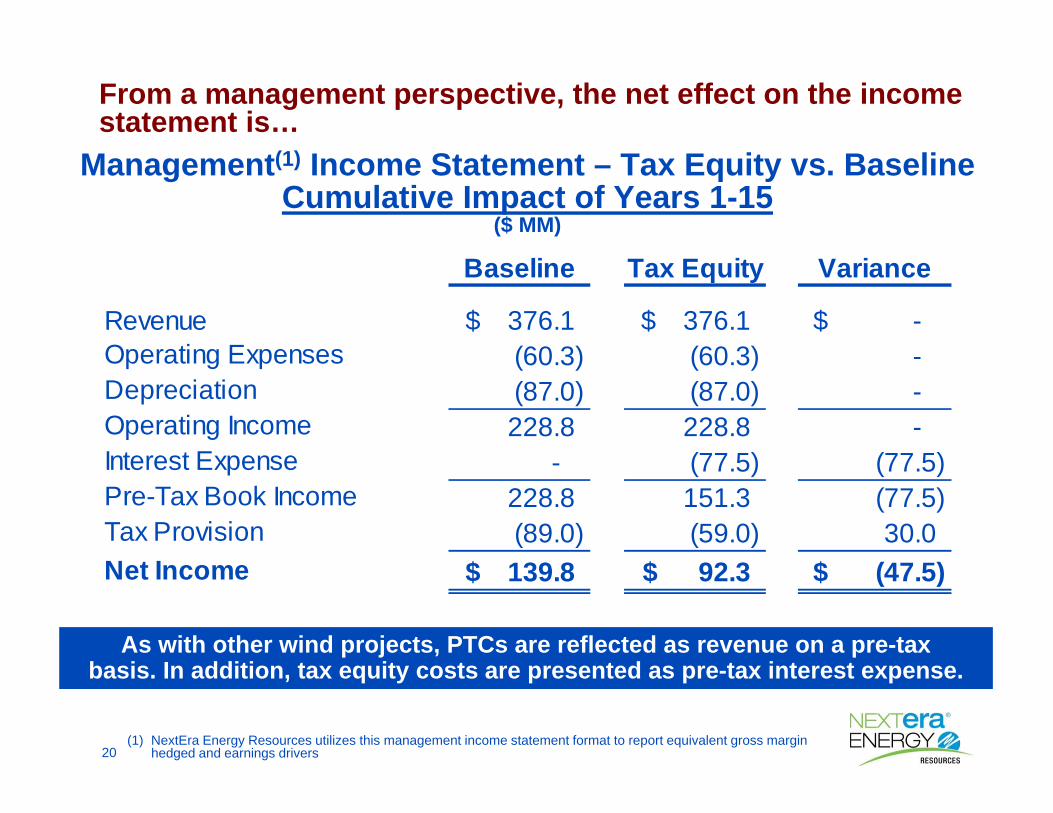
From a management perspective, the net effect on the income statement is…
Management(1) Income Statement – Tax Equity vs. BaselineCumulative Impact of Years 1-15
($ MM)
Revenue 376.1$ 376.1$ -$ Operating Expenses (60.3) (60.3) - Depreciation (87.0) (87.0) - Operating Income 228.8 228.8 - Interest Expense - (77.5) (77.5) Pre-Tax Book Income 228.8 151.3 (77.5) Tax Provision (89.0) (59.0) 30.0 Net Income 139.8$ 92.3$ (47.5)$
Baseline Tax Equity Variance
As with other wind projects, PTCs are reflected as revenue on a pre-taxbasis. In addition, tax equity costs are presented as pre-tax interest expense.
(1) NextEra Energy Resources utilizes this management income statement format to report equivalent gross margin hedged and earnings drivers

21
The net effect on the GAAP cash flow statement…GAAP Cash Flow Statement – Tax Equity vs. Baseline
Cumulative Impact of Years 1-15($ MM)
Operating Cash Flow 260.5$ 145.6$ (114.9)$ Investing Cash Flow (175.0) (175.0) - Financing Cash Flow - 67.4 67.4 Net Cash Flow 85.5$ 38.0$ (47.5)$
VarianceBaseline Tax Equity
Cash Flow Statement Presentation• Initial proceeds from sale of differential membership interests are reflected in cash
flows from financing activities• The allocation of tax attributes (PTCs and benefits from income tax losses) to the
Investor are used to partially pay down the deferred obligation– Because these tax allocations are non-cash to the sponsor, GAAP reporting precludes
reflecting these non-cash “payments” as financing activities but rather are shown as reductions to operating cash flows
• The allocation of project operating cash distributions to the investor is reflected in cash flows from financing activities
22
Operating Cash Flows• PTC’s Allocated to Investor• Tax Losses Allocated to Investor
Investing Cash Flows• No change
Financing Cash Flows• Initial Proceeds• Project Operating Cash Distributions• Buy-out
Net Cash Flow
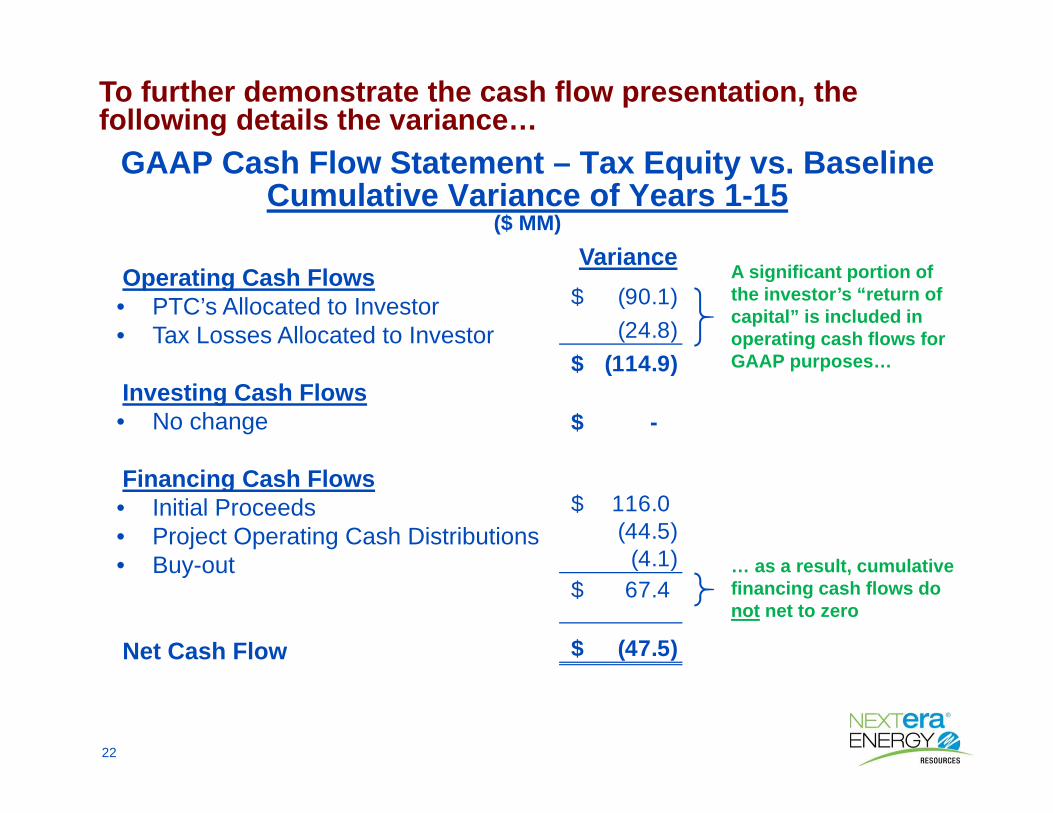
To further demonstrate the cash flow presentation, the following details the variance…
GAAP Cash Flow Statement – Tax Equity vs. BaselineCumulative Variance of Years 1-15
($ MM)
(90.1)$ (24.8)
(114.9)$
-$
116.0$ (44.5)
(4.1) 67.4$
(47.5)$
VarianceA significant portion of the investor’s “return of capital” is included in operating cash flows for GAAP purposes…
… as a result, cumulative financing cash flows do not net to zero

23
The net effect on the GAAP balance sheet is…GAAP Balance Sheet Impact
Tax Equity vs. Baseline – Years 1-10(1)($ MM)
Closing 1 2 3 4 5 6 7 8 9 10Baseline:
PP&E, net 175.0$ 169.2$ 163.3$ 157.5$ 151.7$ 145.8$ 140.0$ 134.2$ 128.3$ 122.5$ 116.7$
Cash and Cash Equivalents - - - - - - - - - - - Total Assets 175.0$ 169.2$ 163.3$ 157.5$ 151.7$ 145.8$ 140.0$ 134.2$ 128.3$ 122.5$ 116.7$
Capitalization 172.9$ 171.0$ 170.7$ 171.2$ 96.6$ 89.1$ 85.5$ 82.0$ 78.4$ 74.8$ 71.3$ Accumulated deferred income taxes 2.1 (1.8) (7.3) (13.7) 55.1 56.7 54.5 52.2 49.9 47.7 45.4 Total Capitalization and Liabilities 175.0$ 169.2$ 163.4$ 157.5$ 151.7$ 145.8$ 140.0$ 134.2$ 128.3$ 122.5$ 116.7$
Tax Equity:PP&E, net 175.0$ 169.2$ 163.3$ 157.5$ 151.7$ 145.8$ 140.0$ 134.2$ 128.3$ 122.5$ 116.7$ Cash and Cash Equivalents(2) 116.0 - - - - - - - - - - Total Assets 291.0$ 169.2$ 163.3$ 157.5$ 151.7$ 145.8$ 140.0$ 134.2$ 128.3$ 122.5$ 116.7$
Capitalization 152.6$ 33.7$ 32.3$ 31.7$ 31.9$ 32.6$ 33.6$ 41.8$ 50.8$ 61.2$ 71.3$ Accumulated deferred income taxes 22.4 20.9 20.3 20.0 20.2 20.8 21.4 26.6 32.3 38.9 45.4
116.0 114.6 110.7 105.8 99.5 92.5 84.9 65.8 45.2 22.4 - Total Capitalization and Liabilities 291.0$ 169.2$ 163.3$ 157.5$ 151.6$ 145.9$ 139.9$ 134.2$ 128.3$ 122.5$ 116.7$
Year:
Deferral related to differential membership interests - VIEs
(1) In this example, the balance sheet is essentially the same after year 10(2) At closing, the tax equity investor contributes $116 MM into the project; at the beginning of year 1, the project
distributes the cash to the sponsor
24
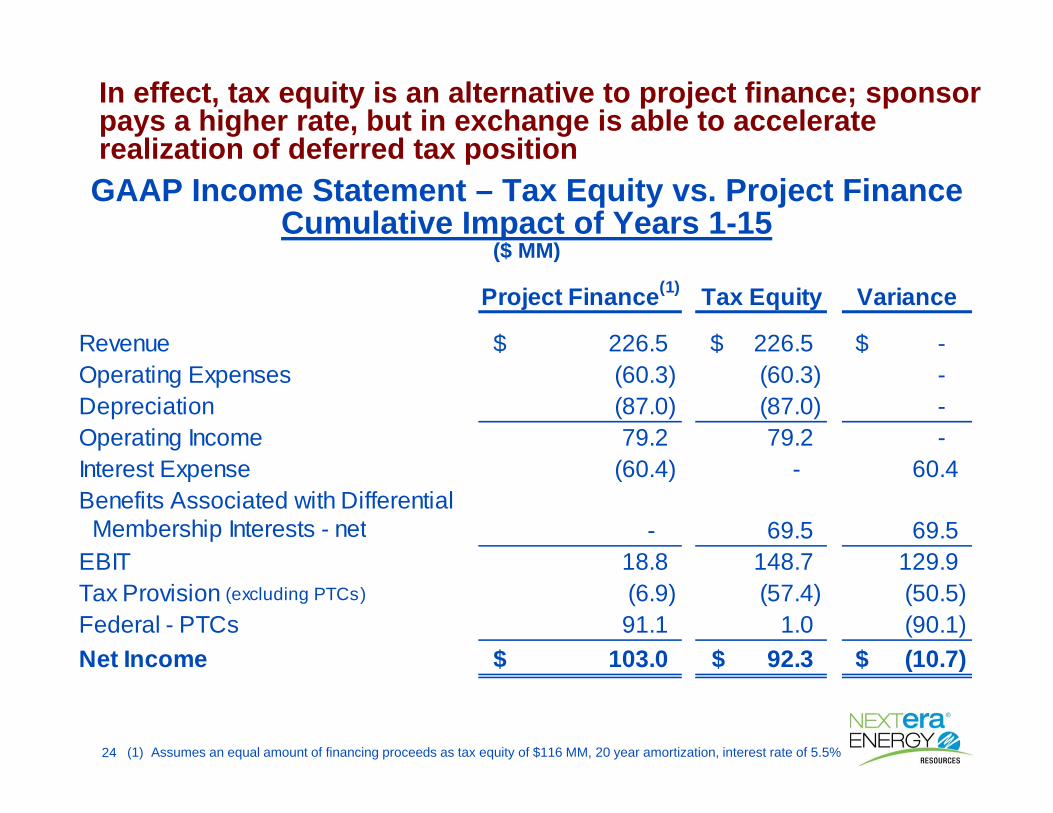
In effect, tax equity is an alternative to project finance; sponsor pays a higher rate, but in exchange is able to accelerate realization of deferred tax position
226.5$ 226.5$ -$ (60.3) (60.3) - (87.0) (87.0) - 79.2 79.2 -
(60.4) - 60.4
Membership Interests - net18.8 148.7 129.9 (6.9) (57.4) (50.5) 91.1 1.0 (90.1)
103.0$ 92.3$ (10.7)$
Project Finance(1) Tax Equity Variance
RevenueOperating Expenses
Net Income
DepreciationOperating IncomeInterest ExpenseBenefits Associated with Differential
EBIT69.5 69.5 -
Tax Provision (excluding PTCs)
Federal - PTCs
GAAP Income Statement – Tax Equity vs. Project FinanceCumulative Impact of Years 1-15
($ MM)
(1) Assumes an equal amount of financing proceeds as tax equity of $116 MM, 20 year amortization, interest rate of 5.5%

25
From a management perspective, the net effect on the income statement is…
Management(1) Income Statement – Tax Equity vs. Project Finance – Cumulative Impact of Years 1-15
($ MM)
Project Finance
Revenue 376.1$ 376.1$ -$ Operating Expenses (60.3) (60.3) - Depreciation (87.0) (87.0) - Operating Income 228.8 228.8 - Interest Expense (60.4) (77.5) (17.1) Pre-Tax Book Income 168.4 151.3 (17.1) Tax Provision (65.4) (59.0) 6.4 Net Income 103.0$ 92.3$ (10.7)$
VarianceTax Equity
(1) NextEra Energy Resources utilizes this management income statement format to report equivalent gross margin hedged and earnings drivers

26
The net effect on the GAAP cash flow statement is…
Operating Cash Flow 223.6$ 145.6$ (78.0)$
Investing Cash Flow (175.0) (175.0) -
Financing Cash Flow 24.3 67.4 43.1
Net Cash Flow 72.9$ 38.0$ (34.9)$
VarianceProject Finance Tax Equity
GAAP Cash Flow Statement – Tax Equity vs. Project FinanceCumulative Impact of Years 1-15
($ MM)
Appendix – Change in Income Statement Classification December 31, 2012

28
Change in Income Statement Classification December 31, 2012• Historically, pretax costs and benefits associated with
differential membership interests have been reported as “taxes other than income taxes and other” in the income statement– Identification of these costs and benefits has been difficult for investors– Discrete presentation of these costs and benefits will improve
transparency for investors• Effective with the December 31, 2012 10-K, pretax costs and
benefits of differential membership interests are reported in a new line item “Benefits Associated with Differential Membership Interests – net” in the “Other Income/(Deductions)” section of the Income Statement; $16 million, $118 million and $81 million are reported in this new line for the years ended 2010, 2011, and 2012, respectively
• Three slides of this presentation were revised to reflect this change and are shown on the following slides
Effective December 31, 2012, pretax costs and benefits associated with differential membership interests are reported discretely in the income statement to improve transparency
29
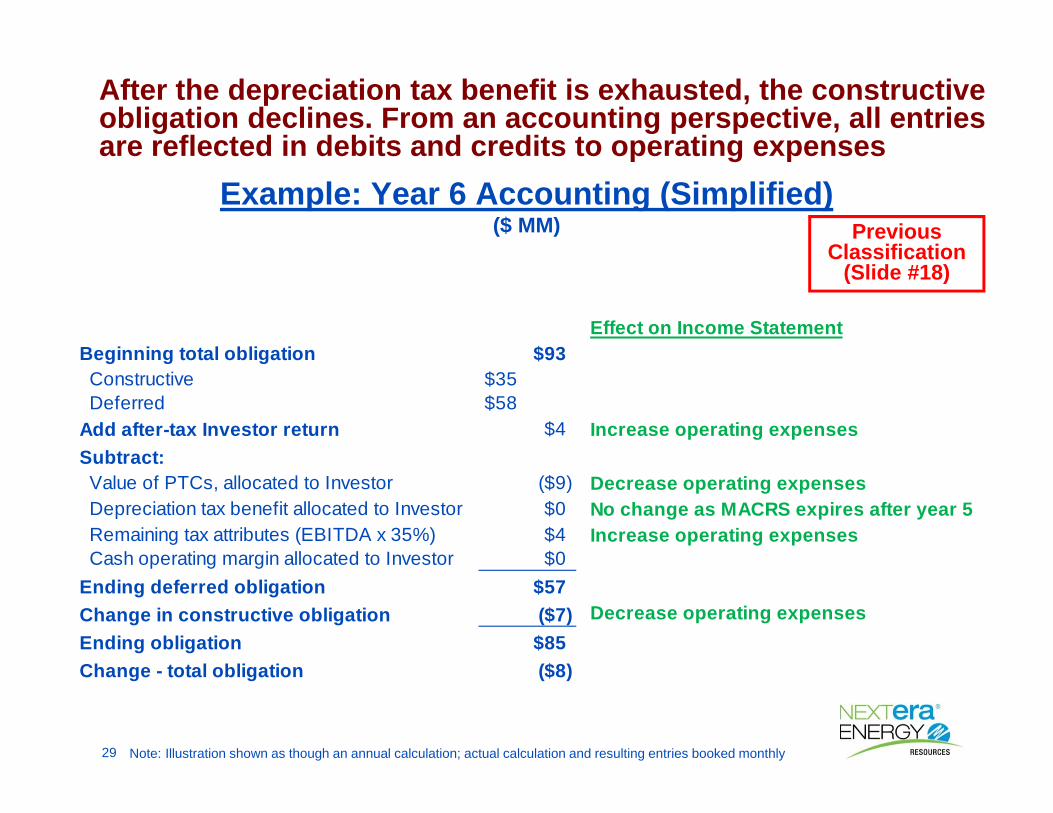
Example: Year 6 Accounting (Simplified)($ MM)
After the depreciation tax benefit is exhausted, the constructive obligation declines. From an accounting perspective, all entries are reflected in debits and credits to operating expenses
Effect on Income StatementBeginning total obligation $93Constructive $35Deferred $58
Add after-tax Investor return $4 Increase operating expensesSubtract:Value of PTCs, allocated to Investor ($9) Decrease operating expensesDepreciation tax benefit allocated to Investor $0 No change as MACRS expires after year 5Remaining tax attributes (EBITDA x 35%) $4 Increase operating expensesCash operating margin allocated to Investor $0
Ending deferred obligation $57Change in constructive obligation ($7) Decrease operating expensesEnding obligation $85Change - total obligation ($8)
Note: Illustration shown as though an annual calculation; actual calculation and resulting entries booked monthly
Previous Classification
(Slide #18)

30
Example: Year 6 Accounting (Simplified) ($ MM)
After the depreciation tax benefit is exhausted, the constructive obligation declines. From an accounting perspective, all entries are reflected in debits and credits to Other Income/(Deductions)
Effect on Income StatementBeginning total obligation $93Constructive $35Deferred $58
Add after-tax Investor return $4 Increase Benefits Associated with Differential Membership Interests- net
Subtract:Value of PTCs, allocated to Investor ($9) Decrease Benefits Associated with
Differential Membership Interests- netDepreciation tax benefit allocated to Investor $0 No change as MACRS expires after year 5
Remaining tax attributes (EBITDA x 35%) $4 Increase Benefits Associated with Differential Membership Interests- net
Cash operating margin allocated to Investor $0Ending deferred obligation $57
Change in constructive obligation ($7) Decrease Benefits Associated with Differential Membership Interests- net
Ending obligation $85Change - total obligation ($8)
Note: Illustration shown as though an annual calculation; actual calculation and resulting entries booked monthly
New Classification
(Slide #18)
31
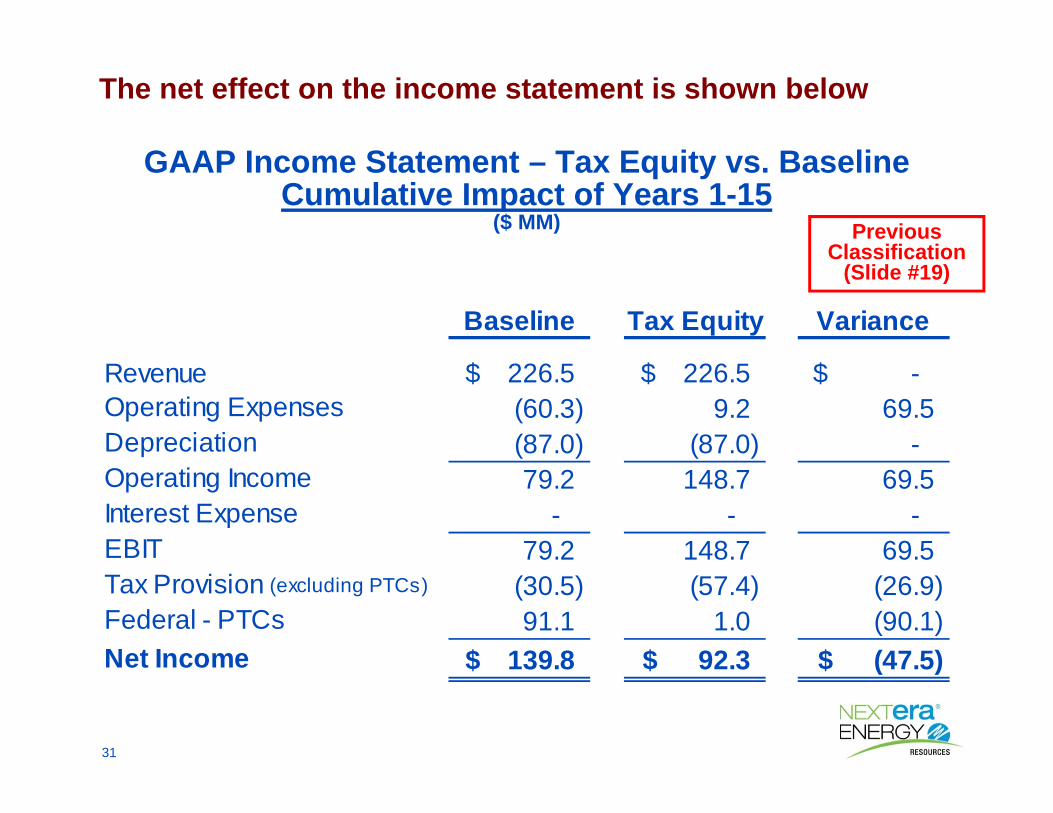
The net effect on the income statement is shown below
GAAP Income Statement – Tax Equity vs. BaselineCumulative Impact of Years 1-15
($ MM)
Revenue 226.5$ 226.5$ -$ Operating Expenses (60.3) 9.2 69.5 Depreciation (87.0) (87.0) - Operating Income 79.2 148.7 69.5 Interest Expense - - - EBIT 79.2 148.7 69.5 Tax Provision (excluding PTCs) (30.5) (57.4) (26.9) Federal - PTCs 91.1 1.0 (90.1) Net Income 139.8$ 92.3$ (47.5)$
Baseline Tax Equity Variance
Previous Classification
(Slide #19)

32
The net effect on the income statement is shown below
GAAP Income Statement – Tax Equity vs. BaselineCumulative Impact of Years 1-15
($ MM)
226.5$ 226.5$ -$ (60.3) (60.3) - (87.0) (87.0) - 79.2 79.2 -
- - -
Membership Interests - net79.2 148.7 69.5
(30.5) (57.4) (26.9) 91.1 1.0 (90.1)
139.8$ 92.3$ (47.5)$
69.5 69.5 -
Tax Provision (excluding PTCs)Federal - PTCsNet Income
DepreciationOperating IncomeInterest ExpenseBenefits Associated with Differential
EBIT
Baseline Tax Equity VarianceRevenueOperating Expenses
New Classification
(Slide #19)
33
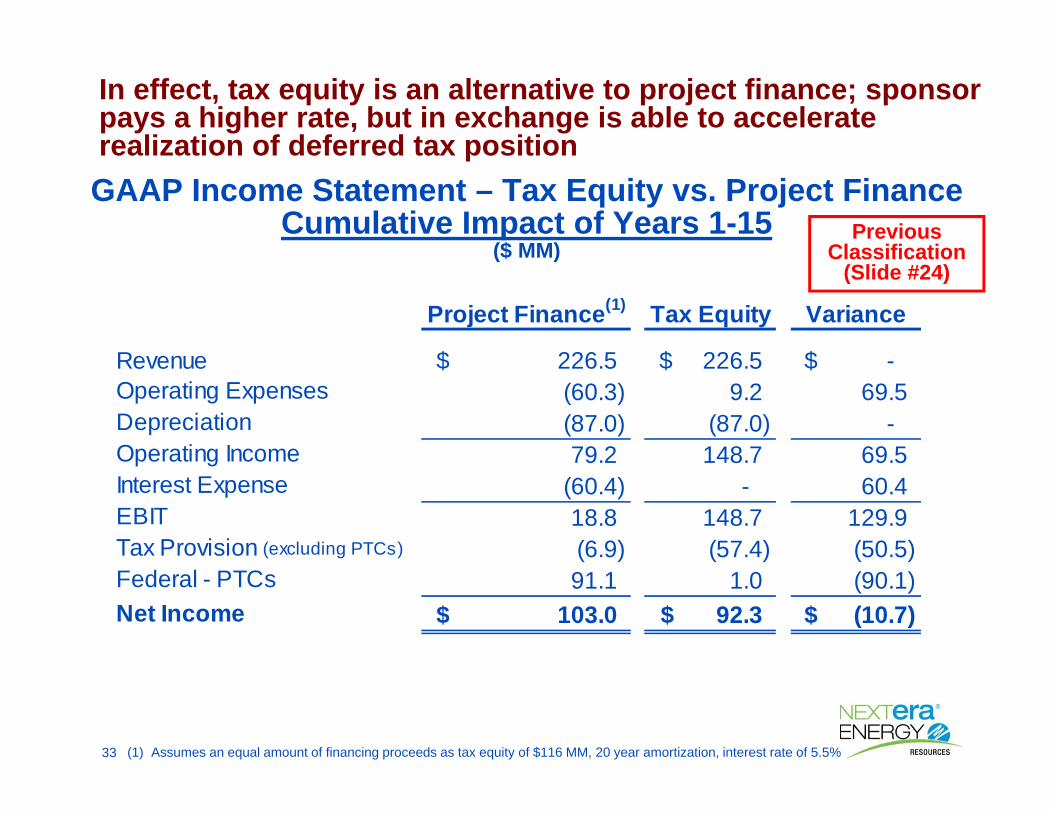
In effect, tax equity is an alternative to project finance; sponsor pays a higher rate, but in exchange is able to accelerate realization of deferred tax position
Revenue 226.5$ 226.5$ -$ Operating Expenses (60.3) 9.2 69.5 Depreciation (87.0) (87.0) - Operating Income 79.2 148.7 69.5 Interest Expense (60.4) - 60.4 EBIT 18.8 148.7 129.9 Tax Provision (excluding PTCs) (6.9) (57.4) (50.5) Federal - PTCs 91.1 1.0 (90.1) Net Income 103.0$ 92.3$ (10.7)$
Project Finance(1) Tax Equity Variance
GAAP Income Statement – Tax Equity vs. Project FinanceCumulative Impact of Years 1-15
($ MM)
(1) Assumes an equal amount of financing proceeds as tax equity of $116 MM, 20 year amortization, interest rate of 5.5%
Previous Classification
(Slide #24)
34
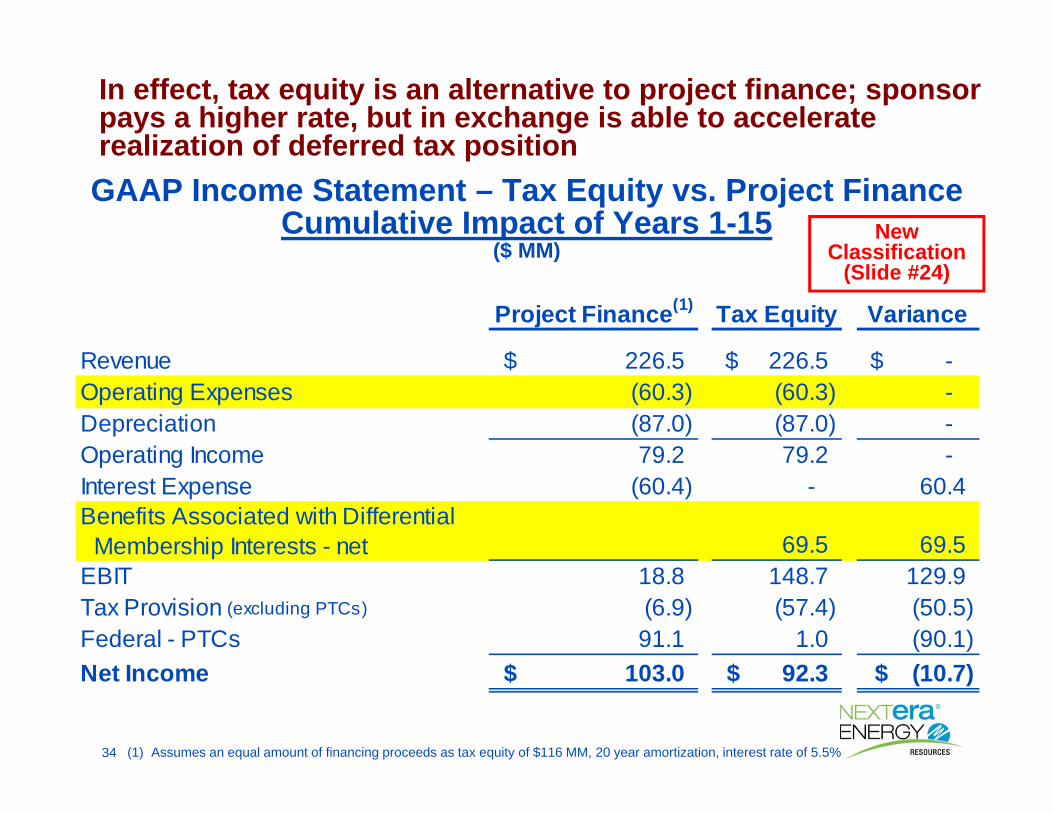
In effect, tax equity is an alternative to project finance; sponsor pays a higher rate, but in exchange is able to accelerate realization of deferred tax position
226.5$ 226.5$ -$ (60.3) (60.3) - (87.0) (87.0) - 79.2 79.2 -
(60.4) - 60.4
Membership Interests - net18.8 148.7 129.9 (6.9) (57.4) (50.5) 91.1 1.0 (90.1)
103.0$ 92.3$ (10.7)$
Tax Provision (excluding PTCs)
Federal - PTCsNet Income
69.5 69.5
DepreciationOperating IncomeInterest ExpenseBenefits Associated with Differential
EBIT
Project Finance(1) Tax Equity Variance
RevenueOperating Expenses
GAAP Income Statement – Tax Equity vs. Project FinanceCumulative Impact of Years 1-15
($ MM)
(1) Assumes an equal amount of financing proceeds as tax equity of $116 MM, 20 year amortization, interest rate of 5.5%
New Classification
(Slide #24)