accounting for human error probability in sil verification ... · pdf file2 still fall short...
TRANSCRIPT
__________________________________________________________________________
1
Accounting for Human Error Probability in SIL Verification
Calculations
William G. Bridges, President
Process Improvement Institute, Inc. (PII)
1321 Waterside Lane
Knoxville, TN 37922
Phone: (865) 675-3458
Fax: (865) 622-6800
e-mail: [email protected]
Harold W Thomas, PE, CFSE
Exida.com, LLC
Sellersville, PA 18195
2012 © Copyright reserved by Process Improvement Institute, Inc.
Prepared for Presentation at
8th
Global Congress on Process Safety
Houston, TX
April 1-4, 2012
Keywords: Systematic Error, human error
Abstract
Safety Instrumented System (SIS) standards have raised the bar on using
instrumented systems (formerly called interlocks, Emergency Shutdown’s etc.).
It introduces requirements for improved management systems to enforce
independence from other Independent Protection Layers (IPLs). It requires
verification that the performance of each Safety Instrumented Function (SIF)
will be met during its lifetime. The performance criteria are documented as the
target SIL or risk reduction factor for each SIF. This is tied to specific values of
probability of failure on demand (PFD). The initial SIS standards did not
include systematic human errors in the example calculation for SIL in either IEC
61508 or 61511 and current working revisions, while beginning to more
rigorously acknowledge the role systematic failures play in overall performance,

2
still fall short regarding methods to quantify. While the SIL Verification
methods outlined in the standards and technical reports like ANSI/ISA
TR84.00.02 facilitate consistency, as user companies seek to obtain greater risk
reduction from their safety instrumented systems to satisfy their corporate risk
criteria, failure to adequately address potential systematic failures can lead to
overly optimistic results and a misallocation of resources intended to reduce risk
This paper shows that human error during testing, maintenance, and restoration
of a SIF can potentially dominate its Probability to Fail Dangerous (PFD) value,
calling into question whether the required risk reduction is indeed being met.
This is especially pertinent to SIL 2 and SIL 3 requirements. Example methods
for estimating the contribution of human error probability for SIL Verification
calculations are provided as well as some proven approaches for controlling
human factors that affect the base error rate (for a given mode of operation). It
also discusses ways to prevent or else detect and recover from errors made in
redundant channels (such as used in 1oo2, 1oo3, or 2oo3 voting).
1. Introduction
The failure of safety instrumented functions can be due to a number of reasons. Common
terminology in the industry characterizes these failures as either random hardware failures or
systematic failures. This paper mainly focuses on the systematic aspects; however, all equations
presented will also include the random contribution for completeness.
Systematic failures may manifest themselves via a number of failure mechanisms such as:
Manufacturer design Errors
End user design errors
Hardware installation errors
Manufacturer software design errors
End user programmable configuration errors
Human error during operation and maintenance
Management of change errors
As the list above shows, systematic error may be introduced by the manufacturer or the end user.
This paper will focus on the end user, as equipment that has been properly reviewed and certified
in accordance with IEC-61508 undergoes a formal work process specifically looking to minimize
systematic errors. It is also likely that systematic errors that do occur will manifest themselves
during the warranty period allowing appropriate response to rectify the problem to a suitable
level. In addition, this equipment is expected to undergo proven in use validation by the
manufacturers on a periodic basis.
Once under the control of the end user, the variability of application and control greatly
increases, making their control more difficult. This paper seeks to make the reader more aware
of how systematic errors may occur and how they can impact the risk reduction of safety
instrumented functions.
3
Human error during interventions with SIS can have a detrimental effect on the availability of an
SIF. There have been numerous cases where SIFs were left in bypass, etc., and an accident
occurred. One of the most notable recent events was at a facility in Institute, West Virginia,
USA (in 2008). A SIF was bypassed to allow startup to proceed more smoothly. Reactant was
allowed in without solvent and the temperature of the newly replaced residue treater ran away
and exploded, resulting in 2 fatalities and multiple injuries. In addition, it was also a near miss
with respect to a potential large release of methyl isocyanate located 80 feet from the explosion.
(See US CSB, 2011)
The focus of this paper will be on human interaction errors. These errors include errors in the
operation of the man machine interface to the SIF (such as leaving a SIF in bypass), errors during
periodic testing of the SIF, and errors during the repair of failed modules in the SIF. This last
type of human error includes the simple case of inadvertently leaving a root valve on an
instrument closed.
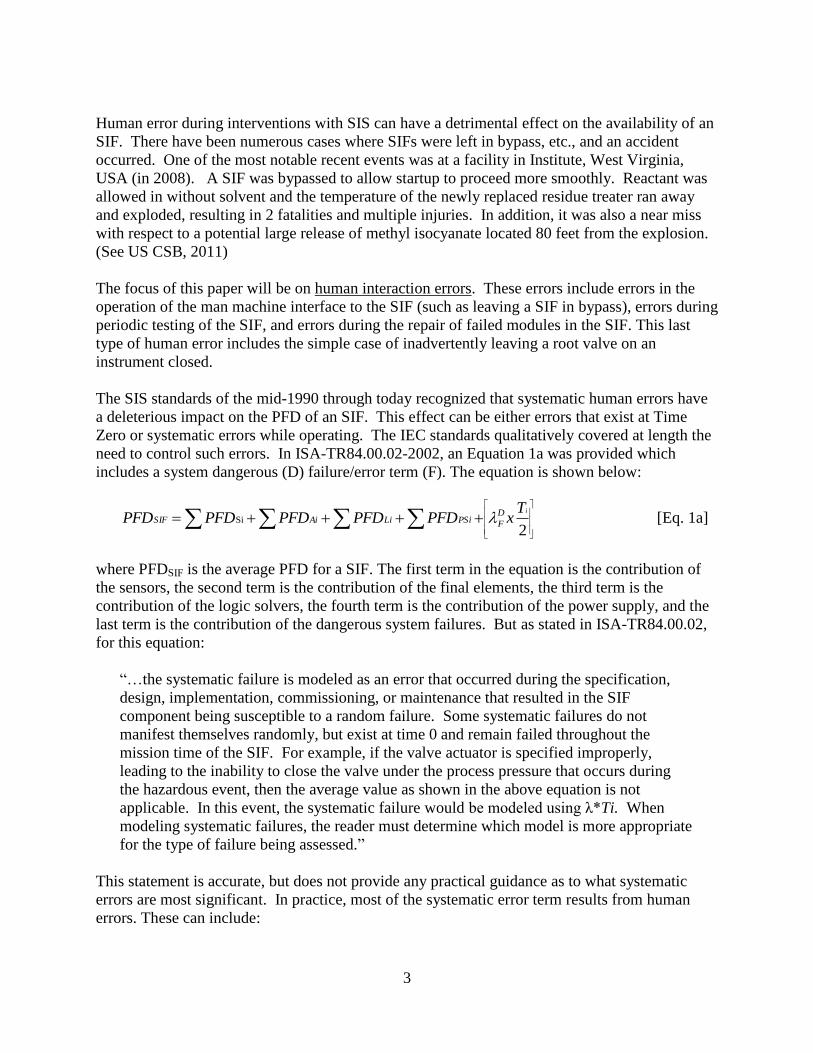
The SIS standards of the mid-1990 through today recognized that systematic human errors have
a deleterious impact on the PFD of an SIF. This effect can be either errors that exist at Time
Zero or systematic errors while operating. The IEC standards qualitatively covered at length the
need to control such errors. In ISA-TR84.00.02-2002, an Equation 1a was provided which
includes a system dangerous (D) failure/error term (F). The equation is shown below:
2
SiiT
xPFDPFDPFDPFDPFD D
FPSiLiAiSIF [Eq. 1a]
where PFDSIF is the average PFD for a SIF. The first term in the equation is the contribution of
the sensors, the second term is the contribution of the final elements, the third term is the
contribution of the logic solvers, the fourth term is the contribution of the power supply, and the
last term is the contribution of the dangerous system failures. But as stated in ISA-TR84.00.02,
for this equation:
“…the systematic failure is modeled as an error that occurred during the specification,
design, implementation, commissioning, or maintenance that resulted in the SIF
component being susceptible to a random failure. Some systematic failures do not
manifest themselves randomly, but exist at time 0 and remain failed throughout the
mission time of the SIF. For example, if the valve actuator is specified improperly,
leading to the inability to close the valve under the process pressure that occurs during
the hazardous event, then the average value as shown in the above equation is not
applicable. In this event, the systematic failure would be modeled using λ*Ti. When
modeling systematic failures, the reader must determine which model is more appropriate
for the type of failure being assessed.”
This statement is accurate, but does not provide any practical guidance as to what systematic
errors are most significant. In practice, most of the systematic error term results from human
errors. These can include:
4
Manufacturer contribution for certified equipment (Believed to be negligible relative to
end user systematic errors)
End user systematic errors:
o Design and installation errors
o Probability of being failed following proof test
o Bypass during operation
Of these end user systematic errors, the dominating contribution is generally human errors that
leave the protection failed at Time 0. These errors can occur during re-commissioning of an SIF
following routine maintenance interventions such as:
Leaving a root valve on an instrument closed
Leaving a SIF in bypass, i.e.:
o Bypassing the function due to a spurious trip and failing to remove bypass.
o Bypassing the function for startup because the system dynamics require this,
however, the designers missed this need during startup mode of the process
resulting in an operational bypass that requires human intervention to remove the
bypass rather than an automated design that removes the bypass.
o Bypassing the final element and failing to remove bypass when the test or repair
is complete
Therefore, a simple equation including the systematic error terms can replace Eq. No. 1a from
ISA-TR84.00.02. The resulting improved equation is:
SYS-HUMiSYS-PROCiPSiLiAiSIF PPFDPFDPFDPFDPFDPFD Si [Eq. A]
where we will now define:
PSiLiAiCOMP PFDPFDPFDPFDPFD Si [Eq. B]
and where the systematic error term is expanded using the simplified equation below
PFDSYSI = PFDSYS-PROCi + PSYS-HUMi [Eq. C]
The first term of Eq. C is the systematic errors and failures generated randomly by the process,
such as plugging of instrument taps by process materials or contaminants, and the second term is
the probability the SIF will be defeated by human error.
Further, the overall systematic human error term can be expanded and written as:
PSYS-HUM = Pdesign error + Pinstallation + Pproof test error + Pbypassed [Eq. D]
Of the four terms in this equation, the first two can be detected and corrected during initial
commissioning steps for the SIF. Experience has shown that the last two terms, Pproof test error and
Pbypassed are likely to dominate the PSYS-HUM, though more industry data is needed to support this
5
observation. Making the assumption that PSYS-HUM is dominated by Pproof test error and Pbypassed,
Equation D can be further simplified to:
PSYS-HUM ≈ Pproof test error + Pbypassed [Eq. E]
Experienced gained from many accident investigations and also from calculations, support the
contention that for high SIL designs, the human errors during interventions Pproof test error +
Pbypassed, dominate the calculated PFDSIF Unfortunately, most of the SIL verification
calculations today use the truncated Eq. No. 1 (instead of 1a) from ISA-TR84.00.02:
PSiLiAiSIF PFDPFDPFDPFDPFD Si [EQ. 1]
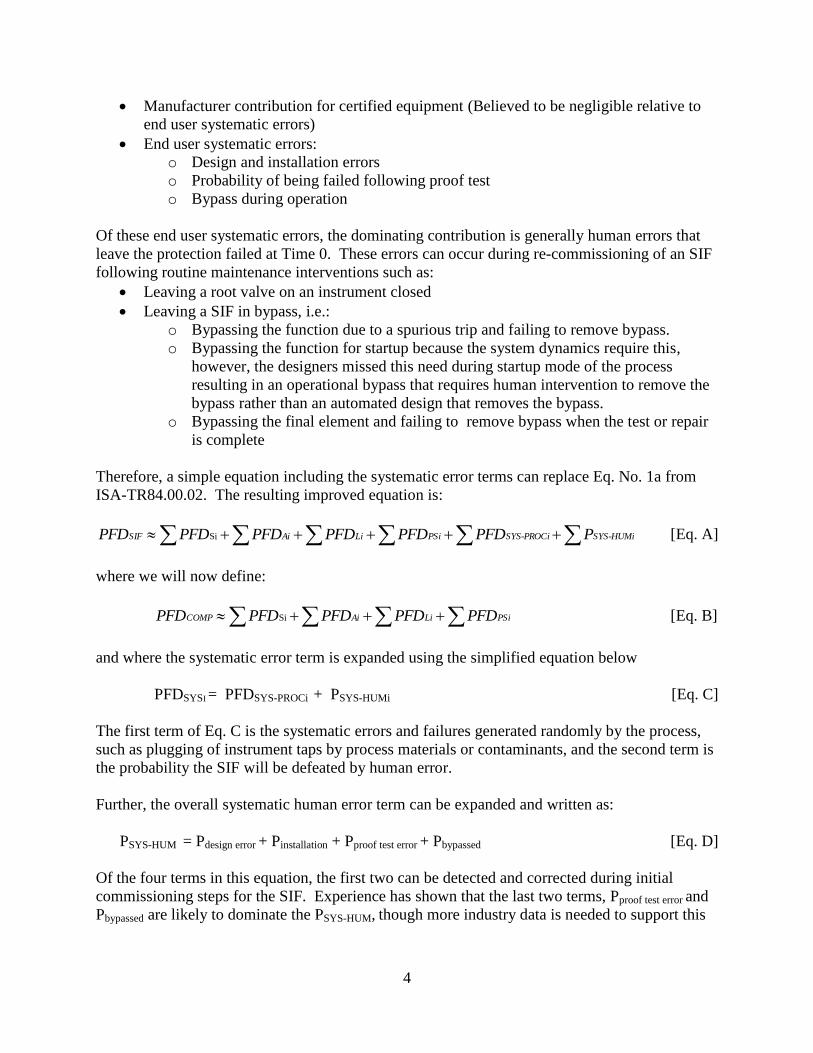
As a result, most SIL Verification calculations today ignore systematic errors when quantifying
their risk reduction capability. (Note that Equation B and Eq. No. 1; TR84.00.02 are the same.)
This is equivalent to saying the system boundary for an SIF only includes the instrumented
components (a subsystem), or Boundary A in Figure 1, instead of including the entire
independent protection layer (IPL) system, shown as Boundary B in Figure 1. In LOPA and
other quantitative risk assessments, the entire IPL system must be considered. For example, if
the IPL is a PSV, then the IPL system must include upstream and downstream features, such as
isolation valves. Therefore, the probability of leaving an isolation valve closed should be
included as a contribution to the overall PFD of the PSV IPL system.
This paper hopes that readers will better understand how to view and analyze the appropriate
boundary for an SIF.
Figure 1: Boundary for SIF
6
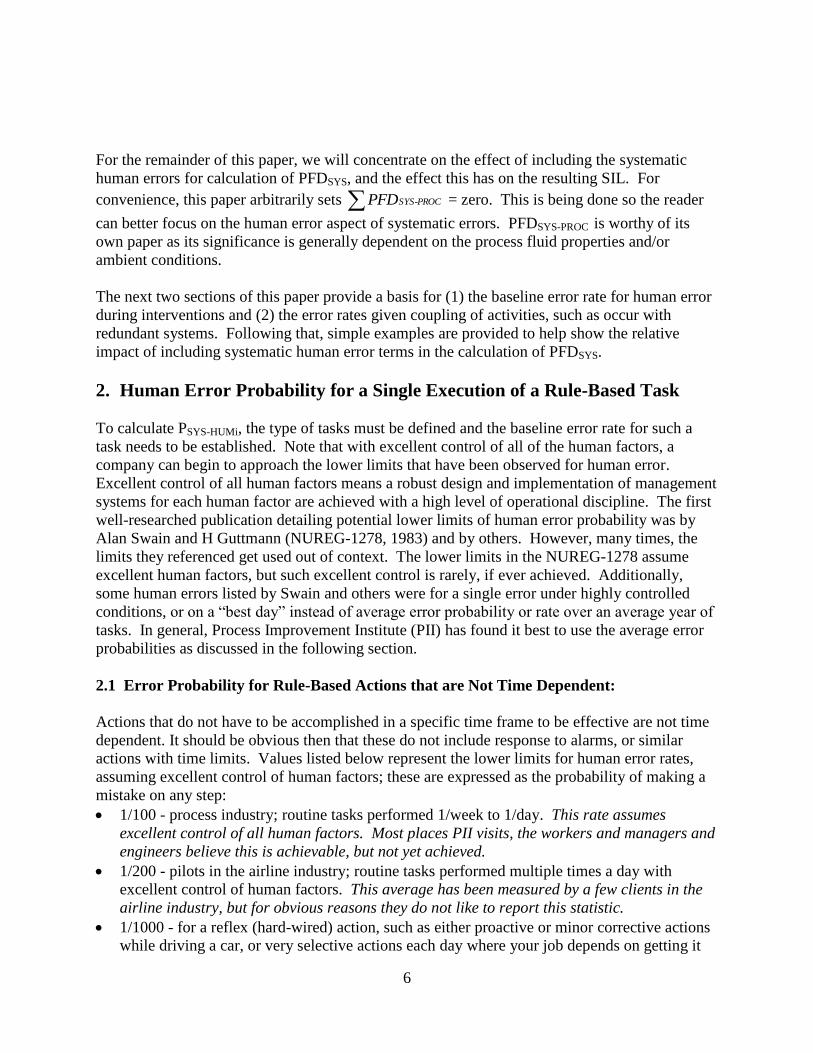
For the remainder of this paper, we will concentrate on the effect of including the systematic
human errors for calculation of PFDSYS, and the effect this has on the resulting SIL. For
convenience, this paper arbitrarily sets SYS-PROCPFD = zero. This is being done so the reader
can better focus on the human error aspect of systematic errors. PFDSYS-PROC is worthy of its
own paper as its significance is generally dependent on the process fluid properties and/or
ambient conditions.
The next two sections of this paper provide a basis for (1) the baseline error rate for human error
during interventions and (2) the error rates given coupling of activities, such as occur with
redundant systems. Following that, simple examples are provided to help show the relative
impact of including systematic human error terms in the calculation of PFDSYS.
2. Human Error Probability for a Single Execution of a Rule-Based Task
To calculate PSYS-HUMi, the type of tasks must be defined and the baseline error rate for such a
task needs to be established. Note that with excellent control of all of the human factors, a
company can begin to approach the lower limits that have been observed for human error.
Excellent control of all human factors means a robust design and implementation of management
systems for each human factor are achieved with a high level of operational discipline. The first
well-researched publication detailing potential lower limits of human error probability was by
Alan Swain and H Guttmann (NUREG-1278, 1983) and by others. However, many times, the
limits they referenced get used out of context. The lower limits in the NUREG-1278 assume
excellent human factors, but such excellent control is rarely, if ever achieved. Additionally,
some human errors listed by Swain and others were for a single error under highly controlled
conditions, or on a “best day” instead of average error probability or rate over an average year of
tasks. In general, Process Improvement Institute (PII) has found it best to use the average error
probabilities as discussed in the following section.
2.1 Error Probability for Rule-Based Actions that are Not Time Dependent:
Actions that do not have to be accomplished in a specific time frame to be effective are not time
dependent. It should be obvious then that these do not include response to alarms, or similar
actions with time limits. Values listed below represent the lower limits for human error rates,
assuming excellent control of human factors; these are expressed as the probability of making a
mistake on any step:
1/100 - process industry; routine tasks performed 1/week to 1/day. This rate assumes
excellent control of all human factors. Most places PII visits, the workers and managers and
engineers believe this is achievable, but not yet achieved.
1/200 - pilots in the airline industry; routine tasks performed multiple times a day with
excellent control of human factors. This average has been measured by a few clients in the
airline industry, but for obvious reasons they do not like to report this statistic.
1/1000 - for a reflex (hard-wired) action, such as either proactive or minor corrective actions
while driving a car, or very selective actions each day where your job depends on getting it
7
right each time and where there are error recovery paths (such as clear visual cues) to correct
the mistake. This is about the rate of running a stop sign or stop light, given no one is in
front of you at the intersection; the trouble is measuring this error rate, since you would have
to recognize (after the fact) that you made the mistake.
See the paper in this conference (Bridges and Collazo, GCPS, 2012) for more details on this
topic
2.2 Adjusting the lower limit rates to estimate a baseline rate at a site
As mentioned earlier, the lower limit rates assume excellent control of human factors in the
industry mentioned. Note that airline pilots have a lower error rate than what PII has measured
in the process industry. This is due, in part, to the much tighter control by the airlines and
regulators on factors such as fitness-for-duty (control of fatigue, control of substance abuse, etc.).
Excellent control of human factors is not achieved in many organizations; therefore the human
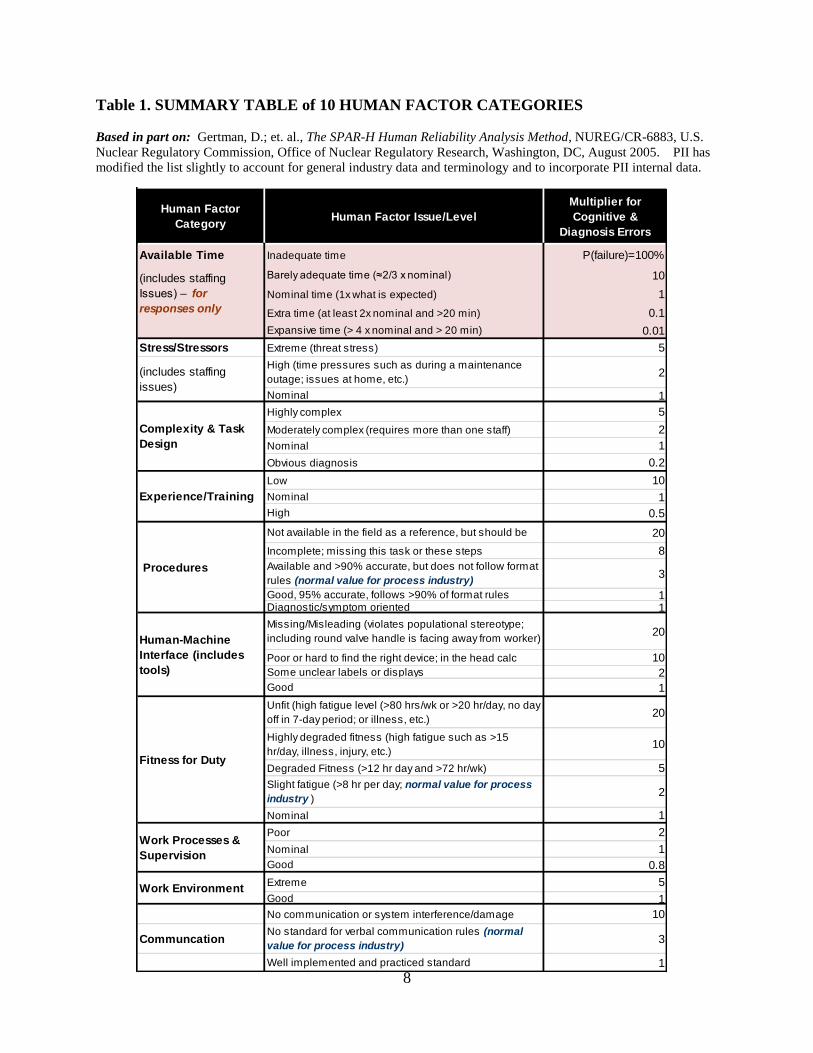
error rates will be higher than the lower limit, perhaps much as much as 20 times higher. Table 1
provides adjustment factors for each human factor. These factors can be used to adjust the lower
limit of error rate upward or downward as applicable, but the factors should not be applied
independently. For instance, even in the worst situations, we have not seen an error rate for an
initiating event or initial maintenance error higher than 1/5, although subsequent steps, given an
initial error can have an error rate approaching 1 due to coupling or dependency.
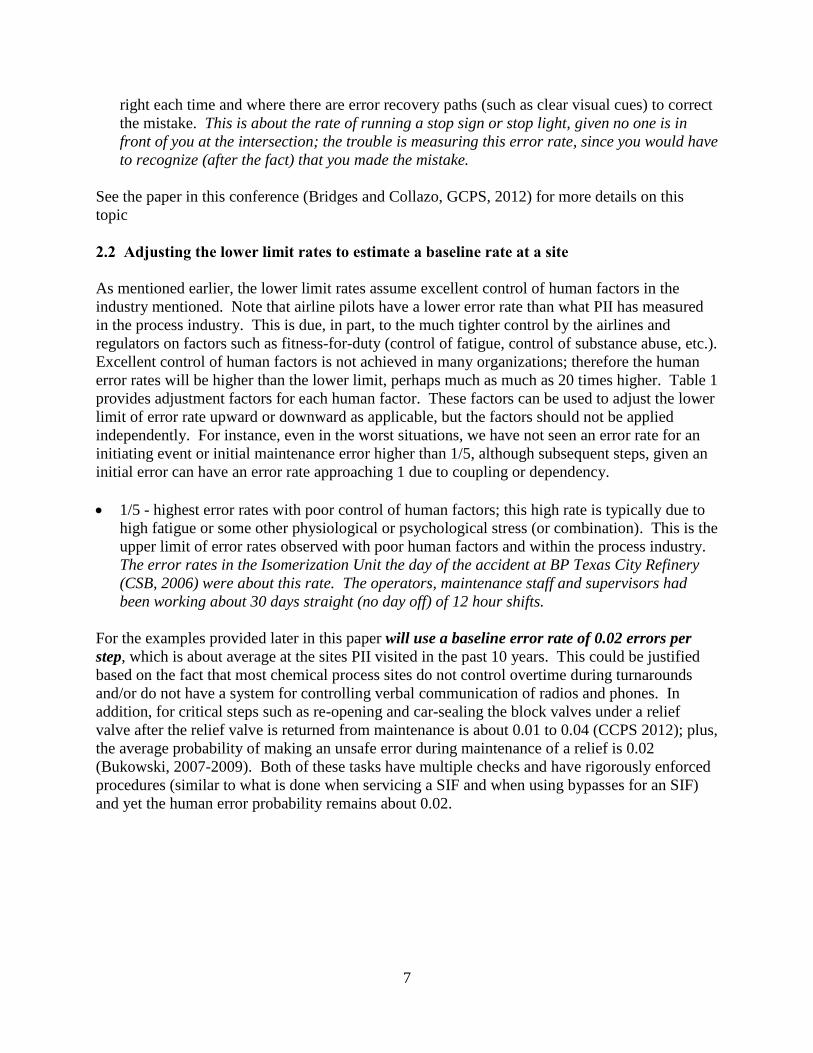
1/5 - highest error rates with poor control of human factors; this high rate is typically due to
high fatigue or some other physiological or psychological stress (or combination). This is the
upper limit of error rates observed with poor human factors and within the process industry.
The error rates in the Isomerization Unit the day of the accident at BP Texas City Refinery
(CSB, 2006) were about this rate. The operators, maintenance staff and supervisors had
been working about 30 days straight (no day off) of 12 hour shifts.
For the examples provided later in this paper will use a baseline error rate of 0.02 errors per
step, which is about average at the sites PII visited in the past 10 years. This could be justified
based on the fact that most chemical process sites do not control overtime during turnarounds
and/or do not have a system for controlling verbal communication of radios and phones. In
addition, for critical steps such as re-opening and car-sealing the block valves under a relief
valve after the relief valve is returned from maintenance is about 0.01 to 0.04 (CCPS 2012); plus,
the average probability of making an unsafe error during maintenance of a relief is 0.02
(Bukowski, 2007-2009). Both of these tasks have multiple checks and have rigorously enforced
procedures (similar to what is done when servicing a SIF and when using bypasses for an SIF)
and yet the human error probability remains about 0.02.
8
Human Factor
CategoryHuman Factor Issue/Level
Multiplier for
Cognitive &
Diagnosis Errors
Available Time Inadequate time P(failure)=100%
Barely adequate time (≈2/3 x nominal) 10
Nominal time (1x what is expected) 1
Extra time (at least 2x nominal and >20 min) 0.1
Expansive time (> 4 x nominal and > 20 min) 0.01
Stress/Stressors Extreme (threat stress) 5
High (time pressures such as during a maintenance
outage; issues at home, etc.)2
Nominal 1
Highly complex 5
Moderately complex (requires more than one staff) 2
Nominal 1
Obvious diagnosis 0.2
Low 10
Nominal 1
High 0.5
Not available in the field as a reference, but should be 20
Incomplete; missing this task or these steps 8
Available and >90% accurate, but does not follow format
rules (normal value for process industry)3
Good, 95% accurate, follows >90% of format rules 1Diagnostic/symptom oriented 1
Missing/Misleading (violates populational stereotype;
including round valve handle is facing away from worker)20
Poor or hard to find the right device; in the head calc 10
Some unclear labels or displays 2
Good 1
Unfit (high fatigue level (>80 hrs/wk or >20 hr/day, no day
off in 7-day period; or illness, etc.) 20
Highly degraded fitness (high fatigue such as >15
hr/day, illness, injury, etc.)10
Degraded Fitness (>12 hr day and >72 hr/wk) 5
Slight fatigue (>8 hr per day; normal value for process
industry )2
Nominal 1
Poor 2
Nominal 1
Good 0.8
Extreme 5
Good 1
No communication or system interference/damage 10
CommuncationNo standard for verbal communication rules (normal
value for process industry)3
Well implemented and practiced standard 1
(includes staffing
Issues) – for
responses only
(includes staffing
issues)
Work Environment
Complexity & Task
Design
Experience/Training
Procedures
Human-Machine
Interface (includes
tools)
Fitness for Duty
Work Processes &
Supervision
Table 1. SUMMARY TABLE of 10 HUMAN FACTOR CATEGORIES
Based in part on: Gertman, D.; et. al., The SPAR-H Human Reliability Analysis Method, NUREG/CR-6883, U.S.
Nuclear Regulatory Commission, Office of Nuclear Regulatory Research, Washington, DC, August 2005. PII has
modified the list slightly to account for general industry data and terminology and to incorporate PII internal data.
9
3. Human Error Probability for Multiple Executions of a Rule-Based Task
Coupled (dependent) Error Rates: Coupling represents the probability of repeating an error (or
repeating success) on a second identical task, given that an error was made on the first task. The
increased probability of failure on subsequent tasks given that an error has already been made is
known as dependence. The list below provides some starting point guidance on values to use:
1/20 to1/90 - if the same tasks are separated in time and if visual cues are not present to re-
enforce the mistake path. This error rate assumes a baseline error rate of 1/100 with
excellent human factors. If the baseline error is higher, then this rate will increase as well.
1/2 - if same two tasks performed back-to-back and strong visual cue is present, and if a
mistake is made on the first step of the two. This error rate assumes a baseline error of
1/100 with excellent human factors. If there the baseline error is higher, then this rate will
increase as well.
8/10 - if same three tasks performed back-to-back and strong visual cue is present, and if a
mistake is made on the first two steps of the three.
Two or more people become the same as one person (with respect to counting of errors from
the group), if people are working together for more than three days; this is due to the trust
that can rapidly build.
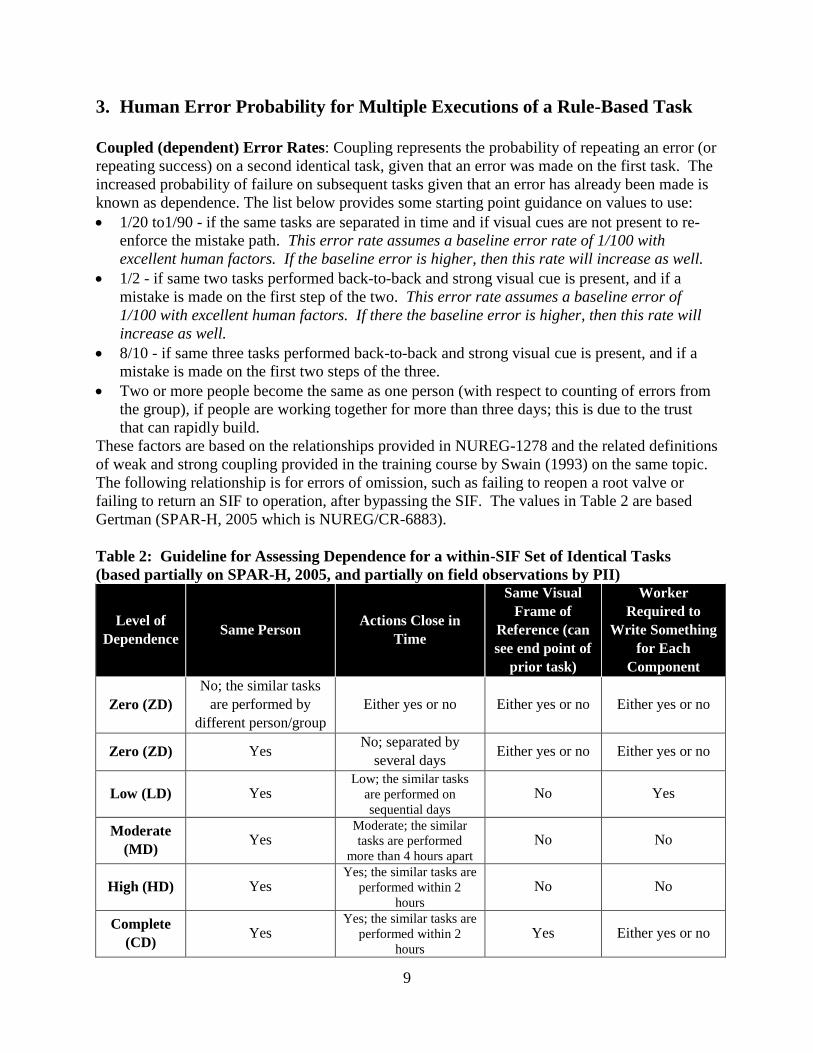
These factors are based on the relationships provided in NUREG-1278 and the related definitions
of weak and strong coupling provided in the training course by Swain (1993) on the same topic.
The following relationship is for errors of omission, such as failing to reopen a root valve or
failing to return an SIF to operation, after bypassing the SIF. The values in Table 2 are based
Gertman (SPAR-H, 2005 which is NUREG/CR-6883).
Table 2: Guideline for Assessing Dependence for a within-SIF Set of Identical Tasks
(based partially on SPAR-H, 2005, and partially on field observations by PII)
Level of
Dependence Same Person
Actions Close in
Time
Same Visual
Frame of
Reference (can
see end point of
prior task)
Worker
Required to
Write Something
for Each
Component
Zero (ZD)
No; the similar tasks
are performed by
different person/group
Either yes or no Either yes or no Either yes or no
Zero (ZD) Yes No; separated by
several days Either yes or no Either yes or no
Low (LD) Yes Low; the similar tasks
are performed on
sequential days
No Yes
Moderate
(MD) Yes
Moderate; the similar
tasks are performed
more than 4 hours apart
No No
High (HD) Yes Yes; the similar tasks are
performed within 2
hours
No No
Complete
(CD) Yes
Yes; the similar tasks are
performed within 2
hours
Yes Either yes or no
10
One can readily conclude that staggering of maintenance tasks for different channels of the same
SIF or for related SIFs will greatly reduce the level of dependent errors. Unfortunately, most
sites PII visits do not stagger the inspection, test, or calibration of redundant channels of the
same SIF or of similar SIF; the reason they cite is the cost of staggering the staff. While there is
a perceived short-term higher cost, the answer may be different when lifecycle costs are
analyzed.
Once the level of dependence is known, the probability of either repeat success or repeating
errors on identical tasks can be estimated. For these probabilities, we use Table 3, which is a re-
typing of Table 20-17 from NUREG-1278 (and the similar table in SPAR-H [Gertman, 2005]).
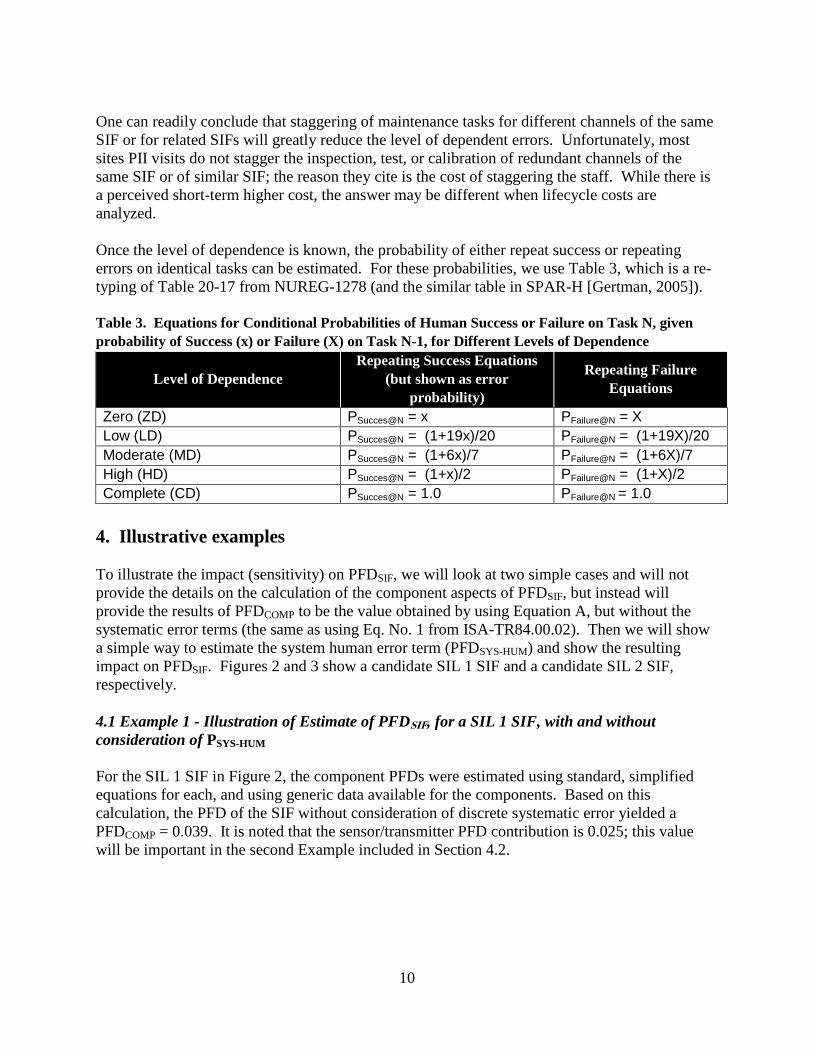
Table 3. Equations for Conditional Probabilities of Human Success or Failure on Task N, given
probability of Success (x) or Failure (X) on Task N-1, for Different Levels of Dependence
Level of Dependence
Repeating Success Equations
(but shown as error
probability)
Repeating Failure
Equations
Zero (ZD) PSucces@N = x PFailure@N = X
Low (LD) PSucces@N = (1+19x)/20 PFailure@N = (1+19X)/20
Moderate (MD) PSucces@N = (1+6x)/7 PFailure@N = (1+6X)/7
High (HD) PSucces@N = (1+x)/2 PFailure@N = (1+X)/2
Complete (CD) PSucces@N = 1.0 PFailure@N = 1.0
4. Illustrative examples
To illustrate the impact (sensitivity) on PFDSIF, we will look at two simple cases and will not
provide the details on the calculation of the component aspects of PFDSIF, but instead will
provide the results of PFDCOMP to be the value obtained by using Equation A, but without the
systematic error terms (the same as using Eq. No. 1 from ISA-TR84.00.02). Then we will show
a simple way to estimate the system human error term (PFDSYS-HUM) and show the resulting
impact on PFDSIF. Figures 2 and 3 show a candidate SIL 1 SIF and a candidate SIL 2 SIF,
respectively.
4.1 Example 1 - Illustration of Estimate of PFDSIF, for a SIL 1 SIF, with and without
consideration of PSYS-HUM
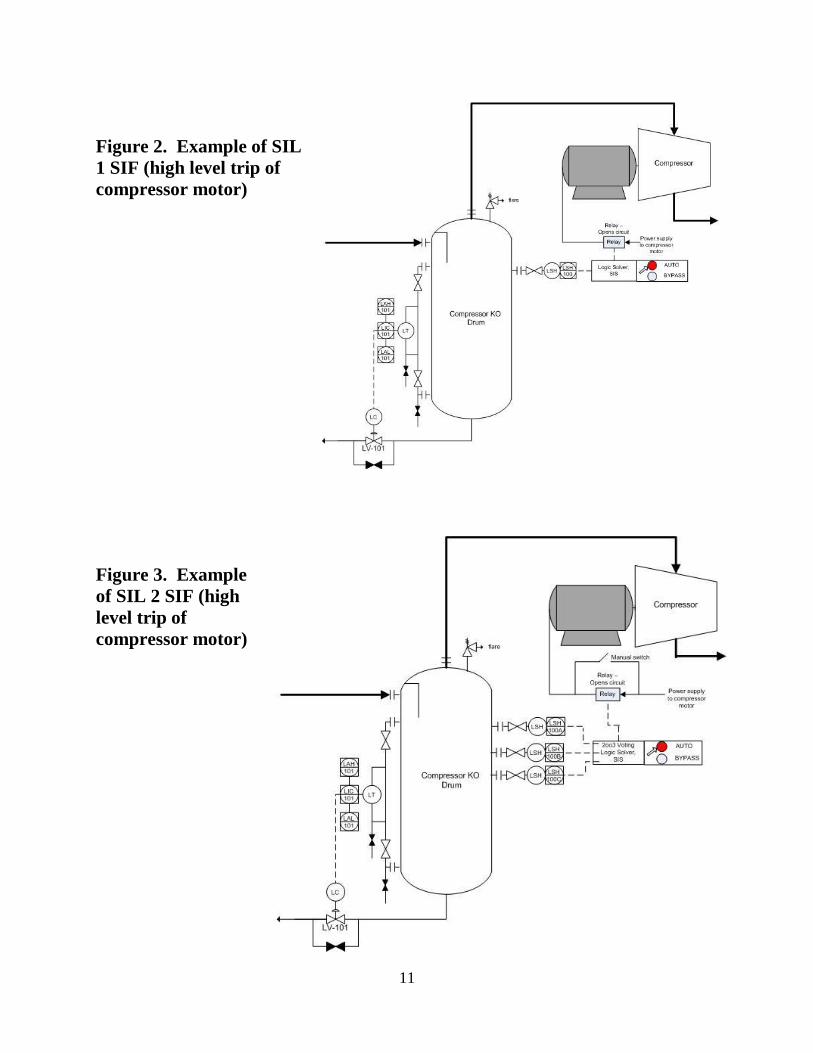
For the SIL 1 SIF in Figure 2, the component PFDs were estimated using standard, simplified
equations for each, and using generic data available for the components. Based on this
calculation, the PFD of the SIF without consideration of discrete systematic error yielded a
PFDCOMP = 0.039. It is noted that the sensor/transmitter PFD contribution is 0.025; this value
will be important in the second Example included in Section 4.2.
11
Figure 2. Example of SIL
1 SIF (high level trip of
compressor motor)
Figure 3. Example
of SIL 2 SIF (high
level trip of
compressor motor)
12
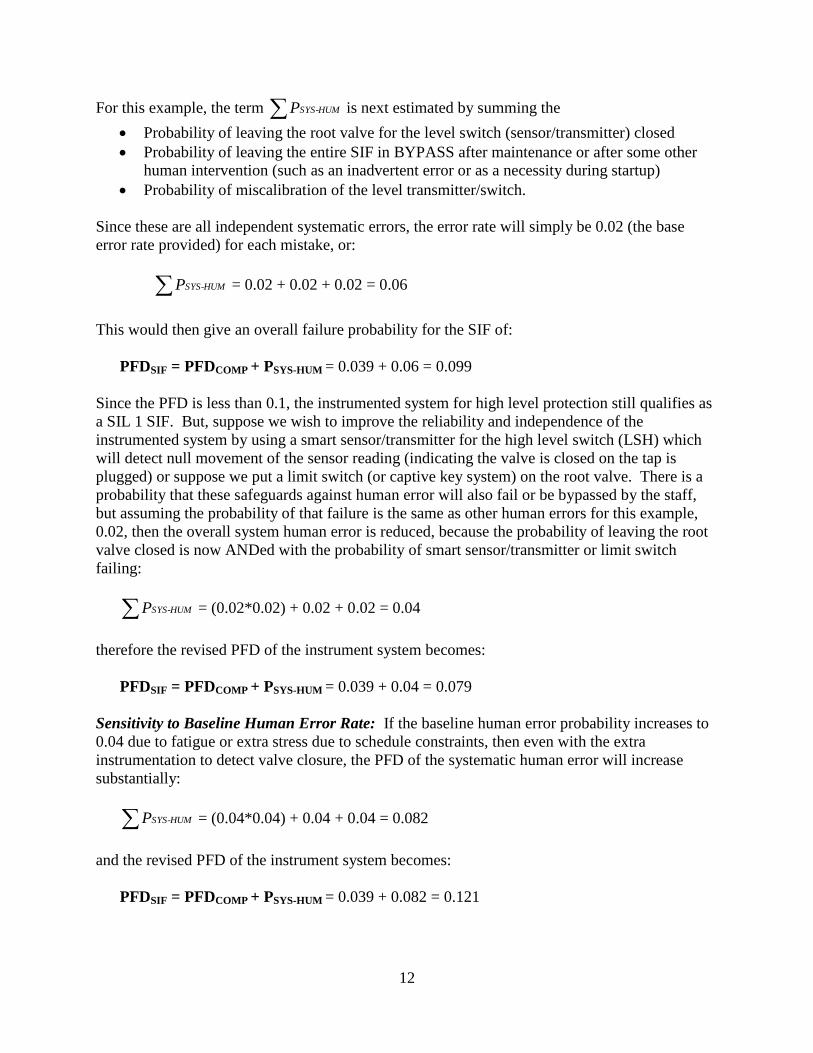
For this example, the term SYS-HUMP is next estimated by summing the
Probability of leaving the root valve for the level switch (sensor/transmitter) closed
Probability of leaving the entire SIF in BYPASS after maintenance or after some other
human intervention (such as an inadvertent error or as a necessity during startup)
Probability of miscalibration of the level transmitter/switch.
Since these are all independent systematic errors, the error rate will simply be 0.02 (the base
error rate provided) for each mistake, or:
SYS-HUMP = 0.02 + 0.02 + 0.02 = 0.06
This would then give an overall failure probability for the SIF of:
PFDSIF = PFDCOMP + PSYS-HUM = 0.039 + 0.06 = 0.099
Since the PFD is less than 0.1, the instrumented system for high level protection still qualifies as
a SIL 1 SIF. But, suppose we wish to improve the reliability and independence of the
instrumented system by using a smart sensor/transmitter for the high level switch (LSH) which
will detect null movement of the sensor reading (indicating the valve is closed on the tap is
plugged) or suppose we put a limit switch (or captive key system) on the root valve. There is a
probability that these safeguards against human error will also fail or be bypassed by the staff,
but assuming the probability of that failure is the same as other human errors for this example,
0.02, then the overall system human error is reduced, because the probability of leaving the root
valve closed is now ANDed with the probability of smart sensor/transmitter or limit switch
failing:
SYS-HUMP = (0.02*0.02) + 0.02 + 0.02 = 0.04
therefore the revised PFD of the instrument system becomes:
PFDSIF = PFDCOMP + PSYS-HUM = 0.039 + 0.04 = 0.079
Sensitivity to Baseline Human Error Rate: If the baseline human error probability increases to
0.04 due to fatigue or extra stress due to schedule constraints, then even with the extra
instrumentation to detect valve closure, the PFD of the systematic human error will increase
substantially:
SYS-HUMP = (0.04*0.04) + 0.04 + 0.04 = 0.082
and the revised PFD of the instrument system becomes:
PFDSIF = PFDCOMP + PSYS-HUM = 0.039 + 0.082 = 0.121
13
In this modified case, which is applicable to about a third of the facilities PII has visited in the
past 10 years (due primarily to fatigue), the instrumented system no longer qualifies as a SIL 1.
The human error for miscalibration is very difficult to reduce, unless there are redundancy and
voting of the level sensor/transmitters; then miscalibration errors can be essentially eliminated as
an important contribution to human error. This case will be explored in Section 4.2 as part of
Example 2.
The composite error of leaving the entire system in bypass is usually made up of (1) the
inadvertent error to return the system to AUTO after maintenance and (2) the probability that the
staff will make the intentional decision to leave the SIF in bypass, for perhaps a reason not
anticipated by the designers. Management of change (MOC) should address the latter case, but
the probability of MOC failing is the same as the error rate used already, since the error
probability used was a lumped error for leaving the SIF bypassed for whatever reason.
Therefore, this error rate normally cannot be reduced, even after adding repeating alarms to alert
the staff that the SIF is still bypassed; the staff will hear and acknowledge the alarms, but will
leave the system in bypass intentionally. Again, this will be bad only if the designers failed to
anticipate this need and therefore failed to have a different IPL provided when it is necessary to
bypass for operational requirements or if the MOC fails to engage the designers allowing for a
proper design fix.
4.2 Example 2 - Illustration of Estimate of PFDSIF, for a SIL 2 SIF, with and without
consideration of PSYS-HUM
For the SIL 2 SIF described in Figure 3, the component PFDs were estimated using standard,
simplified equations for each, and using data available for component. For the case where the
sensors are voted 2oo3, the PFD of the SIF without consideration of discrete systematic error
yielded PFDCOMP = 0.008 (of which the 2oo3 voted sensor portion is 0.0025 and the 2oo3 voted
logic solver is 0.003).
For this example, the term SYS-HUMP is next estimated by summing the
Probability of leaving the level sensor/transmitters 2oo3 root valves closed, causing an
unsafe failure. (This calculation is shown later.
Probability of miscalibration of the level transmitter/switch. This calculation is shown
later, but for this to be significant probability, all two of the three sensors/transmitters
must be miscalibrated, unless there is comparison checking, then it would require
miscalibration of all three transmitters.
Probability of leaving the entire SIF in BYPASS after maintenance or after some other
human intervention such as an inadvertent error or a necessity during startup; as before,
we will use the base error probability of 0.02 as a starting point.
Probability of leaving the relay bypass closed. As before, we will use the base error
probability of 0.02 as a starting point.
To aid in the calculation of the probability of leaving 2oo3 root valves closed, we use an event
tree to show the conditional probabilities for leaving Valve B closed, given Valve A is open or
closed, and similarly, the conditional probability of leaving Valve C closed, given Valve A or B
14
Start Action A Action B Action C
2oo3 Vote
Dangerous
Correct 0.995
Correct 0.990
Incorrect 0.005
Correct 0.98
Correct 0.495
Incorrect 0.010
Incorrect 0.505 0.00495
Correct 0.745
Correct 0.490
Incorrect 0.255 0.00025
Incorrect 0.02
Correct 0.245 * 0.00025
Incorrect 0.510
Incorrect 0.755 0.00770
TOTAL= 0.01315
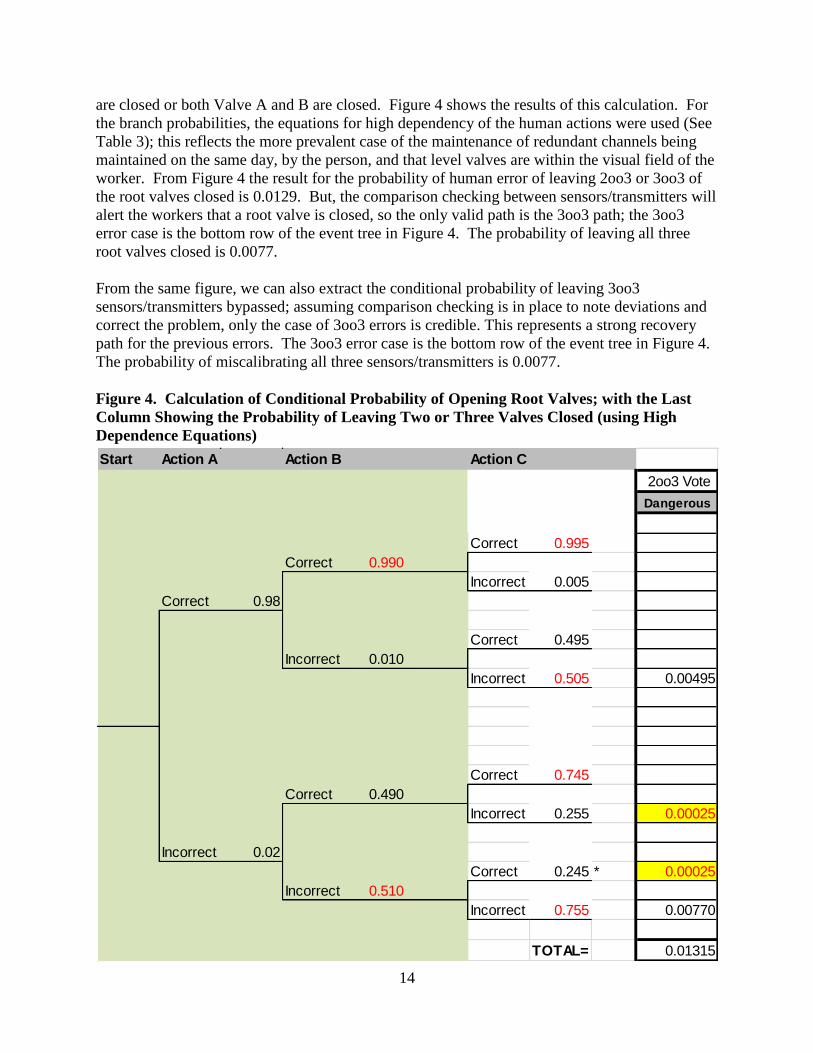
are closed or both Valve A and B are closed. Figure 4 shows the results of this calculation. For
the branch probabilities, the equations for high dependency of the human actions were used (See
Table 3); this reflects the more prevalent case of the maintenance of redundant channels being
maintained on the same day, by the person, and that level valves are within the visual field of the
worker. From Figure 4 the result for the probability of human error of leaving 2oo3 or 3oo3 of
the root valves closed is 0.0129. But, the comparison checking between sensors/transmitters will
alert the workers that a root valve is closed, so the only valid path is the 3oo3 path; the 3oo3
error case is the bottom row of the event tree in Figure 4. The probability of leaving all three
root valves closed is 0.0077.
From the same figure, we can also extract the conditional probability of leaving 3oo3
sensors/transmitters bypassed; assuming comparison checking is in place to note deviations and
correct the problem, only the case of 3oo3 errors is credible. This represents a strong recovery
path for the previous errors. The 3oo3 error case is the bottom row of the event tree in Figure 4.
The probability of miscalibrating all three sensors/transmitters is 0.0077.
Figure 4. Calculation of Conditional Probability of Opening Root Valves; with the Last
Column Showing the Probability of Leaving Two or Three Valves Closed (using High
Dependence Equations)
15
Start Action A Action B Action C
2oo3 Vote
Dangerous
Correct 1.000
Correct 1.000
Incorrect 0.000
Correct 0.9996
Correct 0.990
Incorrect 0.000
Incorrect 0.010 0.00000
Correct 0.995
Correct 0.990
Incorrect 0.000 0.00000
Incorrect 0.0004
Correct 0.990 * 0.00000
Incorrect 0.010
Incorrect 0.010 0.00000
TOTAL= 0.00000
SYS-HUMP = 0.0077 + 0.0077 + 0.02 + 0.02 = 0.055
This would then give an overall failure probability for the SIF of:
PFDSIF = PFDCOMP + PSYS-HUM = 0.008 + 0.055 = 0.063
Since the PFD is greater than 0.01, the instrumented system for high level protection in this
example does not qualify as a SIL 2 SIF when accounting for human error probabilities related to
interventions with the SIF.
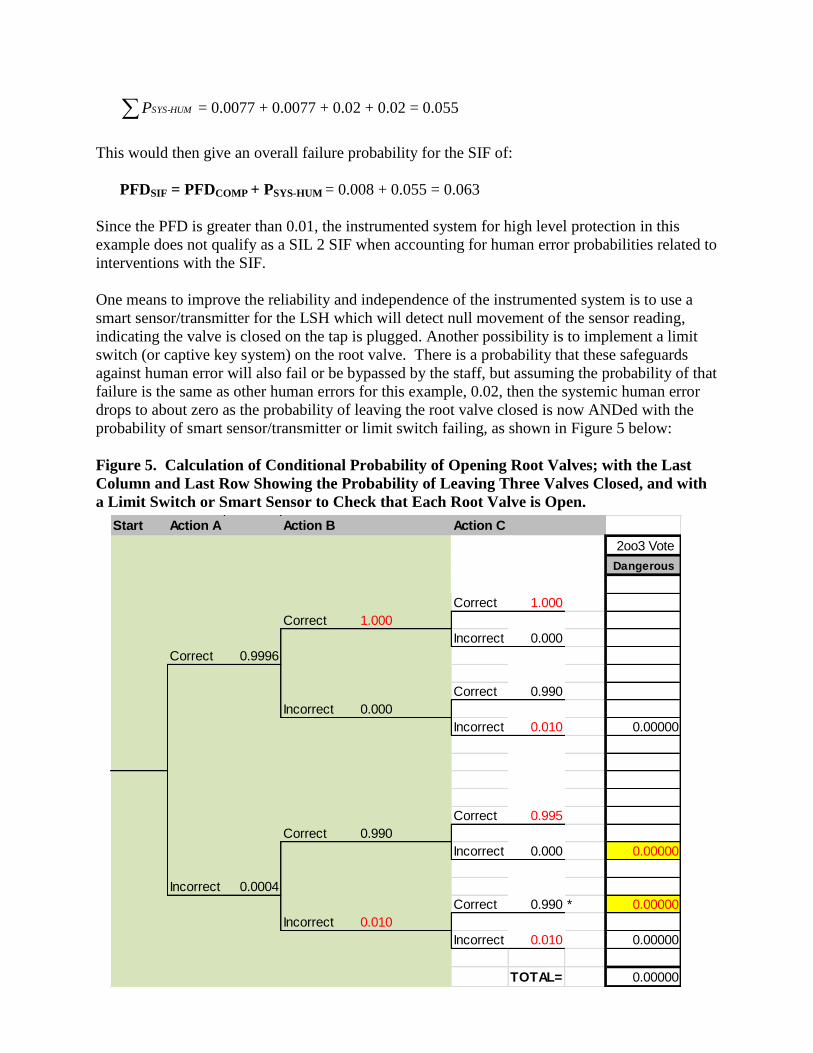
One means to improve the reliability and independence of the instrumented system is to use a
smart sensor/transmitter for the LSH which will detect null movement of the sensor reading,
indicating the valve is closed on the tap is plugged. Another possibility is to implement a limit
switch (or captive key system) on the root valve. There is a probability that these safeguards
against human error will also fail or be bypassed by the staff, but assuming the probability of that
failure is the same as other human errors for this example, 0.02, then the systemic human error
drops to about zero as the probability of leaving the root valve closed is now ANDed with the
probability of smart sensor/transmitter or limit switch failing, as shown in Figure 5 below:
Figure 5. Calculation of Conditional Probability of Opening Root Valves; with the Last
Column and Last Row Showing the Probability of Leaving Three Valves Closed, and with
a Limit Switch or Smart Sensor to Check that Each Root Valve is Open.
16
SYS-HUMP = 0.0000 + 0.0077 + 0.02 +0.02 = 0.048
In this case the revised PFD of the instrument system becomes:
PFDSIF = PFDCOMP + PSYS-HUM = 0.008 + 0.048 = 0.056
Since the PFD is still greater than 0.01, the instrumented system for high level protection still
does not qualify as a SIL 2 SIF when accounting for human error probabilities related to
interventions with the SIF. But, we have reduced the errors related to dependent failures during
checking of the sensors/transmitters as much as possible.
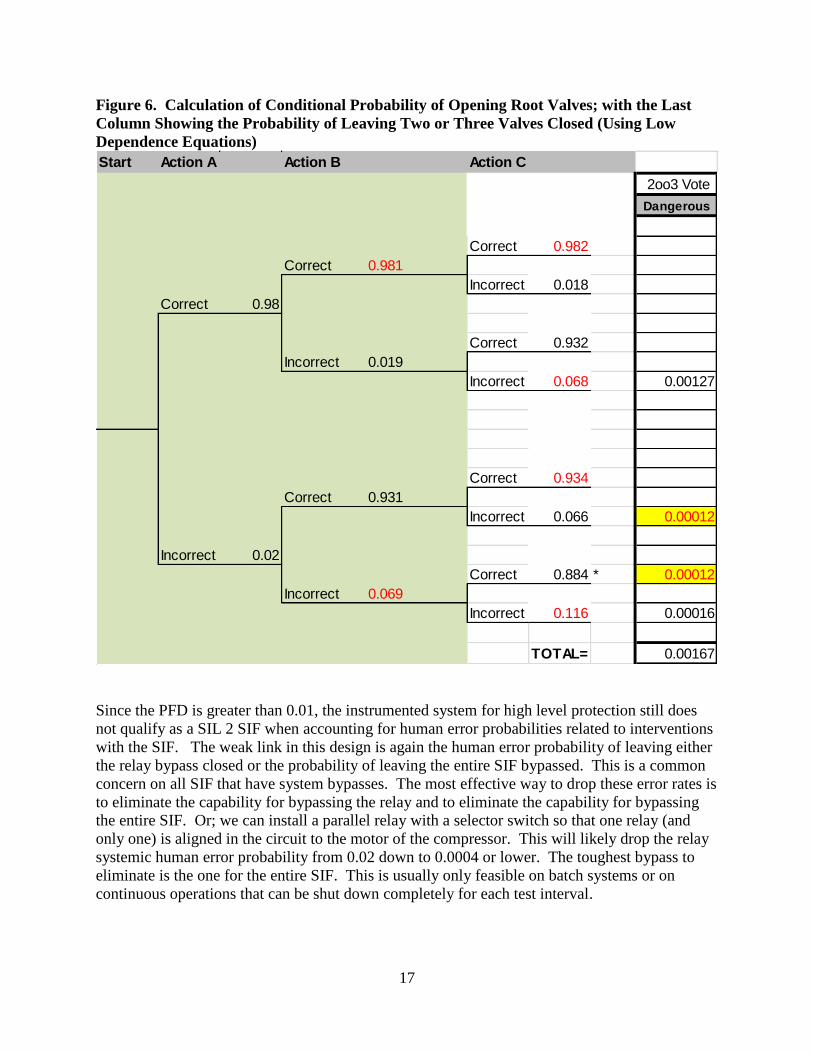
As another alternative (instead of using smart sensors/transmitters or instead of installing limit
switches on the root valves) we can reduce potential dependent human error by staggering
maintenance activities across different shifts. This would drop the dependence to Low. The
dependent error calculations using the Low Dependence equations of Table 3 is shown in Figure
6. From Figure 6, assuming low dependency of human error, the result for the probability of
human error of leaving 3oo3 of the root valves closed in 0.00016 (assuming that comparison of
sensor readings alerts the workers that one root valve is closed)
From the same figure, we can also extract the conditional probability of leaving 3oo3
sensors/transmitters. As before, only the case of 3oo3 errors is considered credible, since it was
assumed that sensor comparison checking was implemented where any transmitter not
miscalibrated will provide the workers an opportunity to note the deviation and take corrective
action to fix the problem; this represents a strong recovery path for the previous errors. The
3oo3 error case is the bottom row of the event tree in Figure 6. The probability of miscalibrating
all three sensors/transmitters is 0.00016.
SYS-HUMP = 0.00016 + 0.00016 + 0.02 + 0.02 = 0.040
This would then give an overall failure probability for the SIF of:
PFDSIF = PFDCOMP + PSYS-HUM = 0.008 + 0.042 = 0.050
17
Figure 6. Calculation of Conditional Probability of Opening Root Valves; with the Last
Column Showing the Probability of Leaving Two or Three Valves Closed (Using Low
Dependence Equations)
Start Action A Action B Action C
2oo3 Vote
Dangerous
Correct 0.982
Correct 0.981
Incorrect 0.018
Correct 0.98
Correct 0.932
Incorrect 0.019
Incorrect 0.068 0.00127
Correct 0.934
Correct 0.931
Incorrect 0.066 0.00012
Incorrect 0.02
Correct 0.884 * 0.00012
Incorrect 0.069
Incorrect 0.116 0.00016
TOTAL= 0.00167
Since the PFD is greater than 0.01, the instrumented system for high level protection still does
not qualify as a SIL 2 SIF when accounting for human error probabilities related to interventions
with the SIF. The weak link in this design is again the human error probability of leaving either
the relay bypass closed or the probability of leaving the entire SIF bypassed. This is a common
concern on all SIF that have system bypasses. The most effective way to drop these error rates is
to eliminate the capability for bypassing the relay and to eliminate the capability for bypassing
the entire SIF. Or; we can install a parallel relay with a selector switch so that one relay (and
only one) is aligned in the circuit to the motor of the compressor. This will likely drop the relay
systemic human error probability from 0.02 down to 0.0004 or lower. The toughest bypass to
eliminate is the one for the entire SIF. This is usually only feasible on batch systems or on
continuous operations that can be shut down completely for each test interval.
18
Sensitivity to Baseline Human Error Rate: Obviously, if the baseline human error probability
increases to 0.04 due to extra fatigue or extra stress due to schedule constraints, the PFD of the
systematic human error will increase substantially and the SIL 2 target becomes even less
attainable. Likewise, if suitable operational discipline is adopted to reduce the baseline human
error with independent performance measurement to validate the results, the human error rate
will be reduced (though it is likely not possible to reduce the baseline human error probability
enough to achieve a SIL 2 target, if a SIF bypass is present).
5. Acronyms Used
1oo2 One out of two voting architecture
1oo3 One out of three voting architecture
2oo3 Two out of three voting architecture
3oo3 Three out of three voting architecture
λ Failure Rate
A Final element
CD Complete Dependence
COMP Random hardware failure contributions to overall PFD
D Dangerous
F Failure/error term
HD High Dependence
HRA Human Reliability Analysis
IPL Independent Protection Layer
LD Low Dependence
L Logic Solver
LOPA Layer of Protection Analysis
MOC Management of Change
P Probability
PES Programmable Electronic System
PFD Probability of Failure (dangerous) on Demand
PII Process Improvement Institute, Inc.
PS Power supply
PSV Pressure Safety Valve
S Sensor
SIF Safety Instrumented Function
SIL Safety Integrity Level
SIS Safety Instrumented System
SYS Systematic failure contributions to overall PFD
SYS-HUM Systematic errors and failures generated by human error
SYS-PROC Systematic errors and failures generated randomly by the process
TI Proof Test Interval
ZD Zero Dependence
19
6. Conclusion
As can be seen from the quantitative examples, systematic errors have the potential to
significantly impact a SIF in a negative manner. In addition, SIL verifications performed today
often do not account for this contribution to probability of failure. In such cases, it becomes
increasingly likely that the risk reduction assumed by analysts (who rely upon a SIL 2 to have a
PFD of 0.01 or lower) is not sufficient to satisfy corporate risk criteria when the actual risk
reduction estimated for the IPL is being counted on, such as an SIF replacing a relief valve, as
opposed to analyses that are simply performed on a comparative basis where consistency is more
important than the actual numbers.
The paper points to the need for companies to begin:
Accounting for systematic (and especially human systematic error probability) in SIL
Verifications; otherwise the risk reduction factor from this IPL will be unrealistically
optimistic.
Taking a more in-depth look at the management systems and work process in place for
operations and maintenance and their associated training and revalidation of
performance.
Utilizing the mathematics presented, companies can gain insight as to the relative effectiveness
of their practices and find areas where improvements can be made without adding any real cost.
Just as improved human factors improve safety, this is one of those cases where improved
performance if done properly with true operational discipline, should also improve reliability and
plant availability.
7. References
1. ANSI/ISA 84.00.01-2004 (IEC61511-1 Mod), Functional Safety: Safety Instrumented
Systems for the Process Industry Sector - Part 1: Framework, Definitions, System,
Hardware and Software Requirements, 2004.
2. IEC 61508: Functional Safety of Electrical / Electronic / Programmable Electronic
Safety-Related Systems, IEC, 2010.
3. U.S. Chemical Safety and Hazard Investigation Board, Investigation Report, Pesticide
Chemical Runaway Reaction Pressure Vessel Explosion, Report No. 2008-08-I-WV,
January 2011.
4. U.S. Chemical Safety and Hazard Investigation Board, Investigation Report, Refinery
Explosion and Fire, Report No. Report No. 2005-04-I-TX, March 2007.
5. ISA-TR84.00.02-2002, Safety Instrumented Functions (SIF)-Safety Integrity Level (SIL)
Evaluation Techniques Part 2: Determining the SIL of a SIF via Simplified Equations.
6. Swain, A., and Guttmann, H., Handbook of Human Reliability Analysis with Emphasis on
Nuclear Power Plant Applications, Sandia National Laboratories, 1983 [this document
became NUREG/CR-1278– The Human Reliability Handbook, guidelines from the US
NRC on Human Reliability Analysis].
20
7. Swain, A., Human Reliability Analysis, Training Course, ABS Consulting (formerly JBF
Associates), 1993.
8. Swain, A., Accident Sequence Evaluation Program (ASEP): Human Reliability Analysis
Procedure, NUREG/CR-4772, U.S. Nuclear Regulatory Commission, Office of Nuclear
Regulatory Research, Washington, DC, February 1987.
9. Gertman, D.; Blackman, H.; Marble, J.; Byers, J. and Smith, C., The SPAR-H Human
Reliability Analysis Method, NUREG/CR-6883, U.S. Nuclear Regulatory Commission,
Office of Nuclear Regulatory Research, Washington, DC, August 2005.
10. Human Error Repository and Analysis (HERA) System, NUREG/CR-6903, U.S. Nuclear
Regulatory Commission, Office of Nuclear Regulatory Research, Washington, DC, 2006.
11. Layer of Protection Analysis (LOPA) Guideline, CCPS/AIChE, 2001.
12. Guidelines for Independent Protection Layers and Initiating Events, 2012, CCPS/AIChE.
13. Bukowski, Julia V. and Goble, William M., Villanova University, Analysis of Pressure
Relief Valve Proof Test Data, Process Safety Progress, AICHE, March 2009.
14. Bukowski, Julia V. and Goble, William M., Villanova University, Analysis of Pressure
Relief Valve Proof Test Data: Findings and Implications, 10th
Plant Process Safety
Symposium, AICHE, 2008.
15. Bukowski, Julia V., Results of Statistical Analysis of Pressure Relief Valve Proof Test
Data Designed to Validate a Mechanical Parts Failure Database, Technical Report,
September, exida, Sellersville, PA, 2007.