accuracy of current meter measurements - hydrologiehydrologie.org/redbooks/a099/099011.pdf ·...
TRANSCRIPT

Accuracy of current meter measurements Rolland W. Carter United States Geological Survey, Washington, D.C., U.S.A.
Abstract. The probable accuracy of a streamflow measurement made by current meter has been assessed by evaluating the separate error components. Non-random error components are: (1) errors in the current meter rating; (2) the error of velocity observation at a point: (3) the error from measuring velocity only at selected points in a vertical; and (4) the error from assuming that the depth and velocity vary linearly between stations in the cross-section, Values for each of these error components are known, based on statistical analysis of special measurc- ments made for this purpose on many different streams. Statistical combination of these errors indicates that the probable error of a streamflow measurement made by the standard procedures is about 2 per cent. The information presented can be used to determine the optimum observation procedure to attain a desired accüracy.
EXACTITUDE DU JAUGEAGE AU MOULINET
Résumé. La précision probable d'une mesure de débit faite au moyen d'un moulinet est estimée en évaluant les divers facteurs d'erreur. Les diverses erreurs non accidentelles sont : (a) l'erreur de tarage du moulinet ; (b) l'erreur de mesure de la vitesse en un point ; (c) l'erreur de mesure de la vitesse effectuée seulement en des points choisis sur la verticale ; (d) l'erreur due 2 la présomption que la profondeur et la vitesse varient d'une faGon linéaire entre les stations de la section transversale. Les valeurs de chacune de ces erreurs sont connues ?i partir des analyses statistiques de mesures spéciales effectuées ?i cette fin dans de nombreuses rivières. rétude statistique de ces erreurs montre que l'erreur probable de la mesure d'un débit par les procédés classiques est d'environ 2 %. La présente étude peut être utilisée pour déterminer la méthode d'observation optimale en vue d'obtenir une précision désirée.
PRECISI~N DE LAS MEDICIONES DE LOS CAUDALES
Resumen. La precisión probable de una medición de caudal en un curso de agua realizada con un medidor de corriente, ha sido calculada evaluando los distintos corrponentes del error. Los componentes de error no aleatorios son (a) errores en la calibración del medidor de corriente, (b) el error de la observación de velocidad en un punto, (c) el error producido al medir la velocidad solamente en los puntos seleccionados de una vertical, y (d) el error de suponer que la profundidad y la velocidad varían linealmente entre los distintos puntos de la sección transversal. Se conocen los valores para cada uno de estos componentes del error total basándose en el análisis estadístico de las mediciones especiales realizadas con estos fines en distintos cursos de agua. La combinación estadística de estos errores indica que el error posible en una medición de caudal en un curso de agua realizada con procedimientos normales, viene a ser del 2 %. Se puede utilizar la información presentada para determinar el procedimiento Óptimo de observación, para alcanzar la precisión deseada.
TOUHOCTb M3MEPEHMW BEPTYILIKAMM
86
Accuracy of current meter measurements
INTRODUCTION
Streamflow is commonly measured by the current-meter method. The accuracy of these measurements depends primarily on the performance of the current meter and the number of observations of depth and velocity that are taken in a given cross- section. Although the absolute accuracy of a single measurement cannot be deter- mined, some insight into probable accuracy can be gained from a study of the individual components of the total error. A discharge measurement is made by observing the depth and velocity at a
number of stations across a section. At each station the velocity is measured at one or more points over a time period. A time period of approximately 45 seconds is used in the United States.
Errors in measurement of depth and width are small and random in nature and thus have little effect on the accuracy of current-meter measurements. The primary sources of error are due to the following assumptions that are made in computing the discharge: 1. The rating of the current meter is correct and is applicable to the conditions of
2. The velocity observed at a point is a true time-averaged velocity. 3. The ratio between the velocity at selected points in the vertical, and the mean
4. The velocity and the depth vary with distance between stations in the section in a
The error resulting from each of these assumptions is considered separately in the statistical analysis that follows. The object of the analysis is to define the standard deviation of the discharge errors (in per cent of mean) that would result from single discharge measurements at a number of stream sites. The errors of approximately two-thirds of the measurements would lie within plus or minus one standard devia- tion. The concepts and definitions used are given in Table 1.
Each value of the ratio, R, in Table 1 is the partial discharge error, in per cent of mean for the entire section, associated with a particular source of error. For example, Ri is the error ratio for the section due to the instrument. Each value of the error ratio, r, is a velocity error.in percent of mean at a point or station in the section. For example, r, is the error ratio resulting from the shape of the vertical velocity-curve at a single station. The standard deviation, S, of a ratio R is a measure of the distribution of a particular ratio for a number of stream sites. The standard deviation, ST, of the total discharge error, RT, may be obtained from
the measurement.
velocity in the vertical is known.
linear fashion.
s; = s2 +Si + s; + SiN Ri f
87

R. W. Carter
PERFORMANCE OF CURRENT METERS
A current meter is rated by towing the meter through still water at various constant velocities and counting the number of revolutions of the rotor in a measured interval of time. It is assumed that this rating is applicable when the meter is used to measure velocity of turbulent flow in stream channels. Errors may be introduced by this assumption or by inaccuracies in the still-water rating. Repeatability of still-water rating data. A large number of runs were made with two Price cup-type meters at each of several different car velocities to establish the precision or repeatability of the data obtained in the towing tank. The variation in velocity indicated by the current-meter rotors is shown in Table 2. The standard deviation (as a percentage) decreases as the velocity increases and is less than 1 per cent at velocities greater than one foot per second. Individual versus average ratings. The United States Geological Survey has discon- tinued its practice of rating each current meter used in discharge measurement. This decision was based on a comprehensive study reported by Smoot and Carter (1969). The conclusions of this study were (a) that a single rating for a group of current meters of one manufacturer fits all observations as well as individual, repeated ratings
Table 1. Statistical concepts and definitions used in analysis of discharge measurements
Source of Partial error Partial error Standard deviation error (section ratios) (point ratios) of section ratios
- Q - Qi Instrument R. =- 1 O0
‘ Q Q - Qt v - V*
Rt = - 100 rt = - 100 Velocity pulsation Q V
SRi
Q - Qs Vertical
curve Q V m Vm - Vs
velocity Rs =- 100 Is=- sRs = s y s / f l
1. See Appendix for definition of symbols.
Table 2. Repeatability of rating data for type AA Price current meter8
Velocity Standard deviation of velocity Indicated by meter, as a percentage
Feet per Meter per Number second second of runs Meter 27 Meter 2 8
O. 25 0.08 48 1.76 2.77 0.50 0.15 24 1.69 1.74 0.75 0.23 24 1.10 0.89 1.10 0.34 20 0.89 0.73 1.50 0.46 20 0.64 0.59
88
Accuracy of current meter measurements
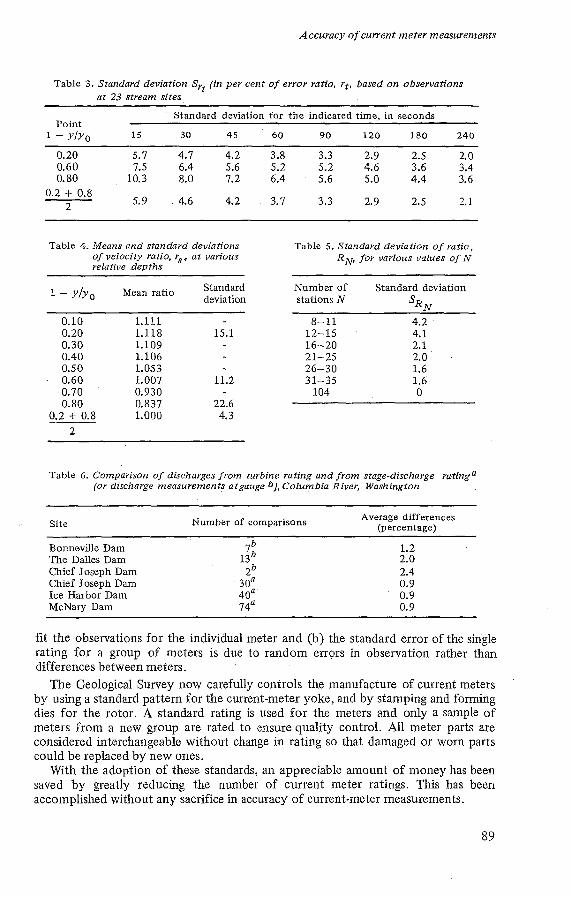
Table 3. Standard deviation ,Yrt (in per cent of error ratio, rt, based on observations at 23 stream sites
Standard deviation for the indicated time, in seconds Point
1 - YIYO 15 30 45 60 90 120 180 240
0.20 5.1 4.1 4.2 3.8 3.3 2.9 2.5 2. o 0.60 1.5 6.4 5.6 5.2 5.2 4.6 3.6 3.4 0.80 10.3 8.0 1.2 6.4 5.6 5.0 4.4 3.6
0.2 + 0.8 2 5.9 4.6 4.2 3.7 3.3 2.9 2.5 2.1
Table 4. Means and standard deviations of velocity ratio, rs, at various relative depths
Table 5. Standard deviation of ratio, RN, for various values of N
1 - y/yo Mean ratio
0.10 1.111 0.20 1.118 15.1 0.30 1.109 0.40 1.106 0.50 1.053 0.60 1.001 11.2 0.10 0.930 0.80 0.837 22.6
0.2 + 0.8 1.000 4.3
deviation
L
Number of Standard deviation stations N SR nr
8-11 4.2 12-15 4.1 16-20 2.1 21-25 2.0 26-30 1.6 31-35 1.6 104 O
Table 6. Comparison of discharges from turbine rating and from stage-discharge ratinga (or discharge measurements atgauge b), Columbia River, Washington
~
Site Number of comparisons Average differences (percentage)
~ ~ ~~ ~~
Bonneville D a m T h e Dalles D a m Chief Joseph D a m Chief Joseph D a m Ice Harbor D a m McNary D a m
~ ~~
lb
2b 13b
30a 40a 14a
1.2 2.0 2.4 0.9 0.9 o. 9
fit the observations for the individual meter and (b) the standard error of the single rating for a group of meters is due to random errors in observation rather than differences between meters. The Geological Survey now carefully controls the manufacture of current meters
by using a standard pattern for the current-meter yoke, and by stamping and forming dies for the rotor. A standard rating is used for the meters and only a sample of meters from a new group are rated to ensure quality control. All meter parts are considered interchangeable without change in rating so that damaged or worn parts could be replaced by new ones. With the adoption of these standards, an appreciable amount of money has been
saved by greatly reducing the number of current meter ratings. This has been accomplished without any sacrifice in accuracy of current-meter measurements.
89

R. W. Carter
Effect of turbulence. The applicability of still-water ratings to natural, turbulent flows is difficult to determine. Laboratory studies may be of little value because of the difference in scale of turbulence in the laboratory and in stream channels. A Price cup-type meter will rotate in still water when moved up and down but this movement may bear little relation to turbulerlt velocities in a stream channel.
Several authors have stated that crice type meters over-register and Ott type meters under-register in turbulent flow, However, comparative discharge measure- ments using Ott and Price meters reported by Townsend and Blust (1960) and by Carter and Anderson (1963) show no significant difference in the measured discharge that can be attributed to type of meter. At the present time there is no evidence that turbulence has a significant effect on
the performance of current meters.
Over-all meter error. The error ratio, Ri , due to the current meter is assumed to have a mean of zero and a standard deviation of 1 per cent if a different meter is used for each measurement. These values appear reasonable to the writer after considering the available evidence.
TIME SAMPLING OF VELOCITY
The velocity at any point in a stream is continually fluctuating in time even at a constant discharge. The point velocities observed during a current-meter measure- ment deviate in a random manner about the true mean velocity.
The nature of the fluctuations in velocity was studied at gauging station sites on twenty-three different rivers. Average velocities for consecutive time periods of 15, 30, 45, 90, 120, 180, and 240 seconds were observed at points corresponding to 0.2, 0.4, 0.6, and 0.8 depth for a one-hour period. The measuring sections ranged in depth from 2.4 to 26.7 ft (0.73 to 8.14 m) and the velocities from 0.43 to 7.9 ft/sec (0.13 to 2.41 mlsec). A statistical analysis of the data shows that: 1. Little correlation exists between the values of rt at a point for consecutive time
2. Little correlation exists between the values of Y, observed simultaneously at
3. No correlation exists between the standard deviation of rt and the depths’or the
4. The velocity fluctuations can be assumed to be randomly distributed in time and
The standard deviations SYt, of the error ratios, rt, about a mean of zero, for observations at twenty-three sites, are given in Table 3 for the various time periods and depths of observation. The standard deviation of rt is given for velocity observations at a point. The standard deviation of error ratio, R,, depends on the standard deviation, Srt , and the number of observation points, Np, as follows:
The error in a discharge measurement due to velocity fluctuation is much smaller than the values given in Table 3 because the velocity is observed at twenty-five or more points. For example, if 45-second readings are taken at the 0.2 and 0.8 positions on twenty-five stations the standard deviation is 0.8 per cent.
periods. The average correlation coefficient was 0.17.
different points in the section.
velocities of the streams.
space in a given cross section.
Srt = Sr, I fl.
90

Accuracy of current meter measurements
VELOCITY, IN METERS PER SECOND
I-
V p: 20 - Lu p.
z 2 40- Lu V
p: 3 rl)
p: Lu
2 6 0 - 3 r. 2 IL
00 - CL UJ n
VELOCITY, IN F E E T PER SECOND
Figure 1. The 66-minute vertical-velocity curve, vertical 280 in the measuring section of the gauging station, Columbia River below Priest Rapids D a m , 14 August 1963
t 7 I I l I I Lu U
L
Z
i o 4
n 3 n Dc
d 2 -
2 z - 1 - I l I I I
O 10 20 30 40 50 60 N U M B E R OF STATIONS IN SECTION
Figure 2. Standard deviation of total error of discharge measurement
91

R. W. Carter
POINT SAMPLING OF VELOCITY IN THE VERTICAL
In making a discharge measurement the velocity is observed at selected distances from the channel bed at a number of stations. In the United States it is common practice to observe the velocity at one or two points: at 0.6 depth, or at 0.2 and 0.8 depth from the water surface. The single-point method is used for depths less than 2.0 feet, and the two-point method for greater depths. The mean velocity in a vertical is then assumed to be equal to the velocity at 0.6 depth, or to the average of the velocities at 0.2 and 0.8 depth. This procedure is based on observations in natural channels, but is in close accordance with the logarithmic distribution function for a wide channel. Rouse (1950) shows that the use of the 0.2 and 0.8 rule or the 0.6 rule yields results less than 2 per cent higher than the logarithmic relationship, regardless of relative roughness or Reynolds number.
The shape of a verticalvelocity curve actually varies from instant to instant because of turbulent fluctuations of velocity. In Figure 1 the central curve is defined by simultaneous observations at ten points in the vertical that were averaged over a period of 66 minutes. The standard deviation of one-minute observations and the maximum and the minimum one-minute observations at each point are also shown. Because there is little time correlation between velocities at any two points, it is evident that curves drawn through sets of one-minute observations could take a variety of forms. It has been shown, however, that regardless of the form of the curve, the 0.6-depth velocity or the average of the 0.2- and 0.8-depth velocities, closely approximates the mean in the vertical. Data obtained by the Geological Survey at over 1 O0 stream sites are summarized in Table 4. The ratios of the average O. 3- and 0.8-depth velocities to the mean in the verrical have a mean value of 1 .O00 and a standard deviation of 4.3 per cent. Further analysis of the data indicates that the average correlation coefficient, p, between ratios for a given section is 0.04. The standard deviation of the section ratio R,, may be obtained from the following equation:
SR, = srs [I + (N - 1) p] 1’2/*
in whichNis the number of stations taken in the section.
POINT SAMPLING OF DEPTH AND HORIZONTAL VELOCITY DISTRIBUTION
In computing a discharge measurement, the depth and the velocity are assumed to vary linearly with distance between stations in the section. The error in a discharge measurement due to this assumption and to random errors ín depth measurement are both related to the number of stations, N, at which the depth and velocity are measured. The standard deviation of the R, ratios was defined by analysis of special discharge measurements made at 127 different stream sites.
The discharge measurement at each site included velocity and depth observations at more than one hundred stations in the section. The discharge at each site was computed using the data for 1/2, 1/4, 1/5, 1/7, and 1/10 of the total number of stations. The ratios R, of these discharges to the discharge computed using all stations, after adjustment for velocity fluctuation errors, were tabulated. For any given number of stations the mean of the RN ratios was near 1.00. The standard
92
Accuracy of current meter measurements
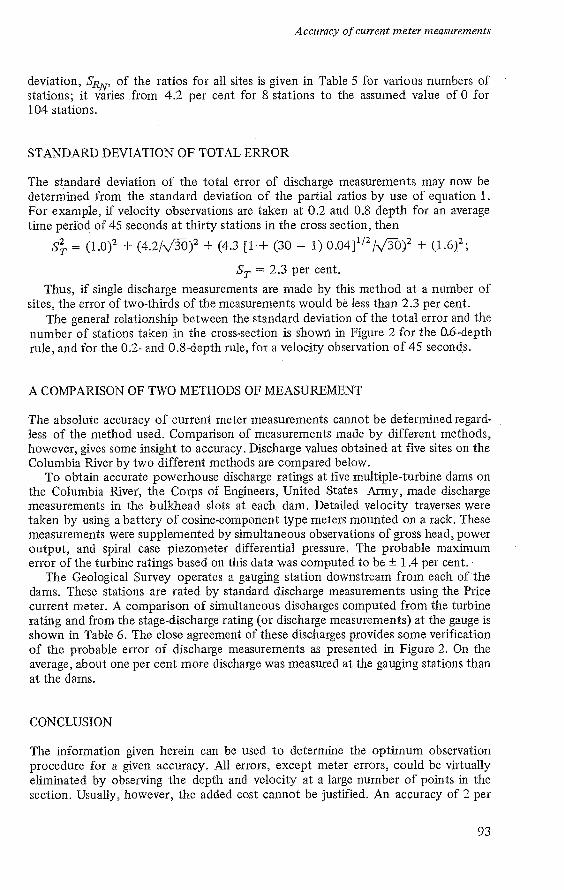
deviation, S&, of the ratios for all sites is given in Table 5 for various numbers of stations; it varies from 4.2 per cent for 8 stations to the assumed value of O for 104 stations.
STANDARD DEVIATION OF TOTAL ERROR
The standard deviation of the total error of discharge measurements may now be determined from the standard deviation of the partial ratios by use of equation 1. For example, if velocity observations are taken at 0.2 and 0.8 depth for an average time period of 45 seconds at thirty stations in the cross section, then
S$ = (1.0)2 + (4.2/60)2 + (4.3 [l + (30 - 1) 0.04]1/2/fi0)2 + (1.6)2; S, = 2.3 per cent.
Thus, if single discharge measurements are made by this method at a number of sites, the error of two-thirds of the measurements would be less than 2.3 per cent.
The general relationship between the standard deviation of the total error and the number of stations taken in the cross-section is shown in Figure 2 for the 0.6-depth rule, and for the 0.2- and 0.8-depth rule, for a velocity observation of 45 seconds.
A COMPARISON OF TWO METHODS OF MEASUREMENT
The absolute accuracy of current meter measurements cannot be determined regard- less of the method used. Comparison of measurements made by different methods, however, gives some insight to accuracy. Discharge values obtained at five sites on the Columbia River by two different methods are compared below.
To obtain accurate powerhouse discharge ratings at five multiple-turbine dams on the Columbia River, the Corps of Engineers, United States Army, made discharge measurements in the bulkhead slots at each dam. Detailed velocity traverses were taken by using a battery of cosine-component type meters mounted on a rack. These measurements were supplemented by simultaneous observations of gross head, power output, and spiral case piezometer differential pressure, The probable maximum error of the turbine ratings based on this data was computed to be f 1.4 per cent. The Geological Survey operates a gauging station downstream from each of the
dams. These stations are rated by standard discharge measurements using the Price current meter. A comparison of simultaneous disaharges computed from the turbine rating and from the stage-discharge rating (or discharge measurements) at the gauge is shown in Table 6. The close agreement of these discharges provides some verification of the probable error of discharge measurements as presented in Figure 2. On the average, about one per cent more discharge was measured at the gauging stations than at the dams.
CONCLUSION
The information given herein can be used to determine the optimum observation procedure for a given accuracy. All errors, except meter errors, could be virtually eliminated by observing the depth and velocity at a large number of points in the section. Usually, however, the added cost cannot be justified. An accuracy of 2 per
93

R. W. Carter
cent to 3 per cent is entirely adequate for most purposes. The standard deviation of the total error of a typical discharge measurement has been shown to be 2.3 per cent for a 30-station cross-section, with 45-second velocity observations at 0.2 and 0.8 depths. Numerous comparisons of measurements with discharges computed for well-rated dams show agreement within these limits.
BIBLIOGRAPHY 1 BIBLIOGRAPHIE Carter, R. W.; Anderson, I. E. 1963. Accuracy of current meter measurements.
American Society Civil Engineers Proc., Jour. Hydraulics Div., Julv 1963, p. 105-115.
Rouse, H. 1950. Engineering Hydraulics. New York, Wiley. Smoot, G.F.; Carter, R. W., 1968. Are individual current meter ratings necessary?
Townsend, F.W.; Blust, F.A., 1960. A comparison of stream velocity meters: Ame- American Society Civil Engineers, Proc., Jour. Hydraulics Div., March 1968.
rican Society Civil Engineers, Vol. 86, no. HY 4, April 1960.
APPENDIX: NOTATION
The following symbols have been adopted for use in this paper: N = number of observation stations in a section; Np = number of observation points; Q = true discharge; Qi = measured discharge with error due to current meter; QN= measured discharge with error due to number of stations; Q, = measured discharge with error due to shape of vertical velocity curve; Q, = measured discharge with error due to velocity fluctuation; Ri = section error ratio due to current meter; RN= section error ratio due to number of sections; R, = section error ratio due to shape of vertical velocity curve; Rt = section error ratio due to velocity fluctuation; RT= total error ratio for discharge measurement; r, = error ratio due to shape of vertical velocity curve at a station; rt = error ratio due to velocity fluctuations at a point; S = standard deviation of an error ratio (subscripts indicate the particular ratio); V, = true mean velocity in vertical; V, = computed mean velocity in vertical; Y = true time averaged velocity at a point; v, = measured velocity at a point with error due to fluctuation of velocity; y = distance from channel bed; yo = depth of flow; and p = average correlation coefficient.
DISCUSSION
André: 1. Avez-vous fait des comparaisons entre mesures au moulinet et jaugeage par dilution ? En France, dans de bonnes conditions, les écarts ne dépassent pas 2 à 3 010.
94

Accuracy of current meter measurements
2. Fait-on des corrections dues à l'angle des filets liquides avec la perpendiculaire à la section de jaugeage dans le cas des moulinets à axe vertical ?
Carter: 1. We have made numerous comparisons of the dilution method with the current meter method with a rate of accuracy of about 2 or 3 per cent. 2. We choose measuring sections with the flow normal to a line across the stream.
In case of an angle, the observed losses are corrected after determination of the angle.
Struyk: The discharge measurement includes the observation of depth and velocity in a number of stations in the cross-section. At a certain moment you use a part of the total number of stations. My question concerns the criterium used for the selection of these stations and for rejecting the others.
Carter: Depth and velocity have been observed at hundreds of stations. After noting the effect at a number of stations, we started the selection, at first using half of the stations, then one-quarter, and finally one-eighth of the stations.
Burtsev: What type of current meter has been used for the comparison of water discharges obtained with a current meter attached to a rod and suspended from a cable?
Carter: Measurements have been made from cables by wading and also'from support- ing structures such as bridges, in such rivers as the Mississippi River, one of the largest rivers in the world, down to small streams.
Botma: It has been stated that the average correlation coefficient for the analysis of time sampling of velocity between the values at a point for consecutive time periods is only 0.17. The magnitude of ths correlation coefficient depends strongly on the time period, so I should like to know which time period was used in this case.
Carter: Between 10 and 45 sec. were used here.
Lambie: Mr. Carter gives in his paper a figure of 2.3 per cent for the accuracy of the velocity component of the measurement, using this figure for comparing each individual gauging. When deducing the accuracy of a discharge measurement, as well as taking the error in the velocity component, it is necessary also to take into account the possible systematic or random error in measurements of width or depth, for assessing the overall accuracy of a gauging; these have to be combined with the velocity error. For his analysis, did Mr. Carter take into account the error in measurement of width and depth? A second question: Mr. Carter mentions that a better result in the definition of
velocity is obtained by using (0.2 k 0.8)/2 instead of 0.6 depth. Is this not wholly due to the first method?
Carter: We did not include the errors due to measurement of depth and width in this paper. We feel that these errors are so small that they are negligible.
Second question: I think that you are right that much of this difference in the 0.2 and 0.8 and 0.6 depth is due to the total number of observations.
Garg: A previous (U.S.S.R.) paper mentions that the error may reach 40 per cent with a vertical axis current meter. Has some work been done in this direction as
95
R. W. Carter
Mr. Carter’s paper reveals that at present there is no evidence of turbulence having a significant effect on this performance of a current meter?
Carter: This subject covers an extremely broad field and needs to be restricted. Some work has been done to try to determine this effect on a Price meter and on the Ott meter. It only seems possible in a laboratory. We obtained only doubtful results. This question of turbulence cannot be answered at this time. But I should like to add that there is no evidence to indicate that turbulence has any significant effect on the performance of a Price meter.
Subramanya: It appears that the fluctuation of velocity vectors in a vertical plane will have more effect on the performance of a cup-type meter than on a propeller meter. The author’s comment on this aspect would be appreciated.
Carter: From a theoretical viewpoint this is certainly a possibility. But I think that we cannot answer the question at this time.
Volker: To what extent have the measuring sites been selected with respect to their suitability for measuring discharges? Has any correlation been found between the magnitude of the error and the
quality of the measuring site (straight stream course, turbulence, depth varia- tion, etc.)?
Glanz: Mistake or deviation, my question would be which one and against which value? Since the discharge is unknown, the mistake against the arithmetic means can be related to several measurements. Could you please give a precise definition about the mistake mentioned.
Carter: As I stated above, the absolute error of a current meter measurement cannot be determined. We have spoken about relative errors of different measuring proce- dures. The best way to make discharge measurements would be diametrically. This would be about the most absolute measures you could use. But on large rivers this is impossible. So we do not know what the absolute error is. We are really talking about relative errors between various procedures.
Grindley: When the cost of calibration of a current meter approaches the cost of a new meter, it may be advantageous to replace a meter instead of calibrating it. Nevertheless, individual calibration, provided that it is accompanied by good mainte- nance, must be better than group calibration. A perfect current meter would be one which caused little disturbance to the
parameter it was designed to measure. It would also respond rapidly to pulsations of flow. A meter with a helical propeller having practically neutral buoyancy meets some
of the requirements. In recent years there has been a tendency for current meters manufactured in the
United Kingdom to have propellers made of low-density material. Both the Plessey and the Braystoke meters have propellers made of plastic. Neither of these meters requires anything but the simplest maintenance. There are no ball bearings or oil-filled compartments. These meters retain their individual calibrations but in certain applications may be used with a group calibration since at 95 per cent
96

Accuracy of current meter measurements
confidence the calibrations of the propellers are all within 3 per cent of the mean calibration.
Rodier: Sur les grands fleuves d’Afrique avec des appareils et des méthodes diffé- rents de ceux du “Geological Survey”, nous arrivons à la même conclusion: précision de 2 %. Mais nous tenons à attirer l’attention sur le point suivant. L’erreur no 4 de M. Carter tient à l’emploi de la méthode des 2 points par verticale et au dépouillement par ordinateur. Cela nous paraît justifié pour les moyens et grands cours d’eau. Pour les petits cours d’eau à écoulement irrégulier dans l’espace, ces méthodes conduisent à des erreurs atteignant parfois 10 ou 15 % (valeur de l’erreur no 4). Pour éviteer des interprétations linéaires trop importantes, nous utilisons pour ces petits cours d’eau (moins de 20 à 40 m3/s) les vieilles méthodes de dépouillement par isotaches ou par paraboles et nous nous interdisons l’emploi du dépouillement par ordinateur (sauf s’il s’agit de contrôler de grandes quantités de vieux jaugeages lorsqu’on veut vérifier si certains ne contiennent pas d’erreurs de 50 à 100 % par exemple).
Wiesner: 1. With increasing utilization of the water resources in the river areas of the German Democratic Republic, the significance of the knowledge of the error in flow rates is emphasized, especially with regard to safeguarding the supply to users. The error in discharge measurement, which is generally an individual measurement, is contained in the measuring result and cannot usually be recognized as such. Under the natural conditions prevailing during discharge measurement, it is not possible to determine its magnitude and the difference between measuring value and effective value. If repeated measurements in measuring series are available in which systematic errors are‘eliminated by measuring equipment and method, it will be possible to determine the error by statistical means. In connexion with the complex investigations into the run-off process in the River
Spree, a number of measurements were made with the current meter and the results permitted the establishment of statistics of error. We checked the results of discharge measurements obtained in four river sections
in the River Spree. The measuring cross-sections were defined in equidistant spacing in river sections
with lengths of 240 m, 1 200 m and 1 600 m. The measuring cross-sections in the Rver Spree were located down stream from the Spremberg Dam. This arrange- ment, and the discharge control during the measurement period, ensured the condition of no-discharge variations during measurement.
In determining the measurement of cross-sections in equidistant spacing in a stretch, independent of bends, we assumed that the continuity equation
Q = v - A
where (Q = discharge ; Y = average velocity ; and A = cross-section is applicable to all cross-sections in the area. This decision served the purpose of eliminating any systematic measuring errors which could be caused by profile peculiarities during measurement of velocity in a cross-section.
2. The statistics of error supply the following datá on the average value and the coefficient of variation of the various measuring methods:
97
R. W. Carter
Measuring method (percentage)
6-point 2-point 1-point
Arithmetic mean 5 100 100 1 O0
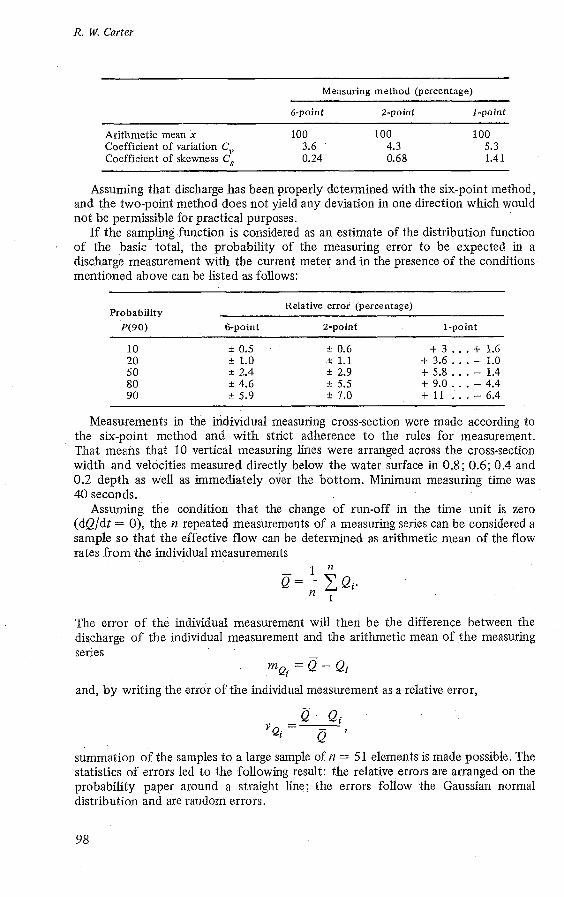
Coefficient of skewness C, 0.24 0.68 1.41 Coefficient of variation C,, 3.6 4.3 5.3
Assuming that discharge has been properly determined with the six-point method, and the two-point method does not yield any deviation in one direction which would not be permissible for practical purposes.
If the sampling function is considered as an estimate of the distribution function of the basic total, the probability of the measuring error to be expected in a discharge measurement with the current meter and in the presence of the conditions mentioned above can be listed as follows:
Relative error (percentage) Probability ~ ( 9 0 ) &point 2-point 1 -point
10 f 0.5 f 0.6 +3...+ 1.6 20 f 1.0 i- 1.1 + 3.6 . . . - 1.0 50 i- 2.4 f 2.9 + 5.8 . . . - 1.4 80 f 4.6 i- 5.5 + 9.0 . . . - 4.4 90 f 5.9 f 1.0 +11 ...- 6.4
Measurements in the individual measuring cross-section were made according to the six-point method and with strict adherence to the rules for measurement, That means that 10 vertical measuring lines were arranged across the cross-section width and velocities measured directly below the water surface in 0.8; 0.6; 0.4 and 0.2 depth as well as immediately over the bottom. Minimum measuring time was 40 seconds.
Assuming the condition that the change of run-off in the time unit is zero (dQ/dt = O), the y1 repeated measurements of a measuring series can be considered a sample so that the effective flow can be determined as arithmetic mean of the flow rates from the individual measurements
The error of the individual measurement will then be the difference between the discharge of the individual measurement and the arithmetic mean of the measuring series
mQi = e- &i and, by writing the error of the individual measurement as a relative error,
summation of the samples to a large sample of n = 51 elements is made possible. The statistics of errors led to the following result: the relative errors are arranged on the probability paper around a straight Iine; the errors follow the Gaussian normal distribution and are random errors.
98