aceee report
TRANSCRIPT

2015 International Energy Efficiency Scorecard
Self-Scoring Tool
Rachel Young, Chetana Kallakuri, and Sara Hayes
August 2015
© American Council for an Energy-Efficient Economy
529 14th Street NW, Suite 600, Washington, DC 20045
Phone: (202) 507-4000 • Twitter: @ACEEEDC
Facebook.com/myACEEE • aceee.org

SELF-SCORING TOOL © ACEEE
i
Contents
About the Authors ..............................................................................................................................iii
Acknowledgments ..............................................................................................................................iii
Abstract ................................................................................................................................................ iv
Introduction .......................................................................................................................................... 1
Instructions ........................................................................................................................................... 2
National Efforts .................................................................................................................................... 3
Change in Energy Intensity (6 points)................................................................................... 3
Efficiency of Thermal Power Plants (3 points) ..................................................................... 4
Mandatory Energy-Savings Goals (3 points) ....................................................................... 4
Tax Credits and Loan Programs (3 points) ........................................................................... 4
Spending on Energy Efficiency and on Energy Efficiency Research and Development (5 points/2 points) ................................................................................................................... 4
Size of the Energy Service Companies Market (2 points) ................................................... 5
Water Efficiency Policy (1 point) ........................................................................................... 5
Buildings ............................................................................................................................................... 5
Energy Intensity in Residential and Commercial Buildings (4 points each) ................... 6
Residential and Commercial Building Codes (3 points each) ........................................... 6
Building Labeling (2 points) ................................................................................................... 7
Appliance and Equipment Standards (5 points) ................................................................. 7
Labeling of Appliance and Equipment Energy Efficiency (2 points) ............................... 8
Building Retrofit Policies (2 points) ....................................................................................... 8
Industry ................................................................................................................................................. 8
Energy Intensity of Industrial Sector (8 points) ................................................................... 9
Electricity Generated by Combined Heat and Power (6 points) ..................................... 10
Investment in Manufacturing Research and Development (2 points) ........................... 10

SELF-SCORING TOOL © ACEEE
ii
Voluntary Energy Performance Agreements between National Governments and Manufacturers (3 points) ....................................................................................................... 11
Mandate for Plant Energy Managers (2 points) ................................................................. 11
Mandatory Energy Audits (2 points) .................................................................................. 11
Agriculture Energy Intensity (2 points) .............................................................................. 11
Transportation ................................................................................................................................... 11
Vehicle Miles Traveled per Capita (3 points) ..................................................................... 12
Fuel Economy and Fuel Economy Standards for Light-Duty Vehicles (3 points/4 points) ...................................................................................................................................... 12
Use of Public Transit (3 points) ............................................................................................ 12
Investment in Rail Transit Versus Road Transit (3 points) .............................................. 12
Energy Intensity of Freight Transport and Fuel Economy Standards for Heavy-Duty Trucks (3 points/3 points) .................................................................................................... 13
Conclusions ........................................................................................................................................ 13
Appendix A. Summary of Results for South Africa ..................................................................... 14
Overview ................................................................................................................................. 14
Top-Performing Areas ........................................................................................................... 14
Areas for Improvement ......................................................................................................... 15
References ............................................................................................................................... 16

SELF-SCORING TOOL © ACEEE
iii
About the Authors
Rachel Young conducts research on the impacts of federal and national energy efficiency policies. She works in the ACEEE Policy Program and focuses on natural resources including energy efficiency as a mechanism to reduce air pollution, the water–energy nexus, and natural-gas efficiency policies and programs. She has authored and coauthored several publications including ACEEE's International Energy Efficiency Scorecard. She also conducts quantitative and qualitative research on a number of ACEEE priority areas. Rachel holds a BA in environmental studies with a concentration in chemistry from Lewis & Clark College.
Chetana Kallakuri works in the Policy Program on the impacts of federal energy efficiency policies. She also works on the International Energy Efficiency Scorecard. She joined ACEEE in 2015. Chetana graduated from the Yale School of Forestry and Environmental Studies in 2014 with a master of environmental management degree and a concentration in energy and the environment.
Sara Hayes has a dual focus within ACEEE, working with both the Policy and Utilities Programs. She leads many ACEEE analyses of national policies and manages research on trends and emerging issues in utility end-use efficiency. She joined ACEEE in 2010. Sara earned a BA in environmental studies from Lewis & Clark College and a JD from Fordham Law School.
Acknowledgments
The authors gratefully acknowledge the external reviewers, internal reviewers, colleagues, and sponsors who supported this report. External experts included Violet Olifant and Thomas Mashapa from the Department of Energy, Republic of South Africa. Internal reviewers included Steve Nadel and Shruti Vaidyanathan from ACEEE. External review and support do not imply affiliation or endorsement. Last, we would like to thank Fred Grossberg for managing the editorial process, Miranda Kaplan for copy editing, Roxanna Usher for proofreading, and Patrick Kiker for his help in launching the tool and user guide.

SELF-SCORING TOOL © ACEEE
iv
Abstract
ACEEE's biennial International Energy Efficiency Scorecard evaluates the energy efficiency policies and performance of the top energy-consuming countries of the world. Now we have developed a new version of the Excel-based International Scorecard Self-Scoring Tool that applies the data and methodology of the 2014 Scorecard and extends the reach of its analysis. Users of the tool can input qualitative and quantitative data from their own country, region, or smaller jurisdiction to get a snapshot of their energy efficiency progress compared to 16 of the world’s largest economies. The tool generates custom energy efficiency scores using 31 metrics in areas such as national policy, buildings, industry, and transportation, as well as an overall score out of a possible 100 points. A new country, South Africa, is included as a self-scoring example.
SELF-SCORING TOOL © ACEEE
1
Introduction
A country that uses less energy to achieve the same or better results reduces its costs and pollution, creating a stronger, more competitive economy. While energy efficiency has played a role in the economies of developed nations for decades, cost-effective energy efficiency remains a massively underutilized energy resource.
Since many factors bear on the extent of energy efficiency in a country, no single metric can provide a complete picture. However the combined results from a range of metrics can indicate the country's overall energy efficiency achievements. In the second edition of the International Energy Efficiency Scorecard, we analyzed the world’s 16 largest economies, covering more than 81% of global gross domestic product (GDP) and about 71% of global electricity consumption. We applied 31 metrics divided roughly in half between policies and quantifiable performance to evaluate how efficiently these economies use energy. We scored the policy metrics based on a country’s adoption of one or more best-practice policies. The performance metrics measured energy use and provided quantifiable results.
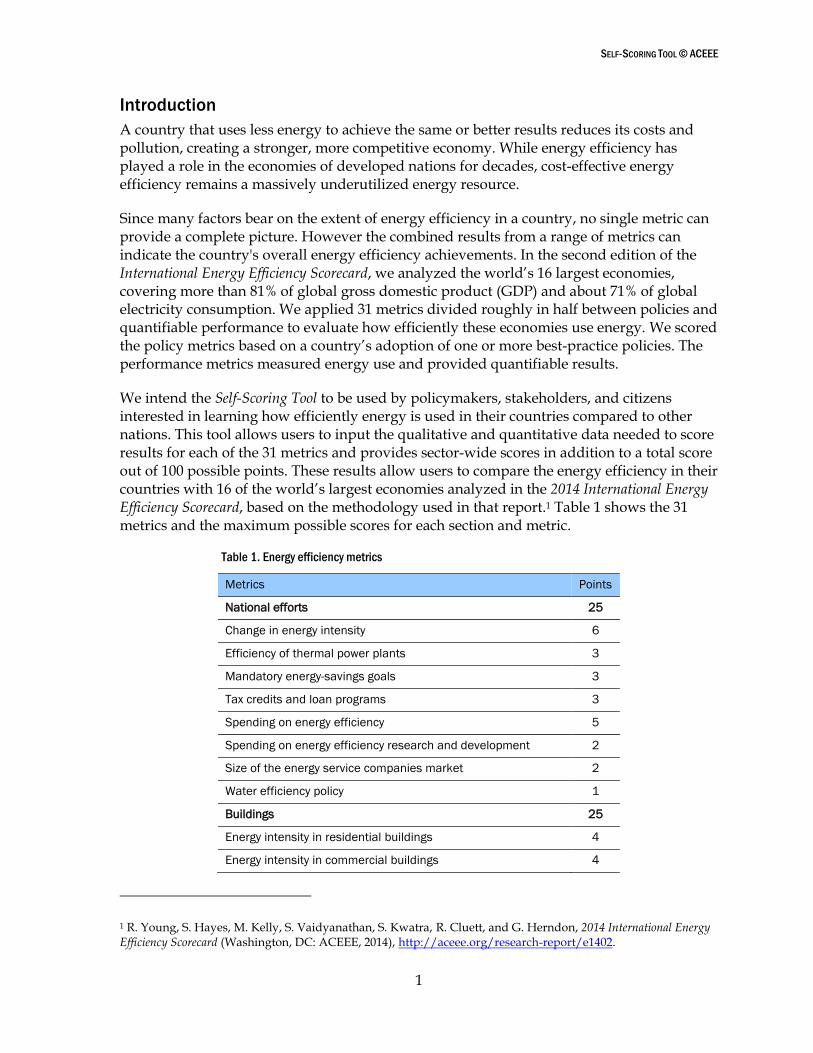
We intend the Self-Scoring Tool to be used by policymakers, stakeholders, and citizens interested in learning how efficiently energy is used in their countries compared to other nations. This tool allows users to input the qualitative and quantitative data needed to score results for each of the 31 metrics and provides sector-wide scores in addition to a total score out of 100 possible points. These results allow users to compare the energy efficiency in their countries with 16 of the world’s largest economies analyzed in the 2014 International Energy Efficiency Scorecard, based on the methodology used in that report.1 Table 1 shows the 31 metrics and the maximum possible scores for each section and metric.
Table 1. Energy efficiency metrics
Metrics Points
National efforts 25
Change in energy intensity 6
Efficiency of thermal power plants 3
Mandatory energy-savings goals 3
Tax credits and loan programs 3
Spending on energy efficiency 5
Spending on energy efficiency research and development 2
Size of the energy service companies market 2
Water efficiency policy 1
Buildings 25
Energy intensity in residential buildings 4
Energy intensity in commercial buildings 4
1 R. Young, S. Hayes, M. Kelly, S. Vaidyanathan, S. Kwatra, R. Cluett, and G. Herndon, 2014 International Energy Efficiency Scorecard (Washington, DC: ACEEE, 2014), http://aceee.org/research-report/e1402.

SELF-SCORING TOOL © ACEEE
2
Metrics Points
Residential building codes 3
Commercial building codes 3
Building labeling 2
Appliance and equipment standards 5
Appliance and equipment labeling 2
Building retrofit policies 2
Industry 25
Energy intensity of the industrial sector 8
Electricity generated by combined heat and power 6
Investment in manufacturing research and development 2
Voluntary energy-performance agreements with manufacturers 3
Mandate for plant energy managers 2
Mandatory energy audits 2
Agriculture energy intensity 2
Transportation 25
Vehicle miles traveled per capita 3
Fuel economy of light-duty vehicles 3
Fuel economy standards for light-duty vehicles 4
Fuel efficiency standards for heavy-duty tractor trucks 3
Energy intensity of freight transport 3
Freight transport per unit economic activity 3
Use of public transit 3
Investment in rail transit vs. roads 3
The 16 economies analyzed in the 2014 International Scorecard make up the baseline against which data entered into the Self-Scoring Tool are scored. The tool awards full and partial points for each metric according to the results from the original analysis. For example, of the 16 economies analyzed, Italy had the highest percentage of electricity generated by combined heat and power (CHP), i.e., 24%. We weight other countries’ scores based on that. We award the maximum score of 6 points for CHP results of 20% or greater. We award 5 points for results of at least 14%, 4 points for at least 12%, 3 points for 10%, 2 points for 6%, and 1 point for at least 2.5% of electricity from CHP.
In addition to the countries included in the International Scorecard, the Self-Scoring Tool features a new country not scored in the 2014 edition: South Africa. Appendix A of this document includes a summary of South Africa’s results from the Self-Scoring Tool.
Instructions
The Self-Scoring Tool is Excel-based and can be downloaded at http://aceee.org/portal/national-policy/international-scorecard.

SELF-SCORING TOOL © ACEEE
3
Begin by selecting your country’s name in the Start tab of the tool directly below the instructions.
Next, fill out the general data for your country. If you do not have access to the requisite data, click on the Suggested Sources links below each data entry field. These links will direct you to online resources that provide the data for these individual fields. It is important to be as accurate as possible when filling out the top section of the form, as these values will be used throughout the analysis. If no link is provided for a field, consult the relevant research organizations for your country.
Then move to the National Efforts tab and input the required data into the blue boxes. As you enter data or select from the drop-down menus, scores will automatically populate the yellow boxes on the left. Repeat this process for the Buildings, Industry, and Transportation tabs.
Final results will appear in the Results and Detailed Results tabs. These tabs also display the results from the countries in the 2014 International Scorecard, allowing you to compare your country against the 16 largest world economies. Results for South Africa, not included in the Scorecard, appear in these tabs as well.
In the original analysis, we attempted to use internationally recognized, uniform data sources for all countries whenever possible. The Self-Scoring Tool provides links and/or information about these resources so that users can enter comparable input values. These resources are from global organizations such as the International Energy Agency (IEA), Organisation for Economic Co-operation and Development (OECD), European Commission, World Bank, and others. However you may need additional country-specific research to compile some of the data.
The remainder of this document provides additional detail about each of the individual metrics used in the Self-Scoring Tool.
National Efforts
The National Efforts section scores energy efficiency performance across all sectors of the economy, as well as the overall commitment and leadership of the national government. These metrics look at the performance of the electricity-generating fleet and the change in a country’s energy intensity over time. They also indicate national commitment by evaluating financial investment in energy efficiency overall and in research and development (R&D) in emerging technologies specifically. In addition, the metrics assess policy indicators such as the presence of national energy-savings goals and programs to engage the private sector using tax credits and loans.
CHANGE IN ENERGY INTENSITY (6 POINTS)
Energy intensity here is the amount of energy consumed in a country divided by national GDP. With this metric we examined change over time, from 2000 to 2011. We adjusted GDP to account for inflation over this period. Countries with a decline in energy intensity of at least 50% receive 6 points; those with a decline of at least 45% receive 5 points; at least 35%, 4 points; at least 30%, 3 points; at least 25%, 2 points; and at least 20%, 1 point.

SELF-SCORING TOOL © ACEEE
4
EFFICIENCY OF THERMAL POWER PLANTS (3 POINTS)
This metric is based on the overall efficiency of the electric power system, accounting for both operational efficiency at power plants and losses that occur during the distribution of electricity. These data indicate how efficiently or inefficiently the electric power sector converts fossil fuels into usable electricity through thermal combustion. Countries receive 3 points for overall efficiency of at least 39%, 2 points for efficiency of at least 31%, and 1 point for at least 27%. Countries with less than 27% overall efficiency receive no points.
MANDATORY ENERGY-SAVINGS GOALS (3 POINTS)
This metric is scored according to whether a country has a policy outlining a mandatory national energy-savings goal. Such goals can send a message across all sectors of an economy, spur innovation, and articulate national priorities. They also measure progress toward a target, making energy efficiency more tangible and yielding quantifiable results. Countries receive all 3 points for policies that require a fixed amount of energy savings per year that total more than 1% of a nation’s overall energy consumption. A country may earn 2 points for an energy-savings target equal to or less than 1% per year. Countries that do not have formal energy-savings targets, but have other goals that may affect energy efficiency, can earn 1 point. For example, Brazil, Canada, and Australia each scored 1 point in the 2014 Scorecard for national commitments to reduce greenhouse gases, even though they do not have energy-savings targets per se. In some cases, a country may receive credit for an energy-intensity target, as China did in the 2014 Scorecard.
TAX CREDITS AND LOAN PROGRAMS (3 POINTS)
This metric reflects a government’s policies that encourage private investment in energy efficiency. These investments often pay for themselves over time, but a common barrier is the upfront cost of the technology or upgrade. Government loan programs and tax credits can help to lower or spread out this cost, thus helping projects meet the payback demands of the entity financing the improvement. In addition, government-backed loan programs and credits can improve market conditions for energy efficiency, attracting additional private investment. Countries with both multisector loan programs and multisector tax credits receive the full 3 points, while countries that have one or the other receive 2 points. A country can earn 1 point if it has either tax credits or a loan program for a single sector.
SPENDING ON ENERGY EFFICIENCY AND ON ENERGY EFFICIENCY RESEARCH AND DEVELOPMENT
(5 POINTS/2 POINTS)
The metric measuring energy efficiency spending is scored based on total investments in energy efficiency by the national government and the utility sector. In some countries (for example, Germany), energy efficiency spending is primarily driven by the national government, whereas in others, notably the United States, utilities and related programs do the majority of spending. Therefore, to be able to compare countries, we combined spending by utilities and by the national government into a single metric for each country. We divided the sum of the government and utility annual investment (measured in US dollars) by population. The results for this metric are an approximation of the annual spending on energy efficiency in 2011 per person in each country.

SELF-SCORING TOOL © ACEEE
5
The awarding of points is as follows: 5 points for per-capita spending of at least $45, 4 points for at least $35 per person, 3 points for at least $25, 2 points for at least $10, and 1 point for at least $5.
SIZE OF THE ENERGY SERVICE COMPANIES MARKET (2 POINTS)
An ESCO, or energy service company, is a business that develops, installs, and arranges financing for projects designed to boost a facility’s energy efficiency and lower its maintenance costs. ESCOs generally act as project developers for a range of tasks and assume the technical and performance risk associated with a project. Typically, they develop, design, and arrange financing for energy efficiency projects; install and maintain the energy-efficient equipment involved; and measure, monitor, and verify the project's energy savings. These services are bundled into the project owner's cost, and the ESCO is repaid through the dollars saved by using less energy.
The presence and size of the ESCO market in a country reflect the efforts to advance energy efficiency through effective business models and creative financing. Countries with ESCO spending of at least 0.05% of GDP receive 2 points. Countries with spending of at least 0.02% of GDP receive partial credit of 1 point.
WATER EFFICIENCY POLICY (1 POINT)
Energy demand can also be reduced through investments aimed at reducing water demand. Water and energy are inherently linked, intersecting at both the supply side (electricity generation and water/wastewater facilities) and the end-use side (residential, commercial, industrial, and agriculture sectors). This energy–water nexus is apparent in the massive amounts of water needed to produce and deliver electricity. Coal, nuclear, and solar-thermal electricity generation are water intensive. Water is needed to create steam and to power turbines; water is also withdrawn for cooling and then either lost in the cooling process or discharged back into the environment. Conversely, it takes immense amounts of energy to clean and transport water. Water and wastewater utilities consume large amounts of energy to treat water by running pumps, motors, and building equipment. On the end-use side, energy and water are connected in our homes, businesses, and industrial facilities. This close relationship means that improvements in water efficiency generally result in energy savings.
Countries can improve their energy efficiency by implementing mandates for water savings and water conservation. Countries receive 1 point if they have national water policies that specifically require measures to improve water efficiency or water savings.
Buildings
Countries can earn up to 25 points across 8 different metrics for energy efficiency in residential and commercial buildings, as well as related policies such as building energy codes and programs that require disclosure of building energy consumption. This section also scores policy treatment of appliances and equipment, looking at whether countries have established performance standards and whether they disclose the energy consumption of products.

SELF-SCORING TOOL © ACEEE
6
ENERGY INTENSITY IN RESIDENTIAL AND COMMERCIAL BUILDINGS (4 POINTS EACH)
We calculated these two metrics by dividing the total energy consumption in buildings by the floor space of the building stock. To normalize these results, we factored in differences in seasonal temperatures by taking the average of the total population-weighted heating and cooling degree days for each country to get each country’s heating and cooling factor.2 We then divided energy consumption per square foot by the heating and cooling factor. This calculation helps to account for the varying impact of temperature and requirements for heating or cooling in different climates, and also for the dispersion of a population across those climates. It allows for more accurate comparisons of buildings energy intensity as it relates to a country’s efficiency improvements, independent of the impact of climate. Table shows how the results are scored
Table 2. Point allocation for metrics measuring
energy intensity in buildings
Points Residential
(Btus/f2)
Commercial
(Btus/f2)
4 5 5
3 10 20
2 15 30
1 20 40
RESIDENTIAL AND COMMERCIAL BUILDING CODES (3 POINTS EACH)
Scores for residential and commercial building codes are based on the presence of national, mandatory building codes covering six major areas, including requirements for:
Insulation in walls and ceilings. Insulating the envelope or shell of a house or commercial building includes adding insulation to prevent heat loss in the winter and heat gain in the summer.
Low U-factors and shading/solar heat gain coefficients for windows. The U-factor measures the rate of heat transfer through a window and how well the window insulates. The solar heat gain coefficient measures the fraction of solar energy transmitted, indicating how well the window blocks heat from solar radiation.
2 ChartsBin Statistics, “Worldwide Heating Needs“ (2011), http://chartsbin.com/view/1029. ChartsBin
Statistics, “Worldwide Cooling Needs“ (2011), http://chartsbin.com/view/1030. A heating degree day is a measure of weather that triggers a need for space heating. A cooling degree day is a measure of weather that triggers a need for space cooling. We can determine the average heating and cooling needs of an entire country by applying population weightings to the degree-day calculations generated for locations within a country. This ensures that large, heavily populated metropolitan areas are accorded more weight than sparsely populated areas, so that the national average reflects the heating and cooling needs faced by the average citizen of that country, with some facing more and others facing less (K. Baumert and M. Selman, “Data Note: Heating and Cooling Degree Days” [Washington, DC: World Resources Institute, 2012[).

SELF-SCORING TOOL © ACEEE
7
Efficient lighting. Some building codes include minimum standards for high-efficiency lighting, lamps, and/or lighting controls.
Efficient heating, ventilating, and air-conditioning systems. Some building codes require a certain level of efficiency in heating, ventilating, and cooling systems to avoid energy waste from inefficient equipment.
Proper design, position, and orientation. Design requirements include architectural programming requirements for all building functions and their relationship to one another, including occupancy and time of use, daylight potential, indoor environmental quality standards, equipment and plug loads, acoustic quality, safety, and security.
Air sealing (residential buildings only). Eliminating air leaks throughout a home, such as around windows and doors, attics, basements, and crawl spaces, reduces the loss of heated or cooled air.
One point is awarded to countries with either mandatory building codes that cover their commercial and residential sectors or mixed codes that cover the majority of their populations. Countries with voluntary or no codes do not receive this point. The remaining 2 points are awarded based on the number of prescriptive and technical requirements from the bulleted list above that the code includes. If all but one of the elements from the list are included in the code, the country receives 1 point. If all elements are included, 2 points are awarded.
BUILDING LABELING (2 POINTS)
We based scores for the next buildings-related metric on the presence of mandatory labeling or ratings and mandatory disclosure of energy use. A building label creates transparency around the energy costs associated with a building, similar to the transparency provided by a miles per gallon rating for a vehicle. Disclosure of a building’s energy use can help owners or lessees recognize the value of energy efficiency benefits at the time of purchase or lease. Countries with disclosure and labeling requirements applicable to all buildings (new and existing, commercial and residential) receive the full 2 points. One point is awarded to countries with national policies that apply to new buildings and are triggered for existing buildings upon a sale, lease, or remodel; with national policies that apply only to new buildings or only to a subset of buildings (e.g., commercial but not residential); or with state and local policies around building labeling.
APPLIANCE AND EQUIPMENT STANDARDS (5 POINTS)
Countries with policies requiring and specifying minimum energy performance standards for appliances and equipment are eligible for up to 5 points. Points are awarded based on the number of appliances and types of equipment covered by the standards. This metric does not measure stringency of standards, percentage of energy consumption covered by standards, or compliance with standards, all of which are important factors affecting the energy efficiency of appliances and equipment. Table 3 shows point thresholds.

SELF-SCORING TOOL © ACEEE
8
Table 3. Point allocation for appliance and equipment
standards and labeling
Points Number of appliance and
equipment standards
5 35
4 30
3 25
2 20
1 15
LABELING OF APPLIANCE AND EQUIPMENT ENERGY EFFICIENCY (2 POINTS)
Labeling programs disclose to consumers information about how much energy an appliance or piece of equipment uses compared to products of the same type. The labels typically display the comparative information using a categorical rating (e.g., a letter grade or a number of stars) or a continuous scale.
Countries are awarded 2 points if they have policies that include mandatory disclosure of the energy consumption of appliances and equipment using a categorical rating. Countries with mandatory labeling using a continuous scale receive 1 point.
BUILDING RETROFIT POLICIES (2 POINTS)
Globally, existing building stocks tend to be old and inefficient, providing a tremendous opportunity for energy savings. Countries can better capture those savings by adopting policies to reward improved efficiency during a building redesign or retrofit. Countries often adopt building energy codes for existing buildings, meaning that building retrofit policies are tied in with building codes. For this metric countries receive 2 points for having comprehensive (residential and commercial) building retrofit policies in place. Countries with partial building retrofit policies, such as policies that apply to either residential or commercial buildings alone or only apply to certain areas of the country, are awarded 1 point, and countries without a policy receive no points.
Industry
Countries can earn up to 25 points across 7 metrics for energy efficiency in the industrial sector. Countries are scored based on performance criteria including the industrial sector’s energy intensity, the percentage of electricity generated from CHP, and investment in industrial R&D. The policy metrics we evaluate look at government efforts to encourage energy efficiency in the industrial sector through incentives, the implementation of voluntary programs to set energy-savings targets, and mandates requiring periodic energy audits and on-site energy managers.
SELF-SCORING TOOL © ACEEE
9
ENERGY INTENSITY OF INDUSTRIAL SECTOR (8 POINTS)
This metric is a measure of the consumption of energy in the industrial sector measured in British thermal units (Btus), divided by industrial GDP in US dollars. 3 Energy intensity varies significantly among the 12 industries analyzed for each country, and the mix of industries also varies considerably among the countries. In order to fairly compare the energy intensities of the overall industrial sectors among the countries, we had to normalize the industrial energy intensity of each country to account for variation in the mix of industries.
Energy intensity values are not always available for all of a country’s industries, so we normalized the data using US intensities by type of industry. This adjustment implicitly assumes that the pattern of relative intensities among a country’s industries would be similar to that of the US. For manufacturing industries we used the average intensity of energy consumption per dollar of value of shipments reported in Table 6.3 of the 2010 Manufacturing Energy Consumption Survey.4 For non-manufacturing industry (mining) we calculated the energy intensity based on the energy consumption and value of shipments reported in Supplemental Tables 33 and 44 of the 2014 Annual Energy Outlook Final Release.5
We multiplied US industry intensities by the energy consumption for each country’s industries, then summed across all of the industries to produce an intensity factor reflecting the relative energy intensity of the country’s industrial sector. We normalized these factors to the average of all countries in the study. We then used these country-intensity weighting factors to adjust each country’s intensity value to create a weighted intensity. In the 2014 Scorecard we made an effort to normalize results based on a country’s industry mix. However data for the normalization are difficult to assemble, so the results in the Self-Scoring Tool are not weighted, giving a slightly skewed result.
Countries with the lowest weighted energy consumption per dollar of industrial GDP (less than 2 Btus per dollar of industrial GDP) in the industrial sector are awarded 8 points. Table 4 shows the breakdown of points.
3 This number includes the following industrial sectors: iron and steel; chemical and petrochemical; non-ferrous metals; non-metallic minerals; transport equipment; machinery; mining and quarrying; food and tobacco; paper, pulp, and printing; wood and wood products; textile and leather; and nonspecified industry. This number does not include energy consumption in agriculture.
4 US Energy Information Administration, 2010 Manufacturing Energy Consumption Survey (2013),
http://www.eia.gov/consumption/manufacturing/data/2010/pdf/Table6_3.pdf.
5 US Energy Information Administration, Annual Energy Outlook 2014: Supplemental Tables for Regional Detail
(April 2014), http://www.eia.gov/forecasts/archive/aeo14/tables_ref.cfm.

SELF-SCORING TOOL © ACEEE
10
Table 4. Point allocation for energy intensity
of the industrial sector
Points Btus per dollar of
industrial GDP
8 1.5
7 2
6 2.1
5 2.2
4 2.4
3 2.8
2 3
1 6
ELECTRICITY GENERATED BY COMBINED HEAT AND POWER (6 POINTS)
CHP systems generate useful thermal energy and electricity or mechanical power in a single integrated system. The use of CHP systems is much more efficient than the separate generation of thermal energy and electricity because heat that is normally wasted in conventional power generation is recovered to meet thermal demands.
Countries where at least 20% of electricity is generated from CHP are awarded the full 6 points. Table5 shows the scoring.
Table 5. Point allocation for electricity-
generated combined heat and power
Points
Percentage of industrial
power from CHP
6 20%
5 14%
4 12%
3 10%
2 6%
1 2.5%
INVESTMENT IN MANUFACTURING RESEARCH AND DEVELOPMENT (2 POINTS)
While manufacturing R&D spending may not go exclusively toward energy efficiency, energy efficiency is a major focus of R&D investments, as it reduces waste and energy costs and improves competitiveness. Spending included in this metric, therefore, represents R&D activities carried out in the business enterprise sector, regardless of the origin of funding. We divided total R&D spending in the manufacturing sector by industrial GDP and reported the result in US dollars. The full 2 points are awarded to countries with spending

SELF-SCORING TOOL © ACEEE
11
equal to or more than 5% of industrial GDP, and 1 point is awarded for spending equal to or more than 3% of industrial GDP.
VOLUNTARY ENERGY PERFORMANCE AGREEMENTS BETWEEN NATIONAL GOVERNMENTS AND
MANUFACTURERS (3 POINTS)
We based the scoring for this metric on the presence of a national government program for entering into voluntary agreements with businesses in the manufacturing sector to improve energy efficiency. The maximum score of 3 points is awarded for a national program that both covers a range of manufacturers and offers incentives for achievements and/or participation. Countries with agreements that either offer incentives or cover a diversity of manufacturers, but do not do both, are awarded 2 points.
MANDATE FOR PLANT ENERGY MANAGERS (2 POINTS)
This metric is scored according to whether a country has a national law or regulation requiring industrial facilities to employ an energy management expert on site. A dedicated on-site energy manager can improve processes, identify waste, and maximize the efficient use of energy resources. Countries that have a plant energy manager mandate receive 2 points.
MANDATORY ENERGY AUDITS (2 POINTS)
Periodic energy audits can help businesses identify opportunities to improve energy efficiency, benchmark improvements, and identify negative trends. Countries are awarded 2 points if they have a national law or regulation requiring periodic energy audits of industrial facilities.
AGRICULTURE ENERGY INTENSITY (2 POINTS)
For the second edition of the International Scorecard we broke out the energy intensity of agriculture and forestry to more accurately represent energy efficiency in this very energy-intensive and economically important sector. Agricultural production relies on the use of energy from fossil fuel resources. Various crop production practices require direct consumption of fuel and electricity, and the production of agricultural inputs, such as fertilizers and pesticides, requires an indirect use of energy.
The full 2 points are awarded to countries with an energy intensity of less than 0.050 kiloton of oil equivalent (ktoe) per dollar of agricultural GDP. Countries with an intensity of less than 0.100 ktoe per dollar receive 1 point.
Transportation
Countries can earn up to 25 points across 8 different metrics for energy efficiency in the transportation sector. We evaluate countries in the areas of passenger (light-duty) vehicles, public transit, and freight transport. We evaluate the energy efficiency of passenger vehicles using a comparison of fuel economy standards, the average fuel economy of on-road passenger vehicles, and the total vehicle miles traveled (VMT) per person in a year. The metrics evaluating public transit consider both investment in and use of modes of public transport in a nation. We evaluate the energy intensity of freight transport based on the

SELF-SCORING TOOL © ACEEE
12
energy consumed per ton-mile. An additional measure of the efficiency of goods movement is provided by ton-mile per unit of GDP, a measure of locational efficiency.
VEHICLE MILES TRAVELED PER CAPITA (3 POINTS)
We score this metric according to total miles traveled in a year by passenger vehicles, divided by total population. This information provides some general insight into how much the population of a nation uses automobiles, an inefficient mode of personal transport. Countries with an average VMT per capita of no more than 1,000 (1,609 vehicle kilometers traveled, or VKT) receive 3 points; no more than 2,000 (3,219 VKT), 2 points; and no more than 7,000 (11,265 VKT), 1 point.
FUEL ECONOMY AND FUEL ECONOMY STANDARDS FOR LIGHT-DUTY VEHICLES (3 POINTS/4
POINTS)
For purposes of this metric, fuel economy standards can be miles-per-gallon standards or limits on carbon dioxide emission. Countries with requirements equivalent to greater than 60 mpg (25.5 km/liter) by 2025 receive a full 4 points, while countries with requirements of between 55 mpg (23.4 km/liter) and 60 mpg (25.5 km/liter) by 2025 receive 3 points. Countries with requirements of between 45 mpg (19.1 km/liter) and 55 mpg (23.4 km/liter) by 2025 receive 2 points. Those with requirements of over 35 mpg (14.9 km/liter) by 2025 receive 1 point.
In addition to scores for standards, we award a separate score for performance—the average on-road fuel economy of light-duty (passenger) vehicles. Countries with fuel economies averaging greater than 35 mpg receive the full 3 points, while countries with an average between 31 and 35 mpg receive 2 points, and countries with an average between 25 and 30 mpg receive 1 point.
USE OF PUBLIC TRANSIT (3 POINTS)
To measure public transit use we divided the distance traveled by rail, bus, and coach passengers by the total distance traveled by passengers across all motorized modes of inland travel (excluding motorcycles). Countries where more than 30% of travel is completed by public transit receive a full score of 3 points; more than 20%, 2 points; and more than 10%, 1 point.
INVESTMENT IN RAIL TRANSIT VERSUS ROAD TRANSIT (3 POINTS)
We measure countries’ investment in public transit as the ratio of government investment in rail to investment in roads. Investment in all transit modes would be a superior metric, but these data are not readily available. Interestingly, among the countries analyzed in the Scorecard, high government investment in rail compared to roads does not appear to correlate with high use of public transit. This seems to support the view that countries must not only make public transit available but also address other factors that affect ridership. Such factors include population density, vehicle ownership, size of transit network, transit schedule, and fares.
Countries with a rail-to-road spending ratio of 1.00 or greater receive the full 3 points; with a ratio of 0.50 to 1.00, 2 points; and with a ratio of 0.10 to 0.49, 1 point.

SELF-SCORING TOOL © ACEEE
13
ENERGY INTENSITY OF FREIGHT TRANSPORT AND FUEL ECONOMY STANDARDS FOR HEAVY-DUTY
TRUCKS (3 POINTS/3 POINTS)
Two metrics measure the energy intensity of freight transport. The first measures energy consumed per ton-mile traveled. The second calculates the ton-miles of freight transport per dollar of GDP to determine the amount of freight transport per unit of economic activity, which can be considered a measure of the locational efficiency of industrial and commercial activity. Table 6 presents the scoring criteria for each metric.
Table 6. Point allocation for freight metrics
Energy per ton-
mile traveled
(kBtu/ton-mile) Score Ton-mile per dollar
of GDP ($) Score
0.6 3 0.08 3
1.2 2 0.2 2
2 1 1 1
For the 2014 edition of the International Scorecard we added fuel efficiency standards for heavy-duty vehicles. These are relatively new policies for most countries but mark an important step toward additional energy savings in the transportation sector. For purposes of this metric, fuel consumption standards can include miles per gallon standards as well as emission limits on carbon dioxide. Countries receive the full 3 points for reduction goals of at least 18%, 2 points for goals of at least 14%, 1 point for 9%, and no points if they do not have a standard in place.
Conclusions
It is our hope that the Self-Scoring Tool will be used to identify energy efficiency progress and opportunities for improvement in countries, states, and other jurisdictions. For countries not included in the 2014 International Scorecard analysis, this tool provides an opportunity to compare their policies and economy-wide energy efficiency with other nations and identify specific areas in which other countries are doing better. In addition, countries that have already been analyzed can use the tool to see how different policy options might affect their scores and improve their rankings.
We are always seeking to improve the quality of our data, and in 2015 we will begin collecting data for the 2016 ACEEE International Energy Efficiency Scorecard. With this in mind, we encourage users to send us their results. Please direct results and questions about this document or the ACEEE International Self-Scoring Tool to Chetana Kallakuri at [email protected] and Sara Hayes at [email protected].
SELF-SCORING TOOL © ACEEE
14
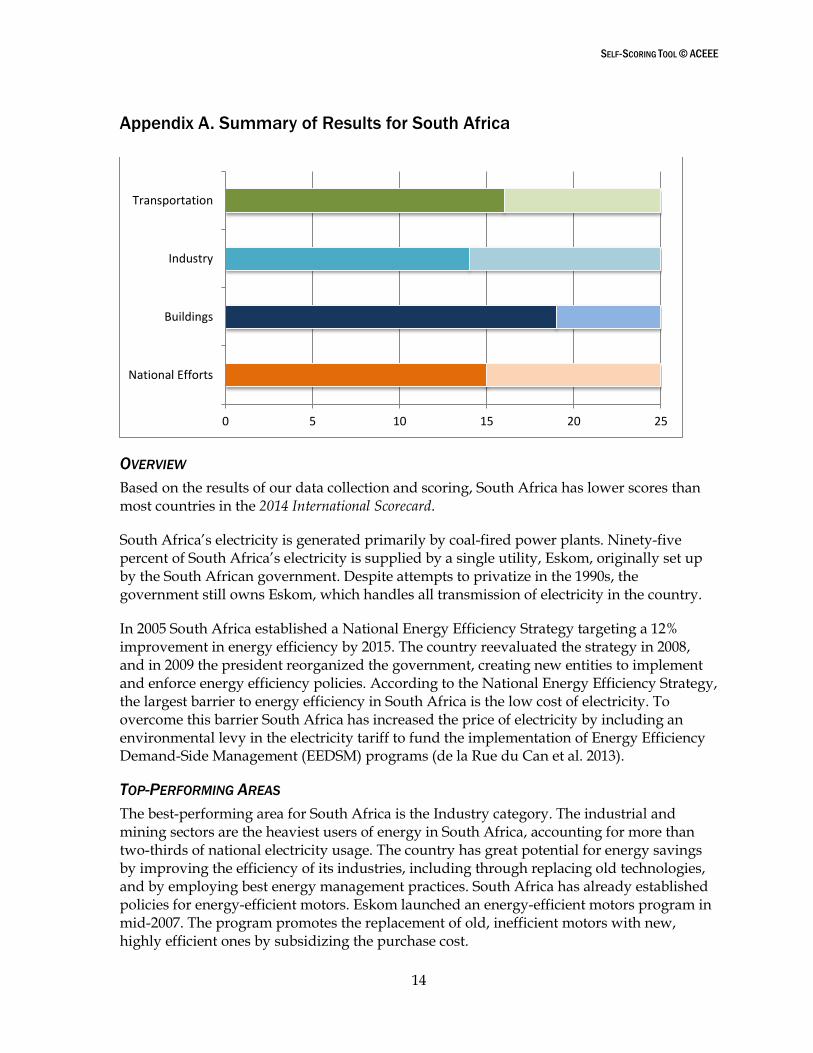
Appendix A. Summary of Results for South Africa
OVERVIEW
Based on the results of our data collection and scoring, South Africa has lower scores than most countries in the 2014 International Scorecard.
South Africa’s electricity is generated primarily by coal-fired power plants. Ninety-five percent of South Africa’s electricity is supplied by a single utility, Eskom, originally set up by the South African government. Despite attempts to privatize in the 1990s, the government still owns Eskom, which handles all transmission of electricity in the country.
In 2005 South Africa established a National Energy Efficiency Strategy targeting a 12% improvement in energy efficiency by 2015. The country reevaluated the strategy in 2008, and in 2009 the president reorganized the government, creating new entities to implement and enforce energy efficiency policies. According to the National Energy Efficiency Strategy, the largest barrier to energy efficiency in South Africa is the low cost of electricity. To overcome this barrier South Africa has increased the price of electricity by including an environmental levy in the electricity tariff to fund the implementation of Energy Efficiency Demand-Side Management (EEDSM) programs (de la Rue du Can et al. 2013).
TOP-PERFORMING AREAS
The best-performing area for South Africa is the Industry category. The industrial and mining sectors are the heaviest users of energy in South Africa, accounting for more than two-thirds of national electricity usage. The country has great potential for energy savings by improving the efficiency of its industries, including through replacing old technologies, and by employing best energy management practices. South Africa has already established policies for energy-efficient motors. Eskom launched an energy-efficient motors program in mid-2007. The program promotes the replacement of old, inefficient motors with new, highly efficient ones by subsidizing the purchase cost.
0 5 10 15 20 25
National Efforts
Buildings
Industry
Transportation

SELF-SCORING TOOL © ACEEE
15
South Africa performs second best in the National Efforts category, with national savings policies driving greater efficiency. For example, the government implemented a lead-by-example program under the National Energy Efficiency Strategy. The Department of Energy partnered with Eskom and the Department of Public Works to retrofit government buildings, resulting in energy and dollar savings.
The government also introduced tax allowances for energy efficiency. One incentive is designed to support investment in cleaner production through manufacturing expansion or retrofit. The other incentive is an allowance for energy savings achieved through energy efficiency in any activity.
AREAS FOR IMPROVEMENT
Though South Africa has taken steps to improve its energy efficiency, it can do more in several areas by applying a number of best practices. In the Buildings category, the Department of Energy has already initiated a labeling program for household appliances to help inform consumers of their energy consumption. The products selected for the mandatory labeling program are residential refrigerators (fridges, freezers, and combinations thereof); washing machines and dishwashers; room air conditioners; electric stoves, ovens, and hobs; and electric water heaters.
South Africa also has national building codes for the residential sector, but these are voluntary. The codes cover insulation and glazing for exteriors and space cooling, space heating, water heating, lighting, and ventilation. The country does not currently have building codes for the commercial sector. Implementing building energy codes for both sectors would reduce waste in buildings and improve South Africa's score.
The South African residential sector has great potential for energy savings through the Reconstruction and Development Program. In 1994, attempting to address the imbalances and inequities of previous government policies, the newly elected democratic government established the Reconstruction and Development Program (RDP). This program set a new policy agenda for the country based on the principle of meeting the population’s basic needs. Also, coupling the National Housing Program with energy efficiency would help increase energy services and comfort and reduce electricity costs.
South Africa’s transportation sector, using three-quarters of the country's petroleum, would benefit from stronger energy efficiency policies and waste-cutting measures. Standards for energy-efficient cars, vehicles with lower emissions, the introduction of licensing differentials according to engine efficiency, and roadworthiness tests are options to help South Africa improve its transportation score. Better transportation-sector data collection and reporting (e.g., on vehicle usage, fuel efficiency, freight usage, and investment in rail
Additional Resources For more information on the National Energy Efficiency Strategy see: http://www.energy.gov.za/EEE/Review%20of%20National%20Energy%20Efficiency%20Strategy%202008.pdf.
For more information on the residential building codes see: http://www.iea.org/beep/south%20africa/codes/national-building-regulation-2011.html.

SELF-SCORING TOOL © ACEEE
16
and road infrastructure) would also help the government understand its energy use and where it might improve.
One promising sign is the interest Eskom and the South African government have shown in working with ESCOs on energy efficiency projects. (In South Africa any company that works on energy efficiency is called an ESCO.) This collaboration would help create new financing opportunities for energy efficiency projects. Building relationships with banks and working with national or international ESCOs could drive greater cost-effective energy efficiency in South Africa and improve its score relative to other countries in the International Scorecard.
REFERENCES
ABB. 2013. South Africa Energy Efficiency Report. Modderfontaine, South Africa: ABB. https://library.e.abb.com/public/ba2fee74f5ecc85ac1257be9002b7892/South%20Africa.pdf?filename=South%20Africa.pdf.
Bredenkamp, B. 2012. “What Does SANS 941: Energy Efficiency SANS 941: Energy Efficiency for Electrical and Electronic Apparatus for Electrical and Electronic Apparatus Require?” Presentation at SABS Convention. https://www.sabs.co.za/docs%5CBarry_Bredenkamp_SANEDI_SABS%20Convention%202012.PDF.
CLASP. 2015. “Global Standards and Label Database.” Accessed August. http://clasp.ngo/Tools/Tools/SL_Search.
CSIR (Council for Scientific and Industrial Research). 2012. State of Logistics Survey for South Africa. Stellenbosch, South Africa: CSIR. http://www.csir.co.za/sol/docs/final_9th%20SoL%20for%20web.pdf.
de la Rue du Can, S., V. Letschert, G. Leventis, and T. Covary. 2013. Energy Efficiency Country Study: Republic of South Africa. Berkeley: Lawrence Berkeley National Laboratory, Environmental Energy Technologies Division. https://ies.lbl.gov/sites/all/files/south_africa_country_study_lbnl_report_final_0.pdf.
Development Bank of Southern Africa. 2012. The State of South Africa’s Economic Infrastructure: Opportunities and Challenges. Pretoria: Development Bank of Southern Africa. http://www.dbsa.org/EN/About-Us/Publications/Documents/State%20of%20economic%20infrastructure%202012.pdf.
EDMS. 2007. Review of the International Water Resources Management Policies and Actions and the Latest Practice in Their Environmental Evaluation and Strategic Environmental Assessment Final Report: South Africa. Hong Kong: EDMS. http://www.epd.gov.hk/epd/SEA/eng/file/water_index/southafrica.pdf.
European Commission. 2013. ESCO Market Report for Non-European Countries 2013. Luxembourg: European Union. http://iet.jrc.ec.europa.eu/energyefficiency/sites/energyefficiency/files/reqno_jrc91689_ld-na-26886-en-n.pdf.

SELF-SCORING TOOL © ACEEE
17
Green Building Council of South Africa. 2015. “Green Star SA Rating System.” Accessed August. https://www.gbcsa.org.za/green-star-sa-rating-system/.
HSRC (Human Sciences Research Council). 2015. “South African National Survey of Research and Experimental Development.” Accessed August. http://www.hsrc.ac.za/en/departments/cestii/sa-national-survey-of-research-and-experimental-development.
ICCT (International Council on Clean Transportation). 2015. Policies to Reduce Fuel Consumption, Air Pollution, and Carbon Emissions from Vehicles in G20 Nations. Washington, DC: ICCT. http://www.theicct.org/sites/default/files/publications/ICCT_G20-briefing-paper_Jun2015.pdf.
IEA (International Energy Agency). 2008. Combined Heat and Power: Evaluating the Benefits of Greater Global Investment. Paris: International Energy Agency. https://www.iea.org/publications/freepublications/publication/chp_report.pdf.
——— . 2011. South Africa: Balances for 2011. Paris: International Energy Agency. http://www.iea.org/statistics/statisticssearch/report/?country=SOUTHAFRIC&product=Balances&year=2011.
——— . 2012. Technology Roadmap: Fuel Economy of Road Vehicles. Paris: International Energy Agency. http://www.iea.org/publications/fueleconomy_2012_final_web.pdf.
——— . 2014a. International Comparison of Light-Duty Vehicle Fuel Economy: Evolution Over 8 Years from 2005 to 2013. Paris: International Energy Agency. http://www.fiafoundation.org/media/45112/wp11-iea-report-update-2014.pdf.
——— . 2014b. Railway Handbook 2014. Paris: International Energy Agency. http://www.uic.org/IMG/pdf/iea-uic_railway_handbook_2014_web.pdf.
——— . 2015. “Energy Efficiency Policies.” Paris: International Energy Agency. Accessed August. http://www.iea.org/policiesandmeasures/pams/southafrica/name-34652-en.php.
Kahn, T. 2014. “SA’s Spending on Research and Development ‘To Improve.’” Business Day Live, April 9. http://www.bdlive.co.za/national/science/2014/04/09/sas-spending-on-research-and-development-to-improve.
Milford, R. 2015. “Perspective on Energy Efficiency Building Regulations; A South African Perspective.” August. http://www.energy.gov.za/cop%2017/CopFiles/PerspectiveOnEnergyEfficiencyBuilding.pdf.
National Institute of Building Sciences. 2014. “Green Building Standards and Certification Systems.” https://www.wbdg.org/resources/gbs.php.

SELF-SCORING TOOL © ACEEE
18
National Treasury Republic of South Africa. 2013. Estimates of National Expenditure 2013. Johannesburg: National Treasury Republic of South Arica. http://www.treasury.gov.za/documents/national%20budget/2013/ene/FullENE.pdf.
Republic of South Africa. 2008a. Electricity Regulation Act 2006. http://www.energy.gov.za/files/policies/Norms_and_standards_for_reticulation_services_promulgated_version.pdf.
——— . 2008b. National Response to South Africa’s Electricity Shortage. Pretoria: Republic of South Africa. http://www.gov.za/sites/www.gov.za/files/resp_elec.pdf.
——— . 2011a. Republic of South Africa, Edict of Government: Energy Efficiency in Buildings. https://law.resource.org/pub/za/ibr/za.sans.204.2011.pdf.
——— . 2011b. SANS 10400-XA: The Application of the National Building Regulations Part X: Environmental Sustainability Part XA: Energy Usage in Buildings. https://law.resource.org/pub/za/ibr/za.sans.10400.xa.2011.pdf.
——— . 2015. “Water Affairs.” Accessed August. http://www.gov.za/about-sa/water-affairs.
Safal Steel. 2013. “Briefly Explained: The SANS 10400-XA and SANS 204 Regulations.” http://www.safalsteel.co.za/2013/12/24/explained-sans-10400-sans-204-regulations/.
SANEDI (South African National Energy Development Institute). 2012. Quantifying the Energy Needs of the Transport Sector for South Africa: A Bottom‐Up Model. Cape Town: South African National Energy Development Institute. http://www.erc.uct.ac.za/Research/publications/12-Merven-etal_Quantifying_energy_needs_transport%20sector.pdf.
——— . 2013. “ESCO: Development of a Market for ESCos.” Cape Town: South African National Energy Development Institute. http://www.sanedi.org.za/esco/.
——— . 2014. Annual Energy Report 2012/2013. Cape Town: South African National Energy Development Institute. http://www.sanedi.org.za/wp-content/uploads/2013/10/sanedi_annual_report_2013.pdf.
——— . 2015. “Energy Efficiency Legislation and Incentives.” South African National Energy Development Institute. Accessed August. http://www.sanedi.org.za/energy-efficiency-legislation-and-incentives/.
South Africa Department of Energy. 2015. “FAQs: Energy Efficiency.” Accessed August. http://www.energy.gov.za/files/faqs/faqs_energyefficiencystandards.html.
South Africa Department of Trade and Industry. 2014. Compulsory Specification for Energy Efficiency and Labeling of Electrical and Electronic Apparatus (VC 9008). Pretoria: Department of Trade and Industry. http://www.nrcs.org.za/siteimgs/vc/VC9008.pdf.

SELF-SCORING TOOL © ACEEE
19
Statistics South Africa. 2012. Building Statistics. Pretoria: Statistics South Africa. http://www.statssa.gov.za/publications/Report-50-11-01/Report-50-11-012012.pdf.
——— . 2013. National Household Travel Survey 2013. Pretoria: Statistics South Africa. http://www.statssa.gov.za/publications/P0320/P03202013.pdf.
Sustainable Energy Africa. 2015. Energy Efficiency in Buildings. Cape Town: Sustainable Energy Africa. http://www.cityenergy.org.za/uploads/resource_162.pdf.
Transnet. 2010. Annual Report 2010. Johannesburg: Transnet. http://pmg-assets.s3-website-eu-west-1.amazonaws.com/docs/120516transneta.pdf.
UNEP (UN Environment Programme). 2015. The South African Developing Automotive Fuel Economy Policy. Accessed August. http://www.unep.org/transport/gfei/autotool/case_studies/africa/southafrica/SOUTH%20AFRICA%20CASE%20STUDY.pdf.
Wafula J.E., and A.A. Talukhaba. 2008. Retrofits and Renewals in Buildings for Energy Efficiency and Building Regulations and Control in Local Authorities in South Africa. Johannesburg: School of Construction Economics and Management, University of the Witwatersrand. https://www.academia.edu/9986573/Retrofits_and_renewals_in_buildings_for_energy_efficiency_and_building_regulations_and_control_in_local_authorities_in_South_Africa.
WEC (World Energy Council). 2015. Energy Efficiency Indicators. London: Enerdata. http://www.wec-indicators.enerdata.eu/power-plants-thermals.html#/power-plants-thermals.html.
World Bank. 2015. “World Bank Open Data.” Washington, DC: The World Bank Group. http://data.worldbank.org/