acf fsl manual final 10
TRANSCRIPT

8/9/2019 ACF FSL Manual Final 10
http://slidepdf.com/reader/full/acf-fsl-manual-final-10 1/270
A C F I N T E R N A T I O N A L

8/9/2019 ACF FSL Manual Final 10
http://slidepdf.com/reader/full/acf-fsl-manual-final-10 2/270
A C F I N T E R N A T I O N A L
ACF-Canada
7105 rue St-Hubert
Bureau 105
Montréal, QC H2S 2N1www.actioncontrelafaim.ca
Tel: +1 514.279.4876
ACF-France
4, rue Nièpce
75662 Paris Cedex 14
www.actioncontrelafaim.org
Tel : +33 01.43.35.88.88
ACF-Spain
C/Caracas, 6, 1º
28010 Madrid
www.accioncontraelhambre.org
Tel.: +34 91.391.53.00
ACF-United Kingdom
First Floor, Rear Premises
161-163 Greenwich High Road
London SE10 8JAwww.actionagainsthunger.org.uk
Tel: +44 20.8293.6190
ACF-United States
247 West 37th Street
10th Floor
New York, NY 10018
www.actionagainsthunger.org
Tel. +1 212.967.7800

8/9/2019 ACF FSL Manual Final 10
http://slidepdf.com/reader/full/acf-fsl-manual-final-10 3/2701ACF Food Security and Livelihoods Assessment Guideline
FOOD SECURITY ANDLIVELIHOOD ASSESSMENTS
A PRACTICAL GUIDE FOR FIELD WORKERS
TECHNICAL DEPARTMENT OF FOOD SECURITY AND LIVELIHOODS
ACF INTERNATIONAL

8/9/2019 ACF FSL Manual Final 10
http://slidepdf.com/reader/full/acf-fsl-manual-final-10 4/2702 ACF Food Security and Livelihoods Assessment Guideline
April 2010
Editing: ACF International
Printed: Joseph Ferruzzi Associates, Inc.
Cover Photo: ACF-Uganda, courtesy P. Foley
© ACF International. All rights reserved

8/9/2019 ACF FSL Manual Final 10
http://slidepdf.com/reader/full/acf-fsl-manual-final-10 5/270

8/9/2019 ACF FSL Manual Final 10
http://slidepdf.com/reader/full/acf-fsl-manual-final-10 6/2704 ACF Food Security and Livelihoods Assessment Guideline
8/9/2019 ACF FSL Manual Final 10
http://slidepdf.com/reader/full/acf-fsl-manual-final-10 7/2705ACF Food Security and Livelihoods Assessment Guideline
PREAMBLE
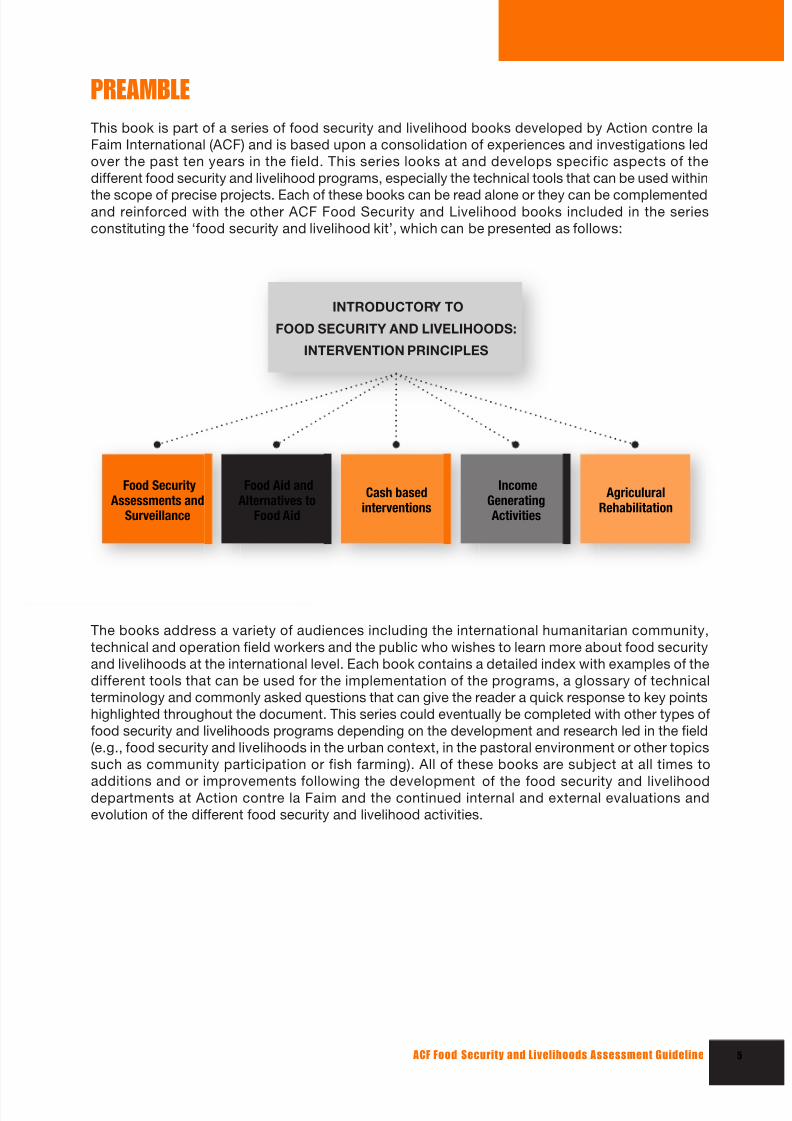
This book is part of a series of food security and livelihood books developed by Action contre la
Faim International (ACF) and is based upon a consolidation of experiences and investigations led
over the past ten years in the field. This series looks at and develops specific aspects of the
different food security and livelihood programs, especially the technical tools that can be used within
the scope of precise projects. Each of these books can be read alone or they can be complementedand reinforced with the other ACF Food Security and Livelihood books included in the series
constituting the ‘food security and livelihood kit’, which can be presented as follows:
The books address a variety of audiences including the international humanitarian community,
technical and operation field workers and the public who wishes to learn more about food security
and livelihoods at the international level. Each book contains a detailed index with examples of the
different tools that can be used for the implementation of the programs, a glossary of technical
terminology and commonly asked questions that can give the reader a quick response to key points
highlighted throughout the document. This series could eventually be completed with other types of
food security and livelihoods programs depending on the development and research led in the field
(e.g., food security and livelihoods in the urban context, in the pastoral environment or other topics
such as community participation or fish farming). All of these books are subject at all times to
additions and or improvements following the development of the food security and livelihooddepartments at Action contre la Faim and the continued internal and external evaluations and
evolution of the different food security and livelihood activities.
INTRODUCTORY TO
FOOD SECURITY AND LIVELIHOODS:
INTERVENTION PRINCIPLES
Food SecurityAssessments and
Surveillance
Food Aid andAlternatives to
Food Aid
Cash basedinterventions
IncomeGeneratingActivities
AgriculuralRehabilitation

8/9/2019 ACF FSL Manual Final 10
http://slidepdf.com/reader/full/acf-fsl-manual-final-10 8/2706 ACF Food Security and Livelihoods Assessment Guideline

8/9/2019 ACF FSL Manual Final 10
http://slidepdf.com/reader/full/acf-fsl-manual-final-10 9/2707ACF Food Security and Livelihoods Assessment Guideline
OBJECTIVE OF THE BOOK
To constitute a methodological, technical and practical reference tool for the implementation of
Food Security and Livelihoods assessments.
Contents
Preamble
Introduction
1. Conceptual framework
2. Gathering information
3. Sampling and assessment planning
4. Core components of a food security and livelihood assessment
5. Analyzing results
6. Identifying solutions
7. Disseminating information
8. Appendices

8/9/2019 ACF FSL Manual Final 10
http://slidepdf.com/reader/full/acf-fsl-manual-final-10 10/2708 ACF Food Security and Livelihoods Assessment Guideline
INTRODUCTION
This book is intended to provide practical guidance to ACF field workers on how to implement a Food
Security and Livelihoods (FSL) assessment. It is intended to be used by ACF food security & livelihood
project managers, team members and consultants responsible for undertaking rapid and in-depth
assessments in emergency, recovery and chronic crisis contexts.
This guideline is a review and update of the 2006 ACF publication Methodological Approach for Food
Security Assessments and Surveillance. Surveillance methods are not included in this book and will be
covered in a separate updated module. This is the sixth book of the series and is conceived as a
supporting document to the first reference book, Introduction to Food Security: Intervention Principles
which explains the basic notions, concepts, definitions and general approaches to food security; as well
as the ACF Food Security & Livelihoods Policy Paper. The book sets the foundation and necessary
understanding for all ACF food security and livelihood programs, introduced in the previous four books:
Agricultural Program, Income Generating Activities, Cash based Interventions and Market for the Poor. In
addition, this book is meant to complement the SPHERE Humanitarian Charter and Minimum Standards
for Disaster Response, revised in 2010.
The overall conceptual approach and associated methods presented in this guideline are based on
two conceptual frameworks adapted from the UNICEF causal framework for malnutrition and the
DFID Sustainable Livelihoods framework. Food security and livelihoods encompass a tremendously
complex field underpinned by a range of factors that are in constant dynamic flux. Likewise, our
understanding of how best to address a population’s food insecurity and support its livelihoods in
a timely, effective, locally coherent and sustainable manner changes over time. Our challenge as
practitioners in the field is to adapt our conceptual approaches and related tools to reflect new
insights and proven methods that ideally will have been developed in concert with affected
communities and local institutions. As such, this guideline represents a snapshot of our current
state of knowledge but will likely require review and revision as time passes.
Assessment is the second step in the project cycle. Its main purpose is to allow us to gather informationon the food security and livelihoods situation of a crisis-affected population in order to identify
appropriate responses by the agency. Many assessments will be carried out during various stages of an
emergency (acute or chronic) in order to support programming decisions and inform the development of
mid and long term strategies. Assessments will also be carried out at other stages of the project cycle,
including as part of monitoring and evaluation activities and to support transition and exit strategies.
To inform decisions by ACF and other actors regarding appropriate responses, assessments must
answer some or all of the following key questions.
KEY QUESTIONS
• Which crisis?• What has been the impact of the crisis on the zone? On the food security and livelihoods
of the population?
• Which groups are at risk? Where? When? Why?
• What types of risks do these groups face?
• What type of response is required to assist these groups?
• How much assistance is required? How much assistance is provided by other actors?
• How should beneficiaries be selected?
• How many people are in need of each type of assistance?
• When should the assistance be provided and for how long?
• What results are we seeking to obtain with our response?

8/9/2019 ACF FSL Manual Final 10
http://slidepdf.com/reader/full/acf-fsl-manual-final-10 11/2709ACF Food Security and Livelihoods Assessment Guideline
THE STRUCTURE OF THE GUIDELINE IS AS FOLLOWS:
Chapter 1. Conceptual framework
This chapter lays out the broad approach to food security and livelihoods programming at ACF and
the key concepts and principles that should guide the design and implementation of food security
and livelihood assessments.
Chapter 2. Gathering information
This chapter reviews the different types of food security and livelihood assessments, types of
information to be gathered and broad methods for doing so.
Chapter 3. Sampling
This chapter looks at the main sampling approaches and provides a checklist of the key steps
involved in planning an assessment.
Chapter 4. Core components of a FSL assessment
This chapter provides detailed guidance on the ten core elements of a food security and livelihoods
assessment and suggests the use of specific tools, methods and sources of information to support
the data collection.
Chapter 5. Analyzing results
This chapter provides an analytical framework for drawing conclusions on the assessment findings
in order to judge the severity and scale of food and livelihood insecurity in the surveyed area and
identify most vulnerable groups.
Chapter 6. Identifying solutions
This chapter gives guidance on how to identify appropriate interventions and formulate
recommendations for action based on the key analytical results of the assessment.
Chapter 7. Disseminating informationThis chapter highlights the need to share findings with a range of stakeholders and provides a
structure for report-writing.
Appendices
Sample question guides, questionnaires and a variety of tools can be found here.

8/9/2019 ACF FSL Manual Final 10
http://slidepdf.com/reader/full/acf-fsl-manual-final-10 12/27010 ACF Food Security and Livelihoods Assessment Guideline
ACF Action Contre la Faim International
ASPI Agro-Sylvo-Pastoral Interventions
CBI Cash Based Intervention
CFW Cash For Work
CSI Coping Strategy Index
DD Dietary Diversity
DRR Disaster Risk Reduction
EFSA Emergency Food Security Assessment
EMMA Emergency Market Mapping and Analysis
EWS Early Warning System
FANTA Food and Nutrition Technical Assistance
FAO Food and Agriculture Organisation of the United Nations
FCG Food Consumption Group
FCS Food Consumption Score
FEWSNET Famine Early Warning System Network
FFW Food For WorkFGD Focus Group Discussion
FSNAU Food Security and Nutrition Analysis Unit Somalia
FSL Food Security & Livelihoods
FSMS Food Security Monitoring System
GAM Global Acute Malnutrition
HDDS Household Dietary Diversity Score
HE A Household Economy Approach
HH Household
ICRC International Committee of the Red Cross and Red Crescent Societies
IDDS Individual Dietary Diversity Score
IDP Internally Displaced Persons
IGA Income Generating Activities
IPC Integrated Food Security and Humanitarian Phase Classification
KI Key Informant
MSF Médécins sans Frontières / Doctors Without Borders
MUAC Mid Upper Arm Circumference
NCA Nutrition Causal Analysis
OCHA Office for the Coordination of Humanitarian Affairs of the United Nations
PP Proportional Piling
PR A Participatory and Rapid Appraisal
SAM Severe Acute Malnutrition
SCUK Save the Children United Kingdom
SFC Supplementary Feeding CentreSMART Standardized Monitoring and Assessment of Relief and Transitions
SWOT Strengths, Weaknesses, Opportunities and Threats
TFC Therapeutic Feeding Centre
TOR Terms of Reference
TOT Terms of Trade
UNICEF United Nations Children’s Fund
USAID United States Agency for International Development
VAM Vulnerability Analysis and Mapping
VCA Vulnerability and Capacity Analysis
WASH Water, Sanitation and Hygiene
WFP World Food Programme of the United Nations
WHO World Health Organisation of the United Nations
WHZ Weight-for-Height Z Score
LIST OF ACRONYMS

8/9/2019 ACF FSL Manual Final 10
http://slidepdf.com/reader/full/acf-fsl-manual-final-10 13/270

8/9/2019 ACF FSL Manual Final 10
http://slidepdf.com/reader/full/acf-fsl-manual-final-10 14/27012 ACF Food Security and Livelihoods Assessment Guideline
CHAPTER 5 – ANALYZING RESULTS 103
5.1 Basic considerations 104
5.2 Identifying the principal causes of food insecurity and risks to livelihoods 105
5.3 Determining the severity of food and livelihood insecurity 107
5.4 Establishing a vulnerability ranking 109
5.5 Estimating the scale of food and livelihood insecurity 111
CHAPTER 6 – IDENTIFYING SOLUTIONS 113
6.1 Examining interventions and capacities of other stakeholders 114
6.2 Zoning the affected areas according to vulnerability level & needs coverage 115
6.3 Identifying the range of possible FSL interventions 115
6.4 Deciding on an appropriate intervention strategy 117
6.5 Formulating recommendations 121
CHAPTER 7 – DISSEMINATING RESULTS 123
APPENDICES 127
LIST OF FIGURES
Figure 1: Conceptual Framework of Malnutrition (adapted from UNICEF,1990) 19
Figure 2: Sustainable Livelihoods Framework (DFID, 1996) 21
Figure 3: Acute malnutrition as a negative livelihood outcome (adapted from IFPRI, 2004) 22
Figure 4: Definitions of assessments in emergencies 30
Figure 5: Assessments in the Project Cycle 33
Figure 6: Stages of the Assessment Process 42Figure 7: Sequential framework of core components 58
Figure 8: Comparing the typical pattern of assets among Camel Nomads
and IDPs in Darfur, Northern Sudan 65
Figure 9: Mapping of agricultural commodity trade flows 70
Figure 10: Example of a seasonal calendar 75
Figure 11: Causal study of malnutrition 108
Figure 12: Decision tree for acute food crisis 119
LIST OF TABLES
Table 1: Severity scale of food & livelihood insecurity 25Table 2: Matrix of agency approaches to FSL assessments 29
Table 3: Core food security and livelihoods indicators 35
Table 4: Summary tools matrix 40
Table 5: Example of sampling methods for a joint FSL
and nutrition assessment in Jebel Marra, Sudan 51
Table 6: Summary of sampling methods 54
Table 7: Contextual information checklist 61
Table 8: Example of livelihood zones and groups in the Irrawaddy Delta, Myanmar 66
Table 9: Markets and price trends checklist 71
Table 10: Food availability checklist 72
Table 11: Sample format for uses of household production by % 74
Table 12: Food access checklist 77
Table 13: Sample format for changes in sources of household income by % 79

8/9/2019 ACF FSL Manual Final 10
http://slidepdf.com/reader/full/acf-fsl-manual-final-10 15/27013ACF Food Security and Livelihoods Assessment Guideline
Table 14: Sample format for changes in patterns of household expenditure by % 80Table 15: Sample format for changes in debt liability by % 81
Table 16: Food consumption checklist 83Table 17: Food utilisation checklist 87Table 18: Coping strategies by level of severity 92Table 19: Hazards, vulnerability and capacity assessment checklist 94Table 20: Types of hazards 95Table 21: Examples of resources that support adaptive capacity 100Table 22: Integrated analysis grid of livelihoods stressors, outcomes & responses 106Table 23: Example of a vulnerability ranking by zone in South Darfur 110Table 24: Example of Vulnerability and Capacity Analysis in pastoral zones of North Darfur 111
Table 25: Example of a scale estimation of food & livelihood insecurity by zone in North Kivu 112Table 26: Response options by risk factor 116Table 27: Entry points for mainstreaming of DRR and climate change adaptation 120Table 28: Method of information dissemination by stakeholder 124Table 29: Suggested report structure 125
LIST OF APPENDICES
Appendix 1: Core food security & livelihoods indicators 128 Appendix 2: Nutrition indicators 129 Appendix 3: MUAC methodology 130 Appendix 4: WASH indicators 132 Appendix 5: Guidelines for Rapid Assessments 133 Appendix 6: Triangulation 144 Appendix 7: Secondary data review 145 Appendix 8: Key informant interview guideline & templates 147
Appendix 9: Focus Group Discussion guideline & templates 163 Appendix 10: Household Questionnaire guideline & templates 178
Appendix 11: Participatory and Rapid Appraisal methods 191 Appendix 12: Steps to assessment planning checklist 217 Appendix 13: Notes on Bias 218 Appendix 14: Protocols for Household Selection, an example 221 Appendix 15: Protocols for Team Leader Monitoring, an example 222 Appendix 16: Daily Activity Plan, an example 224 Appendix 17: Mapping the market 225 Appendix 18: Analysing market trends 226 Appendix 19: Calculating Terms of Trade 228 Appendix 20: Livelihood Zoning and Profiling 231
Appendix 21: Sample Livelihood Matrix 237 Appendix 22: Seed Security Interview Guide 238 Appendix 23: Calculating Individual and Household Dietary Diversity Scores 239 Appendix 24: Calculating the Food Consumption Score 248 Appendix 25: FCS, HDDS and IDDS comparison matrix 254 Appendix 26: Calculating the Coping Strategy Index 255 Appendix 27: Tools and considerations for Data Analysis 261 Appendix 28: Write-up of Assessment Methods, an example 263

8/9/2019 ACF FSL Manual Final 10
http://slidepdf.com/reader/full/acf-fsl-manual-final-10 16/27014 ACF Food Security and Livelihoods Assessment Guideline
BIBLIOGRAPHY
1. On Assessment Approaches
CARE, July 2002. Household Livelihood Security Assessments: A Toolkit for Practitioners.
International Federation of the Red Cross and Red Crescent Societies (IFRC), 2006. How to conducta food security assessment: A step-by-step guide for National Societies in Africa.
Oxfam GB, 2003. Guidelines for Emergency Food Security Assessment and Response.
Save the Children, February 2008. Practitioner’s Guide to the Household Economy Approach.
http://www.savethechildren.org.uk/en/54_6781.htm
Women’s Refugee Commission, May 2009. Building Livelihoods: A Field Manual for Practitioners in
Humanitarian Settings.
World Food Programme (WFP), January 2009. Emergency Food Security Assessment Handbook –
second edition, Food Security Analysis Service
2. On Rapid Assessment Methods
ACF, 2010 (expected). Rapid Assessment Kit
Inter-Agency Standing Committee (IASC), 2009. Global Health, Nutrition & WASH Clusters
Multi-sectoral Initial Rapid Assessment (IRA) Tool.
3. On Livelihood Approaches
ACF, 2008. Urban Assessment Guideline: Evaluer les moyens d’existence durable et lesvulnérabilités urbaines.
DFID Sustainable Livelihoods Guidance Sheets http://www.nssd.net/pdf/sectiont.pdf;
http://www.eldis.org/go/topics/dossiers/l ivelihoods-connect/what-are-l ivelihoods-
approaches/training-and-learning-materials
Jaspers and Shoham, 2002. Overseas Development Institute (ODI). A Critical Review of Approaches
to Assessing and Monitoring Livelihoods in Situations of Chronic Conflict and Political Instability.
http://www.odi.org.uk/resources/download/1986.pdf
4. On Markets
Mohiddin, Lili and Mike Albu, 2009. Emergency Market Mapping and Analysis (EMMA) tool. Field
Exchange, Emergency Nutrition Network, March 2009 Issue 35.
Practical Action. Emergency Market Mapping & Analysis: Introduction & Overview of the EMMA
Toolkit. www.microlinks.org
World Food Programme, 2007. Market Analysis in Emergency Food Security Assessment.
Guidelines on Market Situation Analysis & Forecast and Response Protocol.
World Food Programme, 2009. World Hunger Series: Hunger and Markets.

8/9/2019 ACF FSL Manual Final 10
http://slidepdf.com/reader/full/acf-fsl-manual-final-10 17/27015ACF Food Security and Livelihoods Assessment Guideline
5. On Food Production
ACF Agricultural Programs: from initial assessment to program implementation.
Practical Action, 2009. Livestock Emergency Guidelines and Standards (LEGS)
6. On Food Consumption
Food and Nutrition Technical Assistance Project (FANTA), 2006. Household Dietary Diversity (HDDS)
for Measurement of Household Food Access Indicator Guide.
Food and Agriculture Organisation, December 2008. Guidelines for measuring household and
individual dietary diversity http://www.foodsec.org/tr/nut/guidelines.pdf
Wiesmann, Bassett et al., June 2009. International Food Policy Research Institute (IFPRI) Discussion
Paper 870: Validation of the World Food Programme’s food consumption score and alternativeindicators of household food security. http://www.ifpri.org/publication/validation-world-food-
programme-s-food-consumption-score-and-alternative-indicators-hous
World Food Programme, February 2008. Technical Guidance sheet on Food Consumption Analysis.
http://home.wfp.org/stellent/groups/public/documents/manual_guide_proced/wfp197216.pdf
7. On Coping Strategies
CARE, January 2008. The Coping Strategy Index: Field Methods Manual, Second Edition.
8. On Care Practices
ACF, July 2008. Position Paper: Infant and Young Child Feeding in Emergencies.
9. On Participatory Methodologies
ActionAid, 2004. Participatory Vulnerability Analysis.
www.proventionconsortium.org/.../PVA_ActionAid2005_meth.pdf
CARE, 2009. Climate Vulnerability and Capacity Analysis.
www.careclimatechange.org/index.php?option=com_content&view=article&id=25&Itemid=30
IISD, 2009. CRiSTAL: Community-based Risk Screening Tool – Adaptation and Livelihoods
www.cristaltool.org/
Tearfund, 2009. Climate change and Environmental Degradation Risk and Adaptation assessment.
http://tilz.tearfund.org/Topics/Environmental+Sustainability/CEDRA.htm
10. On Do No Harm
Collaborative for Development Action (CDA) Collaborative Learning Projects, November 2004.
The Do No Harm Handbook: Framework for Analyzing the Impact of Assistance on Conflict.
http://www.cdainc.com/dnh/docs/DoNoHarmHandbook.pdf

8/9/2019 ACF FSL Manual Final 10
http://slidepdf.com/reader/full/acf-fsl-manual-final-10 18/27016 ACF Food Security and Livelihoods Assessment Guideline
11. On Remittances
Savage and Harvey, June 2007. Overseas Development Institute (ODI) HPG Policy Brief 26:
Remittances during crises: implications for humanitarian response.
12. On Classifying Emergencies
IPC Global Partners. 2008. Integrated Food Securi ty Phase Classification Technical Manual.
Version 1.1.

8/9/2019 ACF FSL Manual Final 10
http://slidepdf.com/reader/full/acf-fsl-manual-final-10 19/270ACF Food Security and Livelihoods Assessment Guideline
11.1 Defining food security and livelihoods 18
1.2 Conceptual framework of malnutrition 19
1.3 Sustainable livelihoods framework 20
1.4 Linking nutrition, food security & livelihoods 22
1.5 Examining vulnerability 23
1.6 Community participation 26
Chapter 1CONCEPTUAL FRAMEWORK
© A
C F - M a l a w i , c o u r t e s y S .
H a u e n s t e i n - S w a n
17

8/9/2019 ACF FSL Manual Final 10
http://slidepdf.com/reader/full/acf-fsl-manual-final-10 20/27018 ACF Food Security and Livelihoods Assessment Guideline
1.1 DEFINING FOOD SECURITY AND LIVELIHOODS
For a long time, the conceptual framework used for ACF food security analyses and interventions has
been an adaptation of UNICEF’s conceptual malnutrition framework (1990). The increasing
complexity of the global food security situation, as well as improved analysis and comprehension,
has impelled ACF to broaden this initial focus on food security to encompass the notion of overall
livelihood security, integrating food security programming and analysis into a more far-reachingsustainable livelihoods framework.
Any changes to food availability (arising from changes in production or trade) and to food access
(arising from changes in economic entitlements) should be identified in a food security and
livelihood assessment.
Changes in food utilisation that are linked to disease and malnutrition will be more readilyidentified and measured by colleagues in the nutrition, health and WASH departments since
they are concerned with the access to health and sanitation services. Meanwhile, food security and
livelihood teams will be responsible for identifying changes related to the preparation and
distribution of food among members of the household. This will most often require an analysis of intra
household gender relationships as well as a basic understanding of infant and young child feeding
practices and associated care practices.
Refer to Appendix 1 for a description of the core food security and livelihood indicators used in Food
Security and Livelihood (FSL) assessments.
DEFINITIONS
Food security exists when all people, at all times, have physical, social and economic access to
sufficient, safe and nutritious food to meet their dietary needs and food preferences for an active
and healthy life. (FAO, 2002)
Within this definition of food security, there are three components:
§ Availability refers to the quantity, quality and seasonality of the food supply in the affected area.
It includes all local sources of food production including agriculture, livestock and
fisheries as well as wild-collected foods. It also includes all foods imported into the areaby traders.1 The presence of well-functioning market systems able to deliver food to the
area on a consistent basis and in adequate quantity and quality is a major determinant of
food availability.
§ Access refers to the capacity of a household to procure sufficient food to satisfy the
nutritional needs of all its members. It is a measure of the household’s ability to acquire
available food during a given period through a combination of home production and stocks,
purchases, barter, gifts, borrowing or food aid.
§ Utilisation refers to a household’s use of the food to which it has access, including food
storage, processing and preparation as well as its distribution within the household. It also
refers to an individual’s ability to absorb and metabolize nutrients, which can be affected bydisease and malnutrition.
A livelihood comprises the capabilities, comprised of assets (including both material and
social resources) and activities used by a household for means of living. A household’s
livelihood is secure when it can cope with and recover from stresses and shocks, and
maintain or enhance its capabilities and productive asset base. (Chambers and Conway, 1992)
1 Government programs and agencies can also impact availability in an area by supplying food aid.

8/9/2019 ACF FSL Manual Final 10
http://slidepdf.com/reader/full/acf-fsl-manual-final-10 21/27019ACF Food Security and Livelihoods Assessment Guideline
1.2 CONCEPTUAL FRAMEWORK OF MALNUTRITION
Nutritional causal analysis, the foundation of ACF interventions, considers immediate,
underlying and basic causes of malnutrition. This analysis includes different technical elements
(water-related, food-related, culture-related, etc.) that can influence the nutritional status of an
individual. This integrated analysis can be represented through the conceptual framework of
malnutrition, illustrated in Figure 1.
The framework represents an analytical process that establishes the clear interaction between
various causes of malnutrition.
All ACF interventions are embedded within this conceptual framework, which provides a
structure that helps to optimize resource allocations, ensure sector coherence, and favour efficiency
toward achievement of objectives, outputs, impact and beneficiary satisfaction. Consequently ACF
field activities are characterized by an integrated approach encompassing interventions in nutrition,
health, water and sanitation, and food security and livelihoods, as well as increasingly integrated
assessments, in order to address the spectrum of underlying causes of malnutrition.
MORTALITY
MALNUTRITION
Immediate
Causes
Underlying
Causes
Basic
Causes
Inadequate
Food
Intake
DiseaseImpaired growth &
development
Household
Food Insecurity –
availability, access
and utilisation
Water & Sanitation,
Public Health
& Hygiene
Psycho-Social Environment
&
Care practices
Local priorities
Political, social, historical, cultural & economic context
Formal & informal organization & Institutions
Potential Resources
Human, structural, natural & financial
Figure 1: Conceptual Framework of Malnutrition

8/9/2019 ACF FSL Manual Final 10
http://slidepdf.com/reader/full/acf-fsl-manual-final-10 22/27020 ACF Food Security and Livelihoods Assessment Guideline
Malnutrition is defined as an abnormal physiological condition due to an unbalanced diet in
either quantity or quality or both. Three types of malnutrition are recognized: acute malnutrition,
chronic malnutrition and micronutrient deficiencies. These three types are often met in the same
individuals, and are not mutually exclusive.
• Acute malnutrition or wasting reflects the current nutritional situation of a child and is due
to nutritional deficiencies related to poor intake or absorption. It results in a below-average
weight-for-height score or the presence of bilateral oedema or both. We differentiate between 2
degrees of acute malnutrition: Moderate acute malnutrition, which can further deteriorate into
severe acute malnutrition. Severe acute malnutrition is linked to a very high risk of mortality if not
immediately treated.
• Chronic malnutrition or stunting causes growth retardation and is due to chronic nutritional
deficiencies of mild proportion. It can also be the effect of an exposure to repeated
infections or even to poor living conditions, which hinder the growth of the child. It results in a
below-average height-for-age score.
• Micronutrient deficiencies reflect the poor intake or absorption of vitamins and minerals and are
diagnosed based on a range of determinants.
1.3 SUSTAINABLE LIVELIHOODS FRAMEWORK
The sustainable livelihoods framework (Figure 2) focuses on the strengths and assets that
people own to ensure their food security and livelihoods. These are represented by five key
categories of capital that people can draw from to achieve positive livelihood outcomes such as
ADDRESSING NUTRITION IN FOOD SECURITY & LIVELIHOOD ASSESSMENTS
ACF nutrition programs target specifically, but not always exclusively, acute malnutrition. This is
because acute malnutrition results from risk factors that are directly related to an unfolding
crisis situation and will lead to rapid loss of life in the absence of interventions.
Food security and livelihood assessments as a rule generally will not include anthropometry –
which is the measurement of height, weight, skinfold thickness and other key indicators of
malnutrition. This is because taking accurate body measurements requires training, specialized
equipment and specific sampling methodologies, all of which remain the specialty of trained
nutritionists.
Meanwhile, FSL assessments do need to include the gathering of any available nutritional data
during the course of secondary data collection, as well as an analysis of this data and
the overall nutritional situation in the final report. This means consulting internally with the
ACF nutrition team or with other agencies, or both, at the stage of secondary data collection
regarding the results of nutrition surveys recently conducted in the affected area. Adapted
responses to the presence of malnutrition in an area often include food security and livelihood
programs2 and therefore nutrition data must be considered.
The exception to this rule is in the case of rapid assessments. Occasionally, food security and
livelihoodteams may be the first ones to arrive into a new area and could be called on to include
a measurement of Mid-Upper Arm Circumference or MUAC in their rapid assessment of the
zone, if risk factors for malnutrition are thought to be present. Training and support from
nutrition team members is required in order to effectively deploy this tool in the field, including
sampling design, proper use of the tool, and analysis of results. See Appendix 2 and 3 for a
discussion of nutrition indicators including MUAC and associated thresholds and methods.
2 For example, improving the targeting and quality of food distribution, improving access to a diversity of locally available foodsthrough cash-based interventions, agricultural programs, support to income generation, support to market systems, etc.

8/9/2019 ACF FSL Manual Final 10
http://slidepdf.com/reader/full/acf-fsl-manual-final-10 23/27021ACF Food Security and Livelihoods Assessment Guideline
increased income and well being, improved food security, etc. The sustainable livelihoods framework
portrays food security and livelihoods as a cyclical process, as opposed to the linear process
depicted by the conceptual malnutrition framework. It also adds the notion of vulnerability and
integrates the concept of disaster risk reduction. It is a practical tool that outlines a holistic
approach to the design and monitoring of food security and livelihood interventions.
Within this framework, ACF food security and livelihood programs focus mainly on strengthening the
identified livelihood assets (and the five key categories of capital) and influencing the policies and
actions of structures including government and private sectors, in order to reduce
vulnerabilities and achieve the targeted livelihood outcomes. It is important, however, to note
that ACF interventions have limited ability to impact established factors, such as laws, policies,
culture and institutions, or to change natural conditions such as floods, drought, etc.
The interplay of malnutrition, food security and livelihoods, based on the above two frameworks, is
illustrated in Figure 3, which highlights acute malnutrition as one potential negative livelihood
outcome. The Figure also conceptualizes the theoretical scope of ACF food security and livelihood
interventions, in line with the organization’s overall strategy focusing on malnutrition.
The adoption of a livelihoods approach allows a broader vision of food security programming, as food
security is only one factor that contributes to a specific livelihood outcome. Other factors include
health, water and sanitation, as well as contextual factors that influence people’s way of living and
livelihood strategies. This analysis demonstrates how acute malnutrition can be the result from a
situation where livelihood assets as well as transforming factors and processes are unbalanced, and
the lack of one aspect cannot be compensated by the strength of another. This imbalance can
negatively influence livelihood outcomes and become an underlying cause of malnutrition.
VULNERABILITY
CONTEXT
Influence
& access
LIVELIHOOD
STRATEGIES
LIVELIHOOD ASSETS
STRUCTURES
PROCESSES
• SHOCKS
• TRENDS
• SEASONALITY
TRANSFORMING
STRUCTURES
& PROCESSES
• Levels ofgovernment
• Privatesector
• Laws
• Policies
• Culture
• Institutions
in
order
to
achieve
H
NS
FP
Key
H = Human CapitalN = Natural Capital
F = Financial Capital
S = Social CapitalP = Physical Capital
LIVELIHOOD
OUTCOMES
• More income
• Increasedwell-being
• Reducedvulnerability
• Improved foodsecurity
• More sustainableuse of NaturalResource base
Figure 2: Sustainable Livelihoods Framework (DFID, 1996)

8/9/2019 ACF FSL Manual Final 10
http://slidepdf.com/reader/full/acf-fsl-manual-final-10 24/27022 ACF Food Security and Livelihoods Assessment Guideline
1.4 LINKING NUTRITION, FOOD SECURITY & LIVELIHOODS
Causal pathways for malnutrition are complex. Disease and inadequate food intake are widely
recognized as the immediate causes of malnutrition but are influenced by a range of underlying and
basic causes which are more qualitative in nature.
Inadequate food intake refers to the quantity of food eaten by an individual but also to quality and
energy density. It shares an intimate relationship with disease which places increased nutritional
demands on the body but can also compromise the ability of the body to metabolize and assimilatenutrients as a result of appetite loss, mal-absorption and loss of nutrients. A cyclical relationship
exists between disease and malnutrition, where disease may cause malnutrition and severe
malnutrition increases susceptibility to disease.
Understanding why an individual has become sick or has reduced food intake requires examining
the three underlying causes of malnutrition: household food security, care & social environment and
health environment.
§ Household food security and its availability, access, use and quality components (defined
earlier) directly impact the types and quantity of food an individual consumes within
the household.§ Linked in with food security and nutrition is the household care environment which is the sum
of the ways in which dependent members of a household are looked after and fed. It includes
feeding practices for infants and young children e.g. breastfeeding and complementary feeding;
priorities for food distribution within the household; food habits, culture and traditions; and the
care of the sick and elderly. Inadequate care practices can lead to individual malnutrition within
the home even where household-level food access is assured.
Vulnerability context
Livelihood outcomesLivelihood strategies and assets
Nutrition insecurity
Acute malnutrition
Hiddenmalnutrition
Focus of ACF FSL
interventions
Transformingfactors and
processes
Food insecurity
Figure 3: Acute malnutrition as a negative livelihood outcome (adapted from IFPRI, 2004) 3
3 Nutrition security is considered a wider concept than food security, which is based on the concept of availability, access, andutilisation of food. A household has achieved nutrition security when it has secure access to food coupled with a sanitaryenvironment, adequate health services, and knowledgeable care to ensure a healthy life for all household members.

8/9/2019 ACF FSL Manual Final 10
http://slidepdf.com/reader/full/acf-fsl-manual-final-10 25/27023ACF Food Security and Livelihoods Assessment Guideline
§ Social and political networks, organizational structures, religious institutions and cultural
and religious practices are elements of the wider social environment that impact food
security and nutrition by determining a household’s access to knowledge, resources and
social networks.
§ Access to health services as well as water supply, sanitation and housing make up the
public health environment and are linked to nutrition status by conditioning exposure to
infectious disease.
Livelihoods underpin food security: they are the means by which people access resources and
assets in their environment in order to meet household needs. An analysis of the livelihoods of house-
holds and individuals begins with examining the five livelihood assets – physical, financial, natural,
social and human capital– present in the surveyed area, followed by the range of livelihood strategies
into which people translate them. Food security is one outcome of a successful livelihood strategy.
Ultimately, the larger political, economic, geographic, social and cultural context and its associated
institutions determine the local environment and the type of access that households will have to
resources. It conditions the external vulnerability context in which households operate – the shocks,
trends and seasonality to which they are exposed – as well as the resources and coping strategies
that households make use of.
Food security and livelihood assessments tend to focus on the household food security component
of the underlying causes of malnutrition, as seen in the UNICEF framework, seeking to analyze the
access, availability, quality and use factors associated with household food security. Food security
and livelihood assessments now also integrate an analysis of the vulnerability context and of
livelihood assets and strategies as represented in the Sustainable Livelihoods framework.
Meanwhile, psycho-social health, care and feeding practices, and access to potable water must
also be examined in the framework of an FSL assessment because they have a direct impact on food
intake and disease. Their neglect can lead us to erroneously identify the main risk factors for
malnutrition. ACF nutrition staff can assist in the design and analysis of questions on these topics.
1.5 EXAMINING VULNERABILITY
DEFINITIONSCoping mechanisms are temporary responses to reduce or minimize effects of a stressful eventor an unfavourable situation where food access is abnormally disrupted, for instance by drought,flood, earthquake or military activity.
Adaptive mechanisms are measures used to manage and minimize the risk from chronic foodinsecurity and recurring situations. Adaptation is a process of adjustment to a longer-term
solution, for instance pastoralists moving to new migratoryareas of better rainfall and pasture growth.
Vulnerability is the inadequacy of adaptive mechanisms, coping mechanisms or accumulatedcapital or food stocks to meet people’s daily needs. Generally speaking, the level of vulnerabilityof a household and/or individual is determined by the risk of failure of coping strategies. Morespecifically, food vulnerability refers to the entire range of factors that place people in danger offood insecurity. The degree of vulnerability for an individual, a household, or a group of peopleis determined by its exposure to risk factors and by its aptitude to confront crisis situations andto survive them.
Disaster risk reduction (DRR) is the systematic development and application of policies,strategies and practices to minimize vulnerability, hazard and the unfolding of disaster impactsthroughout a society, in the broad context of sustainable development. ACF interventions now
also aim to integrate the concept of disaster risk reduction.

8/9/2019 ACF FSL Manual Final 10
http://slidepdf.com/reader/full/acf-fsl-manual-final-10 26/27024 ACF Food Security and Livelihoods Assessment Guideline
Vulnerability, risk and capacity to cope (influenced by the strength of livelihood assets) are the key
concepts that define a potential livelihood outcome and a household’s food security, and thus the
need for a potential ACF intervention. In pragmatic terms, they can be translated into the analysis of:
• The likelihood and severity of a shock or ongoing stress, such as conflict, abnormal weather
patterns, changes in household budgets, harvest failures, etc., and the impact of these shocks or
stressors on the population.
• Coping mechanisms or strategies that households are likely to adopt when faced with a crisis, and
the effectiveness and sustainability of these strategies.
• Changes in external factors (transforming factors, structures and processes or vulnerability
context) that are likely to impact outcomes after a shock or ongoing stress, such as
market fluctuation.
Food insecurity results from crises or events to which populations are exposed combined with a
failure of adaptive and coping mechanisms. It often also involves the degradation of the social and/or
natural environment. Frequently, vulnerable households can no longer manage a balance between
dietary needs over the short term (survival) and the management of their means of existence(livelihood) over the long term. Chronic and transitory insecurity are closely linked. A succession of
situations causing temporary but severe food insecurity increases the vulnerability of the household
and leads to chronic food insecurity.
In the early or less severe stages of food insecurity, vulnerable households will sacrifice quality of the
diet by changing their sources of food to less expensive and less preferred foods. Individuals in the
household may also reduce meals and meal size, often while protecting working members of the
households and/or children. Irreversible strategies that involve selling capital assets or migration are
often a last resort: people will attempt to protect their livelihoods for as long as they can, even to the
point of experiencing significant food shortage in the household.
The severity of food insecurity can be charted according to the adoption of a range of increasinglydamaging consumption-related coping strategies as well as livelihood coping strategies such as
borrowing, labour migration, sale of capital assets, etc.
Severity of coping strategies depends heavily on context. Table 1 (below) proposes a broad severity
ranking of coping strategies and other indicators into stages of food and livelihood security, based
on patterns that have been observed across diverse settings. Reference outcomes are based on
the convergence of direct and indirect evidence rather than absolute thresholds. Each stage will not
necessarily show all characteristics, but the table helps to illustrate which stage a situation has
reached and in which direction the situation is likely to develop.

8/9/2019 ACF FSL Manual Final 10
http://slidepdf.com/reader/full/acf-fsl-manual-final-10 27/27025ACF Food Security and Livelihoods Assessment Guideline
The distinction between the different severity levels should be made very carefully through a
thorough food security & livelihoods assessment. The indicators given above are general and should
be applied according to each given context. The simple fact that one indicator is present in the
famine column does not necessary indicate a famine, it is rather the combination of indicators that
show the severity of the situation.
The exact type of response to be adopted can be defined only through detailed analysis of the
context in which the program will operate, using participatory approaches and respecting the
methods outlined in the following chapters.
Refer to the Integrated Phase Classification (IPC) reference table which shows quantitative
reference outcomes for each stage of an emergency.
FOODINSECURITY
FOOD & LIVELIHOODCRISIS
FAMINE
Mortality rate Normal Increased or high Extremely high
Global malnutrition rate Could be increased Increased Extremely high
Severemalnutrition rate
Low Moderate or high High
Population movements Temporary migrationPopulationdisplacement +/-
Concentrated,large-scale
Income andlivelihood sources
Normal or slightlydisrupted
Reduced Exhausted
Livelihood assetsStressed andunsustainable utilisation
Accelerated and criticaldepletion or loss of
access
Effective completeloss; collapse
Coping strategies Adaptive, temporary,reversible
Distress, reversible/ irreversible, increasing
Survival, irreversible
Food availabilityNormal or slightlyincreased
Reduced Rare or none
Food accessibility Slightly reduced ReducedSeverely reduced ornone
Dietary diversity Chronic deficit Acute deficitRegularly 3 or fewermain food groupsconsumed
Dependence onfood aid
Low High or moderate Complete
Reduction incaring practices
Low Moderate or high High
Water accessand availability
Borderline adequate;unstable
Accessed via assetstripping
Extremely low, humanusage only
Public health Stable Epidemic, increasing Pandemic
Severity offood insecurity& mortalityrisk
Table 1: Severity scale of food & livelihood insecurity

8/9/2019 ACF FSL Manual Final 10
http://slidepdf.com/reader/full/acf-fsl-manual-final-10 28/27026 ACF Food Security and Livelihoods Assessment Guideline
1.6 COMMUNITY PARTICIPATION
Participation of the community and local institutions is the process of actively involving local people in
assessing their own needs, designing and implementing relief projects, and making decisions that
affect them. It is vital at all stages of assessment and planning and is included as a SPHERE standard.
There have been an increasing number of analyses of development projects showing thatparticipation is one of the critical components of success in irrigation, livestock, health, water,
sanitation and agriculture. They show that success comes about when people’s ideas and knowledge
are valued, and power is given to them to make decisions independently of external agencies.
Community participation in humanitarian response is equally as important. Although emergency
responses have tended to be more standardized than development projects, the trend is towards a
greater range of humanitarian interventions that take into consideration community priorities and
are tailored to the particular local context. In addition there is increased reliance on a variety of
participatory tools and methods.
Populations affected by crisis and insecurity should be considered partners in any relief effort rather
than as its passive recipients. Communities that have experienced recurrent natural disasters orconflict may have their own local emergency response systems, networks and contingency plans.
It is important that such local capacities be supported.
Begin to consult and involve communities as soon as you start a project. A range of participatory
tools to allow for meaningful consultation with communities at the assessment stage are presented
in these guidelines. We also encourage you to include a section in the needs assessment on local
capacities and resources using a stakeholder engagement approach.
When time comes to design a project, you can use this information to organize multi-stakeholder
workshops and other types of local consultation to ensure that proposed projects are designed in
ways that meet local priorities and respond appropriately to existing needs, while drawing on
available local resources. Programs designed in a participatory manner have a much better chance
of effectively and sustainably responding to needs because they have local support.
Participation leads to a deeper understanding of local vulnerability : when local communities andorganizations are consulted and their views considered, we aim to create a more open space forthe sharing of information. This often will allow aid workers to gather more relevant and timelyinformation about the vulnerability context.
Participation leads to appropriate vulnerability targeting: local communities are in the bestposition to identify their own needs as well as recognize their most vulnerable members.Working with communities through partnership and consultation leads to more appropriate
targeting and effective reduction of vulnerability.Participation empowers communities: when local communities are consulted and included ateach stage of a project, space is created for dignity, empowerment and the expression of voice.Community consultation and participation also helps encourage local ownership of a project andthe more judicious use of its resources.
Participation leads to sustainable recovery : when local communities are consulted and their views
considered in needs assessment and project design, they have greater control and ownership of
the process, which encourages sustainability. The withdrawal of aid agencies will cause less harm
as communities will be in a position of greater control.

8/9/2019 ACF FSL Manual Final 10
http://slidepdf.com/reader/full/acf-fsl-manual-final-10 29/270
Chapter 2GATHERING INFORMATION
ACF Food Security and Livelihoods Assessment Guideline
22.1 Objectives 28
2.2 Types of assessments 29
2.2.1 Rapid assessments 30
2.2.2 Comprehensive FSL assessments 32
2.3 Information required in a FSL assessment 34
2.4 Data collection methods 36
2.4.1 Triangulation 362.4.2 Secondary data review 36
2.4.3 Primary Data Collection 37
2.4.4 Participatory and Rapid Appraisal 38
© A
C F - U g a n d a ,
c o u r t e s y P . F o l e y
27

8/9/2019 ACF FSL Manual Final 10
http://slidepdf.com/reader/full/acf-fsl-manual-final-10 30/27028 ACF Food Security and Livelihoods Assessment Guideline
The key to conducting a successful FSL assessment is to take time before beginning an
assessment to formulate objectives, determine the information needed for decision-making and the
most appropriate information sources and data collection methods. Even if time is limited, initial
investment in the planning stage will ultimately save time later and provide the most useful information.
While having a well thought out initial plan is essential, it is also important to be flexible enough
during the data collection process to pursue alternative pathways or follow-up on unexpected
information. The FSL assessment is a dynamic process where information collected early in the
process will help shape some of the questions that are asked and the data that is collected later.
However, at each step be sure to ask what the alternative pursuit will provide and how the
additional information collected will be used to guide decision-making. Often the wealth of
interesting information can be exciting and distracting. Referring back to the objectives of the
FSL assessment will help keep the data collection on track. This chapter serves as a guide to the
different types of assessments and their respective objectives, the types of information collected in
FSL assessments and information gathering methods.
2.1 OBJECTIVES
ACF approaches to food security and livelihoods assessments focus on identifying the mainunderlying causes of food insecurity and risks to livelihoods across a range of settings to identify
responses that will save lives and preserve and reinforce the livelihoods of vulnerable populations.
Broad objectives of ACF food security and livelihoods assessments are outlined in the Box below.
Specific objectives of an assessment will vary according to context, scope and available resources
and will also differ according to the type of assessment that is being carried out.
Generally ACF adopts an integrated approach to FSL assessments that can be applied in a range
of settings, sharing aspects with SCUK’s food economy approach and OxfamGB’s livelihoods
approach (which rely on methods derived from the Livelihoods approach), WFP’s VAM approach
(which highlights food consumption as a key indicator of food vulnerability) and drawing from the
tradition of applied research and Participatory Rapid Appraisal methods. The strength of the ACF approach is often recognized as rapid qualitative analysis of crisis situations relying on
BROAD OBJECTIVES OF AN ASSESSMENT:
• To ident i fy hazards and vulnerabi l i t ies as part of preparedness act iv i t ies and
contingency planning
• To assess changes in food availability and food access as a result of a shock or a
protracted series of shocks
• To analyze the underlying causes of food insecurity and threats to livelihoods in the
surveyed area
• To identify the main geographic areas and livelihood groups that are vulnerable to food
insecurity in the surveyed area
• To define vulnerability criteria that will allow these groups to be distinguished during the course
of an intervention
• To assess local priorities surrounding needs and identify local capacities and resources to
meet needs
• To recommend an appropriate response to address food security in the short to medium term
and/or support and protect livelihoods in the long term

8/9/2019 ACF FSL Manual Final 10
http://slidepdf.com/reader/full/acf-fsl-manual-final-10 31/27029ACF Food Security and Livelihoods Assessment Guideline
participatory methods and tools. See Table below for a summary matrix of FSL assessment
approaches used by different agencies in the field.
2.2 TYPES OF ASSESSMENTS
We generally recognize two different types of FSL assessments, both of which draw from the
conceptual frameworks presented earlier: rapid assessments (including the rapid appraisal) and
comprehensive or in-depth assessments.4
Source: Jaspers and Shoham, 2002. ODI. A Critical Review of Approaches to Assessing and
Monitoring Livelihoods in Situations of Chronic Conflict and Political Instability
Approach ObjectivesElements of
livelihoods Application
CARE livelihoodsecurity
To provide a multi-dimensional view oflivelihoods to identify vulnerable house-holds, and people's goals to identifyprogramming priorities
AllMostlydevelopment,stable situations
OxfamGBlivelihoodsapproach tofood security
To determine the severity of foodinsecurity in terms of risks to livesand livelihoods, and to identifyappropriate interventions
Food Security
Mainly naturaldisastersDisplaced politicalemergencies
SCUK household
economy
To estimate the impact of a 'shock' on
the ability of a household to acquire foodand non-food items
Food security,
income andexpenditure
Natural disasters
RefugeesConflict
ICRC economicsecurity
To determine the risk of decapitalisationand to intervene to prevent this
Resources,assets, strategies,obligatoryexpenditure
Conflict
MSF-H foodsecurity
To determine the stage of food insecurityand appropriate food and healthinterventions
Food security andaccess to healthcare
Conflict, butlimited applicationsbecause newlydevelopedapproach
WFP VAM
To provide a detailed understandingof food insecurity and vulnerabilityconditions and thus support programmedesign, particularly regarding food aidtargeting and priority groups
Food security
Mostly
development,but also includesmonitoring indisaster-proneareas
USAID FEWS
To manage threats to food securitythrough provision of timely andanalytical early warning andvulnerability information
Food security Natural disasters
Appliedanthropologicalresearch
To improve knowledge of social and
cultural dynamics to inform interventions
All, but oftenwith particularemphasis onspecific aspects,e.g. social capital,local institutions,governance, etc.
Mostly stablecontexts
Development
Table 2: Matrix of agency approaches to FSL assessments
4 In addition, an expanded multi-sectoral assessment is sometimes undertaken. This type of assessment is often erroneouslynamed “rapid”, but it is differentiated from rapid assessments by its broader range of methods (including the household survey),and its use of representative sampling techniques.

8/9/2019 ACF FSL Manual Final 10
http://slidepdf.com/reader/full/acf-fsl-manual-final-10 32/270

8/9/2019 ACF FSL Manual Final 10
http://slidepdf.com/reader/full/acf-fsl-manual-final-10 33/27031ACF Food Security and Livelihoods Assessment Guideline
The food security component of the rapid assessment:
Inquires about changes in food availability and food access following the crisis;
Assesses market function;
Assesses the severity and underlying causes of food insecurity;
Analyses coping mechanisms;
Identifies the worst affected groups and areas;
Identifies resources and capacities of communities to meet immediate needs; and
Identifies appropriate interventions to support food security
A rapid assessment may include measuring nutritional status (using MUAC).
WHEN:
• Initial situations/quick developing situations: Natural catastrophes, mass movement of
people, non-perceived situations/contexts that suddenly become perceptible
• Initial situations/slow developing situations: Drought, food crisis, starvation, war. Contexts where,for several reasons, a fast appraisal of the situation is needed
• Chronic crisis situations: Sudden shock or deterioration in conditions
• Special situations: Contexts with restricted access to the field or to people, for short periods of time
(days/hours) for several reasons. Newly accessible areas previously inaccessible due to insecurity,
weather conditions or other logistical constraints
The main tools used for data collection are qualitative: secondary data review, semi-structured
interviews with key informants, focus group discussions and observation. Market appraisal
is also often included. Sampling is purposive. Methods and associated tools used in Rapid
Assessments are described in detail further in this chapter.
THE TYPICAL OBJECTIVES OF A RAPID ASSESSMENT ARE:• To learn about the general and specific situation of an area or context
• To appraise the humanitarian situation of the area or context under evaluation
• To estimate the size of a disaster/emergency
• To identify the population affected or under risk (kind of population, number, characteristics)
• To define vulnerability criteria that will allow these groups to be distinguished during the course
of an intervention
• To evaluate the local response capacity to face the situation
• To obtain reliable information whose analysis will contribute to the definition of appropriate
responses to the emergency situation

8/9/2019 ACF FSL Manual Final 10
http://slidepdf.com/reader/full/acf-fsl-manual-final-10 34/27032 ACF Food Security and Livelihoods Assessment Guideline
See Appendix 5 for the ACF Rapid Assessment Kit and a Guideline to Rapid Assessments,
including sample objectives, methods and interview questions.
2.2.2 COMPREHENSIVE FSL ASSESSMENTS
A COMPREHENSIVE FOOD SECURITY AND LIVELIHOOD (FSL) ASSESSMENT is an in-depth
analysis of the food security and livelihoods situation in a given area that is conducted to support
longer term programming decisions. An in-depth assessment uses both qualitative and quantitative
methods to comprehensively investigate the factors underpinning food security, analyze livelihood
groups and assets, examine vulnerability and credibly orient program strategies for livelihood
support over the mid to long term.
Due to the considerable investment of time and resources that is required for proper
implementation, in-depth assessments are carried out at strategic points in the project cycle
(see Figure below).
§ They play a primary role in orienting program strategies when an agency enters a new area and
requires a comprehensive baseline of the situation.
§ They are also important at transition points in the relief and recovery effort to chart changes in
the evolving food security and livelihood situation and recommend new orientations.
§Globally, the analysis developed in these assessments supports proposal-writing and projectdesign and provides arguments that can be presented to donors for funding a particular
intervention.
TIMEFRAME FOR A RAPID ASSESSMENT
Rapid assessments can take from 3 to 15 days. Length of the assessment is determined largely
by the context – such as physical accessibility and security constraints – the objectives and
scope of the assessment, as well as the time and budgetary resources available to the agency.
EXAMPLES:
§ One experienced technical officer is deployed immediately after an emergency, enters the
area, on her own, and gathers basic information using secondary data review, observation
and key informant interviews in the space of just 5 days.
§ An established M&E team with training in both nutrition and food security & livelihoods deploys
into a geographic zone adjacent to where ACF is currently working. There is information of an
emerging food security problem in the new area that is linked to the access and availability of
the staple food crop. The team will analyze the causes of household food security and
conduct a MUAC screening using a combination of key informants, focus groups and
nutrition methods over the course of 2 weeks.
THE TYPICAL OBJECTIVES OF A COMPREHENSIVE FSL ASSESSMENT ARE:
• To conduct an in-depth analysis into the causes of food insecurity
• To carry out a vulnerability analysis that includes the identification of seasonal and longer term
risks linked to the environment and the creation of a vulnerability profile
• To engage local stakeholders on the identification of local vulnerabilities, capacities
and priorities
• To identify appropriate interventions and associated target groups that will address food
insecurity and support livelihoods in the longer term

8/9/2019 ACF FSL Manual Final 10
http://slidepdf.com/reader/full/acf-fsl-manual-final-10 35/27033ACF Food Security and Livelihoods Assessment Guideline
Methodological approaches to comprehensive FSL assessments are more rigorous than in rapid
assessments and must be carefully crafted according to the objectives of the survey, the tools to be
used and the form of analysis. A range of quantitative, qualitative and participatory methods are
used that allow for triangulation of data, correlation of findings and statistical analysis (if needed).
Particular attention must be paid to sampling approaches and tool development and testing.
Household questionnaires are the cornerstone of the comprehensive FSL assessment,
augmented by a range of participatory approaches and key informant interviews and focus group
discussions. Methods are detailed in section 2.3.
PROGRAMMING
EVALUATION
FORMULATIONIMPLEMENTATION
FINANCING
FOLLOW-UP
MONITORING
IDENTIFICATION OF
NEEDS
TIMEFRAME FOR A COMPREHENSIVE FSL ASSESSMENT
Comprehensive FSL assessments vary from 21 to 60 days – or more. Time investment is much
more considerable due to the expanded scope and more involved methodologies of survey work.It varies according to context, scope and available resources. Recruiting / training enumerators
and developing / testing field tools can take upwards of 30 days. Field implementation can take
15 to 30 days, followed by often time-intensive data entry and analysis.
EXAMPLES:
§With the objective of investigating the food security situation in a zone where conflict has
displaced hundreds of thousands in recent weeks, a team of 10 enumerators plans
to conduct 421 household interviews, 45 interviews with traders and 11 focus group
discussions with displaced persons in 4 camps and residents across 5 municipalities. Due to
efficient planning, fieldwork is completed in 12 days, and data entry and report writing
requires a further 20 days.
(continued on page 34)
Figure 5: Assessments in the Project Cycle

8/9/2019 ACF FSL Manual Final 10
http://slidepdf.com/reader/full/acf-fsl-manual-final-10 36/27034 ACF Food Security and Livelihoods Assessment Guideline
2.3 INFORMATION REQUIRED IN A FSL ASSESSMENT
Specific indicators are used to assess food availability, food access and food utilisation – the three
pillars of food security – as well as livelihoods assets and strategies, the vulnerability context and
institutional and policy environment – the basic elements of the Livelihoods Analytic Framework.
Different types of indicators each contribute different information about the overall food and
livelihood security picture. A single indicator or several indicators of a single type (e.g. food
availability) is akin to having only one piece of the puzzle. At best one has only a partial picture. For
example, knowing that there is plenty of food available says little about food accessibility or
utilisation. The more pieces of the puzzles that are put together the more clearly one can identify thecomplete picture.
Essential indicators to be included in all food security and livelihoods assessment are listed in the
table below; a more complete version of this matrix can also be found in Appendix 1. This core set
of indicators is considered to represent the minimum package to be applied across all contexts
and assessment types without which the basic FSL analysis will be incomplete. Meanwhile
methods for gathering information on each indicator will vary according to the context, assessment
timeframe and depth of analysis that is required. A much larger dynamic range of indicators exists
for assessing the many dimensions of a population’s food insecurity and risks to livelihoods.
A number of these are described in the pages of this book and should be incorporated into
assessment design as complements to the core set whenever they are found to be useful and relevant.
(continued from page 33)
§ A combined MUAC and comprehensive FSL assessment is planned in a remote region
characterized by violent separatist activity and highly dispersed tribal villages. 3 enumerators
and 1 officer require 30 days for secondary data collection followed by 90 days of fieldwork
to visit 27 villages across 6 sub-districts, conducting 320 household interviews and 40 focus
group discussions and measuring 946 children.

8/9/2019 ACF FSL Manual Final 10
http://slidepdf.com/reader/full/acf-fsl-manual-final-10 37/27035ACF Food Security and Livelihoods Assessment Guideline
A brief description of the most common food availability, access, utilisation and livelihoods
indicators follows.
Food availability indicators
Food production, reserves, stocks, imports and exports along with resources necessary for
production, such as field and pasture conditions, and opportunities for gathering wild foods
provide information about the quantity and quality of the food supply. The existence of well
functioning market systems from the international to the local level also influences the food
supply and therefore food availability. Food availability indicators are useful for assessing
population level food security status.
Food access indicators
Potential and actual income, expenditures, loan and remittance mechanisms as well as trade
and market systems provide information about the way food is obtained. Market factors, the
price of food and purchasing power related to employment and livelihood opportunities
influence the ability to obtain food. In addition, coping strategies can be an important mechanism
to meet food needs. Food access indicators are useful for assessing household or individual
level food security status.
(continued on page 36)
Indicator Description
1. Institutional and policy environmentSocio-political context, past crises andconflict, ethnicity, social organization
2. Vulnerability context Climate; geography; physical infrastructure;hazards
3. Livelihood assets Access to capitals; land tenure, fishery andpasture access arrangements
4. Food stocksSufficiency and diversity of food productsin markets and households
5. Food importsOrigin, diversity and availability of food inmarkets
6. Market pricesPrices of staple food and basiccommodities; variation and trends
7. Food sourcesDiversity and seasonality of food sources;
changes
8. Income sourcesDiversity and seasonality of incomesources; labour migration; debt; changes
9. Coping strategiesRange of food consumption strategies(adaptive, coping, crisis, survival)
10. Dietary diversityDiversity of foods consumed over a 24hour period; meal frequency
11. Malnutrition prevalenceGAM/SAM rates, MUAC screenings, aggra-vating factors and contextual elements
12. Water access & availability Sources, quality, quantity and cost of water
13. Public healthIncidence and severity of outbreaks;changes in access to health care
14. Care practicesPrevalence of and changes inbreastfeeding; food-sharing practices
LIVELIHOODS
AVAILABILITY
ACCESS
UTILIZATION
Table 3: Core food security and livelihoods indicators

8/9/2019 ACF FSL Manual Final 10
http://slidepdf.com/reader/full/acf-fsl-manual-final-10 38/27036 ACF Food Security and Livelihoods Assessment Guideline
See Appendix 1 for a summary table of the core food security and livelihoods indicators to be
included in all FSL assessments.
2.4 DATA COLLECTION METHODS
Various methods are used to gather information during an FSL assessment on food availability,
access, utilisation and livelihood indicators that help answer the questions who, what, when, where
and how. There are also many different sources of information from documents to specific
community and household members that have important perspectives to help guide
decision-making. While each information source provides useful information in its own right,
examining the data from many sources is essential to gain an accurate sense of the overall picture.
2.4.1 TRIANGULATION
Triangulation is a method to verify the accuracy of FSL assessment data and reduce bias bycross-checking the information gathered. Triangulation is done by using different data collection
methods and obtaining the same or similar information from different sources. Often triangulation
also involves different staff members to collect information on the same FSL component. Food
access, food utilisation, beliefs and attitudes and other aspects of FSL assessments are difficult to
measure and quantify. Much of the information gathered in an FSL assessment is based on
observations, opinions and perspectives - subjective data which are all prone to bias. The
interpretation of the information and results is also somewhat subjective. The quality and
interpretation of the information gathered improves over time with the continuous process of cross-
checking. Incorporating triangulation throughout the FSL assessment process ensures a more
accurate and complete FSL assessment. (See Appendix 6 for specific guidelines on triangulation).
2.4.2 SECONDARY DATA REVIEW
Secondary data is data that has been collected by ACF or another organization for previous
assessments or other purposes. Often a wealth of secondary data exists at the country, regional or
local level. Before starting an FSL assessment, identify relevant data that has already been
collected by examining existing reports and speaking with key representatives that may have or
know of relevant information.
Sources of secondary data include government documents, public health reports on mortality,
morbidity, nutritional status and health services and NGO, consulting groups or university reports.
When assessing the relevance of secondary data to the current FSL assessment, important
questions to ask are: When was the data collected? What may have changed (e.g., natural disasters,
increased political strife, migration) between when the data was collected and current conditions?
(continued from page 35)
Food utilisation indicators
Food consumption, sanitation conditions, and nutritional status, morbidity and mortality provide
information about the use of food within the household. Behaviours such as intra-household
food distribution, infant and young child feeding practices, food storage and preparation
provide information about food utilisation. Food utilisation indicators are useful for assessinghousehold or individual level food security status.
Livelihood indicators
Household assets, sources of income and livelihoods, diversification of income and livelihoods,
expenditure and expenditure ratios provide information about livelihoods. Livelihood indicators
often provide information about food access and are closely linked to coping strategies.

8/9/2019 ACF FSL Manual Final 10
http://slidepdf.com/reader/full/acf-fsl-manual-final-10 39/27037ACF Food Security and Livelihoods Assessment Guideline
Who collected the data? How was the data collected? For what purposes was the data collected?
How is the original purpose for the data collection similar or different from the FSL assessment
objectives? The questions listed above will help determine how to integrate secondary data into the
FSL assessment. Even if the secondary data does not measure the exact FSL component or region
of interest, secondary data can provide invaluable contextual information that would be too
expensive and time consuming to collect during an FSL assessment.
See Appendix 7 for specific guidelines on secondary data collection.
2.4.3 PRIMARY DATA COLLECTION
Primary data is data that is collected for the purposes of the current FSL assessment and is
typically collected by ACF staff. However, primary data may be collected in conjunction with or by
other organizations when the raw data and results are shared directly with ACF staff. Primary data
collection methods commonly used in an FSL assessment are listed below.
Key Informant interviews
Key informant interviews are semi-structured interviews of key informants, people that haveknowledge on an important aspect of the FSL assessment. A key informant is often chosen
based on his or her position, experience or responsibilities and can provide information about
local facts, attitudes and beliefs. Different key informants may have unique perspectives on the
current situation. Being flexible enough to follow-up on unexpected information during or after
an interview may lead to additional important insights. (See Appendix 8 for guidelines on key
informant interviews).
Focus group discussions
Focus groups are small group discussions led by a facilitator who guides the group through a
series of questions on a specific topic or series of related topics. Focus group participants are
encouraged to interact with each other expressing opinions, relating similarities and differences
in experiences and perspectives. The group dynamic encourages participants to respond to one
another and generate new ideas or highlight conflicting attitudes that may be missed in a
one-on-one interview. Focus group discussions are an effective way to understand the local
conception of community and household food security. Focus group participants are selected
based on specific characteristics (e.g., gender, age, job, position). Sometimes focus groups will
benefit most from similar characteristics (e.g. all women, the same age, caste or religious group)
while others from diversity (e.g. different ages with both mother- and daughter -in-laws). Cultural
and social norms as well as topics are also important to consider when creating a focus group.
(See Appendix 9 for guidelines on focus group discussions).
Household Questionnaires
Household questionnaires are used to gather detailed and quantitative information on a specifictopic (e.g., food consumption, diet diversity, coping strategies) or a series of related topics about
intra-household functioning or the functioning of individual households as a part of the larger
community. Trained interviewers administer a structured questionnaire to relevant household
members in a standardized way, with no deviation from the original questions. The desired
information determines the relevant household member(s) (e.g., head of household, women with
children, all women) to interview. Results are analyzed both statistically and qualitatively.
Information from household questionnaires is often analyzed by livelihood group, zone or
access group. (See Appendix 10 for specific guidelines on household questionnaires).

8/9/2019 ACF FSL Manual Final 10
http://slidepdf.com/reader/full/acf-fsl-manual-final-10 40/27038 ACF Food Security and Livelihoods Assessment Guideline
2.4.4 PARTICIPATORY AND RAPID APPRAISAL
Participatory and rapid appraisal (PRA) methods are a critical component of FSL assessments and
offer rich qualitative data about the environmental and social context. The primary comparison of
PRA data is relative in nature, that is how one area, set of community members, or villages compare
relatively (not absolutely) to each other. PRA methods are often used together or in a specific
sequence to fill out the context more fully. PRA methods can be used at the community level inspecific or general groups or the household level to gain information on intra-household functioning.
Some PRA methods useful for FSL assessments are listed below. (See Appendix 11 for specific
guidelines on developing and implementing the PRA methods listed below).
Transect walk encourages the assessment team to explore an entire area (e.g., a village, farm
or market). For example a walk through a village may specifically seek out areas of interest such
as agricultural areas, water sources, schools, health centres or hospitals, markets, marginalized
dwellings, and abandoned areas. Transect walks include moving along the periphery, walking
through the area in zigzags, concentric circles or curves, talking to people along the way,
inviting some people to join the walk, asking questions, looking and listening carefully and
recording observations.
Direct observation offers valuable insights into the environmental and social context of an area
and is particularly useful to gather additional and sensitive information without specifically
asking the affected people. The condition of crops, livestock, local surroundings, dwellings,
living conditions and interactions between people are some of the information to be collected
during a direct observation. Direct observation is an integral component of transect walks and
other PRA methods.
Mapping is used to identify specific characteristics in a defined geographical area such as
climate, agroecological zones, livelihood zones, trade linkages, location of markets, etc and to
represent them spatially. At the micro level, it is often used to identify community characteristics
within specific areas and to provide quantitative information where various groups in the
community are located. Community members plot out specific aspects of the community bydrawing a circle to represent the village and drawing specific areas within the circle to represent
the characteristic of interest. Mapping can also be used to identify market or institutional
characteristics.
Seasonal Calendars are used to obtain information on traditional planning activities within the
community and help to understand seasonal changes in food security within the cycle of one
year. Calendars and diagrams identify times of the year during which specific activities (e.g.,
agricultural like sowing, harvesting, economic, or social) are done. Seasonal fluctuations in
farming, hunting, fishing and gathering wild foods help identify time periods (when and for how
long) of higher and lower food availability, and types and time periods for substitutions and
coping strategies. Community members list all the activities that happen in a year then list
the corresponding month(s) or time periods various tasks are achieved during the year. Theinformation is recorded in a calendar or diagram format. Activity Profiles are used to gather
information on time requirements for specific household and community activities and are
often linked to seasonal calendars (e.g., livelihood activities, food procurement, household
responsibilities, infant and young child caring practices, community dynamics, gender
differences). Activity profiles can also provide information on how activities change throughout
the year or given a specific shock.
Venn Diagrams can be used in institutional analysis to provide an idea of the strength of the
relationship between two entities based on the size of the circle and distance from the centre.
Venn diagrams can also show interconnections and membership overlap.
(continued on page 39

8/9/2019 ACF FSL Manual Final 10
http://slidepdf.com/reader/full/acf-fsl-manual-final-10 41/270
(continued from page 38)
Proportional Piling is used to assess the relative importance of an item or activity. Proportional
piling can also be used to assess changes in FSL assessment components such as changes in
food or income sources due to seasonality or a specific shock. The relative importance can be
graphically illustrated through pie charts or putting objects like stones into specific classifications
and provides answers in percentages.
Ranking is used to assess preferences (e.g., for foods, tools, or markets) or to provide
information on relative physical, psychological or social conditions. Ranking helps identify
priority needs within a community. Community members are asked to rate answers in order of
importance. Different types of ranking used in FSL assessments are pair wise ranking, needs
ranking and matrix ranking.
Capacity and Vulnerability Analysis is used to assess local perspectives of community
capacities and vulnerabilities and to outline local priorities in addressing vulnerabilities.
Community members discuss various aspects of livelihoods, ask participants about their
capacities (what they have) and vulnerabilities (what they lack or puts strain on capacities) in
terms of both skills and resources (e.g., people, time, equipments, inputs).
39ACF Food Security and Livelihoods Assessment Guideline
Approaches, methods and tools used in food security & livelihoods assessments are summarized in
the Table below according to the broad context in which they are most usefully applied and the type
of analysis to which they can contribute. Specific tools mentioned here are described in detail in the
following chapters.

8/9/2019 ACF FSL Manual Final 10
http://slidepdf.com/reader/full/acf-fsl-manual-final-10 42/27040 ACF Food Security and Livelihoods Assessment Guideline
Approaches,
methods and toolsParticularly useful for
Context where
applicable
1Nutrition Causal Analysis (NCA)
Underlying causes of malnutritionEmergency levels ofGAM/SAM
2Livelihood zoningand profiling
Vulnerability context, assets, strategies,comparisons between social groups
Acute, chronicand recovery
3Key informantinterview
Institutional and policy environment, vulnerabilitycontext, livelihood strategies, market analysis, rapidassessments, triangulation
Acute, chronicand recovery
4Focus groupdiscussion
Vulnerability context, assets, strategies, outcomes,triangulation
Acute, chronicand recovery
5Householdquestionnaire
Assets, strategies, outcomes, triangulation Chronic and recovery
6 Seasonal calendar Vulnerability context, assets, strategies Acute, chronicand recovery
7 Transect walk Quality and quantity of natural capital Acute, chronicand recovery
8 Hazard mapping Vulnerability context Acute, chronicand recovery
9 Resource mapping Existence of shared natural capital Chronic and recovery
10 Social mapping Access to services and infrastructure Chronic and recovery
11 Timelines Vulnerability context, policy change Chronic and recovery
12 Wealth rankingStrategies and assets needed to exit from poverty,relations between social groups
Chronic and recovery
13 Venn diagramSocial capital, social networks, institutionaland policy environment
Chronic and recovery
14 Pairwise ranking Livelihood strategies, assets, hazards Chronic and recovery
15 Proportional pilingLivelihood strategies, assets, sources of food andincome, patterns of expenditure, uses of householdproduction
Chronic and recovery
16 Vulnerability matrixe.g. VCA, SWOT
Vulnerability context, impact of hazards on assetsand social groups
Chronic and recovery
17Emergency MarketMapping and Analysis (EMMA)
Access to markets, outcomes related to food accessand availability
Acute
18 Market mapping Access to markets, outcomes related to food accessand availability
Acute, chronicand recovery
19 Terms of trade Access to markets, outcomes related to food access Acute, chronic
and recovery
20Mid Upper ArmCircumference(MUAC)
Outcomes related to nutrition status Acute, chronicand recovery
21Coping StrategiesIndex (CSI)
Strategies employed in response to food shortage,outcomes related to food access
Acute, chronicand recovery
22Household DietaryDiversity Score(HDDS)
Outcomes related to food access and utilisation Acute, chronicand recovery
23Individual DietaryDiversity Score(IDDS)
Outcomes related to food access and utilisation Chronic and recovery
24Food Consumption
Score (FCS)
Outcomes related to food access and utilisation Chronic and recovery
25 Decision TreeRelation between assessment findings andappropriate responses
Acute, chronicand recovery
Table 4: Summary tools matrix

8/9/2019 ACF FSL Manual Final 10
http://slidepdf.com/reader/full/acf-fsl-manual-final-10 43/270ACF Food Security and Livelihoods Assessment Guideline
Chapter 3SAMPLING
33.1 Steps to planning the assessment 42
3.1.1 Preliminary Data Collection 42
3.1.2 Preparation 44
3.1.3 Field Implementation 46
3.1.4 Data entry and interpretation 47
3.1.5 Synthesis of findings 48
3.2 Introduction to sampling 483.3 Sampling methods 50
3.3.1 Non-Probability Sampling 50
3.3.2 Probability Sampling 51
3.4 Determining sample size 55
3.5 Bias considerations 55
© A
C F - S o u t h e r n S u d a n ,
c o u r t e s y J .
S e a g l e / C o u n t e r p a r t I m a g e s
41

8/9/2019 ACF FSL Manual Final 10
http://slidepdf.com/reader/full/acf-fsl-manual-final-10 44/27042 ACF Food Security and Livelihoods Assessment Guideline
3.1 STEPS TO PLANNING THE ASSESSMENT
Often both the time and human resources needed to undertake assessments in the field is
underestimated. Depending on the context, certain processes which seem easy at first later prove
exceedingly difficult, and unexpected surprises arise.
When the assessment timeline and process is poorly communicated or budgets are poorlyconstructed, enumerator expectations regarding time commitments, pay and travel can lead to
conflict and even loss of the survey team. If offices do not have the capacity to internally translate
documents into the necessary local languages, advance preparation of tools may be necessary.
Both attention to detail and flexibility is essential.
The planning process takes time and is not always linear, and more often than not, circular. All
tasks should be started as soon as possible. Many of the steps will be undertaken concurrently and
continuously throughout the assessment with the completion of one task sometimes requiring
adaptation of other. For example, the resources available in terms of time, team members and money
may impact the assessment scope, objectives and timeline.
Aside from developing the tools and methodology for the FSL assessment, close attention shouldbe paid to planning and carrying out the assessment at all stages in order to best ensure
successful collection of data and use of resources. The five fundamental steps to planning and
carrying out an assessment are shown in the below. Guidelines for these steps are covered below
and throughout the following chapters.
Refer to Appendix 12 for a checklist of steps in assessment planning and Appendix 15-16 for a
sample daily activity plan and sample protocol on the supervision of team leaders.
3.1.1 PRELIMINARY DATA COLLECTION
1. Gather and Review Secondary Data & Contextual Information
From outset and ongoing throughout assessment
• The assessment team should complete a thorough search and review of secondary data by
searching the internet, asking local and international agencies on the ground for all available
information, and contacting experts with special knowledge of the context and population.
1. Preliminarydata collection
Context analysis
Gap analysis of
humanitarian actors
Stakeholder mapping
+ engagement
Livelihoods zoning
2. Preparation
Formulation of
objectives
Selection of
sampling method
Team recruitment
+ training
Tool selection
+ development
3. Fieldwork
Market survey
Household food
access + utilization
Coping strategies
Vulnerability and
capacity mapping
Hazard mapping
4. Data entry andinterpretation
Daily debrief sessions
Analytical workshops
Data ordering,
cleaning + entry
Data tabulation
5. Synthesisof findings
Causal study of
malnutrition
Severity analysis for
food + LH insecurity
Vulnerability ranking
Scale analysis
Sharing findings with
affected communities
Identification of
appropriate responses
Reporting +
dissemination
Figure 6: Stages of the Assessment Process

8/9/2019 ACF FSL Manual Final 10
http://slidepdf.com/reader/full/acf-fsl-manual-final-10 45/27043ACF Food Security and Livelihoods Assessment Guideline
• Collection of secondary data is one of the first steps in the process as it is necessary
to support all stages of the assessment, from defining objectives, to sampling, to writing the
report. This process will reveal what information is currently available and where there are gaps,
as well as help define the population of concern and focus the objectives of the assessment.
Information reliability should be considered as well.
• Important sources of secondary data include: all nutrition and food security surveys specific to the
region and country; historical, anthropological and political analysis of the population and region;
all up-to-date information on the current crisis including rapid assessment reports, media reports,
UN security reports and updates from UNOCHA.
See Appendix 7 for further guidance on secondary data collection and review
2. Conduct Gap Analysis of Humanitarian Actors
From outset in conjunction with stakeholder consultation and
ongoing throughout assessment
• Knowing the scale of humanitarian aid deployed in the affected area is necessary to anticipate
gaps in coverage and guides the choice about where to conduct the assessment.
• Information about who is working where and doing what should be gathered by carrying
out an informal census of aid organizations working in the affected areas. Other sources of
information include the local OCHA office, agencies such as FAO and UNICEF, coordination and
cluster meetings, ministry meetings, and websites that centralize resources on humanitarian crises
such as Relief Web.
3. Identify Local Partners and Engage Stakeholders
From the outset and throughout the assessment and report circulation
• Stakeholder mapping and analysis by sector is usually conducted as part of agency
preparedness activities. Building agency knowledge and memory in terms of relationshipsand understanding the ‘lay of the land’ will save time when the need arises to conduct
an assessment.
• Local, national and international stakeholders, in civil society, academic, government and
non-governmental institutions should be engaged at all stages of the assessment, from defining
the objectives, to conducting the assessment and in the dissemination of and advocacy around as-
sessment findings.
• Working with various stakeholders necessitates negotiating competing interests, agendas and mis-
sions. Participation of stakeholders should be achieved by integrating their various concerns while
maintaining the focus of the assessment stated in the objectives and ToR. Engaging these actorsboth within and across sectors can enhance the resources available for the assessment and in-
crease buy-in to the assessment results so that comprehensive action can be taken.
See Appendix 11 for further guidance on Stakeholder Mapping
4. Prepare a Preliminary Zoning
From outset in conjunction with secondary data review
• Secondary data review and consultation with stakeholders should provide information
on differences in geography, agroecology and types of livelihoods present in the region
to be surveyed.

8/9/2019 ACF FSL Manual Final 10
http://slidepdf.com/reader/full/acf-fsl-manual-final-10 46/27044 ACF Food Security and Livelihoods Assessment Guideline
• Livelihood zoning may already have been undertaken by other agencies or ACF itself as part of
preparedness activities in the region, especially if there are regularly recurring disasters or
chronic conflict. Detailed (micro-level) information about the specific area to be surveyed may not
be available.
• An area should be zoned by livelihood or other salient criteria prior to carrying out the sampling and
cluster selection, and population data for each identified zone collected or estimated. The
results of the zoning exercise can then serve as the sampling frame for rapid assessments and
surveys intended to be representative of the local range of livelihoods.
3.1.2 PREPARATION
1. Define Objectives & ToR
From outset in conjunction with secondary data review & stakeholder consultation
• Clear objectives and terms of reference will be necessary to communicate the purpose
and necessity of the assessment to the survey team, local authorities, respondents and donors.
• When possible, objectives can be co-created and adapted through transparent consultations withstakeholders in order to increase their buy-in to the assessment process and results.
• Clearly stated objectives and ToR can serve as a ‘contract’ or guide to focus conflicting
stakeholder agendas. Staying focused on the stated objectives saves time and resources and
helps ensure data quality by limiting the data collection to meet the immediate needs of the
assessment.
2. Develop Assessment Timeline
In the initial stages of defining objectives and ToR
• Exact timing of the assessment should be coordinated with local leaders and authorities.
• Potential conflicts with timeline and daily visits should be considered including transportation issues
and road conditions, rainy season, harvest times, distribution schedules, market schedules.
• Depending on the tools and the sample size, implementation times will vary, however ample time
must be given to preparation, tool development and recruitment (2 weeks to 1 month), training of
enumerators and pilot testing (1 week), data analysis and report writing (~ 1 month).
3. Determine Resources Needed
After defining objectives and timeline in preparation for budget development
• A list of all logistical, human and material resources should be made and reviewed by a number ofteam members to prevent omissions. Common costs include: Assessment team member
pay, per-diem and lodging, training costs (space, meals, lodging), vehicles,fuel,
translation needs.
• Involvement of local stakeholders and international partners can lead to their committing
essential resources to the assessment. This can result in additional buy-in, local participation and
interest in the assessment process and results. Care should be taken so as to avoid
conflicts of interest with contributions and co-opting of assessment objectives.
• Larger FSL assessments will demand many people’s involvement including: administrators and
logisticians; enumerators, interviewers and specialists, drivers; translators for international staff,
questionnaires, training and data; team leaders and or monitors, and data encoders.

8/9/2019 ACF FSL Manual Final 10
http://slidepdf.com/reader/full/acf-fsl-manual-final-10 47/27045ACF Food Security and Livelihoods Assessment Guideline
4. Develop Budget
As soon as objectives, ToR and needs are determined
• The budget will primarily be determined by the tools and sampling methods employed which
will in turn inform the expertise needed, number of survey team members, vehicles and other equip-
ment/resources needed.
•Budgets should be exhaustive in order that lack of funding does not hold up the process. Past
NGO practices in the area should be researched to determine local team members’ expectations
regarding remuneration and per diems.
5. Sampling and Cluster Selection
• Sampling and cluster selection should be done as soon as possible as this will determine sites to
be visited which may impact the assessment needs regarding team members’ ability to travel, their
place of origin and their language capacities.
6. Develop Tools, Ensure Translation and Prepare Supplies
• Tool selection and development should be started as soon as objectives for the assessment are
defined, as the process is time-consuming yet critical to the success of the fieldwork. 2 weeks to
1 month may be required. Appropriate time should be budgeted to do justice to this process.
• Skilled facilitators and translators should be identified early on for the development of tools
that require the collection of information from local communities to develop indices and
thresholds. These facilitators will be needed prior to the launch of the fieldwork to assist in
leading focus groups and consulting key informants.
• Steps should be taken early on to ensure timely translation into local languages of all training
materials, objectives, protocols and tools/questionnaires. This includes both locating translators
and including these needs in the budget. It is standard practice to back-translate questionnairesand tools into the language they were developed in to ensure the integrity of the translation.
• Sometimes translation duties are handed off to staff already overwhelmed by their workload or
those incapable of providing technically sound translations. This may lead to translations not
reflecting what the tools are seeking to measure or a failure to receive translations in time.
• Sufficient human resources, material supplies and logistical support should be arranged well in
advance. Pay special attention to the number of vehicles needed to transport teams. Multiple team
members should cross-check supply list to ensure nothing is left out prior to budgeting.
7. Select Assessment TeamTo begin as soon as possible after determining how many team members are needed
• Local institutions, such as universities and statistics/research agencies, and civil society
organizations may be a good source for obtaining qualified team members. Youth should be
especially considered as they are often energetic, eager to learn new skills and willing to
participate.
• When selecting and composing teams it is essential to consider local culture and crisis conditions
with regards to gender and ethnic/linguistic groups. Team members should be able to speak the
local dialects. In conducting household interviews gender dynamics should be considered with
regards to using men or women as enumerators.
8/9/2019 ACF FSL Manual Final 10
http://slidepdf.com/reader/full/acf-fsl-manual-final-10 48/27046 ACF Food Security and Livelihoods Assessment Guideline
• Team members should be given the objectives, timeline and work-plan of the assessment as soon
as possible and their commitment should be ensured. If outstanding issues such as remuneration,
travel demands, sites to be visited or the timeline are left unstated until the training, some team
members may opt out, thus necessitating a last minute scramble to find & train additional people.
• The number of team members needed and team composition will be determined by the
assessment tools, timeline, budget and resources including transportation. As a general rule most
tools (including household questionnaires, focus group discussions etc) require 2 team members
to administer - one to ask questions and another to record and encode answers/notes.
8. Train Assessment Team
4-6 days just prior to the assessment (includes 2 days of field testing, see below)
• Training of the assessment team can be carried out over 4-6 days depending on the scope of the
assessment. Two days of the training includes the piloting and revision of the tools.
• Ideally the training will cover the following: an overview of the conceptual frameworks
underpinning the survey; clarifying assessment objectives and timeline; clarifying and
verifying commitments to the roles and responsibilities of survey team members (including traveland remuneration agreements as necessary); extensive discussion of the assessment tools
to ensure utmost clarity of questions and integrity of translation; training on conducting and
recording household questionnaires, focus group discussions and key informant interviews as
needed with role-plays.
• Trainings go more smoothly when held in accordance with cultural norms and past practices in the
area with regards to venues, breaks, start-stop times. Diversity of tasks between plenary sessions,
group break out sessions and activities also ensures energy among participants especially in
large groups.
9. Pilot Test Questionnaires
2 days at the end of the training
• All assessment tools and sampling procedures should be tested in the field by the assessment
teams by visiting one or two sites over a two day period at the end of the training. The field
testing will help uncover problems with specific questions, test household selection procedures and
give the teams time to practice and receive constructive criticism by the assessment leaders.
• Time should be allocated so that sampling procedures can be tested; each survey team member
has time to administer their tools being sure to leave time at the end of each day for debriefings.
• After pilot-testing, questionnaires and other tools will need to be revised and possible issues in
translation will need correcting. Be sure to wait until after pilot testing to copy questionnaires andleave time for this process.
3.1.3 FIELD IMPLEMENTATION
1. Establish Protocols & Daily Plans for Field Work, Management & Monitoring
As soon as possible in order to inform team members of their duties and obtain their
feedback and commitment
• In calculating the capacity of the teams each day, be sure to consider the time needed to travel to
the field sites taking into consideration security protocols for appropriate travel times, road
access and local customs, holidays etc (e.g. Friday Prayer in Muslim countries).

8/9/2019 ACF FSL Manual Final 10
http://slidepdf.com/reader/full/acf-fsl-manual-final-10 49/27047ACF Food Security and Livelihoods Assessment Guideline
• It is often useful to appoint a leader/supervisor for each team to ensure appropriate materials are
brought each day (copied questionnaires, pencils, maps, household lists etc) and that all
protocols are followed correctly (sampling procedures, coding of questionnaires etc).
• Supervisors should inform the appropriate local authorities before teams arrive on site as well
as also check in with teams throughout the day to ensure work is being done appropriately,
remaining vigilant that teams remain aware and engaged as the assessment progresses.
• Time should be allocated at the end of each day for teams to thoroughly check all data and
debrief from the day’s work.
• It is essential to not overwork teams. While they might be willing to work two weeks straight
without a day off this is likely to compromise the quality of their work. Establishing appropriate
start and stop times each day will also help prevent fatigue among the team members.
See Appendix 15 and 16
2. Adapt Methodology to Constraints Encountered
• Although every effort is made to anticipate logistical and security constraints on the field ahead of
time, some unknowns are certain to arise once the fieldwork is underway (e.g. rains/landslides
barring road access; sudden worsening of security context shortening the workday; unexpected
migration of clusters to seasonal pastures). Flexibility is required.
• Security of team members should remain the paramount concern at all times.
• All adaptations to the original cluster & household selection should strive to minimize bias and fol-
low the original objectives. Where methodological changes are made they should be reported
under the ‘Methods’ section of the report; size and direction of bias estimated and used to inform
interpretation of findings.
• Keep in mind that a certain amount of ‘learning’ will take place among team members over the
course of the fieldwork as they become more familiar with the assessment tools, leading to greater
efficiency and time savings.
3.1.4 DATA ENTRY AND INTERPRETATION
1. Data Entry and Management
To be done concurrently with the data collection
• The most efficient way to manage the data collected is to ensure adequate time and human
capacity for the data to be processed immediately upon returning from the day’s field work. Dataencoders and computers should be available so that quantitative data can be entered on a daily
basis so that it will be available for analysis immediately following the survey. This will also help en-
sure any recording errors or other problems which arise are caught early on in data collection.
• Any qualitative data should be reviewed and written up by team members either in the field or
the same night so that memory of the data is not lost. Translators will need to be available to
translate the qualitative data for analysis.
• Time should be allocated for both team members and supervisors to review and clean the data on
a daily basis prior to processing.

8/9/2019 ACF FSL Manual Final 10
http://slidepdf.com/reader/full/acf-fsl-manual-final-10 50/27048 ACF Food Security and Livelihoods Assessment Guideline
2. Analytical Workshop
At the end of the fieldwork
• A post-fieldwork analytical workshop involving all team members is vital for highlighting keyinformation, bringing out insights that may not have been captured on paper and supporting thedata cleaning process. Qualitative data is best interpreted via daily debrief sessions andworkshops with results tabulated wherever possible.
• Formally debriefing the team provides an opportunity to recognize individual members’contribution to the work and consider their personal analysis of the context.
3.1.5 SYNTHESIS OF FINDINGS
1. Data Analysis and Report Writing
2-4 weeks after data is processed
• After all data has been processed the final stages of analysis, interpretation and report writing canbegin. The time needed for this process varies dramatically by assessment depending on the
amount of data collected and the team involved though 2-4 weeks is often a reasonable amountof time to deliver the initial findings and a first draft of the report.
2. Sharing Findings and Identifying Responses
Following the synthesis of findings
• Preliminary findings should be shared with local stakeholders in each of the major zonesvisited to build consensus on priority needs and responses. This step is vital for formulatingrecommendations that are in line with community priorities and should be undertaken prior tofinalizing the report.
• Care must be taken not to create false expectations about the capacity of the agency to interveneunless it is certain that funding has been secured.
• Data analysis and stakeholder feedback will guide the definition of appropriate responsestaking into account local capacities and resources. Consider the broad political, economic andsecurity environment and the quality of physical infrastructure as it will determine the level ofaccess to vulnerable and marginalized groups.
• Where appropriate responses are identified that fall outside of the ACF mandate, these should beincluded in the report for dissemination and lobby with other actors.
3. Reporting and Disseminating Results
• Finally, care should be taken to disseminate final results to a variety of stakeholders so that
information is broadly shared, e.g. affected communities, local and regional authorities, otherhumanitarian actors, donors and coordination forums. Translation to the major local language mayneed to be arranged.
3.2 INTRODUCTION TO SAMPLING
In undertaking food security and livelihoods assessments, it is not possible to collect informationfrom every location or individual/household in the population concerned by the assessment, thesample population. Only in very rare cases will a survey be exhaustive and collect data from everyunit in the population. Therefore, it is necessary to select a limited number of households orindividuals, whatever the determined sampling unit may be, from whom data will be collected. Thissample is drawn from the established sampling frame, utilizing rigorous methods and awareness

8/9/2019 ACF FSL Manual Final 10
http://slidepdf.com/reader/full/acf-fsl-manual-final-10 51/27049ACF Food Security and Livelihoods Assessment Guideline
of potential bias, in order to best ensure that the assessment results will be able to be generalized
to the population as a whole.
In designing your sampling methods it is essential to consider issues of bias and work to minimize
its effect as bias drastically undermines how serious the assessment results are taken and thus acted
upon. An in depth presentation on bias is found in Appendix 13 and its consideration is absolutely
essential. The credibility of data collected in the assessment and the assessment’s capacity to
convince donors of community needs and inform program direction is ultimately dependant on
sound sampling methodology. It is essential to present a clear and detailed explanation of the
methodology in the report to ensure integrity of the results and respect for them among partners
and donors. Strong understanding of sampling methods and the ability to present them logically will
help ensure the integrity of the assessment results and protect from criticism.
While survey and assessment sampling methodology is a large field in itself and difficult to
master, the following discussion will highlight key considerations necessary for one to keep at the
forefront of the design process to ensure the integrity of the assessments goals, reliability and
applicability in the field. The definitions below serve as an introduction to sampling and are
essential to understand both in designing the assessment and in writing the methodology section of
the report.
DEFINITIONS
Sampling, simply put, is the process of selecting part of a whole in cases where exhaustive
assessments are unpractical or impossible. Sampling the part is done in such a way as to
accurately represent the whole. A key question to always keep in mind is: “Who is being included
and who is potentially being excluded in light of our sampling methodology?”
The sample or target population is the whole population from which a representative sample
is drawn. Common examples of sample or target populations in food security and livelihoods
surveys include the entire population of specific geographic areas such as a nation, province,
region or town. Refugee or IDP camps may also be defined as sampling populations. The
possibilities are endless but must be well-defined prior to drawing the sample and undertaking
the survey.
The sampling frame is an exhaustive list of population elements or units or a geographical
boundary which includes all elements of the sample population to whom the assessment is to
be generalized, and from which a sample is drawn. In strictly controlled refugee camps or villages
with defined boundaries and little in–out migration, camp lists may be exhaustive and provide a
useful sampling frame. In more fluid situations where population elements are ever-changing or
are not known, geographic areas may serve as the sampling frame.
Sampling bias is the tendency of a sample to exclude some members of the sampling universe
and over-represent others. A common source of bias in food security and livelihoods
assessments, especially in emergency and displacement contexts, occurs when the samplingframe from which the sample is drawn is not inclusive of the whole sample population to whom
the assessment refers. For example, an assessment which has the goal of understanding the
household food security of IDP households in a conflict-affected area may be strongly biased if
insecure areas where IDPs are found are not sampled or if only camp-based IDPs are sampled,
with those living in host families being left out. In such cases the sample population may need
to be reconsidered, or limitations must be clearly spelled out and interpreted in the report. Again
the question to consider is “Who is being included and who is potentially being excluded in light
of our sampling methodology?”
The sampling unit is the element or unit selected in sampling which the data refers to. Most
food security and livelihoods indicators use ‘households’ as the sampling unit, while nutrition
surveys may use children under 5 years of age especially in anthropometric surveys. Thus, incollecting data on income, assets and coping strategies to determine household food security,
individual household units are sampled from all the households in the sample population.

8/9/2019 ACF FSL Manual Final 10
http://slidepdf.com/reader/full/acf-fsl-manual-final-10 52/27050 ACF Food Security and Livelihoods Assessment Guideline
See Appendix 14 for sample protocols for household selection and Appendix 29 for a sample
write-up of assessment methodology.
3.3 SAMPLING METHODS
The types of sampling methodologies which can be utilized in the assessment will be driven not only
by the goals of the assessment, but also by constraints including time, resources, access andsecurity. In general, sampling methods can be grouped into two camps, Non-Probability and
Probability Sampling. Because of the various types of data collected in food security and livelihoods
assessments, as well as constraints encountered in crisis and development contexts,
methodologies will often utilize both probability and non-probability methods in selecting a sample.
3.3.1 NON-PROBABILITY SAMPLING
Non-Probability Sampling is any sampling method in which some units have no chance of being
selected or if the probability of selection is unknown. This is commonly used in qualitative
methodologies including selecting key informants, organizing focus groups or interviewing of traders
in markets. Purposive, Convenience and Snowball sampling methods are the most common
non-probability sampling methods. This method often involves the selective judgment of the
enumerator or community leaders and has a high potential of introducing bias into the results.
1. Purposive – In Purposive sampling the researchers decide which particular groups or individuals
to interview. Attempts are made to minimize bias and select a sample which best represents the
population under study. Integrating this method at some level of the sampling process is common
in FSL assessments and it is thus important to be acutely aware of potential bias in selection as this
can lead to criticism of the whole assessment. Purposive sampling can be combined with other ran-
dom approaches, for example, by specifying purposefully a number of communities or clusters to
be visited, but then selecting respondents within the clusters randomly.
2. Convenience – In convenience sampling respondents are chosen because they are accessibleor “convenient.” This results in a great deal of bias due to the diverse differences, especially with
regards to geographic, political and social isolation, between individuals and communities which
are easily accessible and those who are not.
3. Snowball – Snowball sampling resembles the process of taking a small ball of snow and rolling
it to gather more and more snow along the way until it becomes a big ball. Key informants are often
sought out due to their specific knowledge of the situation. These first informants then point the
researcher to other possible informants. One may simply ask whether the respondents knows
anyone else who has experience with the same issues and provide useful information. In this way
new informants are discovered and the snowball grows.
See Table below for an example of rapid assessment sampling methods relying primarily onpurposive sampling.

8/9/2019 ACF FSL Manual Final 10
http://slidepdf.com/reader/full/acf-fsl-manual-final-10 53/27051ACF Food Security and Livelihoods Assessment Guideline
(1) Locations are chosen to include as much variation as possible; the wealth groups are self-defined
by the community; interviews are conducted with representatives of particular wealth groups. The
interview then refers to a ‘typical’ household in that group.
(2) Sampling procedures involve a representative range of affected population groups or livelihood
groupings in the selection of key informants (are they representative of all groups?) and thecomposition of focus or other discussion groups.
3.3.2 PROBABILITY SAMPLING
Probability sampling, also known as ‘random’ or representative sampling, is possible when every
sampling unit has a chance of being selected, the probability of being selected is known and the
selection of the sample is made using random methods. Both selections within a geographical area
and the households or individuals within a given location should be made randomly. Random
sampling is preferred to non-random methods as it is the only one which theoretically has the
potential to represent the entire sampling frame.
Probability sampling is used especially in cases where quantitative data is collected and statistical
analysis is called for. In the food security and livelihood assessment this would pertain to any use of
household questionnaires or collection of data at the household level, which will be generalized to
the larger sample population. Possible methods include Simple Random Sampling, Systematic
Sampling, Stratified Sampling, Probability Proportional to Size Sampling, Spatial Sampling and
Cluster or Multistage Sampling.
1. Simple Random Sampling – This method is used when a list of every household or individual is
available. Respondents are selected randomly from the whole list using a random number table. It is
equivalent to putting all names in a hat and selecting one at a time at random. In contexts where FSL
assessments are undertaken it is very rare to have reliable lists available and thus this approach is not
often used.
Level Factors considered for samplingSampling
intensityComments
Zones withinJebel Marra
Security/ access & currenthumanitarian coverage
12 As defined inhumanitarian coveragemap (Oct 07)
(Groups of)communities
PURPOSIVE selection (emergencylevel then representativeness -livelihood focus); security/ access
36Depending on datacollected at zone level(mapping, SSI)
Groups ofhousehold
PURPOSIVE : depending oninformation to be collectedduring FGD
4
1 general FGD +1 livelihood FGD + 1women FGD (incl. NUT/ health) + 1 WaSH
Key-informants PURPOSIVE : depending oninformation to be collectedduring SSI
Various None
Children RANDOM 30/ settlement Refer to Nut assessment
Table 5: Example of sampling methods for a joint
FSL and nutrition assessment in Jebel Marra, Sudan

8/9/2019 ACF FSL Manual Final 10
http://slidepdf.com/reader/full/acf-fsl-manual-final-10 54/27052 ACF Food Security and Livelihoods Assessment Guideline
2. Systematic Sampling – This method is often used when there is a list of the households or, where
such lists do not exist, the population is geographically concentrated and dwellings are arranged in
a regular geometric pattern. This is the most common sampling method used to select households
within a cluster and is often employed in camp situations and in urban contexts. After a first
household is selected at random, the following households are visited ‘systematically’ using a
“sampling interval” determined by dividing the total number of households by the number needed
to give an adequate sample. For example, if 400 households are on a list, and 20 need to be
interviewed, the first step is to choose the first household at random using a random number table
or other method – let us consider the choice of # 220. Because 400 divided by 20 equals 20, our
sampling interval will be 20. We then select every 20th household starting from # 220; 220, 240, 260
etc, continuing at the beginning of the list when the end is reached until we arrive at our target
number, 20, and we have returned to our start point.
The ‘spin the pen method’ also falls under the category of systematic sampling and is one of the most
common sampling methods used in the field where lists are often unavailable. This is explained in
depth in Appendix 14.
3. Stratified Sampling – When the population being considered contains distinct strata or
sub-groups, these can be sampled independently. This allows references about specific sub-groupsto be draw, which would be difficult if the population was sampled as a whole. This method is
especially useful in FSL assessments where livelihoods or regional groups should be looked at in iso-
lation for the purposes of understanding nuances specific to these groups and to compare them. In
order to maintain statistical efficiency of the sample as a whole, sub-groups should be sampled pro-
portionate to size, if population figures are known.
4. Probability Proportional to Size Sampling can be done in a number of ways, but ultimately
seeks to ensure that the probability of each sampling unit to be selected is set to be proportional to
its size. This method is often employed in the first stage of cluster sampling where a number of
clusters are to be selected from villages or camps with different population sizes. An example from
Wikipedia on the site’s ‘Sampling’ (statistics) page is as follows, with the 6 schools representing the
villages from which 3 “clusters” need to be selected.
“Suppose we have six schools with populations of 150, 180, 200, 220, 260, and 490 students
respectively (total 1500 students), and we want to use student population as the basis for a PPS
sample of size three. To do this, we could allocate the first school numbers 1 to 150, the second
school 151 to 330 (= 150 + 180), the third school 331 to 530, and so on to the last school (1011 to
1500).” If three schools or “clusters” are to be chosen then the sampling interval will be 500 (1500/3
see above). Next a random start number between 1 and 1500 is chosen. The school where this
number falls represents the first cluster and the subsequent two are chosen by counting through the
school populations by multiples of 500. “If our random start was 137, we would select the schools
which have been allocated numbers 137, 637, and 1137, e.g. the first, fourth, and sixth schools.”
5. Two Stage Cluster Sampling – This is the most common sampling method used in FSL
assessments. In the first stage of the process the population is divided into distinct units which are
often defined by administrative or spatial boundaries. This commonly manifests as a list of villages
with varied populations. In contexts of displacement where refugees or IDPs are spread over a large
area the list may be composed of camps or ‘evacuation centres.’ Clusters are then randomly selected
with the probability of selection being proportional to size to ensure each person in the whole area
has an equal chance of being selected. After clusters are selected, a given number of respondents
are chosen at random from each cluster. Where no population figures exist, figures must be
estimated or area maps may be divided into sections and assigned weights.

8/9/2019 ACF FSL Manual Final 10
http://slidepdf.com/reader/full/acf-fsl-manual-final-10 55/27053ACF Food Security and Livelihoods Assessment Guideline
The sample size of the assessment will determine how many clusters are selected and how many
respondents are selected per cluster. Generally it is better from a statistical standpoint to design the
assessment to reach the required sample size by selecting a higher number of clusters and fewer
respondents per cluster. For example, in an assessment demanding a sample size of 300, selecting
30 clusters with 10 households each or 20 clusters with 15 households each is better than using 10
clusters with 30 respondents in each cluster. The design will also depend on factors such as the
assessment timeline, travel time, size of assessment team and how long the tools take to administer.
While the statistical demands of anthropometric surveys often demand a specific ratio of clusters
(e.g. 30 clusters x 30 children per cluster, 60 clusters x 20 children, etc.) household data collected
in FSL surveys will often require a lower sample size with 10 households selected per cluster often
being recognized as acceptable. Thus, if the total sample size for a FSL questionnaire needs to be
150 households, then 15 clusters would be selected with 10 respondents per cluster. Guidelines on
conducting nutrition surveys as well as WFP’s EFSA handbook are good sources to consult in
developing cluster sampling designs.
See Table on next page for a summary of the key sampling methods discussed above.

8/9/2019 ACF FSL Manual Final 10
http://slidepdf.com/reader/full/acf-fsl-manual-final-10 56/27054 ACF Food Security and Livelihoods Assessment Guideline
Table 6: Summary of sampling methods
Type of Sampling Situations in Which to be Utilized Key Concerns
Non-Probability
• Qualitative Tools typical of FSLassessments; Used predominantly in
initial/rapid assessments where time,budget or access is limited• These methods are often combined
and triangulated with other methodsincluding random selection
• Triangulation of data, collecting datafrom multiple methods, helps toensure confidence in results
• Whether sample represents the
population is unknown andgeneralizations are subjective• Key questions to consider for all
non-probability methods: Who is beingleft out? How do those being selecteddiffer from those not being selected?How do these differences potentiallyaffect the indicators of concern?
Purposive
• Often used where time and resourcesare limited allowing only certainpopulation elements to be consideredin the assessment
• Useful where evidence suggests FSLrisks exist only in certain population
sub-groups• Useful in both rapid/initial and
comprehensive FSL assessments
• Good purposive sampling needsthorough knowledge of the populationand context to consider all sub-groups.
• Diversity of population should becaptured
• Can be combined with random
selection; selecting livelihood groupsor geographic regions of concernpurposively and selecting householdsor respondents randomly
Convenience
• Access is limited due to crisis contextor due to the isolation of certainindividuals or communities
• Useful in initial and rapidassessments and in gatheringinformation for planning FSLassessment and tool design
• Often incurs huge selection biasand thus results often cannot begeneralized to the greater populationof concern
Snowball
• Useful when the population of interestis hidden and or difficult to locate,
due to low prevalence or possiblestigmatization
• Snowball sampling carries a high riskfor bias as the respondents often know
each other and thus may belong to aspecific population sub-group,
Probability Sampling
• Collecting quantitative data-especiallyin in-depth assessments wherefindings are generalized to largerpopulations
• Used when unbiased estimates withknown precision are needed
• Sufficient information on populationnumbers and/or location must existor be constructed
• All areas, households and individuals inthe population must be accessible
• Sufficient time and resources mustexist that all selected respondents canbe visited
Random Sampling• Simple Random• Systematic• Stratified• Spatial• Population
Proportionalto Size
• Cluster,• Multi-Stage
Sampling
• To be used alone or in conjunction withnon-probability methods. In purerandom sampling both zones/clustersand households or individualswill be selected randomly. In FSLassessments, livelihood zones orgeographic areas may be purposivelyselected as a first step
• Cluster or special sampling can beutilized in the absence of lists as longas cluster selection or chosen areas donot exclude population elements.Cluster sampling helps maintain randomselection while limiting the geographi
• Spread of the selected population,thus saving time & resources.
• Random selection methods may be
utilized after stratifying the populationby distinct elements: geographic or liveli-hood zones, ethnic group etc.
• The most common approach usedin the contexts in which FSLassessments are likely to be carried
out involves a combination ofpurposive and random sampling,often utilizing both cluster samplingat the first stage of selection andthen systematic sampling to selectspecific households.
• Crisis contexts are often very complexand creativity in approaches and theircombination is essential. Hiddenpopulations and those dispersedthroughout large areas are especiallychallenging including IDPs and urbandisplacement.
• All bias incurred should be
explicitly stated in the methodssection of report.
Table Design Adapted from WFP EFSA Handbook

8/9/2019 ACF FSL Manual Final 10
http://slidepdf.com/reader/full/acf-fsl-manual-final-10 57/27055ACF Food Security and Livelihoods Assessment Guideline
3.4 DETERMINING SAMPLE SIZE
The sample size of the assessment is defined as the number of sampling units, usually households,
needed to give the required level of precision. Determining sample sizes for FSL assessments is notas
straightforward as for nutrition surveys – which follow a general rule of collecting data on 900 children
– due to the diversity of indicators involved and the use of purposive methods in many cases.
For purposive sampling, the accepted rule for household food security and livelihood assessments is
to sample between 50 and 150 households for each reporting domain the assessment wishes to draw
conclusions on. The goal in selecting the locations to visit within the assessment area is to capture the
diversity. If the area in question is homogeneous this will require visiting fewer sites, while
heterogeneous areas demand visiting more sites. In each site it is optimal to visit around 10 households.
For random sampling, it is recommended that between 150 and 250 households (or other sampling
units) are visited for each reporting group to be compared – e.g. geographic area, livelihood group
etc. In cluster sampling approaches, the sample should reach the upper limit of this continuum due
to the design effect incurred in multi-stage sampling.
3.5 BIAS CONSIDERATIONS
Complex emergencies and other crisis are complicated when it comes to sampling. Each situation
demands creativity and flexibility. A rapid onset emergency which demands a rapid assessment will
have different constraints than that of an assessment carried out in a more stable context. IDP
populations which are spread out in a large geographic area, hiding in forests or housed with
host-families in villages or in urban centres present difficulties not encountered in some refugee camps
which are well organized and managed. Where populations are highly mobile or security is unpredictable,
it is highly likely that sampling will be biased in some way or another. In each case it is vital to be aware
of potential bias and do everything possible to minimize it while also showing awareness of these
constraints in the write up of the assessment methodology and analysis of the results.
In random sampling in each context the most important question to consider is whether all
members of the sampling population have an equal chance of being selected , or a chance
which is proportional to size if this method is used. In purposive sampling, it is necessary to capture
all the diversity of the population so that no group is left out of the assessment.
Trying to uncover bias and minimizing it demands one to be critical of one’s sampling methods and
continuously seek to uncover the faults in the process by asking who may be left out of the
assessment or over represented.
Selection Bias is most prevalent where non-probability sampling, such as purposive or convenience
sampling, is used. Random sampling methods may also incur bias where certain communities are
inadvertently left out of or not proportionally represented in the first stage of cluster selection, or whensome households have no chance of being selected in the household selection procedures being
utilized. For example, when household lists are used to select households in a rapidly changing
situation or one which is insecure or the population is highly mobile. In such cases household lists
provided by authorities are often not complete and may even exclude the most vulnerable.
It is important to remember that if sampling procedures cannot be carried out rigorously that the
data gathered does not represent the population as a whole but rather the population that was
surveyed. By extrapolation and analysis, results are then referred to the larger population taking into
consideration the potential sampling bias.
Bias in selecting the sample is only one type of bias incurred in the assessment. Appendix 13 isadapted from the SMART protocols and gives an exhaustive discussion of bias, which is essential
to consider especially with regard to administering the questionnaires and other tools.

8/9/2019 ACF FSL Manual Final 10
http://slidepdf.com/reader/full/acf-fsl-manual-final-10 58/27056 ACF Food Security and Livelihoods Assessment Guideline

8/9/2019 ACF FSL Manual Final 10
http://slidepdf.com/reader/full/acf-fsl-manual-final-10 59/270ACF Food Security and Livelihoods Assessment Guideline
Chapter 4CORE COMPONENTS OF A FSL ASSESSMENT
44.1 Context analysis 59
4.2 Livelihoods groups & zones 62
4.2.1 Defining livelihood groups 65
4.2.2 Defining livelihood zones 67
4.3 Markets and price trends 67
4.4 Food availability 72
4.4.1 Food production 75
4.4.2 Food stocks and reserves 76
4.5 Food access 76
4.5.1 Food sources 78
4.5.2 Income sources and assets 80
4.5.3 Expenditures 81
4.5.4 Credit and debt liability 824.5.5 Terms of trade 82
4.6 Food consumption 82
4.6.1 Meal frequency 85
4.6.2 Dietary diversity 85
4.7 Food utilisation and care practices 86
4.7.2 Care practices 86
4.7.3 Water access & availability 87
4.7.4 Nutritional status 89
4.8 Coping strategies 89
4.9 Participatory vulnerability and capacity analysis 93
4.9.1 Mapping hazards 93
4.9.2 Analyzing vulnerabilities 94
4.9.3 Assessing capacities for recovery,
disaster risk reduction & preparedness 99
© A
C F - M a l a w i , c o u r t e s y S .
H a u e n s t e i n - S w a n
57

8/9/2019 ACF FSL Manual Final 10
http://slidepdf.com/reader/full/acf-fsl-manual-final-10 60/27058 ACF Food Security and Livelihoods Assessment Guideline
The core components of a food security and livelihoods assessment are:
1. Context analysis
2. Livelihood groups and zones
3. Markets and price trends
4. Food availability
5. Food access
6. Food consumption
7. Food utilisation and care practices
8. Coping strategies
9. Participatory vulnerability and capacity analysis
These should serve as the standard basis of all FSL assessments. ACF food security and
livelihoods assessment approaches rely on a common logical framework built around the 9 core
components whose analysis allows us to meet the broad objectives of a FSL assessment set out in
section 2.1. Each core component and its associated set of indicators needs to be addressed in
some form so as to ensure a minimal degree of shared understanding and permit comparative
analysis across settings. The depth of analysis on each component will vary depending on the type
of assessment being carried out and its specific objectives. The sequencing and relationshipsbetween each of the core components and associated indicators are illustrated graphically in the
Figure below.
V u l n e r a b i l i t y C o n t
e x t ( s h o c k s ,
t r e n d s , s e a s o n a l
i t y )
Foodproduction
Regional tradeinfrastructure &communications
Food imports(private, public,
food aid)
Naturalresource base,input markets
Watersanitation& health
Socialnetworks &
transfers
Remittances
Availability
Utilisation Access
Transforming Structures & Processes
(Socioeconomic, political & institutional environment)
Foodconsumption
Nutritionalstatus
Food stocks &reserves
HH Foodsources
HH Assets:human, social,
financial, natural,physical,political
HH incomesources
Copingstrategies
Markets forlabour, goods,
services & credit
Carepractices
Consumermarkets
{ } Adapted from WFP 2009: World Hunger Series, Hunger and Markets.
Figure 7: Sequential framework of core components

8/9/2019 ACF FSL Manual Final 10
http://slidepdf.com/reader/full/acf-fsl-manual-final-10 61/270
4.1 CONTEXT ANALYSIS
Before conducting the survey, an exploratory study of the region is required in order to have a broad
understanding of the area to be surveyed. This includes at minimum a general investigation of the
crisis context, its historical underpinnings and a snapshot of the current situation on the ground.
An analysis of the broad historical, political, socioeconomic and cultural context underlying a crisisor conflict forms an integral part of the ACF conceptual approach to FSL assessments. The
socioeconomic and political environment is a basic cause of malnutrition, and makes up the
Transforming Structures & Processes which influence access to livelihood assets and shape
livelihood strategies and outcomes. The socioeconomic, political and physical environment also
affects the shocks, trends and seasonality that make up the broad Vulnerability Context. This
information is needed to provide the contextual backdrop for the food security and livelihood
analysis that follows and to inform the interpretation of results.
Context analysis is needed to understand:
• The underlying factors that have resulted in vulnerability of the population e.g. political and
economic context, recurrent exposure to floods or drought, degradation of the physicalenvironment, high HIV/AIDS prevalence, weak governance structures
• Which population groups are marginalized and made more vulnerable by virtue of their religion,
ethnicity, socioeconomic status, political affiliation or gender
• The geographic area and demographic profile of the population affected by the crisis
• The nature and scope of the crisis
• Its main humanitarian impacts, in particular health and nutrition
• The local and national response capacity as well as who are the main actors on the ground
• Security and stability of the situation; constraints on physical movement and access, both for the
population and aid workers
The Sustainable Livelihoods Framework serves as the main analytical tool guiding this preliminary
phase of data collection (see highlighted portions of the Figure below).
59ACF Food Security and Livelihoods Assessment Guideline
VULNERABILITY
CONTEXT
Influence
& access
LIVELIHOOD
STRATEGIES
LIVELIHOOD ASSETS
STRUCTURES
PROCESSES
• SHOCKS
• TRENDS
• SEASONALITY
TRANSFORMING
STRUCTURES
& PROCESSES
• Levels ofgovernment
• Privatesector
• Laws
• Policies
• Culture
• Institutions
in
order
to
achie
ve
H
NS
FP
KeyH = Human Capital
N = Natural Capital
F = Financial Capital
S = Social Capital
P = Physical Capital
LIVELIHOOD
OUTCOMES
• More income
• Increasedwell-being
• Reducedvulnerability
• Improved foodsecurity
• More sustainable
use of NaturalResource base
Sustainable livelihoods framework

8/9/2019 ACF FSL Manual Final 10
http://slidepdf.com/reader/full/acf-fsl-manual-final-10 62/27060 ACF Food Security and Livelihoods Assessment Guideline
Socio-economic, political and institutional environment:
The key institutions and policies affecting economic and political life are identified and their major
impacts on people described; a sociocultural and demographic profile of the population
elaborated including breakdown by major ethnicity and geographic area; and the political
organization and presence of formal and informal social networks defined. The social organization
of the local landscape is assessed to understand community capacity for response, collaboration
and partnership in the relief effort (see also section 4.9). Together these aspects make up the
Transforming Structures and Processes.
Physical, environmental, security considerations:
The physical environment and agro-ecological profile of the region should be identified, including
climate trends, geography and significant environmental processes such as drought, deforestation
or desertification and their impacts on livelihoods. Major hazards such as drought, floods,
civil conflict and economic shock are identified and their seasonality, frequency of occurrence,
severity and contribution to underlying vulnerability analyzed (see also section 4.9). Together these
aspects make up the prevailing Vulnerability Context.
Current crisis:
The geographic area and the affected populations (displaced, refugee, host, etc.) should bedefined, including the location of the different populations and their numbers. The source and
nature of the crisis should be identified.
Humanitarian situation:
Basic data on the prevailing humanitarian situation (nutrition, food, shelter, health, water and
sanitation) is gathered. Then, information on the range of actors present is gathered by carrying out
an informal census of aid organizations and UN agencies working in the affected areas and
identifying who does what, when, how, for whom, and where. Knowing the type and scale of
deployed aid leads to the next step: anticipating potential gaps in coverage in a so-called gap
analysis. The gap analysis helps guide the choice about where to conduct the assessment
and later, where to intervene. The security of the affected population as well as questions
of physical access of relief workers and commodities will guide the development of theassessment methodology.
Methods
Contextual information is gathered in a review of secondary data, including websites and online
databases, official government records, UN/ NGO joint assessments, evaluation reports. Much of
this information can be gathered ahead of time. It should already exist on the mission and can be
shared by the coordination team and FSL department onsite.
Knowledgeable key informants, experts and sectoral professionals should be consulted. In
certain countries, national research institutes and universities will serve as important resources. In
emergencies, often the best informants with the most up-to-date information are those servingdirectly on the ground: local organizations, NGOs, UN agencies, military officers (with caution),
etc. The ACF Head of Mission and other members of the team should be consulted first.
Profiling and mapping institutions is done to gather information on the presence of
and relationships between community-based organizations, religious institutions, trade
and agricultural organizations, government agencies, etc. operating in the area. See Appendix 11.
Information will be largely qualitative (narrative) but will also include statistical data
e.g. demographic and epidemiological data, maps and other types of quantitative info.
See table on the next page for a summary of key issues and suggested methods and sources
of information.

8/9/2019 ACF FSL Manual Final 10
http://slidepdf.com/reader/full/acf-fsl-manual-final-10 63/27061ACF Food Security and Livelihoods Assessment Guideline
Table 7: Contextual information checklist
Area of analysis Key issues to consider Methods/sources
Physical andEnvironmental
• Climate, geography, environment• Physical infrastructure• Prevalence of natural disasters• Drought, deforestation, desertifica-
tion and other degradation of thenatural resource base
• Conflict related to accessing naturalresources e.g. land, water, forests
• Seasonality
Economic
• Major and minor production systemse.g. agriculture, livestock, fisheries
• Sources of income, remittances• Seasonal migration
• Markets
Social, political anddemographic
• Socio-political context• Past crises and conflict• Demographic breakdown• Ethnic groups, intra-group linkages• Social organization, local leadership
and authority• Formal and informal social networks
Institutional
• Existing institutions (public, CBOs,NGOs, religious, trade, etc.)
• Policies and law• Nature of institutional programming• Partnerships and collaboration• Relationships with government and
communities• Impacts on economic and
political life
Current crisis
• Nature and location of the currentcrisis
• Underlying factors related tothe crisis
• Duration/ frequency
• Security of affected population• Displacement• Numbers affected• Numbers displaced
Humanitarian
• Health and disease• Nutritional status• Shelter• Availability of and access to food• Access to water and sanitation• Physical access to the affected
area(s)• Presence and type of activity of
other actors
Secondary information sources:• Government documents• Official and other statistics• Maps• Reports published by national and
international agencies• Project evaluations• Joint assessment reports• Websites• Local organizations
Key informant sources:• Government representatives• UN workers, NGO staff• Local authorities
• Traditional or religious leaders• Representatives of local NGO or civilsociety organization
• Teachers, researchers, healthprofessionals, WES professionals,agronomists and other food securityprofessionals
• Youth groups• Local media

8/9/2019 ACF FSL Manual Final 10
http://slidepdf.com/reader/full/acf-fsl-manual-final-10 64/27062 ACF Food Security and Livelihoods Assessment Guideline
4.2 LIVELIHOODS GROUPS & ZONES
A livelihood comprises the capabilities, comprised of assets (including both material and social
resources) and strategies used by a household for means of living. A household’s livelihood is
secure when it can cope with and recover from stresses and shocks, and maintain or enhance its
capabilities and productive asset base. Livelihood assets such as livestock, forest resources or
financial credit in combination with broad structures and processes largely determine the types oflivelihood strategies that households will undertake.
Profiles of livelihoods are constructed early on in the stage of secondary data review and later
refined with primary data. The predominant systems of production in the affected areas such
as agriculture, livestock, fisheries and mining are identified and their relationship to the
agro-ecological, political and security landscape defined. Livelihood profiles are constructed using
information on livelihood assets as well as key hazards and sources of vulnerability linked to
livelihoods. The section which follows describes an iterative process that is initiated before the field
portion of the assessment gets underway, refined with primary data and only completed in the final
analysis phase.
See the highlighted portions of the Sustainable Livelihoods Framework below.
4.2.1 DEFINING LIVELIHOOD GROUPS
A livelihood group is a collection of people who share the same food and income sources, shareaccess to the same livelihood assets and are subject to similar risks.
Examples of livelihood groups include small-scale fishers, agropastoralists, landless casual
labourers and traders. Livelihood portfolios of individual households can be complex and include
two or three main activities, such as subsistence rice cultivation + inland fishing, fishing + crabbing
+ small livestock-raising, or casual labour + charcoal production.
Sometimes, livelihood activities correlate closely with location. This can be true where tribes or
ethnic groups remain historically tied to a particular way of life, or where ecology limits the type of
productive activities that can be carried out. For example, in Wajir, north-east Kenya, pastoralists
dominate the scrub desert landscape, while petty traders and labourers can only be found in town.Meanwhile, several pastoral zones can be distinguished in Wajir according to the type of herd
animal (camels, cattle, goats, sheep).
VULNERABILITY
CONTEXT
Influence& access
LIVELIHOODSTRATEGIES
LIVELIHOOD ASSETS
STRUCTURES
PROCESSES
• SHOCKS
• TRENDS
• SEASONALITY
TRANSFORMING
STRUCTURES
& PROCESSES
• Levels ofgovernment
• Privatesector
• Laws
• Policies
• Culture
• Institutions
in
orde
rto
achieve
H
NS
FP
KeyH = Human Capital
N = Natural Capital
F = Financial Capital
S = Social Capital
P = Physical Capital
LIVELIHOOD
OUTCOMES
• More income
• Increased
well-being
• Reducedvulnerability
• Improved foodsecurity
• More sustainableuse of NaturalResource base
Sustainable livelihoods framework

8/9/2019 ACF FSL Manual Final 10
http://slidepdf.com/reader/full/acf-fsl-manual-final-10 65/27063ACF Food Security and Livelihoods Assessment Guideline
Why do a livelihood grouping?
People with similar food and income sources will tend to respond in similar ways to particular shocks.
They will also tend to benefit from the same interventions to promote their food security and support
their livelihoods. Identifying livelihood groups within the affected population allows us to analyze the
severity of food and livelihood insecurity by group, and formulate recommendations by group.
What about populations who have been cut off from their sources of livelihoods?
Displaced populations, as well as populations in situations of chronic emergency or political
instability and insecurity, are less usefully characterized according to livelihood type. They should
still be classified according to their main sources of income and food and the risks they face. In
situations of insecurity and displacement, determinants of food access may be more closely related
to physical location, risk of attack, settlement type, phase of displacement, gender, etc. rather than
the type of livelihood activity that is practiced. In these cases, population groups are sometimes
referred to as access groups rather than livelihood groups. Where options are severely constrained
in situations of chronic emergencies, everyone may be forced to adopt the same limited number of
food and income sources, making it impossible to distinguish any groups.
Distinguishing livelihood and wealth groups
In general, poorer households will demonstrate a greater diversity in their sources of income, be more
dependent on paid employment for income, rely more heavily on purchased food to meet their
consumption needs, spend a larger proportion of their income on food and have fewer savings and
fewer assets than the better off. However, classifying groups through a purely economic lens can be
risky. Poverty is not always synonymous with vulnerability, especially in insecure settings whereethnicity and political status may matter more than economic assets. It is also complicated and
inexact to compare wealth levels across groups of people who have very different asset profiles.
It is best to distinguish groups first according to the type of activity they practice e.g. landless
labourers, rather than by their wealth or poverty. Wealth categories can later be determined within
livelihood groups. For example, the wealth of pastoral households in Burkina Faso varies according
to the number and composition of herds. Livestock holdings of the poorest households are low and
limited to small ruminants (e.g. one goat, poultry), while better-off households have larger and more
diverse holdings (e.g. poultry, goats, sheep, the occasional head of cattle) and the wealthiest
households enjoy holdings numbering in the tens or hundreds of cattle and sheep.
EXAMPLE: GROUPING HOUSEHOLDS ACCORDING TO DISPLACEMENT STATUS IN KENYA
The post-election violence in Kenya in 2007-08 displaced an estimated 250,000 to 300,000
people from their villages and traditional sources of livelihood. Many of these fled to Nakuru
District. In March 2008, ACF conducted an FSL assessment of livelihoods in the urban slum areas
and camps of Nakuru District and divided the population according to settlement type:
• IDPs integrated into inner-city areas (living with host families)
• IDPs living in camp situations in Nakuru town
• Host populations
These categories were chosen to reflect shared income/food sources despite varied backgrounds
in business, trading, agriculture and livestock (in the case of IDPs). IDPs living in camps were
found to be almost uniformly unemployed and reliant on food assistance, while those living withhost families depended on petty trade and casual labour for income.
Source: ACF 2007 Rapid Assessment, Nakuru, Rift Valley, Kenya: Following Kenyan
Post Election Violence.

8/9/2019 ACF FSL Manual Final 10
http://slidepdf.com/reader/full/acf-fsl-manual-final-10 66/27064 ACF Food Security and Livelihoods Assessment Guideline
The wealth ranking makes use of local indicators of wealth, and breaks down the livelihood group
into 3, 4 or 5 relative wealth categories. See Appendix 11 for guidance on carrying out a
Wealth Ranking.
What are the steps involved in identifying livelihood groups?
In order to group households who pursue a similar mix of economic activities, share access to a
similar range and amount of resources and are exposed to similar risks, it is necessary to identify the
ways households access food and income and to analyze their assets and resources.
To define livelihood groups, several steps are followed:
1. Identify main food and income sources in the area. Generally these fall into the following
categories: production-based, where food is sourced from own production; waged labour ; where
food is sourced from the market; trade-based, where cash crops, livestock or artisan products
are sold or exchanged for food; gifts and transfers, where food is received from social networks,
the government or relief aid; and other sources such as looting and theft. Households will often
pursue a combination of strategies, so the livelihood group is best identified by the main
food source.
Example: The most important food source among poor agro-migrant groups in North Darfur State is market purchase, which is determined by the level of income, remittances and livestock holdings
of the household. Wild foods and gifts/relief to poor households also are important sources of food
in bad crop years. Income is obtained from migration and in-kind payment of women’s agricultural
labour in South and West Darfur.
2. Identify livelihood assets. For the main groups already identified, a livelihood profile that lists
the assets required for a sustainable livelihood can be constructed. The six asset classes of the
Sustainable Livelihoods Framework should be considered for this task.5
Example: Mapping livelihood assets in Darfur
Camel-based pastoralism is facing severe challenges as a livelihood system as a result of insecurity
limiting migration, lack of development adapted to pastoralist lifestyles, pressures to settle, and theeconomic incentives of strategies linked to the war economy. Camel nomads rely on access to
natural assets (for water and pasture) and financial assets (via the camel trade) for their livelihoods.
Access to these capitals has increased as result of the nomadic groups’ participation in violence and
war. Meanwhile their social, human and political capital has contracted, leading to a highly skewed
distribution of livelihood assets. Settled farming groups who have been targeted and displaced in the
conflict previously relied on the same types of assets but have since had to abandon their livelihoods,
suffering major loss of income/financial capital and loss of access to natural resources (such as their
former farms) in the interim. These IDP groups now rely mainly on social networks, other forms of
social and political capital and humanitarian aid for survival. In the Figure below, the asset portfolio
of the two livelihood groups is compared.
Source: Young et al, 2009. Livelihoods, Power and Choice: The Vulnerability of the Northern
Rizaygat, Darfur, Sudan.
5 Natural, physical, human, social, financial, political

8/9/2019 ACF FSL Manual Final 10
http://slidepdf.com/reader/full/acf-fsl-manual-final-10 67/27065ACF Food Security and Livelihoods Assessment Guideline
3. Identify specific vulnerabilities or risks linked to each group. External sources of vulnerability
such as HIV/AIDS, insecurity, displacement, political status and drought should be analyzed, as
these may be more important determinants of food security than livelihoods. When this is the
case, populations can be grouped according to these risk factors rather than their sources of
food and income.
Example: The vulnerability of poor agro-migrant groups in North Darfur State is closely tied to a
number of external factors such as: drought, insecurity, limited options for livelihood diversification
and seasonality of labour markets, as well as intrinsic factors such as high dependency on labour migration.
4.2.2 DEFINING LIVELIHOOD ZONES
Livelihood zones are geographic areas with similar food access defined by:
• Geography
• Market networks
• Livelihoods or combinations of livelihoods prevalent in the area
A geographic area defined by a specific climate and ecology – for example, a coastal region – may
be associated with a single type of livelihood group e.g. fishers who also cultivate cassava. But more
often, several livelihood groups coexist in a geographic area that is ecologically uniform. Within the
same zone, there are groups who pursue different types and combinations of economic activities.
They do so by exploiting different niches e.g. hunting, fishing, gathering forest products, trading.
These differences may be determined by wealth, ethnicity, religion, political affiliation, etc.
In the Table below from the cyclone-affected Delta region in Myanmar, livelihood zones are
distinguished according to the criteria of freshwater access, as people’s sources of income and food
were found to be mainly determined by an area’s reliable [off-season] access to irrigation water. The
freshwater zone enjoys a greater diversity of income sources as staple food needs are more easily covered allowing for income to be reinvested in other productive activities.
Financial
Natural
Political
Physical
Human
Camel Nomads
IDPs
Social
Figure 8: Comparing the typical pattern of assets among
Camel Nomads and IDPs in Darfur, Sudan

8/9/2019 ACF FSL Manual Final 10
http://slidepdf.com/reader/full/acf-fsl-manual-final-10 68/270
Why do a livelihood zoning?
Zoning is a tool that is most commonly used at country level where diversity of landscapes and
climatic zones – as well as differing political and economic contexts and ethnic character – lends
itself to the development of a range of livelihoods and therefore a range of vulnerabilities to shocksand stresses. A livelihood zone map provides a division of the country into homogenous zones that
correspond to patterns of livelihoods. These patterns of livelihood can be associated with differing
vulnerability to shock and stress. To understand how vulnerability is distributed spatially across a
country, zoning exercises are often carried out by governments and prominent agencies and results
made available to the wider humanitarian community. It is unlikely that ACF would be called on to
carry out a country-level zoning independent of other actors.
Depending on the complexity of the physical and sociocultural landscape, zoning can be a useful tool
at regional and local level. The level of detail will more directly support and inform the analysis of
local-level livelihoods than a country-level zoning. Where a crisis-affected area is sufficiently
heterogeneous for local coping responses to vary by livelihood, local area zoning is useful for:
• Serving as the sampling frame for rapid assessments and surveys that will be representative of the
local range of livelihoods
• Understanding the differential impacts of the crisis on various groups and prioritizing needs
• Targeting assistance on a geographical basis
• Serving as a baseline for a FSL surveillance program
66 ACF Food Security and Livelihoods Assessment Guideline
Table 8: Example of livelihood zones and groups in the Irrawaddy Delta, Myanmar
Livelihood zone LocationLivelihood
groupSources of income and food
Commercialfarmers
Rice farming (two crops/year) supplemented by:inland fishing, pig-raising, cash crop cultivation(pulses, groundnut, betel nut), homesteadgardening
Farmers Rice farming, fishing, local fish trading, small shops
Subsistencefarmers
Subsistence rice farming and fishing, livestock,casual labour
Landlesslabourers
Casual labour, water transportation,subsistence fishing
FishersInland fishing supplemented by: rice cultivation(single crop), small livestock, crabbing
Subsistencefishers
Subsistence rice farming and fishing, livestock,casual labour
Landlesslabourers
Casual labour, water transportation,subsistence fishing
Freshwater zone Northern partof Delta
Brackish (salt)water zone
Southern andwestern partsof Delta

8/9/2019 ACF FSL Manual Final 10
http://slidepdf.com/reader/full/acf-fsl-manual-final-10 69/27067ACF Food Security and Livelihoods Assessment Guideline
Incorporating hazards
A livelihood zoning map is not the same as a needs assessment map. Needs assessment maps
are based on a current assessment of the needs of a population due to a specific hazard or
combination of hazards, such as drought or armed conflict. While hazards are not used as a
separate criterion for drawing up zones, livelihood zoning maps will still capture some aspects of
hazard exposure by different groups as vulnerability to predictable hazards affects people’s patterns
of livelihood.
For example, subsistence producers of cassava might undertake complementary charcoal
production in order to mitigate the impacts of mosaic virus disease [a biological hazard] on their
crop and livelihood, thus changing the basic livelihood portfolio of the zone. Patterns of livelihood
will also change over time in response to the recurrence of particular risks. For example, pastoral
groups may abandon distant grazing lands due to ongoing chronic insecurity [a manmade hazard],
thus shifting the boundary of the pastoral zone.
Globally, livelihood zoning maps are relatively static and are useful for providing a baseline on which
to build a needs assessment.
Methods for identifying livelihood groups and zones include secondary data collection, observationand rapid appraisal methods such as transect walks that give a broad view of the landscape
ecology and the ways in which people have organized and developed it. Key informants will
complement this information so that broad patterns of livelihoods and vulnerabilities can be
characterized for the area to be surveyed. Once identified, livelihood groups/zones will then form the
basic unit of analysis for the FSL assessment.
Where time permits, more detailed data on livelihood assets and sources of income and food for
various groups is gathered via the household questionnaire (refer to section 4.5). A number of PRA
tools such as Timelines, Hazard Mapping, Vulnerability and Capacity Analysis and Wealth Ranking
are useful for further refining the livelihood profiles of groups and zones (refer to section 4.9).
See Appendix 20 for guidance on carrying out a livelihood zoning exercise and examples from thefield; Appendix 11 for guidance on PRA tools that can be used in building and refining livelihood
profiles; and Appendix 21 for an example of a livelihood matrix showing changes in the asset
hexagon following conflict and displacement.
4.3 MARKETS AND PRICE TRENDS6
While subsistence activities remain key sources of livelihood in many rural societies, markets form
the backbone of economies everywhere. Today, most people live in cash or mixed economies and
are at least partially reliant on markets to meet their basic household needs. Markets and systems
of informal exchange are particularly important for urban households and displaced persons who will
have negligible if any home production.
DEFINITIONS
A market is a formal or informal setting where buyers and sellers meet regularly to exchange
goods and services.
Market Performance is the extent to which the market makes goods and services available at
affordable prices to meet demand. When markets perform well, households that have cash are
able to find and buy what they need, when they need it, at prices that reflect the traders’ costs
plus a reasonable trading margin (profit). When markets are not performing well, such households
are either unable to find sufficient goods and services on local markets or can find it only at
excessively high prices.
(continued on page 68)
6 Adapted from WFP 2007

8/9/2019 ACF FSL Manual Final 10
http://slidepdf.com/reader/full/acf-fsl-manual-final-10 70/27068 ACF Food Security and Livelihoods Assessment Guideline
Market analysis is needed to understand:
• Linkages between markets on different levels (national, regional, district)
• How markets have been affected by the shock, how well they are functioning and what are the main
constraints on their activity
• The extent to which market disruption has affected food availability and food access, using terms
of trade as a food access indicator
• The extent to which markets can deliver food and other essential commodities at affordable prices
for affected populations
• The functioning of labour markets and their contribution to household food access and livelihoods
in the area
• The capacity of markets to absorb large-scale sales of assets
• The appropriateness of cash-based interventions
• The potential for local/ regional procurement of relief materials and impacts on prices
Markets provide a venue for the exchange of goods and services, thereby influencing the movement
of key commodities and setting their prices according to supply and demand. Changes in an economy
are signalled through price variations which may be seasonal or due to crisis or conflict.
Prices tend to decrease or remain stable when there is an adequate supply of goods and services,
when demand falls, or when demand does not increase in proportion to supply. Price will tend to rise
when traders expect the import, supply or production of goods to fall. Market analysis and price
monitoring helps the assessment team understand changes in the economy, their severity over time
and the related impact on purchasing power of various groups. Market analysis is particularly
important for measuring changes in food availability and food access.
Market analysis is also vital for assessing how markets can be used to support local economic
recovery. Cash-based interventions (CBI) in emergency and recovery contexts now comprise one
of ACF main FSL programming responses. Where markets are performing well, solid market
analysis can provide the arguments for the implementation of cash transfers, cash-for-work
programs, voucher schemes and other types of CBIs, as appropriate. Where market functioning and
recovery is poor, other types of programs such as support to traders may be fitting to rehabilitate
critical market systems. Where conventional relief distributions of food, non-food items and
agricultural inputs continue to be practiced, market analysis is vital to anticipate and track potential
impacts on the local economy. The same is true of projects entailing local procurement.
Establishing a market price baseline at the assessment stage paves the way for market price
monitoring in the affected area, either as part of surveillance activities or program implementation.
(continued from page 67)
Market Structure is the number of buyers and sellers, the size of markets, the volume of product
traded and the degree of specialization, coordination and communication within the market. It
includes how markets are linked by transport, storage and communication infrastructure.
Terms of trade are the ratio of two prices, for example, the ratio of the price of livestock to the price
of a food staple, the ratio of the cash crop price to the price of a food staple, or the ratio of dailywage for unskilled labour to the price of a food staple.

8/9/2019 ACF FSL Manual Final 10
http://slidepdf.com/reader/full/acf-fsl-manual-final-10 71/27069ACF Food Security and Livelihoods Assessment Guideline
Key information to be collected includes:
§ Geographic location of markets; areas covered; commodities traded
§ Sources of staple goods; trade flows; constraints on transport
§ Price movements for a reduced food basket and fuel commodities
§ Impacts on market supply (food availability) and consumer demand
§ Impacts on labour supply and daily wage rates
§ Access to capital by traders
§ Household terms of trade
Sources of information
Market information sources can be both quantitative and qualitative. Qualitative sources refer tobuyers’ and traders’ opinions and perceptions, while quantitative data includes prices in aparticular place, and volumes traded.
Qualitative data is derived from semi-structured interviews with key informants, discussions withfocus groups, and observation. Sampling of traders is usually purposive. Sampling of households (forgeneral data collection including some specific data on markets) can be purposive or random.
Methods
Methods should be participatory and allow key market players to sketch the various factorsinfluencing the marketing chain. Discussions with traders and households on the existing problemsand solutions combined with very simple price analysis can be a good basis to identify appropriateresponses to address lack of effective demand and potentially low market supplies. Therecommended approach entails working with people who know the markets, both domestic andregional, and are familiar with the history of the area.
See Appendix 8 and 17–19 for specific guidance of tools used in market analysis, includingtrader and focus group interview guides, market mapping exercises, price trends and terms oftrade calculations.

8/9/2019 ACF FSL Manual Final 10
http://slidepdf.com/reader/full/acf-fsl-manual-final-10 72/27070 ACF Food Security and Livelihoods Assessment Guideline
The Figure below shows a mapping of trade flows for agricultural commodities across
livelihood zones.
Source: ACF, 2007: Socio-economic study in the ACF zones of intervention, Territories of Fizi/ Uvira,
S Kivu DRC
See table on next page for a summary of key issues in market analysis.
Legend:Product flow
Rice
Groundnuts
LakeTanganyika
Valley
Plain
Middle Plateau Coastal
N
Rice
Groundnuts
Bananas
Cassava
Fish
Palmoil
Figure 9: Mapping of agricultural commodity trade flows

8/9/2019 ACF FSL Manual Final 10
http://slidepdf.com/reader/full/acf-fsl-manual-final-10 73/27071ACF Food Security and Livelihoods Assessment Guideline
Area of analysis Indicator Key issues to consider Methods/ sources
Households
• Own production sold• Food bought
from market• Participation in labour
market
• Quantity sold of staple foods, cashcrops, livestock, livestock or fishery
products• Proportion own production sold• Quantities purchased weekly/ monthly• Prices• Seasonal variation• Access to credit from traders• Type of work and seasons• Proportion of annual income from
labour market
• Household questionnaire• Focus group discussions• Proportional piling and ranking
Prices
• Staple foodcommodities
• Cash crops• Livestock • Fuel
• Price changes compared withpre-crisis or baseline period e.g.one year ago
• Price differences between regions, toassess market integration
• Price variation and trends over recentweeks or months, to assess seasonaland inflationary trends
• Impact of food aid on prices• Perception of future price evolution
• Market price databases, national andinternational e.g. FAO, Central Statisti-cal Agency, Ministry of Agriculture;NGO, UN agencies publications
•
Spot observation in the marketplace• Local/ retail traders, wholesale buyers/
suppliers, households• Construction of price trends
Markets
• Location• Wholesale,
retail• Number of markets• Frequency of markets• Distances
between markets
• Geographic location of markets• Areas covered by markets• Geographic proximity of affected
communities• Quantities sold and seasonal variation• Variation in supply and demand of key
commodities
• Trends over recent weeks or months
• Baseline studies• Trader interviews• Focus group discussions• Household questionnaire• Market mapping• Seasonal calendars
Sources ofkeycommodi-ties
• Main trade routes ofcommodities traded
• Types of commodities traded• Local, regional or imported• Ease of movement e.g. seasonality,
road and storage infrastructure
Traders
• Number of traders• Credit availability• Storage capacity
• Number of traders and trend overrecent weeks or months
• Access to credit• Size of stocks• Impact of food aid on business• Transaction costs e.g. transport,
storage, taxes
Labourmarkets
• Seasonal labouravailability
• Daily wage rate• Main sources of daily
labour• Remittance income
• Labour flows in/out of the area• Labour demand and supply e.g. num-
ber of people seeking and finding work • Change in daily wage rate and sea-
sonal variation• Change in remittance flows
• Focus group discussions• Household questionnaire• Key informant interviews• Market mapping• Seasonal calendars
Terms of
trade
• Daily wage rate/ staple food
• Cash crop/staple food• Livestock/staple food
• Changes in purchasing power forhouseholds selling labour, cash crops
or livestock, to assess changes in foodaccess by livelihood group
• Key informant interviews• Household questionnaire
• Observation• Trader interviews• Market mapping
Table 9: Markets and price trends checklist

8/9/2019 ACF FSL Manual Final 10
http://slidepdf.com/reader/full/acf-fsl-manual-final-10 74/27072 ACF Food Security and Livelihoods Assessment Guideline
4.4 FOOD AVAILABILITY
Food availability refers to the amount of food physically present in an area. It is largely, although not
exclusively, analyzed at the population (macro) level.
To understand changes in available food resources in the affected area, food production, stocks
and flows are considered. The assessment of trade flows of staple goods – including food – isexamined in the section on Markets. Indicators, methods and tools for assessing food stocks and
production systems are summarized in the table and described in detail below.
Area of
analysisIndicator Key issues to consider Method/ source
Food stocks
• Sufficiency anddiversity of foodproducts available
at local level• Self-sufficiency at
household level
• Diversity of government foodstocks and trader stockpiles heldin the area e.g. emergency grainreserves
• Duration of staple food stocksheld by households for ownconsumption
• Secondary datareview
• Local authorities
• Traders• Households
Foodproduction
• Cropping, fishery andanimal husbandrysystems
• Importance of eachsystem e.g. scale anddistribution
• Work force e.g.number of active familymembers, paid workers
• Tools, equipment andother infrastructuree.g. harvest equipment,storage units, nets, boats
• Seed capital• Hydraulic infrastructures
e.g. wells, protection ofwater banks, irrigationnetworks
• Government policies
• Production estimates forlocal area
• Market-based production vs.subsistence production
• Seasonal variation in
food availability• Local determinants of access
to land, pasture & fisheries• Main constraints faced e.g.
access to inputs, land, feed,draft power, water, markets etc.
• Secondary data e.g.food and cropassessments
• Key informants• Focus groups by
livelihood class• Field visits and
transect walks• Seasonal calendars• Maps• Farm profiles• Proportional piling
Imports
• Main markets• Origin of food in the
market• Diversity• Availability
• Location of markets• Change in quantity & availability
of local food sources and imports• Proximity of markets to affected
population
Marketprices
• Prices of staple foods• Government policies,
subsidies
• Change in staple food pricescompared to normal baseline
• Changes in cash crop, fishery orlivestock product pricescompared to baseline
• Terms of trade• Access to market and subsidy
programs by gender/ ethnicity
Table 10: Food availability checklist
• Market survey(described inseparate section)

8/9/2019 ACF FSL Manual Final 10
http://slidepdf.com/reader/full/acf-fsl-manual-final-10 75/27073ACF Food Security and Livelihoods Assessment Guideline
4.4.1 FOOD PRODUCTION
Food production systems in a given area often represent a diverse set of adaptations to the local
geographical landscape and its climate.
A production baseline is defined in order to identify in normal times:
• the main production systems in the area and their relative importance,
• the main staple food and cash crops produced,
• estimates of land/pasture area, fishery size and production for these different products, and
• normal seasonal fluctuation in food availability in the area
• availability and access to seeds
In areas where agriculture is important, specific information can also be gathered on the sowing
basics for each type of crop e.g. average area sown, seed rates, multiplication rates; preferredvarieties; sources of seed and/or breeding material; input and management practices; and decision-
making and management responsibility within the household for the various farming activities.
Global impacts on food production systems resulting from the shock should then be quantified e.g.
losses of standing harvests, livestock, tools and equipment, seed capital, irrigation and storage
infrastructure, labour, etc.
These data will help ACF anticipate how much food derived from local production is likely to be
available now and down the road, as well as the immediate and mid-term impacts on agriculture,
herding or fishery-based livelihoods in the area.
Population-level data can be further refined by assessing impacts at the level of the farm
production unit or household for each livelihood group. Types of information to be gathered for a
basic characterization of the farming unit include:
• Type and number of productive assets held by each livelihood group e.g. land area, seed capital,
livestock, boats/nets
• Diversity and sources of seed, livestock and other inputs
Here it is useful to inventory impacts according to the six classes of livelihood assets:
• Natural capital (e.g. land degradation, water shortages)
• Human capital (e.g. loss of knowledge or change in labour availability due to death, illness,
displacement or migration)
• Social capital (e.g. impact of war on cooperative labour arrangements)
• Financial capital (e.g. availability of agricultural credit, loss of assets produced exclusively for
sale, loss of other income opportunities)
• Physical capital (e.g. loss of productive assets, livestock, changes to market roads, market
closures)
• Political capital (e.g. links/contacts with public authorities, rights over natural resources)
See Appendix 21 for an example of a livelihood matrix.

8/9/2019 ACF FSL Manual Final 10
http://slidepdf.com/reader/full/acf-fsl-manual-final-10 76/27074 ACF Food Security and Livelihoods Assessment Guideline
• Type and number of workers
• Quantities produced and proportion sold/ exchanged/ donated/ stored etc. of staple foods, cashcrops, livestock and fishery products, wild foods, etc.
See Table below for a sample format of the uses of household agricultural production. This can beadapted for other types of products produced and exchanged by the household.
This information can be used to calculate the minimum land area, herd size or other productive
asset(s) needed to provide for the average household, together with data on income sources
and expenditures by livelihood group. Such a measure can later help in the definition of
vulnerability criteria.
Following this should be an assessment of specific household-level impacts of the crisis on normalpatterns of production and marketing. This often includes an inventory of losses experienced bythe household: proportion of the harvest or herd lost, seed capital and other productive assets lost,damage to irrigation infrastructure, boats and nets lost, etc.
It also should include an enumeration of the main constraints to production currently faced by thehousehold, including labour. Where inputs are needed, it should be carefully considered whether
households simply lack the purchasing power to acquire inputs – a question of access – or whetherthose items are truly absent from local markets – and therefore unavailable. Often the two areconfused and in-kind distributions justified on the basis that items are locally unavailable, when infact they might easily be brought in by traders but there is no effective demand.
Table 11: Sample format for uses of household production by %
Type of foodHousehold
consumptionSale Seed Donation
Repayment
of loanTax
Bean
Groundnut
Rice
Plantain
Sweet potato
Maize
Cassava
Vegetables
Meat
Milk
Wild-collectedproducts

8/9/2019 ACF FSL Manual Final 10
http://slidepdf.com/reader/full/acf-fsl-manual-final-10 77/27075ACF Food Security and Livelihoods Assessment Guideline
Example: Constraints to agricultural production in N Kivu, DRC
In an area affected by civil conflict, the looting of crops in the fields and the absence of physical
security due to the presence of armed groups has affected the ability of women farmers to maintain
and harvest their crops. While people cite the lack of seeds and tools as a constraint to their
production, the overriding constraint to production concerns field access.
An assessment of seed security can be included in the larger assessment of local production
systems in order to anticipate needs linked to supporting agrarian livelihoods. Farmers’ ability to
secure seed of adequate quantity, acceptable quality and diversity and in time for planting is
described as seed security. A suggested question guide can be found in Appendix 22.
Methods for gathering information include: secondary data collection e.g. food and crop
assessments; primary data collection: semi-structured interviews with key informants; focus group
discussions by livelihood groups; household questionnaires; and a range of PRA tools including field
visits and transect walks, seasonal calendars, farm profiles, mapping exercises and proportional
piling. See Appendix 8-11 for a description of these tools.
The following seasonal calendar illustrates the key features of the Karamoja unimodal seasonal
calendar along with the timing of harvest and the hunger season, comparing it with the bimodalcalendar prevalent in the rest of Uganda.
4.4.2 FOOD STOCKS AND RESERVES
Governments in many countries keep emergency or strategic grain reserves on-hand to buffer
price variations and be able to respond quickly to an acute food gap. It is important be appraised of
government policies regarding the size of the stocks and the modalities for their use. Government
food stocks can contribute significantly to food availability in an area for prevention purposes andin the immediate aftermath of a crisis where trade routes and markets have been disrupted, if they
can be rapidly channelled to affected populations.
The size and diversity of trader and household food stocks and their estimated duration can be
appraised visually or in the framework of an interview. The presence or lack of food stocks can help
ACF judge the severity of a food crisis in situations where households lack the economic means to
replenish stocks and/or markets are cut off from their sources of supply.
Figure 10: Example of a seasonal calendar
B i m o d a l
Jul 07 Sep Oct Nov Dec Jan 08 Feb Mar Apr May Jun Jul 08Aug
U n i m o d a l
Second rainyseason began
early
Stable civilsecurity expected
in north
Below-normalharvest occurs
Hunger season tostart early in
Karamoja
1st seasonharvest
2nd seasonharvestbegins
Flooding damagescrops, preventssecond-season
harvesting in the eastAssistanceneeded in
AmuriaKatakwi
Rainy season Rainy season
Rainy season
Rainy seasonRainy season Rainy seasonRainy season
Harvest
Below-normal
Harvest
Hun er season to
Normal dry season o
a l Rainy season

8/9/2019 ACF FSL Manual Final 10
http://slidepdf.com/reader/full/acf-fsl-manual-final-10 78/27076 ACF Food Security and Livelihoods Assessment Guideline
4.5 FOOD ACCESS
Food access is a measure of a household’s ability to acquire available food. It usually refers to
a household’s economic means e.g. having sufficient income to buy food on the market, but it is
also a measure of the strength of a household’s social networks, political status and power within a
community.
Food access acts as useful measure of improved food security and increased income, two key
livelihood outcomes (see highlighted portion in Figure below). Examples of other livelihood outcomes
include: reduced vulnerability, increased well-being and more sustainable use of natural resources.
Some measures of livelihood outcomes that are commonly used in the framework of assessments
are: food utilisation, nutritional status, care practices and coping strategies. These are explored in
sections 4.6 – 4.8.
Because food access is such a broad concept, a range of indicators are used to capture
its different dimensions. They include:
• Sources of food
• Sources of income
• Assets
• Expenditures
• Credit
• Terms of trade
Other indicators of food access are discussed elsewhere in this guideline, including market prices,
household-level production, and coping strategies. These data will allow ACF, in the analysis phase,
to make determinations about which livelihood groups are most food insecure, face the greatest
threats to their livelihood and are considered most vulnerable.
VULNERABILITY
CONTEXT
Influence
& access
LIVELIHOOD
STRATEGIES
LIVELIHOOD ASSETS
STRUCTURES
PROCESSES
• SHOCKS
• TRENDS
• SEASONALITY
TRANSFORMING
STRUCTURES
& PROCESSES
• Levels ofgovernment
• Privatesector
• Laws
• Policies
• Culture
• Institutions
in
order
to
achieve
H
NS
FP
KeyH = Human Capital
N = Natural Capital
F = Financial Capital
S = Social Capital
P = Physical Capital
LIVELIHOOD
OUTCOMES
• More income
• Increasedwell-being
• Reducedvulnerability
• Improved foodsecurity
• More sustainableuse of NaturalResource base
Sustainable livelihoods framework

8/9/2019 ACF FSL Manual Final 10
http://slidepdf.com/reader/full/acf-fsl-manual-final-10 79/27077ACF Food Security and Livelihoods Assessment Guideline
4.5.1 FOOD SOURCES
Identifying household food sources reveals patterns of household access to food and the exposure
or vulnerability of the household to specific threats. For example, if most of the food is drawn from
subsistence production, risks that stem from drought, crop disease, civil conflict preventing access
to fields, illness e.g. HIV/AIDS could be particularly acute. If most of the food is sourced from
markets, associated risks include rises in food prices, collapse of labour markets and other factors
that limit physical or economic access to the marketplace.
Food sources commonly include one or more of the following:
• Production
• Market
• Social networks e.g. gifts
• Exchange and barter
• Gathering wild foods and hunting
• Food assistance
These will vary according to the type of foodstuff and should be specified accordingly. For example,
maize, cassava tuber and beans could be sourced from own production; while oil, dried fish andvegetables sourced from market.
Table 12: Food access checklist
Area of analysis Key issues to consider Method/ source Tool
Food sources• Normal food sources• Changes to food sources
• Seasonality
• Focus groupdiscussions
• Householdquestionnaire
• Proportional piling orranking
• Seasonal calendar
Income sourcesand assets
• Changes in remittances• Changes in type and diversity
of income sources• Loss/sale of productive and
non-productive assets• Seasonality
• Focus groupdiscussions
• Householdquestionnaire
• Proportional pilingor ranking
• Seasonal calendar
Expenditures• Changes in patterns of
expenditure• Seasonality
• Focus groupdiscussions
• Householdquestionnaire
• Proportional pilingor ranking
• Seasonal calendar
Credit
• Changes in access to credit
• Debt liability• Seasonality
• Focus group
discussions• Householdquestionnaire
• Seasonal calendar
Terms of trade
• Market prices for staple foods• Market prices for cash crops
and livestock• Local wage rate
• Key informants(traders)
• Householdquestionnaire
• Market survey
Coping strategies• Range of food and livelihood-
related strategies employed byhouseholds to manage crisis
• Key informantsand focus groups
• Householdquestionnaire
• Coping StrategiesIndex (CSI)

8/9/2019 ACF FSL Manual Final 10
http://slidepdf.com/reader/full/acf-fsl-manual-final-10 80/27078 ACF Food Security and Livelihoods Assessment Guideline
Most often, sources of food will vary according to season and may also have changed as a result of
the crisis or shock. Using the seasonal calendar, details on food sources for each of the seasons
(rainy season, dry season) should be gathered. Changes in household sources of food as a result of
the crisis also need to be specified.
Methods
Household-level information on sources of food is gathered using the household questionnaire. The
seasonal calendar, proportional piling and ranking exercises are useful tools to support the data
collection. The data can then be analyzed by livelihood group to enable the identification of specific
vulnerabilities related to how groups source their food in normal times and currently.
4.5.2 INCOME SOURCES AND ASSETS
Productive assets are most commonly enumerated as part of the typology of household food
production systems (see 4.4.1).
Changes to broad asset profiles that have been suffered as a result of acute or chronic crisis can
be illustrated using an asset hexagon structured by livelihood or access group (see 4.2.1 and
Appendix 21).
Information on income sources is gathered in places where household economies depend at least
in part on the market for food and other goods. This is especially true in urban contexts. Analysis of
market price data together with information on which groups are most reliant on markets for income
and food helps to clarify the risks to which different groups are exposed.
Income sources commonly include one or more of the following:
• Sale of cash crops • Salaried work
• Sale of livestock or livestock products • Petty trade and commerce
• Sale of any other produce, wild foods, • Loans
fisheries, honey, handicrafts, services• Casual labour • Gifts and aid
• Skilled labour • Remittances
BOX: REMITTANCE AS INSURANCE MECHANISM IN SITUATIONS OF CRISIS
Remittances are sums of money or goods transferred between migrants and their places of
origin. Remittance flows are particularly significant for the world’s poorest countries and are
central to millions of households’ livelihood strategies.
Migrants make transfers through banks or companies such as Western Union. But the bulk of
remitters worldwide rely on informal hand delivery (home visits, friends or relatives, transporters)
and cash transfers through businesses, microfinance institutions and migrant associations.
Humanitarian crisis and conflict that disrupt remittance flows can profoundly impact
vulnerability. In other cases, remittances that remain stable during crisis can serve as insurance,
allowing a household to meet basic consumption needs and playing an important part in
survival and recovery. Research shows that remittances are often counter-cyclical – increasing
during periods of crisis in response to need. Understanding the significance of remittances in
pre-crisis livelihoods and how they are affected by disaster is an oft-neglected but essential
component of needs assessments.
(continued on page 79)

8/9/2019 ACF FSL Manual Final 10
http://slidepdf.com/reader/full/acf-fsl-manual-final-10 81/27079ACF Food Security and Livelihoods Assessment Guideline
Sources of income may vary according to season and are likely to have changed as a result of the
crisis or shock. Changes in sources of household income as a result of the crisis and their relative
importance need to be assessed. See below for a sample format.
(continued from page 78)
Example: In recent years, run-away inflation and exchange rate controls in Zimbabwe have made
remitting money nearly impossible: an entire industry of ‘transporters’ has risen up to facilitate
in-kind transfers from South Africa. The closure of the border between Sudan and Libya has
dramatically cut down access to international remittances in Darfur, making domestic transfers
from Khartoum and elsewhere increasingly important.
Reference: K. Savage and P. Harvey: Remittances during crises: implications for humanitarian
response. ODI, HPG Policy Brief 26, June 2007.
Income sourceReference period(PP score)
Current(PP score)
Own Production
• Livestock (live animal, milk, butter,honey, hides, ox rental)
• Fishing (fish, crab, shrimp)
• Crop (Cereals, Pulses, Oil seeds& Vegetables)
Self-employment (small business)
Petty trade
Sale of charcoal/ firewood
Casual labour
Remittance
Loan
…
Table 13: Sample format for changes in sources of household income by %
1. How many household members currentlyearn income for the household?
2. How many different sources of income doesyour household currently have?
3. How many different sources of income did yourhousehold have in an earlier reference period?
4. What is each of these income sources? How much did each source contribute to total household incomein the last month, and in the earlier reference period? [Use proportional piling to represent the contributionof each source. Record score below. Note incomes that are purely seasonal or temporary.]

8/9/2019 ACF FSL Manual Final 10
http://slidepdf.com/reader/full/acf-fsl-manual-final-10 82/27080 ACF Food Security and Livelihoods Assessment Guideline
N.B. Information on changes to sources of income normally provides sufficient insight into the
household economy without quantifying actual income levels. It is generally not recommended to use
the household questionnaire to gather information on income levels, as this data is likely to be
biased and unreliable. If income data is desired, trusted key informants in the local community can
provide general information on wage and price levels for the most common occupations and types
of commodities that provide revenue in the community.
Example: Change in income sources following civil conflict/displacement in N Kivu, DRC
Many families have been forced to flee their villages, where they had practiced subsistence
agriculture. This population now mainly relies on daily agricultural labour. The resident population
has diminished access to their fields due to civil disturbance. Sale of cash crops on local markets,
previously an important source of income, has diminished. Daily wage rates have declined as a
result of the rise in labour supply and the decline in demand for waged labour. Increasingly, families
are resorting to credit to cover basic food needs – although moneylenders are hesitant lend to
displaced households who they do not know, heightening the vulnerability of this group.
Methods
Household-level information on sources of income is gathered using the household questionnaire.
Proportional piling and ranking exercises are useful tools to support the data collection.
Understanding the changes in income sources for various groups who rely on the market (e.g.
producers of cash crops, waged labourers, charcoal producers), together with information on food
sources and market prices, allows ACF to identify the specific risks and vulnerabilities linked to the
livelihood strategies of different groups.
4.5.3 EXPENDITURES
Information on changes in patterns of household expenditure can be gathered in the same way as
for income sources, using ranking and proportional piling. Expenditures commonly reflect the samepatterns of change as do income sources. See below for a sample format.
N.B. Collection of quantitative expenditure data (amounts spent on different expense categories) is
not considered necessary.
ItemsReference period(PP score)
Current(PP score)
Food*
Fuel
Water
Education
Health
Transport
Purchase of productive assets
Community obligations
…
1. Of total household expenditure, what was the share of each item in the last month, and in the earlierreference period? [Use proportional piling to represent the share of each item. Record score below.Note expenditures that are seasonal or exceptional.]
* Within food expenditure, differentiate and rank: staple cereal/tuber, pulse, oil, animal product
Table 14: Sample format for changes in patterns of household expenditure by %

8/9/2019 ACF FSL Manual Final 10
http://slidepdf.com/reader/full/acf-fsl-manual-final-10 83/27081ACF Food Security and Livelihoods Assessment Guideline
4.5.4 CREDIT AND DEBT LIABILITY
The availability of credit from formal or informal moneylenders, community or family members
is particularly important to analyze, as accessing credit can be an essential coping strategy for
households whose sources of income are constrained and whose home production is insufficient to
meet consumption needs. Regarding credit, it is important to gather information on:
• Sources of available credit
• Who has access to it
• Uses of credit e.g. primarily for consumption purposes
• Average debt liability by livelihood group
• Seasonality
• Impact of the crisis on sources of credit and debt load
Table 15: Sample format for changes in debt liability by %
1. Does your household currently have any outstanding foodor money debts?
If yes, to whom do you owe money or food? (tick all that apply)
a. Bank/ other formal financial institution
b. Informal money lender
c. Local shop
d. Landlord
e. Family, friends or community members
2. Of these sources, are there any who will no longer lend to you? If sowhich ones? (note the letter of the source)
3. What are the primary uses for the credit? (tick all that apply)
a. Food
b. Health
c. Water
d. Other (specify)
4. What is your debt liability currently and in an earlier reference period?Referenceperiod
Current

8/9/2019 ACF FSL Manual Final 10
http://slidepdf.com/reader/full/acf-fsl-manual-final-10 84/27082 ACF Food Security and Livelihoods Assessment Guideline
4.5.5 TERMS OF TRADE
In communities that trade without cash or depend on mixed economies, it will be important to record
the terms of trade between essential commodities. A local standard may already exist in areas where
it is common practice to track terms of trade, for example between a sac of sorghum and a male goat
expressed as a ratio 1:1.
Terms of trade is the ratio between the value of a key commodity which is sold by a household e.g.
a small ruminant, and the value of a key commodity purchased by a household e.g. kilograms maize
flour. Income data on various groups allows for the identification of major sources of income in the
surveyed area, e.g. herding, groundnut or sesame production, casual labour markets. Price data
allows for the calculation of changes in the terms of trade for the major commodities exchanged by
different livelihood groups (see 4.3).
Terms of trade are a useful indicator of changes in household purchasing power. This data may
already have been gathered in the framework of the market survey.
See Appendix 19 for a more detailed discussion of Terms of Trade calculations.
4.6 FOOD CONSUMPTION
Measures of food consumption reflect the energy and nutrient intake of individuals and households.
Household level food consumption patterns are generally considered a proxy indicator of food
access; while individual level consumption is considered a proxy for food utilisation, as measures are
more closely correlated with nutrient adequacy of the diet.
EXAMPLE: TERMS OF TRADE IN BURKINA FASOTerms of trade (TOT) in the eastern province of Tapoa, Burkina Faso are based on sacs of cereal
that can be purchased with the sale of livestock. The most common TOT indicator compares the
price of a ram or goat to a 100 kg bag of white sorghum. Pastoral and agropastoral communities,
government structures and agencies responsible for surveillance of the pastoral zones routinely
refer to the TOT indicator to judge the food security situation in the area.
A minimum livestock/cereal threshold is recognized below which household food access is
considered insufficient. The threshold depends on the amount of cereal that the average house-
hold requires and other expenses that must be covered from the sale of livestock. In Tapoa, the
standard TOT threshold is expressed as 1:1 for goats to cereal, and 1:2 for rams to cereal. A 100
kg bag of sorghum or millet is considered sufficient for a household for a month. If the price of
sorghum rises relative to livestock, this translates to worsening terms of trade for pastoralists.
At the start of the lean season in February, the average price of a sac of sorghum across Tapoa
was 11,200 XOF. Goat and ram prices were 16,417 XOF and 44,167 XOF, respectively. A
household was able to purchase 1½ sacs with the sale of a goat (TOT of 1:1.5), or 4 sacs of
cereal with the sale of a ram (TOT of 1:4). Over the next months in keeping with seasonal patterns,
livestock prices fell slightly relative to cereals and TOT for goat/sorghum and ram/sorghum
deteriorated to 1:1.3 and 1:3, respectively.
Source: Surveillance Program, ACF Burkina Faso, 2009.
TOT Feb-09 Mar-09 Apr-09
Goat/sorghum 1.46 1.30 1.32
Ram/sorghum 3.94 2.76 2.82

8/9/2019 ACF FSL Manual Final 10
http://slidepdf.com/reader/full/acf-fsl-manual-final-10 85/27083ACF Food Security and Livelihoods Assessment Guideline
Patterns of household-level food consumption are strongly conditioned by traditional habits and the
cultural and religious beliefs that influence choices about food. Even when households have access
to sufficient food in their environment, food taboos and traditions can restrict usage to certain foods
and for individual members of the household based on age, gender, working status, etc. Food habits
and traditions, household sharing priorities, infant and young child feeding practices and other
measures of food utilisation affecting the individual are explored in section 4.7.1.
ACF recommends using more than one indicator of food access and consumption in the FSL
assessment, as each indicator captures a different aspect of the experience of food insecurity. The
number and combination will vary according to the specific objectives of the survey. An assessment
of changes in food sources and meal frequency is considered a minimum information requirement.
This is usually combined with a measure of diet diversity to serve as a baseline for future
monitoring of the evolution of the context. In rapid assessments that do not use household
questionnaires, ACF focuses on changes in food sources as the principal indicator of food access.
Table 16: Food consumption checklist
Area of analysis Key issues to consider Method/ source Tool
Meal frequency
• Change in number of mealstaken per day
• Standard definition ofa meal
• Seasonality
• Householdquestionnaire
• Seasonal calendar
Householddietary diversity
• Diversity of foods consumedby the household
• Economically important foodcategories that correlate withHH purchasing power
• Vitamin A and iron-rich foodconsumption
• Seasonality• Trends
• Householdquestionnaire
• Focus groupdiscussion
• Household dietarydiversity index(HDDS)
Individualdietary diversity
• Diversity of foods consumedby specific vulnerablemembers of the householde.g. lactating women,children <5 years
• Vitamin A and iron-rich foodconsumption
• Prevalence of childrenmeeting minimum threshold
• Seasonality• Trends
• Householdquestionnaire
• Individual dietarydiversity index (IDDS)
Household foodconsumption
• Diversity and frequency offoods consumed by thehousehold
• Macronutrient adequacyof diet
• Prevalence of “Poor” foodconsumption according topreset threshold
• Seasonality• Trends
• Householdquestionnaire
• Food consumptionscore (FCS)

8/9/2019 ACF FSL Manual Final 10
http://slidepdf.com/reader/full/acf-fsl-manual-final-10 86/27084 ACF Food Security and Livelihoods Assessment Guideline
4.6.1 MEAL FREQUENCY
Changes in the number of meals that a family takes before and after a shock can be a simple and
powerful indicator of changes in their food security. Measuring meal frequency can also serve to
differentiate segments of the population who may have differing access to food in situations of
chronic instability and crisis. In order to account for seasonality, it is best to compare the household’s
current situation with the same time period in the previous year.
The definition of a meal should be agreed upon and used consistently by enumerators. What
constitutes a “meal” can vary by cultural context: in many places only the consumption of the
traditional staple taken with other dishes is considered a meal and reported as such by households
e.g. rice or wheat in Asia; boiled cassava, millet, plantain or maize paste in Africa. Children may
snack during the day on available or scavenged foods (sugarcane, green mangos, boiled tubers,
etc.) and take a single “meal” at night time.
The number of meals taken by adults and children within the same household may vary and is
usually analyzed separately.
4.6.2 DIETARY DIVERSITY
The number of different food groups consumed by an individual or collectively by a household over
a given reference period is known as dietary diversity. In recent years, household diet diversity has
been increasingly used in food security assessments; research has shown that diet diversity is a
good proxy indicator – well correlated with – a household’s socioeconomic status. Even in very poor
households, higher food expenditure resulting from additional income is associated with improved
quantity and quality of the diet.
A more diversified diet has been found to be highly correlated with:
• Improved quality of the diet: protein adequacy, percentage of protein from animal source foods,micronutrients
• Improved caloric adequacy of the diet
• Improved health outcomes for children: improved birth weight, child nutritional status, and blood
haemoglobin concentrations [iron status]
• Household income
More field-based research is needed to confirm the relevance of household food consumption
patterns as a food access indicator. Food preferences are highly context-specific. In some cases
diet diversity has been found to vary inversely with income, with wealthier households purposelyrestricting their intake to a few high-value foods e.g. meat, refined cereals; and poorer households
relying on a wide-ranging and highly diverse diet that includes wild-collected and seasonal foods in
order to meet their caloric needs.
Dietary diversity is assessed within the framework of the household questionnaire using a choice of
3 tools: the Household Dietary Diversity Score (HDDS), the Individual Dietary Diversity Score (IDDS)
and the Food Consumption Score (FCS). The tools are described below. See Box below and
comparison matrix in Appendix 25 for key differences between the tools.

8/9/2019 ACF FSL Manual Final 10
http://slidepdf.com/reader/full/acf-fsl-manual-final-10 87/27085ACF Food Security and Livelihoods Assessment Guideline
4.6.2.1 HOUSEHOLD DIETARY DIVERSITY SCORE
The Household Dietary Diversity Score (HDDS) tool measures the number of food groups a
household consumes over a reference period. It serves as a proxy indicator of household foodaccess. Measuring dietary diversity is relatively simple: information requirements are small and do
not require collecting or analyzing exhaustive data sets on food consumption habits. Measurements
of diet diversity provide a snapshot of current household diet patterns and can serve as a tool for
establishing baseline trends tracking seasonal changes and recovery rates among the
surveyed population.
NB. Beware of the confounding effect of food aid on household dietary diversity scores.
4.6.2.2 INDIVIDUAL DIETARY DIVERSITY SCORE
The Individual Dietary Diversity Score (IDDS) tool measures the number of food groups anindividual consumes over a given reference period, usually the previous 24 hours. The IDDS serves
as a proxy indicator for nutritional quality, most commonly for young children and women of
reproductive age. The IDDS is more closely correlated with nutrition status and care practices than
with food access. Breastfeeding tends to confound the scores of young child and only
non-breastfed children should be surveyed. The number of non-breastfed children in the survey
sample population needs to be sufficiently large to ensure representative results.
BOX: DECIDING BETWEEN THE HDDS, IDDS AND FCS TOOLS* HDDS is a proxy indicator of household food access as the food groups are chosen to reflect
economically important food categories that correlate with household purchasing power. The tool
can also be refocused on nutrient adequacy by altering food grouping and placing greater
emphasis on energy-dense or micronutrient-rich foods. HDDS does not capture the nuances of
intra-household distribution of food and caution should be exercised in extrapolating findings
from households to individuals.
* FCS is a proxy of household dietary adequacy focusing principally on macronutrients and
energy. The nutrient density weights are designed to reflect the macronutrient density of typical
quantities consumed. The tool does not capture the nuances of intra-household distribution of
food and caution should be exercised in extrapolating findings from households to individuals.
* IDDS is a proxy for individual nutrient adequacy. It is useful for capturing intra-household
differences in food consumption habits and for highlighting consumption patterns that are
deficient in micronutrient-rich foods. Caution in extrapolating evidence of nutrient-poor diets of
individuals to explain outbreaks of micronutrient deficiency (vitamin A, iron) at the population
level.
The three tools are complimentary and their choice will vary depending on the specific
assessment objective (e.g. rapid classification of a population by food access) and context (e.g.
suspected outbreak of goitre or scurvy). Where objectives are multiple, it is possible to combine
tools as long as the recall period and food groupings are uniform (for instance HDDS and IDDS),
in which case enumerators need to be well trained on the separate objectives and different
modalities that are required to administer the tool.

8/9/2019 ACF FSL Manual Final 10
http://slidepdf.com/reader/full/acf-fsl-manual-final-10 88/27086 ACF Food Security and Livelihoods Assessment Guideline
4.6.2.3 FOOD CONSUMPTION SCORE
The Food Consumption Score (FCS) tool serves as a proxy of household dietary adequacy. The FCS
is a composite indicator measuring 3 separate elements: 1) dietary diversity, 2) food frequency – the
number of days on which a particular food group is consumed over the reference period, and 3) the
relative nutrient quality of the different food groups. To capture nutrient quality within the FCS,
standard weights are assigned to each of eight recommended food groups. These weights reflectthe relative nutritional importance of the groups in the diet or their so-called ‘nutrient density’: the
overall quality of the diet in terms of caloric density, macro and micro nutrient content taking into
account the actual quantities typically eaten. Consequently the FCS tool is considered a relatively
strong proxy indicator for diet quality and quantity7. While standardized thresholds for the
classification of food security status exist, the relevance of the thresholds across all contexts is still
debated and field research suggests that meaningful cut-offs need to be developed locally.
Methods
Dietary diversity is assessed in the framework of the household questionnaire. See Appendix 23 for
guidance on the household dietary diversity score (HDDS) and individual dietary diversity score
(IDDS) tools; Appendix 24 for guidance on the Food Consumption Score (FCS) tool; and Appendix25 for a comparison matrix of HDDS, IDDS and FCS.
4.7 FOOD UTILISATION AND CARE PRACTICES
Food utilisation refers to a household’s use of the food to which it has access, including food
storage, processing and preparation as well as its distribution within the households. It also refers
to an individual’s ability to absorb and metabolize nutrients, which can be affected by disease and
malnutrition.
Household food utilisation is influenced by care practices within the home and the household’s
access to water, sanitation and hygiene, which in turn are key determinants of nutritional status.Food utilisation constitutes one of the three core pillars of food security at the individual level, as
discussed in the framework approaches presented in Chapter 1.
7 Recent evidence suggests the Food Consumption Score is more closely correlated with diet quality than with calorieconsumption. IFPRI, 2009. See: Validation of the World Food Programme’s food consumption score and alternative indicatorsof household food security. http://www.ifpri.org/publication/validation-world-food-programme-s-food-consumption-score-and-alternative-indicators-hous

8/9/2019 ACF FSL Manual Final 10
http://slidepdf.com/reader/full/acf-fsl-manual-final-10 89/27087ACF Food Security and Livelihoods Assessment Guideline
4.7.2 CARE PRACTICES
The concept of food utilisation includes a range of care practices – culturally-prescribed behaviourswithin the home that have important implications for the health and nutrition status of individualmembers of the household.
Care practices include:• Infant and young child feeding practices• the ways in which food is stored, processed and prepared at the household level• food habits, taboos and interdictions• food sharing practices within the household• the care of sick children and adults and the elderly• hygiene practices• access to clean water and sanitation
Area of analysis Key issues to consider Methods/ sources
Food storage,processing andpreparation
1. Storage and processing practices2. Types of losses
3. Fuel type used for food preparation4. Water source used for food preparation5. Hygiene practices6. Seasonality
Infant and youngchild feedingpractices
7. Prevalence of breastfeeding in children 0-1 yr8. Changes in the total number of women
breastfeeding since crisis9. Age of introduction of complementary foods
10. Types of complementary foods given toinfants <1 yr in order of priority
Food habits, taboosand interdictions
11. Food culture and traditions
12. Health and nutrition knowledge of mothers13. Interdictions with regard to pregnant/
lactating women and young children
Food sharingpractices
14. Intra-household food allocation prioritiesbased on age, gender, health or workingstatus
Care practices of thesick and elderly
15. Types of food given16. Responsibilities for care-giving among
the active HH members17. Other types of care
Water access
18. Sources
19. Quality and quantity available20. Cost
Public healthsituation
21. Changes in access to or quality of healthcare22. Incidence and severity of major outbreaks
Malnutritionprevalence
23. GAM/SAM rates24. Aggravating factors & contextual elements25. Caseload
Table 17: Food utilisation checklist
Secondary information sources:• Reports published bynational and internationalagencies
• Joint assessment reports• Nutrition surveys
Key informant sources:• Qualified health professionals• Traditional birth practitioners• Community health workers
Focus groups:• Women-only groups
Household questionnaire

8/9/2019 ACF FSL Manual Final 10
http://slidepdf.com/reader/full/acf-fsl-manual-final-10 90/27088 ACF Food Security and Livelihoods Assessment Guideline
WHO has published a set of recommendations on optimal infant and young child feeding practices
that are summarized in the Box below.
As part of secondary data review, information is gathered on the broad health environment. Note that
any suggestion of a potential relationship between care practices and nutritional status needs to be
considered in light of the prevailing public health situation. Reported outbreaks of measles or
diarrheal disease will have a direct and immediate impact on child nutritional status.
In the example below, infant feeding practices are assessed in post-tsunami Indonesia.
OPTIMAL INFANT AND YOUNG CHILD FEEDING RECOMMENDATIONS (WHO GLOBAL STRATEGYFOR INFANT AND YOUNG CHILD FEEDING 2003)*
The aim is to create and sustain an environment that encourages frequent breastfeeding for
children two years and beyond.
• Infants should initiate breastfeeding within one hour of birth
• Infants should be exclusively breastfed (with no food or liquid other than breastmilk, not even
water) for the first six months of life
• Introduction of nutritionally adequate and safe complementary foods should begin at six months
• Breastfeeding should continue until the child is at least two years old and beyond
* These recommendations exclude HIV + mothers, for whom WHO has published separate
guidelines.
EXAMPLE: ASSESSING INFANT FEEDING PRACTICES IN INDONESIA’S NUSA TENGGARATIMUR PROVINCE
Interviews were held with mothers who have children under age 5 as well as with medical staff
and traditional healers to gather information on infant feeding practices. It was found that:
• Colostrum is given after birth or sometimes discarded. In Sumba Barat, colostrum is
considered dirty and mothers do not give it to their infant. Exclusive breastfeeding is usually
practiced during the first month, after which liquids such as tea with sugar or powdered milk
are added to the diet. According to mothers, the amount of breastmilk is not sufficient for
infant needs.
• At 3-4 months of age, complementary foods are introduced to coincide with the mother’s
return to economic activities (working in the field, fetching water). Weaning is done with the in-
troduction of rice porridge. Families will prioritize commercial products (powdered milk,
porridge) over local products whenever they can afford to purchase them. Most mothers will
end breastfeeding between 1/2 and 2 years. Staple foods given to the child are rice or corn,cassava, banana leaves and papaya leaves – the same as for adults.
Early introduction of complementary foods and low diet diversity were found to be partly
responsible for high rates of children underweight, together with high prevalence of diarrhoea
and malaria (42% prevalence low WAZ).
Source: ACF 2006 - Nutrition, Food Security and Water & Sanitation Assessment,
NTT Province, Indonesia.

8/9/2019 ACF FSL Manual Final 10
http://slidepdf.com/reader/full/acf-fsl-manual-final-10 91/27089ACF Food Security and Livelihoods Assessment Guideline
Methods
Care practices are examined via secondary data collection, key informants and women-only focus
groups. ACF nutrition staff should be involved in the design and analysis of questions on thesetopics. See Appendix 9 for a question guide template on nutrition, health and care practices.
4.7.3 WATER ACCESS & AVAILABILITY
Water is considered one of the essential food nutrients, making secure access to clean drinkingwater one of the major determinants of health. Household-level access to water resources for
consumption purposes needs to be probed as part of an investigation of food utilisation.
The following are key considerations when assessing water access and availability:
• Sources • Quality
• Distance to primary water source • Cost
• Availability • Seasonality
Methods
Questions around community and household-level water access are explored through focus groupdiscussions and/or the household questionnaire. Transect walks and observation are useful tools totriangulate the information. See Appendix 4 for a description of WASH indicators, definitions andthresholds and Appendices 8-10 for interview guide templates.
4.7.4 NUTRITIONAL STATUS
Nutrition in food security & livelihood assessments
ACF nutrition programs target specifically, but not always exclusively, acute malnutrition. Acutemalnutrition results from risk factors that are directly related to an unfolding crisis situation and willlead to rapid loss of life in the absence of intervention.
Food security and livelihood assessments as a rule generally will not include anthropometry – whichis the measurement of height, weight, skinfold thickness and other key indicators of nutritionalstatus. Taking accurate anthropometric measurements requires training, specialized equipment and
specific sampling methodologies, all of which remain the specialty of trained nutritionists.
EXAMPLE: ASSESSING WATER RESOURCES IN MYANMAR’S IRRAWADDY DELTA
In normal times, hand-dug rainwater catchment ponds are the main source of drinking water forsubsistence fishing and rice-cultivating communities living in Myanmar’s Irrawaddy Delta zone.
These communal water reserves are located adjacent to the villages.
During the passage of Cyclone Nargis in 2008, community ponds became contaminated fromthe tidal surge of saline sea water. People resorted to using the few remaining uncontaminatedponds for both human drinking purposes and livestock since traditional ways of coping with watershortage, including water purchase, were not available. Water quality rapidly declined. Availability also became limited as the dry season drew on and water levels went down.
Communities responded to the water emergency by rationing water usage and sharing acrossneighbouring villages. Agencies supported the community response with the delivery ofunsalinated water pumped from riverways in other parts of the Delta, and the distribution ofreverse osmosis systems.

8/9/2019 ACF FSL Manual Final 10
http://slidepdf.com/reader/full/acf-fsl-manual-final-10 92/27090 ACF Food Security and Livelihoods Assessment Guideline
Meanwhile, FSL assessments do need to include the gathering of any available nutritional data
during the course of secondary data collection, as well as an analysis of this data and the overall
nutritional situation in the final report. This means consulting internally with the ACF nutrition team
or with other agencies, or both, at the stage of secondary data collection regarding the results of
nutrition surveys recently conducted in the affected area. Adapted responses to the presence of
malnutrition in an area often include food security and livelihood programs and therefore nutrition
data must be considered.
Interpreting nutrition data in terms of the Causal Framework
Household food security is one of the three underlying causes of malnutrition according to the Causal
Framework of Malnutrition (Figure 1), together with the public health environment and care
practices. If the assessment team is able to account for the health and care determinants of
malnutrition, then it becomes possible to use the prevalence of acute malnutrition to judge the
severity of food insecurity in a population.
A good way to judge the health environment is whether there have been reported outbreaks among
the affected populations e.g. measles or acute diarrheal disease. Barring major disease outbreak or
a significant change in people’s access to or quality of health care, it is unlikely that a suddendecline in nutritional status has occurred as a result of disease. Similarly, to assess major changes
in or degradation of the social and care environment, it is important to note any large-scale
population displacements that can have damaging effects on care behaviours. Maternal
psycho-social health following massive trauma, or new crisis-related demands on maternal time
such as walking long distances to fetch water or fuel can also affect mothers’ ability to produce
sufficient breastmilk or provide proper care to their children.
In slow-onset emergencies, nutrition surveys are conducted in order to assess the prevalence of
malnutrition. They may also be used to confirm the severity of food insecurity in the area, as long as
health and care determinants are accounted for. In the framework of a FSL assessment, information
on the prevalence of acute malnutrition in a population is gathered during the secondary data review
phase and in consultation with agencies that have carried out nutrition surveys in the affected area,including ACF. Care should be taken to consider the impact of factors such as seasonality and the
presence of underlying chronic disease such as high rates of HIV/AIDS infection when interpreting
the reported prevalence of acute malnutrition.
Measuring MUAC
Occasionally, food security and livelihood teams may be the first ones to arrive into a new area and
are called on to carry out a measurement of Mid-Upper Arm Circumference (MUAC) if risk factors for
malnutrition are thought to be present.
Training and support from nutrition team members is required in order to effectively deploy this toolin the field, including sampling design, proper use of the tool, and analysis of results. See Appendix
2 and 3 for a discussion of nutrition indicators including MUAC and associated thresholds and methods.
8 For example, improving the targeting and quality of food distribution, improving access to a diversity of locally available foodsthrough cash-based interventions, agricultural programs, support to income generation, support to market systems, etc.9 Young et al., 2001: Food security assessments in emergencies: a livelihoods approach. Humanitarian Practice Network(HPN) Paper.

8/9/2019 ACF FSL Manual Final 10
http://slidepdf.com/reader/full/acf-fsl-manual-final-10 93/27091ACF Food Security and Livelihoods Assessment Guideline
Examining micronutrient deficiencies
Teams may also be called on to collect information on micronutrient deficiencies such as scurvy,
night blindness, goitre and severe anaemia whenever outbreaks are anticipated or suspected likely
e.g. restricted camp settings, snow-bound mountain communities, etc. The data is important for
designing a proper food aid ration, blanket feeding intervention or micronutrient supplementation
programs.
Methods
Information is collected through secondary sources and interviews with key informants such as
public health officials and medical staff. Direct assessment of the quality of people’s diets will also
provide key insight into the nature of the potential deficiency or deficiencies with the use of tools such
as the IDDS and HDDS. See Appendix 23-24 for a description of the tools.
4.8 COPING STRATEGIES
Household responses to food shortage include behaviours such as changing food sources and
rationing food that appear to be widespread and nearly universal across different cultural contexts.These responses – or coping strategies – are the actions people take to manage food shortage and
other shocks to the household. Household-level coping strategies are most often used as a proxy
indicator of food access and livelihood security.
Strategies do not only relate to managing food shortage: households will also undertake a range of
economic coping strategies that are intended to preserve assets and prevent destitution, such as
buying on credit and migrating for labour. Consumption coping strategies can be engaged by all
households regardless of their sources of livelihoods and assets holdings (including social capital),
whereas the ability to engage livelihood coping strategies varies by these factors. For example, if a
household indicates that they have not borrowed money from informal money lenders, this may have
very different meanings in terms of the household’s food security status - either they did not needto or they lack the credit worthiness to do so. In urban and peri-urban contexts there is a pronounced
need to distinguish between consumption and livelihood coping due to the diversity and
complexity of livelihood sources, available opportunities and assets.
When irreversible strategies are employed such as the sale of capital assets or distress migration,
this usually indicates a situation of severe crisis. Strategies that are irreversible, damaging to
people’s livelihoods or their dignity, and that may permanently undermine future food security and
livelihoods are sometimes referred to as crisis, distress or survival strategies.
Distress mechanisms should be distinguished from adaptive mechanisms, which are measures used
to manage and minimize the risk from chronic food insecurity and recurring situations. Adaptation
is a process of adjustment to a longer-term solution, for instance pastoralists moving to areas ofbetter rainfall and pasture growth, or displaced agriculturalists becoming petty traders and casual
labourers. Adaptation strategies often lead to the development of new livelihoods, and over the long
term may naturally follow from the adoption of distress strategies when old livelihoods are forcibly
abandoned.

8/9/2019 ACF FSL Manual Final 10
http://slidepdf.com/reader/full/acf-fsl-manual-final-10 94/27092 ACF Food Security and Livelihoods Assessment Guideline
The table below suggests a classification of common consumption and livelihood strategies by
severity of behaviour.
* Adapted from Hunger Watch
DEFINITIONS
Adaptive mechanisms are measures used to manage and minimize the risk from chronic food
insecurity and recurring situations. Adaptation is a process of adjustment to a longer-term
solution, for instance pastoralists moving to areas of better rainfall and pasture growth.
Coping mechanisms are temporary responses to reduce or minimize effects of a stressful event
or an unfavourable situation where food access is abnormally disrupted, for instance by drought,flood, earthquake or military activity. Consumption and livelihood coping mechanisms are often
distinguished.
Distress mechanisms, also known as crisis or survival mechanisms in their more radical form,
are measures that households will undertake in response to severe crisis that are largely
irreversible, damaging to people’s livelihoods or their dignity and that may permanently undermine
future food security and livelihoods. They are an extreme form of a coping mechanism.
Preferred foods refer to foods of a particular form (e.g. whole rice vs. broken rice); type of
staple (e.g. millet vs. corn); or quality (e.g. meat or fish). People will often switch to less preferred
foods in the less severe stages of food insecurity, reducing quality to maintain the same level of
consumption.
Undesirable foods refer to foods consumed only under extreme hardship or so-called famine
foods, e.g. wild foods not normally consumed, immature crops, seed stock. Consumption of
these foods is associated with severe food insecurity and a food crisis.
Consumption strategies Livelihood strategies
Adaptive(generally sustainableand reversible)
• Rely on less expensive/ less preferred foods• Gathering or hunting of nutrient/ calorie-rich
foods• Slightly reduce food consumption (e.g. limit
portion size, reduce number of meals in a day)• Reduce expenditure on non-food, nonessential
items• Increase consumption of staple items vs.
non-staple items• Minor reduction of diet diversity
• Borrow food, or cash to buy food, fromneighbour/friend
• Buy food on credit (with expectation of ability topay back)
• Atypical short-term, short-distance migration• Engage in atypical petty trade (e.g. firewood
collection)• Engage in non-preferred wage labour• Slight sales of asset stocks (with expectation
of renewal)• Adapting agricultural practices (e.g. planting
quick-maturing annuals, switching tosubsistence crops)
Distress(some notsustainable orreversible,depends on degree)
• Harvest immature crops• Moderately reduce food consumption• Consume next season's seed stocks• Devote all or nearly all cash resources to staple
food purchase• Gathering or hunting of nutrient/
calorie-poor foods• Send family members (especially children) to
richer relatives• Major reduction of diet diversity• Begging
• Removing children from school• Child labour• Moderate to heavy sales of productive
asset stocks• Atypical long-term, long-distance
labour migration
Survival(unsustainable,
irreversible, high risk)
• Drastically reduce food consumption (e.g. restrictconsumption by adults in order for small children
to eat, skip eating for entire days)• Severe reduction of diet diversity
• Complete sales of assets
• Widespread migration to search for money/food
Table 18: Coping strategies by level of severity
Type ofcoping strategy
Examples of Observed Behaviour

8/9/2019 ACF FSL Manual Final 10
http://slidepdf.com/reader/full/acf-fsl-manual-final-10 95/27093ACF Food Security and Livelihoods Assessment Guideline
The Coping Strategies Index (CSI) is a tool for rapid measurement of household food security in
humanitarian emergencies. It enumerates both the frequency and severity of coping strategies of
households faced with short-term insufficiency of food, with a focus on the enumeration of
consumption-related strategies.
Information generated by the CSI allows for the assessment of relative prevalence of household food
insecurity across livelihood groups or zones e.g. for the purpose of geographic and household
targeting. It also allows for the detection of changes in the food insecurity situation of a population
over time e.g. for monitoring and evaluation purposes.
Because the scoring across the population reflects a relative ranking, CSI is not an absolute
assessment of food insecurity in a population and needs to be triangulated with other indicators
such as HDDS and food sources. The CSI is an appropriate tool for emergency situations because
it is a relatively fast and simple way to collect and analyze information on transitory responses to
food shortage.
Methods
This module is included as part of the household questionnaire. It can also be adapted as a PRA tooland used in focus group settings to capture community-level prevalence of various strategies. It
requires consultation with key informants and focus groups to gauge the relative severity of
strategies used in the local context. See Appendix 26 for detailed guidance on the use of the CSI tool.
4.9 PARTICIPATORY VULNERABILITY AND CAPACITY ANALYSIS
Assessing community-wide vulnerability to hazards is important for a complete understanding of
the vulnerability context and its relationship to food and livelihood insecurity. Participatory
vulnerability analysis also helps to distinguish between acute and chronic sources of food
insecurity and broad livelihood stressors by charting the historical evolution of the local
vulnerability context. Analysing local capacities to address vulnerabilities and reduce risks enables ACF to tailor program design more closely to community priorities, and engage stakeholders as
partners rather than beneficiaries in the recovery process. It also permits the mainstreaming of
disaster risk reduction and climate change adaptation principles into its programming.
In rapid-onset crisis situations, people adopt coping strategies on a temporary basis to protect their
livelihoods and prevent destitution as a response to food shortage and other shocks to the
household (see 4.8). Sequential stages of coping are usually identified according to the severity and
length of the crisis and the vulnerability of different groups. Over time, reconstruction and
rehabilitation activities restore community resources and assets to some sort of baseline. Disaster
risk reduction and preparedness activities become possible as part of early recovery and as the
context stabilizes.
In emergencies where shocks are persistent and recurring, there may be no return to a ‘pre-crisis
baseline’. This is especially true in complex and slow-onset emergencies such as those involving
armed conflict, the HIV/AIDS pandemic or the effects of climate change. The capacity for adaptive
change in these contexts depends on communities’ level of access to and control over resources
necessary for adaptation. Broad-based adoption of adaptive mechanisms across a zone is a useful
indicator of the success of a population’s adaptation process.
10 Research shows that households tend to use both consumption coping strategies and longer-term livelihood strategiessimultaneously. Therefore restricting the CSI to short-term consumption behaviors – which are comparable across socialgroups – is adequate as a rapid indicator of both food and livelihood security at the household level.

8/9/2019 ACF FSL Manual Final 10
http://slidepdf.com/reader/full/acf-fsl-manual-final-10 96/27094 ACF Food Security and Livelihoods Assessment Guideline
Participatory analysis of community-wide hazards, vulnerabilities and capacities draws on a
number of PRA methodologies and tools described below. The analysis process relies on a step-by-
step approach:
1. Charting hazards to determine the nature and level of exposure to risk
2. Identifying vulnerabilities linked to the major identified hazards and threats
3. Analysing community capacities and strategies and their impact on reducing vulnerability
See Table below for a checklist of main issues and methods to consider.
4.9.1 MAPPING HAZARDS
Hazard mapping supports communities to identify areas, resources and groups at greatest risk from
climate and other hazards, to analyse potential or actual changes in hazards and to plan for risk
reduction.
Hazards encompass a range of natural and manmade phenomena. Community perceptions of risksrelated to acute, seasonal and chronic hazards exposure are important to capture, as they provide
an entry point for understanding the local vulnerability context.
Area of analysis Key issues to consider Methods/ sources
Hazards
• Nature, intensity and behaviour ofhazards
• Seasonality• Changes in hazards over time• Areas and resources at risk
Key informantsFocus group discussionsSeasonal calendar
Historical timelineHazard mappingResources mappingProportional piling & ranking
Communityvulnerabilities
• Weaknesses to significant hazards• Impact of hazards on livelihood re-
sources• Impact of hazards by social group
Focus group discussionsSocial and resource mappingHazard mapping Vulnerability matrix e.g. VCA, SWOT,Wealth Ranking
Community capacities
• Local institutions and groups
• Relationships between groups• Access to livelihood resources• Access to services• Availability of social networks
Focus group discussionsHazard mapping Vulnerability & capacity analysis
Institutional mappingStakeholder analysis andsocial mappingSolution trees Venn diagram
Table 19: Hazards, vulnerability and capacity assessment checklist
DEFINITIONS
A hazard is a natural or manmade phenomenon that may cause physical damage, economic loss
and threaten human life and wellbeing.
A disaster is the occurrence of an extreme hazard event that impacts on vulnerable communities
causing substantial damage, disruption and possible casualties, and leaving the affected
communities unable to function normally without outside assistance.
Disaster risk is a function of the characteristics and frequency of hazards experienced in aspecified location, the nature of the elements at risk, and their inherent degree of vulnerability or
resilience.

8/9/2019 ACF FSL Manual Final 10
http://slidepdf.com/reader/full/acf-fsl-manual-final-10 97/27095ACF Food Security and Livelihoods Assessment Guideline
Localized risks related to natural hazards such as drought and floods are closely linked to the
state of the natural resource base, and in many contexts largely determine the vulnerability of local
livelihood systems. Environmental degradation is recognized as one of the key factors contributing
to increasing human, physical and financial hazard-related losses. In many countries deforestation
has disrupted watersheds and resulted in siltation of riverbeds, leading to more severe droughts and
floods. Increased siltation of river deltas, bays and gulfs, together with the destruction of mangroves,
reefs and other natural breakwaters, has also increased the exposure to storm surges and
seawater intrusion. Poor land use management, unsustainable agricultural practices and more
general land degradation have further contributed to increasing flood losses and the rising incidence
of drought.
Globally, environmental degradation contributes to heightening disaster risk in hazard-prone areas.
The anticipated rise in the frequency and intensity of hazards associated with climate change, and
long-term unfolding processes such as desertification, are likely to increase vulnerability and further
weaken livelihood systems over time. This is true unless timely measures are taken to boost the
preparedness of local communities.
Risks related to manmade hazards such as violent conflicts, economic crises and chronic
destitution are linked to the broad political and socio-economic environment and the way ittranslates in the local environment. The nature of the political economy, people’s possession of
social and political capital and their proximity to power largely determine vulnerability to such
hazards. Weak and historically marginalized groups are often exposed to exploitation and abuse to
a much greater degree. In predatory war economies and situations of chronic conflict, violence
becomes a means of asserting power and economic control and may be perpetrated by states,
warlords or other forms of leadership, or ordinary people. Forms of violence may include: asset
stripping of weak or marginalized groups, looting, destruction of stores and resources, forced labour
e.g. in mining, forced military or militia recruitment, and illegal taxation. Mapping such types of
hazards should be done keeping in mind inter-group and inter-zone differences.
See Table below for examples of different types of natural and manmade hazards.
*Adapted from: ProVention Consortium: Tools for Mainstreaming Disaster Risk Reduction, Guidance
Note 2: Collecting and Using Information on Natural Hazards.
Table 20: Types of hazards
Hazard Type Description Examples
Hydro-meteorologicaland geological
• Natural earth, atmospheric,hydrological, oceanographicor climatological processes& phenomena
• Floods, debris and mudflows• Tropical cyclones, storm surges,
wind, rain• Drought, desertification, wild fires,
temperature extremes, sand ordust storms
• Earthquakes, tsunamis• Volcanic activity and emissions
• Landslides, rockslides• Surface collapse, geological fault activity
Biological• Processes of organic origin
or those conveyed bybiological vectors
• Epidemic diseases e.g. HIV/AIDS• Seasonal exposure to disease e.g.
diarrheal infection• Plant or animal contagion e.g.
bacterial wilt• Pest infestations
Manmade• Events related to the
political & socio-economicenvironment
• Economic crises, sharp price fluctuations• Violent conflicts, protracted conflicts, war• Political instability• Government policies
• Chronic destitution

8/9/2019 ACF FSL Manual Final 10
http://slidepdf.com/reader/full/acf-fsl-manual-final-10 98/27096 ACF Food Security and Livelihoods Assessment Guideline
Methods
Participatory hazard mapping makes uses of focus group discussions and PRA tools including:
seasonal calendars (to identify periods of stress, hazards, diseases, hunger, debt, etc.); historical
timelines (to get insight into past hazards and note changes in their nature, intensity and behaviour);
hazard maps overlaid on resource maps (to identify areas and resources at risk from hazards); and
proportional piling & ranking (to identify most significant threats).
See Appendix 11 for guidance on use of the individual PRA tools.
4.9.2 ANALYZING VULNERABILITIES
Participatory vulnerability analysis is a process that supports communities in identifying and
describing their vulnerability to the acute and chronic hazards they face.
Other approaches to vulnerability analysis that are highlighted in this guide (e.g., relying on a range
of pre-defined indicators to identify and rank vulnerable groups) must be triangulated with
participatory approaches that call on vulnerable and disaster-affected populations themselves to
define and explain vulnerability. This is done by supporting people to draw on their own localknowledge, history, experience and understanding of the context.
Analysis of community vulnerabilities must be used to inform policies and actions in which
communities will take a leading role, especially in linking disaster preparedness and response to
longer-term capacity building. The process itself can help to build advocacy skills among poor and
marginalized communities and lead them to better assert their rights in relation to state actors,
customary or tribal leaders, NGOs and others.
In community-level analysis of vulnerability, several steps are followed:
1. Vulnerabilities related to significant hazards are identified and ranked, e.g. the absence ofcyclone shelters, low livestock holdings, insufficient access to water, seasonality of labour,
dependency on migration, high transport costs, etc.
2. Groups that are more prone or vulnerable to loss and suffering in the context of differing
hazards are identified and ranked, e.g. by livelihood group, wealth group, caste, ethnicity,
gender, disability and health status, age, nature and extent of social networks.
3. Areas and livelihood resources more vulnerable to loss or damage are identified, e.g. human
settlements, access roads, production facilities, markets, pasture areas, specific cropping
systems, etc.
In the section below, special attention is paid to mapping social networks as a tool to support theidentification of vulnerable groups; and wealth ranking as an application of vulnerability ranking
approaches.
4.9.2.1 MAPPING SOCIAL NETWORKS
Mapping social networks and other forms of social capital supports communities and ACF in
identifying the formal and informal institutions which influence community life and understanding
resilience and vulnerability in the local cultural context, including the identification of most
vulnerable groups.
Strong social networks can significantly boost the adaptive capacity of a community. The extent towhich households are able to call on family, kinship and community resources has an impact on
their capacity to manage or cope with crisis. In some places networks will be poorly developed or

8/9/2019 ACF FSL Manual Final 10
http://slidepdf.com/reader/full/acf-fsl-manual-final-10 99/27097ACF Food Security and Livelihoods Assessment Guideline
stretched thin by recurrent crisis. In other contexts, strong traditions of hospitality and reciprocityensure that networks will be exceptionally broad and resilient, playing an effective role in protecting
vulnerable community members from the worst impacts of crisis. In countries with strong religioustraditions, mosques, monasteries and churches will play key roles in supporting communities in theirrecovery. Religious values such as sadaqah (alms) and zakah (charity) can underlie acts of solidarityand kindness towards others. Social analysis is needed to understand vulnerability, social exclusionand local determinants of poverty.
Minimum aspects that need to be considered in an FSL assessment are:
• the types of social networks on which people rely in normal times e.g. close family or kin; clanor tribe; religious, political or military organization; livelihood or trade group; government; NGO orcharity group
• the types of support the networks provide e.g. providing gifts, loans, food, housing, temporary
care of children, protection of orphans and widows, access to services, protection from attack
• the level of access to these networks by social group (who benefits)
• recent changes in the availability of support, if any (how much the community is able to providecurrently in the wake of crisis)
Questions are asked about what sources and types of support people rely on when they need help.Who can they turn to when they don’t have enough food in the house or when they can no longerprovide for family members? What type of household is considered most vulnerable in thecommunity? How do communities care for their most vulnerable and poorest members?
Social networks – also known as informal solidarity systems – are vital to analyze and understand,
as this case study from Pakistan reveals.
EXAMPLE: VULNERABILITY & SOCIAL NETWORKS IN PAKISTAN’S NORTHWESTFRONTIER PROVINCE
The World Food Programme responded to the 2005 South Asia earthquake with massive fooddistributions. After the initial 6 months, partners on the ground scaled back distributions usingeligibility criteria that focused on households headed by “vulnerable women, children, orphansand elderly and disabled people in communities whose access to food and basic services areimpeded”. The assumption was that these groups were socially vulnerable. Meanwhile, the
criteria had been transposed from other humanitarian contexts without an assessment of socialnetworks in the local intervention areas.
Careful assessment by ACF showed that traditional forms of solidarity in the area ensure
that women and orphans are taken care of after the deaths of husbands and fathers. Theseindividuals were protected by the community and absorbed into families in the wake of theearthquake: very few female, disabled- or child-headed households could be found.
Instead, large male-headed households with high dependency ratios and limited sources ofincome were found to be isolated from traditional networks and therefore more highly exposedto risk (“only Allah helps us”). Incidentally, these were often the same households who had takenin vulnerable individuals. But they were not recognized as vulnerable according to the eligibility
criteria developed by humanitarian agencies.
Understanding social networks in Pakistan’s conservative mountain communities later permittedappropriate targeting of vulnerable households.
Source: ACF Pakistan FSL Dept.

8/9/2019 ACF FSL Manual Final 10
http://slidepdf.com/reader/full/acf-fsl-manual-final-10 100/27098 ACF Food Security and Livelihoods Assessment Guideline
4.9.2.2 RANKING WEALTH GROUPS
Wealth ranking is a form of participatory vulnerability analysis that identifies and provides
information on the poorest classes.
Wealth ranking makes use of local indicators of wealth, breaking down the livelihood group or
geographic area into 3, 4 or 5 relative wealth categories such as Destitute, Very Poor, Poor, Middleand Better-off. In addition to defining wealth indicators, it should also define the primary social
characteristics of each wealth group e.g. by caste, ethnicity, settlement status, access to social
networks. The poorest classes will include traditionally weak or marginalized people, but also newly
vulnerable groups such as female-headed households, orphans, unaccompanied minors and
disabled people.
Meanwhile, wealth ranking is not relevant in all settings. The poor are not necessarily the mostvulnerable. The most vulnerable groups in the community should be defined in relation to the most
significant hazards identified in the area.
Methods
Participatory vulnerability assessment follows closely from the results of the hazard mapping. It
makes uses of focus group discussions and PRA tools including: social and resource maps (to
identify most vulnerable areas and resources); Vulnerability and Capacity Analysis (VCA), Strengths,
Weaknesses, Opportunities & Threats (SWOT) analysis, Wealth Ranking or other types of vulnerability
matrices (to rank or score livelihood resources and/or social groups according to the level of impact
of identified hazards).
EXAMPLE: WEALTH RANKING IN NORTH DARFUR
The people in the Wadi livelihood zone are farmers and livestock herders. Main wealth indicators
in the zone are: number and type of livestock holdings, access to cultivable wadi land, ability to
hire agricultural labour and access to water pumps. Livestock holding is the key determinant of
financial ability, which enables the better-off households to have cash to buy pumps and diesel
and pay for labour. Water pumps are an important farm input for irrigating the winter crops. Some
middle income households own water pumps, but oftentimes they do not have sufficient land to
cultivate or cash to pay for labour. In this situation, they share the pumps with another farmer
who has land. Most of the middle income households use their own labour force (family labour)
to cultivate; therefore they cultivate less than the better-off. The poor households, who have no
land, borrow land from better-off relatives or other poor who are unable to use all their land.
Poor households irrigate their crops manually. Winter season wadi farming provides labour
opportunities for poor both from the Wadi livelihood zone and others from neighbouring areas.
Source: ACF Sudan, Food Security Assessment, North Darfur, May 2005.
Wealth group Poor Middle Better-off
% of population 45-55% 25-35% 15-25%
Agriculture – land area 0 – 1.6 Mukhamas 1.6 - 3.2 Mukhamas 2.4 - 8 Mukhamas
Livestock – size herds20 – 25 shoats,0 – 2 cattle
40 – 50 shoats,10 –15 cattle
80 – 100 shoats,8 – 20 cattle
Water pump ownership 0 0 - 1 1

8/9/2019 ACF FSL Manual Final 10
http://slidepdf.com/reader/full/acf-fsl-manual-final-10 101/27099ACF Food Security and Livelihoods Assessment Guideline
To map social networks, discussions by social group are especially well suited as people may be
hesitant to share personal information on these topics in an individual interview setting.
See Appendix 11 for guidance on use of the individual PRA tools.
4.9.3 ASSESSING CAPACITIES FOR RECOVERY, DISASTER RISK REDUCTION & PREPAREDNESS
Participatory capacity analysis supports communities to identify and describe specific capabilities
and vulnerabilities and to mobilize local resources and assets necessary to build adaptive change
to recurrent hazards.
Communities dispose of a diverse array of resources, strategies and potential solutions to cope with
acute, chronic and underlying vulnerabilities. These exist in the form of strategies undertaken to
manage crisis and long-term change at the household level, in the physical and natural resources of
the area and also in the social networks and human and organizational resources present locally.
If mobilized for action these assets may substantially reduce risk, build resilience and prepare
communities for adaptive change to recurrent hazards, including those related to climate change. As
understanding is built of local impacts and existing adaptive capacity, communities can be betterassisted in the formulation of strategies and solutions to their problems.
One of the most important factors shaping the adaptive capacity of individuals, households andcommunities is their access to and control over natural, human, social, physical, financial and
political resources. Examples of resources that may be important to adaptive capacity are shown in
the Table on the next page.
DEFINITIONS
Mitigation is any structural (physical) or non-structural (e.g., land use planning, public education)
measure undertaken to minimise the adverse impact of potential natural hazard events.
Disaster risk reduction is the systematic development and application of policies, strategies
and practices to minimize vulnerability, hazard and the unfolding of disaster impacts throughout
a society, in the broad context of sustainable development.
Preparedness is activities and measures taken before hazard events occur to forecast and warnagainst them, evacuate people and property when they threaten and ensure effective response
(e.g., stockpiling food supplies).
Resilience is the ability of a community to resist, absorb and recover from the effects of hazards
in a timely and efficient manner, preserving or restoring its essential basic structures, functions
and identity.
Adaptive capacity is the ability of a system to adjust to long-term change (including climate
change) to moderate potential damages, to take advantage of opportunities, or to cope with the
consequences

8/9/2019 ACF FSL Manual Final 10
http://slidepdf.com/reader/full/acf-fsl-manual-final-10 102/270100 ACF Food Security and Livelihoods Assessment Guideline
Source: CARE, 2009. Climate Vulnerability and Capacity Analysis
Access to and control over the resources necessary for adaptation varies within countries,
communities and even households. It is influenced by external factors such as policies, institutions
and power structures. Adaptive capacity can vary over time based on changing conditions, and may
differ in relation to particular hazards. In general, the world’s weak and historically marginalized
people are also the most vulnerable to recurrent crisis due to their limited access to resources that
would facilitate adaptation.
Table 21: Examples of resources that support adaptive capacity
Human Knowledge of climate risks, conservation agriculture skills, good health to enable labour
Social Women’s savings and loans groups, farmer-based organizations, social networks
Physical Irrigation infrastructure, seed and grain storage facilities
Natural Reliable water source, productive land
Financial Micro-insurance, diversified income sources
Political Representation, links to authorities
COMMUNITY CAPACITY IN CHRONIC CONFLICT SETTINGS
In situations of chronic conflict and political instability, community assets and resources are often
deliberately undermined, diverted or destroyed e.g. blocking or destruction of access roads and
productive infrastructure; diversion of boys and young men into local militias; girls and women as
targets of rape; abandonment of villages and forced migration. Strategies adopted in suchsituations tend to focus on survival and may include:
§ Falling back on subsistence farming § Theft and looting
§ Seeking relief § Prostitution (including
child prostitution)
§ Increasing indebtedness § Child labour
§ High reliance on remittances from abroad § Early marriage
§ Engaging in the informal economy
In such contexts, the long-term erosion of local capacity combined with insecurity may limit the possibilities for sustainable adaptive change. The Coping Strategies Index (CSI) can be adapted
for use in focus group setting to capture the range of strategies employed by communities to
manage their survival, including any adaptive strategies currently employed. Activities focused on
the protection of vulnerable groups may be more appropriate in the interim.

8/9/2019 ACF FSL Manual Final 10
http://slidepdf.com/reader/full/acf-fsl-manual-final-10 103/270101ACF Food Security and Livelihoods Assessment Guideline
Community-level assessment of capacities involves:
1. Describing the existing strategies, resources and assets used to reduce vulnerability in the
community
2. Identifying any external assistance used to reduce vulnerability
3. Identifying priority resources & assets for the reduction of risks and the building of adaptive
capacity, including natural resources and local organizations.
Methods
Participatory capacity assessment follows sequentially from the results of the hazard mapping and
vulnerability assessment. It makes uses of focus group discussions and PRA tools including:
Vulnerability and Capacity Analysis, SWOT (strengths, weaknesses, opportunities & threats)
analysis, and Solution Trees (to identify major physical, material, social and organizational resources
available); Stakeholder Analysis and Venn Diagrams (to understand the role played by different
organizations and their relative importance in the community; to identify the types of social networks
on which people are relying and evaluate access by social group).
See Appendix 11 for guidance on use of the individual PRA tools.

8/9/2019 ACF FSL Manual Final 10
http://slidepdf.com/reader/full/acf-fsl-manual-final-10 104/270102 ACF Food Security and Livelihoods Assessment Guideline

8/9/2019 ACF FSL Manual Final 10
http://slidepdf.com/reader/full/acf-fsl-manual-final-10 105/270ACF Food Security and Livelihoods Assessment Guideline
Chapter 5ANALYZING RESULTS
55.1 Basic considerations 104
5.2 Identifying the principal causes of
food insecurity and risks to livelihoods 105
5.2.1 Synthesizing contextual information 105
5.2.2 Identifying underlying causes 106
5.3 Determining the severity of food and
livelihood insecurity 1075.4 Establishing a vulnerability ranking 109
5.5 Estimating the scale of food and
livelihood insecurity 111
© A
C F - U g a n d a ,
c o u r t e s y P . F o l e y
103

8/9/2019 ACF FSL Manual Final 10
http://slidepdf.com/reader/full/acf-fsl-manual-final-10 106/270104 ACF Food Security and Livelihoods Assessment Guideline
5.1 BASIC CONSIDERATIONS
Data analysis and interpretation can and should be done throughout the assessment process.
Opportunities for analysis can be found at every stage of the assessment process, including:
• At the stage of preliminary data collection, to decide on target populations, methods
and sampling approaches
• During the training workshop, for the purpose of designing field tools
• Following pilot tests, in order to refine field tools and define appropriate thresholds and norms
(e.g. for the CSI)
• Prior to leaving field sites, to present and validate preliminary findings with local authorities
• In analytical workshops with team members, to gather additional insights that were not
formally recorded
• Following data entry, to synthesize findings from different data sources and prepare analytic chartsand models
• In workshops with local stakeholders, for the purpose of sharing results and building consensus
on priority needs and responses
Refer to Stages of the Assessment Process, Figure 6.
Analysis of quantitative data requires development of a spreadsheet or database using Excel,
Sphinx or statistical software program which will have been developed at the same time as the
development of the field tools (if possible). Consider carrying out the data entry alongside the field
work as soon as data becomes available, so that tabulation and analysis can be undertaken as soon
as the field study is completed. Templates of Excel databases are available in electronic form with
this guidebook.
Qualitative data is best analyzed in post-assessment analytical workshops with the assessment
team, and results tabulated. This debrief session with members of the team is useful for
highlighting key information and bringing out insights that may not have been captured on paper
during the formal assessment, thus supporting the data cleaning process. Debriefing the team also
provides an opportunity to recognize individual members’ contribution to the work and consider
their personal analysis of the context.
Simple data analysis tools such as cross-tabulation and key considerations for data analysis are
described in Appendix 27.
As a reminder, there are a number of key questions that ACF is looking to answer with the food
security and livelihoods assessment. Analysis and interpretation of the data should provide answers
to most of these.

8/9/2019 ACF FSL Manual Final 10
http://slidepdf.com/reader/full/acf-fsl-manual-final-10 107/270
5.2 IDENTIFYING THE PRINCIPAL CAUSES OF FOOD INSECURITY AND RISKS TO LIVELIHOODS
Contextual data is gathered from both secondary and primary sources and continually updated and
refined throughout the assessment, thereby contributing to a broad understanding of the crisis. A
sound knowledge of the context is essential for understanding the factors underlying malnutrition and
food insecurity in the surveyed area and the linkages that exist between the broad environment, the
vulnerability context and nutrition, food security and livelihoods outcomes.
5.2.1 SYNTHESIZING CONTEXTUAL INFORMATION
A careful and thorough synthesis of the data gathered on broad structures, processes and
vulnerability contexts helps to support more comprehensive analysis and allows ACF to move
towards more integrated programming.
While acute shocks and hazards and related impacts on food security are most obviously apparent,
it is essential to go beyond and also identify other types of structural, seasonal and chronic
stressors imbedded in the broad sociocultural, policy and institutional environment.
A grid of analysis is proposed below illustrating the relationships between food insecurity and a
range of livelihoods stressors (including structural stressors related to the institutional and policy
environment, acute and seasonal stressors related to shocks and hazards, and longer-term stressorssuch as climate change) in the specific local context. Once clearly identified and analyzed, these
individual stressors can then be addressed through integrated programming such as safety nets
and disaster risk reduction. The grid needs to be adapted to reflect analysis of the context at hand.
105ACF Food Security and Livelihoods Assessment Guideline
KEY QUESTIONS
• Which crisis?
• What has been the impact of the crisis on the zone? On the food security and livelihoods
of the population?
• Which groups are at risk? Where? When? Why?
• What types of risks do these groups face?
• What type of response is required to assist these groups?
• How much assistance is required?
• How should beneficiaries be selected?
• How many people are in need of each type of assistance?
• When should the assistance be provided and for how long?
• What results are we seeking to obtain with our response?

8/9/2019 ACF FSL Manual Final 10
http://slidepdf.com/reader/full/acf-fsl-manual-final-10 108/270106 ACF Food Security and Livelihoods Assessment Guideline
A livelihood matrix by major livelihood/access group or zone is a useful output of contextual
analysis. Information on the key livelihood characteristics of each group or zone can be placed
into a summary matrix. Key identifiers to include in the matrix are: main sources of food and
income, main strategies, ethnic/religious identity, political status, displacement status, sources of
vulnerability, etc. Livelihood profiling is typically done early on in the stage of secondary data
review and informs the development of the sampling approach and assessment tools. Compiling
the data in a livelihood matrix at the analysis stage assists in the synthesis of key information about
the vulnerabilities of and impact of crisis on various groups and the identification of appropriate
responses. See Appendix 21 for an example of a livelihood matrix.
5.2.2 IDENTIFYING UNDERLYING CAUSES
Informed by an integrated analysis of the context and the identification of broad livelihoods
stressors, it becomes possible to pinpoint one or more significant shocks that have affected food
availability, food access or food utilisation and entailed significant risks to livelihoods for some or
all population groups. Examples of such shocks are floods, drought or civil conflict.
Shocks are associated with a series of acute risk factors that have led to deterioration in the food
and security situation. For example, floods will have displaced households away from their food
and income sources; civil conflict will have disrupted trade routes and increased prices; drought
will have upset local food production. Shocks – which may be multiple – and acute risk factorsleading to food insecurity need to be identified during the analytic process, and their relative
importance determined.
In the analysis, it is also necessary to distinguish acute factors from chronic factors affecting
a population’s baseline level of food and livelihood security. Chronic factors are long-term,
structural, seasonal or recurrent stresses that contribute to a population’s underlying vulnerability
and condition its exposure to shock. The presence of chronic stresses affect people’s resilience
to new and acute stress, as their coping strategies may already be stretched thin by their
pre-crisis situation. Examples of chronic factors include HIV/AIDS, persistent political instability,
recurrent drought and macroeconomic policies. If baseline food and livelihood insecurity already
exists in the region, it is important to identify its causal factors.
Table 22: Integrated analysis grid of livelihoods stressors, outcomes & responses
Livelihoodsstressors
Illustrations Some outcomes Local responsesExternalresponses
Structuralstressors
Poor social
protection policies;no accessto assets
Under-development,poverty
Livelihoodstrategies
“Development”
Seasonalstressors
Hunger, Pasturedepletion beforerainy season
Hunger gapSeasonal livelihood& coping strategies
Safety nets
Shocks/hazardsConflict, naturaldisaster
Loss of assets,food insecurity,malnutrition
Coping strategiesDRR, rapidresponse &recovery
Trends/changes
Higher food prices,
climate change,financial crisis
Increasedvulnerability, food
insecurity,malnutrition
Coping strategies/
adaptationstrategies
Supportingadaptation
processes/ climatechange adaptation

8/9/2019 ACF FSL Manual Final 10
http://slidepdf.com/reader/full/acf-fsl-manual-final-10 109/270107ACF Food Security and Livelihoods Assessment Guideline
Different responses to chronic and acute food insecurity are likely to be required in terms of
intervention design and duration. Responses to chronic food insecurity can last several years
and focus on basic and underlying causes of food and livelihood security, while interventions
addressing acute food and livelihood insecurity are generally short-term and tackle immediate (as
well as underlying) causes. In order for responses to acute food and livelihood insecurity to be
sustainable – that is, for chronic factors not to undermine or prevent recovery from acute stress
situations – short-term interventions will occasionally seek to also address basic causes.
5.3 DETERMINING THE SEVERITY OF FOOD AND LIVELIHOOD INSECURITY
Contextual analysis supports the identification of livelihood groups or zones in the area and the
broad risk factors for food and livelihood insecurity across the population. The next step is to
analyze the impacts of the crisis by livelihood/access group in order to conclude on the relative
severity of food and livelihood insecurity for each group. This part seeks to answer the question:
who is worst affected by the current crisis or situation?
Severity of food and livelihood insecurity is determined by cross-tabulating the core FSL
indicators to determine how seriously individual groups are affected by the current situation (refer to
the Food & Livelihood Insecurity Severity Scale, Table 1). Special attention needs to be paid tochanges in household food and income sources, types of coping strategies employed and variation
in household food consumption patterns. Key indicators include:
• Market survey data showing price movements for key commodities, impacts on labour markets and
terms of trade
• Significant reduction in food availability in local markets
• Effects of the crisis on household-level food production and livelihood assets, including loss of
major productive assets, seed stores, access to water and access to land
• Seasonal risks that may compound problems of food supply and food access in the local area
• Large reductions in household food access and changes to sources of income and employment
• Severity of coping strategies employed by households
• Decline/breakdown in social networks; significantly heightened social exclusion
• Changes in patterns of household consumption/utilisation, as measured by reductions in meal
frequency and dietary diversity and changes in food sources
• High prevalence of malnutrition not attributable to health and care factors
Coping Strategies
It is important to know the extent to which large portions of the population are relying on crisis,
distress or survival strategies that put them at risk of permanently undermining their future food
security and livelihoods (refer to Coping Strategies by Severity Level, Table 18). When results from
a severity-weighted CSI are available, it is useful to assess the percentage of the population
engaging in the most severe (highest-weighted) coping strategies. If a broad share of the population
is engaging in such strategies, then it is clear that a large-scale crisis is underway. Agencies have a
responsibility to include an investigation and analysis of coping mechanisms in assessments,
recognize the use of crisis strategies, and act to protect and support populations before they exhaust
all available non-damaging options.

8/9/2019 ACF FSL Manual Final 10
http://slidepdf.com/reader/full/acf-fsl-manual-final-10 110/270108 ACF Food Security and Livelihoods Assessment Guideline
Food Consumption Patterns
Indicators of household consumption are useful for assessing the severity of a crisis by livelihood
group mainly when an affected population shows wide variance with respect to diet diversity, meal
frequency or food sources. Relative levels of food insecurity for different livelihood/access groups
can be judged based on this variance. This will be difficult to do in places where food choice is
limited for most of the population, e.g. geographically remote areas or isolated camp settings.
Using HDDS or FCS to assess the prevalence of the population lying at the extreme end of the diet
diversity spectrum (regular consumption of 3 or fewer main food groups or scores below the FCS
‘Poor’ threshold) provides information on the global severity of the food security situation.
Malnutrition Prevalence
Special attention needs to be paid to the global health environment, especially factors related to
health care access and quality, recent history of disease outbreak and major changes in the care
environment such as those brought about by forced migration. Only if the global health and care
environment is reported to be stable, and malnutrition is found to be high or increasing, is it then
possible to identify household food insecurity as a leading cause of acute malnutrition in the area.
It can be useful to fill out a malnutrition framework detailing the range of underlying and basic causesof malnutrition relevant to the local context. The example below graphically represents a causal
factor analysis for malnutrition done by ACF in South Kivu, DRC.
MORTALITY
Malnutrition
Inappropriateuse of
ressources
Lack of institutionalsupport &
agriculture research
Destructionof infrastructure
Collapse ofeconomic &
agronomic context
Lack of income
Insecurity
WAR
Diseases
Limitedlabour
opportunities
Reduction ofagricultureproduction
Inadequatebreastfeeding
practices
Consumption ofcontaminated
water
Lack ofdrinking water
& latrines
Impaired growth
& development
Looting ofproductive
assets
Inadequate dietary
intake
Looting ofagriculture
fields
Lack of food
Immediate Causes
Underlying Causes
Basic Causes
Looting oflivestock
Displacementof Population
ENVIRONMENTALDEGRADATION
Lack ofhygiene
Limited accessto education
Source: ACF, 2007: Socio-economic study in the ACF intervention zones, Territories of Fizi and Uvira,
Sud Kivu, Democratic Republic of Congo.
Figure 11: Causal study of malnutrition

8/9/2019 ACF FSL Manual Final 10
http://slidepdf.com/reader/full/acf-fsl-manual-final-10 111/270109ACF Food Security and Livelihoods Assessment Guideline
A basic severity analysis distinguishes between three stages of severity: Food Insecure/Vulnerable,
Food and Livelihood Crisis, and Famine.
5.4 ESTABLISHING A VULNERABILITY RANKING
Vulnerability rankings are useful for identifying and prioritising groups or zones for future interventions.
While an entire population is affected by an acute crisis, not all groups will experience the same
severity of impact or recover at the same rate. Differences in the vulnerability profile of various
groups will determine their resilience and recovery in the face of crisis.
Vulnerability is defined in relation to the principal cause(s) of food insecurity and risks to livelihood
(refer to section 5.2.2). Ranking groups/zones according to their relative vulnerability involves
consideration of:
1. Key vulnerability criteria identified by communities during community-level exercises for
assessing vulnerability (refer to Participatory Vulnerability and Capacity Analysis, 4.9.2)
2. Key ‘external’ indicators of vulnerability used by ACF to assess severity of food insecurity
across groups and zones (such as CSI and HDDS)
Establishing a vulnerability ranking that reflects both community and agency concerns is a
challenging exercise that requires: i) crossing and triangulating different sources of information and
different formulations of vulnerability across a range of locations, ii) arriving at a core set of
indicators that are common and relevant to all locations and number no more than 6 or 8, but ideally
as few as 3 to 5, and iii) using this reduced set of indicators to compare and rank vulnerability across
groups and zones.
In the best of worlds, the chosen set of indicators will confirm and corroborate the same ‘story’ of
vulnerability – that is, indicators will correlate with each other and suggest a similar ordering of groups
and zones. Where indicators tell very different stories from each other, it is often because they
describe vulnerability to different and unrelated shocks. For example, settled farm groups in parts ofDarfur may be relatively protected from the hunger gap, but remain exceedingly vulnerable to armed
attack. It will be necessary to select the most robust set of indicators based on triangulation and
cross-tabulation, and to ensure that they are all closely linked to the principal risk factors for food &
livelihood insecurity identified previously.
In the Table below, five livelihood zones across South Darfur are ranked according to different
indicators of vulnerability, of which a majority are related to security and climate risks and impacts
on strategies (violence, looting, drought) and one to livelihood outcomes (food consumption).
Zone or group-specific vulnerabilities, hazards and strategies can be summarized in a matrix, as in
the example below.

8/9/2019 ACF FSL Manual Final 10
http://slidepdf.com/reader/full/acf-fsl-manual-final-10 112/270110 ACF Food Security and Livelihoods Assessment Guideline
Coping strategies from the pastoral zones of North Darfur are presented alongside hazards and
vulnerabilities. In this context, hazards and vulnerabilities are closely linked to drought and
availability of pasture and water. Insecurity and government policies affecting prices and trade also
figure prominently.
Refer also to section 4.9.2 and the Livelihood Matrix in Appendix 21.
Table 23: Example of a vulnerability ranking by zone in South Darfur
Rank ZoneConflict
effects
IDP
Return
Drought
effects
Hunger
gap startHusbandry IGA
Food
consumption
1
Marla,northDonkeyDerissa,Yassine
Villagedestruction
20 to30%
50%Dec (Noharvest)
80%looted
Noactivities
Poor
2
DonkeyDerissasouth,GosKoala,Senia Afendu
Countrysidelooting
60 to100%
50% February All looted Normal50%decrease
3Ed alFursan
No effectsIDP:plus20%
10-20% February No looting Normal50%decrease
4
SaneDelebah, Abu Ajura,Katila
Targetedattacks
Noreturn
25-50% February No looting Normal Normal
5
UmGonia,Ladob,
Rigela
No effectsIDP:plus
30%
50% ? No looting Normal ?
Source: ACF Sudan FSL Dept., 2005. Rapid Food Aid and Food Security Assessment, South Darfur.

8/9/2019 ACF FSL Manual Final 10
http://slidepdf.com/reader/full/acf-fsl-manual-final-10 113/270111ACF Food Security and Livelihoods Assessment Guideline
5.5 ESTIMATING THE SCALE OF FOOD AND LIVELIHOOD INSECURITY
Number of households unable to cope with a shock can be estimated using total population
numbers for the surveyed area and information about the proportion falling into vulnerable
categories. Using the demographic information collected as part of secondary data review, it
is possible to estimate how many households and individuals fall into different categories of
vulnerability. This calculation can be used to provide a justification to donors for the numbers of
beneficiaries that the agency proposes to assist and the level of resources required.
Deciding which households or which zones are most vulnerable and in need of assistance will
depend on the nature of the risks that people are facing and ACF’s strategic orientation in the
country as well as the objectives of a potential response: whether to respond to emergency needs
only, whether to protect livelihoods in addition to addressing emergency needs, whether to address
chronic underlying vulnerabilities, etc.
For example, 3 zones out of a total 5 surveyed in Kirotshe, North Kivu, DRC are ranked most
vulnerable. Across these zones, displaced groups are considered most at-risk according to various
criteria. They total 13,580 persons. Other agencies are servicing the camp population. As a result,
ACF identifies as needing priority assistance the hosted displaced population numbering 9,909,
combined with other forms of support to the resident population of Bweremana, Kituva and Macha
numbering 45,544– for a total estimated 55,435 persons (see highlighted portion in Table below).
Vulnerability of
the Area
Vulnerability
of the PoorHazards Coping Strategies
• Environmental
degradation• Insufficient pasture• Insufficient access to
water• Remoteness limits
access to market• Poor access to basic
services• High percentage of
female headedhouseholds
• Low livestock holdingsspecifically for thepoor household
• Regular consumptionof wild foods e.g.Mukhait, in a bad year
• Dependency onmigration
• Dependency oncollection
• Chronic food insecurity
• Drought locally and inmigration areas
• Poor harvest in most ofDarfur
• Loss of livestockmarkets
• Insecurity/reducedroad access
• Government policies inregard to currencycontrol, livestockimport & export
• Sharp rise of cerealprices
• Animal disease
• Building stocks of wild
foods• Increase consumption
of wild foods• Livestock migration• Female migration• Develop new alliances• Diversification: family
split, some cultivate inthe south or trade inlarge towns
• Move from camel andcattle to sheep
Table 24: Example of Vulnerability and Capacity Analysis in pastoral zones of North Darfur
Source: ACF Sudan, May 2005. Food Security Assessment, North Darfur.

8/9/2019 ACF FSL Manual Final 10
http://slidepdf.com/reader/full/acf-fsl-manual-final-10 114/270112 ACF Food Security and Livelihoods Assessment Guideline
Rank ZoneResident
population
Displaced
population
(host families)
Displaced
population
(camp)
TOTAL
(individuals)
TOTAL
(households)
1 Bweremana 9 879 5 919 15 798 2 633
2 Kituva 5 471 450 1 531 7 452 1 242
3 Macha 30 194 3 540 2 140 35 874 5 979
Total 45 544 9 909 3 671 59 124 9 854
Table 25: Example of a scale estimation of food & livelihood insecurity by zone in North Kivu

8/9/2019 ACF FSL Manual Final 10
http://slidepdf.com/reader/full/acf-fsl-manual-final-10 115/270ACF Food Security and Livelihoods Assessment Guideline
Chapter 6IDENTIFYING SOLUTIONS
66.1 Examining interventions and capacities
of other stakeholders 114
6.2 Zoning the affected areas according
to vulnerability level & needs coverage 115
6.3 Identifying the range of possible FSL
interventions 115
6.4 Deciding on an appropriateintervention strategy 117
6.5 Formulating recommendations 121
© A
C F - M a l a w i , c o u r t e s y S .
H a u e n s t e i n - S w a n
113

8/9/2019 ACF FSL Manual Final 10
http://slidepdf.com/reader/full/acf-fsl-manual-final-10 116/270114 ACF Food Security and Livelihoods Assessment Guideline
The process of assessment is carried out in order to make recommendations for relevant actions.
Appropriate responses depend on need but also on local priorities and resources, capacity of ACF
to respond, available budgetary and human resources, logistical constraints and security risks for
staff (to name a few).
The process of identifying solutions involves several steps:
a. Reviewing the main factors related to vulnerability as well as the local ly expressed need
priorities, and determining that a response is in fact needed and desired
b. Identifying the intervention plans and capacities of other stakeholders to cover needs, and
gaps in these plans
c. Using zoning to spatially prioritize affected areas according to level of vulnerability and the
coverage of needs by other actors. Refining this zoning according to operational strategies and
institutional priorities
d. Identifying the range of possible interventions, taking into consideration the ‘do no harm’
principle and other humanitarian standards such as SPHERE
e. Anticipating scenarios regarding the development of the situation and the actions to be
undertaken in each case
f. Selecting the most appropriate response or combination of responses
g. Preparing recommendations that include targeting criteria, timing, scale, duration and exit
strategies
h. Sharing results and recommendations with affected communities and getting their feedback
6.1 EXAMINING INTERVENTIONS AND CAPACITIES OF OTHER STAKEHOLDERS
Stakeholder analysis followed by consultation with various stakeholders should enable the
assessment team to gather updated information about who is working where and doing what. Other
sources of information include the local OCHA office, agencies such as FAO and UNICEF,
coordination and cluster meetings, ministry meetings, and websites that centralize resources on
humanitarian crises such as Relief Web. Data tables or maps that represent the collected information
according to intervention sector and geographic location are useful to assist in identifying gaps in
humanitarian assistance across the affected areas and to assist in preventing duplication.
Governments and national armies may be involved in the relief effort depending on capacity and
context. The contribution of state actors should not be neglected when identifying and examiningthe range of stakeholders active in relief and likely to be active in the future.
Likewise, civil society can be responsible for mobilizing significant resources and delivering vital
assistance to affected communities. One notable but under-reported example is the role played by
Buddhist monks following the passage of Cyclone Nargis in Myanmar in May 2008. While many
INGOs were denied access to the country for several weeks following the disaster, thousands of
monks across urban and rural areas mobilized to serve on the front lines of the crisis. Similarly, the
Indian civil society role in the tsunami response was notable.
Compiling information on the activities of other actors allows the assessment team to carry out a gap
analysis, both by sector and geographic area. Normally, the bulk of the gap analysis will have been
carried out as part of contextual analysis prior to the field portion of the assessment, and will have
informed the choice about where to conduct the assessment (see section 4.1).

8/9/2019 ACF FSL Manual Final 10
http://slidepdf.com/reader/full/acf-fsl-manual-final-10 117/270
6.2 ZONING THE AFFECTED AREAS ACCORDING TO VULNERABILITY LEVEL & NEEDS COVERAGE
Most often, humanitarian actors and assistance tend to be concentrated in or around urban centres
and areas with good geographical access, at least in the initial stages of an emergency. Gaps will
tend to exist in more remote and physically inaccessible or insecure places, where logistical
constraints to delivering assistance may be considerable. Needs in remote crisis-affected areas are
more likely to be unmet simply by virtue of geographical isolation and the corresponding “bias” ofhumanitarian actors.
Zoning is used to cross information about humanitarian needs coverage with information about
the vulnerability of affected populations, and to spatially prioritize affected areas. The results of
vulnerability ranking and mapping exercises carried out by zone and livelihood/access group can be
used here.
The zoning exercise is refined by factoring in ACF operational strategies and priorities. This takes into
account questions of sectoral expertise, capacity and resources as well as country strategy, overall
mandate and institutional priorities guiding intervention.
6.3 IDENTIFYING THE RANGE OF POSSIBLE FSL INTERVENTIONS
Response options are examined for groups requiring assistance that is not being provided by other
actors, taking into account local capacities and resources and tailoring options to the identified
needs. Involving communities in planning the response is important. Where appropriate responses
are identified that fall outside of the ACF mandate (e.g. mine clearance or education), these still need
to be discussed in the assessment report for dissemination and lobby with other actors.
Types of food security and livelihood interventions which ACFIN undertakes in response to food and
livelihood crises, including situations of protracted crisis, are:
1. Assessment and surveillance interventions
2. Food assistance interventions
3. Cash-based interventions
4. Agro-sylvo-pastoral interventions
5. Income generating interventions
6. Applied research interventions
7. Advocacy interventions
Interventions addressing acute food crisis include food assistance and non-food alternatives such
as cash-based and market support interventions. These have the purpose of filling a food gap and
primarily address food availability and food access problems on the household level.
Interventions addressing livelihood crisis include food assistance as a livelihood support, cash-based
and market support interventions, agro-sylvo-pastoral interventions that support primary
production, and interventions that support income-generating activities. These mainly address food
access and income/employment access issues.
There are also a range of interventions addressing the specific impacts of food crisis on vulnerablegroups. These can focus on providing support to child and maternal health and nutrition or target
groups such as people living with HIV/AIDS, and address food utilisation problems related to care
practices, nutrition, health and WASH.
115ACF Food Security and Livelihoods Assessment Guideline

8/9/2019 ACF FSL Manual Final 10
http://slidepdf.com/reader/full/acf-fsl-manual-final-10 118/270116 ACF Food Security and Livelihoods Assessment Guideline
Finally, other types of interventions such as those addressing broader contextual issues include
advocacy, surveillance and applied research interventions. See Table below for a summary of ACF
FSL response options organized by risk factor.
Table 26: Response options by risk factor
Response
type Examples Description
Responses to underelying contextual issues affecting vulnerability
Food assistanceInterventions
• General fooddistributions
• Supplementaryfeeding
• Food for work • Cash based
interventions
Food Assistance Interventions ensure sufficient food to people affected by anacute crisis. The main objective for these interventions is to save lives andprevent the degradation of beneficiaries’ nutritional and health status whileprotecting livelihood assets. This type of programme is a response to a lack of food availability, which may also be hidden behind an access problemcaused by high food prices, during or following a crisis situation. Localprocurement and the use of voucher systems are encouraged.Market Support Interventions promote local economic recovery byaddressing market and trade route infrastructure, such as road repair, and
supporting traders to restore their activity. This can take the form of easingbottlenecks in supply by providing capital to traders; or promoting demandamong the population through cash-based and voucher interventions.
Market supportInterventions
• Support to traders• Cash based
interventions
Market Support Interventions promote local economic recovery byaddressing market and trade route infrastructure, such as road repair, andsupporting traders to restore their activity. This can take the form of easingbottlenecks in supply by providing capital to traders; or promoting demandamong the population through cash-based and voucher interventions.
Responses to underelying contextual issues affecting vulnerability
Cash-basedInterventions (CBI)
• Cash grants• Cash for work • Voucher programs• Linked to IGA • Linked to ASPI
Cash-Based Interventions can be implemented in various contexts during orafter an acute or chronic crisis situation. They include free or conditionalcash transfers, vouchers and cash-for-work programmes. The general
objective of CBIs is to support an immediate increase in purchasing and/orinvestment power, enabling the beneficiary population to access basicnecessities, including food and non food items, and/or to invest in theprotection, recovery and strengthening of livelihood assets. CBIs can alsotake the form of social protection or safety net programmes, with the aimof providing predictable transfers to vulnerable populations over a givenperiod of time. These programmes may also be food-based or combine bothfood and cash.
Agro-sylvo-pastoralInterventions(ASPI)
• Provision ofproductiveassets/ inputs
• Seed banks• Cereal banks
• Crop diversification• Destocking
programs• Fodder banks
Agro-Sylvo-Pastoral Interventions reinforce a household’s livelihood assetsand its capacities to meet food security needs through production, resourcemanagement, and exchange. These types of programs are used in earlyrecovery, post-crisis, chronic crisis and development stages.Programs aim at re-establishing production and production-basedentitlements through the provision of inputs needed in agriculture, fishingor livestock (seeds, tools, fertilizer, nets, boats, cages, traps, water, fodder,veterinary care); capacity-building; promotion of trade; extension work;irrigation repair; water harvesting; access to land, fishing water and rights;livestock off-take or restocking; livestock shelter, etc.
Incomegeneratingactivities (IGA)
• Provision or loan ofcapital assets
• Skills trainings• Financial
managementtrainings
Income Generating Activities promote the creation of income to improvevulnerable households’ purchasing power for food and non-food necessities,and to strengthen livelihood assets in a sustainable manner.IGAs can be carried out immediately after a shock and focuson livelihood recovery. Alternatively, they can be implemented any time afterthe shock, during a chronic crisis, or as part of a long-term developmentproject. They can take place in urban or rural areas. Participatory marketanalysis and a socio-economic assessment are key preparatory elements,as they help identify marketable services and products as well as
describe existing demand for these products.

8/9/2019 ACF FSL Manual Final 10
http://slidepdf.com/reader/full/acf-fsl-manual-final-10 119/270117ACF Food Security and Livelihoods Assessment Guideline
6.4 DECIDING ON AN APPROPRIATE INTERVENTION STRATEGY
There are a range of actions possible to address food and livelihood crisis. Appropriate responses
are highly context-specific and will depend on the stage, severity and scale of the crisis; the type of
crisis (whether rapid or slow-onset, protracted); and the quality of the infrastructure/degree of access
to the affected area. Food availability and market conditions will determine the feasibility of cash-
based and market-based interventions. The political, economic and security environment will
determine the level of access to vulnerable and marginalized groups.
Decision trees showing decision-making criteria for selecting interventions are a useful tool.
Generally, food assistance responses such as general food distributions are only appropriate in the
initial acute stage of sudden-onset emergencies with the objective of saving lives when people are
cut off from normal sources of food. Supplementary feeding programs can be paired with general
food distributions to address high rates of moderate malnutrition in the area. Where food availabil-
ity and market conditions are good, cash transfers are increasingly used in place of food aid to allow
households to meet their immediate emergency needs according to their own priorities.
Food distributions can be rapidly phased out depending on market functioning, to be replaced with
livelihood support interventions such as asset replacement and public works. Asset replacement
Response
typeExamples Description
Responses to underelying contextual issues affecting vulnerability
Interventionssupportingchild andmaternal health &nutrition
• Supplementaryfeeding program
• Fresh food vouchers• Kitchen gardens• Food conservation• Nutrition education• Child-friendly spaces• WASH programs
Interventions focusing on the improvement of care and feeding practices willusually target women. They will aim to change behaviour around infant andyoung child feeding with child-friendly spaces and programs promotingpsycho-social health, exclusive breastfeeding and hygiene education. Theycan also aim to support healthy food preparation practices with theprovision of cooking equipment and fuel-efficient stoves, diet diversificationwith fresh food vouchers and kitchen gardens; and skills trainings on foodprocessing and preservation such as pickling and drying techniques. Theseinterventions can be tied into traditional supplementary feeding programs.
Responses to underelying contextual issues affecting vulnerability
SurveillanceInterventions
• Sentinel sites
Surveillance systems continuously follow and analyze a specific contextualsituation, enabling timely and adequate responses to emerging criticalsituations. Findings and recommendations are shared with responsiblestakeholders and actors to enable decision makers to adapt ongoingprograms, define adequate strategies and necessary responses, andcontribute to national early warning systems.
Applied ResearchInterventions
• Field studies
Applied research and innovative programs that help to identify andimplement long-lasting solutions and appropriate responses to the identifiedneeds of affected populations are a key commitment for ACF. They includefield studies, documentation of ongoing projects, and research partnerships.
AdvocacyInterventions
• Press releases• Publications• ACF HungerWatch
ACF advocates and lobbies for the needs and rights of crisis-affectedpopulations, alerting of needs in the field, and ensuring awareness andinformation among various population groups, as well as betweenpopulations and stakeholders such as governments, administrators,humanitarian actors, etc.
Table 26: Response options by risk factor (continued)

8/9/2019 ACF FSL Manual Final 10
http://slidepdf.com/reader/full/acf-fsl-manual-final-10 120/270118 ACF Food Security and Livelihoods Assessment Guideline
through voucher programs, fairs or in-kind distribution is appropriate where loss of productive
assets has occurred and is hindering the return to productive activities. Public work programs in the
form of cash-for-work are appropriate where food insecurity is the result of loss of employment or
fall in wages. Livelihood interventions such as support to income-generating activities require
stable environments to implement and are most appropriate in recovery and development phases.
In settings of chronic instability and crisis, livelihood interventions need to be carefully considered
and explicitly tailored to the context while following the policy and intervention principles of ACF.
A decision tree that is focused on response options to an acute food crisis is shown here.

8/9/2019 ACF FSL Manual Final 10
http://slidepdf.com/reader/full/acf-fsl-manual-final-10 121/270119ACF Food Security and Livelihoods Assessment Guideline
Figure 12: Decision tree for acute food crisis
LEGEND
NO
IN-KIND AID
Are food, purchased inputs andother basic items available
in sufficient quantity?
IN-KIND AID e.g. general fooddistribution, supplementary feeding,
food for work
IN-KIND AIDCOMMODITY VOUCHER (items
provided by agencies or traders)MARKET SUPPORT
CASH GRANT or VOUCHERCASH FOR WORK
DESTOCKING PROGRAMMEIGA (in stable context)
NUTRITION PROGRAMMESe.g. SFC, TFC, canteens
DIET DIVERSIFICATION e.g. fresh food
vouchers, kitchen gardens
CASH GRANTCASH or COMMODITY VOUCHER
SEED or LIVESTOCK FAIRRESTOCKING PROGRAMME
POST HARVEST TECHNOLOGIESe.g. stores, pests and disease control
MARKET SUPPORT e.g. support totraders, infrastructure
CBIs
IN-KIND AIDCASH GRANT
CASH or COMMODITY VOUCHER
NUTRITION PROGRAMMESWATER, SANITATION & HYGIENE
HEALTH PROGRAMMES
Will traders be willingand able to adjust to
the increased demand?
Are prices on an unusualinflationary trend? Are prices
forecasted to increase?
Do security conditions allow easyphysical access to markets and
sources of livelihoods?
Do people have access to food fromown production, safety nets or
community-based social networks?
Are land, seed stores, livestock,shelter, feed and other
productive assets intact?
Are populations at risk of malnutritionor already malnourished (due to health,
WASH or care practice factors)?
Is the economy monetised?
Are markets functioning sufficiently?
Are markets competitive (nb of traderslarge enough to have fair prices)?
Are food stores sufficient at thehousehold level?
Are diets adequatein energy and diversity?
COMMODITY VOUCHER and/orIN-KIND AID
ACUTE FOOD SHORTAGE: ACCESS OR LOCAL AVAILABILITY FAILURE
Is credit available totraders? Is the market
and transportinfrastructure intact?
YES
Are incomes andincome sources
sufficient?
Are householdsrationing food or
adopting otherconsumption-relatedcoping strategies?
A
V
A
I
L
A
B
I
L
I
T
Y
A
CC
E
S
S
U
T
I
L
IS
A
T
I
O
N

8/9/2019 ACF FSL Manual Final 10
http://slidepdf.com/reader/full/acf-fsl-manual-final-10 122/270120 ACF Food Security and Livelihoods Assessment Guideline
Disaster risk reduction and climate change adaptation are principles increasingly gaining traction in
humanitarian response and ACF is striving to mainstream them into its programming. Analysis
of local capacities, strategies and assets is a critical step in reducing disaster risk and building
adaptive capacity to climate change and other long-term change processes. Communities should
be viewed as partners in the recovery process and wherever the context permits, fully involved in the
choice, design and implementation of interventions following a participatory assessment of local
vulnerabilities and capacities (see section 4.9).
Entry points for the mainstreaming of DRR and Climate Change Adaptation principles into Food
Security and Livelihoods programs are suggested in the table below.
In addition, it is necessary to consider the principle of Do No Harm when examining the
appropriateness and relevance of different interventions.
Table 27: Entry points for mainstreaming of DRR and climate change adaptation
Area of Intervention Examples
Resilient Livelihoods
• Promoting disaster- and climate-resilient agricultural practices• Supporting diversification of livelihoods, including non-agricul-
tural livelihoods strategies• Building capacity to analyze risks
• Promoting savings and building capacity to plan for riskmanagement
Disaster Risk Reduction
• Establishing food and seed banks in places safe from hazards• Improving shelter to withstand hazards• Strengthening access to early warnings• Facilitating evacuation planning• Protection of assets
Capacity Development
• Strengthening social protection schemes• Facilitating access to financial services• Building knowledge and skills on adaptation strategies• Facilitating access to disaster and climate information
Addressing Underlying Causesof Vulnerability
• Empowerment of women and other marginalized groups• Promoting equitable division of labour within households• Advocacy on rights to livelihoods resources
*Adapted from: CARE, 2009. Climate Vulnerability and Capacity Analysis

8/9/2019 ACF FSL Manual Final 10
http://slidepdf.com/reader/full/acf-fsl-manual-final-10 123/270121ACF Food Security and Livelihoods Assessment Guideline
6.5 FORMULATING RECOMMENDATIONS
Being able to synthesize the results of the analysis and convincingly formulate detailed, feasible and
appropriate recommendations is crucial, as the main purpose of the assessment is to orient future
strategic action by ACF.
Recommendations should include:
• The type of intervention(s) recommended
• Priority geographical areas
• Target groups, including targeting criteria and numbers of beneficiaries
• Level of assistance required: quantities of resources and frequency of provision
• Partnerships and coordination strategies
• Monitoring frameworks
• Duration of the intervention and proposed exit strategies
Deciding whether or not targeting is needed, and if so how it should be done, can be a contentious
process that requires careful attention. Targeting can be done based on geography (choosing one
or more vulnerable zones where needs coverage by other agencies is insufficient) and or based on
target groups within the affected population (for example, choosing households with children enrolled
in therapeutic feeding centres). Targeting criteria must be clearly specified and easy to apply in the
field. They must also be accepted by program staff and communities.
Methods for elaborating targeting criteria in a participatory manner have been developed in recent
years to address the often significant opposition that aid agencies encounter when they attempt to
apply criteria in the field without prior consultation with local communities. Community-basedtargeting and self-targeting have proved useful in reducing the costs and complications that can
‘DO NO HARM’
The “Do No Harm” project was initially set up in the early 1990’s to learn how assistance provided
in conflict situations interacts with conflict conditions and can be used and/or misused in the
pursuit of political or military advantage. The concept of “Do No Harm” has evolved to guard
against the undesired effects of aid interventions, such as creation of social tensions, changing
cultural or local habits, or negatively impacting the environment.
ACF food security and livelihoods programming minimises these undesired consequences
through thorough contextual analysis conducted during the development stages of a project,
as well as ongoing monitoring during program implementation, in order to make the necessary
adjustments should negative consequences be observed.
What are the risks of negative impacts of a program?
§ Consider potential risks at the time of program identification
§ Consider activities and programs that will counter these negative effects
§ Integrate any changes of context that could occur during or after the realization of the program.
For more information and the DNH handbook visit:
http://www.cdainc.com/dnh/docs/DoNoHarmHandbook.pdf

8/9/2019 ACF FSL Manual Final 10
http://slidepdf.com/reader/full/acf-fsl-manual-final-10 124/270122 ACF Food Security and Livelihoods Assessment Guideline
be associated with providing targeted assistance, as has blanket assistance when it is needed. In
many places, aid will tend to be redistributed if communities do not agree with targeting criteria, so
it makes sense to consult and adapt criteria according to local notions of vulnerability whenever
possible.
Meanwhile it is important to be vigilant about the ability of elites and powerful interest groups within
the community to intercept aid and exclude marginal groups and households from receiving
assistance12. Where community representatives are given responsibility for deciding criteria, it is
important to ensure that they actually represent the range of ethnicities, religions and political
affiliations present locally. Finally, cultures that place a strong value on equality may outright reject
the concept of household targeting. In such cases targeting communities – for example, in
collective work programs – or targeting based on geographic zoning may need to be considered as
alternatives.
12 This references the principle of “do no harm” as well as people’s access to social networks.

8/9/2019 ACF FSL Manual Final 10
http://slidepdf.com/reader/full/acf-fsl-manual-final-10 125/270ACF Food Security and Livelihoods Assessment Guideline
Chapter 7DISSEMINATING RESULTS
77 Disseminating Results 124
© A
C F - S o u t h e r n S u d a n ,
c o u r t e s y J .
S e a g l e / C o u n t e r p a r t I m a g e s
123

8/9/2019 ACF FSL Manual Final 10
http://slidepdf.com/reader/full/acf-fsl-manual-final-10 126/270124 ACF Food Security and Livelihoods Assessment Guideline
Results will be disseminated to a variety of stakeholders. While the donor community is an obvious
stakeholder, it is essential to also share findings with communities and authorities as well as other
humanitarian actors active on the ground.
A suggested report structure is given here. Not all assessment reports will follow the same structure
and the proposed framework should be adapted to include only relevant issues. It can be useful to
include a logical framework as part of the recommendations.
Findings and conclusions can be illustrated as appropriate with tables, maps and graphs to clarify
the presentation of quantitative results. It is best to write the final report immediately upon
completion of the fieldwork, to allow for timely dissemination and follow-up.
Stakeholder Restitution Condition
• Community• Oral presentation• Discussion groups
• Even if there is no projecton going
• Authority• Meetings• Report in official language
• Be careful with your remarkson government capacity
• Other humanitarian actors• Coordination meetings• Reports
• Can be a basis for lobby
• Donors• Meetings• (Concept paper, Needs
assessment reports)
• Including financing opportunityand strategy
• Coordination mechanisms• Reports following approved
indicators• Formats approved previously
Table 28: Method of information dissemination by stakeholder

8/9/2019 ACF FSL Manual Final 10
http://slidepdf.com/reader/full/acf-fsl-manual-final-10 127/270125ACF Food Security and Livelihoods Assessment Guideline
Contents of each section
Executive Summary • Concise summary of main issues (2-3 pages)
Table of Contents
List of Abbreviations,Tables & Figures
Introduction
• Broad context• Objectives• Map of the surveyed area• Geographic and demographic situation of surveyed zone
Methodology
• Study team, sites and schedule• Sampling approach• Methods & tools
• Constraints
Livelihoods
• Transforming structures & processes• Vulnerability context• Assets & strategies (agriculture, fisheries, livestock, mining, etc.)• Livelihood zoning
Findings
• Overall nature and impact of the crisis• Nutrition status, health status, water access, shelter condition, food
availability• Demography and household profile• Market functioning, price trends & terms of trade• Impact on sources of income and assets• Impact on sources of food & patterns of household consumption• Impact on care practices
• Other impacts• Coping strategies• Locally expressed vulnerabilities and capacities• Transversal issues (HIV/AIDS, gender, environment, protection, etc.)
Conclusions
• Principal causes of food insecurity and risks to livelihoods• Severity of food & livelihood insecurity• Scale of food & livelihood insecurity• Groups and zones most affected (vulnerability ranking & zoning)
Recommendations
• Type of intervention(s) proposed, if any• Priority geographic areas• Target groups• Resources required
• Duration and exit strategies
Appendices
• References• Questionnaires• Other data collection tools• Summary of stakeholder consultations
Table 29: Suggested report structure

8/9/2019 ACF FSL Manual Final 10
http://slidepdf.com/reader/full/acf-fsl-manual-final-10 128/270126 ACF Food Security and Livelihoods Assessment Guideline

8/9/2019 ACF FSL Manual Final 10
http://slidepdf.com/reader/full/acf-fsl-manual-final-10 129/270
©
A C F - M a l a w i , c o u r t e s y S .
H a u e n s t e i n - S w a n
AppendicesDISSEMINATING RESULTS
Appendix 1: Core food security & livelihoods indicators 128
Appendix 2: Nutrition indicators 129
Appendix 3: MUAC methodology 130
Appendix 4: WASH indicators 132
Appendix 5: Guidelines for Rapid Assessments 133
Appendix 6: Triangulation 144
Appendix 7: Secondary data review 145
Appendix 8: Key informant interview guideline & templates 147
Appendix 9: Focus Group Discussions guideline & templates 163
Appendix 10: Household Questionnaire guidance & template 178
Appendix 11: Participatory and Rapid Appraisal Methods 191
Appendix 12: Steps to assessment planning checklist 217
Appendix 13: Notes on Bias 218
Appendix 14: Protocols for Household Selection, an example 221 Appendix 15: Protocols for Team Leaders Monitoring, an exam 222
Appendix 16: Daily Activity Plan, an exampleple 224
Appendix 17: Mapping the market 225
Appendix 18: Analysing market trends 226
Appendix 19: Calculating Terms of Trade 228
Appendix 20: Livelihood Zoning and Profiling 231
Appendix 21: Sample Livelihood Matrix 237
Appendix 22: Seed Security Interview Guide 238
Appendix 23: Calculating Individual and Household Dietary Diversity Scores 239
Appendix 24: Calculating the Food Consumption Score 248
Appendix 25: FCS, HDDS and IDDS comparison matrix 254
Appendix 26: Calculating the Coping Strategies Index Score 255 Appendix 27: Tools and considerations for Data Analysis 261
Appendix 28: Write-up of Assessment Methods, an example 263
ACF Food Security and Livelihoods Assessment Guideline 127

8/9/2019 ACF FSL Manual Final 10
http://slidepdf.com/reader/full/acf-fsl-manual-final-10 130/270128 ACF Food Security and Livelihoods Assessment Guideline
Appendix 1: Core food security & livelihood indicators
Area of Inquiry Core Indicator Description
LIVELIHOODS
1. Livelihood assets
• Access to 6 capitals by livelihood group• Land tenure, fishery access and
pasture access arrangements
• Type and number of productive &non-productive assets
• Impact of crisis on assets(scale of loss, sale, destruction)
• Social networks
2. Vulnerability context
• Climate, geography, environment• Physical infrastructure• Nature, intensity, frequency and
seasonality of hazards
• Impact of hazards onlivelihood resources
• Impact of hazards bysocial group
3. Broad institutionaland policyenvironment
• Socio-political context• Past crises and conflict• Demographic breakdown
• Ethnic groups, intra-grouplinkages
• Social organization, localleadership and authority
AVAIL ABILITY
4. Food stocks• Sufficiency and diversity of food
products available at local level• Self-sufficiency at
household level
5. Food imports
• Main markets• Origin of food in the market• Diversity• Availability
• Location of markets• Change in quantity & availability
of local food sources andimports
• Proximity of markets to affectedpopulation
6. Market prices
• Prices of staple food, cash crop,livestock, fuel commodities
• Price differences between regions• Terms of Trade
• Price variation and trends overrecent weeks or months
• Impact of food assistanceon prices
ACCESS
7. Food sources• Diversity of food sources
• Changes to food sources• Seasonality
8. Income sources
• Diversity of income &livelihood sources
• Remittances• Labour migration
• Changes to income &livelihood sources
• Seasonality
9. Coping strategies• Range of food consumption strategies
employed by households (adaptive,coping, crisis, survival)
• Impact of Crisis
UTILIZATION
10. Dietary diversity• Diversity of foods consumed over a
24-hrs period• Meal frequency• Micronutrient deficiency
11. Malnutritionprevalence
• GAM/SAM rates• Aggravating factors &
contextual elements
• Caseload• Coverage and Scale
12. Water access &availability
• Sources• Quality
• Quantity• Cost
13. Public health
• Changes in access to or quality ofhealth care
• Incidence and severity of majordisease outbreaks
14. Care practices
• Prevalence of breastfeeding inchildren 0-1 yr
• Changes in the number of womenbreastfeeding since crisis
• Food sharing practices based
on age, gender, health orworking status

8/9/2019 ACF FSL Manual Final 10
http://slidepdf.com/reader/full/acf-fsl-manual-final-10 131/270129ACF Food Security and Livelihoods Assessment Guideline
Appendix 2: Nutrition indicators
ACF relies largely on the analysis of aggravating factors, population density (caseload) and broad
contextual elements (e.g. insecurity and displacement) as key indicators for deciding on action,
rather than specific thresholds of malnutrition prevalence per se. Other agencies have developed
approaches and thresholds for action that similarly take into account a number of indicators
including GAM/SAM, food security and public health indicators. See table below.
* Malnutrition rate is defined as the percentage of the child population (6 months to 5 years) below
either the reference median weight for height –2SD or 80% of reference weight-for-height. Adapted
from: Young and Jaspers, 2006. The meaning and measurement of acute malnutrition in
emergencies: A primer for decision-makers. Humanitarian Practice Network, ODI, No. 56
Table 30: Decision-making framework for selective feeding programmes
Oxfam MSF WHO Action required
General rations < 2,100kcals/person/day
Food availability athousehold level< 2,100 kcal/p/day
Unsatisfactory situation:• Improve general
rations until local foodavailability and accesscan be made adequate
Less than 10%malnourished (lessthan 2% severelymalnourished)
Malnutrition rate < 10%without aggravatingfactors
Malnutrition rate* under10% with no aggravatingfactors
Acceptable situation:• No need for population
interventions• Attention to
malnourishedindividuals throughregular communityservices
10–20%malnourished
(other factors:
general ration lessthan 1,750 kcals/ day, severe publichealth hazard,significantdiseases –especially measles)
Malnutrition rate 10–19%or malnutrition rates 5–9%plus aggravating factors(see above)
Malnutrition rate* 10–14%or 5–9% with aggravatingfactors (see above)
Risky situation:• No general rations, but:• Supplementary
feeding targeted toindividuals identifiedas malnourished invulnerable groups
• Therapeutic feeding forseverely malnourishedindividuals
Over 20%
malnourished
(other factors: poorgeneral ration)
Malnutrition rate over20%, or malnutrition10–19% with aggravatingfactors (CMR >1/10,000/
day; inadequate generalration, epidemic ofmeasles, shigella orother communicablediseases,severe coldor inadequate shelter)
Malnutrition rate* 15% ormore or 10–14% withaggravating factors
(general food ration belowmean energy requirement,CMR > 1/10,000/day,epidemic of measles orwhooping cough)
Serious situation:• General rations (unless
situation is limited tovulnerable groups), plus:
• Supplementary feeding
generalised for allmembers of vulnerablegroups, especiallychildren and pregnantand lactating women
• Therapeutic feeding forseverely malnourishedindividuals

8/9/2019 ACF FSL Manual Final 10
http://slidepdf.com/reader/full/acf-fsl-manual-final-10 132/270
Appendix 3: MUAC methodology
MUAC measurement in emergencies has three main uses:
1. To estimate the prevalence of acute malnutrition as a rapid alternative to W/H
2. As a first-stage screening and referral tool
3. To admit children to therapeutic feeding programs
MUAC is a simple tool that involves a single, non age-related measurement. It requires the use of an
elastic band to systematically measure the mid-upper arm circumference of children between 6 and
59 months of age, using sample sizes of 900 children or more for full surveys. MUAC is often used
in emergencies to estimate the prevalence of wasting across a population. For results to be valid,
enumerators must be carefully trained by qualified staff on proper usage of the armband to ensure
that errors in measurement due to technique and variance between enumerators are minimized.
Nutrition staff must also support FSL teams on designing the sampling approach and analyzing
results. Note that there is still significant controversy over whether MUAC or W/H is the best
indicator of acute malnutrition for use in surveys.
MUAC is also often used as a referral or screening tool in the field to identify children who are at
risk of malnutrition. To date there are no standard MUAC cut-offs for initial first-stage field
screening and FSL teams need to consult with nutrition teams on the ground to identify acceptable
thresholds in collaboration with Ministry of Health officials and other agencies. Cut-offs in the range
of 130 or 135mm have been used.
Children with a measurement below the agreed cut-off are referred to a nutrition centre where a
weight-for-height measurement and/or a new MUAC measurement is taken. Admission criteria to
feeding centres until recently had been solely based on weight-for-height Z scores (WHZ) but MUAC
is now a considered indicator for case definitions of acute malnutrition based on a cut-off of 115mm
(as recommended by WHO/ UNICEF, measured against the WHO growth curves).
Example of a rapid MUAC screening methodology for screening in Jebel Mana on next page:
ACF Food Security and Livelihoods Assessment Guideline130

8/9/2019 ACF FSL Manual Final 10
http://slidepdf.com/reader/full/acf-fsl-manual-final-10 133/270
Approach Rapid MUAC screening for 768 children 6-59 months of age, using a non-scientific sample.
Material One 110cm stick; MUAC bracelets; MUAC record sheets; clipboard & pen; random table.
Selection of
communities
Purposive selection of 24 communities considering security and logistic issues, and so that to cross the rangeof situations prevailing in Jebel Marra. Purposively selected communities all had more than 20 households.
Habitats were generally grouped within villages or camps for selected communities. (N1)
Selection ofcompounds &householdswithin compounds
Random selection of compounds in selected communities. More specifically selected communities weredivided into 4 clusters. From the centre of each cluster, a direction was selected randomly (“spinning pen”technique); the first compound was selected along this direction using a random number table; remainingcompounds were taken successively by proximity, always taking the compounds on the right hand side fromthe entrance of the former. HHs living in these compounds were selected. If more than one HH resided in thecompound, identification was made according to the residential status (resident/ IDP); if the HHs were allresidents or all IDPs, a random choice was made to select 1 HH; if IDPs were living with residents, one HHfrom each residential status was randomly selected. (N2)
Selection ofchildren
Systematic selection of children between 6 months & 59 months within selected households. All childrenbetween 6 months & 59 months/110 cm and living in selected houses are screened, so that to reach 32children per community (equivalent to 8 children per cluster). Children higher than 110 cm/ reference stick were systematically removed, and age was requested to mothers before including very young children (6months-old children were those born after August 2007). If a child was not present in the compound butwas in the close surroundings, MUAC team managed to measure the child; if child was not present in thecompound randomly selected and was not in the close surroundings (away for the village & practicallydifficult to meet him/her), the child was replaced.
Informationrecorded
All the following information was recorded in a MUAC record sheet:For each community: name of community; date; screener; methodology used; household number.For each household: status (resident; IDP); date of arrival (if displaced); origins (is displaced).For each child: age (N3); months; sex; MUAC (mm); presence of oedema (N4); presence of ARI in thepast 15 days; presence of diarrhoea in the past 15 days; any additional comments.
Data storage &analysis
MUAC record sheets were entered in a MS Excel database. In the frame of the analysis, MUAC weredisaggregated into the following MUAC categories: < 110; 110 - 119; 120 - 135; > 135; children were aswell disaggregated in 5 age groups: > 6 & <=12 months; > 12 & <= 24 months; > 24 & <= 36 months;> 36 & <= 48 months; > 48 & <= 59 months.
MiscellaneousIn order to find caretakers/heads of households in the houses, the MUAC screening was conducted earlymorning, after having informed local authorities the former evening.
Notes
(N1) Except in the case of Huera Farik community, which was composed of one village (grouped habitat)surrounded by IDP living along the wadi (diffused habitat).(N2) For 3 smaller communities, another methodological approach was used: all compounds were visited withall eligible children screening (referred in the database as the exhaustive approach); if the number of childrenexceeded the amount desired, 32 children were than randomly within the MUAC record sheet (the case ofDulda, Tabasa Garib West & Marra). In the case of Huera Farik mentioned in (N1), compounds within thegrouped habitat were randomly selected, so that to screen 16 children (2 clusters were defined); IDPhouseholds living along the wadi/ diffused habitat were systematically selected, so that to screen as well16 children.(N3) Age - If the mother knew the birth date, determination of the age is simple: in such case, the age wasrecorded into the questionnaire in month; when birth dates were unknown, mothers were asked about theapproximate age using the local events calendar.(N4) Oedema - In order to determine the presence of oedema, normal thumb pressure was applied to bothfeet for 3 seconds; if a shallow print persisted on the both feet, then the child was presenting oedema; only
children with bilateral oedema were recorded as having nutritional oedema.
ACF Food Security and Livelihoods Assessment Guideline 131

8/9/2019 ACF FSL Manual Final 10
http://slidepdf.com/reader/full/acf-fsl-manual-final-10 134/270ACF Food Security and Livelihoods Assessment Guideline132
Indicators Emergency Stable Situation
Minimum quantity for humanconsumption (drinking + cooking +
hygiene)
15 liters/person/dayNational standard 30-60
liters/person/day
Nutrition centersHealth centers
Maximum distance from water point
Number of people per water point
Maximum waiting time
30 liters/patient/day50 liters/patient/day
500 meters
15 liters person/day8 hours of supply:• 500people per hand pump
(16.6 l/min)• 400 people per open well
(12.5 l/min)• 250 people per _’ tap (7.5 l/min)
15 minutes
50-220 liters/patient/day
50 meters
50 liters person/dayhours of supply• 150 people per hand pump
(16.6 l/min)• 120 people per open well
(12.5 l/min)• 75 people per tap (7.5 l/min)
Household connection
No waiting time, or few minutes
Water quality
0 coli forms/100 ml
Sanitation survey indicates a low risk of possible fecal contamination
For populations of more than 10,000 people, in locations where there is a high risk ofepidemics, or where there is a high occurrence of diarrheas, it is recommended tochlorinate the water and ensure a residual chlorine level of 0.5 mg per liter and less
than 5 NTU turbidity.
Emergency Stable Situation
Water quality
For physic-chemical parameters, use the WHO guideline values and assess thedanger of consuming the water for a short period (in emergencies), thus openingup the possibility of using other water sources. If the danger is deemed very high,the water should not be used.
Total dissolved solids should not exceed 1,000 mg/liter, or a conductivity of 2,000µs/cm
In order to avoid negative health effects, the water should not contain chemical orradioactive contamination
Defecation areas
Latrines
Access to latrines
At least 50 m away from the nearestwater point.Trenches: 2.5 m x 0.3 m x 1 m for100 people
First phase: 1 public latrine per 50peopleSecond Phase: 1 public latrine usedper 20 peopleThird phase: 1 family latrine used perfamily
More than 50 m from the nearestwater point
Less than 50 m from the house
No defecation areas
1 Latrine per family
Appendix 4: WASH indicators

8/9/2019 ACF FSL Manual Final 10
http://slidepdf.com/reader/full/acf-fsl-manual-final-10 135/270
Appendix 5: Guidelines for Rapid Assessments
5.1. ACF RAPID ASSESSMENT KIT
1. Rapid assessment kit components
Definition of rapid assessment: a type of investigation designed to be implemented quickly, with the
aim of obtaining a fast and clear vision of a specific context in a specific moment.
Includes:
• Sources of Secondary Information
• Sources of Primary Information
• Methods
• Reference manuals and decision taking guide
• Final report guide
2. Sources of secondary information
Secondary information includes all knowledge that can be obtained without being on the field. This
information should be gathered and analyzed before going to the place where the crisis has taken
place, within our own office and from other stakeholders and partners.
Not only regarding the emergency situation but also all basic information:
• Country’s structures, statistics of all kinds
• Maps (access, water sources, Pcode…)
• Census
• Weather
• Food production and cereal balance
• Health statistics and endemic zone
• Official reports, NGO reports
• People to contact and sources of information… (List of contacts)
Key informants:
• Government representatives and ministers
• City council members (municipalities)
• UN delegates and workers, NGO employees
• Local associations
• Coordination mechanisms leaders
ACF Food Security and Livelihoods Assessment Guideline 133

8/9/2019 ACF FSL Manual Final 10
http://slidepdf.com/reader/full/acf-fsl-manual-final-10 136/270
Documents:
• Government documents
• Official statistics and other statistics
• National and international institutions reports
• Projects evaluations
• Humanitarian and research organizations
• Mission reports of joint assessments
• UN
ACF Food Security and Livelihoods Assessment Guideline134

8/9/2019 ACF FSL Manual Final 10
http://slidepdf.com/reader/full/acf-fsl-manual-final-10 137/270
Webs
3. Sources of primary information
Macro Level (country scale):
Political situation, national and international support, infrastructure, demographic and socio-cultural
data, physical and agricultural components and economic activities
GENERAL SOURCES
Name Web address
Reliefweb www.reliefweb.int
IRIN http://www.irinnews.org/
Redhum http://www.redhum.org/
Reuters http://www.alertnet.org/
Global Disaster Early Warning System http://www.gdacs.org
Humanitarian Reform (Global Cluster projects) http://ocha.unog.ch/humanitarianreform/
Famine Early Warning Systems (FEWS) Network http://www.fews.net/
World Health Organization in the country http://www.who.int/countries/
OCHA in the country http://ochaonline.un.org/Geographic/tabid/1084/Default.aspx
Government and Geographic informationand Data services
http://www.library.northwestern.edu/govinfo/resource/internat/foreign.html
NGO guide http://www.guiaongs.org/directorio/ongs/
Geohive, global statistics and link tostatistic departments
http://www.geohive.com/default1.aspx
FSL
FAO http://www.fao.org
World Food Programme http://www.wfp.org/aid-professionals
Oxfam http://www.oxfam.org.uk/resources/
Humanitarian Practice Network http://www.odihpn.org
Save the cChildren http://www.savethechildren.org/publications/
ICRC http://www.icrc.org/web/eng/siteeng0.nsf/iwpList2/Info_resources
Humanitarian Information Centres http://www.humanitarianinfo.org
UNHCR http://www.unhcr.org
West Africa Humanitarian Information http://www.humanitarianinfo.org/westafrica/
Southern Africa Humanitarian Information Network http://www.sahims.net/
HE ALTH AND NUTRITION
Emergency Nutrition Network http://www.ennonline.net
Core Group http://www.coregroup.org
Unicef http://www.unicef.org
UNAIDShttp://www.unaids.org/en/KnowledgeCentre/HIVData/EpiUpdate/ EpiUpdArchive/2006/Default.asp
Fanta Project http://www.fantaproject.org
UN Standing Committee on Nutrition http://www.unscn.org/
World Health Organisation http://www.who.org
CDC, Centres for Disease Control http://www.cdc.gov/
WASH (See HEALTH WEBSITE)
Publications of Action Contre la Faim (ACF)French version
http://www.actioncontrelafaim.org/publications/technique-et-recherche/ouvrages-et-fascicules-techniques/
ACF Food Security and Livelihoods Assessment Guideline 135

8/9/2019 ACF FSL Manual Final 10
http://slidepdf.com/reader/full/acf-fsl-manual-final-10 138/270136 ACF Food Security and Livelihoods Assessment Guideline
ALL THAT CAN BE FOUND IN THE CAPITAL CITY
Micro Level (the field):
Political and humanitarian situation, social and demographic organization, demography, food sources
access, access to social structures and state services, farming, fisheries, livestockand other economic
activities
ALL THAT CAN BE FOUND ON THE FIELD
4. Method
General
• Group discussion (community, key groups)
• Household interview
• Single interviews with sectoral specialists and key informants: Health workers, peopleresponsible for epidemic watch, for food security or for nutrition, they can supply statistical data
• Direct observation on the field
Food Security and livelihoods
• Market study (weekly or monthly pricelists, comparison with other markets)
• Household surveys
Nutrition and Health
• Assessment of health and/or nutrition centres
WASH
• Community mapping
• Sanitary survey
• Environmental health walk
• Household surveys (SPHINX version)
5. Reference manuals
They are support documents that are needed to conduct the Rapid Assessment.
• e.g. “Manual de técnicas de medidas antropométricas” or “Manual de entrevistas de grupos
focales”
The person in charge of the Assessment will refer to these documents when getting ready for
training and for field assessments.
• DECISION MAKING GUIDE
Once the results of the Rapid Assessment are obtained in form of Indicators, a diagnosis of the
situation is made, the needs are determined and, with them, the actions required to satisfy them.

8/9/2019 ACF FSL Manual Final 10
http://slidepdf.com/reader/full/acf-fsl-manual-final-10 139/270
Certain activities have already been associated with the corresponding results (QIA’s)
6. Final report
Once all data have been collected, a final report is prepared
It is designed to list and analyze all the information generated by the forms and the vulnerabilityindicators corresponding to the Rapid Assessment
It includes as well all recommendations derived from the Decision Matrix
7. AS A CONCLUSION…
The assessment must allow us to get information on:
• Problems: Vulnerability Indicators obtained by surveys FS, WASH, CAP, SMART, MUAC, etc.
• Causes: background of the crisis or disaster
• Effects: Impact of the crisis on health, sceneries depicting the evolution of the crisis withoutexternal aid, copying mechanism, observed changes…
• Expected results: Impact of the proposed activities in the short term and in the long term, thehumanitarian situation is evaluated by means of:
• Vulnerability indicators measured before and after the crisis and comparison of theevolution
• Analyze of the impact and potential evolution/deterioration of the humanitarian situation
Assessments are led at different level:
• Infrastructures (crops, latrines, wells, health centres)
• Families (amount of food, debts, purchase power, etc...)
• Environment (Security, market, access, other intervention, etc…)
The indicators required to yield a good picture of vulnerability must be clearly identified prior to thefield work.
5.2. RAPID ASSESSMENT GUIDELINE, AN EXAMPLE
Aceh, Indonesia, February 2005
General objectives:
• Assess the impact of the tsunami/earthquake on food security of the populations and theircapacity of recovery
• Contribute to defining a mid-term food security strategy for ACF in Aceh (phasing out ofgeneral food distributions, targeting of food aid, reconstruction/rehabilitation strategy andidentification of potential FS activities – first step, more detailed assessments will be necessary)
137ACF Food Security and Livelihoods Assessment Guideline
• Ex: if MAG > 14 %
• Action: Install CNT and field programs

8/9/2019 ACF FSL Manual Final 10
http://slidepdf.com/reader/full/acf-fsl-manual-final-10 140/270
Specific objectives:
• Identify a typology of populations depending on their vulnerability
• Evaluate the population structure and availability of labour force, and the existence of traditional
social organisation and leadership
• Identify the on-going population movements and their causes
• Analyse how people meet their food needs, through an understanding of their household
economy:
• Assess the availability of, and access to, food
• Identify the main sources of income and food and their current viability
• Understand the existing coping mechanisms
• Evaluate the different opportunities to access income and food in the short–and medium-term
• Determine the type and access to external aid
• Assess the existing commercial networks and supply channels
• Evaluate the nutritional status of the population and the impact of the tsunami/earthquake on
the care practices
• Assess the access to potable water
Methodology:
• Semi-structured interviews with local and displaced populations and key informants
• Observation (esp. nut status, if screening not organised)
• Market survey/Food basket price survey
Identification of assessed areas:
The assessment will be done in ACF food aid intervention areas in Aceh Jaya and Aceh Barat
districts. Sub-districts along the coast in Aceh Jaya have been equally affected by the tsunami, buta typology can be distinguished moving inland from the coast, using two main indicators: (i)
destruction, and (ii) types of population, as synthesised in the table below.
Level of destruction Type of population
Totally destroyed Only IDPs
Partially destroyed IDPs and local population
Not affected Only local population
ACF Food Security and Livelihoods Assessment Guideline138

8/9/2019 ACF FSL Manual Final 10
http://slidepdf.com/reader/full/acf-fsl-manual-final-10 141/270
Nine theoretical situations can be identified (3 levels of destruction*3 types of population), but only
four are commonly in the field:
§ Totally destroyed areas with only IDPs (including resettled and returnees13 )
§ Partially destroyed areas with both IDPs and local population
§Non-destroyed areas with both IDPs and local population
§ Non-destroyed areas with only local population
One representative village will be visited in each of the four zones in Jaya, Krueng Sabe and Teunom
sub-districts (4 per sub-district in 3 sub-districts, total 12 villages). Calang area (district
administrative centre, totally destroyed) and the village in Teunom, where there are only returnees,
will be assessed separately as special cases (Total: 14 villages). An assessment will also be
conducted in Samatiga or Wyola sub-districts. These areas are more peri-urban and less isolated
(road access to Meulaboh) and may represent other problematiques than the zones mentioned
above, and hence an assessment is needed.
Note:
Some questions are pertinent for IDPs, some for returnees, some for host communities.*
INTERVIEW GUIDELINE
1. General
K Name of village, sub-district, district
K Relative wealth of village before tsunami/earthquake
KDate
K Topography
K Type of focus group
2. Demography and social organisation
K Current population
K Population before tsunami/earthquake
K Current number of HH
K Number of HH before tsunami/earthquake
K Gender and age distribution. How did the tsunami/earthquake affect this?
K Current proportion of working aged population
K Proportion of working aged population before tsunami/earthquake
K Community hierarchy or organisation (How are community decisions made, are there any
user committees established etc?) Impact of the tsunami/earthquake?
ACF Food Security and Livelihoods Assessment Guideline 139
13“Returnee” will be defined as people who have returned to their village of origin (even if they do not live in their own house).“Resettled” will be defined as people who have resettled/relocated to a new location after the initial displacement.

8/9/2019 ACF FSL Manual Final 10
http://slidepdf.com/reader/full/acf-fsl-manual-final-10 142/270
K Are there many orphans? How are they taken care of?
3. General impact of the tsunami/earthquake
K Estimate roughly the level of destruction (25%, 75%, totally destroyed…)
K
Which assets remain?
K What type of populations were the most affected? Why?
K Proportion affected vs. non-affected population (%)
I Loss of housing
I Loss of main livelihood (main source of income)
I Loss of head of family
I Loss of working aged people
I % HH affected by all these ( e.g. HH with destructed housing and main livelihoods, and loss
of working aged people and head of family
I % HH affected by two of the first three
K % of population
I living in own houses (without IDPs)
I temporary shelters/camps
I with host families (not host families themselves)
I host families
4. Population movements
K What were the population movements immediately after the tsunami/earthquake?
K Currently, are there any population movements taking place? If yes, what? From where to where?
Who is moving? Why? For how long do you think these movements will take place (projections?)?Why?
K Make a map of population movement since the tsunami/earthquake and distinguish times (see
example of thematic map in annex. Idea is to understand the global picture (e.g. all village names
are not needed) in the whole sub-district by combining the information obtained in
different villages).
K Have you already visited your village of origin? If so, describe.
K Resettlement camps?
ACF Food Security and Livelihoods Assessment Guideline140

8/9/2019 ACF FSL Manual Final 10
http://slidepdf.com/reader/full/acf-fsl-manual-final-10 143/270
5. Sources of food
K How do you normally get food? Through own production, purchase, gathering/wild foods etc?
(All sources, e.g. veggies from own production, noodles through purchase, rice from
neighbouring villages…)
K How do you get food now? (All sources as above, e.g. noodles from distributions, vegetables from
own production, bananas through purchase from neighbouring villages etc) What are the main
difficulties to get food at the moment?
K Have any new ways to get food emerged after the tsunami/earthquake (coping mechanisms)? If
yes, what? Do they have negative effects? What? On who?
K During a normal year, is access to food affected seasonally? If yes, how and why? What are the
‘lean’ months? (Make a seasonal calendar if it helps you)
6. External aid
K Have you received any aid during the last month (food, NFI, medical…)? What? From who? For
how long? When did you last receive aid? (List organisation, type of assistance and number of
beneficiaries)
7. Trade, markets and supply of food (focus on staple foods)
K Is there any trade in the village, especially food and other basic items? Since when? If not, where
is the closest market?
K Is the supply adequate? If not, why? What is available?
K Where do the foods come from? Where are the main markets in the area? Make a map of current
and pre-tsunami/earthquake food supply/trade links (Note reasons for rupture). See example in
annex.
K Current and pre-tsunami/earthquake prices of basic food items, availability and origin
K If produce of the village is sold: producer prices (farm-gate prices)
K During a normal year, is trade affected seasonally? How, when and why?
8. Sources of income
K What are the main sources of income normally? Rank in order of importance and establish % of
population involved.
I Agriculture
I Livestock
I Fishing
ACF Food Security and Livelihoods Assessment Guideline 141

8/9/2019 ACF FSL Manual Final 10
http://slidepdf.com/reader/full/acf-fsl-manual-final-10 144/270
I Debt (from who, how to pay back, interest, guarantee?)
I Sale of assets (what, how often, to who, why?)
I IGA/industry (specify type)
I
Trade
I Remittance/migration labour (how many times/year, destination?)
I Wage/labour contracts (specify type)
I Other
K Do HH normally have more than one source income? If yes, what and how?
K How did the tsunami/earthquake affect the sources of income/food? (Differentiate between
immediate impact and a mid/long term impact on each source – note impact on productive
capital/means of production) Which sources are the most affected? How? Why? What kind ofpopulations are the most affected?
K Are you going to re-establish the affected sources? How? How long will this take? What are the
main constraints to re-establish the activity? If some sources of income will not be
re-established, why?
K Have new sources of income emerged? What? Who benefits of these? Do these have any
negative effects? What? Who is affected?
K How is the work traditionally divided (including household tasks) among men, women, children and
the elderly (who does what)? Has this been affected by the tsunami/earthquake? How?
K During a normal year, are the sources of income affected seasonally? How, when and why? (Make
a seasonal calendar.)
9. Specifics for agriculture
K What proportion of the population was involved in agriculture before the tsunami/earthquake?
K How is access to land assured? (own through hereditary rights, rented…)
K Where is the land located?
K How much was irrigated? How much is irrigated?
K What do you cultivate normally? Make agric calendar of main crops, including cash crops.
See example of agric calendar in annex.
K How are the crops used (own consumption, sales, saved for seed…)
K How was agriculture affected by the tsunami/earthquake? % of crops destroyed? % of
land destroyed?
K What kind of harvest do you expect? List all main crops (including cash crops) and estimate in %the harvest as compared to last year.
ACF Food Security and Livelihoods Assessment Guideline142

8/9/2019 ACF FSL Manual Final 10
http://slidepdf.com/reader/full/acf-fsl-manual-final-10 145/270
10. Specifics for fishing
K What proportion of the population was involved in fishing before the tsunami/earthquake?
K What type of fishing is normally practiced (close to the shore, out in the sea, big boats, small
boats, in a group, individually…)?
K How is the fish used (sold, eaten, processed…? If processed, how and for what? If sold, where
and to who?
K What types of boats are used? How do fishermen get access to boats (e.g. are there big boat
owners who rent their boats to fishermen, own their boats…)?
K How was fishing affected by the tsunami?
K Has fishing restarted? If yes, how? To what extent? If not, why? When will it be restarted?
K Make a seasonal calendar of fishing (seasonal variations in the intensity of fishing, place and type
of fishing)
11. Expenditures
K What are your biggest expenditures normally (rank in order of importance)?
I Food (Within food expenditure, differentiate and rank in order of importance: staple, pulses,
oil, meat/fish, dairy)
I Hygiene
I Health care, medicines
I Education
I Reconstruction (of what?)
I Purchase of productive capital (e.g. boats)
I Ceremonies (e.g. burial)
I etc
K Now, what are the main expenditures (broad categories as above) e.g. has the tsunami affected
the expenditures and if so, how?
12. Water
K How do you get drinking water now?
K How did you get drinking water before the tsunami/earthquake?
K No and type of functional water points before the tsunami/earthquake
K No and type of functional water points now
ACF Food Security and Livelihoods Assessment Guideline 143

8/9/2019 ACF FSL Manual Final 10
http://slidepdf.com/reader/full/acf-fsl-manual-final-10 146/270
13. Health
K What are the most common illnesses? When do they occur and why (seasonality)? Who is
affected (gender, age specific illnesses)?
K Has the tsunami/earthquake affected health? How? Who is the most affected?
K Has the tsunami/earthquake affected the nutrition of infants and care practices?
14. Problem ranking and solutions
K What are the main problems faced by your village (list in order of importance)?
K What can you do about these problems? What solutions do you propose?
K What different potentialiti es currently exist in your village? How could these be used to
re-establish livelihoods?
15. Future plans
K What are your future plans? Where will you go (return to village of origin, remain in current place,
go to camp…)? How will you survive?
Appendix 6: Triangulation
1. Triangulation can be used at different levels of the FSL assessment.
Purpose: to increase the accuracy (reduce bias) of the information gathered and analysis by
cross-checking data.
Objective: to ensure that the information and analysis of data used in a FSL assessment is
accurate and complete.
Process: use different data collection methods to gather information from different sources on the
same or similar aspects of food security and livelihoods. Triangulation sometimes includes having
different ACF staff collect the same data. Staff that consist of different disciplines (e.g., a team
comprised of a sociologist, water engineer, and medical examiner) will add to the overall collection
of complete data.
ACF Food Security and Livelihoods Assessment Guideline144

8/9/2019 ACF FSL Manual Final 10
http://slidepdf.com/reader/full/acf-fsl-manual-final-10 147/270
For example, if you are trying to ascertain specific aspects of livelihoods in a community, it might behelpful to cross-check information with men and women separately. Various sources often
complement each other and fill gaps in knowledge or answer questions that one group could not.
The Figure above is a very simplified version of triangulation. Data from men and women would likely
be collected separately through various methods such as key informant interviews, focus groups
and a combination of participatory rapid appraisal methods such as mapping or proportional piling.
Appendix 7: Secondary data review
Purpose: to explore existing data for information relevant to the current FSL assessment.
Objective: to obtain relevant data about key components and contextual information for the FSL
assessment that has already been collected and / or may be too expensive or time consuming tocollect during an FSL assessment.
Process: Ask technical and local/regional experts about what information may exist that would
inform or provide essential background for the current FSL assessment. Review published and
unpublished reports, maps and articles from institutions such as government agencies, health
centres, NGOs.
Perspectives of men and women –more accurate overall picture
Men Women
ACF Food Security and Livelihoods Assessment Guideline 145
Triangulation Perspective of men and women on livelihoods

8/9/2019 ACF FSL Manual Final 10
http://slidepdf.com/reader/full/acf-fsl-manual-final-10 148/270
Common mistakes:
§Moving to quickly through the process thereby missing important pieces of information
§Missing key representatives or data collection
Checklist of issues to be considered during review of secondary data
• What were different people doing for a living before the disaster?
• What were the main ways that people got food and income before the disaster?
• How did those differ between geographical areas (livelihood zones)?
• How did those differ between richer and poorer people (wealth groups)?
• What was the relative importance of each of those activities (e.g. their contribution to total food
access and to total food income)?
• Were all groups getting enough food of the right quality to be well nourished?
• Were all groups earning enough income by non-harmful ways to afford their basic needs
(including food, education, healthcare, soap and other household items, clothing and
productive inputs such as seeds and tools)?
• (The latter two questions will indicate whether there were chronic problems or not; these may
be exacerbated by a disaster, or may be unaffected; but the appropriate response is influenced
by whether the problem is chronic or acute)
• What is the normal seasonal pattern of activities, and where in the seasonal calendar are
we now?
Suggested sources of secondary data• National level assessments by Government Ministries/ agencies, VACs, WFP, FAO, World Bank,
UNDP
• Existing Household Economy Assessments
• Food security or livelihoods assessments by agencies using a livelihoods approach, e.g.
FEWS-NET, Oxfam, ACF or CARE.
• Malnutrition data can often be found from: Demographic & Health Surveys (DHS); Ministry of
Health; Unicef
• Telephone or face-to- face Interviews/ discussions with exper ienced government and
international agency staff
Checklist of issues to be considered when examining the effects of the hazard/shock
• How has the shock affected the ability of the household to engage in each activity?
• Have there been any deaths or injuries to those who did the activity?
• Is the household pre-occupied with other priorities such that they cannot work? (e.g.
reconstructing shelters, attending funerals, caring for sick or injured or bereaved relatives,
dealing with own trauma)
• Have any key productive assets been lost or damaged? (Note that this could include physical
assets such as tools, and natural assets such as land.)
(continued on page 147)
ACF Food Security and Livelihoods Assessment Guideline146

8/9/2019 ACF FSL Manual Final 10
http://slidepdf.com/reader/full/acf-fsl-manual-final-10 149/270
Appendix 8: Key informant interview guideline & templates
Purpose: to interview community members who have knowledge or unique perspectives on an
important aspect of the FSL assessment.
Objective: to obtain local information on facts, attitudes and beliefs related to the FSL assessment
from individual community members that are in the best position to provide the desired information.
Process:
Preparing for a key informant interview:
§ Identify the necessary data that would be best obtained through interview with a set of individual
community members - often conducted as one-on-one interviews.
§ Create a semi-structured questionnaire that asks open-ended questions to obtain the information.
Be sure to leave room to follow up on unexpected answers. Interviews should be relatively short
(generally about an hour or two hours maximum).
§ Identify Key Informants within a community based who are most likely to have the information
sought, often chosen based on his or her position, experience or responsibilities. Let key
informants know the approximate time it will take to complete the interview.
§ Choose an interview location that will be informative (e.g., on agricultural land being discussed)
but also puts the interviewee at ease. Also need to balance the location with the potential for
interruption to the flow of the survey.
(continued from page 146)
• Has there been any loss of stocks or saving? (e.g. food stocks being destroyed; stocks of
inputs being lost (e.g. a carpenter’s wood, or a shopkeeper’s stock of goods); cash savings
being lost; bank savings being inaccessible…)
• If livelihoods depend on selling a good or a service, has the market for the good or service been
physically affected? (e.g. physical destruction of shops or marketplaces; roads to markets beingdamaged and impassable;
• Has the market for the good or service been economically affected?
• Has the market for the good or service been affected in any other way? (e.g. insecurity
preventing access to markets; psychological or health concerns.) Has the policy environment
changed in a way that might affect livelihoods? (e.g. bans of movements of food or livestock;
restrictions on where people can live
Additional Issues in Conflict Situations
• Does the conflict put any population group at particularly risk of food insecurity (e.g. on the
grounds of nationality, ethnicity, religion, wealth, etc.)?
• How might economic relationships between groups be affected by conflict?
• Is the conflict intentionally targeting particular livelihood strategies?
• Are any groups likely to profit from the conflict?
• Would any of our intended interventions exacerbate tensions or put any group at risk
of violence?
Source: Save the Children HEA Toolkit
ACF Food Security and Livelihoods Assessment Guideline 147

8/9/2019 ACF FSL Manual Final 10
http://slidepdf.com/reader/full/acf-fsl-manual-final-10 150/270
During a key informant interview:
§ Establish rapport, use the traditional introductions and greetings
§ Present goals of the visit, the general information sought in terms that are easily understood by
someone outside of the FSL assessment field.
§ Ask if it is OK to take notes during the interview and be discriminating on what you write down. Ifit is not OK to take notes, then remember key points and write them out directly after leaving the
room.
§ Listen attentively and guide the interview back to the topic at hand being sure to allow adequate
time for follow-up of unexpected but relevant information.
§ If more than one staff will be at the interview, be sure to let the interviewee know a head of time,
introduce team members and be sure each member of the team has a well defined role and
intervenes in an orderly fashion.
§ Finish the conversation by asking if there is anything the key informant would like to add.
After the interview:
§ Organize and condense notes as soon after the interview as possible, be sure to record your
general impressions of the data (such as facts, perspectives, opinions) and places to follow up
with other community members.
Common mistakes:
§ Starting the interview before building rapport
§ Taking notes on everything said
§ Not following up on unexpected data
§ Letting a tangent go on for too long without redirecting back to the conversation
§ Interviewing for too long
§Waiting to compile notes
SECTION 8.01 DISTRICT KEY INFORMANT INTERVIEW GUIDE TEMPLATE.
District District Interviewer(s)
Name Position/Organisation
I. Details of Key Informants
ACF Food Security and Livelihoods Assessment Guideline148

8/9/2019 ACF FSL Manual Final 10
http://slidepdf.com/reader/full/acf-fsl-manual-final-10 151/270
Main Livelihood CategoryFILL IN AS APPROPRIATE]1. Agro-pastoral 3. Trade/small business2. Pastoral
Main Characteristics
(production system, topography,vegetation, natural resources,population density, soils, rainfall)
Main Crops Consumed:Rank in order of importancefor home consumption
1
2
3
Main Crops Sold (food orcash crops): Rank in orderof importance for householdcash income
1
2
3
Main Livestock & LivestockProducts Consumed: Rank inorder of importance for homeconsumption
1
2
3
Main Livestock & LivestockProducts Sold: Rank in orderof importance for cash income
1
2
3
II. Description of Livelihood Zones in the District
III. Population
Livelihood zone Population
1. Agro-pastoral
2. Pastoral
3. Traders/Small business
4. Etc.
ACF Food Security and Livelihoods Assessment Guideline 149

8/9/2019 ACF FSL Manual Final 10
http://slidepdf.com/reader/full/acf-fsl-manual-final-10 152/270
1. Labour
Local rural area Local towns Outside zone Total
100%
If outside zone, where do people go and how much money is needed to go away?
How much is cost of labour per person-day
2. Market Price Data (District Office)
Items [FILL IN AS APPROPRIATE]
Unit 2005 2006 2007 2008 2009
1. Crop
1.1 Main Food Crops1.1.1 Sorghum
1.1.2 P. Millet
1.1.3 F. Millet
1.1.4 Maize
1.1.5 Beans
1.1.6 Peas
1.1.7 Cassava
1.1.8 Sweet Potato
1.2 Cash Crops
1.2.1 Oil crops
1.2.1.1 Groundnut1.2.1.2 Sunflowers
1.2.1.3 Sesame
1.2.1.4 Cotton
1.2.2 Vegetables
1.2.2.1 Pumpkins
1.2.2.2 Cucumber
1.2.2.3 Bitter melons
2. Livestock
2.1 Live animals
2.1.1 Cow2.1.2 Ox/Bull
2.1.3 Calf
2.1.4 Sheep
2.1.5 Goat
2.1.6 Camel
2.17 Chicken
2.2 Animal product
2.2.1 Milk
2.2.2 Butter
2.2.3 Ghee
2.2.4 Hide2.2.5 Egg
2.2.6 Honey
ACF Food Security and Livelihoods Assessment Guideline150

8/9/2019 ACF FSL Manual Final 10
http://slidepdf.com/reader/full/acf-fsl-manual-final-10 153/270
3.1 Agricultural Production
3.2 Livestock Production
3.1.1 Land Tenure System
Tenure System Local Name Management/Policy Access/Use right Remark
Traditional• Grazing
• Farming
Modern/LandTenure Policy• Grazing
• Farming
3.2.1 Livestock Sale Volume
Livestock 2004 2005 2006 2007 2008
1.1 Cow
1.2 Ox
1.3 Calf
1.4 Goat
1.5 Sheep
1.6 Camel1.7 Other
3.2.2 Livestock Migration (Outward or Inward)
District/Clan
From: To:
When: When:
From: To:
When: When:
From: To:
When: When:
ACF Food Security and Livelihoods Assessment Guideline 151

8/9/2019 ACF FSL Manual Final 10
http://slidepdf.com/reader/full/acf-fsl-manual-final-10 154/270
3.3 Crop Production
3.3.1 Cereals, Pulses and vegetables Yield
Crop Type2004 2005 2006 2007 2008
Acre Qt Acre Qt Acre Qt Acre Qt Acre Qt
1. Cereals
1.1 Sorghum
1.2 P. Millet
1.3 F. Millet
1.4 Maize
1.5
2. Pulses + Tubers
2.1 Beans
2.2 Peas
2.3 Cassava
2.4 S. Potato
3. Oil Crops
3.1 Groundnut
3.2 Sunflowers
3.3 Sesame
3.4 Cotton
4. Vegetables
4.1 Pumpkins
4.2 Cucumber
4.3 Bitter melons
3.3.2 Explain extent of agricultural inputs utilization:
Type Remark
Hybrid Seeds
Fertilizers
Pesticides
ACF Food Security and Livelihoods Assessment Guideline152

8/9/2019 ACF FSL Manual Final 10
http://slidepdf.com/reader/full/acf-fsl-manual-final-10 155/270
Effects of Disarmament on Production System/Livelihoods of the population
Has HIV / AIDS affected food security in the zone? Since when has this been a problem? Whatcoping strategies have people adopted to address HIV / AIDS?
ACF Food Security and Livelihoods Assessment Guideline 153
3.4 Disarmament
4. HIV/AIDS

8/9/2019 ACF FSL Manual Final 10
http://slidepdf.com/reader/full/acf-fsl-manual-final-10 156/270
5. Interventions
5.1 Food Assistance Distribution
Sub-County Village No. beneficiaries 2004 2005 2006 2007 2008
5.2 Other Types of Interventions by UN/NGOs, CSO’s & Government (OCHA District Office)
AgencyDistrict/Sub-county/Parish
Activities/Sector
Current Planned
ACF Food Security and Livelihoods Assessment Guideline154

8/9/2019 ACF FSL Manual Final 10
http://slidepdf.com/reader/full/acf-fsl-manual-final-10 157/270
RainfallCrops:• Main crops grown for
consumption• Main crops grown for sale
Livestock :• Migration• Milk production• Livestock sales• ‘Heat’ and Births
Employment:• Local labour (e.g. on farms)• Off-farm employment (e.g.
brick-making)
• Labour migration(where to?)
Wild foods/Game:• Collection and consumption,
by type
Food purchases:• Timing of purchases and
prices (highest/lowest)
Annual 'hunger' season:• Timing
Mining• Peak periods
For crops, indicate the timingof the following:• LP (land preparation)• P (planting)• CG (consumption green)
• H (harvesting)
Indicate variations in accesswith arrows:to indicate peak access andto indicate minimal access
F o o d
s o u r c e /
I n c o m
e a c t i v i t y
W h o ?
M
o n t h ( s t a r t w i t h m o n t h o f f i r s t c r o p
p r o d u c t i o n ( e a t i n g g r e e n ) : w r i t e i n m
o n t h s
ACF Food Security and Livelihoods Assessment Guideline 155
6. Seasonal Calendar (District Agricultural Officers)
§§

8/9/2019 ACF FSL Manual Final 10
http://slidepdf.com/reader/full/acf-fsl-manual-final-10 158/270
What are the important signs of possible impending food crisis resulting
from the main periodic hazard?
Month Early Warning Signs Key Indicators to Monitor
January
February
March
April
May
June
July
August
September
October
November
December
ACF Food Security and Livelihoods Assessment Guideline156
7. Seasonality: Early Warning Indicators (District Agricultural Officers)
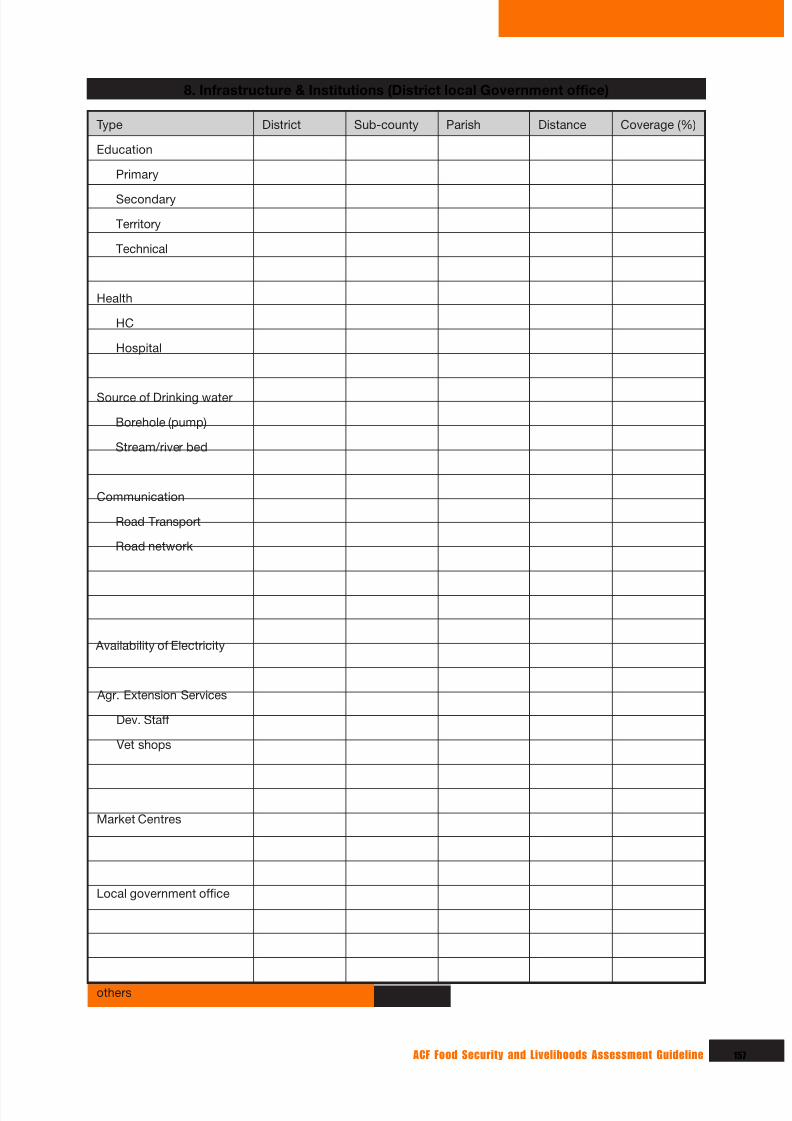
8/9/2019 ACF FSL Manual Final 10
http://slidepdf.com/reader/full/acf-fsl-manual-final-10 159/270
Type District Sub-county Parish Distance Coverage (%)
Education
Primary
Secondary
Territory
Technical
Health
HC
Hospital
Source of Drinking water
Borehole (pump)
Stream/river bed
Communication
Road Transport
Road network
Availability of Electricity
Agr. Extension Services
Dev. Staff
Vet shops
Market Centres
Local government office
others
ACF Food Security and Livelihoods Assessment Guideline 157
8. Infrastructure & Institutions (District local Government office)

8/9/2019 ACF FSL Manual Final 10
http://slidepdf.com/reader/full/acf-fsl-manual-final-10 160/270
SECTION 8.02 : SAMPLE MARKET VISIT AND TRADER INTERVIEW QUESTIONNAIRE TEMPLATE
Observations of The Market (Size, frequency, variety, quantity of goods being sold)
1. Markets
District Market Date Interviewers
Main livestock sold Trade route
1.
2.
3.
Main crops sold Trade route
1.
2.
3.
Main foods bought Trade route
1.
2.
ACF Food Security and Livelihoods Assessment Guideline158

8/9/2019 ACF FSL Manual Final 10
http://slidepdf.com/reader/full/acf-fsl-manual-final-10 161/270
2. Prices of Main Products in Local Market
Market Access Remark
Is market access good orbad in this LZ?
Why?
(e.g. good/bad roads,close to/far from an urbancentre), security,
Availability of main foodand non-food items
Capacity of traders to respondto increased demands
Market Price Data Description of item Unit Price/Unit
a) Main types of livestock andlivestock products
b) Main food & cash crops
c) OtherInclude:expenditure itemsincome itemsrelief food itemshandicraftsothers
ACF Food Security and Livelihoods Assessment Guideline 159

8/9/2019 ACF FSL Manual Final 10
http://slidepdf.com/reader/full/acf-fsl-manual-final-10 162/270
3. Livestock and Livestock Products
DescriptionMain type of livestock orlivestock product
Second type of livestock orlivestock product
Name of livestock
Seasonality in the reference yeara) Months of maximum trade volume
b) Months of minimum trade volume
In each case, give average prices
Identify main source anddestination markets in thereference year, together withany important intermediatemarkets to indicate a trade route.Record names and locations ofmarkets, which can include“local markets”.
Season traded:
Source market:
Intermediate market:
Destination market:
Main trade routes in a “bad” year, ifdifferent from the reference year.Give reasons for differences.
Reasons for recent price trends
ACF Food Security and Livelihoods Assessment Guideline160

8/9/2019 ACF FSL Manual Final 10
http://slidepdf.com/reader/full/acf-fsl-manual-final-10 163/270
4. Food Crop Trade
Description Main food crop traded Second food crop traded
Name of food crop
Seasonality in the reference yeara) Months of maximum trade volume
b) Months of minimum trade volume
In each case, give average prices
IMPORTED FOODS:
Identify main supply source in thereference year, together with anyimportant intermediate marketsto indicate a trade route. Recordnames and locations of markets,which can include “local markets”.
Season imported:
Source market outside LZ::
Intermediate market::
Destination within LZ::
EXPORTED FOODS:
Identify main destination markets inthe reference year, together with anyimportant intermediate markets toindicate a trade route. Record namesand locations of markets, which caninclude “local markets”.
Season exported:
Source market within LZ:
Intermediate market:
Destination outside LZ:
Main trade routes in a “bad” year, ifdifferent from the reference year.Give reasons for differences.
Reasons for recent price trends
ACF Food Security and Livelihoods Assessment Guideline 161

8/9/2019 ACF FSL Manual Final 10
http://slidepdf.com/reader/full/acf-fsl-manual-final-10 164/270
5. Cash Crop Trade
Description Main cash crop traded Second cash crop traded
Name of cash crop
Seasonality in the reference yeara) Months of maximum trade
volume
b) Months of minimum tradevolume
In each case, give average prices
Identify main source anddestination markets in thereference year, together withany important intermediatemarkets to indicate a traderoute. Record names andlocations of markets, whichcan include “local markets”.
Season exported:
Source market within LZ:
Intermediate market:
Destination outside LZ:
Main trade routes in a “bad” year,if different from the reference year.Give reasons for differences.
Reasons for recent price trends
ACF Food Security and Livelihoods Assessment Guideline162

8/9/2019 ACF FSL Manual Final 10
http://slidepdf.com/reader/full/acf-fsl-manual-final-10 165/270
Appendix 9: Focus Group Discussions guideline & templates
Purpose: to conduct a small group discussion (6 to 10 participants) that allows for participant
interactions to provide a better understanding and description of several local perspectives in a
community or local organization.
Objective: to cover maximum range of relevant topics of the context, or less topics but in detail
gathering concrete and detailed accounts of participants’ experiences and exploring participants’
feelings and opinions in depth.
Process:
Preparing for the focus group discussion
§ Define key issues you want to discuss and develop open-ended questions for an unstructured
discussion around those issues (e.g., locally defined priorities, resource awareness and
environmental interests, gender perspectives).
§ Prepare in advance the questions you want to ask being sure to have follow-up questions that are
related if the initial question does not receive a response.
§ Decide the best demographics of the focus group given the information sought. In most cultures
a single gender group is recommended if you want women to speak about specific topics. The
same is true for social issues with respect to creating groups of the same age, caste, religious and
ethnic groups.
During the focus group discussion:
§ Introduce the focus group team and the process that will follow, emphasize that participants’
experiences, opinions, and perspectives are sought to understand the current situation.
§ Set ground rules for the focus group (e.g., each person’s opinion is valid and that there may be
agreement and disagreement among the group – an open exchange of ideas is being sought).
§ Be appreciative of participation yet clear that participating in the focus group does not translate
into receiving assistance.
§ Sometimes it is good to have each participant make an individual, uninterrupted statement of
introduction in the beginning to help less talkative participants bring his or her voice into the group
and have more talkative participants spend time listening.
§ Introduce the first topic with an open-ended question, followed by unstructured discussion
§ Introduce additional topics based mainly on points made during the focus group discussion
§ End the focus group discussion with a general summary of what was discussed and by asking if
there is anything else participants would like to add
§ Thank participants for being part of the focus group
After the focus group discussion:
§Write a report summarizing results, being sure to highlight any unexpected information or gaps
that need to be filled.
ACF Food Security and Livelihoods Assessment Guideline 163

8/9/2019 ACF FSL Manual Final 10
http://slidepdf.com/reader/full/acf-fsl-manual-final-10 166/270
SECTION 9.01 : SAMPLE COMMUNITY REPRESENTATIVE INTERVIEW GUIDE TEMPLATE
3. Agricultural Production
3.1 Livestock Production
District Livelihood Zone Village / sub-county
Interviewers Date Number of participantsMen ______ Women ______
1. General Information
Tenure System Local Name Management Access/Use right Remark
Traditional
• Grazing
• Farming
2. Land Tenure System (Grazing and Farming Land)
3.1.1 Milk and Milk Product Production
Type of Animal
Milk production per day Meat Production Skin
Normal year Current year Normal year Current year Normal year Current year
Cows
Goat
Sheep
Camel
ACF Food Security and Livelihoods Assessment Guideline164

8/9/2019 ACF FSL Manual Final 10
http://slidepdf.com/reader/full/acf-fsl-manual-final-10 167/270
3.1.2 Adaptation Strategies
Strategy Route Season Decision
1. Seasonal Migration
2. Species Diversification
(Species)
3. Herd Splitting
4. Wealth (Livestock)Redistribution• Raiding• Peaceful
Internal/External
5.
3.1.3 Threat for different Adaptation Strategies
Strategy Problem
1. Seasonal Migration
2. Species Diversification
3. Herd Splitting
4. Livestock Redistribution• Raiding• Peaceful
5.
ACF Food Security and Livelihoods Assessment Guideline 165

8/9/2019 ACF FSL Manual Final 10
http://slidepdf.com/reader/full/acf-fsl-manual-final-10 168/270
3.2 Crop Production
3.2.1 Cereals, Pulses and Vegetables Yield
Main food & cash crops Unit
Yield/unit(With Inputs)
Yield/unit(Without Inputs)
Seed Requirement
Normal Current Normal Current Source Qty/Unit
3.2.2 Inputs Utilization
Type of Inputs % of pop. Uses inputs Place/Market bought
3.2.3 Cultural Practices
Practices Description
1. Land Preparation
2. Planting
3. Weeding
4. Harvesting
5. Storage
ACF Food Security and Livelihoods Assessment Guideline166

8/9/2019 ACF FSL Manual Final 10
http://slidepdf.com/reader/full/acf-fsl-manual-final-10 169/270

8/9/2019 ACF FSL Manual Final 10
http://slidepdf.com/reader/full/acf-fsl-manual-final-10 170/270
5. Population movements
5.1 Returns & displacements
N Movements PriorityDescription &
importance
Former/next
locations
Reasons for
movements
1Returns of residentsof community in thepast year
2
Departures ofresidents ofcommunity inthe past year
3
Arrivals ofdisplaced personsin community in
the past year
4Departures ofdisplaced personsfrom community
5.2 Seasonal movements & Economic Migration
N Movements Description Former/next locations
Reasons for
movements
1 Residents
2 IDPs
3 Nomads
ACF Food Security and Livelihoods Assessment Guideline168
5.3 Description of IDPs (living place; relationships with host community)

8/9/2019 ACF FSL Manual Final 10
http://slidepdf.com/reader/full/acf-fsl-manual-final-10 171/270
§ Importance & description (# of displaced persons arriving per week; nb of additional
persons who could come)
§ Description of how they are arriving (scattered individuals or families or clans; tribal,
ethnic, or village groups; means are they travelling; average family size, etc.)
6. Vulnerable Group Descriptions and Ranking
Notes: Consider as well status (IDPs, etc.)
6.1 Vulnerability ranking NOW, considering all households &
sources of food/ income (use of % piling)
N Vulnerability % Definition
LIVELIHOODS
Main income sources Main food sources
1Extremelyvulnerable
(a) (a)
(b) (b)
(c) (c)
2Veryvulnerable
(a) (a)
(b) (b)
(c) (c)
3 Vulnerable
(a) (a)
(b) (b)
(c) (c)
4Lessvulnerable
(a) (a)
(b) (b)
(c) (c)
ACF Food Security and Livelihoods Assessment Guideline 169
5.4 Recent arrivals of IDPs in community or neighbourhood:
5.5 Key issues (e.g. IDP pressure on host communities, settlement, etc)

8/9/2019 ACF FSL Manual Final 10
http://slidepdf.com/reader/full/acf-fsl-manual-final-10 172/270170 ACF Food Security and Livelihoods Assessment Guideline
6.2 Vulnerability ranking BC, considering all households &
sources of food/ income (use of % piling)
N Vulnerability % Definition
LIVELIHOODS
Main income sources Main food sources
1
(a) (a)
(b) (b)
(c) (c)
2
(a) (a)
(b) (b)
(c) (c)
3
(a) (a)
(b) (b)
(c) (c)
4
(a) (a)
(b) (b)
(c) (c)

8/9/2019 ACF FSL Manual Final 10
http://slidepdf.com/reader/full/acf-fsl-manual-final-10 173/270171ACF Food Security and Livelihoods Assessment Guideline
SECTION 9.02. SAMPLE CARE PRACTICES INTERVIEW GUIDE TEMPLATE
Overall guidelines
§ Conduct FGD with women (ideally caretakers) & SSI with key-informants to
complete/cross-check the information;
§ Conduct direct observations through household visits;
§ Put DNW when respondents cannot provide requested information.
For specific site/ visited area ONLY
2.1 Total estimated population of site: __________ persons
2.2 Total estimated # of children below 5: __________ children below 5
2.3 Total estimated # of households: __________ HHs
2.4 Average household size: __________ avg. HH size
2.5 Total estimated # of female-headed HHs: __________ female-headed HHs
2.6 Total estimated # of pregnant/lactating women:__________ pregnant/lactating women
2.7 Total # orphaned or separated children: __________ orphaned/separated children
District Livelihood Zone Village / sub-county
Interviewers Date Number of participants
1. General Information
2. Population

8/9/2019 ACF FSL Manual Final 10
http://slidepdf.com/reader/full/acf-fsl-manual-final-10 174/270
Caretakers
3.1 Who are generally the PRIMARY caretakers of the children below 5 in your community
NOW; select the 2 most common options:
H Mother
H Grand-mother
H Sister/brother; specify range of ages: from ________years old to ________years old
H Father
H Grandfather
H Uncle/aunt
H Other; specify:_____________________________________________________________
3.2 Who are generally the SECONDARY caretakers of the children below 5 in your
community NOW; select the 2 most common options:
H Mother
H Grand-mother
H Sister/brother; specify range of ages: from _________years old to ________years old
H Father
H Grandfather
H Uncle/aunt
H Other; specify: _____________________________________________________________
3.3 Were primary/ secondary caretakers generally the same persons before the crisis? Yes/No
3.4 If no, describe the changes & explain why changes occurred
(e.g. migration, displacement, conflict):
3.5 In your community, are mothers generally available to look after children below 5? Yes/No
ACF Food Security and Livelihoods Assessment Guideline172
3. Care Practices

8/9/2019 ACF FSL Manual Final 10
http://slidepdf.com/reader/full/acf-fsl-manual-final-10 175/270
3.6 If no, explain why mothers are not available (in which others types of activities are they
involved?), specify for which period of the year it applies and describe if this situation
was similar before conflict:
Breastfeeding & infant feeding
3.7 In your community, how do caretakers generally feed children:
3.8 In your community, do mothers generally give colostrum after birth? Yes/No
3.9 At what age do exclusive breastfeeding generally stop completely?
H < 4 months
H 4-6 months
H 7-12 months
3.10 Explain the reasons why exclusive breastfeeding stop completely at this age:
3.11 In your community, when food is generally first introduced:
H Before 2 months
H 2-4 months
H 4-6 months
H 6-12 months
N FeedingLess than
6 months
6 months –
12 months
12 months –
24 months
24 months –
59 months
1Breastfeedingonly
Yes/Sometimes/No Yes/Sometimes/No Yes/Sometimes/No Yes/Sometimes/No
2Breastfeeding+ food
Yes/Sometimes/No Yes/Sometimes/No Yes/Sometimes/No Yes/Sometimes/No
3 Food only Yes/Sometimes/No Yes/Sometimes/No Yes/Sometimes/No Yes/Sometimes/No
ACF Food Security and Livelihoods Assessment Guideline 173

8/9/2019 ACF FSL Manual Final 10
http://slidepdf.com/reader/full/acf-fsl-manual-final-10 176/270
If food is generally introduced before 6 months, explain the reasons:
3.13 Are children below 6 months sometimes separated from their mothers in your
community? Yes/No
3.14 If yes, explain:
3.15 Do mothers from your community have problems with breastfeeding? Yes/No
3.16 If yes, explain in details (if answer is “not enough milk”, ask why):
3.17 In your community, describe the typical food generally provided NOW to:
N ChildrenType of food outside breastfeeding (be specific about theindividual foods that are given; e.g. water, milk, egg, oil +t ype porridge)
# of meals perday onl y forchildren
1Less than 6
months
26 months –
12 months
312 months –
24 months
424 months –
59 months
ACF Food Security and Livelihoods Assessment Guideline174

8/9/2019 ACF FSL Manual Final 10
http://slidepdf.com/reader/full/acf-fsl-manual-final-10 177/270
3.18 In your community, do you observe any changes in relation to breastfeeding
or infant feeding compared to before the conflict? Yes/No
3.19 If yes, explain:
3.20 In your community, which water do children below 5 years old generally drink; describe
if any water treatment is conducted:
3.21 Did you observe a change in relation to drinking water quality compared
to before the crisis? Yes/No
3.22 If yes, explain which changes you could observe:
Social structures & networks
3.23 In your community, which social support is important for women (e.g. family,
organizations, mutual aid systems, etc.):
3.24 Did some of these social support systems break-up compared to before
the conflict? Yes/No
3.25 If yes, explain which social support system break-up and why:
ACF Food Security and Livelihoods Assessment Guideline 175

8/9/2019 ACF FSL Manual Final 10
http://slidepdf.com/reader/full/acf-fsl-manual-final-10 178/270
Programming
3.26 When households in the community faced food shortages, how do they cope to feed
their young children; give the 5 main coping strategies:
1.
2.
3.
4.
5.
3.27 Which young children among the community particularly lack a good care
environment; explain:
3.28 What are the 2 main infant and young child feeding concerns of mothers & caretakers
in your community:
1.
2.
Additional comments
3.29 Additional comments related to care practices at this site:
4.1 Do women in your community have the same roles & responsibilities now
compared to before the crisis? Yes/No
4.2 If no, explain the main changes:
ACF Food Security and Livelihoods Assessment Guideline176
4. Women’s roles & needs

8/9/2019 ACF FSL Manual Final 10
http://slidepdf.com/reader/full/acf-fsl-manual-final-10 179/270
4.3 Do women in your community usually do any work to earn money for
the household? Yes/No
4.4 If yes, describe the types of work:
4.5 Did women in your community have similar types of work before the crisis: Yes/No
4.6 If no, explain the changes:
4.7 In your community, do women generally participate in deciding how the
money is spent? Yes/No
4.8 PRA activity profile
4.9 PRA need ranking:
1.
2.
3.
4.
5.
Activities &responsibilities
Activities all year Activities onl y indr y season
Activities only inrainy season
Children
Women
Men
ACF Food Security and Livelihoods Assessment Guideline 177

8/9/2019 ACF FSL Manual Final 10
http://slidepdf.com/reader/full/acf-fsl-manual-final-10 180/270
4.10 Further comments on programming
Appendix 10: Household Questionnaire guidance & template
Purpose: to interview one or more household members using a structured questionnaire to gather
detailed and quantitative information.
Objective: to understand intra-household functioning or the functioning of individual households as
a part of the larger community.
Process:
Preparing for the household questionnaire:
§ Identify the necessary information that would best be obtained at the household level through
quantitative methods.
§ Design a structured question to gather relevant information (may also use or adapt an existing
household questionnaire) that is relatively short (less than 1 hour to administer) and captures
relevant information
§ Pre-test the questionnaire to be sure the questions are providing the information sought and is
clear to respondents.
§ Decide on the most relevant household member(s) to be interviewed.
§ Train enumerators to administer questionnaire in a standardized way that follows questionnaire
exactly
§ Decide on an appropriate sampling strategy to select a representative sample of households.
During the household questionnaire:
§ Introduce yourself and allow for traditional greetings
§Present objectives of the interview, being clear that participating in the household questionnairedoes not translate into receiving assistance.
§ Answer questions that household member(s) have.
§ Ask to ensure that time and location are suitable.
§ Administer questionnaire in a standardized way that follows questionnaire exactly
ACF Food Security and Livelihoods Assessment Guideline178

8/9/2019 ACF FSL Manual Final 10
http://slidepdf.com/reader/full/acf-fsl-manual-final-10 181/270
After the household questionnaire:
§ Check questionnaires for completeness
§ Analyze results quantitatively
§ Use qualitative data to elucidate quantitative results
Common mistakes:
§Waiting to check the questionnaires for completeness.
§ Administering questionnaire before pre-testing.
§ Creating a questionnaire that is too detailed and / or takes a long time to administer.
Household questionnaires can be combined with other data collection methods to obtain more
qualitative information about the households. Household questionnaire design, implementation
(including sampling strategies) and analysis are specific skills that can be guided by technical staff.
SECTION 10.01 HOUSEHOLD QUESTIONNAIRE TEMPLATE
Livelihood Zone District County/sub-county
Parish/Village Livelihood group Reference year
Type of year Interviewers Number of participants in
interviewMen ______ Women ______
1.1 Household/Family size and composition
Number of people inHH living/eating athome daily(include extradependents)
Number of children atschool (boys / girls)
ACF Food Security and Livelihoods Assessment Guideline 179

8/9/2019 ACF FSL Manual Final 10
http://slidepdf.com/reader/full/acf-fsl-manual-final-10 182/270
1.2 Livestock profile
Livestock Type Quantity Remark
Cattle
Cow
Ox/bull
Sheep
Goat
Camel
Donkey
Poultry
Beehives
1.3 Land holdings profile
Land ownedLand cultivated - total(owned +/- rented / grazing land)
Unit for measuring land Land cultivated – food crops
Any irrigated land? Land cultivated – cash crops
Are there any other productive assets (ploughs and any other assets)?
ACF Food Security and Livelihoods Assessment Guideline180
1.4 Other comments on the household and asset profile

8/9/2019 ACF FSL Manual Final 10
http://slidepdf.com/reader/full/acf-fsl-manual-final-10 183/270
2. Food Sources (in % prop. piling)
What foods have been eaten in the household inthe last 24 hours? 1=yes 0=no
Score(0 or 1)
Main FoodSource
Food Source codes
1 = Own production(crops, animals)
2 = hunting, fishing3 = gathering4 = borrowed5 = purchase6 = exchange labour
for food7 = exchange items
for food8 = gift (food) from
family relatives9 = food aid (NGOs etc.)
10 = Other specify:
ACereals – corn soy blend, pasta,rice, ugali, chapatti, sorghum,
biscuit, bread etc.
BRoots and tubers – potato, cassava,sweet potato etc.
C Vegetables – sukma wiki, sombe,spinach, pumpkin, cabbage, tomato,onion, hoho etc.
DFruits – mango, papaya, guava, banana,watermelon, avocado, orange, lemon etc.
EMeat, poultr y, offal - goat, camel, sheep,cow, chicken, liver, kidney, heart etc.
F Eggs
G Fish and seafood – dried or fresh
HPulses/ legumes/ nuts – beans, lentils,nuts, peas, nuts, seeds etc.
IMilk and milk products – fresh,powdered, yogurt etc.
J Oil/ fats – oil, fat, butter, ghee etc.
K Sugar – sugar, honey, sweets etc.
LMiscellaneous – tea, coffee, chat,condiments (royco) etc.
TOTAL HDDS SCORE (0-12)
ACF Food Security and Livelihoods Assessment Guideline 181

8/9/2019 ACF FSL Manual Final 10
http://slidepdf.com/reader/full/acf-fsl-manual-final-10 184/270182 ACF Food Security and Livelihoods Assessment Guideline
3. Income Sources (in %)
1. How many household members currently earn income for thehousehold?
2. How many different sources of income does your household
currently have?
3. How many different sources of income did your household have in anearlier reference period?
4. What is each of these income sources? How much did each source contribute to total householdincome in the last month, and in the earlier reference period? [Use proportional piling to represent thecontribution of each source. Record score below. Note incomes that are purely seasonal or temporary.]
Income sourceReference period(PP score)
Current(PP score)
Own Production
• Livestock (live animal, milk, butter,honey, hides, ox rental)
• Fishing (fish, crab, shrimp)
• Crop (Cereals, Pulses, Oil seeds & Vegetables)
Self-employment (small business)
Petty trade
Sale of charcoal/ firewood
Casual labour
Remittance
Loan
…

8/9/2019 ACF FSL Manual Final 10
http://slidepdf.com/reader/full/acf-fsl-manual-final-10 185/270183ACF Food Security and Livelihoods Assessment Guideline
Of total household expenditure, what was the share of each item in the last month, and in the earlierreference period? [Use proportional piling to represent the share of each item. Record score below.Note expenditures that are seasonal or exceptional.]
ItemsReference period
(PP score)
Current
(PP score)
Food*
Fuel
Water
Education
Health
Transport
Purchase of productive assets
Community obligations
…
4. Expenditure Pattern (in %)
* Within food expenditure, differentiate and rank: staple cereal/tuber, pulse, oil, animal product
5. Expenditure Pattern (in %)
1. Does your household currently have any outstanding food or money debts?
If yes, to whom do you owe money or food? (tick all that apply)
a. Bank/ other formal financial institution
b. Informal money lender
c. Local shop
d. Landlord
e. Family, friends or community members
2. Of these sources, are there any who will no longer lend to you? If so which ones?(note the letter of the source)
3. What are the primary uses for the credit? (tick all that apply)
a. Food
b. Health
c. Water
d. Other (specify)
4. What is the amount of your debt liability currently and in an earlierreference period?
Referenceperiod
Current

8/9/2019 ACF FSL Manual Final 10
http://slidepdf.com/reader/full/acf-fsl-manual-final-10 186/270184 ACF Food Security and Livelihoods Assessment Guideline
6. Agricultural Production
6.1 Livestock Production
6.1.1 Milk Production
Type# of milkinganimals
Production peranimal per day
HHConsumption
Quantity soldOther use (e.g.gifts, paymentfor labour)
Cows
Goats
Sheep
Camel
6.1.2 Sale of Livestock and Livestock Products
Type Quantity When? Price per unit sold
Cow
Ox
Goats
Sheep
Poultry
Camel

8/9/2019 ACF FSL Manual Final 10
http://slidepdf.com/reader/full/acf-fsl-manual-final-10 187/270185ACF Food Security and Livelihoods Assessment Guideline
6.1.3 Source of animal feed/water
Description Management/Utilization Access/use right (Market source)
Communal/clan Grazing land
Crop residue• Own production
• Purchase
Green forage production• Own production
• Purchase
Concentrates (Purchase)• Cereals
• Molasses
• Salt
Type Access Payment/unit
1. Stream/rivers beds
2. Trough/Borehole
6.1.4 Animal Health
Main Diseases (Rank according to Importance)
Diseases Season Remark
1.
2.
3.
4.
Water Source for Animal

8/9/2019 ACF FSL Manual Final 10
http://slidepdf.com/reader/full/acf-fsl-manual-final-10 188/270186 ACF Food Security and Livelihoods Assessment Guideline
Description Remark
% of Population
Market source
Prices
Vet. Services Remark
District/Sub-county level
Payment
Population Coverage (%)
Challenges Solutions
Veterinary Drugs
Veterinary Services
Veterinary Services

8/9/2019 ACF FSL Manual Final 10
http://slidepdf.com/reader/full/acf-fsl-manual-final-10 189/270187ACF Food Security and Livelihoods Assessment Guideline
6.2 Crop Production
6.2.1 Cereals, Pulses and vegetables Production
Crop Type Cultivated area (acre) Yield/acre (kg/acre) Total (quintal)
Sorghum
P. Millet
F. Millet
Maize
Cassava
6.2.2 Utilization
Crop TypeConsumption(in kg))
Quantity sold / exch. (in kg))
Price/kg Total (quintal)
Sorghum
P. Millet
F. Millet
Maize
Cassava

8/9/2019 ACF FSL Manual Final 10
http://slidepdf.com/reader/full/acf-fsl-manual-final-10 190/270188 ACF Food Security and Livelihoods Assessment Guideline
6.2.3 Agricultural Inputs Utilization
Description Remark
1. Type of Inputs
2. Quantity/Unit
3. % of population
4. Market source
5. Prices
6.2.4 Main Crop Pests and response of farmers (Rank according to importance)
Pests Remark
1.
2.
3.
4.
5.
6.2.5 Main Challenges/constraints for Crop production (Rank according to importance)
Challenges Solutions
1.
2.
3.
4.

8/9/2019 ACF FSL Manual Final 10
http://slidepdf.com/reader/full/acf-fsl-manual-final-10 191/270189ACF Food Security and Livelihoods Assessment Guideline
7. Coping Strategies [A CONTEXT-SPECIFIC CSI CAN ALSO BE ELABORATED]
No. QuestionFrequency score:Number of days out of thepast seven (0 -7).
In the past 7 days, if there have been times when you did not have enough food or money tobuy food, how often has your household had to:
1
2
3
4
5
TOTAL HOUSEHOLD SCORE:

8/9/2019 ACF FSL Manual Final 10
http://slidepdf.com/reader/full/acf-fsl-manual-final-10 192/270190 ACF Food Security and Livelihoods Assessment Guideline
SECTION 10.02 – WATER, SANITATION AND HYGIENE HOUSEHOLD QUESTIONNAIRE TEMPLATE
Homestead Pasture
First water source type:
Use:Drinking/Cooking/Washing/ Bathing/Agriculture/Livestock
Drinking/Cooking/Washing/ Bathing/Agriculture/Livestock
What volume do you collect(specify litres per day or week):
Distance/reliability (seasonal?):
Second drinking water source, ifno water at first.
How maintained?
Do you treat drinking water (boil,filter, etc.)?
Defecation place:
If no household latrine, why?
When do you wash your hands?
Prevalence of diarrhoea/ malaria/ other waterborne diseases(# people in household in last
2 weeks, # of children <5):
Source(s) Distance/Reliability
Who disseminates health/ hygieneinformation
What are the key messages
Needs/ constraints (water,sanitation, hygiene)

8/9/2019 ACF FSL Manual Final 10
http://slidepdf.com/reader/full/acf-fsl-manual-final-10 193/270191ACF Food Security and Livelihoods Assessment Guideline
Appendix 11: Participatory and Rapid Appraisal Methods
The Participatory and Rapid Appraisal Methods (PRA) Appendix is divided into separate sections for
each of the PRA methods presented in Chapter 2 (i.e., Transect Walk, Mapping, Seasonal Calendars,
Venn Diagram, Proportional Piling, Ranking, Capacity and Vulnerability Analysis). Each section
includes an overview of the specific PRA method, general process for conducting the PRA method,
common mistakes and how to avoid them, applications and examples. The PRA Appendix is not
intended to be a comprehensive instructional guide on PRA methodology but rather to provide an
overview with special consideration of how to incorporate PRA methods into food security and
livelihood assessments. Facilitation skills such as listening, encouraging all the participants to
actively participate, particularly by commenting on variations (different possibilities reflecting
different perspectives), allowing time for participants to consult and change if they find it necessary
are important for all PRA methods.
PRA methods are a critical component of food security and livelihood assessments and offer rich
qualitative data about the environmental and social context. Flexibility is a basic principle of PRA.
Some of the information collected or the way it is collected may change as the food security and
livelihood assessment proceeds. Referring back to the food security and livelihood assessment
objectives will keep the assessment on track. PRA methods are often used together or in a specificsequence to provide a more complete picture of the overall current conditions and if possible
changes over time.
The logical framework above demonstrates how PRA methodology combined with other aspects of
data collection such as household questionnaires work together to inform food security and
livelihood assessments. In the lower right-hand side, highlighted in orange, are a collection of PRA
methods – the village transect walk informs a village mapping session to create a map using both
sources of information. Seasonal calendars are then used to help describe the household typology.
This combination of PRA tools provide information on descriptive, spatial and temporal, that is
community-specific and more detailed, aspects of food security and livelihoods in the community
than the more general household questionnaires. The descriptive PRA methods inform both
additional PRA methods (i.e., problem ranking sessions) and feed directly into forming outputs.Problem ranking and stakeholder analysis inform capability and vulnerability analysis and are more
PRA Logical Framework
Logic and relations
Problem rankingand causes
Village mapping –transect
Needs and strategies
(Analytical)
SWOT(Capacities and vulnerabilities)
Type of activitiesto develop and implement
Indicators – resources –Cross checking
(Assets practices)
Resources, livelihoodsactivities, and vulnerability
(Descriptive / spatial
and temporal)
HH questionnaires
Stakeholders analysis Village transect walk
Data treatment
Outputs:• Targets – selection• Rational• Activities & volume• Timeframe
• Partnerships
Seasonal Calendars
Typology households

8/9/2019 ACF FSL Manual Final 10
http://slidepdf.com/reader/full/acf-fsl-manual-final-10 194/270192 ACF Food Security and Livelihoods Assessment Guideline
analytical components of the PRA methods which also directly inform outputs. In addition, other
information gathering techniques such as household questionnaires inform the outputs. The logical
framework presented here is for illustration only. The correct combination of PRA methods will
depend on the specific food security and livelihood assessment objectives that are set.
11.1 Transect walk
Transect walks take ACF staff members through a specified area – region, village or smaller area
such as a farm or market – in order to gain a sense of the overall landscape and points of interest
such as locations of agricultural activity, water sources, schools, markets, and health centres. To a
lesser or greater extent, observation is an important part of all information gathering methods and
in particular PRA methods. Transect walks lend themselves to direct observation of specific
physical conditions of the environmental and social context to intentionally observe especially those
that may be sensitive in nature. Sensitive topics may include conditions of crops and livestock,
physical appearance of people and living conditions, and interactions between people.
Purpose: to explore an area such as a region or village or a more contained, smaller area such as a
market or farm with the help of specific guides who know the area in great detail.
Objective: to provide important contextual information – physical and social - about the specified
area including points of interest and sensitive topics that is important to the food security and
livelihoods assessment.
Process:
Preparing for a transect walk :
• Decide on the necessary information to be collected based on food security and livelihood
assessment objectives. Transect walks are particularly useful tools for collecting information on:
§ The types of vegetation and animals both wild and domesticated that exist in the area;
§ Signs of agricultural activity such as cultivated or maintained land, pastures, crops, livestock,
harvests drying in trees or being prepared for storage or use, locations of barns and water sources
to crops, livestock and housing;
§ Living conditions such as location of dwellings (clustered or dispersed), abandoned areas,
physical conditions of houses, WASH, and physical appearance of people;
§ Access to specific locations such as proximity of houses to markets, road conditions, proximity
of social centres, religious centres, health centres or hospitals, schools;
§ Sensitive topics such as conditions of crops and livestock, physical appearance of people and
living conditions, and interactions between people.
• Locate a map of the area from secondary sources and define the parameters of the area. Large
areas such as a region or disperse village may need to be divided into sections.
• Identifying one or more guides (e.g., women, farmers, representatives from different religious
orders) from the area to accompany you. Guides may be chosen based on the necessary
information to be collected, and the guides detailed knowledge of the area and the people.

8/9/2019 ACF FSL Manual Final 10
http://slidepdf.com/reader/full/acf-fsl-manual-final-10 195/270193ACF Food Security and Livelihoods Assessment Guideline
During a transect walk :
• Walk the periphery of an area to help identify marginalized sections, give a sense of the overall
size, points in and out of an area, and connections to other places.
• Walk in circles and zigzags to help find routes that are less travelled.
• Talk to people along the way.
• Look carefully, listen, observe and record information along the way.
• Cross-check information in different locations during the transect walk.
After a transect walk :
• Write up findings directly after completing the walk.
• Follow up on any data that was unexpected or any gaps in information.
Note: those being observed may change behaviours in the presence of an observer. Being as
discrete and casual as possible and / or having ACF country staff conduct the transect walk will
help decrease changes in the environmental or social conditions.
Common mistakes and how to avoid them:
§ Choosing convenient sites and paths (e.g., walking in a straight line). Follow a sampling strategy
to capture representative areas and people as well as walking on less common paths.
§ Looking for specific behaviours or conditions based on preconceived ideas. Create a structured
checklist of environmental characteristics or specific questions rather than specific behaviours
before heading out into the field. Data collection sheets with a section for notes of unexpectedobservations of interest will allow for collection of additional relevant but unplanned information.
§Walking quickly or talking too much gives a rushed feel that may encourage people to usher you
away or feel uncomfortable. Plan your time accordingly. Develop a priority list of necessary
information based on food security and livelihood assessment objectives. If you do not have time
to gather all the relevant information, choose the priorities that need to happen during a specific visit.
§Writing everything observed down will attract attention and is likely to change behaviours. Refer
back to the food security and livelihood assessment objectives and keep focused on the
necessary information you have decided to obtain.
Application: Village transect walks provide the initial context of the food security and livelihoods
assessment. Transect walks offer the first pictures, identification of different areas and visualization
of conditions, constraints, and opportunities. Information gathered from observation of the
landscape is triangulated during semi-structured interviews with key informants and focus groups
on aspects of food security and livelihoods such as the way the land is used, types of vegetation and
soils, cultural practices of farming and livestock-raising, types and location of water resources. A
schematic synthesis of this information can form the basis for the identification of livelihood zones.
Transect walks may also be used to gather information on how things change during different times
of the year and may be combined with seasonal calendars as well as mapping sessions.

8/9/2019 ACF FSL Manual Final 10
http://slidepdf.com/reader/full/acf-fsl-manual-final-10 196/270194 ACF Food Security and Livelihoods Assessment Guideline
Examples: Transect Walks
Information gathered during a Transect walk
The geography, animals, annual and perennial crops are identified as important aspects of the area.
Problems and opportunities regarding these specific aspects have also been identified.
Resources and Social Mapping session were informed by the Transect Walk. Information collected
during the mapping session included:
Resources mapping: Natural, Productive, Market, WASH
Social mapping: Health structures, Education, Economic structures, Poverty/vulnerability areas
More detailed map combining data from Transect Walk and Mapping session
Animal Passage Way
Market Stalls
Homes
Agriculture Fields
Borehole
Transect Walk

8/9/2019 ACF FSL Manual Final 10
http://slidepdf.com/reader/full/acf-fsl-manual-final-10 197/270195ACF Food Security and Livelihoods Assessment Guideline
11.2 Resources, Social and Hazard Mapping
Maps from secondary sources are useful tools for planning an FSL assessment – identifying regions
that are most likely to experience the impact of a shock, planning the logistics of travelling
to specific locations and starting to determine the most useful information to gather. If relevant
information on the current situation exists, maps can also be used to compare changes between two
time periods. Mapping as a PRA tool, on the other hand, provides essential detailed information
directly from the people most affected by the current environmental or social conditions. Transect
walks are useful complements to creating and interpreting results from mapping sessions. Mapping
as a PRA tool is essential for developing and implementing short-term interventions and longer-term
programs that most appropriately and efficiently address the current situation.
Purpose: to engage community members in identifying the resources and infrastructures that
support food security and livelihoods and the dynamics of an area such as the flow of people within
and between communities, the interactions between different groups living within or surrounding
an area.
Objective: to describe the layout of an area – a region, village, or specific smaller location (e.g.,
farm, market) – by identifying key community centres and landmarks such as churches or schoolsand infrastructure that impact food insecurity and livelihoods directly or indirectly such as pastures,
cultivable land, health centres, WASH, and locations of specific groups defined by characteristics
such as wealth.
Mapping may be used to group areas within a village or region that have similar characteristics –
keeping in mind that no two areas are identical. Grouping areas with similar characteristics is
useful for targeting interventions.
Process:
Preparing for a mapping session:
• Decide on the necessary information to be collected based on the food security and livelihoods
assessment objectives
§ Social factors such as housing conditions, family structure, group dynamics;
§ Access such as proximity to markets, schools and other education centres, health centres, work
opportunities, water, roads, transportation;
§ Geographical characteristics such as plateau, valley, mountainous, coastal;
§ Agronomic factors such as cultivable land, irrigation systems in place, drought levels, type ofagronomic activities (e.g., farming, animal husbandry);
§ Economic activities such as subsistence production, cash crops, livestock, fishery, off farm
income generation.
• Decide on the types of mapping to use based on the necessary information:
§ Social mapping: infrastructures (e.g., health centers, education and schools, markets, roads),
livelihoods, vulnerabilities (e.g., poorest, marginalized, least healthy groups or areas most prone
to floods, droughts and least likely to be able to cope with those changing conditions)
§ Resource mapping: natural resources, productive resources (e.g., irrigation networks, waterholesfor livestock, harvest stores, processing infrastructure, mines), WASH

8/9/2019 ACF FSL Manual Final 10
http://slidepdf.com/reader/full/acf-fsl-manual-final-10 198/270196 ACF Food Security and Livelihoods Assessment Guideline
§ Temporal mapping: pre- and post-shock, intergenerational
§ Hazards mapping to identify areas, resources and groups at risk from climate and other hazards
and to analyse potential or actual changes in hazards and plan for risk reduction.
§Market mapping: (see Appendix 23)
• Decide on the methods that will be used to gather the necessary information, a combination of
transect walks, interviews, and focus groups are common information gathering methods used to
create maps – keeping in mind triangulation is an essential component of mapping.
• Decide on the specific individuals or group(s) who would provide a range of perspectives on the
necessary information. Key informants should know the geographical area in great detail.
• Decide on the areas to map based on the necessary information to be collected.
• Gather materials based on the individuals or group(s) to be interviewed. Mapping may be done
using a variety of materials such as on the ground using stones or other objects to represent
different aspects of the community, a sheet of paper along with different colored pens andstickers, or on a chalk or white board.
During a mapping session:
• Clearly identify the objectives of the mapping exercise in broad terms to participants (e.g., we want
to identify aspects of the farm that impact food production, access and utilization). Being specific
will make it easier for participants to answer the questions at the same being too specific may limit
ideas and leave out important information. Finding the correct balance between being specific and
being open is important and is best determined during the interaction with participants when the
facilitator has as sense of how much guidance the group needs to participate and to provide the
necessary information without going too far afield.
• Hazard Mapping is an extension of creating a representative map of the community. When
participants have finished the physical map of the community, ask participants to identify areas that
are at risk of specific hazards such as natural disasters (e.g. low lying areas that flood easily, areas
prone to drought), higher health risks (e.g., malaria) and social and political issues such as conflict
or land tenure or distribution. Note these hazards on the map in a different colour market to
distinguish them from other community characteristics. Hazards that are not part of the map should
be noted on the side. Then ask participants to identify which areas on the map have few or
no hazards.
• Hazards are likely to affect different groups in different ways. Results from hazard mapping can
inform Venn diagrams and ranking to identify who has the resources and capacity to help in theplanning process to reduce risks around hazards and who has access on a regular basis or in
emergencies to places where hazards are fewer or non-existent.
After a mapping session:
• Use triangulation to integrate knowledge from different social groups such as wealth, gender and
age thereby reducing bias and increasing accuracy.
• Synthesize the data that has been collected from various sources.
• Identify any gaps in information and follow-up to close those gaps.

8/9/2019 ACF FSL Manual Final 10
http://slidepdf.com/reader/full/acf-fsl-manual-final-10 199/270197ACF Food Security and Livelihoods Assessment Guideline
• Identify inconsistencies in data and determine why these inconsistencies exist. If it is essential to
have more accurate information where inconsistencies exist, then conduct direct observation,
transect walks or additional key informant interviews to clarify.
Common mistakes and how to avoid them:
§ Overlooking areas of marginalized groups.
Ask about areas of the village that do not have the main activities, along with incorporating transect
walks into the food security and livelihoods assessment will increase the likelihood of including
marginalized groups.
§Mapping an entire region or village when a smaller area would provide the appropriate amount of
information. Refer back to the food security and livelihood assessment objectives.
§ Leaving the time frame or questions too open ended.
Set a time limit for completing the mapping session. Focus the questions and be as specific as
possible about the outcomes for the mapping session. Base questions on the food security andlivelihood objectives being met through mapping.
Application: Illustrations of the cultivation systems (crop rotation by illustrating the percentages of
the surface are concentrated to each cultivation system or crop rotations during the year) and
breeding/herding systems (pastoral activities around water points or diagrams concerning the paths
of seasonal migration) can be extremely useful for food security and livelihood assessments.
Example: Resources and social mapping – Philippines
The resources and social map identifies locations of churches and other structures (along with
building material – concrete, semi-concrete, light material), infrastructure (e.g., roads),
environmental characteristics (e.g., seashore, swaps, streams), food sources (e.g., coconutplantations, rice fields, pigs) and water sources (e.g., wells). The mapping provides a picture of the
proximity of village characteristics to each other.

8/9/2019 ACF FSL Manual Final 10
http://slidepdf.com/reader/full/acf-fsl-manual-final-10 200/270198 ACF Food Security and Livelihoods Assessment Guideline
11.3 Seasonal Calendar and Historical Timeline
Seasonal calendars are one of the most commonly used tools for gathering information quickly and
accurately and helping to understand seasonal patterns related to community conditions such as
specific activities (related to activity profiling, which are often for shorter time periods than an
entire year), weather patterns, production, income, credit, markets and morbidity. Seasonal
calendars are a useful tool to assess conditions and changes in conditions over an entire year or
portion of a year that influence food security and livelihoods. Seasonal calendars are also useful for
designing intervention timeframes and program monitoring.
Purpose: to engage community members (individuals or small groups) in discussions about
traditional planning of activities, and seasonal variations in environmental, social and health
conditions.
Objective: to identify the time of the year that agricultural, economic, social and other activities are
undertaken; the hunger gap and food surplus occur; other aspects of the community that influence
food security and livelihoods occur (e.g., disease cycles) in order to understand and compare
seasonal changes of these conditions over a one year time span within a specific community or
between different years.
Seasonal calendars are also used to compare how different people during the same time of year
(e.g., men and women) or the same people during different times of the year or before and after a
shock allocate time to specific activities.
Process:
Preparing for seasonal calendars:
§ Decide on the necessary information based on the food security and livelihood assessment
objectives that is best obtained through seasonal calendars
§ Decide which community members will provide the necessary information (e.g., individuals or
small groups – who to include in the small groups) based on time, other resources and detail of
information needed.
§ Identify the best practices to engage chosen community members in creating a seasonal
calendar such as pictures of certain conditions to post or written words or combination of both.
§ Decide whether seasonal calendar session will be focused solely on creating the calendar or part
of a more extensive interview. Seasonal calendars may be integrated into a more extensive key
informant interview or as the sole purpose for the interview. However, for group sessions to have
the seasonal calendar as the only outcome generally works best.
§ Obtain materials to conduct seasonal calendar sessions.
During a seasonal calendar session:
§ Ask participants to list all the activities that are done throughout the year.
§When the list is completed, ask if there are any other activities that precede or come after the
activities currently listed.
§ Then ask when during the year the various activities are achieved.

8/9/2019 ACF FSL Manual Final 10
http://slidepdf.com/reader/full/acf-fsl-manual-final-10 201/270

8/9/2019 ACF FSL Manual Final 10
http://slidepdf.com/reader/full/acf-fsl-manual-final-10 202/270200 ACF Food Security and Livelihoods Assessment Guideline
§ Utilizing seasonal calendars only in the village setting
The seasonal calendar methods described here are easily adapted to the urban and peri-urban
context. In an urban and peri-urban setting there is likely more variation in the community conditions
between community groups and specific land areas. The urban calendar will have more focus on
labour markets and diversity and seasonality of income sources.
Applications:
Besides providing general contextual information, seasonal calendars also support the use of
specific assessment tools by specifying the seasonal dimension of phenomena such as: Markets,
Hazards, Food and Income Sources, Patterns of Expenditure, Meal Frequency, Dietary Diversity and
Water Access and Availability. Because of the integrated nature of the seasonal calendars they may
provide important data for other information gathering methods. For example, weather patterns such
as droughts, floods and typhoons identified in seasonal calendars can be linked to hazard mapping.
Seasonal calendars can also provide information on how time allocations for one activity (e.g., land
cultivation) may compete with other activities (e.g., child caring practices).
Examples: Seasonal Calendars
Community members created seasonal calendars to describe important components of the
community that impact food security and livelihoods such as weather and calamities, agricultural
production and work, animal production, fishing, food substitutions (wild food gathering), migration,
daily work and income opportunities, workload, maximum and minimum income and expenditures,
social events, and diseases.
Seasonal Calendar
C u l t
i v a t i o n
C = Cyclone L = Landslides F = Floods D = Drought
Land Preparation X
Sawing X X
Weeding X X X
Harvesting X
Threashing X X
Storage Repair X X
Storage Filling X X X X
Storage Closure
Housekeeping X X X X X X X X X X X X X X
Community Activities X X X X X X
Meal Frequency 2. 5 2 2 1. 5 1 4 3
Natural Hazards C, L, F C, L, F L, F D D D
Jan Feb Mar Apr Jun Jul Aug
C h o r e s
O t h e r s
C e r e a l
S t o r a g e
Weather / Season
Seasonal calendar - Philippines

8/9/2019 ACF FSL Manual Final 10
http://slidepdf.com/reader/full/acf-fsl-manual-final-10 203/270
ACF staff will often be responsible for transferring the large poster-type calendar as seen above into
a table for program planning and reports. During the transfer the information should be identical
even if information is represented by different ways. For example, the rain clouds and smiling suns
in the first figure may be translated to periods of high, medium and low rain in a corresponding table.
(Note: these Figures represent two different areas in the Philippines so the transfer is not identical
from one figure to the other and are provided here for purposes of illustration only). Transferring the
information from the poster to a table is best done on the same day while you can enlist participantsto help clarify any aspects that are unclear.
Agricultural seasonal calendar - Indonesia
The seasonal calendar below focuses specifically on agricultural production and uses different
colours and indicators (high, low or I, II) to provide more detailed information about agricultural
production within a single calendar. The agricultural seasonal calendar can be combined with other
seasonal calendars describing community activities to provide a more complete picture of
contributors to food security and livelihoods.
201ACF Food Security and Livelihoods Assessment Guideline
Seasonal calendar transferred from group participation poster to smaller chart
Jan Feb Mar Apr May Jun Jul Aug Sep Oct Nov Dec
General
High rain
Medium rain
Low Rain
Landslide, flood & typhon
Diarrhea
Production activities
F- Field work Rice rainfed H H H H H H H H H S S S S
S- Sowing Rice irrigated S S F F F F H H S S S S F F H H H H
H- harvesting Corn H H F S S S S F F F F H H H H H S S S F F H H
Potatoes H H S S S S H H H H H H H H H H H H
Livestock
Reproduction (goat)
Chicken
Pork, cattleSale
FisheryHigh Season fish
Low season
Income and credit
Daily Work opportunities
Low general income
High general income
Indebt credit
Low general expenditures
High general expenditures
General level of workload
High
Medium
Low

8/9/2019 ACF FSL Manual Final 10
http://slidepdf.com/reader/full/acf-fsl-manual-final-10 204/270

8/9/2019 ACF FSL Manual Final 10
http://slidepdf.com/reader/full/acf-fsl-manual-final-10 205/270203ACF Food Security and Livelihoods Assessment Guideline
N.B. The baseline information is October 1996 to September 1997. It was a poor/medium year in
terms of rainfall, insecurity and cereal production.
Example: Timeline of production and major events 1993/4 – 2003/4
Year Description Factors impacting on household access to food and income
1994/5 Poor Poor rain, poor harvest, relief distribution.
1995/6 Good Heavy rainfall/floods, surplus food production, cereal prices very low, no relief
1996/7 MediumMedium rain, poor/medium harvest due to pest infestation, food stocks carriedover, no relief
1997/8 MediumPoor rainfall, exhaustion of carried over food stocks, limited reliefwas distributed
1998/9 Poor Poor medium rainfall, food socks exhausted and in security (Zaghawa & Arab)
1999/0 Good Heavy rain with floods & birds, surplus food production and low grain prices.
2000/1 PoorGood rain, medium harvest, food stock carried over, insecurity:
Fur/Arab conflict
2001/2 Poor Drought, conflict continued. Relief distributed, SFP and TFC.
2002/3 Poor Poor rains, conflict (Fur & Arab), relief, SFP and TFC.
2003/4 MediumModerate cereal production, conflict (Fighting between Government and SudanLiberation Army started).

8/9/2019 ACF FSL Manual Final 10
http://slidepdf.com/reader/full/acf-fsl-manual-final-10 206/270204 ACF Food Security and Livelihoods Assessment Guideline
11.4 Venn Diagrams
Purpose: to engage small groups of community members in discussions about the role of diverse
entities and the relationships between them.
Objective: to identify the informal and formal institutions which influence a specific aspect of the food
security and livelihoods assessment, the relative importance of institutions to each other and the
interactions between entities for decision-making, cooperation and problem solving and the
disconnections and gaps between institutions.
Process:
Preparing for a Venn diagram session:
§ Decide on the necessary information based on the food security and livelihoods assessment
objectives that is best obtained through Venn diagrams including, social capital, social networks,
institutional and policy environments
§ Decide which community groups will provide the necessary information (e.g., men and womentogether, or separately, elders, younger generations, better-off, poor)
§ Obtain materials to conduct Venn diagram session. Different coloured paper, scissors, a large
piece of paper or board to serve as the base or background. Venn diagram sessions can also be
done with markers and a paper or white board. However, paper can be cut out by participants to
different sizes (showing relative importance) and shapes (to distinguish between types of groups)
and a unique advantage of paper cut-outs over markers is that the cut-outs can be moved around
easily to reflect changes in thinking as the discussion evolves.
During a Venn diagram session:
§ Clearly state that the objective of the session is to identify the institutions, relative importance(influence) of institutions to each other, and relationships between institutions around the food
security and livelihoods topic of interest
§ Ask participants to list all the formal and informal institutions within the village that may have
influence over the topic of interest
§When the list is completed, ask participants to list any institutions outside of the village that may
have influence over the topic of interest. Indicate that the list of outside institutions will be put aside
for a moment but want to come back to them after discussing the within village institutions.
§ Ask participants to estimate the relative importance (how much influence) each institution withinthe village has on the topic of interest.
§ Ask participants to put institutions into specific categories (local groups like the solo parents
organization, international groups like the Red Cross, government, informal institutions). There
will likely be different categorizations in different villages. The important task is to put institutions
that have similar characteristics together.
§ Choose a separate colour for each category. Cut different size circles in each colour to represent
the relative importance of different entities. Some institutions will have equal influence and
therefore should have the same size circle.

8/9/2019 ACF FSL Manual Final 10
http://slidepdf.com/reader/full/acf-fsl-manual-final-10 207/270205ACF Food Security and Livelihoods Assessment Guideline
§ Ask participates to write the name of an entity on each circle. (NOTE: shapes may be used instead
of colours or a combination of shapes and colours. Also, cut-outs can be made beforehand to
save time).
§ Place a large circle (fixed) in the center of the base to represent the topic of interest. Ask
participants to place circles (or movable cut-outs) on a base relative to the fixed circle and to one
another. The closer a circle is to the fixed circle the more important it is. Overlap representsinteractions between entities and the degree of overlap represents the amount or intensity of
interactions. Note: that while some entities have very little direct influence on the topic of
interest (and would therefore be far from the center) but have overlap with an organization that has
a lot of influence that is close to the fixed circle (forces the non-influential entity closer to the fixed
circle by virtue of having to overlap with the influential one) and therefore gains importance. Also
remember that the Venn diagram session is not to obtain definitive influences or importance of
entities but rather provide an overall schematic of how participants view these relationships.
§ Review the Venn diagram for completeness and clarity.
§ Ask participants about any additional information that would be useful regarding the relationships
of village institutions for the food security and livelihoods assessment
§ Remind participants about the list of institutions outside of the village. Ask about the relative size
(influence) of these institutions and the overlap or gaps between the current list of within village
institutions. Providing on overview but not the level of detail obtained from the within village Venn
diagram session.
After a Venn diagram session:
§ Transfer data from posters (if used) to smaller paper or computer, on the same day as collection,
if at all possible. Venn diagram data is slightly more difficult to transfer and interpret than other
types of PRA methods. However, copying the schematic may not be necessary or a rough
drawing will do. Recording the names of specific entities, relative influence, the interactions
between them and gaps is important information to integrate into a food security and livelihoods
assessment.
§ Clarify any statements or data that is inconsistent or unclear during transfer
Common mistakes and how to avoid them:
§ Too many sizes, shapes or colours become confusing
Venn diagrams rely on having a visual variety of choices. However, this variety can also be controlled
so that the diagram is informative and not overwhelming because too many choices may make theresults less useful. It may be beneficial to limit the number of sizes to four: Very Important,
Important, Less Important, Minimally Important. The same limits can be places on shapes or colours,
such as having five or ten categories of institutions: Governmental, NGOs, Local Community Groups,
Other Formal Institutions, Informal Institutions. It is also important to list all relevant individual
institutions to create an overall picture and then cluster them into categories of similar institutions
where possible. Venn diagrams for food security and livelihoods projects can also more traditional
approaches by just using only overlapping circles. The decision on which Venn diagram materials to
use depends on how much detail is required to meet the food security and livelihood assessment
objectives being addressed through the session.

8/9/2019 ACF FSL Manual Final 10
http://slidepdf.com/reader/full/acf-fsl-manual-final-10 208/270206 ACF Food Security and Livelihoods Assessment Guideline
Applications:
Venn diagrams are often an early step in PRA methods and can inform which key informants to
interview, integrating transect walks and observations as a means of triangulation. Information
gathered through Venn diagrams and confirmed by other PRA methods can be used to identify
important communication gaps and areas to foster communication when developing and
implementing an intervention.
Examples: Venn Diagrams
Community members used a Venn diagram session to identify key stakeholders and describe the
relationship of these important groups (e.g., women, senior citizens, pastoral group, solo parenting
organization, the dynamic club, the Red Cross) in relative terms to the central issue. Different shapes
and colours symbolize the variety of influences on the central issue. Allowing participants to see
pictorially how groups or influences of a specific type cluster together and or overlap. The
proximity of each symbol to the central issue represents the amount of influence on the central issue
(sometimes the size of the shape is used to convey importance).
The Venn diagram directly above provided information on stakeholders (public & private), activities
and services, means and relations, presence and usefulness, and identified gaps and difficulties
to address.
Outputs: Identification stakeholders, relationships within communities
Venn Diagram - Example
YouthAssociation
Councilof Elders
Political
Power
Venn Diagram
Sub-Prefect (Social)
Village Sambaya
Village Sigon
Village Nyulama
Council of Elders:Village Foulasso
Council of Elders:Village Linson Foubhe
Council of Elders:Village Kagnegande
Council of Elders:Village Basson
Vice President
Councillor
Muezzin
Health Service
Pastoral Service
District Council:Kagnegande
Water + Forestry Service

8/9/2019 ACF FSL Manual Final 10
http://slidepdf.com/reader/full/acf-fsl-manual-final-10 209/270207ACF Food Security and Livelihoods Assessment Guideline
11.5 Proportional piling
Proportional piling involves asking a specific question and allowing community members to answer
by showing the relative importance of different categorical choices through a visual aid that can be
translated into percentages. Participants are asked to allocate all the counters (e.g., stones, beans,
bottle tops) to represent piles of a specific aspect of the food security and livelihoods assessment
such as each food source. The end result is a few piles each representing a different food source.
The pile size corresponds to the relative importance of that food source. The importance or weight
of each activity or item is determined by comparing the different activities or items to each other.
Purpose: to engage community members who may not have the skills in formal numeracy in
estimating proportions on specific community or household characteristics, where numbers are
needed to quantify trends.
Objective: to obtain quantitative data in the form of proportions on specific community or
household characteristics related to food security and livelihoods such as relative production of
crops, food sources, income sources, household expenditures, time allocations, or population
characteristics (e.g., wealth status).
Proportional piling may also be used to assess changes in the relative importance of community or
household characteristics over a specific time period.
Process:
Preparing for a proportional piling session:
§ Decide on the necessary information to be collected based on food security and livelihood
assessment objectives. Proportional piling is useful for collecting information on:
• Food sources such as own production, market, gifts from family, neighbours or other friends, wild
foods, food aid, theft;
• Household expenditures such as staple foods, non-food items, health, education, debt, rent;
• Household incomes such as selling crops, casual labour, sale of non-food items, work in industry,
mines, crafts, or commerce;
• Time allocations (within a specific time period) such as caring for children, tending to crops,
cooking, collecting water.
§ Decide on which individuals or groups (e.g., livelihood groups, women) to include based on the
necessary information to be collected.
§ Gather materials to conduct proportional piling session. The basic materials include counters
(e.g., stones, beans or bottle caps) and sticks, paper or other material to create distinct areas for
each categorical choice. Provide an adequate number of stones to give participants the
flexibility to establish the most accurate estimates of proportions. The basis of the calculation is
100%. The number of stones will determine how much each stone is worth proportionally. For
example, for 20 stones, each has a 5% value, for 10 stones, each as a 10% value.

8/9/2019 ACF FSL Manual Final 10
http://slidepdf.com/reader/full/acf-fsl-manual-final-10 210/270208 ACF Food Security and Livelihoods Assessment Guideline
During a proportional piling session:
§ Clearly identify the objectives of the proportional piling session. For example, we want to get a
sense of the food sources and if people rely on some food sources over others.
§ Clarify the steps in the proportional piling session. First, we will identify the different food sources.
Second, we will determine the relative importance of food sources by placing stones in each food
source category. The more stones, the more important, that is the more often people rely on that
food source.
§ Ask participants to list all the specific categories relevant to the necessary information to be
collected. For example, list all of the food sources. If there are specific categories missing, follow
up by asking participants if there are additional (list missing sources) food sources such as
borrowing or receiving food from family.
§ Give participants the stones and ask them to divide the stones into each category (separate piles)
according to the total amount of food accessed through that source. Emphasize that the stones
represent the relevant importance or overall community (or a specific group within the community
(e.g., poor households) and not individual community members. For example, the stonesrepresent all the food that a household obtains during the dry season or all the people in the
community (not any specific individuals).
§ Repeat the process for each community or household characteristic relevant to the individual or
group participating. Note: some characteristics are preferential to be asked about first while
others may be done together. For example, it is often easier for participants to answer questions
regarding expenses rather than resources or incomes and asking about food and income sources
during the same round can be beneficial.
After a proportional piling session:
§ Calculate percentages from the proportion in each categorical choice (pile).
§ Transfer information from temporary materials, such as on the ground with stones, to paper
for reports.
§ For graphic displays, put percentages into pie charts or bar graphs that are useful to include in
reports or presentations.
Common mistakes and how to avoid them:
§ Participants divide piles up evenly between categories
Clarify with participants that proportional piling is a two step process. The first step is to identify the
choices for each condition (identification of piles). The second step is to put the relative number of
stones into the appropriate pile (proportional attribution). Determining which of the choices are most
important relative to the others is the aim of proportional piling.
§ Too many piles, too many choices lead to confusion.
If there are too many choices, ask participants to identify the top five to eight choices that are most
used and used by almost all participants. Also ask if there are any choices that are essentially the
same or similar to other choices and can be combined. Be sure to note the choices that
were removed or combined. Also consider separating the group into two based on common
characteristics such as gender or income level.

8/9/2019 ACF FSL Manual Final 10
http://slidepdf.com/reader/full/acf-fsl-manual-final-10 211/270209ACF Food Security and Livelihoods Assessment Guideline
§ Participants have some counters left over to illustrate that the current year is a bad year without
much food.
Split the exercise into 2 steps and first ask them to show you how many counters would represent
a normal year and how many would represent current conditions. Visually you can see their reduced
income. Then try the exercise again. The aim is to measure if there are changes between
the two years
§ Interpretation of the results as absolute values (instead of relative) or attempts to quantify
information to draw statistically significant conclusions.
The information gathered during proportional piling are subjective estimates based on a limited
number of choices. While the information provides additional insights into current (or past) conditions,
it is not collected in a manner nor is it possible to draw absolute or statistically significant conclusions.
That is not the purpose of proportional piling. Reports and presentations by ACF staff should clearly
state the relative nature of proportional piling results as is true of PRA methods in general.
Application: The significance of the diverse agricultural and non-agricultural activities, work or
incomes sources can add important information to better understand the importance of each typeof activity. The weights assigned during proportional piling can then be graphically illustrated through
pie charts allowing the assessment team to understand the relative importance of diverse
agricultural and non-agricultural activities, household and community characteristics (e.g., wealth).
Examples: Proportional piling
Proportional piling of wealth groups within a community
55% 35% 10%
Poor Middle Better-off

8/9/2019 ACF FSL Manual Final 10
http://slidepdf.com/reader/full/acf-fsl-manual-final-10 212/270

8/9/2019 ACF FSL Manual Final 10
http://slidepdf.com/reader/full/acf-fsl-manual-final-10 213/270211ACF Food Security and Livelihoods Assessment Guideline
11.6 Pairwise and Ordered Ranking, including Wealth Ranking
Ranking is used to assess the preferences, priorities, importance, dominance or influence regarding
community or household characteristics, food sources, income sources, hazards, vulnerabilities,
wealth groups and other information relevant to food security and livelihoods assessments.
Ranking can also be used to identify areas or population groups within a village or region to be most
at risk. Ranking is often used as part of, or done before and used to inform, vulnerability and
capacity analysis.
Purpose: to engage small groups to understand community characteristics, preferences
and priorities.
Objective: to identify locally defined (criteria) of specific community characteristics (e.g., social or
economic characteristics), the proportion of the population in each category, and community
preferences and priorities. To identify locally defined vulnerabilities and ways to address specific
vulnerabilities according to community priorities and solutions.
Process:
Preparing for a ranking session:
§ Decide on the necessary information to be collected based on food security and livelihood
assessment objectives. Ranking is a particularly useful tool for collecting information on:
• Wealth ranking to assess wealth status or changes in wealth status;
• Problem ranking;
• Community priorities;
• Community preferences;
• Vulnerabilities and capacities.
During a ranking session:
There are two general types of ranking methods: pair wise and ordered.
Pair wise ranking:
§ Ask participants to list areas of concern or other relevant information (e.g. all food sources, causes
of food insecurity, animal preferences) to be collected.
§ Create a matrix by asking participants to choose the four to ten most important concerns (or other
components of a relevant topic e.g., food sources) and list each of these along the horizontal and
vertical axes.
§ Ask participants to compare the urgency of the first issue listed on the horizontal axis with issues
on the vertical. Write a letter, symbol or write the concern in each box that corresponds to the most
important issue of the two which are being compared.
§ Add the number of times each letter or symbol appears in the matrix. The more times the area of
concern appears, the higher its rank.

8/9/2019 ACF FSL Manual Final 10
http://slidepdf.com/reader/full/acf-fsl-manual-final-10 214/270212 ACF Food Security and Livelihoods Assessment Guideline
Ordered ranking:
§ Ask participants to identify areas of concern or other relevant information to be collected.
§ Ask participants to identify the most important concern, the second most important and so on until
all the items have been ranked by importance level.
§ Different ordering referencing can be used such as from most problematic to least problematic,
more to least preferred or highest to lowest priorities.
§ For wealth ranking, participants are asked to identify the local economic and social indicators of
wealth, such as number and type of productive asset and ethnicity
§ Then 3 to 5 wealth categories are identified such as Destitute, Very Poor, Poor, Middle and
Better-off depending on the degree of wealth variation in the local area.
§ Participants are asked to describe each indicator for each wealth category as well as to estimate
the proportion of the population falling into each wealth category. Wealth is almost never
distributed evenly, and the broad majority of the population lies in the lower wealth groups.
§ The poorest classes will include traditionally weak or marginalized people, but also newly
vulnerable groups such as female-headed households, orphans, unaccompanied minors and
disabled people.
Ranking sessions can also be held as breakout sessions by breaking a larger group into several
smaller groups (4-6 people). Once the small groups have ranked the created lists, then the entire
group reforms and each smaller group presents the list of ranked priorities to the larger group.
Discuss similarities and differences in the problems and priorities of each group.
After a ranking session:
§ Create a list of community characteristics or problems listed in priority order. Note differences
between groups.
Common mistakes and how to avoid them:
Wealth ranking leads to spurious results
While wealth ranking has become standard in most food security and livelihood assessments, it is
difficult to accomplish and more so in pastoral communities than in agricultural ones. Using wealth
ranking to measure changes over time may be seen as less invasive and easier to give information
for some participants. Using different classifications of wealth such as less well off, middle andbetter-off may help as well, though it is important to remember for comparisons between different
areas or time periods, consistency in terms is necessary (e.g., less well off does not necessarily
translate to poor). Alternatively, ask a key informant with detail information about the community to
provide wealth ranking information.
Application: Ranking should be used with other PRA methods to probe for reasons for putting
certain concerns or items before others. Ranking may be used to identify preferred crops, animals,
and other aspects of food security and livelihoods and then combined with key informant interviews
and focus group discussions to gain more clarity on why certain choices were made. The importance
of possible coping strategies adopted for procuring food during or post-shocks or preferences for
types of assistance programs can also be assessed using ranking.

8/9/2019 ACF FSL Manual Final 10
http://slidepdf.com/reader/full/acf-fsl-manual-final-10 215/270213ACF Food Security and Livelihoods Assessment Guideline
Examples: Ranking
Scores: Hunger 6, Water 4, Lack of water 1, Disease 2, Lack of school 0
Participants chose water, hunger, disease risk and education as the four main community
vulnerabilities. When comparing vulnerabilities listed in the rows with the second column (Lack of
water), we observe that hunger is thought to be a greater vulnerability than lack of water, however,
lack of water is regarded as a greater vulnerability than disease risk and lack of school. Taking theentire matrix into consideration, hunger (chosen 6 times in these comparisons) is ranked as the
greatest vulnerability when compared to the others.
Pairwise ranking of community problems – Philippines
When the number of indicators is large, pairwise ranking may also use a scoring system that countsthe number of times an indicator ranks higher than its pair across all the rows (see Matrix above). The
highest scoring indicator is then assigned a rank of 1, the second highest a rank of 2, and so on.
Pair wise ranking of community vulnerabilities
Lack of water Hunger Disease Lack of school
Lack of water X Hunger Water Water
Hunger Hunger X Hunger Hunger
Disease Water Hunger X Disease
Lack of school Water Hunger Disease X
The matrix below reproduces the results of the
community-made matrix in the village (on a flip chart).
NoMarket
Lack ofFarmTools
Lack ofFoodSecurity
NoFloodControl
Lack ofMeds
Noportablewater
Lack ofsanitarytoilet
Lack of Lawimplementation
Illegalfishing
Illegallogging
Nounity
Score Rank
No Market x 1 1 4 1 1 1 8 9 1 11 6 5
Lack of FarmTools
x x 2 4 2 2 2 8 9 2 11 5 6
Lack of FoodSecurity
x x x 4 3 6 3 8 9 3 11 3 7->9
No FloodControl
x x x x 4 4 4 4 4 4 11 9 2
Lack of Meds x x x x x 5 5 8 9 5 11 3 7->9
No portable
water
x x x x x x 6 8 9 6 11 3 7->9
Lack ofsanitarytoilet
x x x x x x x 8 9 10 11 0 11
Lack of Lawimplementation
x x x x x x x x 8 8 11 8 3
Illegal fishing x x x x x x x x x 9 11 7 4
Illegallogging
x x x x x x x x x x 11 1 10
No unity x x x x x x x x x x x 10 1

8/9/2019 ACF FSL Manual Final 10
http://slidepdf.com/reader/full/acf-fsl-manual-final-10 216/270
Source: ACF Sudan, Food Security Assessment, North Darfur, May 2005.
214 ACF Food Security and Livelihoods Assessment Guideline
Wealth ranking – North Darfur, Sudan
Wealth group Poor Middle Better-off
% of population 45-55% 25-35% 15-25%
Agriculture – land area 0 – 1.6 Mukhamas 1.6 - 3.2 Mukhamas 2.4 - 8 Mukhamas
Livestock – size herds20 – 25 shoats,0 – 2 cattle
40 – 50 shoats,10 –15 cattle
80 – 100 shoats,8 – 20 cattle
Water pump ownership 0 0 - 1 1

8/9/2019 ACF FSL Manual Final 10
http://slidepdf.com/reader/full/acf-fsl-manual-final-10 217/270215ACF Food Security and Livelihoods Assessment Guideline
11.7 Capacity and Vulnerability Analysis
Capacity and vulnerability analysis is a PRA tool used to assess the capacity of a community to
cope with shocks and changes. Vulnerabilities are related to significant hazards such as low livestock
holdings, insufficient access to water, seasonality of labour, dependency on migration, high
transport costs; specific groups such as livelihood group, wealth group, caste, ethnicity, gender,
disability and health status, age, nature and extent of social networks; and infrastructure and
livelihoods resources such as dwellings, access roads, production facilities, markets, pasture areas,
specific cropping systems. Vulnerability to food insecurity and compromised livelihoods is
dependent on internal factors at the household level and external factors at the structural level and
these are amplified by a shock.
Purpose: to engage community members in small group discussions to identify and describe local
perspectives of community capabilities and vulnerabilities related to food security and livelihoods.
Objective: to identify specific capabilities and vulnerabilities, strengths and opportunities of a
community related to food insecurity and livelihoods and to outline local priorities in addressing
vulnerabilities.
Process:
Preparing for a capacity and vulnerability analysis session:
• Decide on the necessary information to be collected based on the food security and livelihoods
assessment objectives. Capacity and vulnerability analysis is useful for:
• Adaptive capacity such as access to and control over natural , human, social, physical,
financial and political resources;
• Vulnerabilities such as hazards, special groups, infrastructure;
• Opportunities and solutions to address vulnerabilities;
• Decide on the type of capacity and vulnerabil ity analysis to use based on the necessary
information:
• Strengths, weaknesses, opportunities, threats (SWOT) - useful for developing action or
intervention plans by using existing opportunities.
• Gather materials based on the data to be collected including a sheet of poster paper along with
different colored pens or on a chalk board.
During a capacity and vulnerability analysis session:
• Ask participants to list the various aspects of food security and livelihoods.
• Ask participants to discuss specific capacities in terms of what they have.
• Ask participants to discuss specific vulnerabilities (what they lack or puts strain on capacities) in
terms of both skills and resources (e.g., people, time, equipments, inputs).
• Ask participants to identify specific capacities that may help address some of the vulnerabilities.

8/9/2019 ACF FSL Manual Final 10
http://slidepdf.com/reader/full/acf-fsl-manual-final-10 218/270216 ACF Food Security and Livelihoods Assessment Guideline
For SWOT analysis
• Ask participants to list the various aspects of food security and livelihoods. If the list is extremely
long, ask which aspects are similar enough to group together. Also ask to prioritize them in terms
of overall impact on food security and livelihoods. Begin with priority items.
• Ask participants to list strengths, weaknesses, opportunities and threats for each of the food
security and livelihoods aspects.
After a capacity and vulnerability analysis session:
• Record comments from capacity and vulnerability analysis and follow-up on any comments that
were unclear.
Common mistakes and how to avoid them:
Neglecting marginalized groups who are often at the greatest risk .
Integrating transect walks and key informant interviews with the explicit purpose of identifyingmarginalized groups and then following up with those groups to conduct ranking and capability and
vulnerability analysis. Members of marginalized groups may have more time constraints in
participation and therefore a greater effort may need to be made in when and where sessions are held
to encourage participation.
Applications:
Capacity and vulnerability analysis can be used at the end of a focus group discussion to summarize
findings. Venn diagrams and ranking may be used to assess the relative importance of social supports
such as close family or kin, clan or tribe, religious, political or military organization, livelihood or trade
group, government, NGO or charity group and the available social networks and interactions
between groups. Capabilities and vulnerability analysis is often used to develop action plans
by building on strengths and opportunities and address threats.
Examples: Capacities and vulnerabilities analysis
Characteristics Strengths Weaknesses Opportunities Threats
Local material Forests 2 hours away Motor transport Logging
Labor Young men Not organized Approachable Migration
Local management Influential chiefPoor communica-tion
Local structures Migration
Farming skills Traditional Not updated TrainingEnvironmentalchanges
Psychosocialsituation
Informationsharing
Lack of recreationPsychologistpresent
Constantinsecurity
SWOT analysis

8/9/2019 ACF FSL Manual Final 10
http://slidepdf.com/reader/full/acf-fsl-manual-final-10 219/270217ACF Food Security and Livelihoods Assessment Guideline
Appendix 12: Steps to assessment planning checklist
Checklist: Steps to assessment planning
Define the objectives and establish the ToR for the assessment (see Chapter 2)
Establish the geographic area and target population group(s) of concern
Gather and review all available secondary data and contextual information (see Appendix 8)
Engage stakeholders including local authorities and international actors
Determine and develop assessment timeline
Decide which information to collect and which tools will be utilized (see Chapter 2)
Determine and organize the resources needed for the assessment
Develop budget
Design and/or adapt the tools/questionnaires (see Chapters 2 & 4)
Select the sampling methodologies and/or clusters (see Chapter 3)
Obtain and prepare equipment, supplies and survey materials.
Translate the tools into local languages as necessary and possible
Field test questionnaires
Select the survey team
Train assessment teams
Establish protocols and daily plans for field work, assessment management and monitoring
Implement the Assessment
Data entry and Management Resources and Protocols
Analyze and interpret your findings (see Chapter 5 & 6)
Write up the report of the Assessment (see Chapter 7)

8/9/2019 ACF FSL Manual Final 10
http://slidepdf.com/reader/full/acf-fsl-manual-final-10 220/270218 ACF Food Security and Livelihoods Assessment Guideline
Appendix 13: Notes on Bias
Sampling error is not the only source of difference between a survey's result and the actual
population value. Sampling error is due to the random selection of households from the population;
it cannot be eliminated, but it can be minimized by selecting a larger sample.
Bias is anything, other than sampling error, which causes the results of the survey to be different from
the actual population prevalence or rate. Bias cannot be calculated and its effect upon the result
assessed. It is the main reason why surveys may not give an accurate answer. The fact that the
results are biased is usually not appreciated by those doing the survey; it is usually not apparent from
the results and its extent cannot be judged by those reading standard reports.
Readers may distrust the results of a survey if the results differ greatly from those expected. The
reader will examine a survey particularly closely if the results do not “triangulate”. For example, if the
food security and mortality data do not indicate that there is a crisis when the nutritional status is
reported to be very poor, the reader will suspect that the nutritional data is incorrect because of bias.
This uncertainty can lead to relief being delayed or even denied by donors when it is urgently needed.
Alternatively, it can lead to waste of supplies and resources if a relief operation is mounted when the
situation is thought to be much worse than it actually is. The reader must be able to rely on theresults of a survey for there is a great deal at stake. A careful and full description of the methods and
precautions taken to minimize bias is essential to give the reader sufficient confidence in the results
to lead to action. If precautions to minimize bias are not taken, and fully described in the report, a
sceptical reader will assume that a mistake has been made and that the results can be discounted.
Bias is minimized by using good technique. This is the main reason why the supervisor has to be
experienced, why adequate training is critical and why the report has to document all the steps taken
to eliminate or minimize bias.
Shortcuts are likely to be taken if the survey teams are required to work too hard, if there is
inadequate time allocated to rest periods and refreshments, or if the time that can be spent in a
particular household, to administer the mortality questionnaire and measure the children properly, isnot sufficient. These “shortcuts” can take many forms. The team members are usually aware that
they have deviated from the standard method, but through solidarity will not inform the supervisor.
For example:
1) The team may “rush” the interview or the measurements. They should be able to spend sufficient
time in each house to complete their tasks properly and complete a cluster within one day. Most
teams try to complete at least one cluster each day. The data may be much more accurate if the
sample size is sufficiently low to have 20 or 25 households in each cluster instead of 30 households.
By provoking “shortcuts” increasing the sample size may introduce substantial bias, leading to an
inaccurate result, in an effort to achieve a higher precision.
2) A team may not select the households at random when they reach a cluster site. They may go to
the village and take a “convenience” sample of some sort because of tiredness, heat, hunger, and
harassment or because they have insufficient time to select the sample correctly. This tends to be
more common in rough terrain of when there is a long distance to walk to the edge of the cluster.
3) Survey respondents misunderstand questions about mortality in their households and tell survey
interviewers, for example, that persons who left the household are dead. This would lead to an
overestimate of the death rate, thus increasing the difference between the death rates calculated
from the survey results and the actual population death rates.

8/9/2019 ACF FSL Manual Final 10
http://slidepdf.com/reader/full/acf-fsl-manual-final-10 221/270219ACF Food Security and Livelihoods Assessment Guideline
4) The following are some of the sources of non-sampling error that occur particularly duringthe interview.
a. “Recall” error: Respondents often fail to recall all deaths during a given recall period. Infant deaths,in particular those within a short time of birth, are particularly under-reported. Respondents mayalso report ages, dates, and salient events wrongly.
b. “Calendar” error: Respondents may report events as happening within the recall period when theydid not (or vice versa) due to lack of clarity about dates.
c. “Age heaping”/digit preference: Respondents may round ages to a number ending in a 0 or 5. Thiscan be a problem with 0-5DR or other age-specific death rates.
d. Sensitivity/taboos about death: In general, the death of a household member is not a subjectdiscussed readily with a stranger. In some cultures, taboos about death may hinder discussion if the
subject is not broached with tact and understanding.
e. Deliberate misleading: In some populations, with experience of relief operations, some of the
respondents may deliberately give incorrect answers in the expectation of continuing or increasedaid. This can even be orchestrated by local people with authority.
f. Mistranslation: Questionnaires may contain mistranslated key terms and concepts (a common
example is what constitutes a family vs. household). Interpreters may misunderstand questions ormistranslate answers.
g. Interviewer error: Enumerators may ask questions and/or write down answers incorrectly, skipquestions, or rush respondents in an effort to get done quickly.
h. Data-entry error: In the process of data entry, answers can be miscoded or entered incorrectly.
i. Analytic error: In the manipulation of any data, especially quantitative data requiring statisticalanalysis, mathematical and conceptual errors can generate faulty results or explanations
Because bias cannot usually be calculated or corrected by the computer after data collection isfinished it is critical to avoid bias during sampling and data collection. However, we can examine the
quantitative data to see if there is likely to be some form of systematic bias. The teams should beaware that such techniques will be applied during the analysis in order to avoid succumbing to anytemptation to take shortcuts.
Examining the quantitative data for “digit preference”. That is the data having an excess ofparticular digits as the last digit in the measurements of height or weight. This is done overall and
for each individual team. Such “rounding” by the measurer of the team usually results in an excessof “0” or “5” as the last digit. The data obtained during training should also be examined for evidenceof digit preference.
It is also frequent for teams to get tired during the day. The data gathered in the morning are oftentaken more carefully than that in the late afternoon. The data collected from the first and secondhalf of each of the clusters is compared.
These tests can indicate the presence of some types of systematic bias and help to resolve theproblem. Bias is particularly difficult to detect if all the teams have been trained to make the samemistake. Further, bias is more likely to go unnoticed in the interview than with the quantitativemeasurements. It is far better to take great care to avoid bias and to demonstrate to the teams,
during training, the disastrous effects bias.

8/9/2019 ACF FSL Manual Final 10
http://slidepdf.com/reader/full/acf-fsl-manual-final-10 222/270220 ACF Food Security and Livelihoods Assessment Guideline
Bias is minimized by:
• Careful standardization of measurement techniques,
• Training survey workers well,
• Writing clear questions to be asked of survey respondents,
• Back-translation of all questionnaires,
• Using more than one translator and comparing their results when interviewing the same
households,
• Careful choice of the start of a recall period, unusually high. If the second team’s data are very
different from the original data this confirms that there was a systematic bias in the work of the
first team.
• Using local calendars,
• Using the minimum sample size that gives adequate results so that the teams are not stressed
• Providing comfortable transport for the staff
• Ensuring adequate rest and refreshment periods
• Making sure that the payment to the teams is adequate and agreed.
• Having motivated cohesive teams that participate fully in the daily meetings and report any
difficulties promptly and faithfully. The teams must be trusted by the supervisor.
• And applying the other techniques mentioned in this manual.
Adapted from Handbook on SMART Protocols (2005)

8/9/2019 ACF FSL Manual Final 10
http://slidepdf.com/reader/full/acf-fsl-manual-final-10 223/270221ACF Food Security and Livelihoods Assessment Guideline
Appendix 14: Protocols for Household Selection, an example
Ideally we the team will be able to obtain and utilize household (HH) lists for some or all sites. The
selection of households will involve 3 steps. First, establish the number of HH on the list. Second
divide the total number of HH by the ‘estimated HH’ the team expects to visit (in this case 15) – for
example if there are 150 HH, you take 150 divided by 15, which gives you 10. This is an important
number remember it. Third step, Choose a random start number from the number table – if you
choose the number 17 for example, you will count 17 HH from the beginning of the list. This is your
first HH. Next you would use the number you obtained earlier (in this case 10) and count that
number till you reach the next HH on the list. Thus your HHs would be 17, 27, 37, 47…147…7, until
you reach your start number. Once you have your HH list you will NOT visit them in the order you
chose them, but visit them in a random order, by selecting them in a standard random procedure.
No Household List – Next Best Option, “Spin the Pen”
1. Spend the first 30 minutes of the day, during formalities, as a team, becoming familiar with the
boundaries within which the days sample of HH will be drawn – The boundary should be
delineated by relatively easy to recognize landmarks (streets, rivers, marsh boundary etc) and the
team should become familiar with these boundaries. If no map is provided spend the first 30minutes sketching a rough map from the “cluster” from which the sample with be drawn.
2. Using the map (or sketch), estimate the ‘centre’ of the ‘cluster.’ HH enumerators will start from this
point and use the “spin the pen method” to determine their first direction. After spinning the pen
the team should walk in that direction to the limit of the “cluster”, in the direction indicated by the
pen, or take a car if needed.
3. Once reaching the “cluster limit” chose the farthest dwelling from the centre within the “cluster”,
either a house, building, room or tent. This will be your first household. If it is a single HH dwelling,
then you have your first household - if it is a multi-HH house dwelling space, you must randomly
select a HH within the Dwelling. To do this you have various options depending on the situation.
If the dwelling is a schoolroom – you may quickly make a list of households, number them and
use a random selection procedure to choose a HH.
When trying to choose a HH in a multi-story apartment building a random procedure must be
used to select the floor - if there are 4 floors the team will choose randomly from chips 1-4; a
similar procedure would be used to distinguish between rooms and families within a room
4. If working in a host community, try to take a community leader with you to help locate the HH who
host IDPs – DO NOT just go to the HH suggested by the leader. This is ABSOLUTELY wrong and
will hurt our work. When reaching the boundary point and choosing the dwelling, if the HH does
not host IDPs, choose the next closest dwelling. If they do not host IDPs choose the next closestdwelling and so on until the HH is found.
5. After interviewing the first HH, the team returns to the centre and completes the procedure again
– spinning the pen and finding the dwelling at the farthest limit of the “cluster” in the newly
indicated direction. And then repeat all subsequent steps.
If Households are not at home remember ask neighbours when they will return and return to
the HH before the end of the working day at the indicated time, before completing your
sample. If time runs out near the end of the day and the family has not returned home,
complete selection procedure again and chose a new HH.

8/9/2019 ACF FSL Manual Final 10
http://slidepdf.com/reader/full/acf-fsl-manual-final-10 224/270222 ACF Food Security and Livelihoods Assessment Guideline
Appendix 15: Protocols for Team Leaders Monitoring, an example
These reminders are not exhaustive. What is important is to develop written protocols for supervisors
to refer to which will both guide their monitoring/supervision and hold them accountable. The
specifics of these protocols will be determined in the field though some common components are
listed below. Where pilot testing and training uncover team difficulties and weaknesses regarding
the administration of certain tools, these should be highlighted as points where special attention
should be given by the supervisors in the field.
In preparation for each day please make sure to:
1. Encourage the enumerators to read over the questions as many times as possible before going
to the field.
2. Verify that all the team members have their questionnaires, equipment and other necessary
information (maps, sampling materials, contact names etc) at the start of each day.
3. Make sure that each enumerator fills in ALL code information required in the top box on the cover
page of each questionnaire – HH #s can be allocated later – The first HH’s for sub-team one, the
remainder for sub-team 2 – the final ones for the HH without children.
4. Try to be hard on the teams regarding the time it takes to do the survey. Each HH survey should
not take longer than 45 min to 1 hour, as they become more familiar with the survey.
Figure 13: Illustration of UNICEF Pencil Spin Method of Household Selection
Enumerator 1 Enumerator 2 Approximate center of cluster

8/9/2019 ACF FSL Manual Final 10
http://slidepdf.com/reader/full/acf-fsl-manual-final-10 225/270

8/9/2019 ACF FSL Manual Final 10
http://slidepdf.com/reader/full/acf-fsl-manual-final-10 226/270224 ACF Food Security and Livelihoods Assessment Guideline
Appendix 16: Daily Activity Plan, an example
Each 6-7 Member Team is in Two Cars:
One Team Leader = TL
Two 2 person Household Questionnaire Teams = HH1 and HH2
One 2 Person Team Responsible for Key Informants and Focus Groups= KIFG
Time Activities
6:45 Meet at Departure Point
7:00 Depart for the Field Site
By 9:00
Arrive at Site and Introduction to Community LeadersClarify assessment goals and protocolsHH enumerators begin process of HH selection
Obtain updated HH listTransect Walk and Observations site mapping
Request Leaders to Arrange Focus Group Discussions
9:30 – 16:00(30 min. lunchbreak)
TL = Supervises HH selection procedures= Gathers Community Profile with Community Leaders (30-45 Min)= Supervise the administration of Questionnaire and Focus Groups= Check to ensure all codes are correctly filled in, that questionnaires are filled in
correctly and are internally consistent and Focus Group and Key Informant Interviewwrite ups are extensive and exhaustive
HH1 = Teams begin administering Questionnaire in following HH selection procedures inHH with Children (Approx 1 HH per hour, Total 6 HH per day each for HH1 and HH2 )
KIFG = Team conducts 2 Focus Group Discussions, one with women and one with men
(1.5 hours each) and Conducts 4 Key Informant Interviews (2 per team member) as dis-cussed in Training
16:00 – 18:00DistanceDependant
Leave Site
HH A, FGKI – Continue checking questionnaires, discussing data and filling gapsTL – Continue to Check Questionnaires and FG/KI narratives, Diagrams etc
By 18:00 Arrival back at departure site/office
18:00 – 19:00 Debriefing

8/9/2019 ACF FSL Manual Final 10
http://slidepdf.com/reader/full/acf-fsl-manual-final-10 227/270225ACF Food Security and Livelihoods Assessment Guideline
Appendix 17: Mapping the market
Creating a map of the markets as a participatory exercise with traders and households will provide
a visual illustration of the geographic location of markets in a given zone, trade flows between
markets and types of commodities traded pre- and post-crisis. Trade routes (road, river, and
maritime networks) and current constraints on movement can also be illustrated.
The Arrow Diagram tool described in chapter 2 (Methods) provides useful guidance on how to
create such a map. Two maps can be required: the first showing pre-crisis trade flows, and the
second showing the post-crisis impacts on these flows, including the provision of humanitarian aid
and the emergence of new market actors such as NGOs and government authorities.
To avoid overloading information, maps can focus on a single key objective and market sub-system,
rather than showing the entire market network. For example, food availability may be best illustrated
by mapping staple food flows. Impacts on a vulnerable livelihood group such as pastoralists may be
best shown by focusing on the livestock trade.
Example: Impacts on the trade in fishing inputs in the Ayeyarwady River Delta, Myanmar 14
The map below illustrates the market system involved in the annual acquisition of small fishing nets,
a key asset for food security and income for most of the landless poor in the Ayeyarwady river delta
of Myanmar. The first map shows key features of the basic structure of the market-system such as
the relative importance of different routes by which poor households get fishing nets, the number of
market traders at different locations and the most important services that support the value-chain.
14 From: Introduction and Overview of Emergency Market Mapping Analytis (EMMA) Tool Kit. Practical Action, Oxfam and IRC, 2009.
YANGON / PATHEIN MARKET TOWNS VILLAGES
THAIMANUFACTURERS
LARGE BOATOWNERS /
FISH TRADERS
POORFISHING
HOUSEHOLDS
Institutions, Rules & Norms
Supply-Chain Market Actors
Key Infrastructure& Services
Small Fishing Nets – Ayeyarwardy Delta, Myanmar – Before NARGIS
IMPORT PERMITS
BRIBES
SEASONAL
FISHING
LICENCES
GENDER
ROLLS
FOREIGN
EXCHANGE
SMALLER
TRADERS
Yangon = 20
IMPORTERS &WHOLESALERS
Yangon = 5Pathein = 3
IMPORTERS &
WHOLESALERS
Pathein = 10Bogale = 10
Hlaing Bon = 5 Aywgyun = 15
Pyapone = 5
VILLAGE
SHOPS
WAREHOUSESTORAGE
CREDIT AVAILABILITY
TRANSPORT& FUEL
BOATS,NYLON,FLOATS

8/9/2019 ACF FSL Manual Final 10
http://slidepdf.com/reader/full/acf-fsl-manual-final-10 228/270226 ACF Food Security and Livelihoods Assessment Guideline
The second map illustrates the same market system two months after Cyclone Nargis devastated
the river delta, destroying property including fishing nets. The map indicates which elements and
linkages of the system were disrupted or destroyed by the cyclone in May 2008.
It also has been used to illustrate key features of the humanitarian response by local NGOs and
religious associations:
§ the way relief donations have substituted for the role played by large-boat owners, many of whom
died or lost their vessels in the disaster
§ how relief is bypassing the normal retailers and village traders
§ the break-down of normal patterns of credit provision along the supply chain
The map also flags issues around access to foreign exchange and corruption that will be important
to the recovery of this market system.
Appendix 18: Analysing market trends
Compiling quantitative information that has been collected in market visits into databases allows for
easy analysis and establishes a vital baseline for future market monitoring in the area. Price trends
are best analyzed graphically. In this case study from a Sierra Leone displaced persons camp, the
impact of food distribution on availability and prices of market staples is monitored.
YANGON / PATHEIN MARKET TOWNS VILLAGES
THAIMANUFACTURERS
MFF
NGO &Religious LARGE BOAT
OWNERS /FISH TRADERS
POOR
FISHINGHOUSEHOLDS
Institutions, Rules & Norms
Supply-Chain Market Actors
Key Infrastructure& Services
Small Fishing Nets – Ayeyarwardy Delta, Myanmar – After NARGIS
IMPORT PERMITS
BRIBESSEASONAL
FISHING
LICENCES
GENDER
ROLLS
FOREIGN
EXCHANGE
SMALLER
TRADERS
Yangon = 20
IMPORTERS &
WHOLESALERS
Yangon = 5Pathein = 3
NG
IMPORTERS &
WHOLESALERS
Pathein = 10
Bogale = 10Hlaing Bon = 5 Aywgyun = 15
Pyapone = 5
VILLAGE
SHOPS
WAREHOUSESTORAGE
CREDIT AVAILABILITY
TRANSPORT& FUEL
BOATS,NYLON,
FLOATS
!!!!
DS
RGE BOWNERSH TRADE
Disruption
Complete
Partial

8/9/2019 ACF FSL Manual Final 10
http://slidepdf.com/reader/full/acf-fsl-manual-final-10 229/270227ACF Food Security and Livelihoods Assessment Guideline
RELIEF FOOD
ITEMS
ailability of relief fooditems:
1=Plenty 2=Normal 3=Scarce 4=Absent
May '00 Jun '00 July '00
1st wk 2nd wk 3rd wk 4th wk 5th wk 1st wk 2nd wk 3rd wk 4th wk 1st wk 2nd wk 3rd wk 4th wk
Bulgur (cup) 2 2 2 2 2 2 2 2 2 2 2 2 2
Corn meal (cup) 3 3 3 4 4 4 4 4 4 4 4 3 4
Beans (cup) 4 4 4 4 3 3 3 3 3 3 3 4 4
Lentils(cup) 2 2 2 3 3 3 3 3 3 3 3 4 4
CSB (cup) 2 2 2 2 2 2 3 4 2 2 3 4 4
1st wk
May
3rd wk 5th wk 4th wk 2nd wk 1st wk 3rd wk 4th wk 2nd wk 1st wk 3rd wk 4th wk 2nd wk
June July
Relief food items
0
200
400
600
800
1000
1200
1400
Bulgur (cup) Corn meal (cup) Beans (cup)
Lentils (cup) CSB (cup)
L e o n e s
p e r c u p
A general pattern of a reduction in prices at the end of each month, mirrors the camp distribution timetable.The availability of bulgur remained 'normal' throughout the period with only minor fluctuations in price. Cornmeal became absent after the third week of May, after being dropped from some aid distributions. A smallquantity was seen in the third week of July with a trader who was disposing of remaining stock.Beans wereabsent during the first four weeks in May, to be replaced by lentils. This is also a reflection of changes to thecomponents of the food aid ration. The availability of CSB in the central market showed some fluctuationduring the last three months. Interviews suggest that this is a result of the increased numbers of new IDPsarrving in Freetown. Those receiving food aid usually sell part of their CSB ration to established traders. As aresult of the influx, some new IDPs also borrowed food aid from their hosts either to consume or to sell in thestreet, with the result that a smaller quantity was sold by the regular traders.
SALT & SUGAR
Availability of salt andsugar:
1=Plenty 2=Normal 3=Scarce 4=Absent
May '00 Jun '00 July '00
1st wk 2nd wk 3rd wk 4th wk 5th wk 1st wk 2nd wk 3rd wk 4th wk 1st wk 2nd wk 3rd wk 4th wk
Local salt (cup) 2 2 2 2 2 2 2 2 2 2 2 2 2
Sugar (cup) 2 2 2 2 2 2 2 2 2 2 2 2 2
FUEL
Availability of fuel: 1=Plenty 2=Normal 3=Scarce 4=Absent
The supply and price of imported sugar and local salt remained stable during the reporting period (at Le 769per kg for salt and Le 1154 for sugar). Port records indicate that a total of 671 MT of sugar arrived in May,and 22 MT in June. Total tonnage from January to June is 5,057 MT.

8/9/2019 ACF FSL Manual Final 10
http://slidepdf.com/reader/full/acf-fsl-manual-final-10 230/270228 ACF Food Security and Livelihoods Assessment Guideline
Appendix 19: Calculating Terms of Trade
Terms of trade (TOT) can be a powerful indicator of household food access by the main livelihood
groups identified in the FSL assessment.
TOT is the ratio of two prices: e.g. livestock to food staple, cash crop to food staple, or daily wage
to food staple. It can be tracked over time to establish trends in food access and compared with a
benchmark level that indicates an acceptable threshold of food access. Measuring terms of trade in
a food security and livelihoods assessment provides a baseline against which to measure future
trends as part of surveillance or program monitoring activities. Declining terms of trade indicate a
situation of declining access to food. Collapsing terms of trade for livestock and other assets
indicate distress sales, a widely documented coping strategy in acute food crisis.
TOT can be compared among different sub-groups or across different geographical areas and used
in ranking the relative vulnerability of groups or zones in the framework of the assessment.
Example: Terms of Trade in Burkina Faso
Market-purchased sorghum is the principal food staple of households in Tapoa, one of the eastern
provinces of Burkina Faso. Livelihoods are based on small livestock herding, agriculture and trading. Therainy season runs between May/June and September. September and October harvests mark the end
of the lean season and translate into marked improvements in food security in the rainfed agricultural
zones and lower cereal prices benefiting primarily pastoral zones. Animal health notably improves
during and following the rainy season as a result of increased forage availability.
For herders, animals are the main commodity sold for the purchase of the staple food. The number
and composition of herds varies according to the wealth of the pastoral household. Livestock
holdings of the poorest households are low and limited to small ruminants (e.g. one goat, poultry),
while better-off households have larger and more diverse holdings (e.g. poultry, goats, sheep, the
occasional head of cattle). The wealthiest households enjoy holdings numbering in the tens or
hundreds of cattle and sheep. Pastoral and agropastoral households commonly sell poultry and
small ruminant stock as needed to enable the purchase of food.
Terms of Trade
Terms of trade in the region are based on sacs of cereal that can be purchased with the sale of a
particular breed of livestock. The most common TOT indicator compares the price of a ram or goat
to a 100 kg bag of white sorghum. Pastoral and agropastoral communities, government structures
and agencies responsible for surveillance of the pastoral zones routinely refer to the TOT indicator
to judge the food security situation in the area.
A minimum livestock/cereal threshold is recognized below which household food access is
considered insufficient. The threshold depends on the amount of cereal that the average household
requires and other expenses that must be covered from the sale of livestock.
In Tapoa, the standard TOT threshold is expressed as 1:1 for goats to cereal, and 1:2 for rams to
cereal. A 100 kg bag of sorghum or millet is considered sufficient for a household for a month. If
the price of sorghum rises relative to livestock, this translates to worsening terms of trade
forpastoralists.
At the start of the lean season in February, the average price of a sac of sorghum across Tapoa was
11,200 XOF. Goat and ram prices were 16,417 XOF and 44,167 XOF, respectively. A household was
able to purchase 1 _ sacs with the sale of a goat (TOT of 1:1.5), or 4 sacs of cereal with the sale of
a ram (TOT of 1:4). Over the next months in keeping with seasonal patterns, livestock prices fell
slightly relative to cereals and TOT for goat/sorghum and ram/sorghum deteriorated to 1:1.3 and
1:3, respectively.

8/9/2019 ACF FSL Manual Final 10
http://slidepdf.com/reader/full/acf-fsl-manual-final-10 231/270229ACF Food Security and Livelihoods Assessment Guideline
Regional market dynamics
Livestock terms of trade in the Sahel showed unusual patterns in 2009. Livestock/millet trade was
unfavourable to herders in the first trimester, and at times reached levels comparable to those
prevalent during the 2005 food crisis. During the second and third trimesters, TOT stabilised and
more closely reflected normal seasonal levels as dry cereal prices stabilized.
TOT Feb-09 Mar-09 Apr-09
Goat/sorghum 1.46 1.30 1.32
Ram/sorghum 3.94 2.76 2.82
Terms of trade goat/millet – Gotheye (Niger)
Jan Mar AprFeb May Jul AugJun Sep Nov DecOct
0
50
100
150
200
250
Source: SIMA, SIMB Niger
2004-2008 2005 2009
K i l o g r a m s o f m i l l
e t
Kilograms of millet obtained with the sale of a male goat

8/9/2019 ACF FSL Manual Final 10
http://slidepdf.com/reader/full/acf-fsl-manual-final-10 232/270230 ACF Food Security and Livelihoods Assessment Guideline
These patterns are reflected in the figure above, which illustrates market dynamics in Gotheye,
located in the agropastoral zone of western Niger. Food access was good in August 2009 compared
with previous months resulting from favourable pasture conditions. The marked deterioration
that occurred in TOT in the 2005 crisis is highlighted for comparison against larger multi-year
seasonal trends.
Note that the CFA Franc has appreciated 26% compared to the Nigerian Naira since it was pegged
to the Euro, inflating the price of livestock in the franc zone and making purchases by Nigerian
buyers less competitive. The Nigerian market is the main market for trade in livestock in the
Eastern Sahel.
Sources: Surveillance Program, ACF Burkina Faso, 2009 and FAO-WFP: Special Edition on the
Pastoral Situation, Internal Note on Food Security and Humanitarian Implications, Oct 2009.

8/9/2019 ACF FSL Manual Final 10
http://slidepdf.com/reader/full/acf-fsl-manual-final-10 233/270231ACF Food Security and Livelihoods Assessment Guideline
Appendix 20: Livelihood Zoning and Profiling
A livelihood zoning map is usually created in a workshop setting where participants have been
invited. Depending on the complexity of the area being mapped, the quality of available data and the
skill of the facilitator, mapping can be completed in as little as a morning’s work. Technical staff from
ACF who have a broad knowledge of the region in question should be qualified to carry out the
livelihood zoning exercise.
Ideally, sufficient time will be budgeted to develop the map during the tool development stage of the
FSL assessment so that it may serve as the sampling frame for the assessment, if one is needed.
Alternatively, the mapping can be one of the outputs of the assessment after the necessary data on
markets and production systems has been gathered.
* Material from this section drawn in part from Save the Children’s A Practitioner’s Guide to HEA:
Livelihood Zoning.
KEY STEPS IN A LIVELIHOOD ZONING EXERCISE:
1. Listing and mapping productive systems
Enumerate the main productive systems in the geographic area e.g. agricultural, agropastoral,
pastoral, labour-based, fishing, hunting. Refine these categories once the main groupings are
identified. Topographical maps and reference tables listing production-related statistics can serveas useful materials at this stage. Sketch maps can also be used if topographic and other official
maps are not available.
On a large map showing the basic administrative boundaries and the main geographical
features of the area (mountains, rivers, lakes), draw the productive systems just listed. Name the
groups on the map.
2. Introducing market access
Overlay major towns, roads and communication routes on the production system map
considering the main sources of household income for each zone and markets for products sold
and purchased. Outline key trade routes and employment markets. Consider whether market
access differs significantly within any of the productive systems that have been outlined, and if
so whether these zones need to be subdivided.
3. Developing profiles of the livelihood zones
Describe the main characteristics of each livelihood zone including the main categories of
livelihood, the main characteristics of the production system, topography, vegetation, other
natural resource features, climate, market access, hazards (droughts, floods) and household level
coping strategies.
Globally, zones are described by the varying roles that farm production, seasonal labour,
remittances and trade play in influencing the availability and access to food in different parts of
the mapped region. The role of factors other than food production that influence food insecurity
should be highlighted, including disruption in labour markets, blockage of crossborder trade and
changes in terms of trade.
4. Refining livelihood zone boundaries
Using a map of the lowest available administrative level and the most recent census of
population by administrative level, assign each administrative unit to a livelihood zone. This will
allow for a precise map to be drawn and population figures calculated for each livelihood zone.
Name each zone with a unique name using identifiers such as location, topography, vegetation
or dominant economic activity.

8/9/2019 ACF FSL Manual Final 10
http://slidepdf.com/reader/full/acf-fsl-manual-final-10 234/270232 ACF Food Security and Livelihoods Assessment Guideline
See examples below from the North Darfur region for: i) a Livelihood Zoning map of the area, and ii)
an in-depth Livelihood Profile of the Agro-Migrant zone, one of the zones identified in the
mapping exercise.
Example: Zoning Livelihoods in North Darfur State
North Darfur State in Sudan is chronically food insecure and relies on the neighbouringsurplus-producing West and South Darfur states. The population is mainly agro-pastoralist and
spread over six livelihood zones. Tobacco growing is a major cash crop for populations around
El Fasher. Millet is the main staple crop and is planted by most of the population and intercropped
with fruit and vegetables. In the Pastoral zone, livestock sale remains the main source of income,
and is sold or exchanged for grain.
See the Figure below illustrating the distribution of 6 main livelihood zones across the region. *
Figure 14: Zoning Map of production systems in North Darfur, Sudan
*Goz is an area in Eastern Darfur of plains and low hills with sandy soils. Tombac is a
type of chewing tobacco. Wadi is an area of seasonal watercourses that floods in the
wet season.
Source: ACF Sudan, Food Security Assessment, North Darfur, May 2005.
North Darfur administrative units and food economy zones
Legend:
Pastoral
Goz
Agromigrant
Wadi
Mixed cash crop
Tombac
MalhaUm Barrow
Sayah
KumaMellit
El Fasher
Um Kedada
Tewaisha
Lait
Tawilla
Korma
Kutum
F . B a r n o
Karnoy
Serief
S. Omra
Kabkabie
J. S.
T i n a
Dar El Salam

8/9/2019 ACF FSL Manual Final 10
http://slidepdf.com/reader/full/acf-fsl-manual-final-10 235/270233ACF Food Security and Livelihoods Assessment Guideline
Sources: 1993 Population census + 3.14 annual growth
1. Description of the Agro–Migrant Zone
Malha
Um Barrow
Sayah
Mellit
El Fasher
Tawilla
Korma
Kutum
F . B a r n o
Karnoy
Serief
S. Omra
Kabkabie
J. S.
The Agro-migrant Livelihood Zone (LZ) extends from the non-wadi areas of Kutum and Fata
Barno administrative unit in Kutum locality to the Jebel Si/Kebkabiya administrative unit (the
northern extension of Jebel Mara) in Kebkabiya locality. The predominant tribes of Kutum, Fata
Barno and Jebel Si are the Fur and Tunjur. The dominant soil types are stony hills and hard sandy
clay soils. The people of this LZ are millet farmers and have limited land holdings and keep small
to medium size herds of mainly sheep, goats and few cattle. The men in this LZ tend to migrate
to central Sudan or (less commonly) to Gulf States in search of work. Women tend to migrate to
South/West Darfur in search of agricultural employment. Wild food consumption is another
feature of this LZ. The annual rainfall is between 200 – 250 mm. This LZ forms the transition
between the Wadi, Goz and Pastoral LZ.
Admin Unit AU Population LZ P opulation LZ % of AU
Tawilla 87,539 13,131 15%
Korma 58,433 18,114 31%
Kutum 69,955 45,471 65%
Fatabarno 63,822 31,911 50%
Kebkabiya 58,023 6,960 12%
Jebel Si 70,768 70,768 100%
Total 408516 186355 46%
Example: Developing a Livelihood Profile for the Agro-Migrant Zone in North Darfur State

8/9/2019 ACF FSL Manual Final 10
http://slidepdf.com/reader/full/acf-fsl-manual-final-10 236/270234 ACF Food Security and Livelihoods Assessment Guideline
The baseline information for this LZ is October 1996 to September 1997. It was a poor/medium year in termsof rainfall, insecurity and cereal production.
Year DescriptionFactors impacting on household access to food
and income
1994/5 Poor Poor rain, poor harvest, relief distribution.
1995/6 GoodHeavy rainfall/floods, surplus food production,cereal prices very low, no relief
1996/7 MediumMedium rain, poor/medium harvest due to pestinfestation, food stocks carried over, no relief
1997/8 MediumPoor rainfall, exhaustion of carried over food stocks,limited relief was distributed
1998/9 PoorPoor medium rainfall, food socks exhausted and insecurity (Zaghawa & Arab)
1999/0 Good Heavy rain with floods & birds, surplus foodproduction and low grain prices.
2000/1 PoorGood rain, medium harvest, food stock carried over,insecurity: Fur/Arab conflict
2001/2 PoorDrought, conflict continued. Relief distributed, SFPand TFC.
2002/3 Poor Poor rains, conflict (Fur & Arab), relief, SFP and TFC.
2003/4 MediumModerate cereal production, conflict (Fighting betweenGovernment and Sudan Liberation Army started).
Wealth group Poor Middle
% of the population 45-55% 25-35%
Agriculture – Area planted 1 – 2 Mukhamas 1 – 3 Mukhamas
Livestock – size herds 0 – 10 Shoats3 5 – 20 Shoats0 –5 cattle
Other income sources Remittances from CentralSudan
Remittances from Central Sudan
3 Shoats = sheep and goats
2. Timeline of production and major events 1993/4 – 2003/4
3. Wealth Groups

8/9/2019 ACF FSL Manual Final 10
http://slidepdf.com/reader/full/acf-fsl-manual-final-10 237/270235ACF Food Security and Livelihoods Assessment Guideline
Sources of Food:
Poor Households
Sources of Food:
Middle and Better-off Households
Purchase(20-25%)
Wild Foods(30-40%) Wild Foods
(25-35%)
Food Stocks(5-10%)
Food Stocks(0-10%)
Migration(10-20%)
Deficit(5-15%)
Milk & Meat(0-5%)
Relief (0-10%)
Relief (0-5%)
Gifts(0-10%)
Milk & Meat(10-15%)
Purchase(45-50%)
Purchase is the most important source of food for the poor wealth groups. The ability of
households to purchase food is determined by level of remittances and livestock holdings.Migration and the “in-kind” payment of women’s agricultural labour in south/west Darfur
provides a substantial part of the household’s food. In the baseline year, crop production only
provided 1/10 of the food basket due to consecutive bad years in the area exacerbated by the
need to hire out part of the family labour to secure food for the family’s immediate needs. Mukhait
is the most dominant wild food consumed in the area. Gifts/relief to poor households from the
better off households in the form of food items, an invitation to join the better-off households for
a meal, is very common especially in bad years. Dara, a system whereby people eat collectively
also exists. Milk/meat contributes few calories due to low level of income and limited holdings
of animals.
For the middle income group, about half of the food basket in the baseline year is obtained
through market purchase. To maximize calories, middle households resorted to sorghum andmukhait, instead of millet because sorghum and mukhait are cheaper. Middle income
households are in a better position to secure family labour for cultivation and therefore have more
opportunities to maximize their own farm output. It is also common that a woman from the
middle income household migrates for agricultural labour. This may supply 1/3 of the food
basket. Access to milk and meat is greater for the middle income and better off households
because of higher livestock holdings and greater purchasing power in comparison to the
poor households.
4. Food sources

8/9/2019 ACF FSL Manual Final 10
http://slidepdf.com/reader/full/acf-fsl-manual-final-10 238/270
Source: ACF Sudan, Food Security Assessment, North Darfur, May 2005.
236 ACF Food Security and Livelihoods Assessment Guideline
The poor households obtain their income from migration. The poor of Kutum and Fata Barno arehighly dependent on male migration to central Sudan, while the poor of Jebel Si tend to dependon female migration to southwest Darfur. Providing local labour during the cultivation seasoncontributes about 1/10 of the income for the poor households. The most common work is
agricultural labour. Livestock sales are the smallest income source due to low animals’ holdingsfor this group. It is common for boys of poor households particularly from Kutum and Fata Barno,to work as herders for the pastoral group. Collection and sale of firewood and building materialsare very common for those near the main urban centres. In the baseline year the total annualincome for poor group was found to be SDD 33,000 (US$ 226) for S. Kutum and SDD 19,700(US$ 135) for Jebel Si.
The annual income for middle households in the baseline year was SDD 60,000 (US$ 460).Livestock sales represent the most important source of income for middle households becauseof relatively better holding. Remittances are the second most important source of income formiddle-income households. The migration of women for agricultural employment in southwestDarfur contributes to cash income in addition to food. These households also supplement their
income with petty trade while the better-off households were in a position to supplement theirincome with trade activities such as livestock and butchering.
Vulnerability ofthe Area
Vulnerabilit y ofthe Poor
Hazards Coping mechanisms
• Limited land holding• Type of soil• Poor breed of animals• Limited options
of livelihooddiversification
• Marginalization
• High dependency on
migration• Seasonality of labour• High number of female
head HH• Irregular remittances• High transport costs
for female migrantworkers returninghome with in-kindpayment
• Drought locally and inmigration areas
• Insecurity andaccess to traditionalmigration areas
• Limited labouropportunities incentral Sudan
• Drought locally and inmigration areas
• Insecurity andaccess to traditionalmigration areas
• Limited labouropportunities incentral Sudan
5. Income sources
6. Vulnerability, hazards and coping mechanisms

8/9/2019 ACF FSL Manual Final 10
http://slidepdf.com/reader/full/acf-fsl-manual-final-10 239/270237ACF Food Security and Livelihoods Assessment Guideline
Appendix 21: Sample Livelihood Matrix
Source: ACF 2007 Rapid Assessment, Nakuru, Rift Valley, Kenya: Following Kenyan Post Election Violence.
Summary Findings of livelihood changes following Post Election Violence in Kenya
IDP SLUM IDP CAMP Resident
Human
• Elderly have limited
livelihood opportunities• Reduced disposable money for
school fees.• Crowded schools• Limited access to health-
care/medical facilities• HIV/AIDS and other
diseases• Limited access to
secondary/tertiaryeducation
• Orphans
• Elderly have limitedlivelihood opportunities
• Reduced disposable money forschool fees.
• Crowded schools• HIV/AIDS and other
diseases• Limited access to
secondary/tertiaryeducation
• Orphans
• Elderly have limited
livelihood opportunities• Reduced disposable money
for school fees• Crowded schools• Limited access to health-
care/medical facilities• HIV/AIDS and other
diseases• Limited access to
secondary/tertiaryeducation
• Orphans
Social
• Main assistance in slums only
through religious institutions• Advanced crisis strategy stage• Limited membership to
Self Help• Groups due to lack of trust and
tribal differences.• Tribalism: Marginalisation of
some tribes.• Limited access to basic
services.• Single headed households
• Advanced crisis strategy stage• Limited membership to Self
Health Groups due to lack oftrust and tribal differences.
• Tribalism: Marginalisation ofsome tribes.
• Limited kinship support.• Single headed households
• No formal assistance programs• Tribalism: Marginalisation of
some tribes.• Single headed households• Limited access to basic
services.
Physical
• Poorly developed infrastructure
• Limited access to water andsanitation facilities
• Crowded poorly constructedhousing
• Limited access to business/ enterprise
• Crowded basic living conditions• Limited access to business/
enterprise
• Poorly developed infrastructure• Limited access to water and
sanitation facilities• Crowded poorly constructed
housing• Destruction of market centres.
Financial
• Limited access to Credit –formal, informal
• Debt• Destruction of household/
productive assets
• Limited livelihood opportunities• Informal/casual labour• Lack of access to financial
services• Limited financial access to
markets• High unemployment among
the youth
• Limited access to Credit –formal, informal
• Debt• Destruction of household/
productive assets
• Limited livelihood opportunities• High levels of unemployment• Lack of access to financial
services• Limited financial access to
markets• High unemployment especially
among the youth
• Limited access to Credit –formal, informal
• Debt• Destruction of household/
productive assets• Limited funds to rehabilitate
livelihood – reliance on pettytrading
• Reduced Income• High unemployment especially
among the youth
Environmental • Limited land access/availability • Limited and access/availability • Limited land access/availability

8/9/2019 ACF FSL Manual Final 10
http://slidepdf.com/reader/full/acf-fsl-manual-final-10 240/270238 ACF Food Security and Livelihoods Assessment Guideline
Appendix 22: Seed Security Interview Guide
An assessment of seed security can be included in the larger assessment of local production
systems in order to anticipate needs beyond immediate food security concerns. Farmers’ ability to
secure seed, cuttings, tubers and other planting materials of adequate quantity, acceptable quality
and in time for planting is described as seed security.
• Acute seed insecurity is brought on by distinct, short-duration events that often affect a broad
range of the population and may be spurred by the failure to plant in a single season, the loss of
a harvest, or by high levels of infestation of stored seed stocks.
• Chronic seed insecurity is independent of acute stress or disaster, although it may be exacerbated
by it. Populations suffering from chronic seed insecurity tend to be marginalized and are
characterized by continual shortages of adequate seed to plant, difficulties in acquiring seed
off-farm due to lack of funds, and the routine use of low quality seed and unwanted varieties*
Food security and seed security are linked but different concepts. A person can have adequate seed
to sow a plot but lack sufficient food to eat and vice versa. If the FSL assessment is used to
determine whether a population needs seeds& tools, then the assessment needs to explicitlyconsider seed security. Under no circumstances should the seeds and tools response be considered
an obvious and/or systematic intervention. Even if this type of operation has become a classic in
humanitarian programs, it should only be initiated after a thorough evaluation of the situation that would
point to the lack of seeds and/or tools as the principle limiting factor for agricultural production.
* Adapted from Seed Aid for Seed Security: Advice for Practitioners, CIAT and CRS, 2006.
The evaluation should contain a detailed and thorough study of the quantity and access of seed
supplies BEFORE the crisis and currently. Six fundamental questions can guide the assessment:
1. How do farmers normally obtain seed for their most important staple food and cash crops?
What are the preferred varieties? Common seed sources are own production, social networks,
local markets, and the formal sector.2. Did the crisis bring about a situation of acute seed insecurity? We need to distinguish between
‘lack of seed available’ (a rare case) and ‘lack of access’.
3. What are farmer demands, needs and goals for seed relief and recovery? Restoring a system
that is gradually deteriorating may reinforce vulnerability and further stress affected populations.
Meanwhile, there are significant risks associated with introducing new varieties/crops.
4. What is the capacity of local seed/grain markets and home production to meet seed demand?
A production shortfall does not necessarily imply a seed shortfall. If it does, traders may still be
able to source seed from outside the area – but its quality and accessibility should remain key
concerns of the assessment.
5. Are there indications of longer-term chronic seed stress? Indicators include seed aid being
given season after season, cyclical crop failure, dramatic declines in seed quality and viability,
changing crop profiles due to a lack of seed and sharp increases in use of non-preferred varieties.
Here we need to identify chronic stresses.
6. What are possible responses to priority constraints, opportunities and demand? Analysis of the
causes of seed insecurity will lead us to propose more adapted solutions e.g. vouchers and seed
fairs in the case of acute seed access problems; or development of income-generating activities
and agro-enterprises where seed stress is chronic.

8/9/2019 ACF FSL Manual Final 10
http://slidepdf.com/reader/full/acf-fsl-manual-final-10 241/270239ACF Food Security and Livelihoods Assessment Guideline
Appendix 23: Calculating Individual and Household Dietary Diversity Scores
The Household Dietary Diversity Score (HDDS) is a tool used to measure the diversity of
household diets. It is used as a proxy indicator of the household’s economic access to food. It is
generated by calculating the number of different food groups consumed over the course of a
given period.
Objective: to measure the dietary diversity of households
Time to administer: 5 to 10 minutes
Method (preparing the questionnaire): The recommended reference time period is the last 24
hours, as longer reference periods result in less accurate information due to imperfect recall. The
following set of 12 food groups is commonly used to calculate the HDDS:
1. Cereals 7. Fish and seafood
2. Roots and tubers 8. Pulses/ legumes/ nuts
3. Vegetables 9. Milk and milk products
4. Fruits 10. Oil/ fats
5. Meat, poultry, offal 11. Sugar/ honey
6. Eggs 12. Condiments4
Items in each food group should be modified to include only those foods that are locally available
and/or consumed in country. Local terms should be used. The person who works to adapt the
questionnaire should consult the enumeration team and key informants to make the food group
descriptions as concrete and specific to the area as possible. The template (below) gives a numberof examples in each category. These are only examples, and the exact list for each category should
reflect locally available foods.
4 The Food and Nutrition Technical Assistance (FANTA) Project and FAO propose 12 food groups to measure household diet diversity.

8/9/2019 ACF FSL Manual Final 10
http://slidepdf.com/reader/full/acf-fsl-manual-final-10 242/270240 ACF Food Security and Livelihoods Assessment Guideline
3 steps are recommended to review and refine the food group descriptions and translations:
• Basic translation to the most appropriate major language
• First review of the translated questionnaire by the enumeration team to agree on appropriate
wording, fill food group lists with all locally available foods and identify typically fortified foods
(cereals, oil).
• Second review by key informants and/or FGD in each locality to review/ add locally available food
items to the food groups, identify local terms for ‘food’ and ‘meal’, discuss issues of availability of
seasonal foods (fruits, insects, etc), identify locally available fortified foods such as iodized salt
and availability of red palm oil or nuts, gather information on ingredients used in local dishes as well
as local meal customs, etc.
Method (administering the questionnaire): Avoid administering the questionnaire on feast days and
during celebration periods such as Ramadan as consumption patterns may be atypical.
Some foods in the list are listed as a single item – for example, beans – but may usually be eaten in
a sauce, soup or stew. If a mixed food like a sauce, soup, or stew has been eaten in the household,record all the food groups in the mixed food. For example, if the household consumed a stew of
beans, tomatoes, and green leaves, there should be a score of 1 recorded for each of the three food
groups that contain these foods.
Note that very small amounts of food (garlic, pickle, chilli, fish paste, milk in tea, etc.) should be
placed in the condiment or miscellaneous group when conducting the survey. This should be done
consistently by all enumerators. Foods purchased and consumed outside the home should not
be included.
A score of 1 is assigned if an item from that food group was consumed at least once in the reference
period, and 0 is assigned if it was not. Score will be either 0 or 1. An additional column is often added
asking the source of the different foods consumed.
Instead of reading off the questionnaire, it is more effective to allow the respondent to freely recall
what was eaten the previous day:
• Ask the respondent to list all the foods (meals and snacks) eaten yesterday during the day and
night. Start with the first food/drink consumed yesterday morning.
• As the respondent recalls the foods, underline the corresponding foods in the list under the
appropriate food group and write “1” in the column next to the food group if at least one food in
this group has been underlined. If the food is not listed in any group, write it in the margin and
discuss it with the supervisor.
• Probe for snacks eaten between main meals, for special foods given to children or lactating/
pregnant women, and for added foods such as sugar in tea, oil in mixed dishes or fried foods.
• If a mixed dish was eaten, ask about it and underline all the ingredients of the dish.
• Once the recall is finished, probe for food groups where no food was underlined. Write “0” in
the right hand column of the questionnaire when it is ascertained that no foods in that group
were eaten.

8/9/2019 ACF FSL Manual Final 10
http://slidepdf.com/reader/full/acf-fsl-manual-final-10 243/270241ACF Food Security and Livelihoods Assessment Guideline
NB. Beware of the confounding effect of food aid on dietary diversity scores.
HDDS Template
What foods have been eaten in the household inthe last 24 hours? 1=yes 0=no
Score(0 or 1)
Main FoodSource
Food Source codes
1 = Own production(crops, animals)
2 = hunting, fishing3 = gathering4 = borrowed5 = purchase6 = exchange labour
for food7 = exchange items
for food8 = gift (food) from
family relatives9 = food aid (NGOs etc.)
10 = Other specify:
ACereals – corn soy blend, pasta,rice, ugali, chapatti, sorghum,
biscuit, bread etc.
BRoots and tubers – potato, cassava,sweet potato etc.
C Vegetables – sukma wiki, sombe,spinach, pumpkin, cabbage, tomato,onion, hoho etc.
DFruits – mango, papaya, guava, banana,watermelon, avocado, orange, lemon etc.
EMeat, poultr y, offal - goat, camel, sheep,cow, chicken, liver, kidney, heart etc.
F Eggs
G Fish and seafood – dried or fresh
HPulses/ legumes/ nuts – beans, lentils,nuts, peas, nuts, seeds etc.
IMilk and milk products – fresh,powdered, yogurt etc.
J Oil/ fats – oil, fat, butter, ghee etc.
K Sugar – sugar, honey, sweets etc.
LMiscellaneous – tea, coffee, chat,condiments (royco) etc.
TOTAL HDDS SCORE (0-12)

8/9/2019 ACF FSL Manual Final 10
http://slidepdf.com/reader/full/acf-fsl-manual-final-10 244/270242 ACF Food Security and Livelihoods Assessment Guideline
The Individual Dietary Diversity Score (IDDS) is used as a proxy indicator of the nutritional
adequacy of an individual’s diet. It is most often used to measure the quality of diet of young
children and women of reproductive age.
Objective: to measure the dietary diversity of individuals of interest within the household
Time to administer: 5 to 10 minutes
Method (preparing the questionnaire): The recommended reference time period is the last 24
hours. The following sets of food groups are used to construct the IDDS:
Follow the same steps used in preparing the HDDS questionnaire. Do not leave categories abstract
or vague and list all foods that are commonly eaten in the area.
IDDS (adults) IDDS (children)
1 Cereals 1 Grains, roots or tubers
2 Vitamin A-rich vegetables and tubers 2 Vitamin A-rich plant foods
3 White tubers 3 Other fruits or vegetables
4 Dark green leafy vegetables 4 Meat, poultry, fish, seafood
5 Other vegetables 5 Eggs
6 Vitamin A-rich fruits 6 Pulses/legumes/nuts
7 Other fruits 7 Milk and milk products
8 Organ meat (iron rich) 8 Foods cooked in oil/fat
9 Flesh meat 9
10 Eggs 10
11 Fish 11
12 Legumes, nuts and seeds 12
13 Milk and milk products 13
14 Oils and fats (and red palm oil if applicable) 14

8/9/2019 ACF FSL Manual Final 10
http://slidepdf.com/reader/full/acf-fsl-manual-final-10 245/270243ACF Food Security and Livelihoods Assessment Guideline
Method (administering the questionnaire): Do not check off foods that have been added in very
small amounts, or for seasoning. For example, if a spoon of fish powder is added to a pot of stew,
do not record that the person has eaten fish. If one chilli pepper is included in the family pot, do not
record that as an “other fruit or vegetable.” Aside from the treatment of condiments, follow the same
steps used in administering the HDDS questionnaire.
If it is planned to collect data on HDDS and IDDS in the same instrument, data collection may
become confusing because of the similarities of the questions. It is important to train the
enumerators to help the respondent to transition from thinking about food groups consumed by the
household to thinking in greater detail about the food groups consumed by the individual.
A score of 1 is assigned if an item from that food group was consumed at least once in the reference
period, and 0 is assigned if it was not. A template for measuring diet diversity in young children
is below:
(Ask the mother or caregiver) What foods
has the child eaten yesterday during the dayor night? 1=yes 0=no
Score
(0 or 1)
Main Food
Source
Food Source codes
1 = Own production(crops, animals)
2 = hunting, fishing3 = gathering4 = borrowed5 = purchase6 = exchange labour
for food7 = exchange items
for food8 = gift (food) from
family relatives
9 = food aid (NGOs etc.)10 = Other specify:
AInfant formula, milk other than breastmilk, cheese or yoghurt such as tinned,powdered, or fresh animal milk
B
Foods made from grains, roots andtubers – porridge, gruel, fortified babyfood from grains (millet, sorghum,maize, other local grains), bread, rice,noodles, white potatoes, white yams,manioc, cassava, etc
C
Vitamin A-rich fruits and vegetables
(and red palm oil ) – yellow and orangefoods e.g. pumpkin, carrot, squash, sweetpotato, ripe mango, ripe papaya; dark,green, leafy vegetables e.g. cassavaleaves, bean leaves, kale, spinach, pepperleaves, taro leaves, amaranth leaves;foods made with red palm oil, palm nut,palm nut pulp sauce5
DOther fruits and vegetables [FILL INWITH LOCALLY AVAILABLE FOODS]
EEggs [FILL IN WITH LOCALLY AVAILABLE
FOODS]
F
Meat, poultr y, fish, shellfish and organmeats - goat, camel, sheep, cow,chicken, liver, kidney, heart, fresh or driedfish or shellfish, grubs, snails, insects orother small protein foods etc.
GLegumes and nuts – beans, lentils, nuts,peas, nuts, seeds etc.
HFoods made with oil, fat, butter [FILL INWITH LOCALLY AVAILABLE FOODS]
TOTAL SCORE (0-8)
IDDS (Children) Template:
5 Items in this category should be modified to include only vitamin A-rich tubers, starches, or vitamin A-rich red, orange, or yellowvegetables that are consumed in the country.

8/9/2019 ACF FSL Manual Final 10
http://slidepdf.com/reader/full/acf-fsl-manual-final-10 246/270244 ACF Food Security and Livelihoods Assessment Guideline
N.B. Beware of the confounding effect of breast-feeding on dietary diversity scores. Children who
are breast-feeding should be excluded from the IDDS measurement.
Method (tabulating results): Tabulation of the HDDS and IDDS can be done by hand or with adatabase or spreadsheet. First, the HDDS/ IDDS variable is calculated for each household or
individual. Sum up the values in the score column to get a frequency score. The value of this
variable will range from 0 to 12 for the HDDS and 0 to 8 for the IDDS.
Then, the average HDDS and IDDS score is calculated for the sample population by summing all the
scores and dividing by the total number of households or individuals.
Method (interpreting results): Interpretation of the scores will vary according to objective. As
assessment tools, HDDS and IDDS can be used to compare between groups or zones or against a
pre-established threshold of dietary adequacy. As surveillance tools, early warning indicators or
impact indicators, HDDS and IDDS are used to monitor trends across time. Baseline levels for trends
can be established in the framework of the assessment.
The population-level statistics of interest for dietary diversity are the mean dietary diversity score
and a measure of distribution of the scores, such as terciles. Looking at the percent of households/
individuals consuming each food group is another important analytical strategy.
ADAPTING THE HDDS AND IDDS TEMPLATES ACCORDING TO CONTEXT AND OBJECTIVES
Lengthening reference period: Both the HDDS and IDDS methodology can be adapted
according to objective. While the recommended reference time period is the last 24 hours, a
period of up to 7 days can be used. This can be appropriate if different food patterns areassociated with specific days of the week in the local culture e.g. market days or feast days,
which can bias results upwards or downwards depending on the particular day of the week that
the enumerator visits the household. However, beware of recall bias as accuracy will inevitably
be lower when the recall period is extended.
Altering food grouping: Likewise, food grouping for the HDDS can be different according to
objectives, putting emphasis on energy-dense foods or micronutrient-rich foods. In most cases,
the final number of food groups varies from 5 to 16, depending on the main characteristic of the
diet that the score intends to reflect.
HDDS (0-12)Total number of food groups consumed by members of the household. Values for groups A through L will be either “0” or “1”.Sum (A + B + C + D + E + F + G + H + I + J + K + L)
IDDS (0-8)Total number of food groups consumed by the individual. Values for groups A through Hwill be either “0” or “1”.Sum (A + B + C + D + E + F + G + H)
AverageHDDS
Sum (HDDS)___________________________________________________________
Total Number of Households
Average IDDS
Sum (IDDS)___________________________________________________________
Total Number of Individuals

8/9/2019 ACF FSL Manual Final 10
http://slidepdf.com/reader/full/acf-fsl-manual-final-10 247/270245ACF Food Security and Livelihoods Assessment Guideline
To compare between groups and zones:
The HDDS can be used to rank the dietary diversity of livelihood groups and zones identified in the
assessment using the mean score for each group or zone. Where diet diversity is well correlated
with income, the HDDS can be helpful in wealth ranking and vulnerability ranking exercises and can
be used to distinguish the food security of a range of groups and zones.
To compare against a pre-established threshold:
HDDS: Where target thresholds for adequate levels of dietary diversity are pre-established in the
geographic region or can be reliably developed, HDDS results can be measured against this
threshold in order to determine the percent of respondents that meet the cut-off. Again, relative
rankings of groups and geographic areas by % that meet the threshold provide insight into the
different levels of food access in the surveyed area.
IDDS: WHO guidelines consider 4 food groups to be a minimum standard for non-breastfed children
age 6-23 months (using the 8-group system). To calculate the % of non-breastfed children who meet
the minimum standard, divide the number of children with a diversity of 4 or more food groups by
the total number of non-breastfed children who were surveyed.
To measure the share of the population consuming micronutrient-rich foods:
At the population level, calculate the percentage of households or individuals who consume food
groups that are good sources of individual micronutrients. Key food groups of interest for Vitamin Aand iron rich foods are:
• Vitamin A plant-based food groups: vitamin A-rich vegetables or tubers, dark green leafy
vegetables, vitamin A-rich fruits (e.g. mangoes, apricots), red palm oil and its products
• Vitamin A animal-based food groups: organ meat, eggs, milk and milk products
• Iron-rich food groups: organ meat, flesh meat, fish
The following indicators can be derived for consumption of vitamin A rich food groups:
• Percent of individuals/households consuming plant foods rich in vitamin A (vitamin A rich vegeta-
bles and tubers, dark green leafy vegetables, or vitamin A rich fruits)
• Percent of individuals/households consuming vitamin A rich animal source foods (organ meat,
eggs or milk and milk products)
• Percent of individuals/households consuming either a plant or animal source of vitamin A (vitamin
A rich vegetables and tubers or dark green leafy vegetables or vitamin A rich fruits or organ meat,
or eggs or milk and milk products)
The following indicator can be derived for consumption of iron rich food groups
• Percent of individuals/households consuming organ meat, flesh meat, or fish
Minimum dietar y
diversity for non-breastfed children
6-23 months
Percent of non-breastfed children aged 6-23 months who received minimum dietarydiversity in 24 hours preceding survey
# non-breastfed children aged 6-23 months with dietary diversity of 4 or more foodgroups____________________________________________________________________ x 100
Total # non-breastfed children aged 6-23 months

8/9/2019 ACF FSL Manual Final 10
http://slidepdf.com/reader/full/acf-fsl-manual-final-10 248/270246 ACF Food Security and Livelihoods Assessment Guideline
The indicators above are calculated by summing the number of households or individuals who
consumed ANY of the food groups listed in the questionnaire that contain the foods of interest, then
dividing by the total sample size of the survey.
Globally, the HDDS and IDDS are calculated and interpreted differently because the scores are used
for different purposes. The HDDS is meant to provide an indication of household economic access
to food, thus items that require household resources to obtain, such as condiments, sugar and
sugary foods, and beverages are included in the score. The Individual Dietary Diversity Score (IDDS)
reflects the nutrient adequacy of the diet and the food groups considered in this score place more
emphasis on micronutrient intake.
Source: FAO. 2006. Baseline Survey Report Protecting and Improving Household Food Security and
Nutrition in HIV/AIDS Affected Areas in Manica and Sofala Province, Maputo, Mozambique
EXAMPLE OF GROUPING HDDS INTO DIETARY DIVERSITY TERCILESIn Mozambique, dietary diversity scores were analyzed to identify which food groups were predominatelyconsumed at different levels of the score. This provided information on the kinds of foods eaten byhouseholds with the lowest diversity, and those foods that were added by households with higherdiversity [and higher income]. Scores were grouped into terciles to reflect what diets look like in CentralMozambique (during mango season).
Food groups consumed by >50% of households by dietary diversity tercile
Lowest dietar y diversit y(=< 3 food groups)
Medium dietar y diversity(4 and 5 food groups)
High dietar y diversity(=> 6 food groups)
Cereals Cereals Cereals
Green leafy vegetables Green leafy vegetables Green leafy vegetables
Vitamin A-rich fruit Vitamin A-rich fruit Vitamin A-rich fruit
Oil Oil
Other vegetables
Fish
Legumes, nuts and seeds
Example: Percent of households or individuals who consumed plant foods rich in vitamin A during
the last 24 hrs:
Sum of households/individuals who consumed vitamin A rich vegetables and tubers OR dark greenleafy vegetables OR vitamin A rich fruits
__________________________________________________________ x 100
Total number of respondents

8/9/2019 ACF FSL Manual Final 10
http://slidepdf.com/reader/full/acf-fsl-manual-final-10 249/270247ACF Food Security and Livelihoods Assessment Guideline
EXAMPLE OF HDDS ACROSS LIVELIHOOD ZONES IN MANDERA, NORTHERN KENYA
The study area is composed of 3 livelihood zones: pastoral, riverine, and urban or so-called
drop-out pastoralist.
The population in the pastoral zone traditionally depends on livestock production as the main
source of livelihood, with increasing sedentarization in recent decades. The population in theriverine zone are agriculturalists and cultivate maize as the staple food crop complemented by
cash crop cultivation. In the urban zone, principal sources of livelihood are casual labor, firewood
collection and charcoal production.
In total 198 households across the three zones were interviewed at the beginning of shortage of
food items (December 2008), shortage of casual labor and return of livestock from migration
(March 2009) and migration of livestock in search of pasture (June 2009). These points coincide
with the long rain season (March-June) and short rain season (Oct.-Dec.). Twelve food groups
were used as recommended by FANTA.
Significant differences in dietary diversity between the three zones were observed, in particular
between the urban population and the pastoral/ riverine populations, who suffer greater
seasonal extremes due to their increased dependence on own production (milk, cereals) (seeGraph below). Riverine populations systematically ranked lower in diet diversity than the other
populations and can be considered to have the least secure food access due to their chronic
exposure and vulnerability to drought and absence of alternative livelihood options. Prevalence
of malnutrition across the three populations was found to be unrelated to diet diversity and is is
more likely linked to WASH factors and care practices in the area.
Dec-08 Jan-09 Feb-09 Mar-09 Apr-09 May-09 Jun-09
2.0
3.0
4.0
5.0
6.0
6.5 6.3
5.8
5.4
5.55.5
8.4
4.0
2.7
7.0
8.0
9.0
Pastoral Riverine Urban
M e a n H D D S
Source: FS&L Dept., ACF Kenya, 2009.
*This material was drawn in part from: Food and Nutrition Technical Assistance Project (FANTA)’s
Household Dietary Diversity (HDDS) for Measurement of Household Food Access Indicator Guide,
2006; Knowledge, Practices and Coverage KPC2000+ Field Guide 2006 Module 2: Breastfeedingand Young Child Feeding, 2006; and FAO’s Guidelines for Measuring Household and Individual
Dietary Diversity, 2008.

8/9/2019 ACF FSL Manual Final 10
http://slidepdf.com/reader/full/acf-fsl-manual-final-10 250/270248 ACF Food Security and Livelihoods Assessment Guideline
Appendix 24: Calculating the Food Consumption Score
The Food Consumption Score (FCS) is a score calculated using the frequency of consumption of
different food groups consumed by a household during the 7 days preceding the survey. It is used
as a proxy indicator of household dietary adequacy focusing principally on macronutrients
and energy.
Objective: to measure the frequency-weighted dietary diversity of households
Time to administer: 10 minutes
Method (preparing the questionnaire): A disaggregated list of food items is prepared that will serve
as the basis of the questionnaire. Generally, the list of food items surveyed is between 10 and 25.
The food item list should be customized paying particular attention to cereals/grains, cereal-made
food like bread or couscous, or other staples which have important economic meaning in the local
culture. Knowledge of the local food habits as well as nutritional considerations must inform the
creation of the list of foods, and local terms should be used. The person who works to adapt the
questionnaire should consult the enumeration team and key informants to make the food class
descriptions as concrete and specific to the area as possible. The template (below) gives anexample of a food item list. This is only an example, and the exact list of foods should reflect local
food patterns.
4 steps are recommended to review and refine the food group descriptions and translations:
• Identification of major food classes according to local food habits and nutritional considerations,
with examples of typical foods listed for each class
• Basic translation to the most appropriate major language
• First review of the translated questionnaire by the enumeration team to agree on appropriate
wording, fill food class lists with all locally available foods and identify typically fortified foods(cereals, oil).
• Second review by key informants and/or FGD in each locality to review/ add locally available food
items to the food classes, identify local terms for ‘food’ and ‘meal’, discuss issues of availability
of seasonal foods (fruits, insects, wild foods etc), discuss foods typically used as condiments,
gather information on ingredients used in local dishes as well as local meal customs, etc.
Method (administering the questionnaire): The recommended reference time period is the last 7
days. To measure sufficiency of food consumption, households are asked to recall the foods that they
consumed in the previous seven days. Each item is given a score of 0 to 7, depending on the
number of days on which it was consumed.
Foods consumed as condiments or in small quantities (such as milk or sugar in tea) should be noted
only in the last category, and will later be excluded from calculation.
Avoid administering the questionnaire on feast days and during celebration periods such as
Ramadan, as consumption patterns may be atypical.
Use the recall method to administer the questionnaire, instead of reading off the individual food
items (see method outlined for administration of the HDDS tool). Underline individual foods in each
group, note then sum together the total number of days for which foods were consumed for each
food class. Probe for snacks between main meals, special foods given to children or lactating/
pregnant women, and for added foods such as oil in mixed dishes.

8/9/2019 ACF FSL Manual Final 10
http://slidepdf.com/reader/full/acf-fsl-manual-final-10 251/270249ACF Food Security and Livelihoods Assessment Guideline
The following table presents an EXAMPLE of the Food Consumption Score module. The list of food
items must be adapted to capture the differences in diet pattern across various countries with
regard to specific cereal consumption (rice vs. maize vs. sorghum vs. wheat…).
*Names of food items relevant to the local context should be inserted.
NB. Beware of the confounding effect of food aid on food consumption scores.
What foods have been eaten in the household in the last 7 days? On how many days in the last 7 days was
the food eaten?
Food Item*Number of dayseaten last 7days (0-7)
Main FoodSource over thepast 7 days
Food Source codes
1 = Own production(crops, animals)2 = hunting, fishing3 = gathering4 = borrowed5 = purchase6 = exchange labour
for food7 = exchange items
for food8 = gift (food) from
family relatives9 = food aid
(NGOs etc.)
10 = Other specify:
A Rice
B Maize
C Cassava
DOther roots and tubers(potatoes, yam)
EFish
F White meat – poultry
G Pork
H Red meat
I Wild meat
J Eggs
K Pulses/ lentils/ bean curd
L Vegetables (carrots, onions,tomatoes, etc.)
M Green, leafy vegetables
N Oil/ butter
O Fresh fruits
P Sugar / sugar products
Q Milk / milk products
R Condiments
FCS Module Example:

8/9/2019 ACF FSL Manual Final 10
http://slidepdf.com/reader/full/acf-fsl-manual-final-10 252/270250 ACF Food Security and Livelihoods Assessment Guideline
Method (tabulating results): Food items are aggregated into food groups. The following set of 8
food groups is commonly used to calculate the FCS, with condiments as a blank category:
1. Main staples 6. Milk and milk products
2. Legumes/ pulses/ nuts 7. Sugar
3. Vegetables 8. Oil
4. Fruits 9. (Condiments)
5. Meat and fish
Each food group is assigned a weight, reflecting its nutrient density (the food group’s quality in terms
of caloric density, macro and micro nutrient content taking into account the actual quantities
typically eaten). For example:
• Meat and fish are assigned a weight of 4, reflecting their high protein quality, easily absorbable
micronutrients, energy density and the fact they significantly raise the quality of the diet even when
consumed in small quantities;
• Pulses are given a weight of 3, reflecting the high protein content of beans and peas and the high
fat content of nuts;
• Sugar is given a weight of 0.5, reflecting the absence of micronutrients and the fact that it is
usually eaten in relatively small quantities.
The household FCS is calculated for each household by:
1. Summing all the consumption frequencies of food items of the same group, and recoding the
value of each group that is more than 7 as 7,
2. Multiplying each food group frequency by each food group weight,
3. Summing the weighed food group scores into one composite score, thus creating the FoodConsumption Score (see Template below). The household FCS score can have a maximum value of 112
4. Using the appropriate thresholds, recode the FCS into categories (poor, borderline or acceptable
Food Consumption Groups), as indicated below.

8/9/2019 ACF FSL Manual Final 10
http://slidepdf.com/reader/full/acf-fsl-manual-final-10 253/270251ACF Food Security and Livelihoods Assessment Guideline
FCS Tabulation Template:
Method (interpreting results): Interpretation of the scores will vary according to objective. As an
assessment tool, FCS can be used to compare between groups or zones or against pre-established
thresholds of dietary adequacy. As a surveillance tool, early warning indicator or impact indicator,
FCS can be used to monitor trends across time. Baseline levels for trends can be established in the
framework of the assessment.
The population-level statistics of interest are the mean Food Consumption Scores, a measure ofdistribution of the scores, such as terciles, and the share of households falling into poor, borderline
and acceptable groups.
To compare between groups and zones:
The FCS can be used to rank the dietary diversity of livelihood groups and zones identified in the
assessment using the mean score for each group or zone. As the FCS is correlated with nutrition
security and food access more generally, it can be serve as one of the indicators in wealth ranking
and vulnerability ranking exercises in order to distinguish the food security of groups and zones.
No Food group Items consumed by the householdWeight
(A)FrequencyScore (B)
TotalScore( A x B)
1 Main staples
Maize, rice, sorghum, millet, wheat and
other cereals/ grains
Cassava, potatoes, taro, sweet potatoesand other root crops/ tubers
2Legumes andpulses
Beans, peas, lentils, groundnuts, cashewnuts, etc
3
3 Vegetables Vegetables, relish and leaves 1
4 Fruit Fruits 1
5 Meat and fishBeef, goat, poultry, pork, wild meat, eggs,fish, insects etc.
4
6 Milk Milk, yoghurt, and other dairy products 4
7 Sugar Sugar and sugar products, honey 0.5
8 Oil Oils, fats, ghee and butter 0.5
9 CondimentsSpices, tea, coffee, salt, fish powder, small
amounts of milk for tea, etc0

8/9/2019 ACF FSL Manual Final 10
http://slidepdf.com/reader/full/acf-fsl-manual-final-10 254/270252 ACF Food Security and Livelihoods Assessment Guideline
To compare against pre-established thresholds:
The household Food Consumption Score is compared with pre-established thresholds that indicate
the household’s food security status. Thresholds have been developed by WFP for three so-called
Food Consumption Groups (defined as “poor”, “borderline” and “acceptable”).
In populations that have a high frequency consumption of oil and sugar (daily or almost daily),
alternate cut-offs are proposed:
Populations are classified into Poor, Borderline, and Acceptable reflecting their food security status.
The share of the population with poor and borderline food security reflects the prevalence of food
insecurity in the area.
The proposed scoring cut-offs are known to be conservative, and may still not be applicable across
all contexts, especially as it relates to caloric adequacy6. Evidence suggests the FCS is more closely
correlated with diet quality than calorie consumption. Locally-specific thresholds for the householdFCS can be developed, tested and defined based on the frequency of scores and knowledge of
consumption behaviour in the region, but this requires advanced statistical analysis. It is
recommended to consult with the WFP office in-country about appropriate thresholds for analysis.
*This material was mostly drawn from: WFP Vulnerability Analysis and Mapping Branch Food
Consumption Analysis – Calculation and use of the Food Consumption Score in food consumption
and food security analysis, 2008.
The typical thresholds used by WFP are:
FCS Food Consumption Groups [t ypical]
0 – 21 Poor
21.5 – 35 Borderline
> 35 Acceptable
FCS Food Consumption Groups [high sugar/oil consumption]
0 – 28 Poor
28.5 – 42 Borderline
> 42 Acceptable
6 An IFPRI validation study of the FCS found that the present cut-off points lead to serious underestimates of food insecurity whencompared to calorie consumption per capita. No evidence was found for the existence of universal cut-offs.

8/9/2019 ACF FSL Manual Final 10
http://slidepdf.com/reader/full/acf-fsl-manual-final-10 255/270253ACF Food Security and Livelihoods Assessment Guideline
EXAMPLE OF FCS ACROSS GROUPS IN KIROTSCHE, DRC
The study area in North Kivu is broadly characterized by large population movements and the
influx of IDPs from mountainous areas in Masisi to the relatively secure lakeside areas of
Kirotsche as a result of recurrent armed conflict between insurgent groups. The displaced
population is living with host families or in camps around Goma, Minova, Shasha, Kirotsche
and Sake.The chronic insecurity and large-scale population influx has led to an increase in casual labor
supply on local markets, pressure on local resources (water, fuel, agriculture, livestock), poorly
supplied food markets (as a result of road blockage) and price inflation.
421 households across Kirotsche were surveyed using the FCS tool. 24 food items were grouped
into 8 food groups to measure household frequency of consumption. Cereals and tubers were
grouped separately to account for frequent consumption of tubers in the population; while milk
products were eliminated entirely as a group due to the universally very low consumption of milk
or cheese. Out of a total possible score of 98, households were classified by food security
status using FCS thresholds of 24 and 38. The cut-offs were borrowed from a recent
Vulnerability Analysis and Mapping (VAM) survey conducted by WFP in the region that utilized the
FCS tool.
Displaced households living in camp situations were found to be most food insecure relative to
IDPs in host families or residents. The findings (below) mirrored the results from the VAM survey.
IDP in campsituation
IDP in hostfamily
Resident hostfamily
Resident
0%
25%
50%
75%
100%
Source: FSL Dept., ACF DR Congo, 2008.
Poor Borderline Acceptable
% o
f H o u s e h o l d s
Food Consumption Groups by Displacement Status
8%
6%
36%
57%
17%
47%
50%
44%
17%
40%
43%
36%

8/9/2019 ACF FSL Manual Final 10
http://slidepdf.com/reader/full/acf-fsl-manual-final-10 256/270254 ACF Food Security and Livelihoods Assessment Guideline
Appendix 25: FCS, HDDS and IDDS comparison matrix
Table adapted from: WFP – FAO, 2008. Interagency Workshop Report: Measures of Food
Consumption Harmonizing Methodologies. Rome.
Table 31: Comparison matrix
Key QuestionsFood ConsumptionMethod/Score
Household DietaryDiversity
Individual Dietary Diversity
1CONSTRUCTIONWhat information iscollected in the method?
7 day recall of the
consumption of 8 food groupseaten by the household(score based on weightedsum of food groups)
24 hour recall of the con-
sumption of 12 foodgroups eaten by thehousehold (score based onsimple sum of foodgroups).
24 hour recall of theconsumption of 14 food
groups eaten by anindividual, most oftenvulnerable groups (women oryoung children).(score basedon simple sum of food groups)
2
MEANINGWhat is the meaning ofthe indicators derivedfrom this method?
Proxy indicator of HH foodaccess/ consumption,focusing principally onmacronutrients and energy.(caution in extrapolating fromHH to individual)
Proxy indicator of HH foodaccess/ consumption,including access to Vita-min A and iron rich foods.(caution in extrapolatingfrom HH to individual)
Proxy indicator ofmicronutrient/ dietaryadequacy (research lookingat micronutrient adequacyongoing), also a proxy forfood access/ consumption
3
REQUIREMENTSWhat are the practicalrequirements to use the
method?
Adaptation (local foods and food names need to be included as examples for each foodgroup in the questionnaire.) Enumerator training required. Basic analytical skills required
to calculate score and prevalence. More advanced skills to do further analysis.
4
REFERENCESHow are the indicators/ scores interpreted?
Cut-points of 21 and 35reflect three levels of foodsecurity. Higher cut-pointsused if oil and sugar areconsumed in the area.Means are used formonitoring. Interpretation:Prevalence of population withscore of 21 or lessreflects prevalence of verypoor consumption.
No standard cut-point.Means or terciles used forcomparison betweenareas/groups, and trendsover time. Interpretation:lowest terciles reflects thelowest diversity for thatarea. Best used to followtrends over time. Individ-ual food groups also used.
No standardized cut-point forIDDS in adults. Same asHDDS (adults), analyse bydistribution of scores intoterciles (or quartiles) and alsoby prevalence of consumptionof individual food groups. A cut-off for minimumacceptable diversity hasbeen defined for children6-23.9 months of age.
5
LIMITATIONSWhat are the mainlimitations of the method?
Works less well in urbanareas. Does not capture intra-HH distribution. Questionablestandard cut-offs.Communication of results isharder than with HDDS.Potential double counting ofgroups when food items areaggregated into food groups.Moderate correlation withenergy intake. Works lesswell for upper end of thespectrum. More recall biasdue to recall period of 7 days.Does not capture foodeaten outside home.
Works less well in urbanareas. Does not captureintra-HH distribution.Currently no standardcut-offs. Less informationcaptured due to shorterrecall period. Weak correlation with energyintake. Does not capturefood eaten outside home.
Less information onhousehold foodconsumption. Cannotextrapolate individualconsumption tohousehold level.No standard cut-offsfor adults.
6
STRENGTHSWhat are the mainstrengths of the method?
Positive correlation withenergy and other HH FSindicators. Allows for a gooddescription of dietary pat-terns. Works better at thelower end of the spectrum(which is the group ofinterest). Lots of experiencein the field, wide use inassessments and countries.Technical guidance available.Wide range of possiblevalues. Recall covers alonger period, hence moreinformation is provided.
Positive correlation withenergy and other HH FSindicators. Allows for agood description of dietarypatterns. Captures accessto vitamin A and iron richfoods. Easy to explain thescore. Less recall biasthan scores derived fromlonger recall periods.Technical guidance avail-able. Simple and quick toadminister and easy tocalculate the score.
Works well in urban and ruralareas. Can accountfor food eaten outside ofhome. Can captureIntra-HH distribution of food.Correlated withmicronutrient intake/ adequacy. Easy forrespondent and interviewers.Provides a good descriptionof diet patterns.

8/9/2019 ACF FSL Manual Final 10
http://slidepdf.com/reader/full/acf-fsl-manual-final-10 257/270255ACF Food Security and Livelihoods Assessment Guideline
Appendix 26: Calculating the Coping Strategy Index
The Coping Strategy Index (CSI) is a tool strategy for rapid measurement of household foodsecurity in humanitarian strategy emergencies.
Objective: to measure the coping strategies of households as a proxy indicator of food access andlivelihood security
The CSI is composed of a series of questions that typically measure people’s responses to food
shortage. Four general categories of consumption coping are measured, with individual strategiesdefined specifically according to location and culture:
5. Dietary change (e.g. eating less preferred but less expensive food)
6. Increasing short-term food access (e.g. borrowing, gifts, wild foods, consuming seed stock)
7. Decreasing the numbers of people to feed (e.g. short-term migration)
8. Rationing strategies (e.g. mothers prioritizing children/men, limiting portion size, skippingmeals, skipping eating for whole days)
Responses will vary in relation to the scope and magnitude of a shock or strained situation.
Questions are typically grouped according to the perceived seriousness or severity of the copingresponse and assigned a weight in proportion to the severity .
A 5-question “Universal Index” related to responses to food shortage has been tested acrossseveral countries and is considered universally applicable. It represents the mandatory minimum setof questions to be included in any CSI, and can be reliably used to compare changes in food access
across regions and countries. It uses a standard set of five individual coping behaviours that can beemployed by any household, anywhere. A universal set of severity weightings for the behaviours
has also been developed.
The five standard coping strategies and their severity weightings are:7
• eating less-preferred foods (1.0)• limiting portions at mealtime (1.0)
• limiting adult intake (3.0)• reducing the number of meals per day (1.0)• borrowing food/ money from friends and relatives (2.0) A “Full” or context-specific CSI can also be developed by adding-on to the 5 universal questions byconsulting with community-level focus groups and key informants. This allows for widening thescope beyond consumption coping to livelihood coping strategies that address risks to livelihoods,
or for use in highly specific contexts e.g. examining food access in HIV/AIDS-affected communities.
7 While the first 4 strategies are clear consumption strategies, the fifth strategy (borrow food) is sometimes considered a livelihoodstrategy, as the ability to engage this strategy varies depending on a household’s social capital and access to social networks.

8/9/2019 ACF FSL Manual Final 10
http://slidepdf.com/reader/full/acf-fsl-manual-final-10 258/270256 ACF Food Security and Livelihoods Assessment Guideline
Method (preparing the questionnaire): If the assessment objective is primarily for geographic
targeting of food insecure zones, it is appropriate to rely solely on the universal CSI tool. Thetemplate can be found below.
In other cases, a context-specific CSI will be considered important to administer to better supportthe identification of vulnerable households in the population. The process to develop a context-specific CSI is intensive and requires a substantial amount of upfront work.
5 steps are recommended to construct a context-specific CSI:
• Generate a comprehensive list of locally relevant strategies by key informants and/or FGD in eachlocality, to be triangulated across livelihood/population groups. General questions should be askedsuch as “what do people do in response to food shortage”. Identify strategies undertaken inresponse to crisis rather than seasonally e.g. gathering wild foods. Ensure women are included inthe group.
• Group strategies of similar severity by assisting the group to rank the identified strategies into 3 or4 levels of perceived severity. See detailed instructions below.
Deciding between a universal and a context-specific CSI* Where the assessment objective is to measure and compare food security across different locations
and contexts for the purpose of geographic targeting, the 5 questions in the universal CSI are sufficientand appropriate.
* Where the assessment objective is to identify the most vulnerable households in a given location for thepurpose of vulnerable group targeting, additional context-specific questions can be added to the CSI inorder to assist in flagging extreme behaviours that are associated with high levels of food insecurity inthe local area.
Universal CSI Template:
No. QuestionFrequency score:Number of days out of the pastseven (0 -7).
In the past 7 days, if there have been times when you did not have enough food or money to buy food,
how often has your household had to:
1 Rely on less preferred and less expensive foods?
2 Borrow food, or rely on help from a friend or relative?
3 Limit portion size at mealtimes?
4 Restrict consumption by adults in order for small children to eat?
5 Reduce number of meals eaten in a day?
TOTAL HOUSEHOLD SCORE:

8/9/2019 ACF FSL Manual Final 10
http://slidepdf.com/reader/full/acf-fsl-manual-final-10 259/270257ACF Food Security and Livelihoods Assessment Guideline
• Narrow down the list to only those strategies that are exceptional (not seasonal), short-term, reflect
a broad consensus of opinion, apply to all groups equally and represent the same severity level of
food & livelihood insecurity for each of these groups8. Where strategies vary by group, omit these
questions if the objective of the CSI is to compare between groups. If a single livelihood group is
being assessed, then it is possible to include strategies specific to that group.
• Basic translation to the most appropriate major language
• Review of the translated questionnaire by the enumeration team and a group of local informants
to agree on and adapt meanings and phrases to the local context, identify examples of
‘less-preferred foods’, ‘undesirable foods’, etc.
The list should be the main set of coping strategies—it doesn’t need to include every single
strategy mentioned (some are very rare), but should represent the consensus view of all the groups
interviewed. Try to keep the list down to a feasible number (perhaps 12–15 at most). It should not
include any similar or overlapping coping strategies (e.g. different ways of describing the same
basic behavior).
Caution: Consumption-related questions should be the focus of the CSI9
. Care should be taken withregard to questions about:
• Taking loans
• Selling assets
• Liquidating savings
• Distress migration
These or other strategies to augment the household resource base should not be included, as not
all livelihood coping strategies are accessible or available to all people. For example, taking a loan
or selling off assets may not be an option for extremely poor households, to whom moneylenders
will not lend and who may not own any assets to sell. Responses to these questions are misleading
because a negative response does not necessarily indicate the household is food secure.
Procedure for Grouping Strategies of Similar Severity
A series of focus group discussions should be held to ask questions about the perceived severity of
all the coping behaviors that end up on the list.
• The first step is to group the strategies into categories that are of roughly the same level of
severity. Since this task is carried out with different groups, it is useful to impose some structure
from the outset. For example, one could divide them into four different categories: very severe,
severe, moderate, and least severe.
8 Irreversible strategies are defined as behaviours that have a negative impact on the long-term livelihoods of affected populations.Irreversible strategies should be distinguished from adaptive mechanisms, which are measures used to manage and minimizethe risk from chronic food insecurity and recurring situations. Adaptation is a process of adjustment to a longer-term solution, forinstance pastoralists moving to areas of better rainfall and pasture growth, and can lead to new livelihood strategies. The CSI isnot well adapted to capture long-term adaptation to chronic shock; questions should be limited to short-term reversible andirreversible strategies.
8 Food security is clearly related to factors besides just short-term consumption, including longer-term livelihood strategies, laboropportunities, alternative income-generating strategies, levels of physical and financial assets and one-off asset sales. Researchshows that households tend to use both consumption coping strategies and longer-term livelihood strategies simultaneously.Therefore restricting the CSI to short-term consumption behaviors – which are comparable across social groups – is adequateas a rapid indicator of both food and livelihood security at the household level.

8/9/2019 ACF FSL Manual Final 10
http://slidepdf.com/reader/full/acf-fsl-manual-final-10 260/270258 ACF Food Security and Livelihoods Assessment Guideline
• It is always easiest to establish the extreme types of coping strategy, so ask the group to select
the most severe and least severe individual strategies first.
• Then ask if there are other individual strategies that are more or less the equivalent of these two in
terms of how severe they are perceived to be. When those two extreme categories are established,
it is easier to group the remaining behaviors into intermediate categories.
• This must be done with enough groups representing enough diversity within the location or culture
to ensure that a reasonable consensus has emerged. Weighting the individual strategies on an
insufficient number of focus groups risks errors in the analysis.
• Although there is no hard and fast rule on how many focus groups is “enough,” a minimum of six
to eight is recommended for each culture or location, with the main different social groups
represented. Women are likely to be the most knowledgeable informants, but men should be
consulted as well.
• Tabulate results by strategy and by focus group into a grid that will allow for calculating the
consensus severity weight for each strategy (see Example at end of Appendix section)
Method (administering the questionnaire): The CSI is based on a 7-day recall period and asks
about the number of days in the past seven days that the particular strategy was used in the house-
hold. The frequency score varies from 0 to 7.
1. Note the way in which the question is worded. Repeat the main question for each behavior to
remind the respondent that the question is referring to times when they did not have enough food
or enough money to buy food. Be sure the question includes the recall period.
2. Note that you are always asking about some time period beginning from today and counting
backwards (e.g., “the last seven days” not “the past week,” or “last week”). People get confused
if you are not specific about this.
3. If a respondent answers “all the time,” be sure to clarify if that means each day for the past seven
days, and if so, record the answer as seven. If s/he says “never,” be sure to clarify if this means
zero days, and if so record the answer as zero. If it is something that the household never does,
a “not applicable” answer should be given.
4. Results tabulation is explained below.
Method (tabulating results): The CSI tool relies on counting coping strategies that are not equal in
severity. Different strategies are "weighed" differently, depending on how severe they are considered
to be by the people who rely on them.
The CSI score is calculated in 3 steps:
1. Summing the frequency of the strategies for each household
2. Categorizing and weighting the strategies by severity
3. Combining the frequency and severity scores to calculate a weighted score for that household.

8/9/2019 ACF FSL Manual Final 10
http://slidepdf.com/reader/full/acf-fsl-manual-final-10 261/270259ACF Food Security and Livelihoods Assessment Guideline
Tabulation template (universal CSI)
No. QuestionFrequency
score(0-7)
Severityscore(1-3)
WeightedScore =
Frequency xWeight
1 Rely on less preferred and lessexpensive foods?
1
2Borrow food, or rely on help from afriend or relative?
2
3 Limit portion size at mealtimes? 1
4Restrict consumption by adults inorder for small children to eat?
3
5 Reduce number of meals eaten in a day? 1
TOTAL HOUSEHOLD SCORE:
Method (interpreting results): The higher the CSI score, the more food insecure the household.
CSI data is most powerful if it is analyzed and interpreted over multiple time periods, across
multiple locations, and/or across specific groups.
The CSI correlates well with food security measures (e.g. food frequency, diet diversity, meal
frequency, caloric intake) as well as livelihood measures (e.g. assets and expenditures). CSI results
should be triangulated with more than one indicator - for example, HDDS and food sources.
To target households:The context-specific CSI is developed based on local contexts and yields very detailed information
about the localized food security situation. Within a specific location, the context-specific CSI will
be useful for identifying food insecure households. CSI data from individual households can be
aggregated into mean scores by sub-group or location to reveal information on the relative food
security of a range of livelihood groups or zones. Location or group-specific severity scores can
then be used to contribute to vulnerability rankings of individual populations.
To target geographic areas:
The universal CSI is useful in comparing mean scores across regions that may be significantly
different from each other, and in assisting with geographical targeting of humanitarian assistance.
To use as a PRA tool in qualitative analysis:
The CSI can also be adapted as a qualitative tool (applicable to Participatory Rapid Appraisal or
PRA). The tool can be used in focus group discussions in which community averages are the topic
of the discussion, rather than individual household scores. The CSI tool can be used in conjunction
with a proportional piling exercise to obtain the relative proportions of groups in the community
relying on various coping strategies. Using the CSI as a PRA tool gives some level of information
about the average impact at the village or community level, and can be a useful cross-check on
household level information.

8/9/2019 ACF FSL Manual Final 10
http://slidepdf.com/reader/full/acf-fsl-manual-final-10 262/270260 ACF Food Security and Livelihoods Assessment Guideline
The qualitative tool looks similar to the set of questions about individual coping strategies for the
household survey, but rather than inquiring about the relative frequency of relying on those
strategies at the household level, the question is about the relative proportions of households in the
village or community employing the strategy. Beans or stones can be used by a group of informants
to depict the proportions of households in the community that are regularly relying on a given
strategy or behavior. If ten beans or stones are provided to depict the answer in each case, you will
get rough estimates of the proportion of the village population in tenths (or ten percent of the
population) that do/ do not rely on various coping strategies.
Be aware about the potential impact of social bias on the findings – as open discussion of
shameful or illicit behaviors in a public forum may not always lead to reliable findings.
*This material was in part drawn from: CARE USA The Coping Strategies Index Field Methods
Manual, Second Edition, 2008.
To be noted about the matrix below:
Example of Coping Strategies Grouped and Ranked by Focus Group
No. Question
Focus Group Ranking for Each Individual Behaviour
FG1 FG2 FG3 FG4 FG5 FG6 FG7 FG8 FG9 FG10 FG11 FG12 MeanConsensus
Ranking
1 Less preferred 1 1 1 1 1 1 1 1 1 1 1 1 1.01 1
2 Borrow 2 2 2 2 2 3 2 2 2 2 2 2 2.1 2
3 Buy on credit 2 2 1 2 1 3 2 2 2 2 3 2.0 2
4 Wild foods 5 5 3 3 3 4 4 4 4 5 4 4 4.0 4
5 Eat seed stock - - 3 3 3 4 2 3 4 2 4 4 3.2 3
6HH membersgo elsewhere
- - 2 2 2 1 3 2 2 3 2 3 2.2 2
7 Beg 5 5 4 4 3 3 2 4 4 5 5 5 4.1 4
8 Limit portions 1 1 1 1 1 1 1 1 1 1 1 1 1.0 1
9Restrictadult intake
3 2 2 - - 2 3 1 3 - - 2 2.3 2
10 Feed workers 3 3 2 - 2 2 3 1 3 3 3 2 2.5 3
11 Reduce meals 1 1 2 1 1 1 1 2 - 3 1 1.4 1
12 Skip meals 4 4 3 3 4 4 4 3 4 4 3 4 3.7 4
• The individual strategies listed have been grouped into four categories, where 1 indicates the leastsevere category, 4 indicates the most severe, and 2 and 3 are intermediate.
• Twelve different focus groups were consulted about their perceptions of the severity of the variousindividual strategies.
• There was not complete consensus except that limiting portion size was the least severe and skippingentire days or begging were the most severe. However, a quick glance will indicate that there was fairlygood consensus on the severity of most of the strategies.
• In general, the consensus ranking should be a whole number that is the most frequent response.

8/9/2019 ACF FSL Manual Final 10
http://slidepdf.com/reader/full/acf-fsl-manual-final-10 263/270261ACF Food Security and Livelihoods Assessment Guideline
Appendix 27: Tools and considerations for Data Analysis
Data analysis is undertaken in 2 main ways:
(i) Use of software packages
(ii) Team de-briefings and analytical workshops
Analysis will usually comprise a mixture of the two. Comprehensive FSL assessments will rely more
heavily on statistical analysis using a database while rapid assessments have a greater
emphasis on qualitative data collection and will favor analytical workshops with the assessment
team. The analytical workshops can and should also take place with those who were involved in
providing the information.
The analytical method and the database that is selected will depend on the staff available, their time
and their capacities. Up until now ACF has largely relied on each individual food security and
livelihood officer to develop his or her own analytical system based on the use of Excel, EPIinfo and
in certain cases, Access. This has led to constant changes in the analytical system and a lack of
continuity.
Currently ACF is promoting the use of the ‘Sphinx’ software package which is intended to
improve continuity in data analysis methods.
Software and Hardware
Sphinx19 is user-friendly for data entry but may be limited for output when compared to other
software. It is however possible to export data from Sphinx to Excel in order to carry out other
analyses if necessary. While it is relatively new within ACFIN, it has been piloted and adopted
operationally. SPHINX is a software package for survey design and data analysis that can analyze
qualitative and quantitative data and automatically produce graphic tables from the data. It is based
on Microsoft products and is user-friendly and flexible. The questionnaire is developed using the
software (in a way similar to that of EPIinfo) but it is more innovative and complete. It is easilyaccessible for those less experienced in data entry. The software is available in French, English and
Spanish. Whichever software is selected, it must offer user-friendly cross tabulation.
Cross Tabulation
Cross-tabulation displays the joint distribution of two or more variables, most often in a matrix
format. Whereas frequency distributions show the distribution of a single variable (e.g. settlement
status), cross tabulations describe the distribution of two or more variables simultaneously (e.g.
settlement status and geographical zone). The tool establishes an interdependent relationship
between two variables but does not establish causality.
Individual cells can be highlighted in order to draw out specific information in the table, for examplethe destination of refugees who return to DRC’s South Kivu from camps in Tanzania (see table below).
Table 32: Geographical zone by % settlement status
Status Basin Littoral Hills Plains
Displaced 2 4 2 1
Repatriated (UNHCR) 2 6 2 1
Repatriated (independent) 1 2 0 0
Refugee 0 0 1 0
Resident 92 85 93 97
Internal returnee 3 3 1 1

8/9/2019 ACF FSL Manual Final 10
http://slidepdf.com/reader/full/acf-fsl-manual-final-10 264/270262 ACF Food Security and Livelihoods Assessment Guideline
Time Trends
Time trends are important analytical tools for surveillance, program monitoring and impact
monitoring purposes. The software must be trend-friendly. Data file structure needs to be set up in
advance with this in mind and data archiving also needs to be considered. Changes in indicators
need to be made with care. Even for new programs, it is important to remember that somebody one
or two years ahead will want to ask the question “How does it compare with last year at this time?”
See figure below illustrating time trends for infectious disease in DRC.
Analysis as a Bottleneck
A bottleneck is often created by analysis – teams collect information and it is often the food
security and livelihoodofficer who takes the responsibility for data analysis. To analyze and write
reports is time consuming and this aspect must be taken into consideration when planning the work
of the whole surveillance team. Unanalyzed data must not be allowed to accumulate and there must
be someone in the team other than the officer who can do the analysis and even with that it always
takes longer than expected. If not properly planned and organized, serious delays can occur which
invalidate the information and thus a lot of time and effort has been put in for very limited output. This
is a major frustration for everyone in the chain and must be avoided. To recruit a database analystspecifically dedicated to such issues is essential. Eventually this person may train other staff in the
use of the tool and the main objectives.
Geographic Information Systems (GIS)
Maps can be an excellent way to visualize data analysis. Some such systems have been developed
and used with success in ACF but others have failed. Many of the reasons for past failures have
included lack of training, training of personnel who subsequently leave the mission without
transferring their knowledge, or the development of databases that are too large and complicated.
However, it has met with great success in some missions where crossing indicators visually using
maps has greatly helped to facilitate understanding of the context and developing crises in the
country. For example, information on water points, pasture availability, normal and abnormal
movements of animals and humans have been crossed to understand the potential water and foodavailability for nomadic populations.
Jan Feb Mar Sep Oct Nov Dec Aug Apr May Jun Jul
0
10
20
30
40
50
60
70
Diarrhea Intestinal Worms
% o
f F r e q u e
n c y
Malaria
Figure 15: Disease trends in South Kivu DRC

8/9/2019 ACF FSL Manual Final 10
http://slidepdf.com/reader/full/acf-fsl-manual-final-10 265/270263ACF Food Security and Livelihoods Assessment Guideline
Sustainability
It is absolutely vital to leave behind a detailed description of the analysis method concerning
indicators that will be monitored over time. This description will serve subsequent teams to be able
to compare information from one year to another or to make appropriate changes according to the
evolving context. This description should include:
• detailed information on the methodology and indicators
• instructions on software selection and use
• staff training
• procedures for report dissemination
• internal and external coordination mechanisms
Appendix 28: Write-up of Assessment Methods, an example
The below sample methodology is from a joint food security and nutrition assessment. While FSL
assessments will often not include a nutrition component, this write up demonstrates the
exhaustive nature with which the assessment methodology should be conveyed in the final report.
The reader of the report should be left with as few questions as possible as to the assessment
methodology thus giving them as little room as possible to criticize the methods and thus results.
Assessment Design and Sampling
Prior to undertaking the assessment in the field the joint team undertook an extensive review of
existing literature and data on the food security and nutrition situation in Mindanao. Consultations
were held with various stakeholders and cluster members in both Manila and Mindanao in order to
receive feedback on the assessment tools and methodology and to incorporate the concerns and
needs of all partners. All processes were designed and implemented on the ground by the nutrition
consultant, nutritionist, and Regional and Country staff with the support of government agencies
including HEMS-DOH, ARMM-DOH and CHD X and XII and food and nutrition cluster members.
The Joint Emergency Nutrition and Food Security Assessment was designed as a two-stage
cluster survey and the population of concern was defined as the entire IDP population, e.g. EC and
home-based, currently displaced in the five crisis-affected provinces of Lanao Del Norte, Lanao DelSur, Maguindanao, North Cotabato and Sultan Kudarat. The choice of the two-stage cluster survey
was useful given the complexity of the IDP context in Mindanao in which families are spread over a
wide geographic area, mobile and living both inside evacuation centres and with relatives. The
sampling frame of the assessment was composed of updated validation lists of IDP households by
province and barangay – the smallest administrative division in the Philippines - which were
obtained by staff from provincial government centres. The validation lists indicated that 45,612
households would be covered in the assessment. Using the local estimate of an average of 6
people per household the total population covered in the assessment was estimated at 275,472
IDPs. Given the fluidity of the situation and other constraints in profiling IDP populations, this
population figure is not exact but represents a best estimate (See limitations below).

8/9/2019 ACF FSL Manual Final 10
http://slidepdf.com/reader/full/acf-fsl-manual-final-10 266/270264 ACF Food Security and Livelihoods Assessment Guideline
The methodology and sample size for the joint assessment was designed around the need to gain
statistically strong data on the nutritional status of children from 6 through 59 months of age in the
displaced population. The sample size was calculated using the formula below where:
p = estimated prevalence of malnutrition at 13%
d = estimated precision of .03
deff = design effect of 1.5
1.962 * p x (1 – p) * deff
d2
1.962 * .13 x (1 – .13) * 1.5 = 724
.032
The total estimated sample size needed for the above criteria was 724 children. Taking into
consideration constraints related to logistics, time-duration, team composition and the widegeographic area under concern, as well as the likelihood of lower design effect in the assessment,
the team determined that a 36x20 design, with a total of 720 children, would be the best suited to
maintain an acceptable degree of precision and tight 95% confidence intervals with the expected
GAM prevalence of 10 – 15%.
For the first stage of cluster sampling, lists and population figures of all evacuation centres and
barangays hosting IDPs were compiled from the validation lists obtained by Mindanao office staff.
A number of barangays, especially in Lanao Del Sur, were pre-excluded from the assessment due
to problems with access, including logistics, insecurity and/or flooding. Thus the final results do not
represent the whole of the IDP population in ARMM, Region XII and Region X but only the
population which was accessible. 36 clusters were randomly selected proportional to population
size (See Cluster List in Annex) using the Emergency Nutrition Assessment (ENA) software. As theIDP context in Mindanao was very fluid throughout the assessment, it was necessary to randomly
choose additional replacement clusters which would be assigned to teams in the even that the IDPs
in a chosen site had returned home or were for some reason inaccessible. Finally, the chosen
clusters were divided between the three assessment teams, with two teams based in Cotabato City
and one in Marawi.
In the second stage of cluster sampling, households were randomly selected from the ‘master lists’
of all IDP households living in the selected evacuation centres or home-based sites/barangays.
These ‘master lists’ were obtained by staff prior to undertaking the field assessment and represented
the most up to date population data available.. Upon the arrival of the team at the daily assessment
site, evacuation centre or barangay, the team leaders confirmed changes in IDP numbers with thecommunity leaders and updated the ‘master lists’ in order not to exclude recent arrivals. Next, the
teams utilized random start numbers obtained from a random number table in order to determine
their first selected household from the list. Successive households were chosen using a sampling
interval determined by dividing the total number of households by the number of households the
teams expected to interview in order to reach the target of 20 children and 15 households. While it
was projected that around 15 households would need to be interviewed in one day, it was expected
that some selected households would not be available to be interviewed and that replacements
would be needed. Therefore, each team initially selected 20-25 households from this list. Thus, for
example, if 20 households were to be selected in a cluster in which 200 households resided, and the
team obtained a random start of 15, the first selected household would be number 15 and the
sampling interval would be 10. The next households would be obtained by adding the sampling
interval to the previous selected household number, resulting in the selection of household numbers25, 35, 45 and so on until the target of 20 households is obtained.

8/9/2019 ACF FSL Manual Final 10
http://slidepdf.com/reader/full/acf-fsl-manual-final-10 267/270265ACF Food Security and Livelihoods Assessment Guideline
After selecting the households, the Team Leaders confirmed the presence or absence of these
households in the community. If more than 10% of the selected households were no longer in the
community, the household list was considered too inaccurate for use and a variation of the “spin the
pen” method was employed. In the case where the list was considered valid for use, the selected
households from the list were visited in a random order, to account for spatial and other bias that may
have arisen from visiting a limited number of households in the order found on the master lists. Most
clusters in the assessment were in fact able to make use of the ‘master lists.’
Within each cluster, selected households were interviewed on both the food security and child
health/nutrition questionnaire until anthropometric data was collected on the target number of 20
children ages 6-59 months. All children in a given household were measured and in clusters with less
than 20 children 6-59 months, all households with eligible children were sampled. In order to ensure
strong food security data, teams were instructed to sample a minimum of 15 households per
cluster, regardless of how many households were needed to reach the 20 children target.
Team Composition and Training of Enumerators
Team size and composition was guided by the assessment’s need to cover the necessary number
of 36 clusters in a reasonable time-period, as well as to obtain the target sample of 20 children per
cluster, with each cluster being completed by one team each day. In order to meet these needs,three (3) teams, consisting of seven people each worked to collect data in over a period of 16 days.
These teams consisted of one team leader (drawn from regional office staff); two (2)
Anthropometry/Food Security sub-teams composed of 2 people each; and one two-person Food
Security team which served to administer the household questionnaire in selected households
without eligible children as well as administering the host family questionnaires in home-based IDP
contexts (see Assessment Participant List in Annex). This allowed the teams collecting
anthropometric data to focus on households with children to ensure meeting the target of 20
children per cluster while still administering the food security and livelihoods questionnaire to all
selected households.
The team leaders were responsible for ensuring that teams adhered to strict household selection
protocols. They also worked closely with teams in the field during and after each day’s work toensure all questionnaires were completed appropriately and consistently. During the course of the
training and assessment, Team Three, which worked in Lanao del Sur and Lanao del Norte, was
fortunate to have extra “back-up” enumerators thus increasing their team size above seven for much
of the data collection process. On the other hand, Team One, which was based out of Cotabato City,
suffered from limitations in team size, working as a team of six, after losing one enumerator due to
emergency circumstances. In the latter case, the integrity of the team and their data was ensured as
the fully trained team leader undertook additional work as an enumerator.
In preparation for data collection in the field, enumerators were recruited from the Regional and
Central Health Departments, Provincial Health Office, the Provincial DSWD, and local and
international organizations participating in the nutrition cluster. A five-day training for all survey teammembers was held in Cotabato City. The objective of the training was to ensure that all
enumerators and team leaders understood the assessment tools as well as the assessment
background, objectives, conceptual frameworks for food security, livelihoods and malnutrition and
anthropometric theory and practice.

8/9/2019 ACF FSL Manual Final 10
http://slidepdf.com/reader/full/acf-fsl-manual-final-10 268/270266 ACF Food Security and Livelihoods Assessment Guideline
The entire questionnaire was thoroughly discussed so that all enumerators both understoodthe questions and how to administer them in an unbiased manner. The training included a
standardization test for anthropometric measurements and two days of on-site field testing andtraining. The teams’ feedback from the field testing was integrated into the final version of thequestionnaire. As the assessment was carried out in a region in which multiple languages anddialects are spoken, significant time was dedicated during the training to discuss the nuances ofeach question and how they should be asked appropriately in the local languages. Finally, teamleaders attended an additional day of training to discuss their numerous roles and accountabilities.
Assessment Tools
Household survey
A standard questionnaire covering demographic information, crop and animal productions, incomeand food sources, food consumption and expenditures, coping strategies and assistance receivedwas developed utilizing the agency’s Emergency Food Security Assessment tools. The nutritional
status of all children ages 6 months to 5 years old children was also assessed by measuring theheight and weight of all eligible children in selected households. The mother of each child under 5years of age was interviewed regarding a number of issues related to the underlying causes of
malnutrition. The questions concerned issues of child health, measles vaccination, de-worming andvitamin A supplementation child feeding practices and hand washing behaviors. The questions onfood security were asked to the head of the household while the questions on the child’s health andfood consumption were asked to the mother or child care-taker if he/she was not the household
head. Households were informed of the assessment purpose and content and consent was soughtprior to administering the questionnaire. For the purposes of the survey, a household was definedas a group of people who consistently share food and resources for meals together (ie. ‘eat from thesame pot’). The Household Nutrition and Food Security Questionnaire can be found in annex of thisreport. A total of 580 household questionnaires were obtained, including valid anthropometric andhealth data on 717 children 6-months to 5 years of age.
Key Informants interviews
In each evacuation centre or barangay, a short questionnaire was administered to the local leadersto enquire about the situation in which the IDPs were living and the extent to which communityresources were impacted by the presence of the IDPs. The comparison was sought by askingleaders whether they thought key resources and services (shelter, food, cooking fuel, water, land,health facilities, toilet facilities and education facilities) were adequate "before" and "during" the time
IDPs settled in the area.. A total of 36 key-informant forms were completed, one for each cluster.
Home Based Questionnaire
The survey also administered questionnaires to non-IDPs households which hosted IDPs. Thequestionnaire was administered in selected clusters in which IDPs were “home-bases” and wasintended to assess the impact of the IDP presence on their hosts. There had been speculations that
IDP presence would impact negatively on host resources because IDPs were supported by relativesor friends hosting them. This impact would expect to be greater in absence of any humanitarian
assistance to the IDPs living among host communities. The questionnaire sought to establishhousehold profiles, the duration of hosting IDPs and their relationship with these IDPs. It also soughtto establish the extent of resource sharing and whether or not these resources were adequate inmeeting both their needs and those of the IDPs. Overall, 69 host household questionnaires wereadministered in 16 municipalities across the four provinces participated.

8/9/2019 ACF FSL Manual Final 10
http://slidepdf.com/reader/full/acf-fsl-manual-final-10 269/270267ACF Food Security and Livelihoods Assessment Guideline
Anthropometric Methodology
Enumerators collected the measurements of weight, height/length, and assessed the presence of
bipedal oedema. Children were weighed to the nearest 100 grams with a UNICEF Electronic
Mother-Child Scale. Height was measured using the Shorr height/length board and by following
standard procedures. For children younger than 2 years of age or less than 85 centimeters (cm),
length was measured to the nearest millimeter in the recumbent position. Children 85 to 110 cm
were measured in a standing position. The presence of nutritional oedema was assessed by
applying thumb pressure to the feet for approximately 3 seconds and then examining for the
sustained presence of a shallow print or pit. Numerical MUAC measurements were not recorded. Mid
Upper Arm Circumference was recorded using the current color-coded MUAC cut-offs for risk
of malnutrition
Prior to the assessment, enumerators foresaw potential problems in gathering precise ages as many
mothers were reported to not know their children’s birthday. To estimate age in months a calendar
of events was developed which included important religious, political and environmental events for
the various Muslim and Christian communities in different localities over the last 5 years. Special
attention was given to establishing events necessary for estimating age around the cut-offs of 6
months to 5 years of age.
In each randomly selected household all children 6-59 months of age were measured, including all
children in the last household even if the target of 20 children was achieved. Thus, more than 20
children were often measured in any given cluster. If a child was absent from the household at the
time of the interview, enumerators were instructed to return to the household later in the day to
collect the measurements. In nine (9) cases, children could not be located, thus measurements were
not taken and they were excluded from the analysis. Other data was excluded due to issues
concerning age (3), lack of data on the sex of the child (8), and the feasibility of certain measurements
(3). After these exclusions, a total 717 children provided valid anthropometric and health data
for analysis.
Data Entry and Analysis
After attending the five- day enumerator training, the four data encoders from DoH ARMM andBangsamoro Development Agency were trained by WFP regional staff on the data entry software.
The regional officer spent ten days supervising the data entry and training the encoders on
procedures for checking the data daily for mistakes and inconsistencies related to missing entries
and feasibility/outliers. Potentially problematic entries were then double checked by the encoders by
referring to the hard copy questionnaires. Data entry took place simultaneous with the data
collection process, with data being entered the day after it was collected in the field. This allowed
for the data to be immediately available for cleaning analysis the day after data collection was
finished in the field. Data was cleaned by regional staff in Bangkok. Analysis of the anthropometric
data was done using ENA Smart software and reported in reference to both the 1977 NCHS
reference and new WHO growth standards. The NCHS reference was preferred for purposes of
comparison with baseline data and for interpreting and analyzing the results in the emergencycontext given the widely accepted thresholds for analysis based on the NCHS reference and lack
thereof for the 2006 WHO growth standards. These results were then fed back into the integrated
database and analyzed along with all other variables - including those on child health, food security,
consumption, and expenditure using SPSS.

8/9/2019 ACF FSL Manual Final 10
http://slidepdf.com/reader/full/acf-fsl-manual-final-10 270/270
Limitations and Potential Bias
Conducting an assessment in a displacement context such as the one in Mindanao presents a
number of constraints with regards to identifying, locating and accessing the population of concern.
A number of limitations and complications arose during the course of the assessment which should
be taken into consideration both in interpreting the current findings and especially in undertaking
similar assessments in the Mindanao IDP context in the future.