achieving dramatic school improvement - wested · as a result, policymakers have sought ways to...
TRANSCRIPT


Achieving Dramatic School Improvement: An Exploratory Study
A Cross-site Analysis From the Evaluation of Comprehensive School Reform Program Implementation and Outcomes Study
Daniel K. Aladjem, American Institutes for Research Beatrice F. Birman, American Institutes for Research
Martin Orland, WestEd Jenifer Harr-Robins, American Institutes for Research
Alberto Heredia, WestEd Thomas B. Parrish, American Institutes for Research
Stephen J. Ruffini, WestEd
Prepared for:
U.S. Department of Education
Office of Planning, Evaluation and Policy Development Policy and Program Studies Service
2010
This report was prepared for the U.S. Department of Education under Contract Number ED01CO0129. Menahem Herman served as the contracting officer’s representative. The content of this report does not necessarily reflect the views or policies of the U.S. Department of Education, nor does the mention of commercial products or organizations imply endorsements by the U.S. government. The inclusion of such information is for the reader’s convenience and is not intended to endorse any views expressed, or products, programs, models or services offered. U.S. Department of Education Arne Duncan Secretary Office of Planning, Evaluation and Policy Development Carmel Martin Assistant Secretary Policy and Program Studies Service Alan Ginsburg Director January 2010 This report is in the public domain. Authorization to reproduce it in whole or in part is granted. While permission to reprint this publication is not necessary, the suggested citation is: U.S. Department of Education, Office of Planning, Evaluation and Policy Development, Policy and Program Studies Service, Achieving Dramatic School Improvement: An Exploratory Study, Washington, D.C., 2010. This report is available on the Department’s Web site at: www.ed.gov/about/offices/list/opepd/ppss/reports.html#title. On request, this publication is available in alternate formats, such as Braille, large print, or computer diskette. For more information, please contact the Department’s Alternate Format Center at 202-260-0852 or 202-260-0818.

iii
CONTENTS
Exhibits .......................................................................................................................................... v
Preface........................................................................................................................................... ix
Acknowledgments ........................................................................................................................ xi
Executive Summary ................................................................................................................... xiii
Chapter 1: Introduction ............................................................................................................... 1
Chapter 2: Classifying Improving Schools ............................................................................... 13
Vignette: Weston Elementary—Putting it All Together ....................................................... 18
Chapter 3: Leadership................................................................................................................ 21
Vignette: Mill Elementary—A Visionary Leader Creating a Culture of High Expectations.................................................................................................................. 24
Vignette: Freedom Elementary—Daily Persistence in Selling the Message of High Expectations......................................................................................................... 25
Vignette: Mill Elementary—Every Teacher a Leader .......................................................... 28
Chapter 4: School Climate ......................................................................................................... 31
Vignette: Freedom Elementary—Behavior Modification Plus ............................................. 33
Vignette: Weston Elementary—Drilling Clear and Consistent Expectations....................... 34
Vignette: Lincoln Elementary—Balancing Principal and Community Authority in a Tight-Knit Community .......................................................................................... 37
Vignette: Chelsea Elementary—Pushing for Greater Parent Voice...................................... 38
Chapter 5: Instructional Improvement Strategies................................................................... 41
Vignette: Weston Elementary—A Comprehensive Approach to Extending Time............... 43
Vignette: Freedom Elementary—Team Problem Solving to Support Struggling Students and Teachers .................................................................................................. 46
Vignette: Mill Elementary—Transparency and Student Engagement Through Prominently Displayed Data Boards............................................................................. 48

iv
Vignette: Swift Middle School—Using a Regional Consultant and Teacher Leaders to Roll Out Reforms ........................................................................................ 51
Chapter 6: External Support ..................................................................................................... 53
Vignette: Swift Middle School—Strategically Using District and State Funds ................... 54
Chapter 7: Sustaining Rapid and Dramatic School Improvement ........................................ 57
Vignette: Mill Elementary—Instilling a “Sense of Urgency” Among New and Veteran Staff ................................................................................................................ 59
Chapter 8: Lessons Learned from Studying Dramatic School Improvement....................... 61
Chapter 9: Conclusions and Next Steps.................................................................................... 67
References .................................................................................................................................... 71
Appendix A—Detailed Methodology ........................................................................................ 75
Pilot Study ............................................................................................................................. 75
Primary Study........................................................................................................................ 76
Appendix B—Data Collection Instruments.............................................................................. 81
Appendix C—Site Abstracts .................................................................................................... 111

v
EXHIBITS
Exhibit E.1 Integrated Framework for School Improvement.................................................. xiv
Exhibit E.2 School Selection Criteria ..................................................................................... xvi
Exhibit 1 Integrated Framework for School Improvement..................................................... 6
Exhibit 2 School Selection Criteria ........................................................................................ 8
Exhibit 3 Selected Characteristics of Visited Schools.......................................................... 11
Exhibit 4 Perceived Relationships Between School Characteristics and Student
Achievement ......................................................................................................... 14
Exhibit 5 Student Demographic Factors That Might Have Affected Changes
in Achievement ..................................................................................................... 63
Exhibit B.1 Informed Consent Form........................................................................................ 82
Exhibit B.2 Community Member Focus Group Protocol......................................................... 84
Exhibit B.3 Current Principal/Assistant Principal Interview Protocol..................................... 86
Exhibit B.4 Curriculum/Instructional Specialist Interview Protocol ....................................... 88
Exhibit B.5 District Curriculum Specialist Protocol ................................................................ 90
Exhibit B.6 District Official Interview Protocol ...................................................................... 92
Exhibit B.7 Document Review Checklist................................................................................. 94
Exhibit B.8 ELA/Mathematics Department Chair Interview Protocol .................................... 95
Exhibit B.9 Experienced Principal Interview Protocol ............................................................ 97
Exhibit B.10 Experienced Teacher Focus Group Protocol ...................................................... 100
Exhibit B.11 Guidance Counselor Interview Protocol............................................................. 103
Exhibit B.12 New Teacher Focus Group Protocol................................................................... 105
Exhibit B.13 Parent Focus Group Protocol .............................................................................. 107
Exhibit B.14 School Improvement Plan (SIP)/Leadership Team Focus Group
Protocol ............................................................................................................... 109
Exhibit C.1 School, District, and State Student Achievement (2002–07),
Reading ............................................................................................................... 115
Exhibit C.2 School, District, and State Student Achievement (2002–07),
Mathematics........................................................................................................ 116

vi
Exhibit C.3 Critical Events Chronology (2000–01 to 2007–08), Freedom
Elementary School (K–5) ................................................................................... 117
Exhibit C.4 School, District, and State Student Achievement (2002–07),
Reading ............................................................................................................... 121
Exhibit C.5 School, District, and State Student Achievement (2002–07),
Mathematics........................................................................................................ 122
Exhibit C.6 Critical Events Chronology (2000–01 to 2007–08), Lincoln
Elementary School (K–8) ................................................................................... 123
Exhibit C.7 School, District, and State Student Achievement (2002–07),
English Language Arts........................................................................................ 126
Exhibit C.8 School, District, and State Student Achievement (2002–07),
Mathematics........................................................................................................ 127
Exhibit C.9 Critical Events Chronology (2000–01 to 2007–08) Mill Elementary
School (PK–6)..................................................................................................... 128
Exhibit C.10 School, District, and State Student Achievement (2002–07),
English Language Arts........................................................................................ 131
Exhibit C.11 School, District, and State Student Achievement (2002–07),
Mathematics........................................................................................................ 132
Exhibit C.12 Chronology of Critical Events 2000 to 2007, Stratford Elementary
(PK–6)................................................................................................................. 133
Exhibit C.13 School, District, and State Student Achievement (2001–07),
English Language Arts........................................................................................ 136
Exhibit C.14 School, District, and State Student Achievement (2001–07),
Reading ............................................................................................................... 137
Exhibit C.15 School, District, and State Student Achievement (2001–07),
Mathematics........................................................................................................ 138
Exhibit C.16 Critical Events Chronology (1999–2000 to 2007–08), Swift Middle
School (6–8)........................................................................................................ 139
Exhibit C.17 School, District, and State Student Achievement (2003–07),
English Language Arts........................................................................................ 142

vii
Exhibit C.18 School, District, and State Student Achievement (2003–07),
Mathematics........................................................................................................ 143
Exhibit C.19 Critical Events Chronology (2000–01 to 2007–08), Walker
Academy (PK–12) .............................................................................................. 144
Exhibit C.20 School, District, and State Student Achievement (2002–07),
Reading ............................................................................................................... 147
Exhibit C.21 School, District, and State Student Achievement (2002–07),
Mathematics........................................................................................................ 148
Exhibit C.22 Critical Events Chronology (2000–01 to 2007–08), Weston
Elementary School (PK–5) ................................................................................. 149
Exhibit C.23 School and State Student Achievement (2002–07), Reading ............................. 152
Exhibit C.24 School and State Student Achievement (2002–07), English
Language Arts..................................................................................................... 153
Exhibit C.25 School and State Student Achievement (2002–07),
Mathematics........................................................................................................ 154
Exhibit C.26 Critical Events Chronology (2000–01 to 2007–08), Dogwood
Middle School (6–8) ........................................................................................... 155
Exhibit C.27 School, District, and State Student Achievement (2003–07),
Reading ............................................................................................................... 159
Exhibit C.28 School, District, and State Student Achievement (2003–07),
Mathematics........................................................................................................ 160
Exhibit C.29 Critical Events Chronology (2000–01 to 2007–08), Martin
Elementary School (PK–5) ................................................................................. 161
Exhibit C.30 School, District, and State Student Achievement (2002–07),
Reading ............................................................................................................... 164
Exhibit C.31 School, District, and State Student Achievement (2002–07),
Mathematics........................................................................................................ 165
Exhibit C.32 Critical Events Chronology (2000–01 to 2007–08), Chelsea
Elementary School (PK–8) ................................................................................. 166

viii
Exhibit C.33 School, District, and State Student Achievement (2003–07),
Reading ............................................................................................................... 169
Exhibit C.34 School, District, and State Student Achievement (2003–07),
Mathematics........................................................................................................ 170
Exhibit C.35 Critical Events Chronology (2000–01 to 2007–08), Cooke Elementary
School (PK–5)..................................................................................................... 171

Preface ix
PREFACE
This report from the Evaluation of the Comprehensive School Reform Program Implementation and Outcomes (ECSRIO) presents findings about low-performing schools that dramatically improved their performance. It follows prior research from this study examining the implementation and outcomes of the federal Comprehensive School Reform (CSR) program.
The CSR program was established as a demonstration program in 1998 and authorized as a full program in 2002 as part of the reauthorization of the Elementary and Secondary Education Act (ESEA). It is one approach to help low-performing K–12 public schools meet state performance standards.
In 2006, the U.S. Department of Education contracted with WestEd and American Institutes for Research to add an additional substudy to ECSRIO, involving case studies of 11 CSR schools. The focus of this study is on schools that made significant improvements in student achievement in a relatively short (one- to two-year) time frame as well as at a slower, steadier pace over a longer period.
To avoid reader confusion, we want to emphasize that this study examines quick-and-dramatic as well as slow-and-steady school improvement retrospectively, seeking to understand the policies, programs, and practices that contributed to “turning around” these schools’ performance. This stands in contrast to current federal policy objectives that aim to prospectively identify the lowest-performing schools in each state as targets for concerted turnaround interventions. The findings of this study can inform the development of high quality school turnaround designs and programs in these sites. In addition, this report concludes with suggestions for an ongoing research agenda for contemporaneously studying low-performing schools that are targeted for school turnaround.


Acknowledgements xi
ACKNOWLEDGMENTS
We wish to thank the many individuals who contributed to the completion of this report. We are particularly grateful to district staff, building principals, and staff of the schools we studied for their kind cooperation and assistance in participating in interviews and follow-up communications. In addition, parents and community members took time out of their busy schedules to participate in interviews and focus groups about each of our schools. Without their efforts, this report would not have been possible, and we deeply appreciate their assistance. We also wish to acknowledge the efforts of Marisela Sifuentes-Den Hartog of WestEd for contacting the schools and arranging the site visits.
Several individuals at the U.S. Department of Education provided report guidance and direction. We would like to acknowledge the assistance of Alan Ginsburg, director, Policy and Program Studies Service (PPSS); David Goodwin, former director, Program and Analytic Studies Division, PPSS; Menahem Herman, Calvin Marshall, Diane Crow, Katie Decker, Jessica Peng, Alan Pryor, and Kara Tanenbaum. The information in this report was provided by independent research firms under contract to the U.S. Department of Education. The overall Evaluation of Comprehensive School Reform Implementation and Outcomes (ECSRIO) study was led by Martin Orland of WestEd, and the Dramatic School Improvement substudy was co-led by Beatrice Birman and Daniel Aladjem of American Institutes for Research and Martin Orland of WestEd. Naida Tushnet of WestEd was the original director of this study, and her efforts were invaluable.
Jennifer O’Day of American Institutes for Research reviewed multiple drafts of this report. Her probing, insightful, and challenging questions improved the report immeasurably
Other researchers who provided useful assistance for this report include Brooke Connolly, Rebeca Diaz, Norman Gold, April Haagenson, Khadijah Salaam, Amy Schustack, and Lauren Davis Sosenko of WestEd; and Andrea Boyle, Stephen Coleman, Kerstin Carlson Le Floch, Lindsay Poland, and Tricia Tulipano of AIR. We would like to acknowledge thoughtful contributions of the members of our Technical Working Group, including Carolyn Temple Adger, Geoffrey Borman, H. J. Green, Bryan Hassel, Elsie Leak, Valerie Lee, Paul Ruiz, Jean Rutherford, Malik Stewart, Sam Stringfield, and Ken Wong. While we appreciate the assistance and support of all of the above individuals, any errors in judgment or fact are of course the responsibility of the authors.


Executive Summary xiii
EXECUTIVE SUMMARY
Improving persistently low-performing schools is a core goal of the No Child Left Behind Act of 2001 (NCLB), the most recent reauthorization of the Elementary and Secondary Education Act of 1965. As a result, policymakers have sought ways to address the increasingly large numbers of schools identified as low-performing. Across the nation, 13,457 schools failed to make adequate yearly progress (AYP) in 2007–08. Of those, 1,583 were planning for restructuring, and 3,358 were in the first year of implementing restructuring. These numbers are likely to rise because many states have established progressively ambitious targets for meeting the NCLB goal of student proficiency by 2013–14.1
School reform research suggests that multiple factors contribute to improvement: leadership and staffing, school climate, instructional improvement strategies, and external (district, state, federal) support. Furthermore, a large body of research accumulated over several decades indicates that the interplay of these components is complex and improvement is incremental, occurring over several years—what we call in this report slow-and-steady. For example, studies of comprehensive school reform suggest that implementation for at least three to five years is typically the time necessary to see student achievement improve (Aladjem et al., 2006; Borman et al., 2003; Desimone, 2000; Zhang et al., 2006).
The pressure to meet NCLB's 2014 deadline has motivated many policymakers to question this widely held consensus that it takes at least three to five years to improve failing schools enough to produce substantial gains in student achievement. Some policy analysts have asked what can be learned from the private sector about quick and dramatic organizational improvement. Recent literature draws lessons from failing businesses and corporations that have turned around. This literature suggests that schools can accelerate reform efforts and see the same sort of quick, dramatic improvement if they engage in a process—characterized by strong leadership, a clear focus on improving instruction, achievement of “quick wins,” and building of a committed staff—similar to that used by successful corporations.2 The business-model literature suggests that much more rapid-improvement is possible in less time than the usual three to five years.
To avoid reader confusion, we want to emphasize that this study examines quick-and-dramatic as well as slow-and-steady school improvement retrospectively, seeking to understand the policies, programs, and practices that contributed to “turning around” these schools’ performance. This stands in contrast to current federal policy objectives that aim to prospectively identify the lowest-performing schools in each state as targets for concerted turnaround interventions. The findings of this study strongly support this proactive approach and can inform the development of high quality school turnaround designs and programs in these sites. In addition, this report concludes with suggestions for an ongoing research agenda for contemporaneously studying low-performing schools that are targeted for school turnaround.
1 http://www.ed.gov/programs/statestabilization/schooldata.pdf 2 Herman and colleagues (2008) point out that there is little rigorous evidence to support this conception, although there is a consensus on which factors seem related to turning around low-performing schools based on the current state of the research literature.
Executive Summary xiv
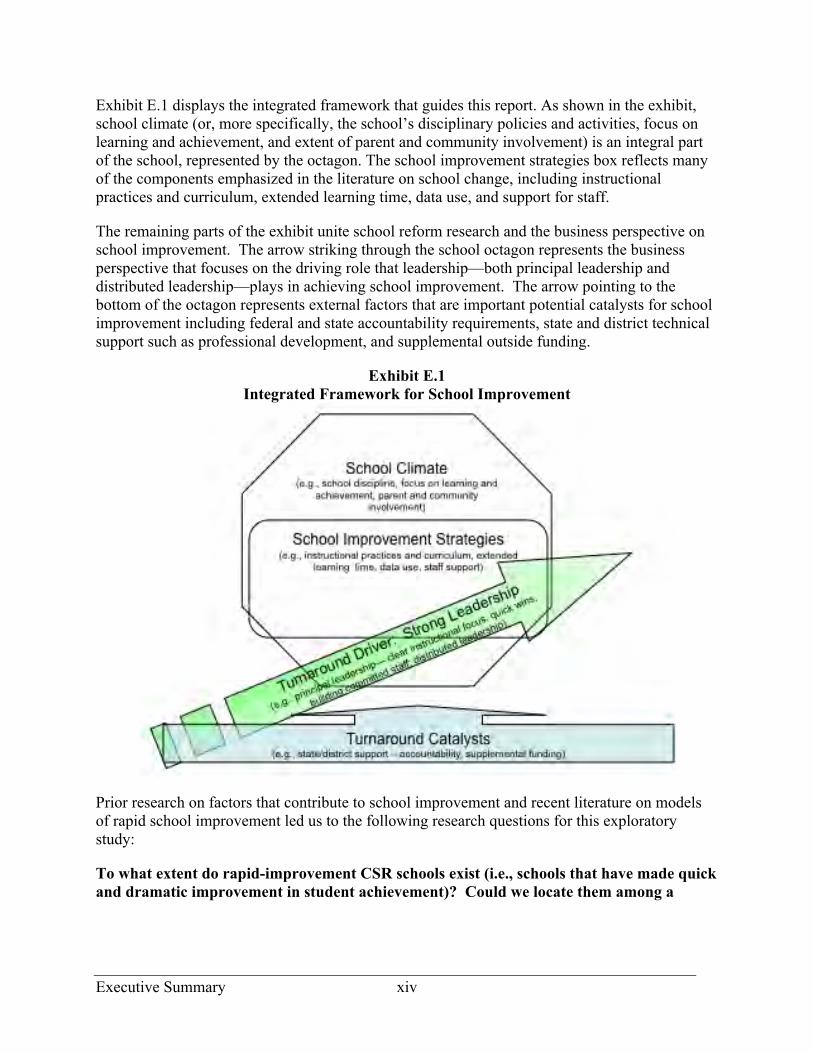
Exhibit E.1 displays the integrated framework that guides this report. As shown in the exhibit, school climate (or, more specifically, the school’s disciplinary policies and activities, focus on learning and achievement, and extent of parent and community involvement) is an integral part of the school, represented by the octagon. The school improvement strategies box reflects many of the components emphasized in the literature on school change, including instructional practices and curriculum, extended learning time, data use, and support for staff.
The remaining parts of the exhibit unite school reform research and the business perspective on school improvement. The arrow striking through the school octagon represents the business perspective that focuses on the driving role that leadership—both principal leadership and distributed leadership—plays in achieving school improvement. The arrow pointing to the bottom of the octagon represents external factors that are important potential catalysts for school improvement including federal and state accountability requirements, state and district technical support such as professional development, and supplemental outside funding.
Exhibit E.1 Integrated Framework for School Improvement
Prior research on factors that contribute to school improvement and recent literature on models of rapid school improvement led us to the following research questions for this exploratory study:
To what extent do rapid-improvement CSR schools exist (i.e., schools that have made quick and dramatic improvement in student achievement)? Could we locate them among a

Executive Summary xv
national pool of Comprehensive School Reform—funded schools engaged in improvement efforts?
Did the processes of reform across rapid-improvement schools and initially low-performing schools that steadily improved at a slower pace (i.e., slow-and-steady) reflect the characteristics and strategies found in prior research on school improvement?
Did rapid-improvement schools differ in observable, systematic ways from slow-and-steady schools?
How did rapid-improvement schools and slow-and-steady schools address challenges to implementing and sustaining improvement strategies?
This set of case studies, conducted jointly by WestEd and the American Institutes for Research, is part of a larger study, the Evaluation of the Comprehensive School Reform Program Implementation and Outcomes. In 2001, the U.S. Department of Education (ED) contracted with WestEd to conduct a longitudinal study of the Comprehensive School Reform (CSR) program. The case studies had two purposes: to conduct in-depth, retrospective case studies to examine schools nationwide that received CSR grants and that demonstrated significant improvement in student achievement; and to understand the processes and practices in which they engaged to accomplish this improvement.
Methodology
This exploratory study describes approaches to improving schools through retrospective, in-depth qualitative case studies. To select schools to be examined, we sought to identify CSR schools demonstrating two distinctive patterns of improved student achievement between 2000 and 2005, rapid-improvement (i.e., schools that made quick and dramatic improvements in student achievement over a one or two year time period) as well as slow-and-steady (i.e., schools that made noteworthy student achievement improvements but over a four or five year timeframe). Exhibit E.2 outlines the steps used for identifying candidate sites. This process led us to study 11 schools.
Executive Summary xvi
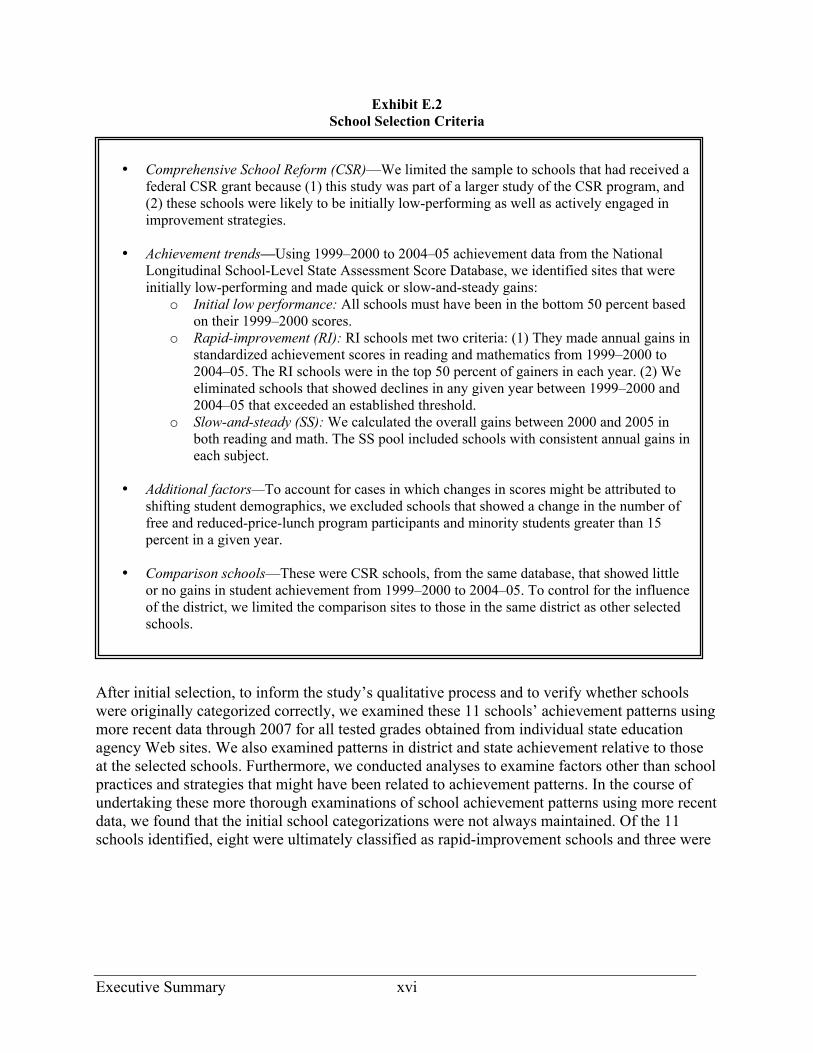
Exhibit E.2 School Selection Criteria
After initial selection, to inform the study’s qualitative process and to verify whether schools were originally categorized correctly, we examined these 11 schools’ achievement patterns using more recent data through 2007 for all tested grades obtained from individual state education agency Web sites. We also examined patterns in district and state achievement relative to those at the selected schools. Furthermore, we conducted analyses to examine factors other than school practices and strategies that might have been related to achievement patterns. In the course of undertaking these more thorough examinations of school achievement patterns using more recent data, we found that the initial school categorizations were not always maintained. Of the 11 schools identified, eight were ultimately classified as rapid-improvement schools and three were
• Comprehensive School Reform (CSR)—We limited the sample to schools that had received a
federal CSR grant because (1) this study was part of a larger study of the CSR program, and (2) these schools were likely to be initially low-performing as well as actively engaged in improvement strategies.
• Achievement trends—Using 1999–2000 to 2004–05 achievement data from the National
Longitudinal School-Level State Assessment Score Database, we identified sites that were initially low-performing and made quick or slow-and-steady gains:
o Initial low performance: All schools must have been in the bottom 50 percent based on their 1999–2000 scores.
o Rapid-improvement (RI): RI schools met two criteria: (1) They made annual gains in standardized achievement scores in reading and mathematics from 1999–2000 to 2004–05. The RI schools were in the top 50 percent of gainers in each year. (2) We eliminated schools that showed declines in any given year between 1999–2000 and 2004–05 that exceeded an established threshold.
o Slow-and-steady (SS): We calculated the overall gains between 2000 and 2005 in both reading and math. The SS pool included schools with consistent annual gains in each subject.
• Additional factors—To account for cases in which changes in scores might be attributed to
shifting student demographics, we excluded schools that showed a change in the number of free and reduced-price-lunch program participants and minority students greater than 15 percent in a given year.
• Comparison schools—These were CSR schools, from the same database, that showed little
or no gains in student achievement from 1999–2000 to 2004–05. To control for the influence of the district, we limited the comparison sites to those in the same district as other selected schools.

Executive Summary xvii
classified as slow-and-steady. All 11 had achieved some success in improving student outcomes. There were no comparison schools.3
Following site visits to the selected schools, each team prepared a detailed site case report organized around CSR program components and additional factors from the business-model literature. After completing all visits in spring 2008, the full study team met for two days to discuss each site and emerging themes across schools. Additional activities identified remaining questions that required follow-up activities by site visitors.
Key Questions and Findings
To what extent do rapid-improvement CSR schools exist (i.e., schools that have made quick and dramatic improvement in student achievement)? Could we locate them among a national pool of CSR schools engaged in improvement efforts?
Few schools nationwide met our criteria as rapid-improvement schools. From our database of 1,037 CSR elementary schools that were initially low-performing in both reading and math achievement, we were able to identify only 47 that showed dramatic and sustained achievement gains in subsequent years. Finding dramatically improved middle schools proved even more difficult. This suggests that few schools across the nation are likely to be making quick gains that are sustained over an appreciable period of time.
Did the processes of reform across rapid-improvement schools and initially low-performing schools that steadily improved at a slower pace (i.e., slow-and-steady) reflect the characteristics and strategies found in prior research on school improvement?
Yes, the rapid-improvement and slow-and-steady schools that were studied consistently addressed factors long identified in school reform research as contributors to improved student outcomes. The schools reported adopting and implementing new leadership styles, practices to improve school climate, new instructional strategies and practices, and strategies to secure external support. However, specific practices varied across schools.
Leadership. Both principal and distributed leadership were important in stimulating, implementing, and in some cases, sustaining reforms to improve student achievement. For example, about half of the schools reported adopting distributed leadership practices (in which school staff shared leadership responsibilities with the principal). In one school this meant that the school organized committees of teachers from across grade levels, which enhanced both horizontal (within grade) and vertical (across grades) collaboration, according to staff members. Another school tapped senior teachers to roll out new strategies, increasing perceived ownership across the school; staff in this school believed
3 We originally identified two of these schools as potential comparison sites (i.e., a CSR-funded school in the same district and grade span as an identified sample school, but which had not demonstrated significant achievement gains) for study. However, in the course of undertaking the more thorough examination of school achievement patterns in these schools using more recent data, we found that they were actually making substantial achievement gains. They were thus retained as improvement rather than comparison sites.

Executive Summary xviii
that they were creating their own reforms, even though they were receiving considerable external help. Although schools employed different strategies, staff across the schools saw common, multiple benefits of distributed leadership, including shared responsibility, greater staff buy-in, more effective implementation of new practices, continuity of leadership, and enhanced collaboration. Reform accelerated with new principals, regardless of the managerial style of the principal.
School Climate. School climate was another area of common attention but varied practice. Many of the schools addressed school climate challenges at the beginning of the improvement period though they did so in different ways. Examples included establishing clear, consistent schoolwide behavior rules or expectations, and conveying those expectations to staff, students, and families; establishing unambiguous consequences for student misbehavior, which enabled teachers to consistently practice and enforce school expectations; and instituting incentive programs that reward good behavior and academic achievement accomplishments. Other common approaches to improving school climate included involving parents meaningfully in school governance, and soliciting resources from the community.
Instructional Strategies. Across the board, both the rapid-improvement and slow-and-steady schools visited engaged in strategies, albeit different ones, to enhance instruction, such as aligning the curriculum to district or state standards and assessments, adopting a new curriculum, or increasing learning time through an extended school year, after-school programs, or block scheduling within the school day. Almost all schools reported sharing and systematically using data on student achievement for “continuous improvement.” Schools used data on student performance—often through regular benchmarking—to foster improvement in several ways. The first was to modify instruction, such as by providing greater focus to areas of weaker student performance. A second way was to identify and target individual or groups of students for remediation or interventions. A third was to monitor individual teachers and help them improve their instructional strategies. Professional development from the district, consultants, or local universities often strengthened teachers’ comfort levels with ongoing use of data especially in the rapid-improvement schools.
External Support. External support, especially fiscal resources from multiple sources—state, federal, and local—helped schools undertake many improvement efforts. Support also came in the form of accountability, external pressure, and establishing consistent expectations.
While the schools visited implemented distinctive practices in the areas of leadership, school climate, instruction, and external support to address common challenges, they also combined these practices in a variety of different ways. Some schools placed greater emphasis on one factor (e.g., distributed leadership) than another (e.g., transparent use of student-level data). Others chose a different order of strategies over time or identified unique ways to establish a coherent whole-school approach. Reform strategies interacted in multiple ways, suggesting that the same reforms may be more or less successful depending on differences in leadership, staff capacity, community support, and other factors. Schools engaged in varying combinations of

Executive Summary xix
reforms that they often adapted and changed to meet their evolving circumstances. The energy, experience, and stability of leadership and teachers also influenced the interplay of reforms, and this interplay appeared to require ongoing monitoring and fine-tuning.
School improvement did not occur in a vacuum. While much of the recent literature on turning around the achievement of low-performing schools focuses on changes at the school level, we found few examples of schools that improved in isolation. Respondents in our study rarely mentioned districts as inhibiting reform efforts (as is implied in some of the literature on turnaround schools), and they often identified districts as being key initiators and supporters of school reform.
State and federal accountability also appeared to push schools to change. Respondents noted both the pressure of chronic low performance and for greater alignment of state, district, and school efforts. Furthermore, additional resources supported many of the reform efforts we observed in both the rapid-improvement and slow-and-steady schools visited. While the primary form of support was financial, respondents across many of the study’s schools also provided examples of in-kind assistance, predominantly from the districts. In-kind assistance was generally in the form of consultation and professional development for instructional coaches and teachers. In some cases, schools and districts used funding to purchase assistance directly from state and private agencies. Other forms of district support appeared subtler, such as assigning experienced principals with the explicit purpose of turning around the school or guiding reform efforts by establishing consistent expectations.
Did rapid-improvement schools differ in observable, systematic ways from slow-and-steady schools?
Rapid-improvement schools and slow-and-steady schools had much in common, but there were differences as well. For example, in most of the rapid-improvement schools with sustained achievement gains, improvements in student achievement were credited to new principals who were viewed as change leaders and who continued to lead the school through the study period. In contrast, two of the three schools with slow-and-steady increases in student achievement had multiple principals during the study’s five-year time period. Perhaps in part because of this, respondents in these schools were more likely to attribute their success to distributed leadership (in which teachers and other school staff shared leadership with the principals) than were respondents in rapid-improvement schools. And while both categories of schools may have attributed their success to use of data, the rapid-improvement schools appeared more likely to use data in more transparent and public ways. One rapid-improvement school, for example, prominently displayed data boards throughout the school and, instead of using them for punitive monitoring, established a shared responsibility for results, with one teacher noting, “We all sink, or we all swim.” At another school, the notion of data display and transparency was extended to students, who regularly tracked their own progress against an “aim line” that served as a means of comparing their current achievement with established goals.
Staff members in the rapid-improvement schools (irrespective of whether those gains were sustained in the longer term) also were more likely than those in the slow-and-steady schools to attribute their success to increased learning time, either from an extended school year, after-

Executive Summary xx
school programs, or block scheduling within the school day. One rapid-improvement school used extended learning time to provide remedial instruction to struggling students, while in another, teachers used the results from weekly benchmark assessments in core content areas to identify students for an after-school and a Saturday academy. Two schools that operated on a year-round schedule took advantage of “intersession” breaks to target students for remedial instruction.
How did rapid-improvement schools and slow-and-steady schools address challenges to implementing and sustaining improvement strategies?
Sustaining school improvement appeared to be as challenging as achieving it in the first place. As we describe in this report, two of the rapid-improvement schools originally identified as having made quick academic gains according to our selection criteria showed considerable declines in more recent years. Even schools that sustained their growth reported continued challenges, including high levels of student mobility, maintaining a sense of urgency among both veteran and new staff, and continuing to develop new teacher leaders as experienced staff advanced to administrative positions elsewhere.
In several cases, both rapid-improvement and slow-and-steady schools had to cope with diminished resources, even as they showed improvement—in some cases because of their improvement. Most schools developed strategies to alleviate resource fluctuations, such as seeking supplemental fiscal resources to replace lost funds and building expertise among staff to reduce reliance upon external support. Schools generally had an influx of resources over several years at a time. As grant funding streams ended, eight of the schools studied were able to rely on new funding streams.
Several schools used their funds and other resources to focus on other strategies to sustain improved outcomes. For example, some schools worked to enhance the knowledge and skills of their staff through professional development or purchasing or developing materials and instructional programs that would remain in place once funding ended. To combat the problems associated with staff turnover, a few schools strengthened the orientation of new staff. Despite these efforts and actions, sustaining improvement efforts and the achievement of students continued to be a common concern across schools. These case studies point to an often chaotic and sometimes irrational environment that can thwart the sustainability of hard-won gains in student achievement.
Cautions
The findings of this study must be interpreted with caution. First, we studied only 11 schools. Furthermore, the sample of schools did not include any comparison sites (despite attempts to include such schools in the study), making it impossible to determine whether the factors we observed as being associated with rapid and dramatic school improvement were not also present in schools that did not experience appreciable achievement gains. Nor did the study include any examples in which fundamental school structural arrangements were altered such as might occur through state takeover or reconstitution or charter school conversion. Shifts in the composition of student populations in many study schools also made it difficult to distinguish whether
Executive Summary xxi
achievement changes were attributable to school-specific efforts or to the demographic changes. In addition, each of the study schools engaged in unique, complex, and multifaceted improvement efforts, making it both difficult and ill-advised to relate changes in achievement to any single critical factor. For these reasons, we cannot discern the degree to which specific, individual school factors are systematically related to the academic improvement patterns observed at these schools. We also cannot generalize the conditions and factors we report for these particular sites to other schools—similar actions at other schools will not necessarily lead to similar results. All of the schools we visited, however, achieved some degree of success in improving student achievement, and the factors we report appeared to have contributed to that success.
Conclusions and Next Steps
NCLB has raised the stakes for persistently low-performing schools. As states have placed more schools in Needs Improvement or Restructuring status, educators have been searching for ways to improve the performance of their students, and policymakers have been searching for specific practices they could recommend to help these schools turn around quickly.4 For years, research on school reform has offered many different ingredients—in the areas of leadership, climate, instructional practices, and support—that appear to help schools increase student achievement. These factors appear to have contributed to success in this study as well. Although there were some differences between rapid-improvement schools and slow-and-steady schools, we found that schools in both categories consistently relied on these ingredients to achieve improved student outcomes.
Beyond identifying similar ingredients for improving student outcomes, this study also joins others in concluding that there is no single recipe for success. Schools may achieve different patterns of outcomes because they implemented or combined these ingredients in different ways. Indeed, prior research indicates that different combinations of specific practices can achieve results if they are implemented well (Aladjem et al., 2006). However the complexity of the environments in which educators work can challenge even well-implemented reforms. Prior history as well as existing routines, beliefs, and cultures of the school will influence how such interventions are interpreted, implemented, and interact to produce the results specific to that context. Therefore, similar strategies can yield different outcomes depending on factors both within and outside the control of schools, districts, and states.
This report provides examples of how some schools appear to be achieving noteworthy gains in student outcomes; while achieving these gains appears to be relatively rare, there also appears to be multiple ways to do so. This study points to the dynamic settings in which many low-performing schools operate and the need for ongoing investigation of how schools can achieve impressive results and sustain them in constantly changing environments. Researchers, policymakers, and practitioners in recent years have paid much attention to the scientific search
4 Schools categorized by the federal government as “Needs Improvement” include those in Year 1 Improvement, Year 2 Improvement, and Corrective Action status. Schools categorized as “Restructuring” include those in Restructuring or Planning and Restructuring or Implementation status.
Executive Summary xxii
for “what works” to improve schools and turn them around. This study’s findings draw attention to the fact that turning schools around is not just about adopting a set of effective or promising practices. It is about recognizing that “one best system” does not exist—that no single approach can guarantee improvement in a particular school. It is also about implementing practices well, while at the same time navigating and adapting to a constantly changing landscape.

Chapter 1 1
CHAPTER 1: INTRODUCTION
Improving persistently low-performing schools is a core goal of the No Child Left Behind Act of 2001 (NCLB), the most recent reauthorization of the Elementary and Secondary Education Act of 1965 (ESEA). Policymakers have sought ways to address the increasingly large numbers of schools identified as low-performing. Across the nation, 13,457 schools failed to make adequate yearly progress (AYP) in 2007–08. Of those, 1,583 were planning for restructuring, and 3,358 were in the first year of implementing restructuring. These numbers are likely to increase because many states have established more ambitious targets for meeting the NCLB goal of student proficiency by 2013–14.
Persistently low-performing schools are more likely than other schools to serve high proportions of poor students and students of color (LeFloch et al., 2007; U.S. Government Accountability Office, 2007). Such differences raise concern that the poor quality of these schools may be reinforcing or even exacerbating inequities in educational opportunity and outcomes—the very inequities that NCLB intends to eliminate.
The pressure to meet NCLB's 2014 deadline has motivated many policymakers to seek ways to accelerate the process of improving schools. Some policy analysts have questioned the widely held consensus in the educational research literature that it takes at least three to five years to improve schools enough to produce substantial gains in student achievement. These analysts have asked what the field of education can learn from the private sector about quick, dramatic, and sustained organizational improvement.
Dramatic School Improvement Cross-site Study
In 2001, the U.S. Department of Education (ED) contracted with WestEd to conduct a longitudinal study of the Comprehensive School Reform (CSR) program.5 This large-scale national evaluation was expanded in 2006 to include a study of low-performing schools that dramatically improved their achievement in a relatively short time period. The purpose of this study was twofold: to conduct in-depth retrospective case studies of schools nationwide that received CSR grants and that demonstrated significant improvement in student achievement; and to understand the processes and practices in which they engaged to accomplish this improvement. This study, conducted jointly by WestEd and American Institutes for Research (AIR), is part of the larger national study, the Evaluation of the Comprehensive School Reform Program Implementation and Outcomes (ECSRIO).6
5 With the reauthorization of ESEA, the CSR program became Part F of Title I (20 USC §6511). 6 The First-Year Report (U.S. Department of Education, 2004) addressed questions regarding the targeting of CSR funds, reform implementation, and the influence of district and state conditions on implementation. The Third-Year Report (U.S. Department of Education, 2008) addressed questions related to student achievement outcomes and reform implementation fidelity. Analyses explored the relationship between scientifically based model adoption and school-level achievement and the longitudinal relationship between CSR awards and school-level achievement. Other analyses examined the association between implementation levels and achievement gains. Qualitative case study analyses of CSR reform implementation in 15 pairs of schools added further detail.
Chapter 1 2
The universe of CSR schools was a particularly abundant place to look for schools undergoing improvement. CSR schools, on average, performed lower than other schools (U.S. Department of Education, 2004) and tended to be actively engaged in the process of improvement. For this report, the sites we visited provided compelling stories, both encouraging and cautionary, about how schools have worked to improve in the context of NCLB and its 2014 deadline.
To avoid reader confusion, we want to emphasize that this study examines quick and dramatic as well as slow-and-steady school improvement retrospectively, seeking to understand the policies, programs, and practices that contributed to “turning around” these schools’ performance. This stands in contrast to current federal policy objectives that aim to prospectively identify the lowest-performing schools in each state as targets for concerted turnaround interventions. The findings of this study strongly support this proactive approach and can inform the development of high quality school turnaround designs and programs in these sites. In addition, this report concludes with suggestions for an ongoing research agenda for contemporaneously studying low-performing schools that are targeted for school turnaround.
In the following sections, we summarize the literature on school change, describe this study’s conceptual framework, research questions, and methodology, and note some important cautions in interpreting study findings.
Research on School Change
Studies of school improvement consistently identify several components of school-level practice that appear to contribute to improved outcomes for students. Researchers also have focused on evaluating reform models that combine several of these factors into a comprehensive, schoolwide approach (Herman et al., 1999; Borman et al., 2003). Empirical studies of how schools have implemented such models suggest that, in general, it takes time—typically three to five years—for schools to implement new practices or models effectively and to realize improvements in student achievement (Aladjem et al., 2006; Borman et al., 2003; Desimone, 2000; Zhang et al., 2006). A recent conception utilizing a business-model offers a different view of how schools can improve more quickly and dramatically (Herman et al., 2008; Public Impact, 2007).
The following factors or components appear to play important roles in school improvement, according to earlier research:
Leadership. The literature on school improvement emphasizes the role of the principal as instructional leader (Camburn, Rowan, and Taylor, 2003; Anderson and Shirley, 1995; Weiss and Cambone, 1994). Instructional leadership involves principals observing and understanding classroom teaching and learning. Principals who are instructional leaders then use that knowledge to support teachers both in improving instruction and in their professional growth. The literature also points to involving other administrators and teachers through distributed forms of leadership (Elmore, 2000; Gronn, 2000; Hart, 1995; Heller and Firestone, 1995; Smylie, Conley, and Marks, 2002; Spillane, Halverson, and Diamond, 2001; Wallace, 2002).

Chapter 1 3
School climate. Successfully improving schools often first seek to establish a safe and orderly school environment and a culture focused on learning and student achievement, if such an environment and culture are not already present at the start of the reform effort (Datnow et al., 2006; Mosenthal et al., 2004; Stringfield and Teddlie, 1991). Parent and community involvement also are often important in supporting healthy school cultures (Datnow et al., 2006; Public Impact, 2007). Instructional improvement strategies. Instruction is central to improving student outcomes. Strategies to improve instruction can focus on altering the content of instruction (curriculum), incorporating more effective pedagogical approaches based on student results, increasing the amount of instructional time, or improving the knowledge and skills of teachers and paraprofessionals. Schoolwide, coherent instructional programs—consisting both of pedagogical interventions and challenging curriculum—can profoundly influence the patterns of teaching and learning within individual classrooms (Datnow et al., 2006; Stringfield and Teddlie, 1991). Not surprisingly, how schools use time (throughout the school day) and the amount of time available for instruction (before and after school and over the course of the school year) matters for student achievement (Brookover et al., 1979; Brookover and Lezotte, 1977; Edmonds, 1979; Stringfield and Teddlie, 1991). Researchers have linked improved student performance to frequent and transparent use of student outcome data to guide instruction (Datnow et al., 2006). Support for staff development also is critical for improving instruction. Teachers in high-poverty schools tend to be less well-qualified than other teachers (Clotfelter et al., 2007). Thus, it is particularly important that these teachers engage in high-quality professional development and receive ongoing professional support (Berends, 2000; Datnow et al., 2006; Ross et al., 2001). Garet and colleagues (2001) and Cohen and Hill (1998) both established the link between professional development and improved student achievement. One challenge to ongoing staff development is the high level of turnover in high-poverty schools (LeFloch et al., 2007). External support. Over the past two decades, districts and states increased their involvement in initiating, planning, and supporting school improvement through a variety of strategies and tactics (Datnow et al., 2006), including the infusion of new resources. Many successful schools have supported their improvement strategies with the timely influx of supplemental, discretionary funding. This additional funding allows schools to access experts who would otherwise be unaffordable and to hire additional staff. States and districts can also stimulate school improvement through new accountability or technical assistance efforts (O’Day and Bitter, 2003).
Abundant research suggests that the above factors play important roles in fostering improved student achievement. However, this research also suggests that the improvement process is complex and these factors can be addressed and combined in many different ways.
To address the complexity of school improvement, reformers turned to comprehensive school reform models that specified several of the important components of practice and how these

Chapter 1 4
components were to work together (Aladjem et al., 2006). Evaluations have demonstrated that some of these schoolwide models, when well-implemented, improve student outcomes (Aladjem et al., 2006).
While research has consistently identified common factors associated with improved student outcomes, a debate has emerged recently about how long it takes to realize such improvement. A large body of research accumulated over several decades indicates that improvement is incremental, occurring over several years—what we call in this report slow-and-steady. For example, studies of CSR suggest that implementation of reform efforts for three to five years is typically the time necessary to see student achievement improve (Aladjem et al., 2006; Borman et al., 2003; Desimone, 2000; Zhang et al., 2006). New practices appear to be difficult to implement quickly or well, especially if other changes, such as changes in staffing or staff development, have to occur first.
Spurred in part by the accountability requirements of NCLB, and its goal of eliminating achievement gaps by 2014, a body of recent policy literature has focused attention on accelerating school improvement. Drawing lessons from case studies of how failing businesses and corporations have turned around, some analysts suggest that schools can see the same sort of quick, dramatic improvement if they engage in a process similar to that used by these entities. Two central premises underlie the application of this business model to education: that schools, like businesses, can expect much more rapid-improvement than conventional wisdom suggests and that the key to rapid school improvement resides in the actions of the school leadership—that is, the principal. The business-model perspective (Public Impact, 2007) emphasizes the actions of the principal as a change leader, the driver of school improvement. To achieve success, the leader engages in the following actions (among others):
• concentrating on achieving a few tangible wins in year one;
• focusing clearly on improving instruction;
• implementing practices to achieve goals even when they deviate from norms;
• conducting analysis and problem solving;
• driving for results;
• influencing key actors inside and outside the school; and
• measuring and reporting student outcomes.
Many of these actions that emerged in recent studies of rapid school improvement align well with the larger body of literature on school improvement from the last 30 years. For example, case studies of these schools like prior studies of school improvement, recognize the importance of focusing on teaching and learning and the contextual supports, conditions, and catalysts for
Chapter 1 5
improving teaching and learning.7 However, the business-model literature posits that schools that are persistently low-performing need a “jumpstart” to speed up improvement. While adherents find no fault with many of the elements of incremental school improvement, they do find fault with the widespread acceptance of the three-to-five-year time period required for improvement. They suggest that much more rapid-improvement is possible, with the principal providing the jumpstart by engaging in the actions listed above.
Conceptual Framework and Research Questions
Recently, policy activists, researchers, and others began using the terms turnaround school and school turnaround with increasing frequency (Viadero, 2007) but without consistently defining these terms. For the purposes of this study, we use the term rapid-improvement school to refer to schools making quick and dramatic improvements in school-level achievement, usually in two years or less (Herman et al., 2008). Our objective in this study was to identify and study schools that made substantial improvements in student achievement, both those that fit the widely accepted time frame of three to five years and those that seemed to accomplish this more quickly. We looked for schools that showed quick and dramatic short-term growth (i.e., rapid-improvement schools) and contrasted them with those that showed more gradual improvement with minimal fluctuations over an extended time period (labeled slow-and-steady schools).
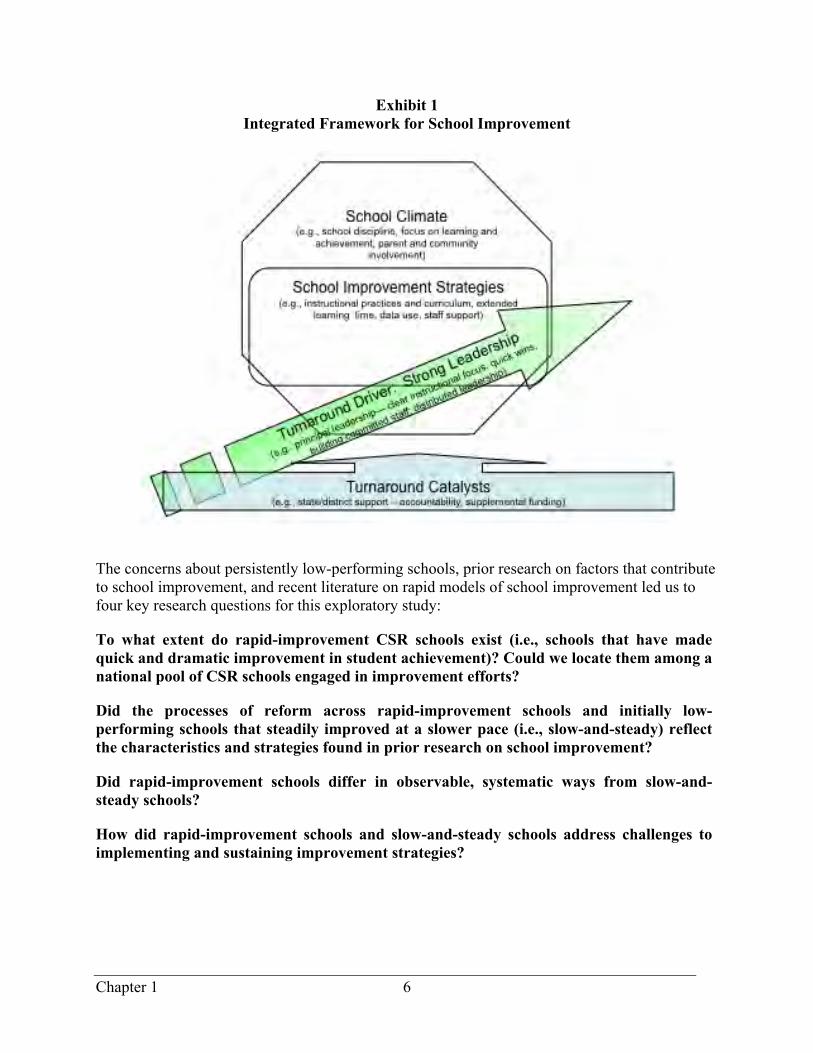
Exhibit 1 displays the integrated framework that guides this report. As shown in the exhibit, school climate (or, more specifically, the school’s disciplinary policies and activities, focus on learning and achievement, and extent of parent and community involvement) is an integral part of the school, represented by the octagon. The school improvement strategies box reflects many of the components emphasized in the literature on school change, including instructional practices and curriculum, extended learning time, data use, and support for staff.
The remaining parts of the exhibit unite school reform research and the business perspective on school improvement. The arrow striking through the school octagon represents the business perspective that focuses on the driving role that leadership—both principal leadership and distributed leadership—plays in achieving school improvement. The arrow pointing to the bottom of the octagon represents external factors that are important potential catalysts for school improvement including federal and state accountability requirements, state and district technical support such as professional development, and supplemental outside funding.
7 While the leader actions listed above do not explicitly refer to teaching and learning, the explicit assumption in the leadership models is that the focus of the principal’s actions are on teaching and learning (Duke, n.d.; Picucci et al., 2002a; Johnson and Asera, 1999).
Chapter 1 6
Exhibit 1 Integrated Framework for School Improvement
The concerns about persistently low-performing schools, prior research on factors that contribute to school improvement, and recent literature on rapid models of school improvement led us to four key research questions for this exploratory study:
To what extent do rapid-improvement CSR schools exist (i.e., schools that have made quick and dramatic improvement in student achievement)? Could we locate them among a national pool of CSR schools engaged in improvement efforts?
Did the processes of reform across rapid-improvement schools and initially low-performing schools that steadily improved at a slower pace (i.e., slow-and-steady) reflect the characteristics and strategies found in prior research on school improvement?
Did rapid-improvement schools differ in observable, systematic ways from slow-and-steady schools?
How did rapid-improvement schools and slow-and-steady schools address challenges to implementing and sustaining improvement strategies?
Chapter 1 7
Methodology
Rooted in the research questions and the framework outlined above, this study describes specific approaches used by improving schools. From the large pool of CSR grantees, the research team empirically identified schools with distinctive patterns of improved student achievement—rapid-improvement schools and slow-and-steady improvers. We then conducted in-depth qualitative case studies of these schools to understand the processes and practices in which they engaged. Similar to prior research on effective schools, this study looked at “outliers,” albeit using different criteria for selecting schools. While the effective schools literature examined schools that performed better than expected based on their demographic composition, this study focused particular attention on low-performing schools that improved student achievement substantially in a short time frame.
School Selection
Selecting sites for study proved to be a challenging task. To do so, we first identified schools using data on school-level achievement from CSR grantees from 1999–2000 through 2004–05. More current data for schools nationwide were not available from any database. The study team and a technical work group of experts in the fields of school reform and evaluation methodology convened for this study engaged in extended dialogue about the criteria to use to identify these schools. Exhibit 2 describes the criteria that emerged from those discussions.

Chapter 1 8
Exhibit 2 School Selection
Criteria
From our database of CSR elementary schools with achievement data, 1,037 elementary schools in the bottom 50 percent in both reading and math achievement were identified as initially low-performing from which 47 subsequently exhibited rapid-improvement and 53 slow-and-steady gains in both subjects. We also identified 909 initially low-performing CSR middle schools as indicated by reading and mathematics achievement in the bottom 75 percent of all CSR middle schools. From this list we identified 81 rapid-improvement middle schools and 36 that made slow-and-steady progress in either reading or math.8 Applying the remaining selection criteria led us to identify 30 schools for potential study (18 improvement schools and 12 comparison sites) from which 11 were subsequently visited for case studies. Nine of the 11 were chosen as improvement sites while two were initially selected as comparison sites.
8 The middle school criteria were less stringent because applying the elementary school selection criteria (i.e., bottom 50 percent of CSR schools exhibiting subsequent rapid or slow-and-steady achievement improvements in both reading and mathematics) did not yield any rapid improvement middle school sites for potential study.
• Comprehensive School Reform (CSR)—We limited the sample to schools that had
received a federal CSR grant because (1) this study was part of a larger study of the CSR program, and (2) these schools were likely to be initially low-performing as well as actively engaged in improvement strategies.
• Achievement trends—Using 1999–2000 to 2004–05 achievement data from the National
Longitudinal School-Level State Assessment Score Database, we identified sites that were initially low-performing and made quick or slow-and-steady gains:
o Initial low performance: All schools must have been in the bottom 50 percent based on their 1999–2000 scores.
o Rapid-improvement (RI): RI schools met two criteria: (1) They made annual gains in standardized achievement scores in reading and mathematics from 1999–2000 to 2004–05. The RI schools were in the top 50 percent of gainers in each year. (2) We eliminated schools that showed declines in any given year between 1999–2000 and 2004–05 that exceeded an established threshold.
o Slow-and-steady (SS): We calculated the overall gains between 2000 and 2005 in both reading and math. The SS pool included schools with consistent annual gains in each subject.
• Additional factors—To account for cases in which changes in scores might be attributed
to shifting student demographics, we excluded schools that showed a change in the number of free and reduced-price lunch program participants and minority students greater than 15 percent in a given year.
• Comparison schools—These were CSR schools, from the same database, that showed
little or no gains in student achievement from 1999–2000 to 2004–05. To control for the influence of the district, we limited the comparison sites to those in the same district as other selected schools.
Chapter 1 9
Site Visits
We conducted intensive site visits to collect school and district respondents’ perspectives on the characteristics of their schools and how they improved student achievement. Two-person teams made three-day visits to each selected school once during the 2007–08 school year. These teams interviewed and conducted focus groups with principals, teachers, parents, community members, and district staff. We mined this wealth of qualitative information for themes to provide a richer understanding of the experiences of schools that exhibited improvements in student achievement. Following each visit, each research team prepared detailed case reports and organized the reports around CSR program components and additional factors from the business-model literature. After completing all visits in spring 2008, the full study team met for two days to discuss each site and emerging themes across schools.
Updated Achievement Analyses
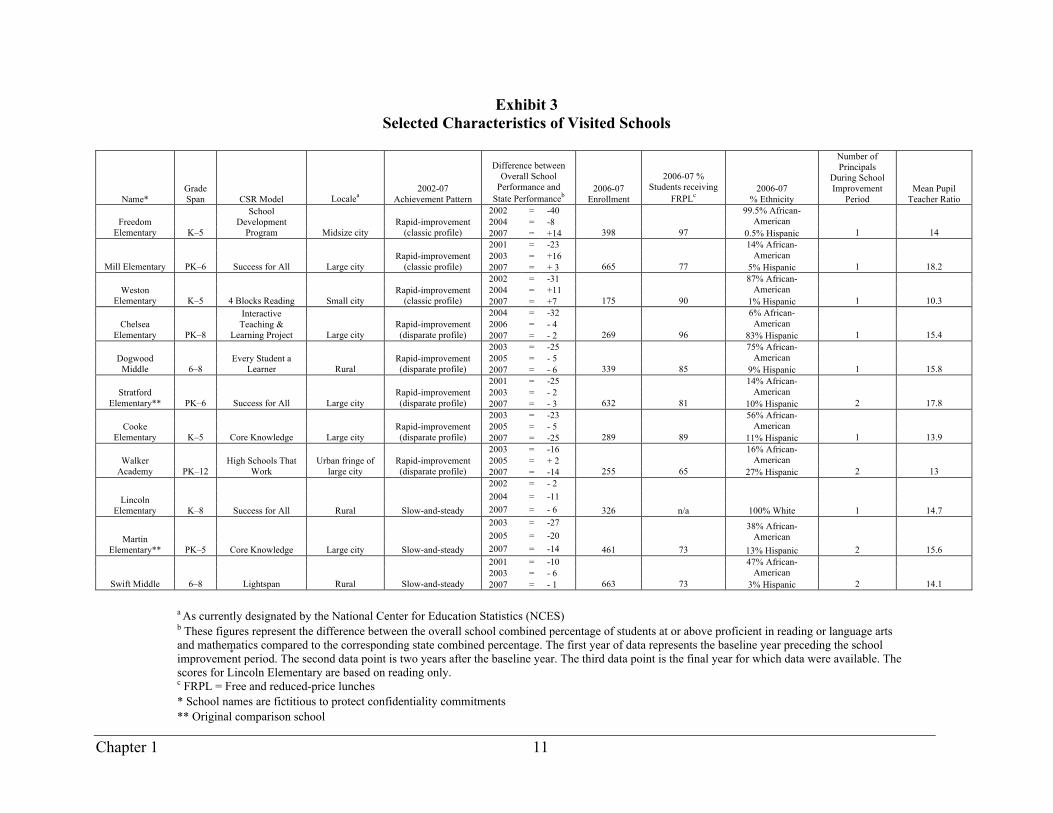
After the initial identification of schools for study, we examined updated achievement patterns from the selected schools using data through 2006—07 for all tested grades obtained from individual state education agency Web sites. This effort informed the study’s qualitative process and also determined the accuracy of our original classification of schools. We also examined patterns in district and state achievement relative to those at the selected schools to determine how school-level achievement compared to achievement at the district and state levels. Using the percentages of students reaching proficiency in reading or English language arts and math on state assessments through spring 2007, along with the average district and state performance in the tested grades and subjects, we revised the description of schools’ achievement patterns in some sites to more accurately represent their standing through the latest year of the study. We also examined demographic data (e.g., school enrollment levels), along with the case study information, to assess whether factors other than school practices and strategies might have been strongly related to achievement patterns. Exhibit 3 lists the schools included in this study, their selected characteristics, and 2002–07 achievement patterns.
In the course of undertaking these more thorough examinations of school achievement patterns using more recent data, we found that the original distinction between comparison and sample schools did not hold. In particular, we initially selected Martin Elementary and Stratford Elementary as comparison sites. However, after updating their achievement data and analyzing additional information, we found both schools to be making substantial achievement gains during the time period that we were studying (2002–07), so we retained these two schools for analysis as part of our improving schools sample.9
Furthermore, while we excluded from the initial sample school category schools that showed declines in any year between 1999–2000 and 2004–05, some rapid-improvement schools initially identified for case studies did not sustain their achievement gains in the longer term. The extended achievement data indicated that two of the eight schools identified for case studies did not sustain these gains through the 2006–07 school year. The most glaring example of this discrepancy was Cooke. The percentage of students scoring proficient or above in reading at this
9 The school names used in this report are fictitious. They were created to ensure respondent confidentiality.
Chapter 1 10
school nearly doubled from 40 percent in 2003 to 78 percent two years later, far exceeding the district average performance of 55 percent (and on par with the state average). It was for this reason that we selected Cooke as a sample school candidate for this study using a national dataset. In the subsequent two years, however, the school dropped by 20 percentage points to 58 percent proficient, while the district and state averages rose. By 2007, Cooke showed schoolwide proficiency in reading that was 23 percentage points behind the state and 9 percentage points behind the district.
Despite these categorization changes, most of our initial sample schools continued to sustain their gains through 2007. Two of the strongest examples of quick, large, and sustained growth relative to the district and state average were Freedom and Weston Elementary. In 2002, 29 percent of students at Freedom scored proficient in reading as compared to its district and the state averages of 55 and 75 percent, respectively. By 2007, Freedom continued to improve to 99 percent proficient, considerably above the district and state averages of 82 and 85 percent, respectively. Likewise, Weston showed growth in reading of 50 percentage points (to 93 percent proficient) during this same time period, as compared to a growth of 21 percentage points for its district and 10 percentage points for the state.
Indeed, when examined relative to their states, we see two distinct profiles to the achievement patterns of the rapid-improvement schools. The first profile—the classic profile—consists of schools that improved student achievement dramatically during the initial years of our study period and sustained that improvement over time. The classic profile schools exhibited the greatest growth in student achievement per year for each of the years studied (between 4 and 8 percentage points). They exhibited a dramatic “spike” in achievement over one to two years, which was maintained over at least another two to four years. Three of the eight rapid-improvement schools fit this profile.
The second profile—the disparate profile—consists of five schools that either had smaller, but still substantial, improvements in achievement over a year or two, or issues regarding the sustainability of achievement gains. One school, Chelsea, posted impressive gains, but relatively late in the period we studied; therefore, we only had one year of follow-up data to judge whether the improvements at Chelsea were sustained. We had enough data for two of the disparate profile schools to learn that they actually reverted to their original performance at the start of the study period. One might argue that schools failing to sustain their improvements should not be included for study. We argue, on the contrary, that such schools demonstrated the ability to achieve quick and dramatic improvements but not the ability to sustain them. By including these schools we were able to see what they shared with other schools exhibiting rapid increases in student achievement and in what ways they were different that might explain their inability to sustain apparent initial improvements. In the last group of schools were the three slow-and-steady schools that improved along a more linear path than the rapid-improvement schools. These schools achieved overall improvement in student achievement but, unlike the rapid-improvement schools, it took them more than three years to do so.
Ultimately after sampling, screening, recruitment, and recategorizations based on updated achievement analyses, our study sample consisted of 11 schools—eight rapid-improvement schools and three slow-and-steady schools —with no comparison sites. They are described in Exhibit 3.
Chapter 1 11
Exhibit 3 Selected Characteristics of Visited Schools
Name* Grade Span CSR Model Localea
2002-07 Achievement Pattern
Difference between Overall School
Performance and State Performanceb
2006-07 Enrollment
2006-07 % Students receiving
FRPLc 2006-07
% Ethnicity
Number of Principals
During School Improvement
Period Mean Pupil
Teacher Ratio 2002 = -40 2004 = -8
99.5% African-American Freedom
Elementary K–5
School Development
Program Midsize city Rapid-improvement
(classic profile) 2007 = +14 398 97 0.5% Hispanic 1 14 2001 = -23 2003 = +16
14% African-American
Mill Elementary PK–6 Success for All Large city Rapid-improvement
(classic profile) 2007 = + 3 665 77 5% Hispanic 1 18.2 2002 = -31 2004 = +11
87% African-American Weston
Elementary K–5 4 Blocks Reading Small city Rapid-improvement
(classic profile) 2007 = +7 175 90 1% Hispanic 1 10.3 2004 = -32 2006 = - 4
6% African-American Chelsea
Elementary PK–8
Interactive Teaching &
Learning Project Large city Rapid-improvement (disparate profile) 2007 = - 2 269 96 83% Hispanic 1 15.4
2003 = -25 2005 = - 5
75% African-American Dogwood
Middle 6–8 Every Student a
Learner Rural Rapid-improvement (disparate profile) 2007 = - 6 339 85 9% Hispanic 1 15.8
2001 = -25 2003 = - 2
14% African-American Stratford
Elementary** PK–6 Success for All Large city Rapid-improvement (disparate profile) 2007 = - 3 632 81 10% Hispanic 2 17.8
2003 = -23 2005 = - 5
56% African-American Cooke
Elementary K–5 Core Knowledge Large city Rapid-improvement (disparate profile) 2007 = -25 289 89 11% Hispanic 1 13.9
2003 = -16 2005 = + 2
16% African-American Walker
Academy PK–12 High Schools That
Work Urban fringe of
large city Rapid-improvement (disparate profile) 2007 = -14 255 65 27% Hispanic 2 13
2002 = - 2 2004 = -11 Lincoln
Elementary K–8 Success for All Rural Slow-and-steady 2007 = - 6 326 n/a 100% White 1 14.7 2003 = -27 2005 = -20
38% African-American Martin
Elementary** PK–5 Core Knowledge Large city Slow-and-steady 2007 = -14 461 73 13% Hispanic 2 15.6 2001 = -10 2003 = - 6
47% African-American
Swift Middle 6–8 Lightspan Rural Slow-and-steady 2007 = - 1 663 73 3% Hispanic 2 14.1
a As currently designated by the National Center for Education Statistics (NCES) b These figures represent the difference between the overall school combined percentage of students at or above proficient in reading or language arts and mathematics compared to the corresponding state combined percentage. The first year of data represents the baseline year preceding the school improvement period. The second data point is two years after the baseline year. The third data point is the final year for which data were available. The scores for Lincoln Elementary are based on reading only. c FRPL = Free and reduced-price lunches * School names are fictitious to protect confidentiality commitments ** Original comparison school
*
Chapter 1 12 12
Cautions
Several factors complicated this study and suggest the need for caution in attributing student outcomes to specific actions taken by schools. First, we studied only 11 rapid-improvement schools and slow-and-steady schools. This sample of schools did not include any comparison sites (despite attempts to include such schools in the study), making it impossible to determine whether the factors we observed as being associated with rapid and dramatic school improvement were not also present in schools that did not experience appreciable achievement gains. Nor did the study include any examples in which fundamental school structural arrangements were altered such as might occur through state takeover, reconstitution or charter school conversion. Shifts in the composition of student populations in many study schools made it difficult to distinguish whether achievement changes were attributable to school-specific efforts or to the demographic changes. In addition, each of the study schools engaged in unique, complex, and multifaceted improvement efforts, making it both difficult and ill-advised to relate changes in achievement to any single critical factor. For these reasons, we cannot discern the degree to which specific, individual school factors are systematically related to the academic improvement patterns observed at these schools. We also cannot generalize the conditions and factors we report for these particular sites to other schools—similar actions at other schools will not necessarily lead to similar results. All of the schools we visited, however, achieved some degree of success in improving student achievement, and the factors we report appeared to have contributed to that success.
In the later chapters, we present detailed descriptions and illustrations of some of the practices these schools adopted in the hope that they can illuminate potential strategies for others to consider. We also comment on the methodological challenges that face researchers of this critical area of education policy and practice.
The next chapter examines patterns of findings across school sites and summarizes what we learned about dramatic school improvement from the 11 cases. In Chapters 3–7, we discuss our observations about school practices and key themes that emerged from our site visits. Chapter 8 presents lessons learned about studying dramatic school improvement. The concluding chapter summarizes our findings.
Chapter 2 13
CHAPTER 2: CLASSIFYING IMPROVING SCHOOLS
This study examined 11 CSR schools that were initially low-performing and substantially improved student performance at some point between 1999–2000 and 2004–05. Some schools made quick, dramatic improvement, while others progressed at a slow-and-steady pace. This chapter summarizes the similarities and differences in characteristics and practices across the 11 schools and subgrouping of those schools. Exhibit 4 presents several key characteristics of each school and assesses the reported contributions of various factors to each school’s improvement. The chapter concludes with a vignette of one of the more compelling school improvement stories.
Exhibit 4 summarizes key characteristics of the schools in this study on dimensions that have been identified as important for school improvement. The rapid-improvement schools are presented in columns 3 through 10 (Freedom through Walker). Within this group, the first three schools (Freedom, Mill, and Weston) are classic profile schools. The next five (Chelsea, Cooke, Dogwood, Stratford, and Walker) are disparate profile schools. Two of those schools (Cooke and Walker) showed substantial declines in their initial achievement gains in more recent years. The last three columns list the slow-and-steady schools (Lincoln, Martin, and Swift).
The exhibit rows display key characteristics present in the schools and document their perceived relationship to the schools’ improved achievement, according to respondent data. The characteristics are grouped into four sets that this study examined: leadership and staffing, school climate, instructional program, and external support. Some of the general characteristics are described in the literature review in Chapter 1. Chapters 3–6 further illustrate these characteristics.
Rapid-improvement schools and slow-and-steady schools shared many characteristics.
All 11 schools exhibited several common experiences with regard to school leadership, instructional improvement strategies, school climate, and external support. Ten of the 11 schools implemented new reading curricula, used data for school improvement, and focused on student behavior. All but three of the schools had new principals at the start of the improvement period. Lastly, all 11 schools reported obtaining and using additional resources beyond their CSR grants. These factors contributed to improved student outcomes in the majority of the schools, according to those we interviewed.

Chapter 2 14
Exhibit 4 Perceived Relationships Between School Characteristics and Student Achievement
Rapid-Improvement
Classic Profile Disparate Profile Slow-and-Steady
Name Freedom (K–5)
Mill (PK–6)
Weston (K–5)
Chelsea (PK–8)
Cooke (K–5)
Dogwood (6–8)
Stratford (PK–6)
Walker (PK–12)
Lincoln (K–8)
Martin (PK–5)
Swift (6–8)
New principal at start of improvement period + + + na + + 0/U + + na na
Principal actively sought rapid, dramatic improvement
+ + + na 0 na na na 0 0 na
Principal pursued managerial approach to school leadership
na na na + na + + 0 na na 0
Distributed leadership + + na na + na na na + + +
Lead
ersh
ip a
nd S
taff
ing
Staff reassignment/ replacement + + na na + na na - na U na
Discipline/student behavior + + + na + + U U U + +
Scho
ol
Clim
ate
Community/parent involvement + 0 + + U 0 U na + 0 0
New curriculum in reading + + U U na + U + + + +
New curriculum in mathematics U + U U na + U na 0 0 +
Inst
ruct
iona
l Im
prov
emen
t St
rate
gies
Instructional changes + + + U U U U U + + +
Continued
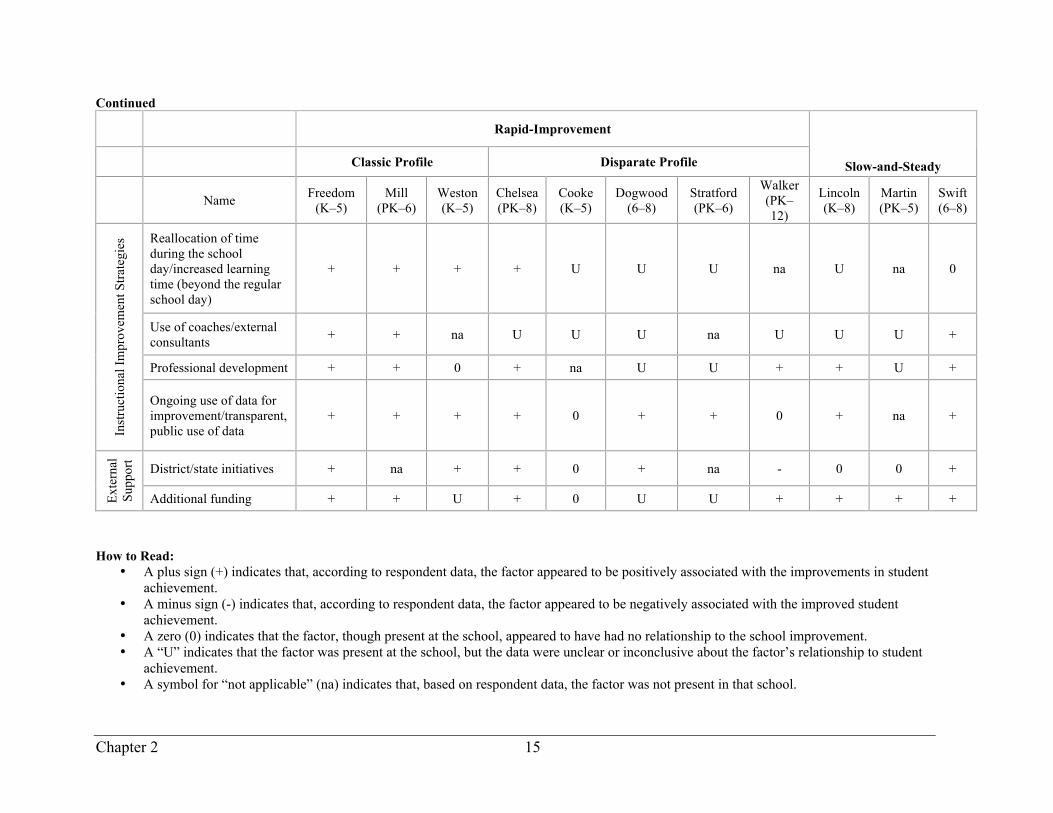
Chapter 2 15
Continued
Rapid-Improvement
Classic Profile Disparate Profile
Slow-and-Steady
Name Freedom (K–5)
Mill (PK–6)
Weston (K–5)
Chelsea (PK–8)
Cooke (K–5)
Dogwood (6–8)
Stratford (PK–6)
Walker (PK–12)
Lincoln (K–8)
Martin (PK–5)
Swift (6–8)
Reallocation of time during the school day/increased learning time (beyond the regular school day)
+ + + + U U U na U na 0
Use of coaches/external consultants + + na U U U na U U U +
Professional development + + 0 + na U U + + U +
Inst
ruct
iona
l Im
prov
emen
t Stra
tegi
es
Ongoing use of data for improvement/transparent, public use of data
+ + + + 0 + + 0 + na +
District/state initiatives + na + + 0 + na - 0 0 +
Exte
rnal
Su
ppor
t
Additional funding + + U + 0 U U + + + +
How to Read:
• A plus sign (+) indicates that, according to respondent data, the factor appeared to be positively associated with the improvements in student achievement.
• A minus sign (-) indicates that, according to respondent data, the factor appeared to be negatively associated with the improved student achievement.
• A zero (0) indicates that the factor, though present at the school, appeared to have had no relationship to the school improvement. • A “U” indicates that the factor was present at the school, but the data were unclear or inconclusive about the factor’s relationship to student
achievement. • A symbol for “not applicable” (na) indicates that, based on respondent data, the factor was not present in that school.
Chapter 2 16
Beyond these similarities, we observed some different patterns of activities for the three different types of schools—rapid-improvement—classic profile, rapid-improvement—disparate profile, and slow-and-steady.10 As described previously, the classic profile schools were those that stood out for the magnitude and sustainability of improvement. The disparate profile schools experienced some improvement, but their outcomes were not as dramatic as the classic profile schools, and two of the schools ultimately failed to sustain the improvements that landed them in the study’s sample in the first place. In addition to the rapid-improvement schools, three schools exhibited slow-and-steady improvement. These shared some similarities with, yet also differed from, the rapid-improvement schools.
Below, we summarize and compare our findings for these three types of schools.
Classic Profile Schools
The data summarized in Exhibit 4 suggest that the success of the classic profile schools—in the views of respondents—stems from the specifics of their leadership, their instructional programs, and a focus on school climate. Each of the three classic profile schools had a new principal just prior to its improvement in student achievement and who stayed at the school throughout the improvement period. These principals, moreover, adopted the orientation of a dynamic change leader as opposed to a more managerial style of leadership. They actively sought rapid, dramatic improvement.
The instructional programs of these schools involved new reading and math curricula, and instructional improvements appeared related to success, according to respondents. Similarly, reallocation of time during the school day and additional learning time in two of three schools were credited with improved student outcomes in these schools. One consistent feature of the classic profile schools was that they all reported using data for improvement both transparently and publicly—for example, with the use of data walls. (See Chapter 5 for a vignette on how Mill used data for improvement.) While staff in the full sample of schools reported an emphasis on school climate, in the classic profile schools, community and parent involvement were reported to have played important roles in helping to improve student outcomes.
Slow-and-Steady Schools
Like the classic profile schools, the slow-and-steady schools’ improvements were reportedly related to new reading curricula and instructional changes. However, unlike the classic profile schools, neither the reallocation of instructional time nor additional learning time seemed to play much of a role in the slow-and-steady schools. Also, while two of the three slow-and-steady schools reported successfully using data in an ongoing way for improvement, none used data in the transparent and public ways that the classic profile schools did. 10 See page 10 for a definition of this category.

Chapter 2 17
The slow-and-steady schools had new principals at the beginning of their improvement process, but two of the three had multiple principals during the improvement period. While two of the three schools had principals who were reported to be change leaders—that is, principals attempting rapid, dramatic improvement—all three schools appeared to rely more on distributed leadership that included teachers and other school staff. Respondents in slow-and-steady schools were more likely than respondents in rapid-improvement schools to see distributed leadership as contributing to the schools’ improvement. The forms of distributed leadership varied but included involving staff in making decisions and implementing changes particularly related to the implementation of discipline policies, new curricula, and data-driven decision-making systems and processes.
Disparate Profile Schools
The disparate profile schools show some striking contrasts to both the classic profile schools and the slow-and-steady schools.11 While the disparate profile schools also made speedy and impressive performance gains, their paths to improvement and its sustainability were more varied and unclear than those of the classic profile schools or the slow-and-steady schools. Respondents in all but one were not able to report what accounted for their school’s success. While the disparate profile schools implemented new curricula and focused on instructional changes, like the classic profile schools and the slow-and-steady schools, respondents were less likely to attribute student outcomes to these changes. Similarly, while respondents in these schools reported some reallocation and increase in instructional time, the use of time was not consistently viewed as contributing to their success. Like the slow-and-steady schools, however, the more successful disparate profile schools’ use of data in an ongoing way appeared to matter, though they did not use data in the transparent public way that the classic profile schools did.
A striking difference between the disparate profile schools and the classic profile schools was the number of principals and their style of leadership. Three of the five disparate profile schools had a single principal while the other two had multiple principals during their improvement period. By contrast, all classic profile schools consistently had a single principal. Furthermore, the leadership styles of the principals at four of the five disparate profile schools were more managerial and less directed toward change than those at the classic profile schools.
Two of the disparate profile schools (Cooke and Walker) did not sustain their gains in achievement, dropping back from their achievement highs.12 In many respects, these improvements looked remarkably like the other disparate profile schools. However, they were plagued by persistently high staff turnover, which may have contributed to the drops
11 See page 10 for a definition of this category. 12 We classified a third school (Chelsea) as a disparate profile school because its improvement period was relatively recent and, as such, there was not enough data to determine whether its quick and dramatic performance increases would be sustained.

Chapter 2 18
in student achievement. One was a charter school, which may have contributed to the high staff turnover.
One Classic Profile School
The classic profile schools represent an archetype of school improvement. This report devotes much space to detailing the specific activities undertaken by each of these schools. Below we describe one of them in some depth to illustrate how the interdependence of, and interaction among, several factors contribute to successful school improvement.
Vignette: Weston Elementary—Putting it All Together
Weston is a small, K–5 elementary school in a poor neighborhood in a southeastern state. The school building, built in 1926, was well-equipped, well-maintained, and surrounded by tidy landscaping when we visited. However, school staff warned that properties just a few blocks from the school were in disrepair and crime was a serious concern. In 2007–08, only about 170 students attended Weston, of which about 90 percent were black, 9 percent were white, and 1 percent were Hispanic. Eighty-four percent of students were eligible for free or reduced-price lunches.
In 1999, Weston “reopened” as a magnet school for the arts. The school had received a federal magnet school grant, and the historic school building underwent substantial renovations. Teachers reported that during the “serious arts” years, the students became accomplished musicians, dancers, and artists, devoting a substantial proportion of their school day to their artistic endeavors. Academically, however, the school suffered. By some reports, basic school supplies, such as math textbooks, were lacking. More importantly, teachers said, the school culture was one in which the arts came first and academics came second. Rather than focusing on content standards, one teacher explained that they were primarily driven by “hobby teaching.” With a new principal in 2001, Weston began to limit arts instruction and increased a focus on core academic subjects. In 2003, and again in 2004, Weston experienced substantial student achievement gains in both English language arts and mathematics. Despite a small dip, these gains have generally been maintained.
Leadership. By all accounts, Weston’s improvement period began under the leadership of a new principal who was transferred to Weston in 2001 by the central office in order to help stimulate school improvement. One teacher explained, “[District administrators] brought in one of the best principals in the division. We needed a good academic leader to come in, who knew how to turn the school around, and [who] knew how to motivate us.” Ms. Williams was described as a strong instructional leader, dedicated, extremely organized, and with high expectations for faculty and students.
School Climate. One of the first things that teachers at Weston mentioned was having consistent practices across the school, including disciplinary practices. Early in the improvement period, staff jointly developed a set of “organizational procedures” that
Chapter 2 19
detail the use of homework folders, appropriate backpack regulations, appropriate times to sharpen pencils, whether coats are permitted in classrooms, and how to walk in the hallway. Teachers asserted that having consistent expectations enabled them to accomplish more academically and that the students’ “minds are settled, and they are ready to learn.”
The caring, cohesive school culture was a noteworthy feature of Weston. Teachers, administrators, parents, and community members repeated similar phrases, most frequently, “We’re all on the same page,” or “It takes a village.” Likewise, the words “family” or “love” were often heard during interviews with the full range of stakeholders. A deep sense of community bound the school. As one parent explained:
Overall, the staff, even down to the janitors and the crossing guards, it’s a family. I drop my child off; I’m never worried. Everyone goes the extra mile. Plenty of things are implemented to get these kids where they need to be academically, and I think every child here feels special to someone.
Instructional Improvement Strategies—Extended Learning Time and Opportunities. Weston did not simply provide instruction 180 days a year, releasing students at 3:00 each afternoon. Rather, the school was on a year-round schedule, and instruction was provided during the three-week intersessions dispersed throughout the school year. (The one exception was the four-week break during the summer.) As teachers explained it, they taught during two of the three weeks in each intersession. Participation was optional for teachers and students, but most teachers did teach, and 92 percent of students attended during intersession. Teachers observed, “It’s amazing how much they forget during long breaks,” and having fewer extended breaks reduced review time. Moreover, “They don’t have to go back into their home environments for any long period of time. Here, there’s heat and food, and they feel secure.” Weston also offers many tutoring opportunities, one teacher said, “We have fourth- and fifth-grade students who come at 7:30 and don’t leave until 4:30. Other third-grade students arrive early and don’t leave until 5:00 with after- school tutoring.”
A focus on student outcomes was an integral part of the school’s culture and went hand in hand with the extended learning opportunities. Teachers at Weston were active analysts of student data, which they used regularly to target instruction on topics and for particular students. As one teacher explained, “Every nine weeks, we assess students and we calculate which students passed which questions. Then we have intersession geared toward the skills students did not get. It’s time-consuming, but the spreadsheet [in which we enter student test results] is helpful to target interventions.” Any topic on which fewer than 75 percent of students “pass” became the focus of review.
Instructional Improvement Strategies—Small Class Size, Small School Size. Weston is a small school, and most teachers have very small classes. In 2007–08, one teacher had 24 students, which was considered to be exceptionally large; the average class size was closer to 15 students. Because of this, one teacher explained, “When you have 12 students, there is no excuse for a teacher to let the students slip between the cracks. You

Chapter 2 20
can tell why they’re not succeeding.” Numerous stakeholders credited the small school size as a factor that facilitated a caring environment and effective instruction.
External Support. In the fall of 2002, Weston’s low achievement scores had put them on the list for state intervention. State representatives visited the school and forced the school stakeholders to confront their low test scores. If the school failed to improve, state officials threatened, teachers would lose their jobs. In addition to the threats, the state provided some financial and technical support—the latter being from members of teams from schools with similar demographics but much higher performance levels. Teachers later acknowledged that the state intervention was painful but necessary. One said, “It was hard, but it was the best thing that ever happened.” Another teacher said of the state takeover, “It put a new light in my head—you don’t just go in, close the classroom door, and do whatever you want.” In addition, teachers credited some external strategies as instrumental to their success. The most frequently mentioned external supports included the Four Blocks of Reading and the Ruby Payne workshops.
What is notable about Weston is that we cannot easily attribute its success to any one or two factors. Rather, Weston’s success is found in how the school worked on all fronts and integrated all of its varied activities.
Summary
In this chapter we identified factors across our 11 schools that respondents considered important in explaining improvements in student achievement. We divided our schools into three groups: rapid-improvement schools—either classic profile or disparate profile—and slow-and-steady. While we found instances, especially in the classic profile schools, that were consistent with what the literature suggests is critical to rapid-improvement (change leader, data-driven decision-making, etc.), we also found cases in which improvement occurred without these features and in which other factors were salient. Overall, there was substantial variability of practices within each of the three groups, and substantial similarity in approaches across the different groups of schools. Chapters 3–7 look at the many ways the schools in this study engaged in activities that fostered their improvements.

Chapter 3 21
CHAPTER 3: LEADERSHIP
Literature on successful turnaround organizations describes the importance of specific leader capabilities and actions. These actions include, but are not limited to, focusing on a few tangible successes early on, breaking from the norm to achieve goals, conveying a positive vision for the future, and analyzing and reporting data frequently and publicly (Public Impact, 2007). Literature on school improvement emphasizes the importance of the principal, especially as an instructional leader (Aladjem et al., 2006; Kurki, Boyle, and Aladjem, 2006; Stringfield and Teddlie, 1991).
Principals represent just one form of school leadership. Research has increasingly recognized the critical role of shared—or distributed—leadership among staff in improvement efforts, particularly with respect to implementation and sustainability of the reforms. Distributed leadership may come in various forms, ranging from a few selected teacher leaders to more widespread involvement (Elmore, 2000; Spillane, 2006).
In line with the research literature, our study found that both principal and distributed leadership were important in stimulating, implementing, and, in some cases, sustaining reforms to improve student achievement. Further, we found that whether the principal had a change-orientated style that was more consistent with the literature or a managerial leadership style, the level of reform generally increased soon after a new principal came on board and sent a clear message that change was necessary. We also found several examples of principals sharing school improvement responsibility with their staff by mobilizing them and building a professional community. This distributed leadership strategy appeared especially important in providing continuity when schools experienced principal turnover, as was the case in two of the three slow-and-steady schools visited.
Principal Leadership—What We Found
The arrival and sustained leadership of new principals were often seen as instrumental to quick and sustained school improvement.
In five of the six sample schools in which student achievement was sustained, heightened levels of reform coincided with the arrival of a new principal who remained in place during the entire improvement period. In these cases, school—and oftentimes district—respondents generally attributed increases in student achievement to the new principal’s direction, identifying the principal as the primary catalyst—or one of the primary catalysts—for change.
Although all schools in our study initially struggled with student performance issues, most of their districts did not purposely assign experienced principals to these sites with the explicit responsibility of turning around the school.
The district specifically recruited and assigned an experienced new principal to address chronic low performance, or related issues, in just three of the schools visited (two of eight rapid-improvement schools and one of three slow-and-steady schools). Six schools had first-year principals during the course of the study time frame—three had been assistant principals

Chapter 3 22
elsewhere in the district and another was the school’s former assistant principal. However, coming into the school without extensive experience as a principal was not always perceived as a disadvantage. One superintendent commented on the benefits of assigning a former assistant principal: “He was a new administrator. From my perspective, that was a good thing because he didn’t come in with preconceived notions.”
Prior to their improvements, several schools reported a history of leadership turnover or a lack of direction that made staff receptive to the need for dramatic change.
For example, Freedom experienced five principals in seven years. Respondents described a situation in which these multiple administrators had not provided structure or direction and essentially told teachers to do whatever they felt most comfortable doing. Teachers had been working independently to obtain individual goals instead of working together toward a common goal under one leader. Many teachers responded positively to their new principal’s leadership, which was more organized and directional, because they recognized the need to be more effective.
Principals seen as playing a significant role in their school’s improvement exhibited one of two leadership styles. We observed each school principal embodying one of two general styles—change-oriented or managerial. By our definition, the change-oriented leaders in the study schools quickly set the tone and expectations for change and took quick action to introduce immediate reform. They took their own initiative to forge ahead with or without outside support. By contrast, principals with a managerial style of leadership generally took the district’s direction to implement reform, garnering staff support and creating a conducive working environment to make the reform successful. Managers may have initiated some of their own changes, but they generally did not appear to be trendsetters.
A principal’s leadership style appeared to have been a contributing factor to all six cases of sustained school improvement that we observed in this study. However, the change-oriented style was apparent in only half of these cases; in the other three, the principal displayed characteristics of a managerial leader.13 These findings suggest that a dynamic leadership style may not be necessary for turning a school around.
Principals—even the change-oriented leaders—described their approach to change as being incremental and having a strategic focus while at the same time, they sent a clear message that things would be different from the outset.
Even principals who introduced quick changes at the start of their tenure generally acknowledged the need to balance substantial changes with fostering a culture that would support the reforms. In a number of schools, the initial focus was to establish a safe, orderly school climate, as described in greater detail in the “School Climate” section later in this report.
13 See page 10 for a definition of this category.
Chapter 3 23
This incremental approach did not prevent principals from clearly conveying the message that change was expected. For example, the new principal at Dogwood immediately changed the focus of the administration from “facilities” to improving student achievement through instruction, increased attendance, and improved discipline. Similarly, principals at Freedom and Mill would regularly remind staff that if they were not willing or unable to commit to the necessary changes to raise student achievement, the principal could provide transfer forms or help them find “other arrangements.”
A significant focus of many principals was to mobilize and motivate staff and to build a professional community.
Most of the principals in the schools we studied readily acknowledged that they did not operate in isolation and credited staff for being the backbone behind the reforms. Building a supportive, trusting collegial community that would coalesce around the goal of raising student achievement was a priority for these principals. To accomplish this, they made themselves accessible to staff (through open-door policies and being visible throughout the school) and frequently provided positive encouragement to teachers. One principal, for example, instituted the practice of regularly leaving positive feedback in teachers’ mailboxes based on her classroom observations. Another celebrated staff with appreciation days, facilitated the development of social relationships and trust by holding social gatherings—such as birthday parties and breakfasts— and boosted morale with gifts and staff recognition.
To facilitate staff buy-in and build a collaborative community, several principals instituted specific new policies such as common planning periods, mandating grade-level meetings, providing professional development or additional release time, and disseminating research materials to staff. Other principals also gave teachers a degree of discretion and flexibility to motivate them, convey professional respect to staff, and help alleviate burnout. For example, the principal at Freedom encouraged staff to take time off on occasion if they felt overwhelmed. In supporting the “whole teacher,” the principal believed staff would be able to better support their students when their own lives were in order.
Many principals matched their high expectations for student performance by obtaining extra school resources to facilitate improvement reforms. Principals also frequently reinforced high expectations with a heightened focus on teacher accountability.
As an important complement to setting high expectations, several principals in the 11 sites leveraged additional resources for their school as well as instituted new policies to strengthen teacher accountability. Freedom’s principal provided materials, technology, and staff development (including academic coaches to develop the instructional capacity of teachers), and ensured that the school environment was clean and welcoming. The principal at Cooke served as a negotiator between the school and district, and staff considered her a “master at getting resources” to address school needs. When the budget for Stratford included money for after-school tutoring but no money for classroom supplies, the principal gave teachers points for after-school tutoring, and permitted early leave on Fridays to encourage their participation. Teachers could redeem the points for classroom materials that limited state remediation funds purchased.
Chapter 3 24
New policies instituted by principals to promote teacher accountability included conducting more frequent classroom observations, setting specific expectations for teacher behaviors in the classroom, providing feedback to teachers on the quality of their instruction, and carefully monitoring student performance data. For example, Freedom increased its focus on academics, which included an expectation for teachers to increase “time-on-task.” This expectation was reinforced through principal and assistant principal classroom walk-throughs where time-on-task was monitored.
How Two Principals Created a Collaborative Community Built on High Expectations With the Purpose of Raising Student Achievement
Vignette: Mill Elementary—A Visionary Leader Creating a Culture of High Expectations
Mill respondents unanimously agreed that their principal had been essential to creating and shaping the reforms. The principal’s dynamic leadership style had been honed over more than 30 years as an educator. After earning an Administration and Supervision License, she served as a principal in a series of urban public elementary schools beginning in 1993, and arrived at Mill in August 2000.
The principal noted that she was not specifically recruited nor given the explicit task of turning Mill around. Conversely, the principal said that district administrators expected she wouldn’t be at the school long and, when hired, did not inform her of the school’s low performance. District staff who had known this principal for a number of years identified her as having “a very competitive spirit—she has to be number one. She has instilled that spirit in her teachers and staff; they will do what it takes.” This same respondent also pointed out that “she has an amazing talent for adapting something she has learned for her school with incredible speed and great insight.” Soon after her arrival, the principal set into motion a series of changes that had an immediate impact on Mill’s school climate. For example, although the principal was not allowed to make changes for a six-month period (in accordance with district policy), she immediately reduced the recess from 30 to 15 minutes and required that students “earn” recess by completing homework and adhering to rules of conduct—an act that invoked indignation from many parents. Believing that creating a safe, orderly learning environment was an essential prerequisite to addressing academic achievement and launching subsequent reforms, the principal also implemented a discipline plan, with the assistance of a district consultant, and publicly posted the school rules. When she first arrived, the principal learned that teachers were not regularly holding grade-level meetings. By the end of her first year, however, the principal reassigned to other grade levels more than a third of her teaching staff who appeared stagnant in their current positions and held them accountable for holding grade-level meetings regularly. The purpose was to stimulate collaboration and revitalize the professional climate. The principal further enhanced the professional climate by instituting mandatory research teams.
Chapter 3 25
The principal made it clear that she expected reforms. One teacher remarked that the principal would say at staff meetings, “This is not a place for everyone; if you’re not willing to improve, you have to be willing to leave this school.” As a precursor to undertaking reform, the principal, during her second year at Mill, required all staff to read a motivational book, Who Moved My Cheese? An Amazing Way to Deal with Change in Your Work and in Your Life. The principal was able to make changes in ways that resulted in staff respect and appreciation with minimal resistance. Within two months of the principal’s arrival, Mill teachers signed a letter thanking the superintendent for hiring her.
To encourage a cohesive community with a focus on instruction, the principal instituted annual schoolwide themes early in her tenure. These themes transformed the school’s hallways and classrooms into outer space (“Come Meet Our Stars”), construction zones (“Under Construction: Caution—You Are Entering a Learning Zone”), beaches (“Riding the Wave to Success”), and sports arenas (“We Are Champions”). The themes rallied both staff and students alike and spruced up the appearance of the aging facility prior to renovations. Teachers remarked that the former principal had good intentions but “felt sorry” for the students. The current principal made a decisive stand against that perspective, starting with clear, explicit expectations for discipline. She created a culture of high expectations for all students irrespective of their home lives, which was reinforced by data analysis, transparency, and accountability. As one respondent described, “The excuses stop at the school door. The principal started that [philosophy], and it has filtered throughout the Mill culture.” In further conveying this message to students, the principal conducted one-on-one conferences with each student, starting in fall 2002, to review his or her prior state assessment results and to set high performance expectations. The principal also set clear expectations for staff through her “Mountain to Die On” vision. Distributed at the beginning of every year, this document delineated twelve points that the principal deemed essential to Mill’s school culture. Key concepts communicated through this document included: (1) that teachers will “be visible” throughout the day; (2) that instruction will be driven by data, and that data about standards-based learning goals and student performance will be visible on data boards created daily; and (3) that “all teachers will be trainers” and will engage in ongoing professional development.
The principal indicated that she felt “comfortable taking risks” because she had the backing of the district administration. Although the district laid out specific requirements, the principal believed that the district supported principals proposing “bold ideas” about strategies that could improve academic achievement.
Vignette: Freedom Elementary—Daily Persistence in Selling the Message of High Expectations
Freedom respondents credited the principal, in her fifth year at the school at the time of the study site visit, with the school’s major improvement—moving the school from the lowest-performing elementary school in the district to the highest-performing. The seven-year period prior to this principal’s arrival had been marked by turmoil and a succession of five principals.

Chapter 3 26
The principal held two master’s degrees, one in counseling and guidance, and another in administration and supervision with an emphasis on urban studies and instructional leadership. Her previous experience included serving for five years as an assistant principal in a high-poverty area elementary school, directing after-school programs, and providing leadership for drug-free schools. Freedom was her first assignment as a principal.
The demographics and poor performance data were familiar to the principal, but the school improvement needs were “nevertheless daunting,” she said. The school had a reputation for being “on the back burner.” Teacher morale was low, and student behavior problems were severe. Both children and parents were sometimes out of control. To improve teacher and student performance, the principal indicated she first had to work toward enhancing the feelings of self-worth of the entire school community.
The principal’s early goal for the school was “to get through one day at a time.” When she first entered the school building, it was in disarray, she recalled. Furniture was everywhere in the halls. She immediately directed the custodial staff to clean, paint, and organize the school.
The principal listened and observed for herself. She met with business partners, parents, and key players in the school community, and identified a group of committed, experienced teachers with whom she began to consult regularly.
During her first year, the principal indicated she used the broken record approach: “We can do this, I know we can, I know what you think, but we can do this.” Teachers and parents were somewhat skeptical given their previous experience, but two factors with this principal were different, they recalled. Parents felt she was relentless in voicing her conviction, and she worked tirelessly to make Freedom a school that all would be proud of. Teachers remarked that the principal was often at school from eight in the morning until well into evening, and was frequently found at the school on weekends. She set the tone for commitment and others followed. Her philosophy, the principal explained, was that if you make people think they’re the best thing since sliced bread, they would deliver.
She distributed leadership among staff (described further in the “Distributed Leadership” section below), enabling a paradigm shift in the thinking and belief system of the entire school community. According to school leaders, a new belief—a sense among teachers and students that hard work and investment could result in success for individuals and the group—replaced their previous sense of victimization and belief that no one cared about this school and its community. The school’s administrative and instructional leaders felt this new belief structure generated a new energy and effort by teachers and students that facilitated implementation of instructional improvement efforts, and significantly contributed to their successes. The school’s performance did, in fact, begin to change as students’ scores rose exponentially.
Distributed Leadership—What We Found
The role of distributed leadership, as a factor in explaining substantial increases in student achievement, seemed apparent in the three slow-and-steady schools visited in this study.
Chapter 3 27
Two of these schools experienced a change in principals during their respective improvement period. This leads us to hypothesize that these schools’ continued achievement growth across two school leaders might be partially attributed to the continuity provided by a distributed leadership model. While principals often cited distributed leadership as a key strategy in building a culture of change and responsibility, some clearly went “beyond the basics” to models in which substantial authority and responsibility were given to significant numbers of school staff.
All 11 schools reported some level of shared decision-making. A common means of participation was through a leadership team that guided the development of the school’s improvement plan, often as part of a district requirement. However, a number of principals placed a major emphasis on enhancing the roles and responsibilities of school staff for school improvement. Prominent examples included enhanced existing structures by recruiting more experienced staff than prior administrations to participate in school decision-making, opening up the decision-making process to the broader staff community (particularly when the previous involvement had been limited to a few members), or instituting committees or research teams that zeroed in on specific topics to support school improvement.
Principals created a variety of structures to distribute leadership—some with selected participants, others requiring universal participation. In all cases, principals tied those structures to school improvement efforts.
The principal at Freedom strengthened the school’s existing planning and management team by selecting a strong group of experienced teachers and requiring them to review school progress and conduct planning sessions. At Swift, an external improvement specialist began working with a group of teachers whom the principal had selected because they were well-respected in the school. The external specialist then trained these teachers to roll out “best practices” for their colleagues at Swift.
In other examples, teachers selected classroom strategies for grade-level or schoolwide implementation, or developed or selected new curricula. The principal at Martin initiated a volunteer teacher committee for interviewing and hiring new school staff. The principal did not participate, and the committee vote was final. The intent was to garner more support from the teachers by making them more responsible for their new colleagues.
Reported benefits of distributed leadership were interrelated and included shared responsibility, greater staff buy-in, more effective implementation of new practices, continuity of leadership, and enhanced collaboration.
By drawing upon teachers from across grade levels, the organization of committees in Mill enhanced both horizontal (within grade) and vertical (across grades) collaboration. Teachers met within their grade level for weekly planning meetings as well as across grades for monthly committee meetings. These committees also increased ownership, as described by one respondent: “We’re not told what to do. We work together to make it happen.”
Respondents indicated that distributed leadership enhanced ownership of the reforms and facilitated the implementation of new strategies. For example, teachers at Swift believed that

Chapter 3 28
they were creating their own reforms, even though they were receiving considerable external help, because their own senior teachers were rolling out the strategies. Similarly, the teacher leaders at Freedom attributed the success of the school’s improvement efforts partially to the collaborative team approach.
Respondents also indicated that shared responsibility can be critical to maintaining continuity of leadership and thereby sustaining reforms, particularly as these schools previously had considerable turnover in principals. At Freedom, for example, the staff selected by the principal to serve on the management team continued to serve in pivotal leadership roles at the school five years later. When the principal left Swift following the 2005–06 school year, its teacher leaders continued to lead and run the school with seemingly little guidance from the new principal.
How One School Developed Teacher Leaders to Share the Responsibility of School Improvement Efforts
Vignette: Mill Elementary—Every Teacher a Leader
The principal at Mill focused on the cultivation of leadership skills among teachers, stating that one of her values was creating a school culture in which “every teacher becomes a leader.” The principal encouraged shared responsibility and ownership (“I want the instructional teams to have ownership of things”) while maintaining accountability (“I try to keep my hands off, but I look for evidence of standards-based instruction everywhere I go [within the school].”).
In her second year at Mill (2001–02), the principal created four Instructional Research Teams to help staff understand and implement new approaches to instruction. The principal created this structure on her own initiative, believing there were too many talented teachers who were not involved: “To get them involved, you have to make them involved.” In the beginning, some teachers resisted, as they did not want to give up the time to participate. The principal mandated that all teachers participate, and eventually participation on the teams became an integral part of the professional culture. Staff chose their own research teams, and, to guide their choices, the principal provided detailed descriptions of each team, including its responsibilities and what participants were to accomplish over the course of the year. The principal gave a wide degree of discretion to the research teams and met with them at the beginning of the school year to review why the team was formed, its objectives, and the expectations associated with participants’ roles. Although she required that teams submit meeting minutes, she did not attend subsequent meetings, as she wanted to encourage ownership and avoid micromanaging.
These teams evolved over time to meet the needs of the school, and by 2006, they covered the areas of data, instructional strategies, climate and community, and grade level chairs. The teams, which met monthly, drew upon teachers from across grade levels, so both horizontal and vertical collaboration resulted from this organizational structure. The teams also contributed to staff development through book studies. Descriptions of two of the four teams follow.
The data team, led by the two Title I teachers who collected the data and posted schoolwide graphs, met bimonthly. The whole team analyzed the data and looked for fidelity of practices, such as collaborative scoring and instructional practices. According to the school improvement

Chapter 3 29
plan, the data team was responsible for “matching learning gaps to instructional strategies by monitoring both implementation of strategies and growth in student achievement.” This team also was responsible for determining the focus and objectives for the school improvement plan by examining and disaggregating data.
The instructional strategy team covered problem solving, reading comprehension, and writing topics. The team also identified and rolled out best practices that started within a particular grade but were applicable to all grades. As one member noted, “We are becoming the decision-makers.” Members of the instructional strategy team also broke into smaller groups when needed (e.g., reading team, math team) and were becoming “specialists” in reading or math in response to a drop in student test scores and an identified need to improve instruction in these areas.
Another example of shared decision-making at Mill was in the high level of staff involvement in the selection and design of classroom strategies. Often, before instituting big changes, the principal asked teachers to serve on a research team that would determine best practices and choose “pilot” teams for the new changes. Staff who attended district-level professional development sessions would select and implement the suggested interventions on a small-scale to assess effectiveness. Staff determined effectiveness by looking at pre- and post-data. They would then share the results with other teachers and determine whether to continue and scale-up to other grades. One curricular strategy started with one fourth-grade teacher, then was adopted by the fourth-grade team after a trial run, and was eventually used schoolwide. While some concepts came from consultants, teachers led the development of the materials used in the implementation.
In line with this process, Mill teachers developed a reading program that was based on research from the National Reading Panel and the support of an external consultant. The teachers developed this program to replace a packaged CSR program. The principal noted that once the school got away from the packaged program, the teachers gained genuine ownership and a sense that “research made a difference.”
As a result of building effective teacher leaders, the school lost nine staff to administrative positions, and six more staff members were working toward their principal licenses as of 2007–08. However, even with these teachers leaving Mill to become leaders of other schools or at the district level, Mill’s distributed leadership structure appeared to be continuing to generate new teacher leaders at the school to take their place. The principal described continually identifying one to four potential leaders from the ranks each year so that the “platform of leaders is never left empty.” She noted further, “There is always someone to step up, and we just need to give them the opportunity. Some teachers may want to take on leadership roles, but just don’t know how [until they are given the opportunity].” As an example, she tapped two first-year teachers to lead the school’s new teacher academy in 2008–09.


Chapter 4 31
CHAPTER 4: SCHOOL CLIMATE
The literature on school improvement and turnaround schools suggests that improving the climate in troubled schools can accompany—and facilitate—improved achievement (Herman et al., 2008). Changes to the climate that make the school safer and more orderly can serve a dual purpose: they demonstrate that it is possible to make quick and dramatic changes to the school, motivating staff and students to support improvement efforts (Herman et al., 2008); and they eliminate a set of pressing, nonacademic needs to allow staff to focus on academics (Kowal and Hassel, 2005). The research literature also notes the importance of creating parent and community support for a school as it goes through the dramatic changes involved in school improvement. Principals of low-performing schools that successfully turned around student achievement work closely with the community and families to ensure their support of and involvement in the school changes (e.g., Picucci et al., 2002b).
School respondents across nine of the 11 schools visited, considered changes made to improve school climate have been important factors in explaining impressive academic gains. All of the schools in this study faced school climate challenges at the beginning of the improvement period, such as a disruptive student learning environment or uninvolved parents, and each school adopted specific strategies intended to improve this condition. In about half of the schools, new principals in our schools considered addressing school climate concerns as a necessary first step in laying the groundwork for instructional improvement efforts. Common approaches to improving school climate included enhancing behavior management efforts, involving parents meaningfully in school governance, and soliciting resources from the community.
Establishing an Orderly Learning Environment—What We Found
All of the schools included in this study faced significant student management challenges in the earlier years of the study time frame. Respondents described the school climate prior to the reforms as disruptive and dysfunctional, with a high level of disciplinary problems. Three years prior to the dramatic increase in achievement, Mill reported 438 suspensions at the midyear point, with a population of only 679 students, equaling roughly a suspension for every two in three students (although some were repeat offenders). Nearly 1,000 student instructional days were missed due to either in- or out-of-school suspensions. In another example, prior to the 2003–04 school year, Dogwood was considered by school staff to be the worst school in the area and some even referred to it as having been the “Wild West,” a place where students did as they pleased in an environment with lax discipline enforcement. Staff described Dogwood as a school with a chaotic atmosphere in which there was not a strong focus on academics, and attendance and student achievement were low.
In half of the study schools, explicit changes to address these concerns coincided with the arrival of a new principal who tackled student behavior issues as a first step in creating an environment conducive to learning. In other words, principals and staff alike viewed a safe, orderly learning environment to be a necessary prerequisite for raising academic achievement and implementing other reforms.
Respondents in schools undertaking steps to improve discipline generally noted that these efforts resulted in reduced disciplinary referrals and suspensions and improved attendance, as well as

Chapter 4 32
increased teacher collaboration and ownership of all students. For example, two years after the arrival of a new principal who quickly initiated student management changes, suspensions at Mill dropped from 438 to 28. Similarly, behavioral referrals decreased considerably at Dogwood, from 780 in 2004 to 570 in 2007, after a new principal instituted an incentive program for students to combat excessive absences and poor discipline.
Several schools addressed student management early on by establishing clear, consistent schoolwide behavior rules and expectations; conveying those expectations to staff, students, and families; and establishing unambiguous consequences for misbehavior.
At Mill, a simple but effective first step toward improving student behavior was to prominently display behavior rules throughout the school. With the district’s help, Mill also adopted a Level 1–4 disciplinary program, which delineated action to be taken for specific behavior infractions. The actions increased in intensity with each level. Another approach enabled teachers to consistently practice and enforce the established expectations.
Some schools instituted incentive programs that reward good behavior and achievement accomplishments.
Some school programs allowed students to earn points through good behavior and redeem the points for prizes. Although the rewards themselves could be a powerful and tangible motivation, particularly given that many of these students came from high-poverty households, there was also a social aspect to the motivation. As one teacher explained, “When the kids feel like they’re getting rewards for their hard work, they work harder. When they feel like someone else outside of just their parents is paying attention to them, they want to soar and go beyond just whatever limits were set for them previously.”
Such reward programs also recognized academic performance and attendance. The principal at one school recognized students who made top scores on their benchmark assessments through activities such as an “Honors’ Breakfast,” a “Math Bowl,” and cash payments. This school encouraged greater attendance on Fridays by offering students their choice of a class—physical education, art, band, or technology—each Friday. For students who did not have absences or behavioral problems, the principal also hosted social events such as dances, movie nights, and ice cream socials.
Some schools implemented an extensive system of behavior supports.
Two schools in particular described comprehensive behavior intervention systems designed to identify and help students at risk of academic failure. In addition to using a national evidence-based behavior intervention program designed to teach children how to resolve social problems, Martin collaborated with a local university that placed graduate social work students at the site to counsel children.
Another approach schools took was to hold parents accountable for student absences.
Although not commonly described among the study schools, two districts sanctioned parents for excessive student absences. In one district, parents of students at Martin were required to appear in court if their children were absent regularly. In 2002–03, another district required parents of

Chapter 4 33
Dogwood students with at least 10 absences to meet with the district attorney, a juvenile court judge, a social worker, and a school representative. If they failed to comply, parents could be fined or jailed. As a result, Dogwood reported nearly a 50 percent decline in students being absent for 15 or more days, from 21 percent in 2001–02 to 11 percent in 2006–07. Alternatively, two schools had home-school liaisons who would call parents if the student was absent, and sometimes would pick up the student if the parent was unable to take him or her to school.
How Two Schools Improved Student Discipline, Laying the Groundwork for Improved Student Achievement
Vignette: Freedom Elementary—Behavior Modification Plus
Freedom’s approach to overcoming its student discipline challenge was multifaceted and appears to have been successful. Respondents indicated that the lives of students at Freedom reflected a myriad of problems, many of which were family-based. The students resided in a 1960s type housing project, which surrounded the school, and their families often struggled with and suffered from the effects of long-standing poverty.
Both the principal and the school district understood the need to deal effectively with school discipline if they were going to have any chance of improving test scores. The first thing the principal did in collaboration with the district superintendent was to develop a set of partnerships. Through a program known as Communities in Schools (CIS), Freedom established partnerships with a local university and various other community-based institutions.
At the request of Freedom Elementary, the university developed a behavioral management program based on positive reinforcement principles. Specifically, students earned “Eagle Bucks” for meeting the behavioral standards in a code of conduct set by the program for the school. Students earned Eagle Bucks by exhibiting good behavior, attendance, and scholarship, and could periodically redeem the bucks at a school store. School respondents said the students appreciated this reward system. If their behavior did not measure up to the standards of the program, students were not allowed to participate until they demonstrated a sincere interest in meeting the program’s requirements. According to several school leadership members, students highly valued just being able to participate in the program.
The CIS partnership with Freedom developed a more intensive program for students who were not able to benefit from the Eagle Bucks program. The main objective of the program was to enable the students to develop control over their own behavior through behavioral modification techniques. With the assistance of CIS and other local mental health service providers, this program provided support in the school setting for serious behavior issues that may manifest in students suffering from severe household issues, such as abuse, sudden separation, death in the family, and incarceration, that have strongly impacted the child or family and may have taken place over long periods of time. To qualify for this program, the students needed to have tried and failed to respond to other programs, such as Eagle Bucks, or help provided by the school counselor. If these efforts failed and the student continued to be disruptive, and the parents concurred, this program would remove the student from his or her classroom and place him or

Chapter 4 34
her in small behavioral modification groups. The student would remain in school and in the program until being able to demonstrate sufficient behavioral control to rejoin his or her classmates.
According to school leadership and several teachers at Freedom, this program has been highly effective and has significantly diminished disruptive behavior. The cost of the program was subsidized by the federal Medicare Program and did not come out of the district’s scant resources. Respondents noted positive effects on students and on overall school functioning by removing and working with students who often disrupted the rest of the students’ learning.
School partners provided other nonacademic services to address the needs of students and their families. As the principal indicated:
Everything I can do for them [the children] to make sure they don’t become a statistic, I will do. Volunteers, tutors, lunch buddies, I would love for every child to have a mentor. This is a nurturing environment; it has to be. Our children come with so much baggage and see nothing except their parents incarcerated and shootings. I want to make sure they see the alternative.
For students who have led the way for their classmates, the school instituted “Content of Character” awards to reward students who had shown outstanding character.
Vignette: Weston Elementary—Drilling Clear and Consistent Expectations
One of the first things that teachers at Weston mentioned in interviews was that they implemented consistent practices across the school, including expectations for student behavior. Experienced teachers recalled that prior to the improvement period, noise levels in the school were high, and, according to the current principal, “everything seemed disorganized as far as behavior was concerned.” Early in the improvement period, staff developed a set of organizational procedures” that specified details regarding homework folders, appropriate backpacks, when to sharpen pencils, whether coats were permitted in classrooms, and how to walk in the hallway. Examples of such organizational procedures follow:
Students should have a pass when they are in the hall.
Students should not wear heavy coats in class. They can keep a light jacket or sweater at school.
The teacher will provide a designated place for completed work.
Students should come directly to the classroom in the morning. They should not be allowed to go visit other teachers or to go to the bathroom without going to class first.
Teachers asserted that having consistent expectations enabled them to accomplish more academically, and as the students’ “minds are settled, they are ready to learn.” Teachers also

Chapter 4 35
explained that because the students’ home lives may be somewhat unstable, students benefited from a structured environment with clear expectations.
These common disciplinary and behavior expectations were drilled into the students during the first week of the school year, which the teachers called, “boot camp.” As one teacher explained:
At the beginning of the year, we spend the first week of school in boot camp. We don’t do any instructing. We get them acclimated to [their new] grade. We teach them the process of being in the school during the day, what to do when someone walks in the room, how to line up, when to sharpen [their pencils] how to pack up for the end of the day, how to unpack at the beginning of the school day… It’s really helpful. At the end of the third or fourth day, they get a little bored of it, but then they really know it, and if something goes wrong, we can say, “Remember what you learned in boot camp?”
In particular, teachers encouraged students to walk through the hallways silently, with their hands behind their backs. They explained that having the students walk that way in the halls encourages good posture, and helps them keep their hands to themselves. This practice was the idea of the rapid-improvement school principal, who told the children that was how “great thinkers walked.”
Teachers also reported that they relied on the principal and each other for support when students misbehaved. One teacher commented that if she was having a difficult time with a student, she could bring him or her to a neighboring classroom for a short time to cool down. This degree of interdependence was made possible by a context in which, as many stakeholders commented, “We’re all on the same page.”
Parent and Community Involvement—What We Found
Respondents at all study sites reported developing a high level of parent and community involvement as a challenge, and in some cases, the nature of involvement was also a concern. For example, at one site, parents entered and left the school freely, even confronting staff aggressively. At another site, community members and school staff essentially ran the school because of constant administrative turnover, creating some tension when a new principal arrived. In these cases, new principals had to act quickly to establish their authority by communicating with and demonstrating to parents and community members a desire and commitment for school improvement. They demonstrated this commitment by immediately addressing areas of needed improvement upon their arrival.
At many of the schools we visited, parents were impressed with the positive improvements taking place at their respective schools. They acknowledged the positive school climate and the improved achievement. They also recognized the commitment of staff to improving the schools and their willingness and ability to work with parents and community for improvement. Parents at Freedom indicated that students were eager to come to school and loved their teachers and principal. While parents at some of the schools reported they were initially hesitant or resistant to the actions taken by the new principal, they gradually came to support these changes when the efforts produced positive results (e.g., improved test scores, fewer student behavioral problems).

Chapter 4 36
Increasing community involvement was also a focus for many of the schools. For example, Chelsea’s principal collaborated with a local social service agency and the parents it had empowered to serve as school and community leaders. Principals at several other sites sought resources from community partners, such as local universities, faith-based organizations, and other community-based organizations.
Specific Strategies for Involving Parents and the Community
Several schools provided opportunities for parents and community members to participate in school governance and decision-making.
Parents and community members participated actively on school site councils and other governing committees with control over school resources and, at one site, the hiring of the school principal. Two schools had councils with considerable influence over school decision-making. Parents at Chelsea formed a majority on the governing council of the school. The council also included community representatives. The district designed all its governing councils with parent and community majorities to increase principal accountability. At Lincoln, state reforms gave the school and its council considerable governing autonomy, especially in hiring the principal and deciding how to use discretionary funds to implement the school improvement plan.
School leaders actively sought community resources as part of reform efforts.
Several schools obtained non-monetary resources from local institutions of higher education, faith- and community-based organizations, and state and local noneducation agencies. These resources were used predominantly to provide additional instruction and tutoring to students outside of school hours and to address student behavior, discipline, and safety issues.
Principals at the sites sought community resources for several reasons. First, they acknowledged that monetary resources were not always sufficient to address the needs of the school. Second, they considered the communities to be an integral part of the school. These schools pursued community resources in the form of volunteers from faith-based organizations, volunteer tutors from local businesses, after-school enrichment and tutoring programs through local community centers, and donations from local businesses for facilities improvements. For example, the principal at Freedom worked with a local university and a municipal behavioral health authority to develop behavior incentive plans for all students and interventions for students with serious behavior problems. At Weston, students majoring in education at a local university prepared social studies lessons aligned with student classroom instruction and taught these lessons after school to third-graders.

Chapter 4 37
How Two Schools Facilitated Parent and Community Involvement
Vignette: Lincoln Elementary—Balancing Principal and Community Authority in a Tight-knit Community
Lincoln faced a number of challenges in its attempt to increase parent and community involvement. A primary challenge was to address the nature of parent involvement that developed during a lengthy period of inadequate leadership at the school. Parents more or less felt they ran the school and that any demand they made would be satisfied. Another challenge was the rural geographic spread of the district, which posed a problem for some families in getting to the school to participate in school events or to volunteer. In addition, the relatively high levels of poverty and lack of formal education of many families in the area created barriers to increased family involvement.
Despite these challenges, interviewees indicated that traditionally the parents and community of Lincoln have played an important role in the school. While economically disadvantaged, Lincoln is a close-knit community in which the various members were interconnected in multiple ways. For example, multiple generations of families attended Lincoln. Teachers were generally from the area and have family members who also teach, or have taught, at the school. Teachers often knew students and their family members outside the school context. At the beginning of the school year, especially in kindergarten, teachers visited their students’ homes. This interaction between school staff and students’ families helped students who were experiencing difficulties continue to progress in their education. Teachers mentioned several examples of students struggling with home situations that came to teachers’ attention because of their familiarity with the families.
Dealing with an activist role of community members in the day-to-day running and oversight of the school became a top priority of the new principal. She established the authority of her position at the school and at the same time fostered a resurgence of community involvement. She accomplished both by presenting a clear and positive vision of school improvement for the school and reestablishing proper boundaries and roles for school professionals and parent and community participants.
Parents and community members began to involve themselves in the school formally and informally. Interviewees noted an increased number of parents attending school events such as sports activities, holiday meals, and school fundraisers over the last five years. Community organizations also facilitated parent and community involvement. The local Family Resource Center, started in 1993, provides resources to families to enhance their involvement in the school and establish necessary conditions for learning. The center links families with counseling resources, conducts home visits, helps to promote attendance, and provides food to families over Thanksgiving and Christmas.
Community involvement, above and beyond the Family Resource Center, is now an important part of Lincoln. A group called Foster Grandparents provides reading tutoring to students during and after school through a grant provided by an international children’s charitable organization. The tutors, trained by a literacy specialist, work with 65 to 75 students over a year. The local

Chapter 4 38
parks and recreation department provides playgrounds and physical activities for students, and installed a walking track. The regional education agency, as well as regional colleges and universities, provides instructional resources and support for teachers. Local and regional arts organizations provide cultural enrichment for the students. The local library has a summer reading program serving 10 to 15 children. The coal companies contributed funding for school facilities. In addition, interviewees mentioned coordination of efforts among many of the organizations. For example, the parks and recreation department and the regional arts organization worked together to bring a traveling theater group to Lincoln.
Participation of the school community was essential to Lincoln’s rapid and dramatic improvement. Led by the new principal, educators and community participants revived their effectiveness in bringing a variety of community resources to improve the circumstances of students and their families.
Vignette: Chelsea Elementary—Pushing for Greater Parent Voice
Parent involvement has become an integral part of Chelsea’s school culture over the past 11 years, with a local social service agency playing a major role in increasing parent participation. The agency began working with Chelsea in January 1997. The major purpose of the agency was to identify the needs of immigrant families in the neighborhood and provide parents the tools to take on leadership positions in the school and other entities in the community. The agency found working through the schools with parents was the best way to fulfill its mission.
According to a representative from the agency, parent involvement at Chelsea looked very different 11 years ago, prior to the school’s improvement period. She described the typical response of teachers to parents as follows: “If parents asked,‘What can I do to help my child?’ the standard response [from the school] was, ‘Go home, turn off the television, clear the table, [create] a quiet space, and require your child to sit for two hours and do homework while you supervise.’” Yet, the issue was that parents had concerns and wanted a larger voice in their children’s schooling. The agency set as its first goal reaching out to parents who were not involved in the school.
The turning point for parent and community involvement occurred during the 2001–02 school year when the agency garnered a grant from the district office. The grant was part of a court-mandated desegregation plan to reduce inequities in predominantly black and Hispanic public schools. The purpose of the grant was to increase shared decision-making in the school and help schools increase community involvement by providing professional development for teachers on how to work with parents to help them help their children. In partnership with Chelsea, the agency implemented community involvement activities that continue to take place through the current school year (2007–08). To attain the objective of holding a parent involvement evening every quarter of the school year, Chelsea implemented the following activities: a reading night, a math and science night, a sports event, and “Kermes,” a traditional Mexican celebration to congratulate students for completing the academic year. School staff members were impressed and reported that, through their partnership with the agency, they brought up to 300 to 400 parents to each of the evening events over the course of the years.

Chapter 4 39
According to the agency representative and staff, the principal was initially reluctant to open the school to outside partners and to heavy parent involvement in the late 1990s. At the time, Chelsea was overcrowded and was plagued with gangs and discipline problems. Yet, at the persistence of the agency, the principal agreed to allow the school to host its first evening event, which turned out to be a success. According to the agency representative, the principal eventually became more receptive to having a true partnership with the parents and other members of the community. After working with the agency for a number of years, the principal and school staff found the partnership with the agency benefited the school. The current principal commented that the agency was a regular and positive presence at Chelsea and consistently followed through in its work with parents.

Chapter 5 41
CHAPTER 5: INSTRUCTIONAL IMPROVEMENT STRATEGIES
The research literature suggests that a relentless focus on improving student achievement is a common factor in being able to turnaround low performance in schools. Low-performing schools that improve use a variety of instructional improvement strategies, which include aligning the curriculum with state standards and assessments and changing the curriculum for core subjects (Herman et al., 2008).14 Adopting new curricula and aligning curricula with state standards and assessments are complex undertakings (Webb, 1999).
Another instructional strategy common to these schools is increasing the quantity of instructional time. One approach has been to revise the school schedule to remove distractions (e.g., announcements or bells), thereby improving the quality of instruction (Picucci et al., 2002a). Furthermore, those who have studied school reform efforts have highlighted the importance of ongoing efforts to track student progress and fine-tune approaches based on student data (Herman et al., 2008).
Teachers are the lynchpin for any instructional improvement efforts. How well new curricula are implemented, the value of extended learning time, and the appropriate use of data all hinge on the skill and expertise of teachers, which, in turn can depend on their ongoing professional learning. The use of consultants and coaches has been a common practice for teacher professional development. For example, 29 states used external professionals (e.g., school improvement specialists, retired teachers, principals) to help schools identified for improvement under NCLB (LeFloch et al., 2007). Such support sometimes involves visits from a “mentor team” or state technical assistance team trained to help the school plan and implement school improvement activities (LeFloch et al., 2007).
All schools in this study reported making instructional improvements to raise student achievement. Common strategies to enhance instruction, in line with the research literature, included aligning the curriculum to district or state standards and assessments and adopting a new curriculum, increased learning time through an extended school year, after-school programs, and block scheduling within the school day. While eight of the 11 schools reported some efforts to increase learning time, the efforts of the classic profile rapid-improvement schools appeared to meet with greater success, according to respondents.15
To support instructional improvement efforts, almost all schools reported sharing and systematically using data to guide instructional changes. In the classic profile schools, the use of data appeared to be especially transparent and was credited with playing a role in the rapid-improvement in student outcomes. Professional development from coaches and external consultants, often hired through district or state support, also appeared to be key in improving instruction, especially in the classic profile schools.
14 Aligning curriculum, standards, and assessments is a strategy that goes beyond schools that dramatically improve. Of the schools identified for improvement under NCLB, 72 percent report having aligned their curriculum with district and state standards and assessments as part of their reform effort (Le Floch et al., 2007). 15 See page 10 for a definition of this category.
Chapter 5 42
New Curriculum Adoption and Alignment with Standards—What We Found Most of the 11 schools studied implemented new curricula during the improvement period.
While the perceived impact of new curricula was unclear in some cases, in others it was viewed as a positive factor in improving student achievement. This impact was apparent in reading in all three slow-and-steady schools and in two of the three classic profile rapid-improvement schools in which dissatisfaction with existing models led to major curricula changes. For example, Freedom changed its K–3 reading curriculum in 1999–2000 from Houghton-Mifflin, which featured a whole language approach to literacy instruction, to the highly structured, phonics-driven Open Court program. Five years later, the school adopted Open Court as a language arts curriculum as well, and use of Open Court for reading and language arts had become schoolwide by 2007–08.
Similarly, during her first year, the principal at Mill designated a group of teachers to look into alternatives to the Success for All curriculum, which the principal considered to be inadequately research-based. The result was the development of a new “homegrown” curriculum model—the Mill Learning and Reading Program.
At both Freedom and Mill, respondents credited the curriculum reforms as contributing to improvements in school achievement trajectories.
The perceived impact of curriculum change was stronger in reading than in mathematics.
Respondents attributed achievement gains in seven of the 10 schools adopting new curricula during the improvement period to changes in the reading curricula. However, we found such perceptions of positive impact in only three of nine schools adopting new math curricula.
Some schools visited also initiated efforts to better align the school curriculum with state standards and assessments.
Although the district tended to initiate the curriculum alignment process, some level of teacher influence was cited in all cases where alignment of curriculum with standards and assessments was a major school improvement focus.
At the highest level of collaboration, teachers at Lincoln worked with other teachers in the district to align the curriculum with state standards and to develop instructional sequencing and pacing guides. Teachers at Martin had the flexibility to embellish the newly aligned curriculum with their own materials, while those at Freedom appeared dedicated to using the aligned curriculum as a centerpiece of their improvement efforts.
Additional Learning Time—What We Found
Opportunities for extended learning time in the study schools commonly included before- and after-school programs, while two of the schools operated on year-round schedules. In addition, half of the schools allocated more time within the existing school day to certain subjects through block scheduling (e.g., increasing time on English language arts from 60 to 90 minutes).

Chapter 5 43
Schools drew upon funds and other resources from federal, state, local, and community sources to support before- and after-school programs.
Given the costly nature of providing additional learning opportunities, several schools relied on supplemental financial and in-kind resources to carry out these programs. For example, Chelsea used extensive funding from two consecutive 21st-Century grants, a district grant, and federal supplemental educational services (SES) funds to pay teachers to staff the school program.
Other schools used a variety of resources to provide extended learning time opportunities for students. Lincoln used a charitable foundation grant to provide literacy tutoring to students for two hours after school and four hours during the school day, as well as for five weeks during the summer. At Cooke, a neighboring community center provided homework help and tutoring to students after school. In addition, a regional university provided dance and chess clubs and a shop class after school. Two community-based organizations at Swift supported after-school tutoring and provided funds to transport students to their neighborhoods after receiving tutoring.
In one case of limited financial resources, Stratford’s principal capitalized on the volunteer efforts of teachers to provide after-school tutoring. To encourage volunteers, the principal offered teachers an early leave on Fridays and gave points that could be redeemed for classroom materials and supplies.
Some schools used extended learning time to target instruction to struggling students.
Freedom teachers used the results from weekly benchmark assessments in core content areas to identify students for participation in an after-school and a Saturday academy. The 20 to 30 teachers staffing the program provided supplementary instruction in reading, writing, and mathematics to over 100 students daily, thereby reinforcing the core instruction. The two schools with year-round schedules also took advantage of student “intersession” breaks to target students for remedial instruction. For example, Dogwood established a year-round calendar in 2001–02. In 2003, the new principal set up intersession instruction to provide remediation classes in reading, English language arts, and mathematics.
Not all extended programs directly reinforced core instruction. For instance, Chelsea focused on providing a “safe haven” and structured enrichment activities for students during nonschool hours. While Chelsea’s extended program served all students at the school and incorporated tutoring with parental involvement and enrichment, it did not directly address classroom instruction.
How One School Used Extended Learning Time to Support School Improvement Efforts
Vignette: Weston Elementary—A Comprehensive Approach to Extending Time
Weston supported student learning beyond the traditional school day. In 2002–03, the principal reorganized the school year from a traditional calendar to a year-round schedule to reduce the length of summer vacation and the academic losses that typically occur for students over this period. Rather than having one long summer break, the new schedule had four three-week breaks

Chapter 5 44
throughout the year. Teachers also provided instruction for two of these three weeks, except during the summer intersession. Teachers noted that the intersession instruction reduced the amount of time needed to review what students had been taught prior to going off-track. The district’s Title I funds from a budget for remediation instruction provided additional pay for teachers. Although participation was optional for teachers and students, most teachers participated, and 92 percent of students attended intersession remediation classes.
High-quality instruction was a key element of Weston’s extended learning opportunities. Every Wednesday for 16 weeks, students from a local university prepared lessons and taught after-school classes for third-grade students at Weston as part of their teacher education program course work. The university students prepared detailed lesson plans aligned with state standards and classroom instruction. With small groups of no more than 12 students, the prospective teachers taught two-hour lessons that focused on economics (in the fall) and science (spring). Parents and teachers strongly supported the after-school sessions, and students had nearly perfect attendance.
Weston also provided a range of out-of-school academic programs. In 2006–07, the school started the Morning Math Club for fourth- and fifth-graders. Approximately 40 students met twice per week an hour before school to participate in math remediation classes. Experienced teachers led students in hands-on activities that supported math instruction in their classes. In addition, 25 students, K–3, participated in a before-school reading club. One teacher noted, “We have fourth- and fifth-grade students who come at 7:30 a.m. and don’t leave until 4:30 p.m.. Other third-grade students arrive early and don’t leave until 5:00 p.m. because of after-school tutoring.”
Targeting interventions to specific students based on need was important to the success of the after-school programs. Volunteers from a neighboring church provided one-on-one tutoring to 15 second-graders identified by the school as most in need of remediation. Other volunteers provided one-on-one reading tutoring to primary students. Community volunteers were trained to take a running record of a child’s oral reading, follow a teacher-created lesson plan, and communicate with the teachers regarding students’ progress. In addition, students scoring just above proficient on the Phonological Awareness Literacy Screening were selected for a Book Buddies Program because, as one respondent indicated, “They’ll benefit the most” [from the extra reading support].
Data Use—What We Found
While all schools reported some level of monitoring and using student achievement data, variations existed in how and the degree to which data were used. In several schools, school leadership played a direct role in facilitating the process by modeling data use for staff, setting clear expectations on the use of data, and holding teachers accountable through observations and monitoring. In some cases, the initial catalyst for increased data use came from district or state requirements (which were often reinforced by the principal). In three schools, Reading First requirements for monitoring students’ literacy performance enhanced the school’s existing use of data.

Chapter 5 45
A number of factors appeared to facilitate the process of using data, including a supportive, trusting professional culture; teacher buy-in (subsequently bolstered by seeing the positive results of using data); consistency of data use across all grades and subjects; and shared responsibility for all students. Across all of these components, school leadership played a key role in promoting these factors. In addition, professional development from the district, consultants, and local universities often strengthened teachers’ comfort levels with using data. Data collection was frequent, sometimes based on school- or teacher-generated assessments, which were complementary to district assessments and tied to the state standards. More than half of the schools reported regular benchmarking that ranged from weekly to every two months. In some cases, schools developed their own assessments to meet the need for relevant and frequent data above and beyond district common assessments.
Generally there were three clear purposes to analyzing achievement data. The first was to modify classroom-, grade-, or school-level instruction and provide specific instructional focus.
Lincoln made an innovative instructional change based on achievement data. Using disaggregated data, the principal and staff discovered a gap in the performance between girls and boys, especially at the middle school level. In response, the school initiated same-sex classes in math, science, and language arts in grades 6 through 8. Another school, Cooke, adopted a new curriculum after an extensive formal needs assessment that determined that students transferring out were frequently behind the other students in the recipient schools. As part of the assessment, teachers reviewed data from multiple sources that included results from the state accountability test, the district norm-referenced test results, and quarterly benchmark test results, and informal classroom unit tests. Data were also used to hone instructional focus by identifying weaker areas. For example, at Weston—a school with a year-round calendar—any topic on which fewer than 75 percent of students demonstrated proficiency became the focus of review during the school’s intercessions.
A second purpose of using data was to identify and target individual or groups of students for remediation or interventions. Schools often used data to target remedial interventions (commonly provided through after-school tutoring, Saturday programs, and summer school) or differentiated instruction for individuals or groups of students. As discussed above, two schools with year-round calendars used achievement data to identify low-performing students for participation in intersession remediation. Performance data also determined membership in groups for differentiated instruction. Freedom established a formal system for addressing student needs as determined by the data. For students who did not meet certain performance levels on the weekly assessments, teachers were required to create a remediation plan on how they would re-teach the subjects. The teachers submitted the completed plan to the principal and coaches for review. A third purpose of data use was to monitor individual teachers and help them improve their instructional strategies.

Chapter 5 46
A team approach typically supported these efforts. For example, at Freedom grade-level teams analyzed scores at multiple levels, including the teacher-level and discussed how to modify classroom practices. The principal then reviewed assessments with the school’s teaching coaches every week. If there were patterns in a grade in which students failed to meet the benchmarks, the grade-level team would discuss how to strengthen instruction to improve student performance. Informal monitoring and collaborative troubleshooting among teachers also took place at Mill, given to the high level of transparency of the data (see vignette below for more details). At several schools, the school leadership expected all teachers to manage, analyze, and react to data, and held teachers accountable for these responsibilities. Principals generally conveyed a “whole school effort” message. Distributed leadership structures, such as planning committees or research teams, reinforced this message. Mill, Stratford, and Martin required all teachers to participate in such teams, which were responsible for examining data related to their designated topic and for devising next steps. At Cooke, the principal required each teacher to maintain a binder of data to track the progress of individual students and the entire class. By default, this type of widespread engagement required data to be accessible to all staff and not simply filtered down from the district or school administration. Furthermore, school leaders generally coupled this level of staff engagement with accountability. For example, principals conducted walk-throughs to ensure that data were displayed, reviewed remediation plans and committee meeting minutes, and conducted unannounced checks of data books that staff were expected to maintain. Data were accessible and transparent to teachers, students, and parents, particularly in the classic profile rapid-improvement schools.16 While the level of transparency varied across school sites, there was generally an emphasis on conveying performance results in a meaningful manner to staff and the wider community, including the students themselves. Respondents in the classic profile rapid-improvement schools reported that the transparent use of data played an important role in the dramatic improvements in student achievement. The following vignettes illustrate two approaches to using data.
How Two Schools Used Collaborative Decision-making and Transparency to Improve Instruction and Student Performance
Vignette: Freedom Elementary—Team Problem Solving to Support Struggling Students and Teachers Freedom, along with other low-functioning schools in the district, was required to assess student progress on a weekly basis. These weekly assessments were tied to the state standards and aligned to the school district’s curriculum and pacing guides. When Freedom was no longer 16 See page 10 for a definition of this category.
Chapter 5 47
required to conduct weekly performance assessments because of its strong growth, school personnel decided to continue the practice because it was viewed as effective. The performance assessment process at Freedom involved both teachers and administrators. A school assessment team—which was led by the principal and included three teacher leaders who were designated as coaches—reviewed the student performance results. The three coaches, each assigned to two grades, generated the data sheets and identified any score under the benchmark in a report to the principal. If scores were low for a particular classroom, the principal requested teachers from that grade to review the week’s instruction for the subject area of concern. The principal, for example, would ask a teacher of low-performing students to describe what might have gone wrong with the students in science that particular week. The principal then asked all teachers in that grade to examine the test scores and provide explanations for the low performance. The teachers of low-performing students then reviewed their instruction with the whole grade, and their colleagues and attending coaches offered suggestions for improvement. At first, teachers (particularly those with lower-performing students) tended to be defensive and had difficulty troubleshooting. Over time, teachers generally became more comfortable with the process, particularly as their student scores began to rise, and readily conversed about alternative approaches that might be more effective. The notion of shared accountability and problem solving appears to have facilitated this data-driven instructional improvement process. As noted above, when one teacher’s class failed to meet the standard, staff in that entire grade was brought to account for the poor performance and worked as a team to identify both the problem and solution. The following quote by a teacher leader exemplifies this approach:
We had to ensure that teachers realized that if one class failed to pass the test, the whole grade failed. So we had to encourage them to share, the ones who did well with the ones struggling. And you see teachers doing that now; they ask each other for help, the ones who did well support the ones who are struggling.
Another part of this process involved student intervention. Students who were identified as struggling were given extra help individually or in small groups either by in-school tutors or by their teacher during after-school reinforcement classes or Saturday academy. According to respondents, students were highly motivated to work hard and score well on state mastery tests. As with teacher performance, students who were underperforming brought down not only their own averages, but also the average for the entire class. One teacher described the use of performance data from the students’ perspective:
Another way [the use of the data] is helpful to put up the scores each week. The children understand the graphs and get mad with their classmates and say, “You made our test scores go down, and we can’t let so-and-so beat us.” So they are paying more attention to what’s being taught and what’s on the test, and they

Chapter 5 48
don’t rush through. Those who need special help are given the time they need to do well.
Vignette: Mill Elementary—Transparency and Student Engagement Through Prominently Displayed Data Boards According to respondents, Mill leaders fostered a culture of data use and transparency through daily practices that made data on student performance readily visible, rather than hidden or secret. A major lynchpin to this culture of transparency was the concept of the “data board.” The principal set the example early on. Teachers recalled being aware since 2001–02 that the principal was reviewing the data and making data boards that displayed schoolwide goals and achievement. Although the district later required all of its schools to have data boards, the Mill principal several years earlier had adopted and enhanced this concept (which another school in the district had originated). In 2003–04, the principal required all grades and classrooms to prominently display data boards in the school hallways. The boards tracked the progress of each class and individual students and explained the standards in student-friendly ways. Respondents said the principal set clear expectations up-front, using her schoolwide data board as an example and specifying that the grade-level and classroom boards be highly visual (e.g., graphs), make inferences about the data (“What does the graph mean?”), and describe next steps and strategies (the “so what” factor). The principal considered the last element (the “so what”) to be the most important. In Mill’s early days of using data boards, teachers in general were not very tech-savvy, according to respondents. As a result, teachers created the graphs out of construction paper, crayons, and markers. The school’s technology team later polished this process, training teachers how to create graphs on computers. Yet, according to respondents, how the graphs looked was secondary to the intent of using data to drive instructional decisions. The principal remarked that it would have been easier if she had simply required teachers to post a graph on a wall, but she emphasized using the data as a tool in the continuous improvement process. She did not want the boards to be a “dog and pony show”—rather, each board had to be meaningful for some kind of improvement. Various supports were in place to facilitate Mill’s continuous improvement process. First, since 2002–03, the school had a data team comprising grade-level representatives. The team gathered and distributed data on academic performance throughout the school to facilitate shared expectations and a sense of widespread accountability. The team helped teachers collect data and determine which data were important to include on the data boards. The principal believed the strategy of using data boards would not have been as successful without the data team in place. Second, the data team took questions, such as, “What the data mean?” (e.g., “What do we do about it?”) to the instructional strategy team, a cross-grade team that helped grade levels identify and implement instructional strategies to address weaknesses identified by the data. In addition to the data and instructional strategy teams, a school-based consultant assisted teachers by holding grade-level meetings to discuss data. A district-based consultant supported the school administration by working with principals on data-based decision-making.

Chapter 5 49
Each teacher at Mill identified the needs of his or her class based on the existing data and was given discretion to create data boards that were relevant to those needs. While the principal did not tell the teachers what data to use, she insisted that the data be current. During the process of using data boards, Mill staff realized that some of the existing assessments did not provide the information necessary to guide the instructional decisions they needed to make. Consequently, school leaders created an assessment team to develop the school’s own ongoing assessments that could help the school address the question, “What do we need to know [to make instructional decisions]?” Student engagement was an important element of data board implementation. According to respondents, in 2004-05, once the teachers were accustomed to the practice, students themselves contributed to the data boards. Students regularly tracked their own progress (against an “aim line” that tracked their current status regarding goals) and created action plans that specified their own personal learning goals and identified areas for them to strengthen and master. As a first step, the teachers at each grade level created forms for the students to help them understand and describe their own data and create an action plan. One respondent explained that these student-created action plans reinforced a common understanding and generated dialogue about what students needed to work on. Even kindergarten students had basic plans. Students became familiar with standards and other terminology, and understood the level at which they were reading. A staff survey conducted in 2004–05 reported that teachers believed 98 percent of the students could interpret their own data. Some of the posted student-level graphs and plans used numbers to identify students, while others had student names. The principal noted that parents never expressed concern to her regarding the identification of students: “It’s a competition with themselves, and students enjoy seeing their progress.” The school administration expected all teachers across all subjects, including music and gym, to use data boards, and students came to expect this widespread use. For example, respondents related stories of how students checked the boards as they walked into class and insisted that teachers update the progress charts as soon as possible after a test. New teachers noted that students “pushed back” if their teacher was not doing what their other teachers were doing in this regard. The widespread visibility of data also contributed to informal monitoring among grade-level teachers at Mill. Respondents noted that variation in performance (as displayed by the boards) could suggest that teachers were not implementing the instructional strategies with fidelity. Teachers were aware when they or their colleagues had lower scores, and, as such, worked to identify problems and support the teachers with lower performance. For instance, one new teacher with lower math scores realized that her instruction might have been lacking, so she asked a colleague to observe her class. As a result, she and her colleague determined that her math review was not as thorough as it needed to be. Respondents indicated that a noncompetitive, supportive, professional atmosphere and teacher collegiality were important to the success of data transparency. They described a strong

Chapter 5 50
expectation that staff support each other without negativity or penalty. Teachers pointed out that, while the school was competitive with other schools, there was no competition within the school among teachers. A common phrase during the teacher interviews was: “We all sink, or we all swim.” The principal noted that she felt strongly that staff growth was rooted in having opportunities to take risks in a supportive environment. One new teacher remarked, “Trial and error are definitely okay here. We get support for our growth period as teachers.” When asked directly about teachers’ possible concerns about the public display of how their classes were performing, the principal said there never had been any such concerns. She attributed this to the fact that teachers themselves posted their own data, and the focus was on improving instruction. The administration did not use the boards as a punitive monitoring tool of individual teachers, she said. It also helped, she explained, that the entire grade level takes ownership of students, rather than student performance being the sole responsibility of individual teachers. Respondents also indicated that teachers had grown tired of being the lowest-performing school in the district and were, as a result, receptive to change, which facilitated the shift to a culture of data transparency. Furthermore, once the school started making gains in achievement, staff bought into this strategy quickly.
Support For Staff—What We Found Respondents from nine of the 11 sites described using supplemental coaches and consultants in some manner over the past five years, with respondents from six of the sites citing access to two or more consultants at one time. Respondents from several sites emphasized the importance of consultants and coaches working collaboratively with staff, earning their respect and trust, and developing relationships with staff. Support ranged from the use of nationally known experts to a much heavier reliance on local staff. While most sites appeared to rely on local expertise, the external consultants provided by one district included national leaders in school reform. These consultants generally provided support to school administrators and districtwide teacher training on specific topics. The intensity of these services varied in terms of the number of personnel and the frequency of support. Different sites used different numbers and combinations of consultants and coaches. As mentioned above, six of the sites described working with multiple consultants and coaches at one time. The pattern of use did not seem related to schools with different achievement patterns (i.e., rapid-improvement or slow-and-steady).17
22See page 10 for a definition of this category.

Chapter 5 51
According to Chelsea respondents, a mathematics coach, two literacy coaches, and two English learner specialists provided support to the school. An example of multilayered support, Mill supplemented its district-level consultants with a close and long-term relationship with a school-based consultant who supported the school from 2001 to 2007. One site indicated much more casual reliance on this kind of support, with a respondent commenting, “When we ask, the regional agency sends some folks out.” At another school, respondents did not mention consultants or coaches as a major component of their efforts over the past several years.
How One School Used Consultants and Coaches to Support Teachers in Improving Instruction
Vignette: Swift Middle School—Using a Regional Consultant and Teacher Leaders to Roll Out Reforms
Swift respondents attributed a large part of the school’s slow-and-steady progress to the presence of a core of experienced instructional leaders and the assistance of a school improvement consultant from a regional education agency. The state required the school to use a consultant as a result of its Needs Improvement status. The regional consultant facilitated the development and implementation of the school improvement plan, helped prioritize content standards to better meet the state assessment requirements, and provided professional development in instructional best practices.
The school began developing its own teacher leaders with the creation in 2002 of a design team, which consisted of the principal, two teachers from each grade level, one special education teacher, and the school improvement specialist. For this team, the principal selected teachers whom he had observed to be highly respected in the school. School respondents noted that the principal did not simply choose the most experienced teachers or those who were department chairs but carefully selected staff that he felt were natural leaders and who would be capable of training their peers in instructional best strategies.
The regional consultant trained the design team once a month in curriculum alignment and instructional best practices, such as writing “essential questions” or lesson objectives on the board every day, and using graphic organizers in their classrooms. After being trained, the design team implemented the best practices in their classrooms for two to four weeks and then used common planning time to train the other teachers on both their grade-level “study” teams and in content teams, which met every other week. Once a week, during their common planning time in content and grade-level teams, teachers had the opportunity to give feedback on each strategy and share successes and individual variations. The manner in which this process was rolled out to teachers through the highly respected teacher leadership team appears to have contributed to the overall acceptance and enthusiasm with which the best practices were implemented and improved upon throughout the school.
Although the information initially came from an outside source—the regional consultant—the teachers indicated that they felt a strong sense of ownership and pride in the success of the strategies. A number of factors may have contributed to this sense of ownership:
Chapter 5 52
• The teachers had worked with the regional consultant previously, so they knew and accepted her.
• The well-respected principal actively endorsed the consultant.
• The design team pretested the reforms in their classrooms prior to recommending the practices to their colleagues, and they offered advice and support to the other teachers throughout the year.
• Teachers seemed to appreciate the flexibility to experiment with the reforms and adjust them to be most effective in their own classes.
The regional consultant also helped the design team align and prioritize their content standards. One teacher pointed out that it would have taken 20 years to teach students the full set of required standards. The design team sorted the standards into three categories: essential objectives, important objectives, and supplemental objectives. Teachers stated that this prioritizing allowed them to simplify their pacing guide and resulted in better instructional coordination throughout the school. This alignment of standards also facilitated instructional oversight. When administrators, members of the design team, and the regional consultant did monitoring walk-throughs, teachers in different classrooms would be teaching similar material on any given day of the week.
The regional consultant’s work ended after the two years during which the school was receiving additional school improvement funds for being in Year 1 Improvement status. However, due to the capacity-building nature of the regional consultant’s training, the continued presence of the strong design team, and additional professional development opportunities that the district provided to teachers, Swift managed to sustain its steady progress.
Respondents described the design team as cohesive and well-trained, and it steadily took over the instructional management of the school. All of the teachers on the original design team were still at Swift as of 2007–08. The school’s distributed leadership structure appears to have contributed to the sustainability of reforms. When the principal left after the 2005–06 school year, the design team members continued to lead and run the school with seemingly little guidance from the new principal. One member of the design team later became the assistant principal at the school.
Chapter 6 53
CHAPTER 6: EXTERNAL SUPPORT
In addition to actions at the school level, districts, states, and the federal government can play an important role in stimulating both rapid-improvement and more incremental reform efforts. Accountability requirements can push schools to change and additional resources can support these efforts. School improvement literature suggests that school change often is stimulated and supported through district, state and federal efforts, although schools often have difficulty sustaining improvement after outside resources disappear (Berends et al., 2001). More recent literature suggests that schools can withstand the loss of outside resources or other singular risk events but have difficulty only when faced with multiple risk factors, including, among others, loss of funding and turnover of staff or leadership (Taylor, 2006).
Multilayered Reform Context—District, State, and Federal Role
Efforts to turn schools around are embedded in district, state, and federal systemic reform and accountability environments. Efforts to improve student outcomes often are required of low-performing schools, and funding sometimes accompanies these requirements. Districts have been active in fostering reform efforts (e.g., Spillane and Thompson, 1997), and the federal government and states have provided Title I funds and other grants targeted toward school improvement. These factors played a role in several of the study schools.
District, State, and Federal Role—What We Found
Respondents in about half of the study schools, both rapid-improvement and slow-and-steady, cited district support, guidance, and assistance as being instrumental in their success.18 While respondents were somewhat less likely to mention states and the federal government as specifically and directly affecting local reform, the overall accountability context did appear to have an important motivating effect at the local level. Respondents noted the pressure of chronic low performance, as determined by federal and state accountability measures, as stimulating change. Freedom, Weston, Dogwood, and Swift received substantial state support.
While the primary form of support was financial, respondents provided examples of in-kind assistance, predominantly from the districts. In-kind assistance was generally in the form of consultation and professional development for instructional coaches and teachers. In some cases, schools and districts used funding to purchase assistance directly from state and private agencies as noted in Swift, Mill, and Stratford. Other forms of district support appeared more subtle, such as assigning experienced principals with the explicit purpose of turning the school around or guiding reform efforts by establishing consistent expectations.
Fiscal resources from multiple sources—state, federal, and local—helped schools undertake many improvement efforts.
All of the schools in this study reported obtaining and using additional resources, beyond their CSR grant, to support or sustain their improvement efforts. Schools, often with the support of
18 See page 10 for a definition of this category.
Chapter 6 54
their districts, pursued a variety of grants to fund school improvement efforts. In addition to federal Title I funds, major sources of funding for these schools included federal competitive grants. Walker, Mill, and Stratford received Reading First; Chelsea and Freedom received 21st Century Community Learning Centers (21st CCLC) or GEAR UP grants. Walker, Freedom, Weston, Dogwood, and Swift, designated as Needs Improvement under NCLB, received supplemental funds. In addition to providing fiscal resources to enable new or ongoing strategies, these grants often guided and provided focus to the reform efforts by mandating the use of funds and monitoring of programs.
In a number of schools, overlapping grants helped to maintain support for school improvement efforts. For example, Chelsea had six years of funding (2001 to 2007) from both the 21st CCLC program and the district for before- and after-school programs, which overlapped with the school’s CSR and Reading First grants. From 2003 to 2006, Freedom received supplemental funding under its state accountability system, which coincided with a 21st CCLC grant.
Support also came in the form of accountability, external pressure, and establishing consistent expectations. Respondents at Weston said a major impetus for change had been external pressure and threat of sanctions from the state. State representatives visited the school and threatened to fire teachers if student achievement did not improve. Teachers acknowledged that the process was painful but necessary. As one teacher described, “It put a new light in my head—you don’t just go in, close the classroom door, and do whatever you want.”
At Dogwood, the district supported reform efforts by aligning the curriculum and instruction with state assessments. This drive for consistency helped to focus instruction. As one teacher commented, “The biggest thing that the district did was to align the curriculum. Before, you taught what you felt like teaching.” While another district’s philosophy was to empower principals to take risks, it established a list of “nonnegotiable” policies to avoid spending resources on reinventing something that already worked and to create consistency across the district to cope with student mobility.
How a District and State Assisted One School in Its Improvement Efforts
Vignette: Swift Middle School—Strategically Using District and State Funds Respondents at Swift attributed much of their academic progress to district and state support in developing and implementing its school improvement program. Respondents credited the district for monitoring and supporting all schools in Needs Improvement status in a number of ways, including providing school improvement consultants, offering professional development opportunities, and conducting needs assessments. The district required all schools in Year 1 Improvement status to use a school improvement consultant from a regional agency. Respondents also said the district contributed to the school’s success by carefully selecting a principal who could effectively manage and stabilize the school. The district provided support in the principal’s efforts to eliminate weaker teachers who were not

Chapter 6 55
inclined to participate in the school’s reform efforts. Finally, the district supported a significant amount of professional development, based upon an annual districtwide needs assessment of student data and surveys of school staff and parents.
After the school failed to make AYP for two years, the state allocated additional federal funding to help the school implement its plan and to support the school’s improvement process. These funds supplemented the school’s professional development activities and supported a school improvement specialist. This specialist position was funded until the school had made AYP for two years. Subsequently, the state provided funding for a graduation coach, who took over some of the functions previously provided by the school improvement specialist.
Although the district continued to provide support after Swift exited its Needs Improvement status, the school no longer received supplemental school improvement funds. While the loss of funding created challenges in continuing reforms, the school used existing funds strategically and relied heavily on its strong group of leader teachers to continue to push the school forward.

Chapter 7 57
CHAPTER 7: SUSTAINING RAPID AND DRAMATIC SCHOOL IMPROVEMENT
Sustainability—What We Found
Schools face challenges in sustaining their improvement strategies and achievement gains. Many schools in our study found ways to replace lost resources, and some have succeeded in institutionalizing improved instructional practices. However, many schools continue to face environments that make sustaining student achievement gains an ongoing challenge.
While all the schools included in this study demonstrated some level of achievement growth during a short time frame, not all schools sustained these gains. In fact, Cooke and Walker, originally selected for showing rapid gains, experienced considerable achievement declines in later years of the study and fell well below their respective state and district average performance in both reading and math. While these were the most striking examples, other schools also experienced some periods of decline during the study’s time frame.
Many schools operated in fluctuating environments—reflected in reduction in available resources, high levels of student mobility, changes in student demographics, and staff turnover—that created challenges in sustaining achievement growth.
Some schools attributed their achievement gains in part to the actions of, and resources provided by, districts, states, and the federal government. When this was the case, respondents expressed concerns about the potential loss of district or state support.
For example, the state provided supplemental school improvement funding to Swift when it entered Needs Improvement status, and the state withdrew the funding just two years later when the school exited this status.19 As a result, there were cutbacks in several areas, such as the school improvement specialist position and work with special education students. Freedom expected to face the same situation at the end of both its Needs Improvement state grant and 21st Century funds. While Freedom staff expressed concerns about the fact that improving achievement would reduce the school’s funding, we found no evidence that the school leaders had looked at their resources and developed a sustainability plan.
In addition, respondents noted that efforts to sustain gains in achievement also were complicated by changing student demographics, and teacher and student turnover, among other factors. Changes in the student population may influence achievement trends perhaps in part because teachers may not be prepared to accommodate students’ needs when the student population becomes more challenging. The principal at Stratford described such a shift as a specific challenge when the percentage of students receiving free and reduced-price lunches increased by 17 percent over a five-year period. The high levels of student mobility reported by the schools (generally 30 percent of the student population) also created difficulties in showing and sustaining growth. In addition, student mobility posed a challenge to some of the study schools 19 Needs Improvement and Restructuring status are used generically in this report. Needs Improvement includes status includes Year 1 Improvement, Year 2 Improvement, and Corrective Action. Restructuring status includes Restructuring, Planning and Restructuring, and Implementation.

Chapter 7 58
in their efforts to maintain a culture of high expectations and an orderly learning environment. As the principal at Mill stated, “What is acceptable in one school is not acceptable [here], and it takes effort and time to acclimatize new students to these expectations.”
Respondents also identified staff turnover, both voluntary and involuntary, as an impediment to sustaining academic achievement. Walker consistently experienced high turnover in staff as teachers sought to move from this charter school to regular, higher paying, tenure-track positions in the local public school district. Stratford also reported that nearly half of the teaching staff were new to the school in 2004–05, largely due to a new school opening up in the district. In addition, three-fourths of these new teachers were in their first year of teaching. Many new and inexperienced staff created challenges, particularly given Stratford’s high-need student population. As described by a district respondent, “When you’re working with new teachers, they take about three years to get up to par for working with children of poverty.”
Most schools developed strategies to alleviate these fluctuations in resources, such as seeking supplemental fiscal resources to replace lost funds and building expertise among staff to reduce reliance upon external support.
Schools generally had an influx of resources over several years at a time. As grant funding streams ended, eight of the schools studied were able to rely on new funding streams. In some of these cases, it appears that the schools or their districts anticipated the loss of funding and pursued other grants.
Five schools used their funds and other resources in ways that mitigated future loss of funding. They focused on enhancing the knowledge and skills of their staff through professional development or by purchasing or developing materials and instructional programs that would remain in place once funding ended. Lincoln’s principal noted that she was reluctant to seek grants unless she could sustain the effort after the grant ended, so she focused on securing grants that would build staff skills to outlive the life of the grant.
Several schools made themselves less reliant on funding and external assistance by providing extensive professional development to their teachers and by building teacher leaders through distributed leadership opportunities. At Stratford, Reading First originally funded coaches, then limited Title I funds paid for these coaches, and by the end of our study, the school was attempting to create teacher leaders in the event it could not continue to afford coaches in the future. Teachers mentioned that they were working on a “gradual release” of reliance on external funds by training teachers to the point in which coaches would no longer be needed. At Swift, regional consultants trained a selected group of teacher leaders on instructional practices and on training other teachers in those strategies. Near the end of our study, the school lost its school improvement specialist due to lack of funding. However, much of the implementation of the instructional practices had become institutionalized.
A few schools strengthened the orientation of new staff. At both Mill and Stratford, teachers participated in a new teacher academy. Swift instituted a mentor system that assigned new teachers to an experienced member of the staff to help integrate and acculturate the new teachers to the school.
Chapter 7 59
How One School Changed Its Professional Development Model to Address Sustainability Concerns
Vignette: Mill Elementary—Instilling a “Sense of Urgency” Among New and Veteran Staff Several factors played a role in enabling Mill to sustain its initial improvement. The principal cited the consistency in the school’s focus on reading, math, and attendance as being critical to facilitating and sustaining its reforms. School leaders anchored everything that the school did—from instructional strategies to professional development—to those foci in some way. Respondents indicated that a broad-based culture of shared leadership, knowledge, and responsibility was perhaps most critical to the sustainability of the school’s improvements. A quote from an assistant superintendent in the school’s application for a prestigious award captures the pervasive nature of the school’s reforms: “A teacher or principal could leave, and the change would still occur because it is now engrained in the system.” After five years of sustaining its high performance, one of the prominent challenges for Mill was maintaining a “sense of urgency” among staff. This issue was particularly relevant for newer staff because many teachers started at Mill well after the school went from the “bottom of the bucket” to being one of the highest performers. Many of these newer teachers may not have been fully cognizant of the school’s previous history or the importance of particular strategies. The principal remarked that the challenge was ensuring that new leaders understand the “Mill story”: “Without knowing where we had been, new leaders will not understand how to stay where we are,” she said. There appeared to be widespread awareness and recognition among the school respondents that the staff cannot become complacent, despite the school’s success. Indeed, one of the inquiry questions in the school’s improvement plan was, “How do we instill in teachers new to Mill our sense of urgency and commitment to continual student improvement?”
During walk-throughs, the principal found that strategies that she considered important were not necessarily being implemented across the board. She remarked, “You’re not going to have the sustained growth if people are not using the techniques that you know are research-based and make a difference.”
To address this concern, the school introduced teacher-led professional development in 2007–08 to instill urgency and reinforce fidelity of classroom practices. This approach was a major departure from prior years, in which external consultants provided most professional development. The district released a number of staff development days to all schools, which helped facilitate Mill’s new approach to professional development. Under this approach, all teachers were provided three sessions each Monday, and participants chose one session to attend, allowing them to prioritize their own needs. Surveys were used to determine areas of expertise and the areas teachers would like to know more about.
In addition to providing frequent and relevant professional development and facilitating ownership of reforms, this “teachers-teaching-teachers” approach was designed to develop in-house expertise, build teacher leaders, continue to pressure veteran staff by challenging them with new ideas, and continually expose new staff to Mill’s strategies and values. According to a teacher respondent, the in-house structure “helped with understanding why change is needed.”

Chapter 7 60
This approach also provided a means to sustain reform in the event that the coaches are no longer available because, as one respondent explained, “Every teacher here has become a trainer.”
This model also helped ensure consistency and fidelity of implementation because it involved all staff. The principal would recommend individual teachers to attend specific sessions that would address her implementation concerns. As a respondent described, “We needed to slow down a bit and make sure the reforms are working and being implemented.” Provided to all staff, the sessions stressed the urgency and importance that all teachers, veteran and new alike, were “doing the little things that matter.”

Chapter 8 61
CHAPTER 8: LESSONS LEARNED FROM STUDYING DRAMATIC SCHOOL IMPROVEMENT
Much of the recent literature on turning around the achievement of low-performing schools has been grounded in the proposition that schools could improve their performance quickly as some businesses have. Empirical studies have focused on case descriptions of low-performing schools that improved, offering “existence proofs” that schools can turnaround the academic achievement of their students in a short period of time (Herman et al., 2008). This study adds to the literature by systematically identifying low-performing schools that dramatically improved their achievement and describing the actions that appear to have been related to those achievement patterns. In each of these efforts—identifying schools and describing what they did—the study encountered challenges that will likely face future studies of this kind on low-performing schools that improved. These challenges, in turn, have implications for future research, raising questions regarding what we really want to know about the phenomenon of dramatic school improvement and how to design studies to obtain that knowledge.
Challenges in Identifying Schools for Study
This study had difficulty using empirical criteria to select sample schools for study based on the achievement of their students. The inadequacies of available national data on school performance impeded our efforts to apply empirical criteria and to interpret the observed achievement trends. In addition, we grappled with how competing demographic factors, other than actions taken by school leaders and staff, might have accounted for improved student performance in the selected schools.
How to Select Rapid and Dramatic Improvement Schools Based on Student Achievement Patterns Based on available evidence from case studies, as well as expert opinion, the recent Institute of Education Sciences (IES) practice guide, Turning Around Chronically Low-Performing Schools (Herman et al., 2008), defined turnaround schools as follows: First, they began as chronically poor performers—with a high proportion of their students (generally 20 percent or more) failing to meet state standards of proficiency in mathematics or reading as defined under NCLB over two or more consecutive years. Second, turnaround schools, as defined by the IES expert panel, showed substantial gains in student achievement in a short time (no more than three years). Examples of substantial gains in achievement are reducing by at least 10 percentage points the proportion of students failing to meet state standards for proficiency in mathematics or reading, showing similarly large improvements in other measures of academic performance (such as lowering the dropout rate by 10 percentage points or more), or improving overall performance on standardized mathematics or reading tests by an average of 10 percentage points (or about 0.25 standard deviations).

Chapter 8 62
This definition seems precise, but operationalizing it with reliable and valid metrics presents several major challenges. While this study employed different criteria to identify schools across the nation, it encountered issues, described below, that would similarly affect studies using the definition spelled out in the IES practice guide.
One challenge in selecting sites across the nation for our study was the absence of up-to-date national data on student achievement. Moreover, reliable estimates of school-level performance should ideally be derived from longitudinal, student-level data to ameliorate problems inherent in using percent proficient school-level calculations through the use of robust student growth curve models. This issue is of particular importance in schools that experience high levels of student mobility, which was the case at several of the schools in our study.20
As discussed earlier, we were constrained by having a national data set that was both out-of-date and provided achievement information only at the school level. Because the school-level data available from the National Longitudinal School-Level State Assessment Score Database (NLSLSASD) were not updated, we needed to gather data from individual states, which varied in its completeness and timliness. While one might reasonably expect future updates to national school-level data sets such as the NLSLSASD, it seems unlikely that a comparable national database of student-level data will be compiled in the near future.
Another complication in identifying and selecting sample schools had to do with the study’s time period. Restricting our search for schools in the available database, we somewhat arbitrarily selected the time period for this study. Schools, however, have achievement trajectories independent of the exigencies of education research. Other schools than those in our study likely improved dramatically much earlier, during a time period not captured by our database or selection criteria. Still other schools might have started on an improved trajectory toward the end of the study’s time period.
A final challenge faced by this study may have been largely mitigated in recent years as NCLB testing requirements have been implemented more widely. We were constrained to examining data from a single grade level because the majority of states were only testing one elementary grade and one middle grade during the baseline period of our data collection. Better approaches that combine data from multiple grade levels and across multiple subjects will be more feasible as states continue to implement reading and mathematics assessments in all grades from 3 through 8, as required by NCLB, and as state data systems improve. An increasing number of
20 There are several other limitations to using percent proficient as the criterion for sample school selection. First, with any proficiency standard, there are likely to be substantial cohort effects, as students one year may be more or less capable than students the next, independent of the quality of their school experience. Second, a proficiency standard is susceptible to erroneous interpretation because it sets a fixed (and arbitrary) standard. Small changes (both improvements and declines) may appear more substantively significant than they really are. For example, imagine that a large number of fourth-grade students score just below proficient on a state reading assessment. A small improvement the next year in fourth-grade reading scores would appear to be a major improvement in school performance, even though substantively and statistically, it may really only be measurement error from year to year, or a cohort effect, or just a small improvement. Finally, this definition of school improvement says nothing about reduction in achievement gaps, a goal that is central to NCLB. One could imagine a school that had drastically reduced the gap between white students and students of color. This substantial accomplishment would not be captured by the criterion of percent proficient.
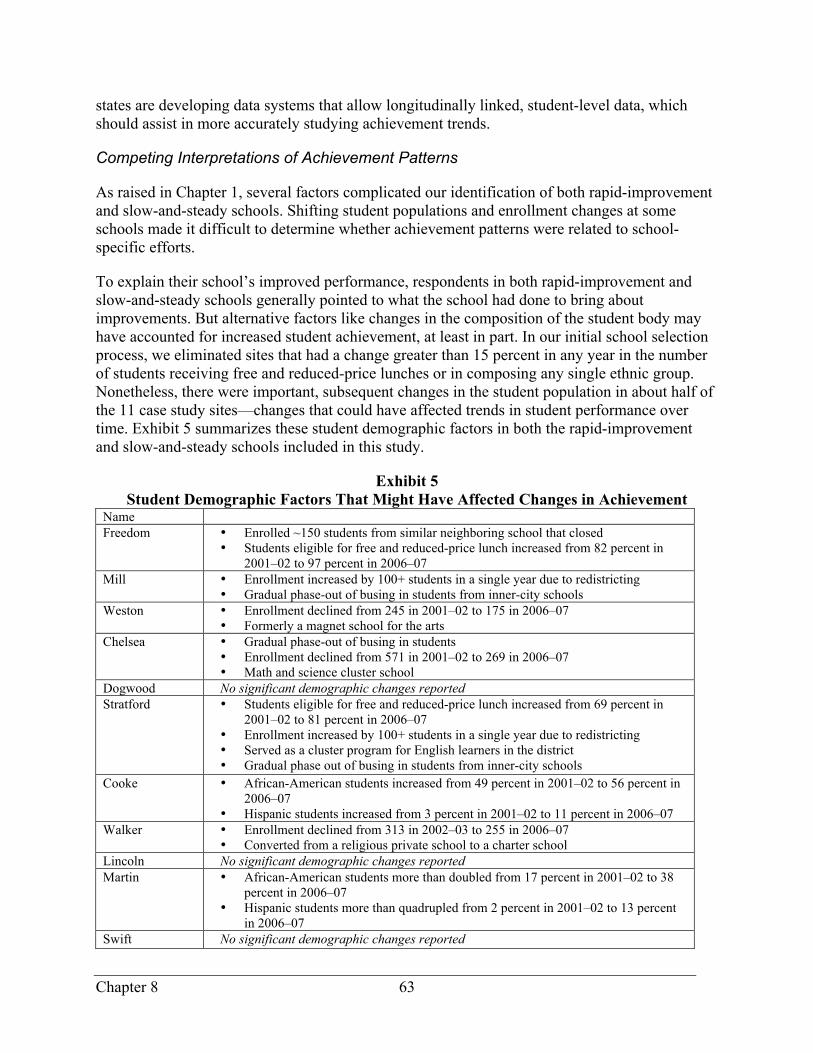
Chapter 8 63
states are developing data systems that allow longitudinally linked, student-level data, which should assist in more accurately studying achievement trends.
Competing Interpretations of Achievement Patterns
As raised in Chapter 1, several factors complicated our identification of both rapid-improvement and slow-and-steady schools. Shifting student populations and enrollment changes at some schools made it difficult to determine whether achievement patterns were related to school-specific efforts.
To explain their school’s improved performance, respondents in both rapid-improvement and slow-and-steady schools generally pointed to what the school had done to bring about improvements. But alternative factors like changes in the composition of the student body may have accounted for increased student achievement, at least in part. In our initial school selection process, we eliminated sites that had a change greater than 15 percent in any year in the number of students receiving free and reduced-price lunches or in composing any single ethnic group. Nonetheless, there were important, subsequent changes in the student population in about half of the 11 case study sites—changes that could have affected trends in student performance over time. Exhibit 5 summarizes these student demographic factors in both the rapid-improvement and slow-and-steady schools included in this study.
Exhibit 5 Student Demographic Factors That Might Have Affected Changes in Achievement
Name Freedom • Enrolled ~150 students from similar neighboring school that closed
• Students eligible for free and reduced-price lunch increased from 82 percent in 2001–02 to 97 percent in 2006–07
Mill • Enrollment increased by 100+ students in a single year due to redistricting • Gradual phase-out of busing in students from inner-city schools
Weston • Enrollment declined from 245 in 2001–02 to 175 in 2006–07 • Formerly a magnet school for the arts
Chelsea
• Gradual phase-out of busing in students • Enrollment declined from 571 in 2001–02 to 269 in 2006–07 • Math and science cluster school
Dogwood No significant demographic changes reported Stratford • Students eligible for free and reduced-price lunch increased from 69 percent in
2001–02 to 81 percent in 2006–07 • Enrollment increased by 100+ students in a single year due to redistricting • Served as a cluster program for English learners in the district • Gradual phase out of busing in students from inner-city schools
Cooke • African-American students increased from 49 percent in 2001–02 to 56 percent in 2006–07
• Hispanic students increased from 3 percent in 2001–02 to 11 percent in 2006–07 Walker • Enrollment declined from 313 in 2002–03 to 255 in 2006–07
• Converted from a religious private school to a charter school Lincoln No significant demographic changes reported Martin • African-American students more than doubled from 17 percent in 2001–02 to 38
percent in 2006–07 • Hispanic students more than quadrupled from 2 percent in 2001–02 to 13 percent
in 2006–07 Swift No significant demographic changes reported

Chapter 8 64
In some cases, factors such as lower enrollment or less challenging student needs over time may have played a role in increased student achievement. For example, Chelsea’s enrollment declined by more than half over a five-year period, from 571 students in 2001–02 to 269 in 2006–07. Moreover, the largest decrease (-28 percent) occurred the year preceding the school’s peak in achievement (2003–04). Although the percentage of students in poverty was fairly constant throughout this time span (2001–07), school respondents noted that the demographics of the neighborhood changed, with an influx of middle class families without children and an exodus of low-income families. At Weston, the student population also declined almost 29 percent, from 245 in 2001–02 to 175 in 2006–07.
Busing of students from other neighborhoods was being phased out in both Mill and Chelsea during the study timeframe. Teacher respondents at Chelsea attributed the lower test scores prior to its improvement period in 2004 to student busing. They believed that the principals at other schools had been sending students with achievement or disciplinary problems to Chelsea. Mill’s increase in student achievement occurred several years before busing ended, but the accompanying decline in ethnic diversity might have contributed to sustaining the school’s gains.21
On the other hand, some schools improved in student performance over time despite considerable turnover in students or evidence of an increasingly challenging student population. Martin reported that one-third of its students turned over on a yearly basis. Furthermore, its percentage of minority students increased from about 25 percent to more than 50 percent over the five years of our study. Freedom, in another particularly striking example, sustained its academic gains despite reporting that it absorbed in a single year approximately 150 students from a neighboring school that had closed. In addition, students receiving free and reduced-price lunches increased from 82 percent in 2001–02 to 97 percent in 2006–07.
Challenges in Describing Activities
The schools studied posed unique challenges for retrospective data collection. Collecting data from respondents on events that occurred several years earlier could have been hindered by gaps in memory, rationalizing earlier actions in light of later outcomes, and the sheer complexity of improvement efforts.
Our study relied on data from interview and focus group respondents whom we asked to describe and reflect upon activities that occurred two, three, or, in some cases, more years earlier. Some schools had experienced considerable turnover in teaching or administrative staff. Even when staffs were stable, respondents were not always certain of the timing and details of particular reform strategies. In one school, the principal documented events in great detail over several years. Unfortunately, this was the exception rather than the rule—most schools in our study rarely documented the details of their improvement efforts.
21 Three of the rural schools in our study appeared to have relatively more student stability. These tended to be smaller communities, often with only one school at a given level. The majority of schools studied, however, were in more urban settings. Here, student transience and school choice seemed more prevalent.

Chapter 8 65
Furthermore, retrospective data collection can be subject to an additional source of error. In hindsight, some respondents may tend to rationalize their actions or impose—after the fact—logic or order to their behavior that was not originally there. Details of other actions that may suggest different interpretations may be forgotten selectively, if unintentionally. This process is not just one of individuals forgetting dates, names, and facts. It is a collective process. As school staff interact with one another, they influence each other’s perceptions. The result is frequently a shared interpretation or story about what has happened and to what effect. This story may be strongly held by a majority of the staff but may have been based on misconceptions either of events or of their relationship to observed outcomes.
Finally, the sheer complexity of school improvement efforts made it difficult to obtain a complete picture of what occurred in these schools. Each of the study schools engaged in unique, complex, and multifaceted improvement efforts. As noted earlier, school improvement literature often identify particular factors, such as the critical role of school leadership or data-based decision-making, to explain substantial gains in student achievement. We discuss such factors in this report as well. However, these factors appeared to overlap and interact in complex ways in these sites.
The complexity of reform efforts, as well as the challenges of retrospective data collection, might account for some of the patterns displayed in Exhibit 4 in Chapter 2. In many cases, the data did not allow us to determine whether key school characteristics were perceived to have been related positively or negatively or unrelated at all to patterns of improvement in student achievement (indicated by “0” in Exhibit 4, Chapter 2). As mentioned previously, faulty and incomplete memories might have been one explanation for these gaps. Different respondents attributed their schools’ academic improvement to different combinations of factors, adding to the difficulty of collecting data and understanding what had occurred in the schools.
Implications for Future Research As described above, this study faced challenges identifying dramatically improving schools, describing what occurred at the schools before and during the time that the achievement improved, and explaining the relationship between the actions taken and the student outcomes (and eliminating competing explanations of the achievement patterns). Like other studies of school improvement more generally, this was a study of “outlier” schools that “beat the odds.” While this study attempted to use empirical criteria to select sample schools initially, it encountered methodological challenges shared by other small-scale, retrospective case studies of outlier school improvement. The challenges have implications for future research. Ongoing, current databases documenting patterns of student achievement would help researchers to identify low-performing schools that improved. Having ongoing, universal or widespread, current databases of school activities and of student outcomes over several years would allow researchers to identify schools that fit school improvement criteria. Even more important, such data would allow researchers to determine whether the increases at the school level exceeded district or state averages, enabling researchers to analyze relative growth of achievement at the school, district, and state levels. Available

Chapter 8 66
ongoing data about large numbers of schools over a longer time frame also would help examine patterns of activities undertaken in schools that show rapid-improvements in student outcomes and comparable schools that do not. Such important comparisons often are missing from examinations of schools that beat the odds, making it difficult to determine whether schools attempting similar reforms are less successful, and why. Ongoing data about student achievement also would help avoid problems associated with studies that are limited to arbitrary time periods. Real-time documentation of reform efforts would eliminate the weaknesses of retrospective data collection. In order to understand the implementation of reforms, descriptive information should be collected before student outcomes are known. Only then can researchers be sure that the success (or failure) of a school to dramatically increase student achievement has not colored respondents’ memories of events and attributions to particular actions taken (or not taken). Routinely collecting school practices data and making it available in existing databases or routinely sampling schools could help researchers understand which schools undertake reform and which do not, as well as which actions ultimately appear related to improved student outcomes. A more robust theoretical foundation and knowledge base are prerequisites to designing studies that could attribute dramatic improvements in achievement patterns to school improvement activities. Establishing and tracking the progress of schools—both qualitatively and quantitatively—would help researchers and policymakers better understand the relationships between school actions and student outcomes. However, this approach could not determine whether the actions caused the outcomes. Such causal attribution can only be demonstrated by rigorous studies of the impact of specific interventions. To date, there is virtually no research that examines the impact of specific school improvement interventions on student outcomes. This is in part because there has been insufficient work to identify potentially critical components of school improvement interventions, how these components might be optimally put together, and the important possible drivers of the school improvement process. Developing a more robust theoretical foundation for the school improvement process and developing testable hypotheses would be the important prerequisites for designing interventions that could be tested rigorously to determine their impact on student outcomes. In sum, studies of dramatic school improvement, like studies of school reform more broadly, requires asking the right questions and building ongoing data sources and activities to address those questions, or, in other words, a thoughtful, cumulative program of research to inform practice.

Chapter 9 67
CHAPTER 9: CONCLUSIONS AND NEXT STEPS
NCLB has raised the stakes for persistently low-performing schools. As states place more schools in Needs Improvement or Restructuring status, educators on the front lines are searching for ways to improve their school’s performance, and policymakers are searching for specific practices they can recommend to help schools turn around quickly. For years, research on school reform has offered many different ingredients—in the areas of leadership, climate, instructional practices, and support—that appear to help schools increase student achievement. Research also has concluded that different combinations of these ingredients, embodied in comprehensive school reforms, can achieve results if they are implemented well (Aladjem et al., 2006). This study joins others in concluding that there is no single recipe for success. Our examination of CSR schools yields lessons about the variety of approaches to school improvement and the complexity of the environments in which educators work. These environments can challenge even well-implemented reform efforts, and similar strategies can yield different outcomes depending on factors both within and outside the control of schools, districts, and states. Below we review some of the overarching points that emerged from our in-depth case studies of 11 schools.
To what extent do school rapid-improvement CSR schools exist (i.e., schools that have made quick and dramatic improvement in student achievement)? Could we locate them among a national pool of CSR schools engaged in improvement efforts?
Few schools nationwide met our criteria as rapid-improvement schools. From our database of 1,037 CSR elementary schools that were initially low-performing in both reading and math achievement, we were able to identify only 47 that showed dramatic and sustained achievement gains in subsequent years. Finding dramatically improved middle schools proved even more difficult. This suggests that few schools across the nation are likely to be making quick gains that are sustained over an appreciable period of time.
One difficulty in identifying these schools is the lack of a commonly accepted definition of what constitutes rapid and dramatic school improvement. There are varying ideas on how much a school should improve, within what time frame, how long the improvement should be sustained, and using what outcome measure(s). How this school-level change compares with district or state achievement over a similar time period also seems relevant. A school may improve performance substantially, but if its change is not much different than that of the average school in the state during this period, it should probably not be the target of study for its “dramatic” achievement improvements. The same caution applies to improvement increases that coincide with nontrivial changes in student composition.22 It can be a challenge to disentangle the impact of such external factors from the effect of school-level reforms; nonetheless it is important to acknowledge these factors in school improvement, as we have tried to do in this study.
22 Although if schools improve despite substantial increases in high-needs students, then they may indeed be improving schools.

Chapter 9 68
Did the processes of reform across both rapid-improvement schools and slow-and-steady schools (i.e., initially low-performing schools that steadily improved at a slower pace) reflect the characteristics and strategies found in prior research on school improvement?
Yes, the rapid-improvement and slow-and-steady schools that were studied consistently addressed factors long identified in school reform research as contributors to improved student outcomes. Across the board, the improving schools that we studied reported adopting and implementing new leadership styles, practices to improve school climate, new instructional strategies and practices, and strategies to ensure external support. However, specific practices varied across schools.
While the schools visited implemented distinctive practices to address common challenges, they also combined these practices in a variety of different ways. Some schools placed greater emphasis on one factor (e.g., distributed leadership) than another (e.g., transparent use of student-level data). Others chose a different order of factors or combined features of reform in unique ways to establish a comprehensive, whole-school approach. Furthermore, reform strategies interacted in multiple ways, suggesting that the same reforms may be more or less successful depending on differences in leadership, staff capacity, community support, and other factors.
Schools engaged in varying combinations of reforms that they often adapted and changed over time to meet their changing needs and circumstances. The energy, experience, and stability of leadership and teachers also influenced the interplay of reforms, and this interplay appeared to require ongoing monitoring and fine-tuning.
School improvement did not occur in a vacuum. While much of the recent literature on turning around the achievement of low-performing schools focuses on changes at the school level, we found few examples of schools that improved in isolation. Respondents in our study rarely mentioned districts as inhibiting reform efforts (as is implied in some of the literature on turnaround schools), and they often identified districts as being key initiators and supporters of school reform. State and federal accountability also appeared to foster greater alignment of state, district, and school efforts.
Did rapid-improvement schools differ in observable, systematic ways from slow-and-steady schools?
Rapid-improvement schools and slow-and-steady schools had much in common, but there were differences as well. In rapid-improvement schools with classic profiles of student achievement (those in which achievement gains were substantial and rapid at the outset of our five-year study period), improvements in student achievement were credited to new principals who were viewed as change leaders and who continued to lead the school through the study period.23 In contrast, two of the three schools with slow-and-steady increases in student achievement had multiple principals during the study’s five-year time period. Perhaps in part because of this, respondents in slow-and-steady schools were more likely to attribute their success to distributed leadership (in which teachers and other school staff shared leadership with the principals) than were
23 See page 10 for a definition of this category.

Chapter 9 69
respondents in rapid-improvement schools. And while both categories of schools may have attributed their success to use of data, the classic profile schools appeared to use data in more transparent and public ways. Staff in the rapid-improvement schools also were more likely than those in the slow-and-steady schools to attribute their success to increased learning time, either from an extended school year, after-school programs, or block scheduling within the school day.
How did rapid-improvement schools and slow-and-steady schools address challenges to implementing and sustaining improvement strategies?
Sustaining improvement in student achievement appeared to be as challenging as achieving it in the first place. As we described in this report, two of the rapid-improvement schools originally identified as having made quick gains according to our selection criteria showed considerable declines in more recent years. Even schools that sustained their growth reported continuing challenges, whether a high level of student mobility, maintaining a sense of urgency among staff, or continuing to develop new teacher leaders as experienced staff advanced to administrative positions elsewhere. In several cases, both rapid-improvement and slow-and-steady schools had to cope with diminished resources, even as they showed improvement—in some cases because of their improvement. These cases point to an often chaotic and sometimes irrational environment that can thwart the sustainability of hard-won gains.
Final Note
This report provides many examples of specific ways that schools appear to be achieving noteworthy gains in student outcomes. It points to the dynamic settings in which many low-performing schools operate, and the need for ongoing investigation of how schools can achieve impressive results and sustain them in constantly changing environments. A serious effort to understand low-performing schools that improved will involve going beyond case studies of the rare examples of dramatic improvement—i.e., the “outlier” schools that have beaten the odds. . Such studies are suggestive but do not provide systematic information about the incidence of rapid school improvement, the factors associated with it, and similarities and differences with schools that have not achieved such outcomes. Armed with this knowledge as a foundation, researchers might then design interventions and rigorous studies to determine their impact on student outcomes.
Researchers, policymakers, and practitioners in recent years have paid much attention to the scientific search for “what works” to improve schools and turn them around. This study’s findings underscore the challenges inherent in such efforts by drawing attention to the fact that turning schools around is not just about adopting a set of effective or promising practices. It is about recognizing that the one best system does not exist—that no single approach can guarantee improvement in a particular school. Efforts to improve low-performing schools are by their nature interventions in ongoing systems. Prior history as well as existing routines, beliefs, and cultures of the school will influence how interventions are interpreted, implemented, and interact to produce the results specific to that context. Finally, turning schools around, like other school improvement efforts also is about implementing practices well while at the same time navigating and adapting to a constantly changing landscape.


References 71
REFERENCES
Aladjem, D. K., LeFloch, K. C., Zhang, Y., Kurki, A., Boyle, A., Taylor, J. E., Herrman, S., Uekawa, K., Thomsen, K., and Fashola, O. (2006). Models Matter—The Final Report of the National Longitudinal Evaluation of Comprehensive School Reform. Washington, D.C.: American Institutes for Research. Retrieved May 31, 2007, from http://www.air.org/publications/documents/NLECSR_2006.pdf.
Anderson, L. W., and Shirley, J. R. (1995). High School Principals and School Reform: Lessons Learned from a Statewide Study of Project Re:Learning. Educational Administration Quarterly, 31(3), 405–423.
Berends, M. (2000). Teacher-Reported Effects of New American School Designs: Exploring the Relationships to Teacher Background and School Context. Educational Evaluation and Policy Analysis, 22(1), 65–82.
Berends, M., Kirby, S. N., Naftel, S., and McKelvey, C. (2001). Implementation and Performance in New American Schools: Three Years into Scale-Up. Santa Monica, California: RAND.
Borman, G. D., Hewes, G., Overman, L., and Brown, S. (2003). Comprehensive School Reform and Student Achievement: A Meta-Analysis. Review of Educational Research, 73(2), 125–230.
Brookover, W. B., Beady, C., Flood, P., Schweitzer, J., and Wisenbaker, J. (1979). School Social Systems and Student Achievement: Schools Can Make a Difference. New York: Prager.
Brookover, W. B., and Lezotte, L. W. (1977). Changes in School Characteristics Coincident with Changes in Student Achievement. East Lansing, Michigan: Michigan State University, College of Urban Development.
Camburn, E., Rowan, B., and Taylor, J. E. (2003). Distributed Leadership in Schools: The Case of Elementary Schools Adopting Comprehensive School Reform Models. Educational Evaluation and Policy Analysis, 25, 347–373.
Clotfelter, C. T., Ladd, H. F., Vigdor, J. L., and Wheeler, J., (2007). High Poverty Schools and the Distribution of Teachers and Principals. North Carolina Law Review, 85. (June), 1345–1380.
Cohen, D. K., and Hill, H. C. (1998). Instructional Policy and Classroom Performance: The Mathematics Reform in California (RR-39). Philadelphia: Consortium for Policy Research in Education.
Datnow, A., Lasky, S., Stringfield, S., and Teddlie, C. (2006). Systemic Integration for Effective Reform in Racially and Linguistically Diverse Contexts. New York: Cambridge University Press.

References 72
Desimone, L. (2000). Making Comprehensive School Reform Work (Urban Diversity Series No.112). East Lansing, Michigan: Clearinghouse on Urban Education, Institute for Urban and Minority Education. (ERIC Document Reproduction Service No.1637)
Edmonds, R. (1979). Effective Schools for the Urban Poor. Educational Leadership, 37(1), 15–18, 20–24.
Elmore, R. F. (2000). Building a New Structure for School Leadership. Washington, D.C., Albert Shanker Institute.
Garet, M. S., Porter, A. C., Desimone, L., Birman, B. F., and Yoon, K. S. (2001). What Makes Professional Development Effective? Results from a National Sample of Teachers. American Educational Research Journal, 38(4), 915–945.
Gronn, P. (2000). Distributed Properties: A New Architecture for Leadership. Educational Management and Administration, 28(3), 317–338.
Hart, A. W. (1995). Reconceiving School Leadership: Emergent Views. Elementary School Journal, 96(1), 9–28.
Heller, M. J., and Firestone, W. A. (1995). Who’s In Charge Here? Sources of Leadership for Change in Eight Schools. Elementary School Journal, 95, 65–86.
Herman, R., Dawson, P., Dee, T., Greene, J., Maynard, R., Redding, S., and Darwin, M. (2008). Turning Around Chronically Low-Performing Schools: A Practice Guide (NCEE #2008-4020). Washington, D.C.: National Center for Education Evaluation and Regional Assistance, Institute of Education Sciences, U.S. Department of Education. Retrieved from http://ies.ed.gov/ncee/wwc/practiceguides.
Johnson, J. F., and Asera, R. (eds.). (1999). Hope for Urban Education: A Study of Nine High-Performing, High-Poverty, Urban Elementary Schools. Washington, D.C.: Policy Studies Associates and University of Texas at Austin, Charles A. Dana Center.
Kowal, J. M., and Hassel, E. A. (2005). Turnarounds with New Leaders and Staff. Washington, D.C.: The Center for Comprehensive School Reform and Improvement.
Kurki, A., Boyle, A., and Aladjem, D. K., (2006). Implementation: Measuring and Explaining the Fidelity of CSR Implementation. Journal of Education for Students Placed at Risk, 11(3and4), 255–277.
LeFloch, C., Martinez, F., O’Day J., Stecher, B., and Taylor, J. (2007). State and Local Implementation of the No Child Left Behind Act, Volume III—Accountability Under NCLB: Interim Report. Washington, D.C.: U.S. Department of Education, Office of Planning, Evaluation and Policy Development, Policy and Program Studies Service.
Mosenthal, J., Lipson, M., Torncello, S., Russ, B., and Mekkelsen, J. (2004). Contexts and Practices of Six Schools Successful in Obtaining Reading Achievement. The Elementary School Journal, 104(5), 343–367.

References 73
O’Day, J., and Bitter, C. (2003). Evaluation Study of the Immediate Intervention/Underperforming Schools Program of the Public Schools Accountability Act of 1999: Final Report. Palo Alto, California: American Institutes for Research.
Picucci, A. C., Brownson, A., Kahlert, R., and Sobel, A. (2002a). Driven to Succeed: High-Performing, High-Poverty, Turnaround Middle Schools. Volume I: Cross-Case Analysis of High-Performing, High-Poverty, Turnaround Middle Schools. Austin, Texas: University of Texas at Austin, Charles A. Dana Center.
Picucci, A. C., Brownson, A., Kahlert, R., and Sobel, A. (2002b). Driven to Succeed: High-Performing, High-Poverty, Turnaround Middle Schools. Volume II: Case Studies of High-Performing, High-Poverty, Turnaround Middle Schools. Austin, Texas: University of Texas at Austin, The Charles A. Dana Center.
Public Impact. (2007). School Turnarounds: A Review of the Cross-Sector Evidence on Dramatic Organizational Improvement. Center on Innovation and Improvement.
Ross, S., Sanders, W., Wright, P., Stringfield, S., Wang, L., and Alberg, M. (2001). Two- and Three-Year Achievement Results from the Memphis Restructuring Initiative. School Effectiveness and School Improvement, 12(3), 323–346.
Smylie, M. A., Conley, S., and Marks, H. M. (2002). Exploring New Approaches to Teacher Leadership for School Improvement. In J. Murphy (ed.), The Educational Leadership Challenge: Redefining Leadership for the 21st Century, 101st Yearbook of the National Society for the Study of Education, Part I (pp. 162–188). Chicago, Illinois: University of Chicago Press.
Spillane, J. P. (2006). Distributed Leadership. San Francisco: Jossey-Bass.
Spillane, J. P., Halverson, R., and Diamond, J.B. (2001). Investigating School Leadership Practice: A Distributed Perspective. Educational Researcher, 30(3), 23–28.
Spillane, J. P., and Thompson, C. L. (1997). Reconstructing Conceptions of Local Capacity: The Local Education Agency's Capacity for Ambitious Instructional Reform. Educational Evaluation and Policy Analysis, 19(2), 185–203.
Stringfield, S., and Teddlie, C. (1991). Observers as Predictors of Schools' Multi-Year Outlier Status. Elementary School Journal, 91(4), 357–376.
Taylor, J. E. (2006). The Struggle to Survive: Examining the Sustainability of Schools’ Comprehensive School Reform Efforts. Journal of Education for Students Placed at Risk, 11(3 and 4), 331–352.
U.S. Department of Education, Office of Planning, Evaluation and Policy Development, Policy and Program Studies Service (2008), Evaluation of the Comprehensive School Reform Program Implementation and Outcomes: Third-Year Report, Washington, D.C.
References 74
U.S. Department of Education, Office of Planning, Evaluation and Policy Development, and Office of Elementary and Secondary Education (2004). Longitudinal Assessment of Comprehensive School Reform Program Implementation and Outcomes: First-Year Report. Washington, D.C.
U.S. Department of Education, Office of Planning, Evaluation and Policy Development, and Office of Elementary and Secondary Education (2006). Models Matter—The Final Report of the National Longitudinal Evaluation of Comprehensive School Reform. Washington, D.C.
U.S. Government Accountability Office. (Sept. 5, 2007). No Child Left Behind Act: Education Should Clarify Guidance and Address Potential Compliance Issues for Schools in Corrective Action and Restructuring Status. (Publication No. GAO-07-1035)
Viadero, D. (August 17, 2007). Scholars Reaching Outside Education for School Fixes. Education Week, 26(45). Bethesda, Maryland: Editorial Projects in Education.
Wallace, M. (2002). Modeling Distributed Leadership and Management Effectiveness: Primary School Senior Management Teams in England and Wales. School Effectiveness and School Improvement, 13(2), 163–186.
Webb, N. L. (1999). Alignment of Science and Mathematics Standards and Assessments in Four States (NISE Research Monograph No. 18). Madison, Wisconsin: University of Wisconsin-Madison, National Institute for Science Education.
Weiss, C. H., and Cambone, J. (1994). Principals, Shared Decision Making, and School Reform. Educational Evaluation and Policy Analysis, 16(3), 287–301.
Zhang, Y., Fashola, O., Shkolnik, J., and Boyle, A. (2006). The Implementation of Comprehensive School Reform and Its Impact on Increases in Student Achievement. Journal of Education for Students Placed at Risk, 11(3–4), 309–329.

Appendix A 75
APPENDIX A—DETAILED METHODOLOGY
PILOT STUDY
Site Selection
Researchers applied several criteria to select low-performing schools that experienced major increases in student achievement. The criteria included: at least 40 percent of the students scoring below proficiency on the state test; a dramatic increase in the number of students achieving proficiency the following year; an increase in the number of students achieving proficiency over the three years beyond the baseline year; the number of high-poverty students served; and the achievement of adequate yearly progress (AYP) for at least the last two years prior to the pilot study.
Researchers used multiple sources to identify potential schools for site visits. Data from the Academic Development Institute (ADI) database, supplemented by data from approximately 40 state education agency Web sites, were the primary sources. Furthermore, the researchers collected school data from the National Association of Secondary School Principals’ list of “breakthrough schools,” a list of principals recognized by the National Association of Elementary School Principals, and a list of award-winning principals. The U.S. Department of Education recommended additional candidates. By reviewing these sources against our criteria, the researchers selected nine sites. There was no requirement to select schools that received Comprehensive School Reform grants. Only two of the selected schools received the grants.
Although the original plan was to have a total of three schools at each level (elementary, middle, and high school), only two high schools met the criteria for inclusion. Consequently, the list of nine schools included two high schools, three middle schools, three elementary schools, and one school that serve kindergarten through eighth grade.
Interview protocols
WestEd developed a set of interview protocols to guide the onsite data collection. The instruments drew on existing research on CSR, LACIO findings and data collection experience, AIR’s data collection for the Study of State Implementation and Accountability and Teacher Quality under NCLB (SSI-NCLB), as well as the Turnaround Evidence Review authored by the Center for Innovation and Improvement. The pilot protocols were highly structured and lengthy. The instruments contained numerous specific questions and follow-up questions that left no opportunities to probe any responses. For example, the original principal interview protocol contained 23 primary questions and typically two to nine additional questions. Only one topic contained no additional questions.
Data Collection
A two-person WestEd and AIR team visited each site. The team spent most of each visit interviewing people individually. Interviewees at each site included a district contact, a new

Appendix A 76
teacher, an experienced teacher, a parent, a community partner, and a principal. Each interview took 40 to 60 minutes. The principals were interviewed twice for a total of 90 minutes.
Results
The researchers produced a site report for each of the nine schools visited. The Technical Work Group (TWG) then reviewed the process and the results and provided feedback to the researchers, making important suggestions to improve the process. The TWG recommended shortening the interview protocols to permit more open-ended responses. The group also recommended interviewing more teachers in groups (and offering to meet individually if requested) and recommended focus groups with parents and each school’s leadership team.
PRIMARY STUDY
Sampling Frame
For the primary study after the pilot, researchers selected initially low-performing schools that received a CSR grant and experienced achievement improvements. They used three data sources to create the sampling frame: the CSR universe file, the National Longitudinal School-Level State Assessment Score Database (NLSLSASD) data set, and the Common Core of Data (CCD) file. The NLSLSASD data set included school-level achievement data, which served as the primary basis for site selection. The CCD file was used to identify schools’ grade spans.
Researchers edited and merged data from these sources to create an initial site selection database. They cleaned the CSR universe data file to remove duplicate records, consortia, Bureau of Indian Affairs schools, schools in Puerto Rico, and schools with missing National Center for Education Statistics codes. Next, researchers merged the NLSLSASD data set with the CCD data to add a grade span variable to the test score data set in order to distinguish between elementary, middle, and high schools. Researchers then edited the resulting data set to remove all states that were missing the 1999–2000 baseline achievement data. A total of 10 states were deleted for this reason. These steps produced a file with 6,446 schools that encompassed all grade levels. Researchers then merged the two modified data sets and deleted non-operational schools, resulting in a data set of 5,035 CSR schools that had achievement data.
The next step was to identify low-performing schools based on 1999–2000 baseline school year achievement data. Because the majority of states were testing only one elementary grade and one middle grade, researchers based their site selection on achievement data for a single grade level. They examined the distributions of z-scores for reading and math and identified schools whose baseline reading and math achievement were in the bottom 50 percent of the initial schools. This process identified 1,037 initially low-performing elementary schools that had received a CSR grant and 506 middle schools.
To complete the sampling frame, the researchers needed to identify improved schools. While the emphasis was on schools that made quick, dramatic, and sustained gains, schools that made slow-and-steady progress were of interest also. Researchers identified rapid-improvement
Appendix A 77
schools on the basis of annual gains in standardized achievement scores from 1999–2000 to 2004–05. Researchers identified each school’s achievement score gain for each of the five years in this period in reading and separately in math, resulting in a total of 10 gain scores for each school. The researchers selected the top 50 percent of schools with gains in both subjects for each year in the study period. They analyzed all subsequent years following each gain period to ensure that no declines greater than 0.1 standard deviation occurred. They repeated the selection of the top 50 percent for each subject area and each school level for each year, creating a composite list that included all schools with annual gains and no single decreases greater than 0.1 standard deviation. The process produced a pool of 47 elementary schools for possible selection. However, these criteria did not yield any dramatically improving middle schools. Therefore the criteria for initially low-performing middle schools was expanded to include schools in the bottom 75 percent in reading and math. This added 403 schools for a total of 909 initially low-performing middle schools 81 showed dramatic improvements in reading, math, or reading and math (39 based on reading only, 34 based math only, and 8 in both reading and math).
The researchers next defined slow-and-steady schools as those initially low-performing schools not previously identified as demonstrating dramatic improvement but exhibiting an overall gain in either reading or math achievement from 1999–2000 to 2004–05 and with no single-year decline greater than 0.25 standard deviation. Researchers conducted separate analyses for each subject area and school level. This process generated a slow-and-steady school list of 53 elementary schools and 36 middle schools. Of the elementary schools 31 were identified based on reading, 19 based on math, and 3 based on both subjects. Among the middle schools, 15 were identified based on reading, 20 based on math, and 1 based on both subjects.
Site Selection
To produce the final list of sites, researchers applied additional restrictions to the identified schools. Researchers eliminated sites that had dramatic demographic shifts greater than 15 percentage points in federal lunch program participants or minority students. The researchers also used achievement data from state files to help select schools with the highest achievement levels in 2005 and 2006. Additionally, they had state officials confirm that gains were not artifacts of proficiency calculation changes. Also, schools that did not make AYP by 2006 were eliminated. Beyond these restrictions, researchers selected high-poverty schools with broad representation across states and locale types. All processes culminated in a list of 10 preferred sites (nine elementary schools and one middle school) as well as a list of eight alternate sites (six elementary schools, one middle, and one PK-12 school) to replace unavailable preferred sites.
Researchers then selected comparison schools that were initially low-performing and received a CSR award but made little or no improvement on standardized achievement measures from 1999–2000 to 2004–05. The researchers limited the pool of comparison schools to schools that received CSR awards within two years of the sample school. Researchers also examined all potential comparison schools to determine if they implemented the same CSR model as the sample school. The process yielded at least one comparison site for eight of the 10 preferred sites and four of the eight alternate sites. The researchers selected five of these sites for potential participation. All potential comparison sites were elementary schools since no comparison middle schools were identified.
Appendix A 78
After the initial identification of candidate schools for study, we examined updated achievement patterns from the selected schools using data through 2006–07 for all tested grades obtained from individual state education agency Websites. This effort informed the study’s qualitative process and also determined the accuracy of our original classification of schools. We also examined patterns in district and state achievement relative to those at the selected schools to determine how school-level achievement compared to achievement at the district and state levels. Using the percentages of students reaching proficiency in reading or English language arts and math on state assessments through spring 2007, along with the average district and state performance in the tested grades and subjects, we revised the description of schools’ achievement patterns in some sites to more accurately represent their standing through the latest year of the study. We also examined demographic data (e.g., school enrollment levels), along with the case study information, to assess whether factors other than school practices and strategies might have been strongly related to achievement patterns. Exhibit 3 lists the schools included in this study, their selected characteristics, and 2002–07 achievement patterns.
In the course of undertaking these more thorough examinations of school achievement patterns using more recent data, we found that the original distinction between comparison and sample schools did not hold. In particular, two schools initially selected as comparison sites were actually making substantial achievement gains during the time period that we were studying (2002–07). We therefore added these two schools to our case study sample, one as a rapid-improvement site and the other as a slow-and-steady site.
Site Recruitment and Preparation
To gain access to the identified schools, the researchers submitted formal applications to the respective school districts. Each packet included a detailed proposal with information about the purpose of the study, the selection process, the site visit process, and estimated time burden on the school. An appendix contained a copy of the informed consent form, all interview and focus group protocols, as well as Independent Review Board (IRB) documentation.
Gaining access to the schools was the next step. District officials disapproved two schools, one due to doubts about the improvement. Another school changed its grade configuration. Yet another requested a visit that could not be accommodated in the study time frame. A fifth school was eliminated due to its failure to provide necessary information. Researchers identified alternates for all schools. Of the resulting recruitment list of 10 sample schools and five comparison schools, researchers were able to ultimately recruit nine sample schools and two comparison schools. However, as noted earlier, subsequent data were reviewed that two schools initially recruited as comparison schools actually exhibited noteworthy improvements. They were thus retained as study sites resulting in a final list of 11 schools with no comparison sites.24 Eight of these were rapid-improvement, while three were slow-and-steady.
After receiving confirmation from the school principals, researchers sent a packet of materials to each school to help prepare for the visit. One document defined the participants for the various interviews and focus groups. Worksheets enabled the principals to list the people for each 24 While comparison sites would have strengthened the study, time constraints precluded additional recruitment efforts.

Appendix A 79
session and to schedule the sessions. A final list showed all documents that the site visitors would need.
Instrumentation
Based on the TWG’s recommendations following the pilot study, the researchers shortened the pilot protocols and made them less structured to permit more open-ended responses. Researchers also developed interview and focus group protocols for school leaders, teachers, support staff, parents, community partners, and school district officials (see Appendix B).
Research staff from WestEd and AIR volunteered to serve as the site visitors. The study staff created additional documents to help site visitors organize their data and to provide a uniform structure for reporting. An analytic table provided a structure to capture the key features of CSR components and the turnaround framework and to assist site visitors in organizing and synthesizing data collected onsite. Also, the table provided a uniform format to assist with the cross-site analysis. In addition to generating a general description of the site, site visitors had to identify the site’s distinguishing features and catalysts.
Researchers developed a report outline to enable site visitors to provide consistent reports. The report outline included an introduction, school characteristics, findings, a school improvement chronology, and descriptions of the individual topics in the analytic table. Furthermore, the outline required site visitors to analyze the relationships between actions and processes as well as to draw conclusions.
A one-day training for site visitors introduced them to the study framework, the protocols, and the project timeline. Researchers created the analytic table and report outline after the training.
Data Collection
The researchers formed two-person site visit teams with no more than one junior researcher per team. Each team, with one exception, included one researcher from WestEd and one from AIR.
A total of 13 site visitors completed at least one site visit. At least one visitor to each of the two comparison schools also visited the corresponding sample school. Site visits typically lasted for two to three school days. All initial visits were conducted from mid-November 2007 through Feb. 1, 2008. Almost all subsequent follow-up activities were conducted via telephone and e-mail.
In appreciation for their participation, each school received $200 following the initial site visit. Because many staff, but not all, participated in the process, the study team decided a school gratuity was more appropriate than individual gratuities.
Appendix A 80
Data Analysis
Case Study Reports
Site visitors collected an enormous amount of information from each site. They analyzed their notes and documents to produce an account of the school improvement chronology and related factors. All information in the narrative report was expected to be verifiable through information in the analytic table. Site teams completed their draft reports between late December 2007 and early March 2008. At least one researcher from each organization reviewed each report. Typically, three to four people reviewed each report, and at least two provided comments to the site visitors. The site visitors and report reviewers participated in telephone conference calls to discuss each draft report. The initial call focused on one report, then subsequent calls focused on two reports in order for site visitors to become aware of practices and challenges in other schools. More importantly, the calls provided site visitors with general and specific recommendations to improve their reports. Site visit teams completed final case study reports after addressing all issues from the review process.
Cross-Site Report
A seven-person writing team developed the cross-site report. Participants had reviewed the majority of the case study reports, and two of the members had conducted site visits. The writing team held conference calls to discuss issues and to ensure progress of the report development.
To begin the collective discussion of the individual case studies, all site visitors met with the writing team. In preparation for that meeting, the writing team asked site visitors to consider whether the school was a low-performing school that improved and whether the achievement changes were different from the rest of the state. The team also asked site visitors to consider staff changes, student changes, and resource infusions before focusing on reported reforms. In response, site visitors generated brief summaries that served as the basis for discussion with the writing team, helping identify specific areas that required additional follow-up activity at each site and helping generate an initial list of cross-site themes. (See Appendix C for cross-site summaries).
Writing team members also met with the TWG to gain additional perspectives on the main stories for each site and on the cross-site report. In preparation for this meeting, the writing team constructed site abstracts from the available draft reports and the brief summaries prepared for the cross-site meeting. Writing team members consulted with site visitors as needed to provide additional details. Abstracts provided contextual information, a description of the achievement trends, and a description of school activities.
Consistent with the original plans for this study, site visitors developed vignettes to illustrate the cross-site themes. Each site visit team determined which themes were most important to their school’s achievement growth. Some of the vignettes required additional follow up with the school.

Appendix B 81
APPENDIX B—DATA COLLECTION INSTRUMENTS
Informed Consent Form .................................................................................................82
Community Member Focus Group Protocol.................................................................84
Current Principal/Assistant Principal Protocol............................................................86
Curriculum/Instructional Specialist Interview Protocol..............................................88
District Curriculum Specialist Protocol.........................................................................90
District Official Interview Protocol................................................................................92
Document Review Checklist............................................................................................94
ELA/Mathematics Department Chair Interview Protocol ..........................................95
Experienced Principal Interview Protocol.....................................................................97
Experienced Teacher Focus Group Protocol ..............................................................100
Guidance Counselor Interview Protocol......................................................................103
New Teacher Focus Group Protocol ............................................................................105
Parent Focus Group Protocol .......................................................................................107
School Improvement Plan (SIP)/Leadership Team Focus Group Protocol .............109

OMB No. 1875-0222-v.3 Approval expires 12/31/2008 Appendix B 82
Exhibit B.1
Informed Consent Form
LACIO—TURNAROUND CASE STUDIES
This study of “turnaround” schools is sponsored by the U.S. Department of Education, and is being conducted by WestEd and American Institutes for Research (AIR).
1. Purpose: The purpose of this study is to learn about how schools have successfully “turned around” from low performance to high performance in a short time.
2. Procedures to be followed: We will review documents and interview key informants who will be invited to participate in the study. All audio tape recordings and notes will be coded without reference to school or informant name. As a key informant, we will ask you questions about the school’s vision and goals, its successes and challenges, including specific questions regarding noticeable changes in the school during the interview or focus group. These interviews will be audiotaped to ensure that all information is accurately captured with your verbal consent.
3. Benefits: Your participation in the study will help us understand the accomplishments and challenges in school restructuring. This understanding will support future research, policy, and education planning. There are no direct benefits to you as an individual of participating in this study.
4. Risks and Discomforts: Research reports will not identify schools by name, nor will research participants be identified by name. However, roles of participants within school communities will be presented. Because there are a limited number of schools involved in this study, we may not be able to protect the confidentiality of your comments if you have a unique role in your school (such as principal, superintendent, PTA president). Participation in a focus group will affect the confidentiality of your responses, in that, other participants in the focus group will hear your responses. If you are uncomfortable with the focus group at any time, you may select not to participate or you may request a one-on-one interview with the site visitors. There are no other anticipated risks in participating in this study.
5. Time required: Interviews will last between 45–90 minutes.
6. Confidentiality: All of the information we gather during the interviews, focus groups, and document reviews will be held confidential. We are required to share our findings (not the data) with the study’s sponsor (the U.S. Department of Education) in a report.
a. We will not use your name or any other identifiable information in any written reports resulting from the study. We will replace your name with a pseudonym during the data collection and analysis process to ensure that the information you give us remains confidential. As the school name will

OMB No. 1875-0222-v.3 Approval expires 12/31/2008 Appendix B 83
also be reported with a pseudonym, you will not be identifiable in reporting. Regardless, you have the right to stop all interviews and recordings at anytime during the interview and speak off the record.
b. Only AIR and WestEd staff will have access to your interview responses. All information gathered from interviews, including audiotapes, will be stored in a locked file cabinet or restricted (password protected) computer file.
c. These data will not be used in any other study. All data and materials, including audio tapes and written statements, will be securely disposed of three years after completion of this study.
7. Right to Ask Questions: For more information about this study, you may contact Lauren Davis Sosenko at (562)799-5476 or [email protected]. For questions regarding your rights as a research participant, you may contact Independent Review Consulting at 1-800-472-3241 or [email protected].
8. Voluntary Participation: Your participation in the study is voluntary; you have the right to withdraw from the study at any time. You do not have to answer any question that you do not want to answer. You will face no penalty or loss of benefits to which you are entitled if you refuse to participate in this study. If you refuse to participate or drop out, your relationship with your school system will not be harmed.
By signing this form, you are indicating that you have read and understood the information provided to you about your participation in this study and you agree to participate in the study, including being audiotaped. Print Participant’s Name: _____________________________________________________
Participant’s Signature: _________________________________ Date: ________________
Note: participant must be given a blank copy of this form to keep.

OMB No. 1875-0222-v.3 Approval expires 12/31/2008 Appendix B 84
Exhibit B.2
Community Member Focus Group Protocol 1. Tell me a little about how you came to be involved in the school.
[Probes: Who encouraged your involvement? Did the encouragement come from the school or district? A community organization?]
2. In what capacity are you involved with the school?
[Probes: Are you involved in supporting school actions at board meetings and other public events, providing services to students within the school, providing materials and equipment. For how long?]
3. With whom at the school do you interact? How often? On what topics? Has this changed over the period during which you have worked with the school? If so, when did the change take place?
[Probe to identify parties with whom they communicate: Principal? Teachers? Parents? Students? Community liaisons? Has the school given you data about student achievement?)]
[Probe to identify topics: Student achievement? Data? Student behavior? Parental involvement? School facilities?]
4. What would I have seen had I come to this school five years ago? How are things different now? Who or what prompted changes at the school? (N/A if the respondent has been working with the school for fewer than five years).
5. In general, how do you feel about the school? Has your impression changed over time? If so, what caused the change? What is the school’s reputation in the district? Compared to other schools?
6. How are community members made aware of the school’s vision, plans, and goals? Are you aware of any school accomplishments? Problems? How are the problems and accomplishments communicated? By whom?

OMB No. 1875-0222-v.3 Approval expires 12/31/2008 Appendix B 85
7. What role do community members play in the implementation of school activities?
[Probes: In what way do they support instructional improvement? Are community members involved in planning, implementing, or evaluation school activities? If so, how?]
8. Is there anything else I should know to tell the story of the school’s improvement efforts?

OMB No. 1875-0222-v.3 Approval expires 12/31/2008 Appendix B 86
Exhibit B.3
Current Principal/Assistant Principal Interview Protocol 1. Tell me little about yourself.
[Probe: When did you come to the school? What is your educational background? How many years have you been a principal? At this school? Do you have prior experience or training working with low-performing schools or students?]
2. Are you aware of any major school improvement efforts that occurred before you came to this school? If yes, are you aware if these reforms were comprehensive? Why they were selected?
[Probes for turnaround schools: Were you aware of the turnaround that occurred in student achievement? Who or what do you think was responsible for the turnaround?]
[Probe for comparison sites: Which of the school improvement efforts had the most significant effects on student achievement?]
[Probe at all schools for the existence of a research base and source of information about that base, as well as parental involvement in decision making and coordination of resources.]
3. What was the school like when you arrived?
[Probes: What were the school’s strengths? Weaknesses? What was the student achievement profile? What were the teachers like? What was the general climate of the school? What was the relationship between the school and the district? Were reform efforts underway? If so, what were they? How were they working? Have they changed? If so, what influenced the change(s)?]
4. Have any changes been made in the overall approach to reform since you arrived? If so, on what basis were they made? To what extent did school-based data influence these changes? What has been the reaction of staff? Of parents? Of the central office? How frequently have changes been made?
5. Are the actions to improve student achievement monitored? If so, how?
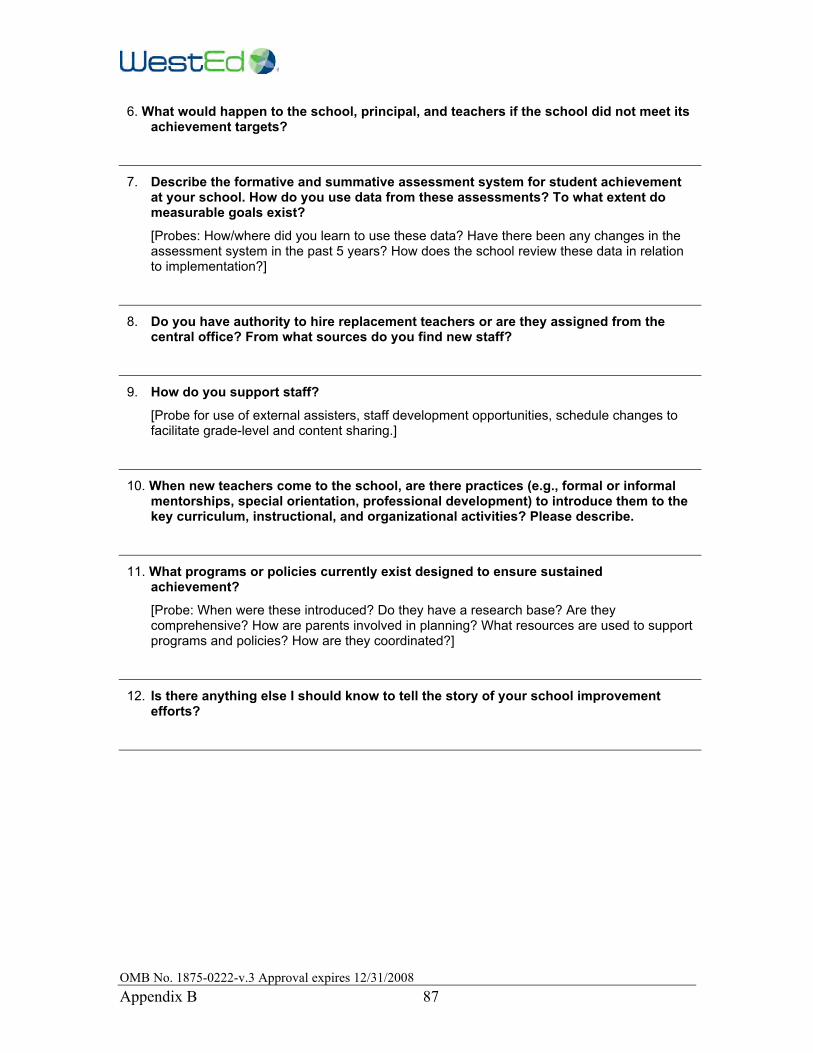
OMB No. 1875-0222-v.3 Approval expires 12/31/2008 Appendix B 87
6. What would happen to the school, principal, and teachers if the school did not meet its achievement targets?
7. Describe the formative and summative assessment system for student achievement at your school. How do you use data from these assessments? To what extent do measurable goals exist?
[Probes: How/where did you learn to use these data? Have there been any changes in the assessment system in the past 5 years? How does the school review these data in relation to implementation?]
8. Do you have authority to hire replacement teachers or are they assigned from the central office? From what sources do you find new staff?
9. How do you support staff?
[Probe for use of external assisters, staff development opportunities, schedule changes to facilitate grade-level and content sharing.]
10. When new teachers come to the school, are there practices (e.g., formal or informal mentorships, special orientation, professional development) to introduce them to the key curriculum, instructional, and organizational activities? Please describe.
11. What programs or policies currently exist designed to ensure sustained achievement?
[Probe: When were these introduced? Do they have a research base? Are they comprehensive? How are parents involved in planning? What resources are used to support programs and policies? How are they coordinated?]
12. Is there anything else I should know to tell the story of your school improvement efforts?
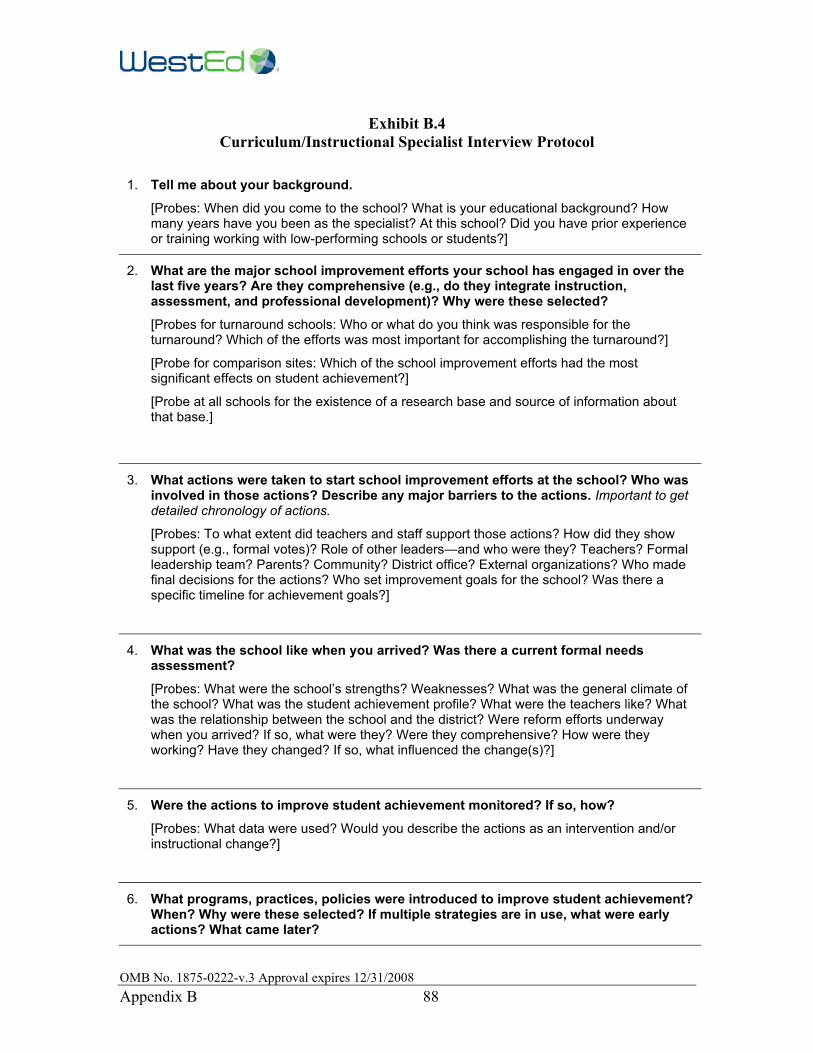
OMB No. 1875-0222-v.3 Approval expires 12/31/2008 Appendix B 88
Exhibit B.4
Curriculum/Instructional Specialist Interview Protocol 1. Tell me about your background.
[Probes: When did you come to the school? What is your educational background? How many years have you been as the specialist? At this school? Did you have prior experience or training working with low-performing schools or students?]
2. What are the major school improvement efforts your school has engaged in over the last five years? Are they comprehensive (e.g., do they integrate instruction, assessment, and professional development)? Why were these selected?
[Probes for turnaround schools: Who or what do you think was responsible for the turnaround? Which of the efforts was most important for accomplishing the turnaround?]
[Probe for comparison sites: Which of the school improvement efforts had the most significant effects on student achievement?]
[Probe at all schools for the existence of a research base and source of information about that base.]
3. What actions were taken to start school improvement efforts at the school? Who was involved in those actions? Describe any major barriers to the actions. Important to get detailed chronology of actions.
[Probes: To what extent did teachers and staff support those actions? How did they show support (e.g., formal votes)? Role of other leaders—and who were they? Teachers? Formal leadership team? Parents? Community? District office? External organizations? Who made final decisions for the actions? Who set improvement goals for the school? Was there a specific timeline for achievement goals?]
4. What was the school like when you arrived? Was there a current formal needs assessment?
[Probes: What were the school’s strengths? Weaknesses? What was the general climate of the school? What was the student achievement profile? What were the teachers like? What was the relationship between the school and the district? Were reform efforts underway when you arrived? If so, what were they? Were they comprehensive? How were they working? Have they changed? If so, what influenced the change(s)?]
5. Were the actions to improve student achievement monitored? If so, how?
[Probes: What data were used? Would you describe the actions as an intervention and/or instructional change?]
6. What programs, practices, policies were introduced to improve student achievement? When? Why were these selected? If multiple strategies are in use, what were early actions? What came later?

OMB No. 1875-0222-v.3 Approval expires 12/31/2008 Appendix B 89
[Probes: On what basis were these selected? To what extent did the research base influence the selection of strategies? To what extent did school-based data influence the selection?]
7. What resources were used to support the actions taken to improve student achievement? Were additional resources needed? Where did they come from? Were they coordinated?
[Probes: Federal, state, district, philanthropic, or other sources? Use of both fiscal and human resources? Resources reallocated? School autonomy in budgeting?]
8. How did staff react to the plans for improvement? To what extent were they involved in the decisions?
[Probes: Did staff support or resist the plans for improvement? How? How was staff resistance overcome? Were there any staff changes or turnover? If yes, what were the reasons for these staff changes? What is the process for replacing (hiring new) teachers? How did the staff turnover affect the process?]
9. What support did teachers receive to help them successfully implement school improvement efforts? When? How were the teachers motivated to participate in the reform?
[Probes: Help from people outside the school (e.g., model developers, consultants)? Professional development? Opportunities to meet as grade-level or content teams? Teacher incentives?]
10. When new teachers come to the school, are there practices (e.g., formal or informal mentorships, special orientation, professional development) to introduce them to the key curriculum, instructional, and organizational activities? If so, when were these practices introduced?
11. Describe the formative and summative assessment system for student achievement at your school. How do you use data from these assessments? To what extent do measurable goals exist?
[Probes: How/where did you learn to use these data? Have there been any changes in the assessment system in the past 5 years? How does the school review these data in relation to implementation of the reform effort?]
12. How did the district office react to the changes in the school?
[Probes: How did it support or inhibit reform actions? Did you encounter any resistance from the district office or school board in implementing the actions? If so, what actions were taken to overcome the resistance?]
OMB No. 1875-0222-v.3 Approval expires 12/31/2008 Appendix B 90
Exhibit B.5
District Curriculum Specialist Protocol
1. We are examining efforts to improve student achievement over the past five years. Are you aware of any improvements in student achievement in the last five years? What do you think accounts for this improvement?
[Probes for turnaround school: Did the district intentionally seek to turn the school around? If so, what steps did the district take to make changes in practices at the school? Were they comprehensive? Was there a change in leadership or staff? Did the district provide staff development for teachers, change curriculum, engage external assistance? When? Did the district set specific expectations? Timeframe for improvement? Existence of a research base?]
[Probes for comparison school: Did the district intentionally target this school for improvement efforts? If so, what steps did the district take to make changes in practices at the school? Were they comprehensive? Was there a change in leadership or staff? Did the district provide staff development for teachers, change curriculum, engage external assistance? When? Did the district set specific expectations? Timeframe for improvement? Existence of a research base?]
2. Please tell me a little about yourself and your relationship with the school.
[Probes: How long have you been with the district? How long have you been at the central office? What previous positions did you hold in this district or in other districts?]
3. How well did the actions fit with district policies? Did any conflict with district policies and practices? If so, how did the principal act in the conflict? The central office? Were any waivers to district policies granted? To the union contract?
4. Did the district monitor progress toward meeting student achievement goals differently for this school from how it monitors other schools? If so, please describe the differences.
[Probes: Is more intense attention paid to this school? If so, how is that intensity shown? Does it still monitor progress differently?]
5. What support did the district provide to the school to encourage change in student achievement? What supports are in place to ensure continuous improvement? Do these differ from supports provided to other schools in the district? If so, what is the rationale for the difference? How are these resources coordinated?
[Probes: Support such as extra staff, targeted financial resources, additional fiscal resources, policy changes, assistance from external agencies? Rationale such as to stimulate change? To reward positive outcomes?]
6. Have the school’s goals or plan to achieve the goals changed over the last five
OMB No. 1875-0222-v.3 Approval expires 12/31/2008 Appendix B 91
years? If so, how? What was the rationale for the change(s)? To what extent do measurable goals exist?
[Probes: Challenges in implementing the original plan, changes in state or district policies, focus on new priorities because of the successes in the first area(s) of focus.]
[Probe for turnaround schools: Have the goals or plans changed in light of improvements in achievement over time?]
7. What programs, practices, policies were introduced at the school to improve student achievement? When? Are they comprehensive (e.g., do they integrate instruction, assessment, and professional development)? Why were these selected? If multiple strategies are in use, what were early actions? What came later?
[Probes: On what basis were these selected? To what extent did the research base influence the selection of strategies? To what extent did school-based data influence the selection?]
8. What professional development is available to teachers to support improvement? Who provides this professional development
[Probes: External assistance providers? District? School-site staff?]
9. Describe the formative and summative assessment system for student achievement in the district. How do you use data from these assessments?
[Probes: How/where did you learn to use these data? Have there been any changes in the assessment system in the past 5 years?]
10. How did the district office react to the changes in the school?
[Probes: How did it support or inhibit reform actions? Did you encounter any resistance from the district office or school board in implementing the actions? If so, what actions were taken to overcome the resistance?]
11. Is there anything else I should know to tell the story of your school improvement efforts?

OMB No. 1875-0222-v.3 Approval expires 12/31/2008 Appendix B 92
Exhibit B.6
District Official Interview Protocol 1. Please tell me a little about yourself and your relationship with the school.
[Probes: How long have you been with the district? How long have you been at the central office? What previous positions did you hold in this district or in other districts?]
2. We are examining efforts to improve student achievement over the past five years. Are you aware of any improvements in student achievement in the last five years? What do you think accounts for this improvement?
[Probes for turnaround school: Did the district intentionally seek to turn the school around? If so, what steps did the district take to make changes in practices at the school? Were these efforts comprehensive changes? Was there a change in leadership or staff? Did the district provide staff development for teachers, change curriculum, engage external assistance? When? Did the district set specific expectations? Timeframe for improvement? Existence of a research base and source of information about that base?]
[Probes for comparison school: Did the district intentionally target this school for improvement efforts? Were these efforts comprehensive changes? If so, what steps did the district take to make changes in practices at the school? Was there a change in leadership or staff? Did the district provide staff development for teachers, change curriculum, engage external assistance? When? Did the district set specific expectations? Timeframe for improvement? Existence of a research base and source of information about that base?]
3. What actions has the principal taken to improve the school? When were these actions taken? To what extent did the central office drive these actions? Teachers? Parents? Community members?
[Probes: To what extent did teachers and staff support those actions? How did they show support (e.g., formal vote)? Does the principal have autonomy in hiring, budgeting, and curriculum decisions? Same or different from other schools in the district? If yes, has the level of autonomy changed over time?]
4. How well did the actions fit with district policies? Did any conflict with district policies and practices? If so, how did the principal act in the conflict? The central office? Were any waivers to district policies granted? To the union contract?
5. Did the district monitor progress toward meeting student achievement goals differently for this school from how it monitors other schools? If so, please describe the differences.
[Probes: Is more intense attention paid to this school? If so, how is that intensity shown?] Does it still monitor progress differently?
OMB No. 1875-0222-v.3 Approval expires 12/31/2008 Appendix B 93
6. What support did the district provide to the school to encourage change in student achievement? What supports are in place to ensure continuous improvement? Do these differ from supports provided to other schools in the district? If so, what is the rationale for the difference?
[Probes: Support such as extra staff, targeted financial resources, additional fiscal resources, policy changes, assistance from external agencies, and professional development? Rationale such as to stimulate change? To reward positive outcomes?]
7. What resources were used to support the actions taken to improve student achievement? Were additional resources needed? Where did they come from? Were they coordinated?
[Probes: Federal, state, district, philanthropic, or other sources? Use of both fiscal and human resources? Resources reallocated? School autonomy in budgeting?]
8. Have successes, challenges, or failures in the efforts to stimulate high student achievement been documented? If so, how is the documentation used? What data are used to document the successes, challenges, and failures? Are these data reviewed in relation to implementation?
[Probes: Are successes celebrated? If so, how? Are failures used to change policies and practices?]
9. Have there been any changes to school leadership in the last five years? If so, what led to the personnel change? What were the qualities seen in the current principal that made you (or others in the central office) think he/she was an appropriate person for the job?
10. Have the school’s goals or plan to achieve the goals changed over the last five years? If so, how? What was the rationale for the change(s)? To what extent do measurable goals exist?
[Probes: Challenges in implementing the original plan, changes in state or district policies, focus on new priorities because of the successes in the first area(s) of focus, use of evaluation of implementation or impact of reform]
[Probe for turnaround schools: Have the goals or plans change in light of improvements in achievement over time?]
11. How much staff turnover has there been in the school? Why have staff members left?
12. Is there anything else I should know to tell the story of the school’s improvement efforts?

OMB No. 1875-0222-v.3 Approval expires 12/31/2008 Appendix B 94
Exhibit B.7
Document Review Checklist School code:
1. Resumes of key staff during the period of turnaround (Note: public school employees frequently do not have current resumes. If the resumes are not available, use information from the interview questions about the principal’s and other school leaders’ backgrounds.)
2. The school improvement plan (SIP) or similar document
3. Curriculum guides (or a summary)
4. Pacing schedules
5. Descriptions of assessments and the schedule on which they are administered
6. School schedule (include instructional minutes)
7. Contracts with outside assisters such as model developers or consultants, OR a list of the outside assistance received including topics and frequency of assistance
8. District policy and procedures manual, particularly as relates to hiring and budgeting
9. Any evaluations conducted for special projects that relate to the school
10. Examples of internal school data reports, particularly those that show longitudinal trends in student achievement.
NOTES:
OMB No. 1875-0222-v.3 Approval expires 12/31/2008 Appendix B 95
Exhibit B.8
ELA/Mathematics Department Chair Interview Protocol School code: Interviewer:
1. How long have you been a coach or department chair? How long did you teach? What
grade levels/subjects? At this school? What brought you to this school?
2. What are the major school improvement efforts your school has engaged in over the last five years? Are they comprehensive (e.g., do they integrate instruction, assessment, and professional development)?
[Probes for turnaround schools: Who or what do you think was responsible for the turnaround in student achievement? Which of the efforts was most important for accomplishing the turnaround?]
[Probe for comparison schools: Which of the school improvement efforts had the most significant effects on student achievement?]
[Probe all schools for the existence of a research base and source of information about the base.]
3. Please describe your role at the school.
[Probe: With whom do you interact? How often? What services do you provide?]
4. What programs, practices, policies were introduced to improve student achievement? When? Why were these selected? If multiple strategies are in use, what were early actions? What came later?
[Probes: On what basis were these selected? To what extent did the research base influence the selection of strategies? To what extent did school-based data influence the selection? How are they linked to goals for school improvement?]
5. How did staff react to the plans for improvement? To what extent were they involved in the decisions?
[Probes: Did staff support or resist the plans for improvement? How? How was staff resistance overcome? Were there any staff changes or turnover? If yes, what were the reasons for these staff changes? What is the process for replacing (hiring new) teachers? How did the staff turnover affect the process?]
6. How did you support staff as they sought to implement the change?
[Probes: Use of external assisters, staff development opportunities, schedule changes to facilitate grade-level and content sharing?]

OMB No. 1875-0222-v.3 Approval expires 12/31/2008 Appendix B 96
7. When new teachers come to the school, are there practices (e.g., formal or informal mentorships, special orientation, professional development) to introduce them to the key curriculum, instructional, and organizational activities? If so, when were these practices introduced?
8. Describe the formative and summative assessment system for student achievement at your school. How do you use data from these assessments? To what extent do measurable goals exist?
[Probes: How/where did you learn to use these data? Have there been any changes in the assessment system in the past 5 years? How does the school review these data in relation to implementation?]
9. What programs or policies currently exist designed to ensure sustained achievement?
[Probes: When were these introduced? Do they have a research base? Are they comprehensive?]
10. Is there anything else I should know to tell the story of your school improvement efforts?

OMB No. 1875-0222-v.3 Approval expires 12/31/2008 Appendix B 97
Exhibit B.9
Experienced Principal Interview Protocol School
code: Interviewer:
1. Tell me about your background.
[Probes: When did you come to the school? What is your educational background? How many years have you been a principal? At this school? Did you have prior experience or training working with low-performing schools or students?]
2. What major school improvement efforts has your school engaged in over the last five years? Are they comprehensive (e.g., do they integrate instruction, assessment, and professional development)? Why were these selected?
[Probes for turnaround schools: Who or what do you think was responsible for the turnaround? Which of the efforts was most important for accomplishing the turnaround?]
[Probe for comparison sites: Which of the school improvement efforts had the most significant effects on student achievement? Who or what was responsible for this effort?]
[Probe at all schools for the existence of a research base and source of information about that base.]
3. What actions were taken to initiate school improvement efforts at the school? Who was involved in those actions? Describe any major barriers to the actions. Important to get detailed chronology of actions.
[Probes: To what extent did teachers and staff support those actions? How did they show support (e.g., formal votes)? Who were the leaders and what was their role (e.g., principal, teachers, formal leadership team, parents, community, district office, external organizations)? Who made final decisions for the actions? Who set improvement goals for the school? Was there a specific timeline for achievement goals?]
4. What was the school like when you arrived? Was there a current formal needs assessment?
[Probes: What were the school’s strengths? Weaknesses? What was the general climate of the school? What was the student achievement profile? What were the teachers like? What was the relationship between the school and the district? Were reform efforts underway when you assumed the principalship? If so, what were they? Were they comprehensive? How were they working? Have they changed? If so, what influenced the change(s)?]
5. Were the actions to improve student achievement monitored?
[Probes: What data were used? Would you describe the actions as an intervention and/or instructional change?]
OMB No. 1875-0222-v.3 Approval expires 12/31/2008 Appendix B 98
6. What programs, practices, policies were introduced to improve student achievement? When? Why were these selected? If multiple strategies are in use, what were early actions? What came later?
[Probes: On what basis were these selected? To what extent did the research base influence the selection of strategies? To what extent did school-based data influence the selection?]
7. What resources were used to support the actions taken to improve student achievement? Were additional resources needed? Where did they come from? Were they coordinated?
[Probes: Federal, state, district, philanthropic, or other sources? Use of both fiscal and human resources? Resources reallocated? School autonomy in budgeting?]
8. How did staff react to the plans for improvement? To what extent were they involved in the decisions?
[Probes: Did staff support or resist the plans for improvement? How? How was staff resistance overcome? Were there any staff changes or turnover? If yes, what were the reasons for these staff changes? What is the process for replacing (hiring new) teachers? How did the staff turnover affect the process?]
9. How did you support staff as they sought to implement the change?
[Probes: Use of external assisters, staff development opportunities, schedule changes to facilitate grade-level and content sharing?]
10. When new teachers come to the school, are there practices (e.g., formal or informal mentorships, special orientation, professional development) to introduce them to the key curriculum, instructional, and organizational activities? If so, when were these practices introduced?
11. Describe the formative and summative assessment system for student achievement at your school. How do you use data from these assessments? To what extent do measurable goals exist?
[Probes: How/where did you learn to use these data? Have there been any changes in the assessment system in the past 5 years? How does the school review these data in relation to implementation of the reform effort?]
12. How did the district office react to the changes in the school?
[Probes: How did it support or inhibit reform actions? Did you encounter any resistance from the district office or school board in implementing the actions? If so, what actions were taken to overcome the resistance?]

OMB No. 1875-0222-v.3 Approval expires 12/31/2008 Appendix B 99
13. How were parents involved in planning and implementing the changes? How did they react to them?
[Probes: How did they learn about the changes? From whom? How did they support or inhibit reform actions? Did you encounter any resistance from them? If so, what actions were taken to overcome the resistance?]
14. What programs or policies currently exist designed to ensure sustained achievement?
[Probes: When were these introduced? Do they have a research base? Are they comprehensive?]
15. Is there anything else I should know to tell the story of your school improvement efforts?

OMB No. 1875-0222-v.3 Approval expires 12/31/2008 Appendix B 100
Exhibit B.10
Experienced Teacher Focus Group Protocol School code: Interviewer:
1. What grade (subject, for middle and high school) do you teach? How long have you taught? At this school? What brought you to this school?
2. What major school improvement efforts has your school engaged in over the last five years? Are they comprehensive (e.g., do they integrate instruction, assessment, and professional development)? Why were these selected?
[Probes for turnaround schools: Who or what do you think was responsible for the turnaround in student achievement? Which of the efforts was most important for accomplishing the turnaround?]
[Probe for comparison schools: Which of the school improvement efforts had the most significant effects on student achievement? Who or what was responsible for this effort?]
[Probe at all schools for the existence of a research base and source of information about that base.]
4. Now, please tell me a little about what I would have seen had I come to this school five years ago.
[Probes: How would you characterize the student body? What was the school “vision?” Were there earlier efforts at reform? Please tell me a little about them and their success or failure.]
4. Are things different now?
[Probes: The student body? The school vision?]
6. During the first year of implementing the major school improvement efforts, how was progress assessed?
[Probes: By whom? Did the assessment include looking at the extent to which the vision was enacted in practice? How did the principal assess progress? How did teachers? Do similar assessments take place now? How is the school’s progress currently assessed?]
6. What would have happened to the school, principal, and teachers if the school did not meet its achievement targets in the past? Is it the same now?
OMB No. 1875-0222-v.3 Approval expires 12/31/2008 Appendix B 101
7. How did teachers react or respond to the changes in school improvement efforts?
[Probes: Were any teachers particularly supportive? If so, how did they show their support? Did any teachers resist the changes? If so, how was the resistance dealt with?]
8. What support did teachers receive to help them successfully implement school improvement efforts? When? How were the teachers motivated to participate in the reform?
[Probes: Help from people outside the school (e.g., model developers, consultants)? Professional development? Opportunities to meet as grade-level or content teams? Teacher incentives?]
10. Describe the assessments used to measure student progress. To what extent do measurable goals exist?
[Probes: When were they instituted? How often are they administered? Has this changed? Was training provided in analyzing and using data? If so, who provided the training? What happens with the information from the assessments?]
[Probes: Schoolwide, grade-level, or subject area? Were data used for instructional change? To provide individualized support to students? Are they currently used in the same way?]
10. Is there a pacing schedule? When was it initiated or revised? Does it help you with your instruction? Is it monitored? If so, by whom? What happens if you are not on schedule?
11. In the past, was there common planning time? Has the schedule changed in the last 5 years? If so, when?
[Probes: Grade-level planning? Subject area planning? Cross-disciplinary planning? Were data introduced? If yes, what data? Do the results lead to changes in classroom practice? Does the school schedule support collaboration?]
12. What resources were used to support the actions for improvement? If so, how have the resources been used? How were they coordinated?
[Probes: Purchase supplemental classroom materials? Extend professional development? Establish new positions to support the changes? Extend the school day?]
13. When you came to the school, what orientation and support were given? Has this changed for new teachers?
14. Are there factors that help or hinder the ongoing improvement of the school? What are the main distracters you feel that keep you from achieving school goals?
[Probe for specific distracters, which can range from interruptions to parent problems]

OMB No. 1875-0222-v.3 Approval expires 12/31/2008 Appendix B 102
15. How were parents involved in planning and implementing the changes? How did they react to them?
[Probes: How did they learn about the changes? From whom? How did they support or inhibit reform actions? Did you encounter any resistance from them? If so, what actions were taken to overcome the resistance?]
16. Is there anything else I should know to tell the story of your school improvement efforts?

OMB No. 1875-0222-v.3 Approval expires 12/31/2008 Appendix B 103
Exhibit B.11 Guidance Counselor Interview Protocol
School code: Interviewer: 1. Tell me about your background.
[Probes: When did you come to the school? What is your educational background? How many years have you been a counselor? At this school? Did you have prior experience or specific training working with low-performing schools or students?]
2. What is your role in the school? In school improvement efforts?
[Probes: Who do you interact with?]
3. What major school improvement efforts has your school engaged in over the last five years? Are they comprehensive? Why were they selected?
[Probes for turnaround schools: Who or what do you think was responsible for the turnaround? Which of the efforts was most important for accomplishing the turnaround?]
[Probe for comparison sites: Which of the school improvement efforts had the most significant effects on student achievement? Who or what was responsible for this effort?]
[Probe at all schools for the existence of a research base and source of information about the base.]
4. How did staff react to the plans for improvement?
[Probes: Did staff support or resist the plans for improvement? How? How was staff resistance overcome? Were there any staff changes or turnover? If yes, what were the reasons for these staff changes? What is the process for replacing (hiring new) teachers? How did the staff turnover affect the process?]
5. How was the school staff supported to implement the report efforts? Who provided this support?
[Probes: What professional development is available to staff? How are external assistance providers involved? Administrators? District staff?]
6. What was the school climate like when you arrived?
[Probes: What were the school’s strengths? Weaknesses? What were the teachers like? What was the relationship between staff like? Between staff and students? What was the relationship between the school and the district?]
OMB No. 1875-0222-v.3 Approval expires 12/31/2008 Appendix B 104
7. Has the school climate changed over the last 5 years? If so, in what ways? Who or what were the catalysts for these changes?
8. Please describe the level of parental involvement. What factors contribute to the level of parental involvement you described?
[Probe for specific examples of parental involvement in reform efforts, curriculum decisions, and presence in the school. Probe for changes in the approach to encouraging parental involvement.]
9. Describe the formative and summative assessment system for student achievement at your school. How do you and other staff members use data from these assessments? To what extent, do measurable goals exist?
[Probes: How/where did you learn to use these data? Have there been any changes in the assessment system in the past 5 years?]
10. Is there anything else I should know to tell the story of your school improvement efforts?
OMB No. 1875-0222-v.3 Approval expires 12/31/2008 Appendix B 105
Exhibit B.12 New Teacher Focus Group Protocol
School code: Interviewer:
1. What grade (subject, for middle and high school) do you teach? How long have you
taught? At this school? What brought you to this school?
2. Are you aware of any school improvement efforts that occurred before you came to this school? Are they comprehensive (e.g., do they integrate instruction, assessment, and professional development)? Why were these selected?
[Probes for turnaround schools: Were you aware of the turnaround in student achievement? Who or what do you think was responsible for the turnaround? Did a research base and sources of information about that base exist?]
[Probe for comparison schools: Which of the school improvement efforts had the most significant effects on student achievement? Did a research base and sources of information about that base exist?]
3. What are the two or three most important strategies for improving student achievement? How were they introduced? In what venues? By whom? What is their focus?
[Probes: Curriculum? Instructional practices? Student assignments? To what extent did teachers and staff support those actions? How did they show support (e.g., formal votes)? Do the strategies have a know research base?]
4. What is the “vision” for the school? How is the vision communicated? Has the vision been modified since you came to the school?
5. How are teachers evaluated? Are teachers held accountable for results? What happens if a teacher does not produce the desired results? What data are used to determine whether the teacher has produced the desired results?
6. What support do teachers receive to help them perform?
[Probes: Help from people outside the school? School leadership?]
7. Please tell me more about the professional development at your school. What topics are covered? Who chooses the topics?
[Probes: Is professional development school-, grade- or subject focused? Do individual teachers select from a menu of topics?] How is it delivered? [Probe for workshops,

OMB No. 1875-0222-v.3 Approval expires 12/31/2008 Appendix B 106
coaching, etc.] Where is it delivered? When is it delivered?
8. How are students evaluated? How are students motivated to participate in the learning process? What rewards are available for student accomplishments (beyond report cards—e.g., “student of the month,” other public recognition)? On what basis are students rewarded?
9. Describe the assessments used to measure student progress. When were they instituted? How often are they administered? Has this changed? Was training provided in analyzing and using data? If so, who provided the training? What happens with the information from the assessments?
[Probes: Schoolwide, grade-level, or subject area? Were data used for instructional change? To provide individualized support to students? Are they currently used in the same way? To what extent did measurable goals exist?]
10. Is there a pacing schedule? Does it help you with your instruction? Is it monitored? If so, by whom? What happens if you are not on schedule?
11. Is there common planning time?
[Probes: Grade-level planning? Subject area planning? Cross-disciplinary planning? What data were introduced? Did the results lead to changes in classroom practice? Does the school schedule support collaboration?]
12. When you came to this school, what orientation and support were you given?
13. How are parents involved in planning and implementing changes at the school?
14. Is there anything else I should know to tell the story of your school improvement efforts?

OMB No. 1875-0222-v.3 Approval expires 12/31/2008 Appendix B 107
Exhibit B.13 Parent Focus Group Protocol
School code:
Interviewer:
No. of participants:
Interviewer:
1. For turnaround schools: We are visiting this school because it has demonstrated
important gains in academic outcomes. Were you aware of this improvement? Who or what do think was responsible for the change?
For comparison schools: We are visiting this school because it has engaged in school improvement efforts. Were you aware of such efforts? Who or what do you think was responsible for initiating these efforts?
2. What grades are your children in? Over what period have any of your children attended the school?
3. In general, how do you feel about the school? Has your impression changed over time? If so, what caused the change?
4. Since the time when your first child attended the school, have you noticed any changes in the school? If so, please describe them.
[Probe: How teachers and principals work—or do not work—with parents, student work, teacher quality instruction, physical plant.]
5. To what extent are you involved in school activities? Do you believe you are welcome in the school? Do you believe you have input into school goals?
[Probe: classroom activities, PTA, school improvement team, other volunteer activities.]
6. Do you think school personnel encourage parents to get involved? If yes, can you give an example of how parents are encouraged?
7. How do you learn about school accomplishments, challenges, or failures? What information is presented?
[Probe: Does the principal communicate regularly with parents? If so, how (telephone calls, regular newsletters or letters, e-mail or e-letters)? Do teachers communicate with parents regularly? If so, how (telephone calls, regular newsletters or letters, e-mail or e-letters)?
OMB No. 1875-0222-v.3 Approval expires 12/31/2008 Appendix B 108
8. What is the school’s reputation in the district? Does this differ from other schools in the district? If so, how?
9. Is there anything else I should know to tell the story of the school’s improvement efforts?

Appendix C 109
Exhibit B.14 School Improvement Plan (SIP)/Leadership Team Focus Group Protocol
School code: Interviewer:
Participant Title(s):
1. Tell me about your background.
[Probes: When did you come to the school? What is your educational background? How many years have you served in this role? At this school? Did you have prior experience or training working with low-performing schools or students?]
2. What major school improvement efforts has your school engaged in over the last five years? Are they comprehensive (e.g., do they integrate instruction, assessment, and professional development)? Why were these selected?
[Probes for turnaround schools: Who or what do you think was responsible for the turnaround? Which of the efforts was most important for accomplishing the turnaround?]
[Probe for comparison sites: Which of the school improvement efforts had the most significant effects on student achievement? Who or what was responsible for this effort?]
[Probe at all schools for the existence of a research base and source of information about that base.]
3. How did teachers react or respond to the changes in school improvement efforts?
[Probes: Were any teachers particularly supportive? If so, how did they show their support? Did any teachers resist the changes? If so, how was the resistance dealt with?]
4. Describe how the school improvement team is involved in planning and initiating school improvement plans.
[Probes: Who is involved in planning school improvement plans? What is the team’s role in planning efforts? What is the process for planning school reform? For initiating improvement plans?]
5. What information is used to develop school improvement plans?
[Probe for types of data used, how the data is used to develop plans, and specific examples of using data to develop plans or assess impact of strategies. To what extent do measurable goals exist?]

Appendix C 110
6. What resources were used to support the actions for improvement? If so, how have the resources been used? Were they coordinated?
[Probes: Purchase supplemental classroom materials? Extend professional development? Establish new positions to support the changes? Extend the school day?]
7. What support did you provide teachers to help them successfully implement school improvement efforts? When? How were the teachers motivated to participate in the reform?
[Probes: Help from people outside the school (e.g., model developers, consultants)? Professional development? Opportunities to meet as grade-level or content teams? Teacher incentives?]
8. Is there anything else I should know to tell the story of the school’s improvement efforts?
Appendix C 111
APPENDIX C—SITE ABSTRACTS
Introduction............................................................................................................................... 112
Freedom Elementary School .................................................................................................... 113
Lincoln Elementary School ...................................................................................................... 118
Mill Elementary School ............................................................................................................ 124
Stratford Elementary................................................................................................................ 129
Swift Middle School .................................................................................................................. 134
Walker Academy....................................................................................................................... 140
Weston Elementary School ...................................................................................................... 145
Dogwood County Middle School ............................................................................................. 150
Martin Elementary School ....................................................................................................... 156
Chelsea Elementary School ...................................................................................................... 162
Cooke Elementary School ........................................................................................................ 167

Appendix C 112
Introduction The following individual school site abstracts are succinct accounts of the information collected in the 11 school visits. They were developed by the study evaluation team around a common framework to produce uniformly structured descriptions of each school’s key outcomes and activities. Accountability test results are included in the abstracts. Hence, for some schools Reading tests results are reported whereas for other schools English Language Arts results or both Reading and English Language Arts results are reported. Mathematics results are reported for all schools. As noted earlier, school names are fictitious to protect confidentiality commitments.

Appendix C 113
Freedom Elementary School
Overview
Freedom Elementary School sits in the middle of a 1960s vintage, federally funded housing development, east of a river. The school has consistently, since at least 2000, served a population of low-income (82–97 percent eligible for the federal school lunch program), African-American (99–100 percent) students in grades K–5. August 2002 saw the arrival of a new principal; a year earlier a new superintendent of schools joined the school district. Freedom staff and students have labored under many of the societal ills that afflict so many urban schools: neighborhood crime, drug use, and poverty.
Achievement Pattern
Freedom School exhibited relatively quick, dramatic, and sustained improvements in student achievement from 2002 through 2007. Over a four-year period, students moved from 29 percent proficient in reading and 42 percent in mathematics to over 95 percent proficiency in both subject areas. (See Exhibits C.1 and C.2.) While the school district overall also showed marked improvements in both reading and mathematics during this period, the districtwide gains were not as dramatic or as quick as those of Freedom. Within three years (by 2005), the district effectively caught up to the state’s average student performance in reading and mathematics. Freedom entered improvement status under the Elementary and Secondary Education Act in the 2001–02 school year. It made adequate yearly progress (AYP) for the first time in the 2004–05 school year and has continued to make AYP since.
There are no obvious counter-explanations in demographic changes to account for Freedom’s dramatic improvement. While there was a large influx of students from a nearby closing school serving a similar population of students in 2006, this was well after Freedom achieved its dramatic improvement in student performance. Furthermore, while disciplinary incidents rose during the year of the new student influx, student achievement remained at near 100 percent proficient and well above the state mean. The student population has otherwise remained stable over time.
School Activities
Over six years, Freedom received significant new funding resources, including a state partnership grant for successful schools and federal Title I and 21st-Century Community Learning Centers grants. The state grant began in the 2003–04 school year and was funded at $125 thousand per year. The school received a 21st-Century Community Learning Centers grant that began the year following the end of the state grant (2006–07), continuing through the 2008–09 school year. These funds were used to reduce class size, build community partnerships, move to block scheduling, run an after-school program and a Saturday academy, hire instructional coaches in mathematics and language arts, and add 30 minutes of reading each day. Data gathered as part of the district-mandated weekly benchmark assessments were analyzed by a data

Appendix C 114
team, led by the principal. These data were publicly shared with the school community. The school also implemented behavioral incentives and housed state health and behavioral authority staff in the gym. These staff provided counseling and other services to as many as 70 children and families. There were some important state and district actions occurring over this period. The state’s accountability system identified Freedom as a school in need of improvement and provided resources to do so (the state grant). The district identified the current principal as someone capable of motivating the school community and gave her the tools, resources, and guidance necessary to enact her vision of school improvement. The district aligned school curricula to state standards, sought accreditation for all schools, required weekly assessments for schools in improvement status, and required Voyager reading (a scripted reading program) in all elementary schools in grades K–2. For a chronology of critical events, see Exhibit C.3.
Additional Facts Reform grant expired in 2001–02. There is little evidence that the school’s CSR program contributed to its later success. Also, the teachers’ union supported improvement by funding professional development activities designed to develop a professional learning community at Freedom. They also sponsored and funded the TAKE 1 program that put teachers on the track to national board certification.

Appendix C 115
Exhibit C.1 School, District, and State Student Achievement (2002–07), Reading

Appendix C 116
Exhibit C.2 School, District, and State Student Achievement (2002–07), Mathematics
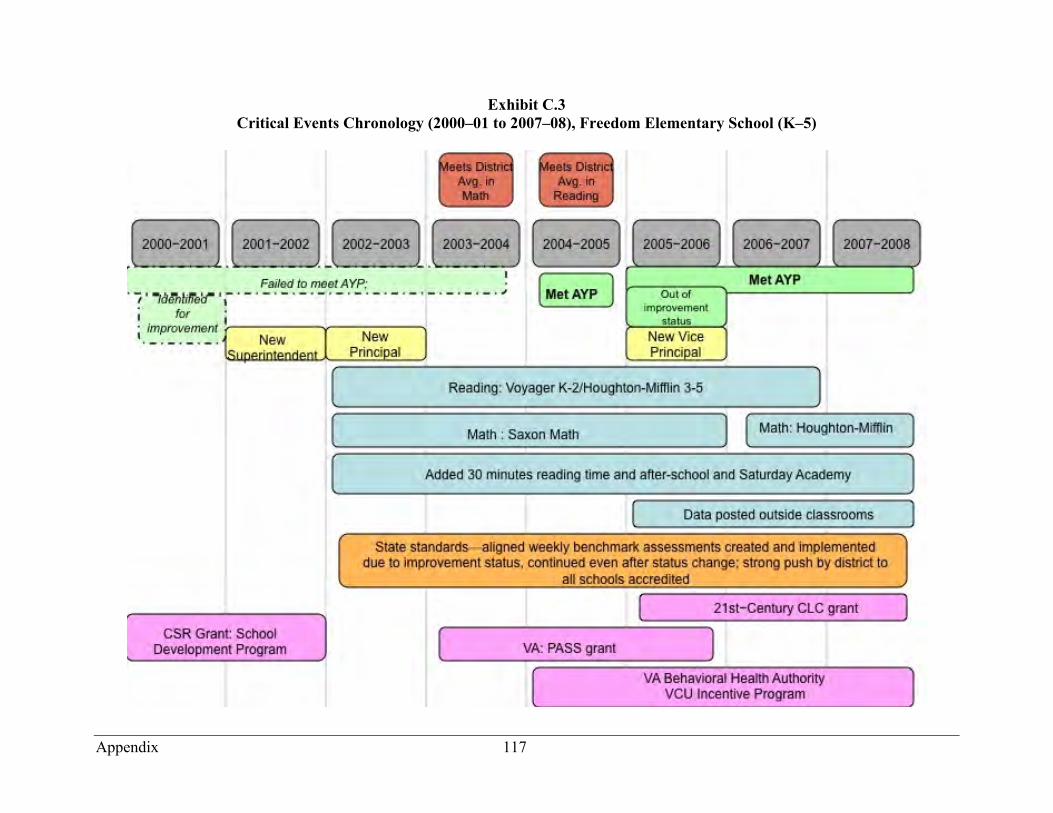
Appendix 117
Exhibit C.3 Critical Events Chronology (2000–01 to 2007–08), Freedom Elementary School (K–5)
Appendix C 118
Lincoln Elementary School
Overview
Lincoln is a K–8 school in a southern county. The economic condition of the community is extremely poor. In addition to employment provided by the coal industry and the services it requires, the majority of jobs are in education and social services. The teaching force is very stable with little turnover at this school. The school has approximately 350 students as of the 2007–08 school year. The number of children eligible for the federal school lunch program has hovered slightly under 75 percent for seven years, and attendance has been in the 90 percent range. The vast majority of students are white, with a Hispanic and black population of less than 1 percent. The principal has been with the school for six years as of 2007–08 and is committed to making this the best school in the country. Over the previous ten years, there was inconsistent leadership, which included the eventual abandonment of a comprehensive school reform effort. In addition to the strong principal, the school has a committed staff and substantial community involvement.
Achievement Pattern
From 2002 through 2007, reading and mathematics performance generally improved at the school, as well as districtwide and statewide (see Exhibits C.4 and C.5). At Lincoln over this period, students scoring proficient or better increased by 30 percentage points in reading and 18 percentage points in math. Yet, the pattern of results is different across the two subjects. In reading, while the initial performance of the school was considerably lower than district and state performance, slow-and-steady performance gains (except for 2005–06) reduced these gaps considerably by 2007 (see Exhibit C.4). In contrast, nearly all of the mathematics achievement improvement occurred during one year when the percent scoring at the proficient level rose dramatically from 34 to 61 percent (see Exhibit C.5). This school has met all adequate yearly progress (AYP) standards for each of the past five school years, as of 2007–08.
A factor to note in mapping and interpreting achievement changes for this school is that the averages shown in Exhibits C.4 and C.5 are based on testing for only two out of the school’s nine grades and may at least partially reflect a cohort effect. It appears from these data that the cohort of students enrolled in grades 4 and 7 and tested in the spring of 2005 may have been academically stronger than the students in grades 5 and 8 that year. The former cohort had 10 percentage points of growth in reading as compared to the prior year’s fourth- and seventh- graders. Then, in the spring of 2006, when this group of students was in the fifth and eighth grades, these students showed a huge gain of 61 percent scoring proficient or better as compared to the prior year’s fifth- and eighth-graders, only 34 percent of whom scored proficient or better. Thus, this cohort of students showed considerable gains in reading in the spring of 2005 (as fourth- and seventh-graders) and then in math in the spring of 2006 (as fifth- and eighth-graders). Similarly, the next cohort of students showed a decline in reading in 2006 and then in math in 2007.

Appendix C 119
This school did not have to contend with changes in the student population. Available data show a fairly stable rate of students eligible for the federal school lunch program. Enrollment has been stable with changes of only 2 to 4 percent. In the last 60 years, there has been little change in the school district’s demographics. Many of the teachers as well as their parents went to local schools, and there is little movement out of or into the school community. The state emphasizes local control, with each school having a site council that has considerable authority over school policy and operations. However, the state and district exert considerable influence by leading an effort to align the curriculum with the state standards and academic performance testing and by introducing instructional programs.
School Activities
Upon her arrival at the school in 2001, the principal set a new standard of commitment, dedication, and action, according to respondents interviewed for this study. In the first year, she worked to develop her relationship with the school site council that hired her, the school improvement management team she organized in the school, the school faculty, for which she set high standards, and the parents. She welcomed parents but also made clear that she was now running the school, not them. She also set high standards for student attendance and behavior.
One of her initial tasks was to align the curriculum with state standards and performance testing. In support of this district-led effort, Lincoln teachers began working with other teachers in the district to align the curriculum with state standards and to develop instructional sequencing and pacing guides. These efforts were considered instrumental in making instruction more efficient.
Decisions in this school became more data-driven in that changes were made based on test results, and school staff contributed to the development of solutions. In response to the 2003–04 test results, the principal emphasized professional development and encouraged teachers to use more differentiated instruction. Work groups were established in each content area to reflect on and implement best practices in classrooms. In support of this effort, the principal offered additional release time for professional development beyond that provided by the district. Staff development resources were provided by a regional educational cooperative, the district, a local university, and a private foundation. Foci for staff development included using open-ended questions in assessments and increased use of technology in the classroom.
Many of these policies and practices continued in subsequent years. Important events in 2004–05 included a focus on differentiated instruction and multiple intelligences. Same-sex classes were instituted for math, science, and language arts, with staff indicating that this reduced discipline problems. Challenges were identified and addressed through a distributed leadership model by which groups studied the situation and developed solutions.
The use of assessments to generate changes in instruction became more prominent in 2005–06 with the districtwide introduction of Achieve 3000, a computer-based reading program that diagnoses a student’s reading level. Teachers became more focused on open-ended responses to better prepare students for state tests. The following year, a Response to Intervention process was introduced to provide continuous assessment of student progress and modification of teaching strategies.

Appendix C 120
Parent and community involvement was a very large part of the school’s overall improvement strategy. Parents and community members shared common ideas with school staff about the need for reform and the direction that reform should take. Involvement has been fairly constant at this school over time. Efforts include an active parent-teacher organization (PTO), outreach efforts, and parent communication that includes test score information. For a chronology of critical events see Exhibit C.6.
Additional Fact
As of the 2007–08 school year, most teachers have less planning time than in the previous year, and a new math curriculum has been implemented.

Appendix C 121
Exhibit C.4 School, District, and State Student Achievement (2002–07), Reading

Appendix C 122
Exhibit C.5 School, District, and State Student Achievement (2002–07), Mathematics

Appendix C 123
Exhibit C.6 Critical Events Chronology (2000–01 to 2007–08), Lincoln Elementary School (K–8)

Appendix C 124
Mill Elementary School
Overview
One of six National School Change Award winners in July 2005, Mill (pre-K–6), with an average of 650 students from 2001 to 2007, boasts a newly renovated facility a few miles from the downtown section of a large city in a township with a small town feel. 25 A sports theme—”We Are Champions”—unifies the hallways. Football and basketball graphics anchor a multitude of classroom and grade-level bulletin boards showing data graphs, standards, and examples of student work. These first impressions demonstrate the school’s “no excuses” attitude and its attempts to prevail over a student poverty rate of 77 percent. Teachers often related stories of the student hardship stemming from their students’ home life (e.g., incarcerated parents, drug use, some students being expected to get themselves to school).
Achievement Pattern
Once one of the lowest-performing among the ten elementary schools in the district, Mill experienced a single-year spike (from fall 2001 to fall 2002) that put it above state and district averages.26 Since this initial surge, Mill’s achievement has been generally more than sustained at these new levels of performance. In both English language arts (ELA) and mathematics, the school’s performance continued to grow but then showed some decline in the most recent years. In both subjects, however, Mill has continued to exceed the district average, suggesting that its growth from the fall of 2002 was school-specific rather than simply resulting from more general trends. In math, despite some declines from the fall of 2004 to 2007, the school has consistently and substantially outperformed the average for the state as well as for the district, starting with fall of 2002 testing (see Exhibits C.7 and C.8). By fall 2007, Mill continued to sustain its earlier significant achievement gains and was the district’s top-performing elementary school in math and third top performer in ELA.
While there have been some changes that impact the student populations, these do not appear to be the driving factor behind Mill’s improvement. There have been some enrollment fluctuations, marked by slight declines in the last two years examined. All English learner students within Mill’s attendance area have attended Stratford (an elementary comparison site for this study) since 1998–99 when the district established a cluster program.27 Mill’s African-American population has declined from 27 percent in 2001–02 to 13 percent currently, due to the 2004 gradual reversal of the 1981 desegregation court order to bus in students from the nearby city public schools. 25 The Panasonic National School Change Award (held by Fordham University) is a prestigious award recognizing “schools that have significantly changed for the better.” Its application process is extensive, and schools must provide documentation across 16 specific criteria. 26 The state test was re-normed for the fall 2002 test cycle and may have had an impact on the increases in achievement, which were observed statewide. At the same time, Mill outgrew the state and district in that year. 27 Prior to the fall 2003 test cycle, the scores for these students were reported by Stratford. Yet this should not have impacted Mill’s gains, since Mill transferred only between one and three students prior to 2003.
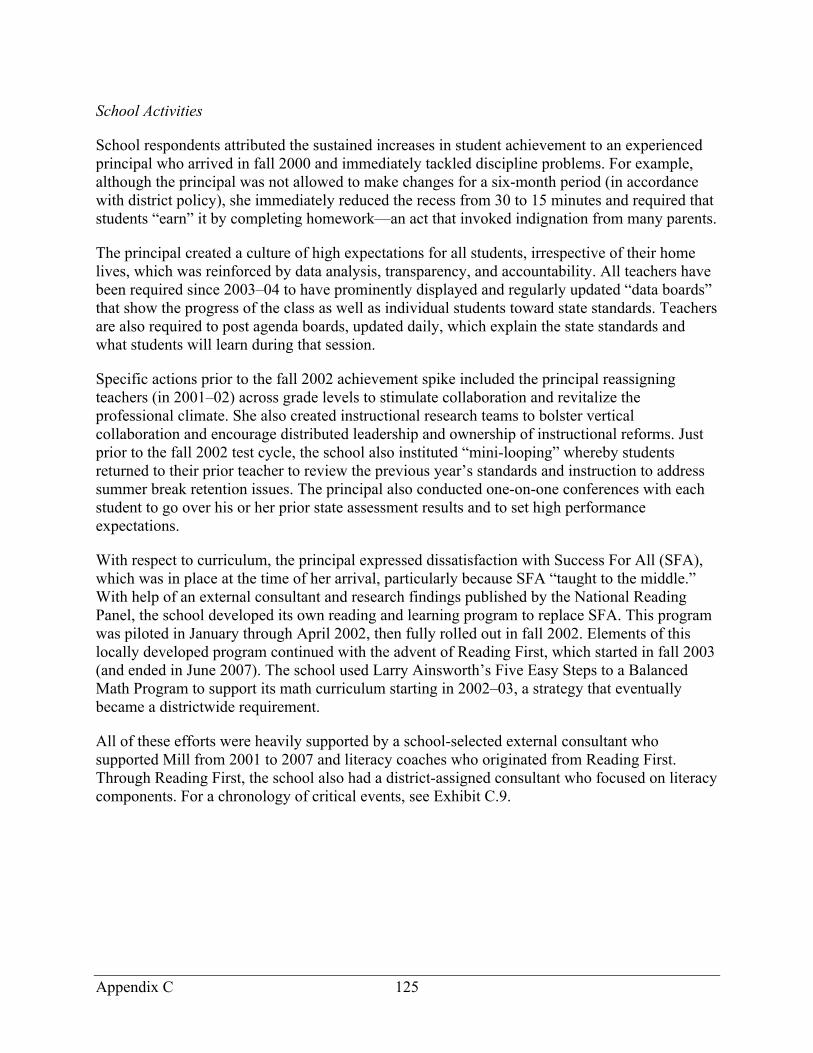
Appendix C 125
School Activities
School respondents attributed the sustained increases in student achievement to an experienced principal who arrived in fall 2000 and immediately tackled discipline problems. For example, although the principal was not allowed to make changes for a six-month period (in accordance with district policy), she immediately reduced the recess from 30 to 15 minutes and required that students “earn” it by completing homework—an act that invoked indignation from many parents.
The principal created a culture of high expectations for all students, irrespective of their home lives, which was reinforced by data analysis, transparency, and accountability. All teachers have been required since 2003–04 to have prominently displayed and regularly updated “data boards” that show the progress of the class as well as individual students toward state standards. Teachers are also required to post agenda boards, updated daily, which explain the state standards and what students will learn during that session.
Specific actions prior to the fall 2002 achievement spike included the principal reassigning teachers (in 2001–02) across grade levels to stimulate collaboration and revitalize the professional climate. She also created instructional research teams to bolster vertical collaboration and encourage distributed leadership and ownership of instructional reforms. Just prior to the fall 2002 test cycle, the school also instituted “mini-looping” whereby students returned to their prior teacher to review the previous year’s standards and instruction to address summer break retention issues. The principal also conducted one-on-one conferences with each student to go over his or her prior state assessment results and to set high performance expectations.
With respect to curriculum, the principal expressed dissatisfaction with Success For All (SFA), which was in place at the time of her arrival, particularly because SFA “taught to the middle.” With help of an external consultant and research findings published by the National Reading Panel, the school developed its own reading and learning program to replace SFA. This program was piloted in January through April 2002, then fully rolled out in fall 2002. Elements of this locally developed program continued with the advent of Reading First, which started in fall 2003 (and ended in June 2007). The school used Larry Ainsworth’s Five Easy Steps to a Balanced Math Program to support its math curriculum starting in 2002–03, a strategy that eventually became a districtwide requirement.
All of these efforts were heavily supported by a school-selected external consultant who supported Mill from 2001 to 2007 and literacy coaches who originated from Reading First. Through Reading First, the school also had a district-assigned consultant who focused on literacy components. For a chronology of critical events, see Exhibit C.9.
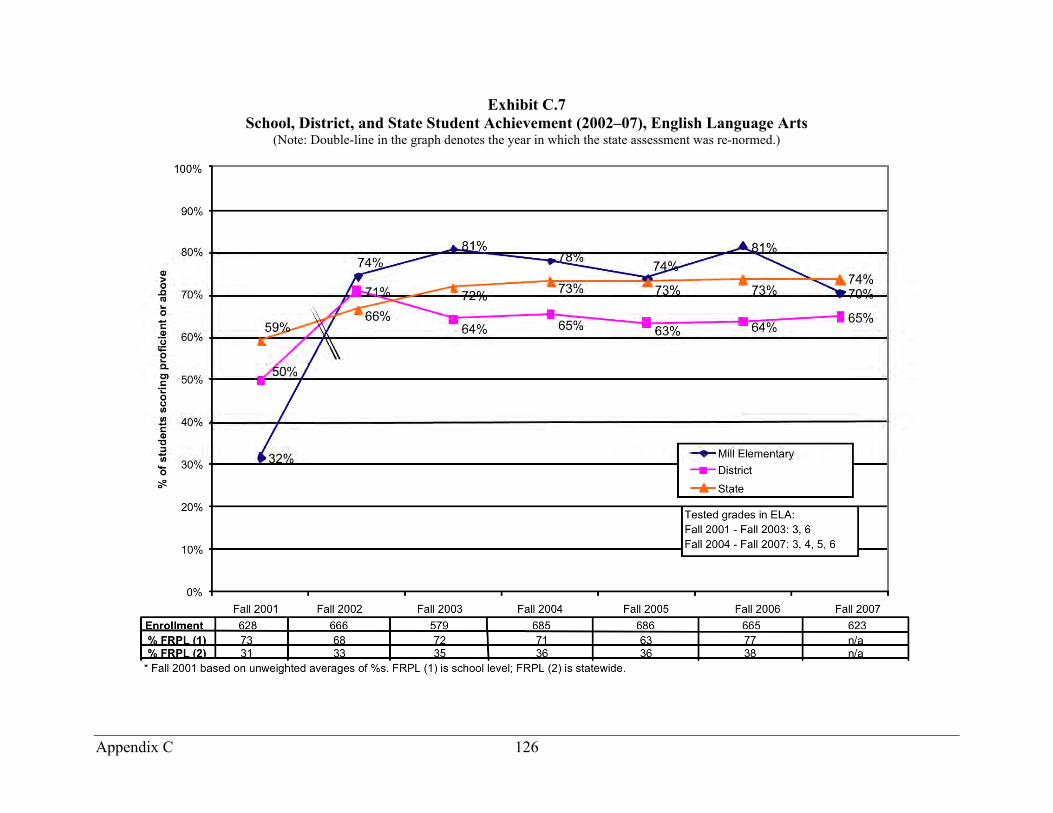
Appendix C 126
Exhibit C.7 School, District, and State Student Achievement (2002–07), English Language Arts
(Note: Double-line in the graph denotes the year in which the state assessment was re-normed.)

Appendix C 127
Exhibit C.8 School, District, and State Student Achievement (2002–07), Mathematics
(Note: Double-line in the graph denotes the year in which the state assessment was re-normed.)

Appendix C 128
Exhibit C.9 Critical Events Chronology (2000–01 to 2007–08) Mill Elementary School (PK–6)

Appendix C 129
Stratford Elementary
Overview
Just a few miles from the downtown section of a nearby city, the area where this school is located quickly takes on a rural feeling, with subtle signs of poverty—run-down homes, an abandoned warehouse. With 669 students in 2007–08, Stratford (pre-K–6) has a predominantly white population (72 percent), with nearly equal distributions of African-American and Hispanic students (13 percent each). The new look of the renovated facility belies the high level of student poverty, with 82 percent of the student population eligible for the federal school lunch program (the second highest poverty school in the district). According to the teachers, many of these students endure a challenging home life, and the school nurse is the primary care physician for many students at Stratford. Students frequently require such basic necessities as shoes, coats, eyeglasses, and meals, which are sometimes purchased by staff: “We need to meet their basic needs before they can move on and learn,” noted one teacher.
Achievement Pattern
Initially designated as a comparison school for Mill, Stratford likewise experienced a dramatic increase in achievement from 2001 to 2002.28 However, this surge was not fully sustained in either English language arts or math in subsequent years (see Exhibits C.10 and C.11). Unlike Mill, Stratford’s relative ranking in performance between 2001 and 2007 compared with other schools in the district remained relatively static, even including 2001–02, when it experienced dramatic achievement increases.
Stratford has experienced demographic shifts outside of its control. For example, it was one of three cluster program sites within the district starting in 1998–99 that enrolled English learner students from other schools.29 Stratford also enrolled about 130 students from Mill in 2004–05, due to permanent redistricting to shift populations to relieve enrollment burden in the northern areas of the district.30 Coupled with declines of the existing enrollment, the school experienced a net jump of 105 students in that year. While the distributions by ethnic group remained largely the same, this resulted in a growth in the numbers of Hispanic and African-American students. Its student poverty rate increased from 69 percent in 2001–02 to 82 percent in the 2007–08 school year.
28 The state test was re-normed for the fall 2002 test cycle and may have had an impact on the increases in achievement, which were observed statewide. 29 Prior to the fall 2003 test cycle, the scores for these students were reported by Stratford. Subsequently, the scores were reported by the resident school. 30 The new attendance area for Stratford included 139 students originally in Mill’s attendance area; however, the district allowed sixth graders to complete 2004–05 at Mill.
Appendix C 130
School Activities
Stratford saw a change in school leadership in August 2000 and again in the spring of 2003. Also, nearly half of the teaching staff for the 2004–05 school year was new to the school (24 of 52 teachers, and 18 of those 24 were first-year teachers), due to teachers voluntarily transferring to a newly opened school within the district and new positions to accommodate enrollment increases from the redistricting. Given these staffing changes, the researchers for this study were not yet able to uncover specific activities that occurred just prior to the jump in achievement between 2001 and 2002. However, school respondents did discuss subsequent reforms and contributing school characteristics.
Among the most prominent characteristics, according to the school respondents, was the new principal in 2003 who focused on research-based strategies and use of data, established top-down expectations of professional collaboration, and fostered a strong supportive culture with emphasis on community building. The principal also redistributed all teaching staff across different grade levels in 2004–05 to mitigate the inexperience of the new teachers, to revitalize the veterans, and to signal change. Mill also undertook similar reforms, although Mill appeared to undertake these changes earlier in the process and more firmly embed them in the school’s daily practices.
Stratford used its CSR funds to implement Success For All from 2000–01 to 2002–03. The school became heavily focused on literacy, with the start of the Reading First program in 2003–04 and the district-mandated “Literacy Framework,” which emphasizes components found in the National Reading Panel research (e.g., phonics, vocabulary, phonemic awareness, comprehension, fluency, writing to communicate). In accordance with another district mandate, the school used Larry Ainsworth’s Five Easy Steps to a Balanced Math Program to support its math curriculum starting in 2005–06.
Contributing to these reform efforts was a very dedicated, caring staff (following the influx of new staff in 2004–05) that coalesced around a common theme: doing what was best for the students. It was generally perceived by school and district respondents that potentially resistant staff transferred to a newly opened elementary school in the district prior to the 2004–05 school year. By default, the remaining staff were receptive to the wave of changes that followed, resulting in minimal resistance. District respondents noted that Stratford benefited from the “clean slate” in teaching staff in 2004–05, which enabled the principal to build a positive school climate with staff that embraced change. Conversely, it has taken time to train teachers to work with the school’s challenged student population.
Aside from providing professional development through the national Center for Performance Assessment consultants and providing a district-level Reading First consultant, the district’s earlier efforts seem to have played a peripheral role in the school’s improvement efforts, while permitting principals the flexibility to take reasonable risks. School respondents mentioned little or nothing of state or federal context, other than the requirements related to Reading First and Title I fiscal support. For a chronology of critical events, see Exhibit C.12.
Appendix C 131
Exhibit C.10 School, District, and State Student Achievement (2002–07), English Language Arts
(Note: Double-line in the graph denotes the year in which the state assessment was re-normed.)

Appendix C 132
Exhibit C.11 School, District, and State Student Achievement (2002–07), Mathematics
(Note: Double-line in the graph denotes the year in which the state assessment was re-normed.)

Appendix C 133
Exhibit C.12 Chronology of Critical Events 2000 to 2007, Stratford Elementary (PK–6)

Appendix C 134
Swift Middle School
Overview
Situated next to the high school on a large flat plain in a rural area, Swift’s greatest challenge, according to several school respondents, is not only to educate its students but also to keep them from leaving the community for higher growth areas locally and beyond. With 663 students, the school’s population is roughly half African-American and half white, with 73 percent of the students eligible for the federal school lunch program. The school also has a relatively high percentage of special education students, ranging from 21 to 25 percent from 2000–01 to 2006–07. Swift is a very rural and stable community, and there have been relatively few changes in the student population or teaching staff in recent years.
Achievement Pattern
Swift exhibited slow-and-steady improvement from 2001 to 2007–08. In English language arts and reading, the percent proficient was considerably below the statewide average in 2001, and the school’s students rose in both subjects to be on par with the statewide average by 2007 (see Exhibits C.13 and C.14). In math, the percentages of students scoring proficient or above on state assessments exceeded the statewide average from 2004 through 2007 (see Exhibit C.15). The school’s trend line is fairly similar to the district’s performance, as Swift serves approximately 70 percent of students in grades 6 through 8 districtwide.31
School Activities
In the fall of 1999, a new principal began his six-year tenure at Swift. During the years prior to this new leader, school administration had been weak and fractured, and teachers felt completely unsupported, according to those interviewed for this study. In the new principal’s first two years as the school leader, he selected core staff focused on creating a more structured, cohesive, learning-focused atmosphere at the school. In particular, in his first two years as principal, he increased behavioral expectations (e.g., focused on teaching students schoolwide expectations, such as how to walk quietly in the halls; established consistent routines; and supported teachers in holding students accountable) and introduced block scheduling for math and language arts. He also required teachers, with the support of coaches, to analyze student data, gave teachers one period per week for common planning time, and shifted staff around to better suit student needs.
The school failed to meet adequate yearly progress (AYP) in 2000–01 and 2001–02 and subsequently fell into Needs Improvement status for the following two years. During the two years in Needs Improvement, the school received additional school improvement funds from the state, which were spent on an in-school school improvement specialist position (filled by existing leadership staff) and additional training and professional development in Max Thompson’s 31 In addition to Swift, there are two other schools within the district that serve middle grades (a pre-K–8 school and a school serving grades 6–12).

Appendix C 135
Learning Focused model of instructional improvement that was spearheaded by a consultant from the local Regional Educational Services Agency (RESA). In the summer of 2002, this RESA consultant began training a specially selected group of teachers, who were regarded as role models by other school staff, in essential techniques and skills to enhance their instruction. Teachers reported feeling positively supported by the RESA consultant; however, she is no longer serving the school due to lack funding when the school came out of Needs Improvement status.
The strength and cohesiveness of the staff appears to have helped facilitate the school’s improvements. A benefit of the earlier years when administrative leadership was reported to have been weak is that the staff banded together and depended on one another because they represented the only continuity and stability during this period, according to the experienced teachers. A core of veteran teachers shared the responsibility for leading the school improvement efforts with the new principal and was trained by the RESA external consultant in “best practices.” This core of teachers implemented these practices in their own classrooms first, then trained their colleagues in these techniques and strategies, which included curriculum alignment and mapping, use of data for benchmarking and instructional decision-making, and cooperative learning techniques.
This core of teacher leaders continued to be the mainstay of the improvement effort and to bolster reform even when changes occurred in administrative leadership (such as a new principal in 2006–07) and state improvement funds were withdrawn.
Furthermore, the school increased its emphasis on inclusion of special education students into mainstream classes, exposing students to the same curriculum and skill standards as the general population. School improvement funds were utilized to hire paraprofessionals to augment the special education staff and to support the increased inclusion effort. After-school tutoring was also emphasized to help special education students keep up with the core curriculum. Teaming at the grade and subject levels enabled all faculty to work with and support the efforts of students with special needs. For a chronology of critical events see Exhibit C.16.

Appendix C 136
Exhibit C.13 School, District, and State Student Achievement (2001–07), English Language Arts

Appendix C 137
Exhibit C.14 School, District, and State Student Achievement (2001–07), Reading

Appendix C 138
Exhibit C.15 School, District, and State Student Achievement (2001–07), Mathematics

Appendix C 139
Exhibit C.16 Critical Events Chronology (1999–2000 to 2007–08), Swift Middle School (6–8)
Appendix C 140
Walker Academy
Overview
Walker (pre-K–12) is a charter school in a southern state. Formerly a private Christian school, Walker reopened under a public charter in 1998 with a predominantly uncertified teaching staff. As a charter school, it was not accountable to state performance standards prior to 2002–03. This school was challenged with high student, teacher, and principal turnover. Enrollment in grade levels tested (3–11) between 2002 and 2007 ranged from 17 to 22 students, with enrollment in K–12 ranging from 251 to 313 students. These low enrollment figures were accompanied by high rates of student mobility, with about one-third of students not enrolled in the school at least 83 percent of the school year, according to state education agency data. In the same period, the proportion of African-American students increased from 9 to 16 percent, while that of white students decreased from 69 to 54 percent; the proportion of students eligible for the federal school lunch program ranged from 49 to 65 percent, staying above 60 percent from 2003 on. Average teacher experience ranged from 0.6 to 1.0 years. Teachers left the school often for better pay and benefits in surrounding districts. Walker had three changes in principal—first in summer 2004, then in spring 2006, and again in summer 2006. The last principal change was accompanied by a wholesale release of the teaching staff on the part of the charter management organization; only four teachers from the prior year remained. Between 2001 and 2004, Walker’s school budget per pupil increased from $3,577 to $5,466.
Achievement Pattern
While the data show that student achievement peaked in 2005, it was not sustained. From 2003 to 2005, the proportion of students attaining proficiency in reading rose 22 points (compared to a seven-point gain at the state level) and the proportion attaining proficiency in mathematics rose 29 points (versus a 10-point gain at the state level). In spring 2005, Walker exceeded the state-level proportion in reading by six points and fell two points short of state-level in mathematics, despite the fact that the Texas Assessment of Knowledge and Skills proficiency standards were raised from prior years. However, between 2005 and 2006, Walker reading achievement declined by 15 points; between 2005 and 2007, mathematics achievement declined by 14 points. Ultimately, overall gains in reading and mathematics between 2003 and 2007 paralleled state gains (see Exhibits C.17 and C.18). Walker made adequate yearly progress (AYP) from 2002–03 through 2005–06. In 2006–07, it did not make AYP in mathematics.
School Activities
Walker initiated several activities aimed at improving achievement after 2002–03, the year in which it became subject to state accountability standards. Walker applied for and received a Reading First grant and used it to implement Open Court Reading in grades K–3 in 2003–04. Walker also used the funds to hire a reading coach, three reading specialists, and two instructional assistants. The assistants worked with the coach and specialists to provide intensive

Appendix C 141
intervention to struggling readers. During this year, teachers supplemented Open Court with other reading curricula. In 2004–05, the school obtained Open Court training for its teachers after the state mandated use of Open Court exclusively. Both the reading coach and Open Court training remained in place through the 2007–08 school year.
In 2004–05, a new principal, a former teacher and a key lead in school grant writing, was assigned at Walker. This principal worked closely with coaches and staff at the site to promote the use of data for instructional decision-making. Teachers collected Dibels Fluency assessment data, as required by Reading First. School staff also collected data using the Texas Primary Reading Inventory and the Iowa Test of Basic Skills. The principal and reading coach periodically reviewed the data to determine which standards needed to be addressed more extensively through instruction and intervention. This principal vacated her position two months prior to the end of the 2005–06 year for medical reasons. She was replaced by the prior principal for the remainder of the year.
In 2005–06, Walker received a Comprehensive School Reform grant, which it used to implement High Schools That Work, extend the focus on literacy into the secondary grades, and establish block scheduling.
In fall 2005, the charter management organization provided Walker with a scope and sequence in all grade levels and content areas that mapped the state content standards into six-week intervals. For 2005–06, the organization hired a mathematics curriculum specialist who revised the scope and sequence and provided professional development to teachers and continues to support the school. However, teachers noted that since 2002–03 Walker had not updated the mathematics curriculum, which was not aligned to state standards. The organization required use of earlier versions of the state accountability assessment three times per year as benchmark assessments. At the end of 2005–06, the organization released all but four teachers, so the new principal for 2006–07 could hire her own staff.
The state provided reading technical assistants in 2003–04 and 2004–05. According to school staff, the assistant in the latter year was more effective than her predecessor. The assistant continues to serve the school. The state’s Region 10 Education Service Center provided a large majority of teachers to the site through an alternative certification program.
In 2007–08, the school also received state funds through the accelerated reading and mathematics initiatives based on the number of students underperforming on the state assessments.
In spite of the adoption of a research-based reading curriculum and a high school comprehensive school reform model, increased funding per student, extensive use of assessment data for decision-making, and coaching, the significant turnover in staff and students, small school size, and turnover in leadership confound attribution of achievement gains to specific reforms. For a chronology of critical events, see Exhibit C.19.

Appendix C 142
Exhibit C.17 School, District, and State Student Achievement (2003–07), English Language Arts
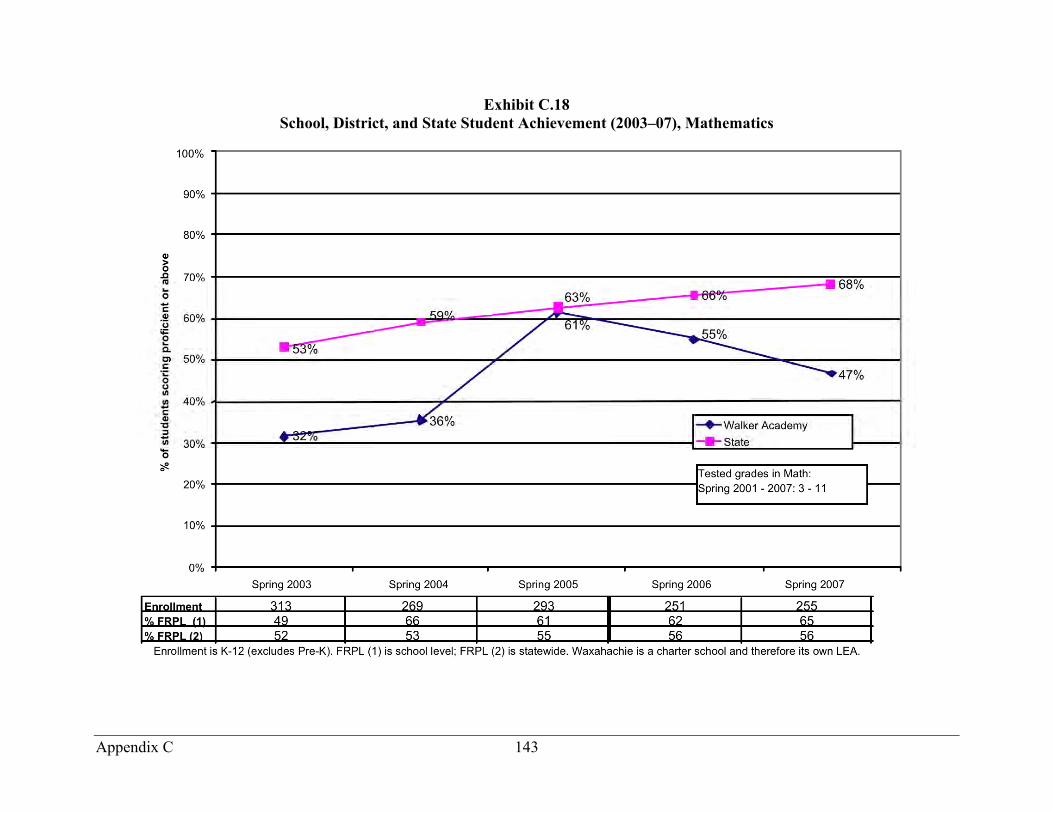
Appendix C 143
Exhibit C.18 School, District, and State Student Achievement (2003–07), Mathematics
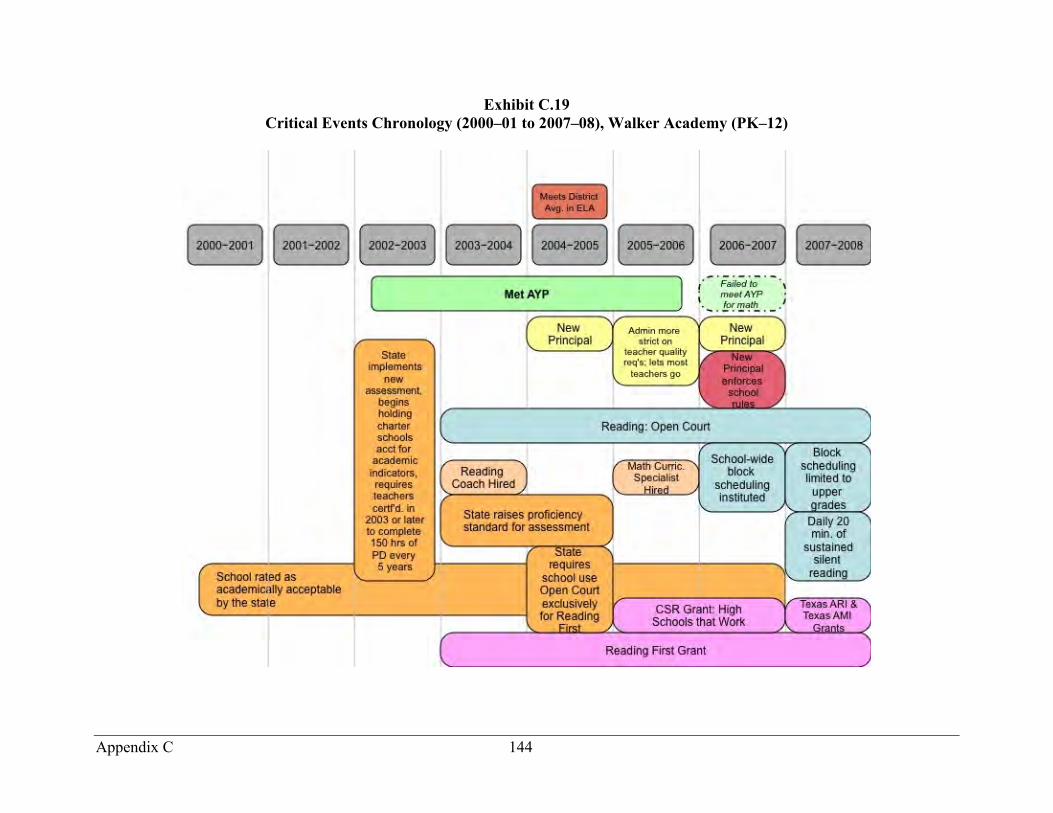
Appendix C 144
Exhibit C.19 Critical Events Chronology (2000–01 to 2007–08), Walker Academy (PK–12)

Appendix C 145
Weston Elementary School
Overview
Weston Elementary School is a small, K–5, elementary school in a small city of a southern state. In 1999, the school became an arts magnet school, drawing mostly but not entirely from the surrounding neighborhood. The magnet program ended in 2003–04, though the name persists. The school has consistently served a population of low-income (85–90 percent eligible for the federal school lunch program), African-American (87–92 percent) students. To a visitor, the neighborhood does not appear to be particularly disadvantaged, but school staff warn that just off the main street, homes deteriorate and there are several public housing projects with crime and drug activity. The school itself is elegant, historic, and well preserved: Built in 1926, the main entry hall is flanked by two large staircases, the stone steps of which are worn with decades of students’ treads. A large brass chandelier lights the entry, and hardwood floors are found in many classrooms. The arts rooms, renovated with a federal magnet schools grant, are state-of-the-art.
Achievement Pattern
Weston School exhibited quick, dramatic improvements in student achievement from 2002 to 2004 and has continued to exceed or approximate statewide student achievement. In those two years, students at Weston moved from 43 percent proficient in reading and 47 percent in mathematics to over 90 percent in both subject areas. (See Exhibits C.19 and C.20.) During the same period, the school district overall showed substantial, but less dramatic improvements in both mathematics and reading. The district schools remain below the state average, while Weston has generally stayed above the state average since 2004. Weston has consistently made adequate yearly progress since the 2003–04 school year.
Demographic changes in the student population could be a contributing factor in accounting for Weston’s improvements. First, the school has been a magnet school for many years and draws a small but significant number of students from outside its neighborhood. Currently, about 25 students come from outside the neighborhood. Second, though the demographic makeup of the school has remained largely constant, overall enrollment has declined dramatically from almost 250 students in 2000–01 to only 175 in 2007–08. Many classes now have as few as 15 students. The principal attributes the decline to the school’s inability, with the loss of magnet grant funding, to provide transportation for students from outside the school’s neighborhood.
School Activities
During its first years as an arts magnet school (1999–2001), a substantial proportion of the school day at Weston was devoted to the fine and performing arts. This left little time for core academics and consequently, student achievement in mathematics and reading was low. While the “Big Show” in the spring was always a highlight, basic supplies and mathematics texts were often lacking. In 2001, the school district replaced the principal with a veteran principal known
Appendix C 146
for turning around schools in the district. That same year, the state intervened and placed the school in the Partnership for Achieving Successful Schools (PASS) initiative. In a visit to the school, the state explicitly threatened to terminate teachers’ employment unless substantial changes were made and improvement was achieved. Under this threat of layoffs, the principal initiated several strategies, including regular use of data, targeted intervention, extended learning time, schoolwide disciplinary practices, and greater community involvement. School climate and school improvement also benefited from low student-teacher ratios.
Teachers use data regularly to guide and focus instruction. Every nine weeks, the school tests students, a practice initiated by the district. The data guide the topics of intersession instruction. Weston did regular benchmark testing while participating in PASS, but that was less widely used than the current district-driven process. Intersession instruction focuses on topics on which at least 75 percent of students had not demonstrated proficiency. The names of students who received perfect scores on the state Standards of Learning are posted at the front of the school. Faculty also use data to provide academic support to students as soon as it becomes evident that a student has not mastered the material.
Weston has used a year-round calendar since 2002–03. During each of the several three-week intercessions except summer break, instruction is offered for two of the three weeks. Ninety-two percent of students voluntarily choose to attend school during intersession. Weston also offers before-school and after-school tutoring opportunities for students.
Weston enforces a strict schoolwide behavior program. Early in the improvement period, staff jointly developed expectations detailing the use of homework folders, appropriate backpacks, pencil sharpening, classroom apparel, and even hallway behavior. Students today walk down the hallways with their hands behind their backs, having been told this is how “great thinkers walked.” These common disciplinary and behavioral expectations are drilled into students during the first week of school that teachers call “boot camp.”
The small class sizes and low student-teacher ratio facilitate some of the strategies employed at Weston. These changes may explain as much of the improvement in student achievement as any other single factor. Some classes are as small as 12 students. Others have as many as 18–20 students. This was not a strategic design by Weston, rather a function of declining enrollment. One unintended consequence has been a high level of communication and collaboration among the staff. Teachers have a very high level of awareness of what is going on in each others’ classrooms, a strong sense of community, and a high level of mutual support. Staff are expected to be responsible for the well-being of the students; this extends beyond the school day.
Additional Fact
Despite its success, the school district may decide to close Weston in the near future due to its declining enrollment and the high costs of maintaining this facility.

Appendix C 147
Exhibit C.20 School, District, and State Student Achievement (2002–07), Reading

Appendix C 148
Exhibit C.21 School, District, and State Student Achievement (2002–07), Mathematics
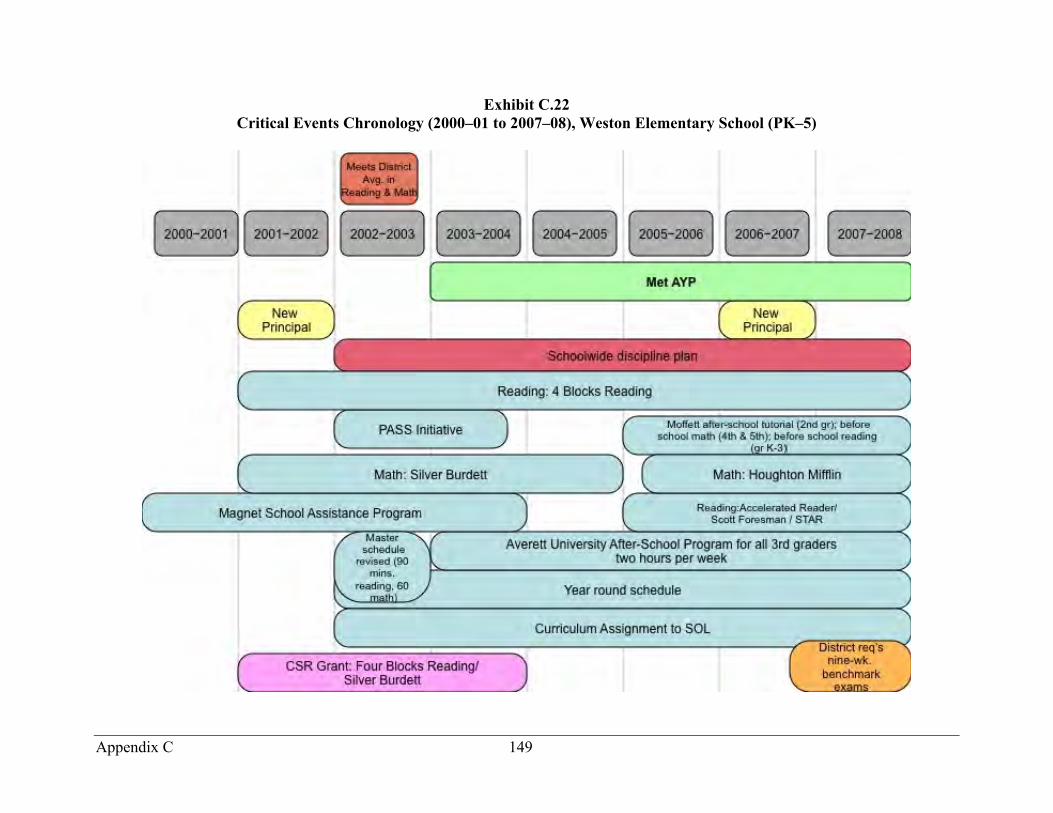
Appendix C 149
Exhibit C.22 Critical Events Chronology (2000–01 to 2007–08), Weston Elementary School (PK–5)

Appendix C 150
Dogwood County Middle School
Overview
Dogwood County Middle School (grades 6 through 8), serves approximately 340 students in a rural area. In its town, most storefronts, such as the local gun shop, have long since shut down, cotton plants grow incidentally on roadsides, and the cotton mill provides an example of local industry. The county correctional facility sits not far from the school. The county also has one high school and one elementary school. Prior to 2003–04, the school was considered the worst in the area. Teacher supervision was limited, staff morale was low, and the district provided little monitoring or oversight of student performance. The building was “dilapidated” and generally run down. In 2003–04, the school reopened in a brand new facility. The new facility has large halls, high ceilings, and light streaming from large windows. Classrooms are built around a large library and media center. During the researchers’ site visit for this study, school and district staff noted that the new site increased staff and student morale and signaled a “new start.”
Achievement Pattern
After declines in reading, English language arts, and mathematics between 2002 and 2003, Dogwood demonstrated quick and dramatic achievement gains in all three areas between spring 2003 and 2004. Dogwood sustained gains in reading and English language arts through 2007 (see Exhibits C.22 and C.23), while losing most of its gains in mathematics (see Exhibit C.24). From 2003 to 2004 Dogwood gained 20 points in the percentage of students attaining proficiency or above in reading, and 29 points in the percentage attaining proficiency or above in language arts (77 percent proficient in both areas, compared to 84 percent in both reading and 78 percent in language arts statewide). By 2007, Dogwood came within 1 percentage point of both the statewide proficiency levels in reading (87 percent) and language arts (89 percent). Dogwood experienced a gain of comparable scale in mathematics from 2003 to 2004 (24 percentage points) and came within 5 percentage points of the statewide proficiency level (71 percent). These gains were largely sustained until 2007 when the percent proficient or above dropped to 56 percent compared to 73 percent statewide. Dogwood has met adequate yearly progress (AYP) since 2004–05. Dogwood had stable enrollment and no student mobility during the entire period examined for this study.
School Activities
In 2001–02, the district began an effort to improve achievement by aligning its English language arts curriculum with state standards (with other content areas to follow). The district provided professional development to teachers for the resulting new curriculum guides, which included lessons, resources, and tools for teachers. In the same year, the school adopted a single-track year-round calendar and developed an intersession program providing remedial instruction in reading, language arts, and mathematics.

Appendix C 151
In 2003–04, Dogwood was assigned a new principal, the former assistant principal of Dogwood High School. The new principal immediately changed the focus of leadership at the school from a “facilities” focus to enhancing the teaching and learning environment for teachers and students. In January 2004, a new superintendent, who turned out to be very supportive of the initiatives of the new principal at Dogwood, was appointed.
The new principal addressed instruction, attendance, and discipline. He implemented the school improvement plan, which had been developed prior to his arrival by a district leadership team but was not being implemented. Teachers used achievement data to identify low-performing students for participation in intersession and remedial classes. Given excessive student absences (21 percent of students were absent at least 15 days in 2001–02), poor discipline, and declines in student achievement, the new principal in 2003–04 instituted an incentive program for students, including limited cash awards and traditional student recognition activities. As a result of the program, attendance increased and discipline improved. The school adopted a formal attendance plan in 2005–06. In 2006–07, 11 percent of students were absent at least 15 days. In 2005–06, to maintain a schoolwide focus on instruction, the principal and assistant principal conducted classroom observations daily on an informal basis, as well as three formal observations of each teacher annually using a protocol provided by the state department of education.
In 2000–01, the district began aligning the curriculum and changed the school to a year-round calendar, but it hardly monitored student achievement. In 2002–03, the district implemented a districtwide attendance policy. Parents of students absent 10 days were required to meet with the district attorney, a social worker, and a school representative and could be fined or jailed. The combination of principal and district reform efforts resulted in a climate of increased expectations for all students and of collaboration and support among school staff. The district provided weekly professional development workshops for all teachers on differentiated instruction, developing a high-performing learning community, classroom management, and on curriculum alignment with state content standards since 2003–04. It also created separate reading and language arts classes at Dogwood because it recognized that middle school students required additional reading instruction. The district relinquished to Dogwood the responsibility for developing the school budget and selecting professional development activities. In 2006–07, the district required mandatory Monday meetings for professional development in teaching reading to middle school students. Meetings included book studies on differentiated instruction and district presentations on curriculum guides, tools, and resources. The district shared assessment data with the school board, students, parents, community, and local press. For a chronology of critical events see Exhibit C.25.

Appendix C 152
Exhibit C.23 School and State Student Achievement (2002–07), Reading

Appendix C 153
Exhibit C.24 School and State Student Achievement (2002–07), English Language Arts

Appendix C 154
Exhibit C.25 School and State Student Achievement (2002–07), Mathematics
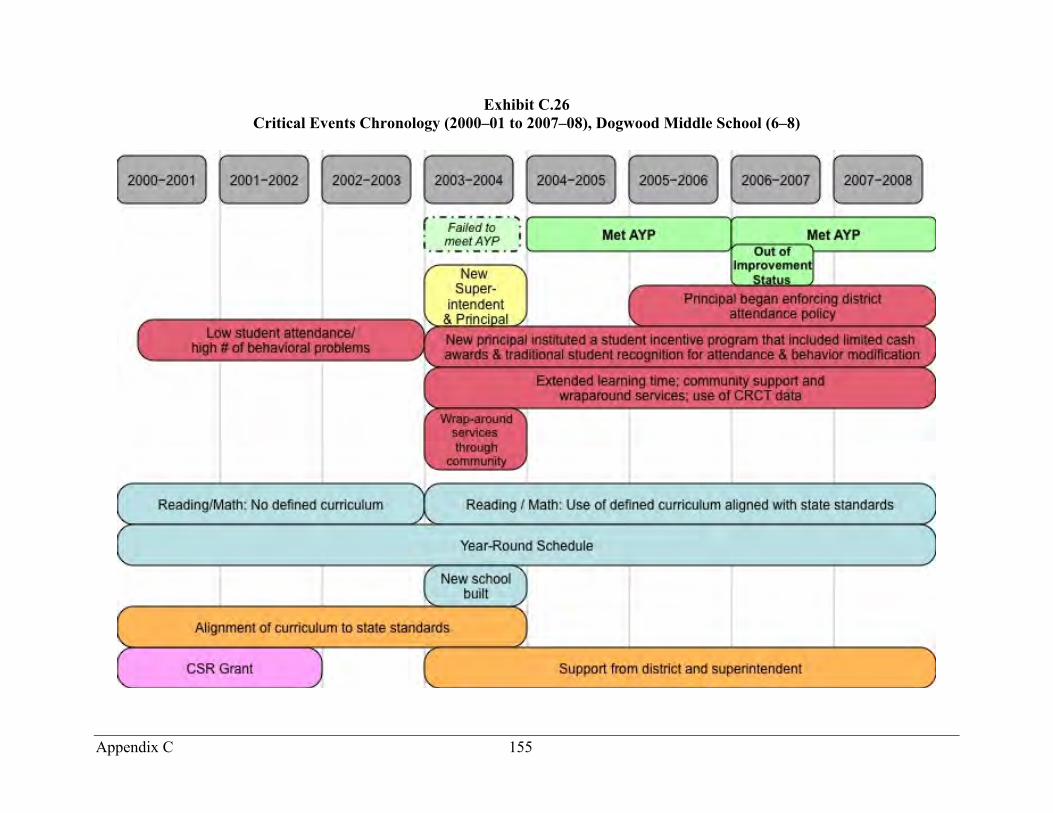
Appendix C 155
Exhibit C.26 Critical Events Chronology (2000–01 to 2007–08), Dogwood Middle School (6–8)

Appendix C 156
Martin Elementary School
Overview
Martin Elementary is a pre-K through 5 school in a northern city public school system. Located in a southern section of the city on a small peninsula, this school is somewhat isolated geographically. The school is also very close to a neighboring county. For the 2007–08 school year, enrollment was 425 students. Of these students, 41 percent are black, 39 percent white, and 16 percent Hispanic. Across the school district, approximately 90 percent of the students are black, 8 percent are white. Student mobility is constant, with more than one-third of the students entering and leaving the school during the year. Many properties near the school are rentals. Not too many years ago, most residents owned their homes. Safety concerns prevent the teachers from allowing the students to play on the school’s recently built playground. Drug dealing exists in the neighborhood, yet some respondents interviewed considered the school to be somewhat of a haven for its students. When a new principal arrived at the beginning of the 1999–2000 school year, he had to transform a dysfunctional school. There were nearly 2,000 office referrals. A culture of blame for low student achievement permeated the school. The school was on a list of the 10 worst schools for compliance with special education requirements. This brought added attention from a federal court monitor.
Achievement Pattern
From 2003 to 2007 the achievement levels in this school showed steady growth. Large gains in reading and math in 2004 were followed by continuous, though smaller improvements. The initial gain of 19 percentage points made the reading achievement level comparable to the district average, though still well below the state. Subsequent achievement gains were comparable to districtwide improvements (see Exhibit C.27). The pattern of math achievement was very similar (see Exhibit C.28). This school has met AYP every year in all achievement categories. AYP for attendance was met every year except for the 2005–06 school year.
This school was selected as a comparison school for another site in this study, Cooke. While achievement gains in Cooke substantially exceeded those shown for Martin through the data available at the time of sample selection (i.e., through spring 2005), Cooke dropped fairly substantially over the subsequent two years, while Martin achievement continued to grow. In retrospect, Cooke Elementary can be seen as a low-performing school that rose fairly dramatically (but then declined), while Martin has been able to sustain and continue its more gradual ascent.
This school experienced sharp demographic shifts from the 1999–2000 school year to the more recent school years. Total enrollment, racial composition, students eligible for the federal school lunch program, as well as students with disabilities have all fluctuated. In 1999–2000, the racial composition of the school was markedly different. At that time, the student population was 86 percent white, 12 percent black, and less than 1 percent Hispanic. By the 2004–05 school year, the percentage of black students increased by a factor of three; Hispanic students made up 9
Appendix C 157
percent of the enrollment, and white students decreased by 30 percentage points. At the same time, the percentage of students eligible for the federal school lunch program increased from 64 percent to 82 percent. The percentage of students with disabilities was 14.5 percent. Over the next three years, the percentage of Hispanic students doubled to 16.5 percent, while the number of black students continued to increase, and the number of white students continued to decrease. The percentages of poor students and of students with disabilities decreased slightly during this period.
School Activities
The principal in charge of this school during the CSR award period arrived for the 1999–2000 school year. After dealing with immediate student behavior problems, he began instituting new reforms for academic progress. By the 2001–02 school year, teachers had multiple years of experience with the Open Court curriculum and a better understanding of how to teach reading in grades K through 3. The Core Knowledge curriculum was implemented to improve instruction in grades 4 and 5. Project Achieve was implemented to improve student behavior. Other reforms during that year included the creation of an Instructional Technology Integration Program to introduce technology into teaching. With the direct participation of teachers, the school selected and implemented the Core Knowledge model. The Project Achieve behavioral intervention program was implemented also. More teachers began using technology, for which they received training. The principal implemented programs to make learning more interactive. At the same time, according to teachers, he created a learning community among staff by giving them authority for selecting new teachers and creating an environment in which risks and failure were acceptable. This self-described change-agent principal left the schools at the same time the CSR grant expired and accepted a position as a director of coaching, training, and school support with a school leadership development organization.
The fall of 2005 brought a new principal. There was some staff turnover that year also. The new principal selected all new hires, in contrast to the previous principal’s policy of letting the school’s teachers select new teachers. Technology improvements continued, so that all teachers had whiteboards and laptop computers for instructional use. To support a learning community environment, the principal rearranged the schedule to allow more common planning time. Collegiality was also supported through participation of all teachers on the School Improvement Team. Work on a subcommittee required analyzing relevant data and developing strategies for improvement. Writing became a priority when Basic Constructed Response (BCR) assignments were mandated by the district. In 2007–08, more scripted science and social studies curricula were mandated. Hence, Core Knowledge was phased out. Project Achieve was discontinued when the program teacher left the school. Also of note, the new voluntary state curriculum had a direct influence on the school. The former principal required the school to align its curriculum with the voluntary state curriculum. For the new principal, district policy directly influenced the school curriculum. Core Knowledge was required for science and social studies, while Scott Foresman was required for math.

Appendix C 158
Additional Facts Beginning with the 2008–09 school year, this school will add sixth-grade students, thus becoming an extended elementary school. Additional grades will be added over the following two school years to make this a K–8 school. Overcrowding may be an issue.

Appendix C 159
Exhibit C.27 School, District, and State Student Achievement (2003–07), Reading

Appendix C 160
Exhibit C.28 School, District, and State Student Achievement (2003–07), Mathematics

Appendix C 161
Exhibit C.29 Critical Events Chronology (2000–01 to 2007–08), Martin Elementary School (PK–5)

Appendix C 162
Chelsea Elementary School
Overview
Chelsea School (pre-K–8) is situated in a neighborhood that has gentrified over the last 10 years. Serving 278 students in 2007–08, Chelsea has changed drastically since the late 1990s, when it served over 1,000 students and had what interviewees referred to as “gang problems.” Chelsea enrolled 571 students in 2001–02 and had further enrollment declines in 2003–04 (of 28 percent) and 2004–05 (19 percent). Several interviewees noted that increased rents caused the declines, as couples without children replaced low-income families with children. Some families who moved out continued to send their children to Chelsea, but most did not. Through 2004–05, students were bused in from other neighborhoods. Teachers welcomed the end of busing, noting that other schools had been sending their lower-performing students. Between 2001 and 2007, the proportion of low-income students32 remained at or above 90 percent; the proportion of Hispanic students ranged from 83 to 90 percent, and English language learners ranged from 23 to 29 percent.
School leadership was remarkably stable. The new principal in 2007–08 had worked at Chelsea for 30 years, just previously serving as assistant principal. The previous principal spent over 30 years in the position. Teacher staffing was also stable, with average experience at least 13 years since 2000–01, though diminishing enrollment has compelled annual teacher reductions. As of the 2007–08 school year, Chelsea had 15 teachers.
Achievement Pattern
Chelsea demonstrated quick and dramatic achievement gains in both reading and mathematics between spring 2003 and 2007. From spring 2003 to 2005, the proportion of students meeting or exceeding state standards in reading increased by 30 percentage points to 63 percent (compared to a six-point gain at the district level and two-point gain at the state level), equaling the state-level proportion and exceeding the district-level proportion by 15 points (see Exhibit C.30). In mathematics, from 2003 to 2006, the proportion of students meeting or exceeding standards increased by 55 points to 80 percent (compared to 22-point and 10-point gains by the district and state, respectively), ultimately exceeding the district-level proportion by 16 points and nearly equaling the state level of 82 percent (see Exhibit C.31). Chelsea made adequate yearly progress (AYP) in 2005–06 and 2006–07, exiting program improvement status, after failing to make AYP since 2002–03. By district mandate, Chelsea became a magnet “cluster” school focused on mathematics and science in August 2003. Unlike typical magnets in the district, a “cluster” school has attendance boundaries and offers a programmatic theme in collaboration with several other schools in its neighborhood. Families outside of attendance boundaries may apply for openings not filled by neighborhood students.
32 Students eligible for the federal lunch program, living in institutions for neglected or delinquent children, supported with public funds in foster homes, or from families receiving public aid.
Appendix C 163
School Activities
Beginning in 2001–02, Chelsea began working closely with a community partner to provide extended day learning programs and increase parent involvement at the school. These efforts were sparked by parent concerns that students did not have a “safe haven” during after-school hours. Chelsea received two major grants, a five-year district grant (which was later extended for a sixth year) and two federal 21st-Century Community Learning grants (in 2002–03 and 2005–06, the latter for $100,000), both to fund before- and after-school programs. These programs provided students with intensive tutoring, remediation, and enrichment and were predominantly staffed by teachers. Funds were also used to sponsor quarterly parent events—a reading night, a math and science night, a sports event, and “Kermes,” a Mexican tradition celebrating student completion of a school year. These events still take place at Chelsea. Parents are also members of the school council established in the 1980s, which includes the principal, two teachers, six parents, and two community members. The school council approves the School Improvement Plan and school expenditures. A parent group, facilitated by the community partner, meets weekly and provides classroom volunteers, helps with grading papers, assists English learners, and helps plan family events. Parents also take computer classes at Chelsea once a week. Parents interviewed expressed satisfaction with the current principal—indicating she maintained the same leadership style as the prior principal—and the level of communication from the school.
In 2001–02, Chelsea also received a federal GEAR UP grant, funded through 2006–07. Staff used funds to provide teacher professional development in analysis of student data. Chelsea also hired a professor from a nearby university to consult and work with teachers on data analysis and use of student data to guide improvement efforts. In 2002–03, the principal and assistant principal decided to focus on teacher quality by hiring “more qualified” teachers as teachers who were not in line with their reform plans left. They also provided more ongoing supervision, including weekly meetings and formal walkthroughs. In 2003–04, Chelsea received a three-year Reading First grant and introduced a new reading program by mandate of the district Area Instructional Office. In 2005–06, Chelsea adopted new mathematics curricula—Everyday Math (K–5) and Connected Math (6–8). However, even though the school adopted pre-packaged curricula, the principal gave teachers individual flexibility on how to teach reading and mathematics, so long as student achievement remained high.
The district, through the Area Instructional Office, provided a mathematics coach, two literacy coaches, and two English learner specialists who conducted workshops and modeled lessons for teachers. Coaches and specialists visited the school at least biweekly. In 2005–06, district coaches provided professional development on use of the new mathematics programs. They conducted formal walkthroughs to ensure that curricula were being implemented, although one teacher noted using the adopted mathematics curriculum only when observed. For a chronology of critical events, see Exhibit C.32.
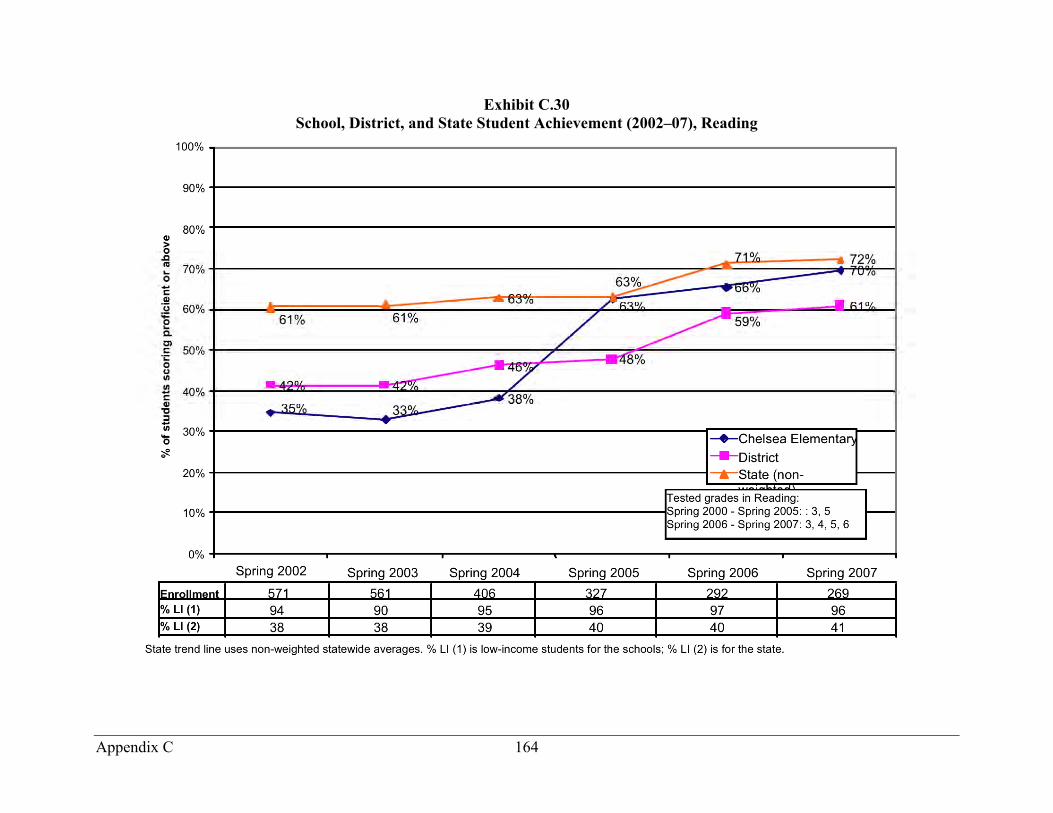
Appendix C 164
Exhibit C.30 School, District, and State Student Achievement (2002–07), Reading
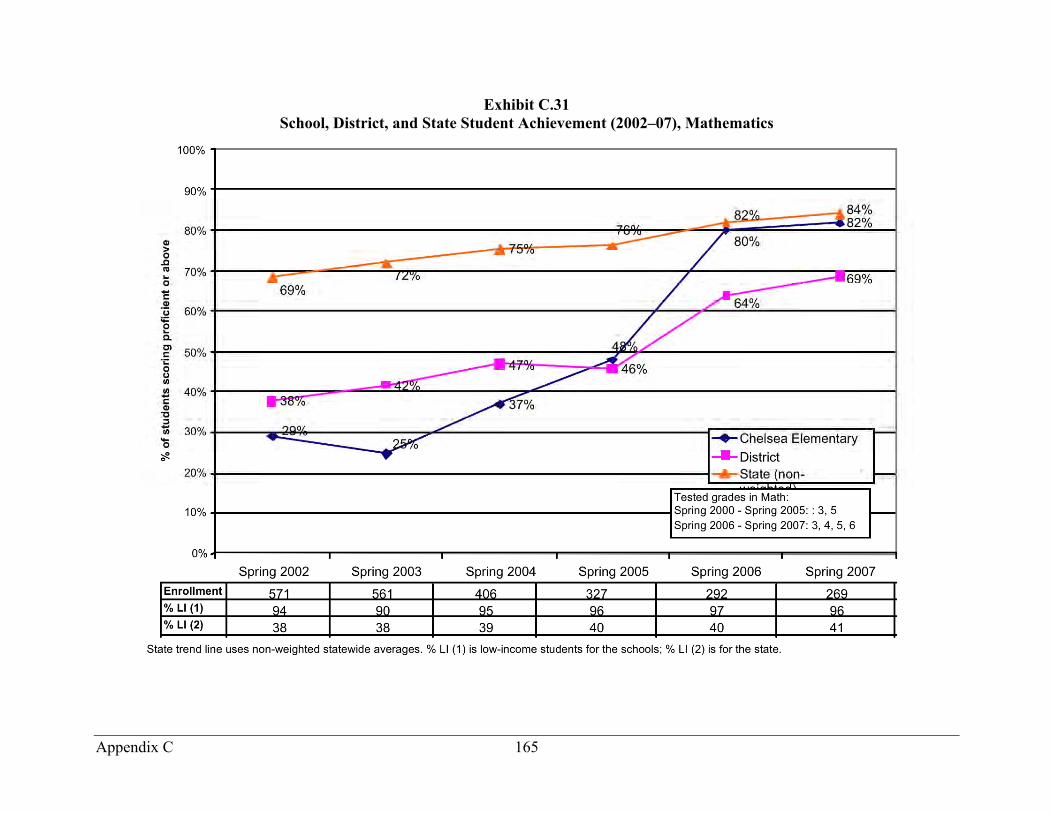
Appendix C 165
Exhibit C.31 School, District, and State Student Achievement (2002–07), Mathematics

Appendix C 166
Exhibit C.32 Critical Events Chronology (2000–01 to 2007–08), Chelsea Elementary School (PK–8)
Appendix C 167
Cooke Elementary School
Overview
Cooke is a K–5 elementary school in the located in the southwestern section of a city. The school’s neighborhood is both racially and economically diverse. Although the vast majority of residents in the surrounding ZIP Code have a high school level education or less, there are some college graduates, including a few with advanced degrees. Grants are available to encourage small business development, and incentives are available to attract new residents. As of the 2007–08 school year, the school enrolls approximately 300 students. More than 90 percent are eligible for the federal school lunch program. Slightly more than half are black (56 percent), one quarter are white (25 percent), and 9 percent are Hispanic. The percentage of black students is much lower than the overall district rate of 88 percent. One of the community partners indicated that many of the students have families in which someone is afflicted with substance abuse problems, and “a lot of the students are living with their grandparents because their parents are drug-addicted.” Drug dealers and prostitutes transact their business in the neighborhood around the school.
Achievement Pattern
The net increase in the percentages of students scoring at the proficient level or higher was 18 percentage points in both reading and math from 2003 to 2007. However, the patterns are best described as dramatic increases followed by at least partial decline. In reading, gains over two years raised the percent proficient by 36 points and virtually identical with the state level. But this increase was followed by a 20-point decline over the next two years, bringing the school’s performance level well below the state average (see Exhibit C.33). Similarly, in math, two years of large gains were followed by another two of sharp declines (see Exhibit C.34). The school made adequate yearly progress (AYP) in the first four years represented in the exhibits. At the end of the 2003–04 school year, it exited the state school improvement process. The school did not make AYP in 2007 due to poor performance among students with disabilities and students eligible for the federal lunch program.
This school experienced some demographic shifts in recent years. Since 2002–03, the percentage of Hispanic students has more than doubled. Also, the percentage of black students increased by 6 percentage points, while the percentage of white students decreased by 9 percentage points. Students with disabilities have consistently made up 15 to 18 percent of all the school’s students. This exceeds the district-level average of 13 percent for elementary schools.
School Activities
According to almost everyone interviewed during the site visit, the leadership of the school principal was the major influence on this school’s improvement. Upon her arrival in fall 2002, the principal quickly established herself as the school leader. Policies and practices, such as how to enter and exit the school, were put in place to improve student behavior. A “Very Good Store”

Appendix C 168
was established, so students could redeem credits for good behavior. Because parent behavior had been an issue, parents were no longer permitted to roam the halls at will. These initial actions helped to make the school environment more conducive to learning.
The principal established herself as the instructional leader through her presence in the classroom and by improving the skills of her teachers. Her methods included routine classroom walkthroughs with feedback and an emphasis on data-driven decision-making. The main source of information was the attendance and achievement data book that each teacher kept on his or her class. The principal required the data book and compelled the teachers to have current information and to regularly analyze it.
Teachers were supported and a climate was created in which teachers could openly exchange ideas and seek support or guidance from each other as well as from the principal. While it was clear that the principal was the ultimate decision maker, all teachers had input into the operation of the school. All teachers served on a School Improvement Plan committee. A clear focus on students by the administration and staff guides the school.
For its curriculum, the school used Direct Instruction for reading and math through the 2005–06 school year. Professional development support from the district declined after the district switched from Direct Instruction. A teacher-led study at the school found a lack of alignment between the curriculum and the voluntary state curriculum, so a change request was made to the district administration. After a one-year delay, Open Court Reading (OCR) and Scott Foresman Math (SFM) were implemented for the 2006–07 school year. Teachers who had been in the school more than five years had a tougher time with the shift because they had become accustomed to the scripted nature of Direct Instruction. In the conversion to Open Court and Scott Foresman, teachers received professional development over the summer for Open Court and used professional development days during the year for Scott Foresman. Also, teachers participated in after-school professional development in the new curricula; the principal funded this with Title I funds.
Teacher turnover tended to be low, except for two time periods. Approximately one-third of the teachers left the school at the same time the principal arrived. The principal described her new teachers as “eager to learn at every moment.” Other notable staff changes occurred in 2006–07 when three new teachers came to this school, and the school had two fewer classroom teachers than in previous school years. The decline of two teachers in this small school represented 10 percent of the classroom teachers. For a chronology of critical events see Exhibit C.35.

Appendix C 169
Exhibit C.33 School, District, and State Student Achievement (2003–07), Reading

Appendix C 170
Exhibit C.34 School, District, and State Student Achievement (2003–07), Mathematics
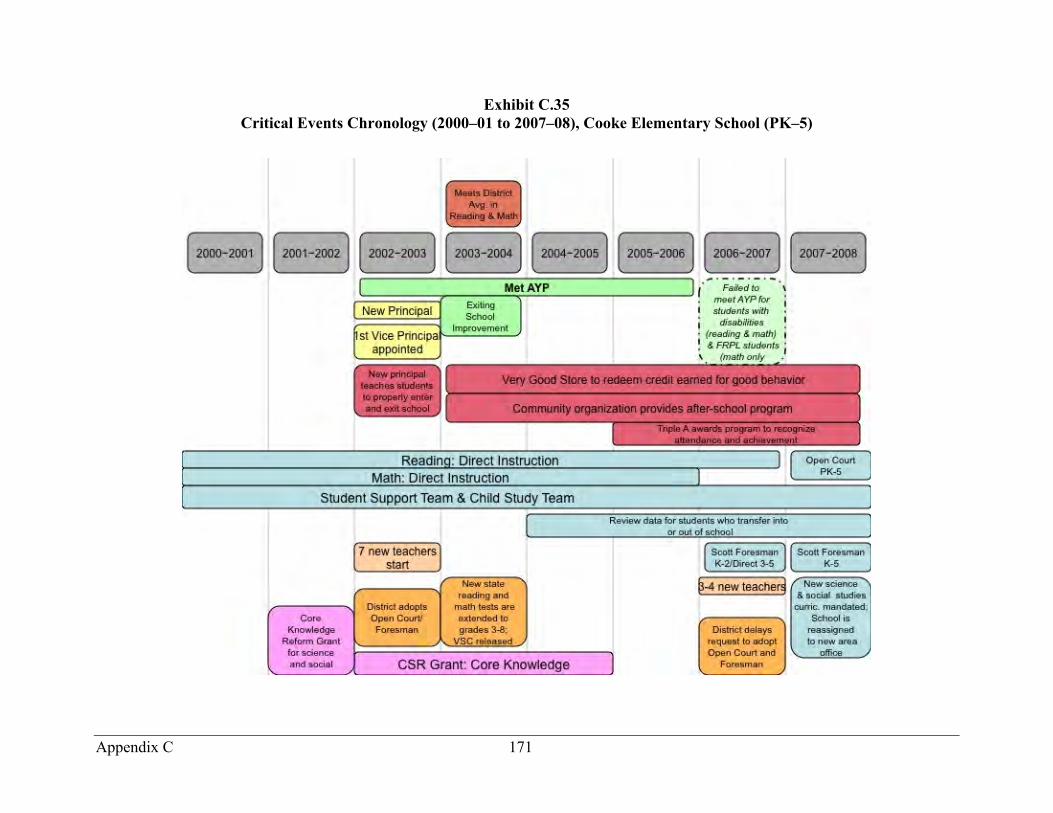
Appendix C 171
Exhibit C.35 Critical Events Chronology (2000–01 to 2007–08), Cooke Elementary School (PK–5)

