acoustic cavitation for engineering of gold sols in silver
TRANSCRIPT

Ultrasonics Sonochemistry 18 (2011) 853–863
Contents lists available at ScienceDirect
Ultrasonics Sonochemistry
journal homepage: www.elsevier .com/ locate /ul tsonch
Acoustic cavitation for engineering of gold sols in silver nitrate solutions
Darya V. Radziuk, Dmitry G. Shchukin, Helmuth Möhwald ⇑Max-Planck Institute of Colloids and Interfaces, D14424 Potsdam, Germany
a r t i c l e i n f o
Article history:Received 20 July 2010Received in revised form 25 October 2010Accepted 26 November 2010Available online 14 December 2010
Keywords:SonochemistryGold–silverAlloyMorphologyCrystallinity
1350-4177/$ - see front matter � 2010 Elsevier B.V. Adoi:10.1016/j.ultsonch.2010.11.013
⇑ Corresponding author. Tel.: +49 (0) 331 567 9201E-mail address: [email protected]
a b s t r a c t
Binary gold–silver nanostructures of preformed gold nanoparticles (25 nm) in silver nitrate solutions areproduced by a two step sonication (20 kHz). Ultrasonic treatment of gold–silver mixtures is carried out inthe presence of sodium dodecyl sulfate in water or 2-propanol, and poly(vinyl pyrrolidone) in ethyleneglycol solutions. Gold–silver nano-worms, which consist of ripened gold particles connected by ultrason-ically reduced silver, are formed after 1 h of sonication in the presence of sodium dodecyl sulfate aqueoussolution. In 2-propanol bimetallic nano-worms have a well defined core–shell structure. Polygonal alloynanoparticles with gold as a core material and a silver shell are produced after 180 min of sonication inthe presence of poly(vinyl pyrrolidone) in ethylene glycol solution. Bimetallic gold–silver nanostructureshave defected face centered cubic structure and represent polycrystals with a large number of crystallitesrandomly oriented. For the first time, the mechanism of gold particle design by ultrasound is examined indetail. The role of additives (sodium dodecyl sulfate, polyvinyl pyrrolidone, ethylene glycol and 2-propa-nol) as reductants of silver at the gold contact surface or stabilizers of particles is highlighted.
� 2010 Elsevier B.V. All rights reserved.
1. Introduction
Colloidal gold is the most stable metal dispersion towards mois-ture, oxygen and most corrosive reagents. The main advantages ofgold particles are biocompatibility and conjugation with antibod-ies, proteins and DNA [1,2], and ease of surface functionalization[3–12]. Moreover, gold sols of different morphology can be em-ployed as models for the investigation of nanoparticle behaviourunder extremely high pressures and temperatures [13].
Morphological modification of gold with one of the other metals(Pd, Fe, Ag, Pt) at the nanoscale for surface-enhanced Raman scat-tering (SERS) surfaces, drug delivery, biological sensing, nonlinearoptical switching, and catalysis is an interesting aspect of modernnanotechnology. As one of the most known examples, nanoparti-cles with a gold-core and palladium-shell show higher activitiesfor the hydrogenation of 4-pentenoic acid than for those of themixtures of monometallic nanoparticles with the correspondingAu/Pd ratio [14]. Gold-coated iron (Fe@Au) nanoparticles werefound superparamagnetic with a lower blocking temperature of42 K [15] as compared to iron nanoparticles with the samedimension.
Moreover, the bimetallic nanoparticles obtain not onlyenhanced, but tunable optical properties in the ultraviolet, visibleand near infrared region, which is a special case of binary gold–silver nanoparticles [16,17]. Metallic silver is a technologically
ll rights reserved.
; fax: +49 (0) 331 567 9202.e (H. Möhwald).
important material, since it has the highest conductivity andreflectivity among all metals and exhibits size-dependent catalyticactivity. In addition, silver has strong toxicity in various chemicalforms to a wide range of microorganisms and is used as sterilizerfor removal of bacteria in drinking water. Both gold and silver atthe nanometre scale are especially attractive in the industrialapplication due to the optical and electronic properties dependingon their morphology [18] and shape-dependent surface plasmonresonance [19]. Despite the fact, that gold has lower opticalenhancement factors than silver does [20], gold particles couldbe easier prepared as monodisperse nanoparticles with differentdiameters [21]. The preformed gold nanoparticles coated with sil-ver have a narrower size distribution than typical original silverand stronger SERS response in comparison to gold [22].
Different synthesis procedures have been applied up to date forformation of colloidal gold: citrate reduction [23]; the Brust–Schif-frin method [24], which is a two-phase synthesis and stabilizationby thiols; wet chemical synthesis based on seed-growth mecha-nism [25], a variety of physico-chemical methods such as photo-chemical method (UV, near-IR) [26,27], radiolysis [28–30],aerosol technology [31], thermolysis [32–34], and ultrasonicapproach. Sonochemical formation of gold sols was first reportedby the group of Grieser 17 years ago [35]. Gold particles werereduced by ultrasonic treatment of aqueous HAuCl4 solutions at20 kHz in the presence of alcohols (different types and concentra-tion) and have a diameter less than 10 nm. Later a detailed workreported about the ultrasonic synthesis of gold particles withaverage diameters from 9 to 25 nm in the presence of aliphaticalcohols and sodium dodecyl sulfate [36]. The study of

854 D.V. Radziuk et al. / Ultrasonics Sonochemistry 18 (2011) 853–863
sonochemical reduction of Au(III) ions from aqueous HAuCl4 solu-tion in the presence of alcohol was extended from ultrasound of20 kHz to 213 kHz, 358 kHz, 647 kHz and 1062 kHz [37]. The factthat the particle growth can be inhibited by surfactant adsorptiononto the particle surface [38] was realized to form gold nanoparti-cles with narrow size distribution [39] and of different structure(1-D [40] and 2-D [41–43]). The morphology of ultrasonicallyformed gold particles is controlled by the metal and surfactant mo-lar ratio.
For silver particle dispersions, the most known approaches arecondensation methods, which are chemical reduction of silver ionsfrom their salt in different solvents by sodium borohydride [44] ororganic (citric acid [23], ascorbic acid [45], formaldehyde [46],aminosilanes [47]) reducing agents. However, the major problemof these methods is a limited flexibility in the size of particles,which is less than 10 nm. Although small size is desirable in catal-ysis due to the favourable surface-to-volume ratio, for opticalapplications larger diameters are often necessary. Moreover, smallparticles do not interact with light nearly as efficiently as thosethat have 20–100 nm diameter. On the other hand, the plasmonresonances in larger silver sols have a significant light-scatteringcomponent that can be advantageously used in applications thatrequire efficient optical labels, such as in chemical assays.
Numerous non-traditional approaches, in turn, are developed toform silver particles through high temperature [48] and photo-reduction [49], electron irradiation [50], electrochemical procedure[51] and laser ablation [52]. Unfortunately the main problems forthese methods are the high polydispersity and lack of particle crys-tallinity as well as the cost and scalability of sol production. There-fore the synthetic procedure should address all of the abovementioned problems and yield particles with undesired moleculeson the surface to avoid the alteration of surface and optical proper-ties. The sonochemical method as one of the alternatives to theother non-traditional procedures allows one to form silver parti-cles with the diameter from 18 to 350 nm, different morphology[53–58] and crystallinity (crystalline [59] and amorphicity [60]).
In colloid science bimetallic Ag–Au nanoparticles are mainlyprepared by reduction of the ions of silver (e.g. AgNO3) and gold(e.g. HAuCl4) in refluxed aqueous solutions of sodium borohydrideand sodium citrate [61] or only of the last one [62]. The advantageof the ‘citrate’ procedure is that trisodium citrate dihydrate (TCD)is used as both reducing agent and stabilizer of gold nanoparticles.The only difficulty is to find an appropriate concentration of TCDfor the reduction rate and nucleation-to-growth ratio for the for-mation of monodisperse gold nanoparticles. The as formed parti-cles are long-lived and their surface can be used for design withsilver.
Co-reduction of gold and silver ions from the mixture eithercontaining both metal precursors [63], preformed sols of one ofthe metals (Au or Ag) in the presence of acid or salt of the otherone [64], is recently documented by the sonochemical approach.Moreover, bimetallic Au–Ag alloy nanoparticles can be preparedby fusion of gold and silver aqueous sols during ultrasonic treat-ment [65].
The general idea of the ultrasonic method is the creation of ahighly non-equilibrium microenvironment (cavitation bubbles) in-side a bulk solution at normal conditions and the utilization of thethermal (formation of free radicals) and mechanical (shock waves,microjets or turbulent flows) energy from the implosive bubblecollapse. Normally the ultrasonic treatment of metal dispersionsis carried out in the presence of surface active additives (surfac-tants or solvent molecules). On one hand, surface active materialsreact with free radicals due to the accumulation at the gas/liquidinterface and form secondary radicals which enhance heteroge-neous reduction of metal ions. On the other hand, surfactants con-trol the hydrophilicity and surface charge of colloidal sols for
adsorption at the bubble interface. Particles which are at the gas/li-quid interface can either penetrate into the hot spot region for fu-sion or react with radicals and the ions of the other metal. Themorphology and elemental composition of the bimetallic productsis achieved by the nature of surfactants, tuning the molar concen-tration of metal (Au, Ag) precursors and ultrasonic treatment con-ditions (ultrasonic intensity and duration). Typically the structureof sonochemically prepared gold–silver particles is a core–shell.Gold as a core material is formed first since it has a larger redox po-tential (Au3+ ? Au: 1.02 V) than silver does (Ag+ ? Ag: 0.7996 V),which is reduced at a lower rate and coats the gold surface.
The presented work is the new continuation of our previous re-port on the sonochemical design of preformed gold nanoparticlesin silver nitrate aqueous solutions [64]. In contrast to the descrip-tive nature of the earlier article, the present manuscript elucidatesthe role of surface active additives (sodium dodecyl sulfate andpoly(vinyl pyrrolidone)) and solutes (2-propanol and ethylene gly-col) in the silver reduction to produce gold–silver nanostructureswith different morphology. It is important to emphasize, that theroles of surface active materials, which act as stabilizers or reduc-tants are distinguished during vigorous stirring as a control exper-iment and by elemental mapping analysis of binary Au–Agnanostructures. Moreover, the examined surface plasmon reso-nance band, crystalline structure and elemental composition ofultrasonically treated gold sols without silver nitrate in the pres-ence of sodium dodecyl sulfate in aqueous solution proves thatgold–silver nano-worms consist of ripened gold nanoparticles,which are connected by reduced silver in between. In addition,the core–shell structure of binary gold–silver particles with so-dium dodecyl sulfate in 2-propanol solution is proved by compar-ison of elemental composition patterns of Au–Ag nano-worms inwater. Furthermore, the kinetics formation of silver shell at thesurface of preformed gold nanoparticles in the presence of polyvi-nyl pyrrolidone in ethylene glycol solution is expanded by thestudy of elemental composition versus time and crystalline struc-ture of binary nanostructures. Moreover, preformed gold nanopar-ticles in silver nitrate solution are substituted by silver sols in orderto elucidate the silver reduction during sonication.
2. Experimental section
2.1. Materials
Silver nitrate (AgNO3, 99.8%), trisodium citrate dihydrate(C6H5Na3O7�2H2O, >99%), ethylene glycol (EG, �99.5%), poly(vinylpyrrolidone) K-30 (PVP K-30, 40 kDa) were purchased from Sig-ma–Aldrich (Munich, Germany). Hydrogen tetrachloroaurate (III)trihydrate (HAuCl4�3H2O, 99.99%) and sodium n-dodecyl sulfate(SDS, 99%) were purchased from Alfa Aesar (Karlsruhe, Germany).2-Propanol (>99.7%) was bought from Merck (Darmstadt,Germany).
All chemicals were used without further purification. The waterused in all experiments was prepared in an Integra UV plus purifi-cation system (Wasseraufbereitung und Regenerierstation GmbH,Barsbüttel, Germany) and had a conductivity 0.055 lS cm�1.
2.2. Synthesis of gold nanoparticles
Gold nanoparticles were prepared following the citratereduction method modified by Frens [21]. The procedure was car-ried out in a 1 L round-bottom flask prewashed in concentrated ni-tric acid, rinsed in water and oven-dried prior to use. Fresh38.8 mmol L�1 trisodium citrate dihydrate aqueous solution wasrapidly added to 500 mL of 1 mmol L�1 HAuCl4 and heated to theboiling point. The gold solution changed the colour from pale

D.V. Radziuk et al. / Ultrasonics Sonochemistry 18 (2011) 853–863 855
yellow to burgundy, indicating the formation of colloidal gold.Boiling was continued for 10 min, then the heating mantle was re-moved and stirring lasted for additional 15 min. After the solutionreached room temperature, it was dialysed through a cellulose dia-lysing tube against 1.1 L of 38.8 mmol L�1 C6H5Na3O7�2H2O for42 h. The calculated concentration of formed gold nanoparticlesin solution is 0.97 mmol L�1. The prepared gold colloidal solutionwas kept at 4 �C, and no sediment was observed during severalweeks after the synthesis.
2.3. Ultrasonic treatment conditions
A tightly closed home made batch reactor of ca. 50 mL equippedwith a Fryka KT 06-42 thermo-cryostat was used to sonicate solu-tions of nanoparticles with ultrasound. Ultrasonic treatment wasprovided by a Vibra Cell (VCX 505, 20 kHz) ultrasonic processorpurchased from Sonics & Materials Inc. (Newtown, USA) with atitanium alloy probe having 0.700 solid tip, which was immersedabout 1.5 cm below the surface of the exposed solution. The colloi-dal solutions were bubbled with argon (O2 < 2 ppmv, air liquid)20 min each time in every ultrasonic procedure before and duringthe ultrasonic treatment at a rate of 200 mL min�1 to eliminate theoxygen in the solutions. The temperature of the solutions did notexceed 50 �C during ultrasonic treatment.
The sonication of preformed gold nanoparticles in silver nitratesolutions in the presence of additives was carried out stepwise.
2.3.1. Sodium dodecyl sulfate in aqueous solution17.28 mg of SDS in 30 mL of H2O was stirred for 15 min and
then 7.5 mL of 40 mmol dm�3 AgNO3 was added, and the mixturewas sonicated for 30 min at 23.8 W cm�2. 7.5 mL of 5 mmol dm�3
concentration of preformed colloidal gold solution was mixed with4.25 mg of SDS, shaken for 15 min and then added to the sonicatedSDS–silver solution for ultrasonic treatment for 60 min at38.9 W cm�2.
2.3.2. Sodium dodecyl sulfate in 2-propanol solution17.28 mg of SDS was dissolved in 30 mL of 2-propanol and stir-
red for 24 h in conical glass. Then the mixture was added to 7.5 mLof 40 mmol dm�3 AgNO3 and sonicated for 30 min at 23.8 W cm�2.As soon as the sonication was completed 7.5 mL of 5 mmol dm�3
concentration of preformed colloidal gold solution with 4.25 mgof SDS was added into the sonicated SDS–silver solution, and thenthe mixture was ultrasonically treated for 60 min at 38.9 W cm�2.
2.3.3. Poly(vinyl pyrrolidone) in ethylene glycol solution12.5 mg of poly(vinyl pyrrolidone) was stirred overnight in
30 mL of ethylene glycol. 15 mL of this organic mixture was addedto 7.5 mL of 40 mmol dm�3 AgNO3 and sonicated for 30 min at23.8 W cm�2. Then 3.1 mg of PVP was added to 7.5 mL of5 mmol dm�3 concentration of preformed colloidal gold solutionand stirred for 6 h. As the next step, the PVP–colloidal gold solutionwas mixed with sonicated PVP–silver solution, and the mixturewas ultrasonically treated for 60 min at 38.9 W cm�2.
2.4. Characterization
The UV–Vis spectrophotometer Varian CARY 50 (Varian Inc.,USA) was used to record absorbance spectra in the wavelengthrange from 250 nm to 1000 nm with precision of 0.2 nm using aquartz cell with 1 cm path length, and a quartz halogen lamp(315–1200 nm) served as the light source. The zeta potential val-ues of colloidal solutions were measured employing a Nano ZetaSizer (Malvern Instruments Ltd., United Kingdom). A conventionaltransmission electron microscope (TEM) Zeiss EM 912 Omega (CarlZeiss AG, Germany), which is operated at 120 kV was employed for
illumination of the samples by an electron beam to visualize theparticle morphology and structure through the difference of theTEM image contrast at a moderate resolution of 0.34 nm. Thetransmission electron microscope (TEM) Zeiss EM 912 Omega (CarlZeiss AG, Germany), equipped with an electron diffraction unit wasutilized to obtain information about the crystal structure and localorientation of samples, allowing to distinguish between differentcrystallographic phases. The unit cell and symmetry of an un-known phase determined from the geometry of the diffraction pat-tern [66], with proper interpretation of the intensities of spots,yields the positions of atoms in the crystal.
Scanning transmission electron microscopy (STEM) measure-ments were conducted using a transmission electron microscopePhilips CM200 LaB6 with scanning electron transmission micros-copy unit and energy dispersive X-ray detector (Genesis 4000)operating at 200 kV with a maximum resolution of 0.23 nm for ele-mental mapping. At each spot, the generated signal is simulta-neously recorded by selected detectors, building up point bypoint an image to detect small clusters or single atoms of a heavymetal in a matrix of light elements (Z-contrast), to visualize di-rectly the nanostructures. The crystal structure of nanoparticleswas investigated by a D8 Bruker wide angle X-ray diffractometer(XRD). Gold–silver colloidal mixtures were first washed at a rota-tion speed of 13,000 min�1 and five centrifugation times withwater at room temperature in a Sigma 1–15 K centrifuge and driedat 60 �C overnight to prepare the nanoparticle powder for XRDmeasurements. Energy dispersive X-ray fluorescence diagrams ofsamples were recorded by a DSM 940 (Zeiss AG, Germany) scan-ning electron microscope, which is fitted with a micro-analyticalsystem (Link ISIS System, Oxford Instruments).
3. Results and discussion
3.1. Preformed gold nanoparticles in silver nitrate solutions withsodium dodecyl sulfate
3.1.1. Formation of gold–silver nano-wormsGold nanoparticles (Au NPs) are prepared via the ‘citrate’ meth-
od based on the paper of Turkevich [23]. The final Au NPs have adiameter of (25 ± 3 nm) with negative n potential of �51 ± 5 mV.No visible sediment and no change in the colour of monodispersespherical gold NPs appeared for at least a month of storing at roomtemperature.
The gold–silver mixture is sonicated with sodium dodecyl sul-fate in water or in 2-propanol solutions in two steps. After ultra-sonic treatment the resulting Au–Ag/SDS/water solution becametransparent, while the Au–Ag/SDS/2-propanol solution changedthe colour from violet to light-cognac, and dark grey sediment ap-peared on the bottom of the vessel in both types of solutions. TheUV–Visible spectra of the gold–silver mixture with SDS in water orin 2-propanol are shown in Fig. 1A and B, respectively.
Fig. 1A shows a baseline with a broad shoulder from silver ni-trate in SDS aqueous solution (as indicated by the black curve)and a surface plasmon resonance peak near 526 nm from pre-formed gold nanoparticles with SDS in water before ultrasonictreatment. When unsonicated gold nanoparticles coated with SDSare mixed with silver nitrate/SDS aqueous solution, which wassonicated for 30 min in the first step, a broad surface plasmon res-onance band with two badly resolved signals near 436 and 509 nmappears. This indicates the presence of silver and gold. After 30 minof ultrasonic treatment at the second step, this SPR band narrows,is red shifted to 538 nm and the absorbance of silver disappears,indicating the formation of gold–silver nanocomposites. Afteradditional 15 min of sonication the intensity of the SPR peak near538 nm decreases by a factor of 2.6 without a change of the
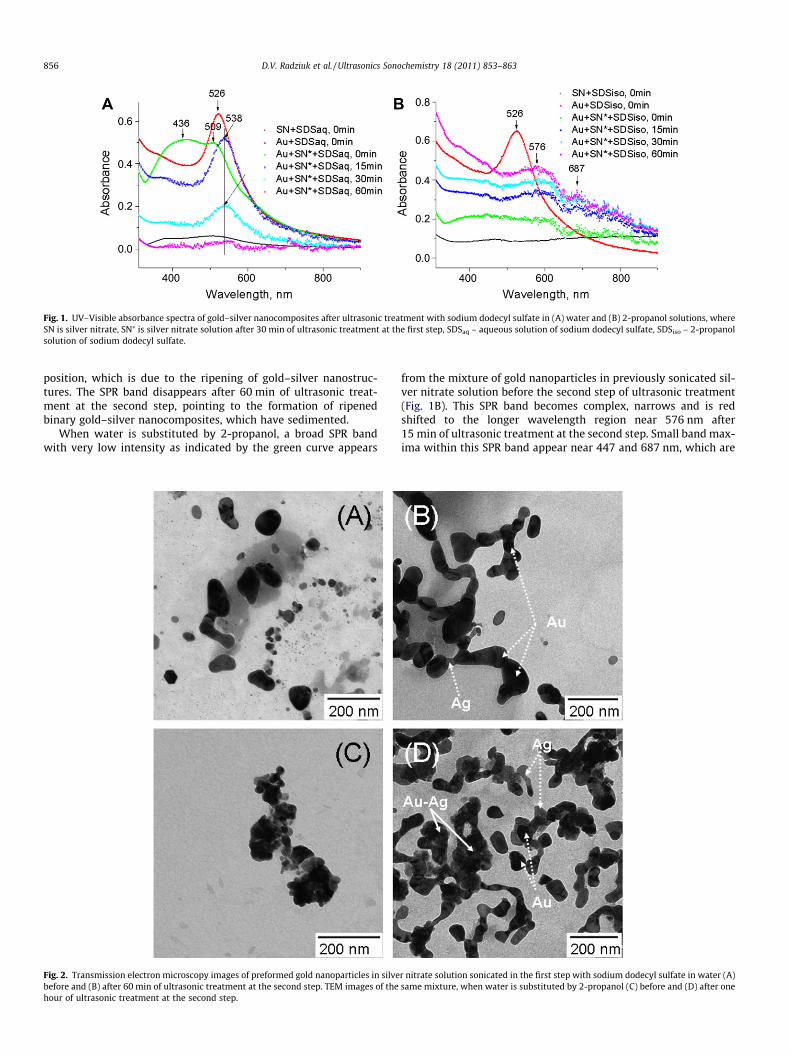
Fig. 1. UV–Visible absorbance spectra of gold–silver nanocomposites after ultrasonic treatment with sodium dodecyl sulfate in (A) water and (B) 2-propanol solutions, whereSN is silver nitrate, SN⁄ is silver nitrate solution after 30 min of ultrasonic treatment at the first step, SDSaq – aqueous solution of sodium dodecyl sulfate, SDSiso – 2-propanolsolution of sodium dodecyl sulfate.
856 D.V. Radziuk et al. / Ultrasonics Sonochemistry 18 (2011) 853–863
position, which is due to the ripening of gold–silver nanostruc-tures. The SPR band disappears after 60 min of ultrasonic treat-ment at the second step, pointing to the formation of ripenedbinary gold–silver nanocomposites, which have sedimented.
When water is substituted by 2-propanol, a broad SPR bandwith very low intensity as indicated by the green curve appears
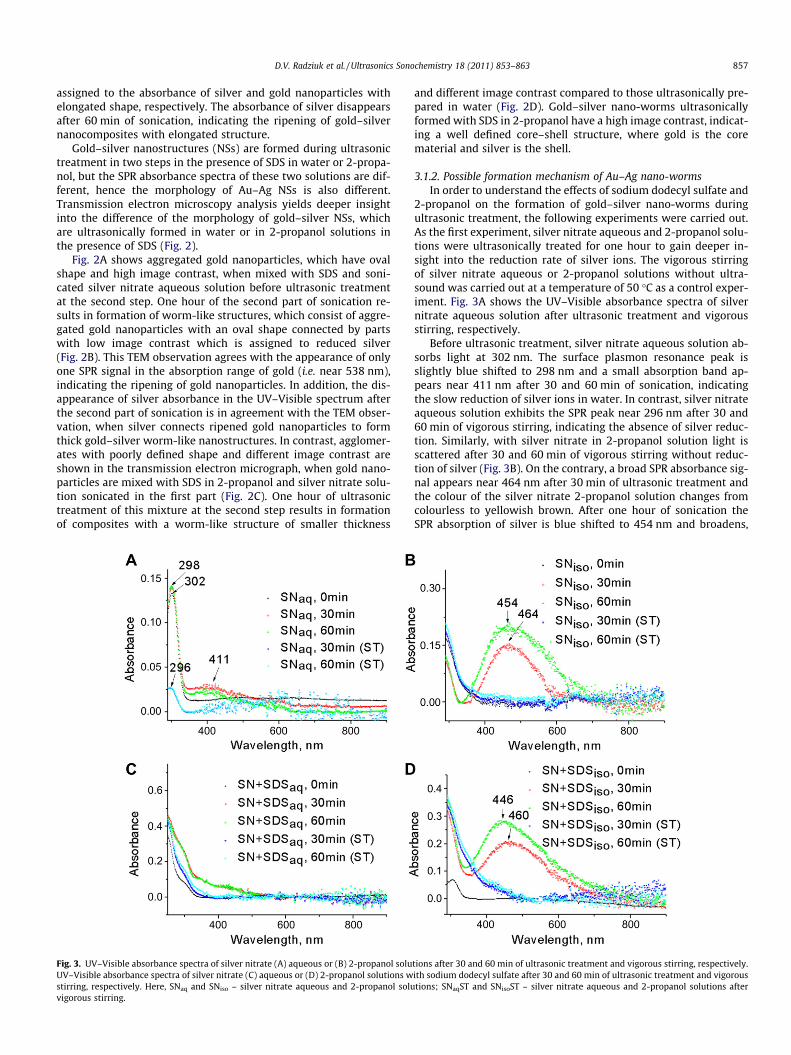
Fig. 2. Transmission electron microscopy images of preformed gold nanoparticles in silvebefore and (B) after 60 min of ultrasonic treatment at the second step. TEM images of thehour of ultrasonic treatment at the second step.
from the mixture of gold nanoparticles in previously sonicated sil-ver nitrate solution before the second step of ultrasonic treatment(Fig. 1B). This SPR band becomes complex, narrows and is redshifted to the longer wavelength region near 576 nm after15 min of ultrasonic treatment at the second step. Small band max-ima within this SPR band appear near 447 and 687 nm, which are
r nitrate solution sonicated in the first step with sodium dodecyl sulfate in water (A)same mixture, when water is substituted by 2-propanol (C) before and (D) after one
D.V. Radziuk et al. / Ultrasonics Sonochemistry 18 (2011) 853–863 857
assigned to the absorbance of silver and gold nanoparticles withelongated shape, respectively. The absorbance of silver disappearsafter 60 min of sonication, indicating the ripening of gold–silvernanocomposites with elongated structure.
Gold–silver nanostructures (NSs) are formed during ultrasonictreatment in two steps in the presence of SDS in water or 2-propa-nol, but the SPR absorbance spectra of these two solutions are dif-ferent, hence the morphology of Au–Ag NSs is also different.Transmission electron microscopy analysis yields deeper insightinto the difference of the morphology of gold–silver NSs, whichare ultrasonically formed in water or in 2-propanol solutions inthe presence of SDS (Fig. 2).
Fig. 2A shows aggregated gold nanoparticles, which have ovalshape and high image contrast, when mixed with SDS and soni-cated silver nitrate aqueous solution before ultrasonic treatmentat the second step. One hour of the second part of sonication re-sults in formation of worm-like structures, which consist of aggre-gated gold nanoparticles with an oval shape connected by partswith low image contrast which is assigned to reduced silver(Fig. 2B). This TEM observation agrees with the appearance of onlyone SPR signal in the absorption range of gold (i.e. near 538 nm),indicating the ripening of gold nanoparticles. In addition, the dis-appearance of silver absorbance in the UV–Visible spectrum afterthe second part of sonication is in agreement with the TEM obser-vation, when silver connects ripened gold nanoparticles to formthick gold–silver worm-like nanostructures. In contrast, agglomer-ates with poorly defined shape and different image contrast areshown in the transmission electron micrograph, when gold nano-particles are mixed with SDS in 2-propanol and silver nitrate solu-tion sonicated in the first part (Fig. 2C). One hour of ultrasonictreatment of this mixture at the second step results in formationof composites with a worm-like structure of smaller thickness
Fig. 3. UV–Visible absorbance spectra of silver nitrate (A) aqueous or (B) 2-propanol soluUV–Visible absorbance spectra of silver nitrate (C) aqueous or (D) 2-propanol solutions wstirring, respectively. Here, SNaq and SNiso – silver nitrate aqueous and 2-propanol soluvigorous stirring.
and different image contrast compared to those ultrasonically pre-pared in water (Fig. 2D). Gold–silver nano-worms ultrasonicallyformed with SDS in 2-propanol have a high image contrast, indicat-ing a well defined core–shell structure, where gold is the corematerial and silver is the shell.
3.1.2. Possible formation mechanism of Au–Ag nano-wormsIn order to understand the effects of sodium dodecyl sulfate and
2-propanol on the formation of gold–silver nano-worms duringultrasonic treatment, the following experiments were carried out.As the first experiment, silver nitrate aqueous and 2-propanol solu-tions were ultrasonically treated for one hour to gain deeper in-sight into the reduction rate of silver ions. The vigorous stirringof silver nitrate aqueous or 2-propanol solutions without ultra-sound was carried out at a temperature of 50 �C as a control exper-iment. Fig. 3A shows the UV–Visible absorbance spectra of silvernitrate aqueous solution after ultrasonic treatment and vigorousstirring, respectively.
Before ultrasonic treatment, silver nitrate aqueous solution ab-sorbs light at 302 nm. The surface plasmon resonance peak isslightly blue shifted to 298 nm and a small absorption band ap-pears near 411 nm after 30 and 60 min of sonication, indicatingthe slow reduction of silver ions in water. In contrast, silver nitrateaqueous solution exhibits the SPR peak near 296 nm after 30 and60 min of vigorous stirring, indicating the absence of silver reduc-tion. Similarly, with silver nitrate in 2-propanol solution light isscattered after 30 and 60 min of vigorous stirring without reduc-tion of silver (Fig. 3B). On the contrary, a broad SPR absorbance sig-nal appears near 464 nm after 30 min of ultrasonic treatment andthe colour of the silver nitrate 2-propanol solution changes fromcolourless to yellowish brown. After one hour of sonication theSPR absorption of silver is blue shifted to 454 nm and broadens,
tions after 30 and 60 min of ultrasonic treatment and vigorous stirring, respectively.ith sodium dodecyl sulfate after 30 and 60 min of ultrasonic treatment and vigoroustions; SNaqST and SNisoST – silver nitrate aqueous and 2-propanol solutions after

Table 1Intensities and calculated intensity ratios of XRD peaks from gold nanoparticles insodium dodecyl sulfate aqueous solution before and after 60 min of ultrasonictreatment in water.
Time [min] (h k l) D
(1 1 1) (2 0 0) (2 2 0) (3 1 1) D1 D2 D3
0 785 342 219 311 2.3 1.56 0.7060 564 248 135 131 2.27 1.84 1.03
D1 is ratio of I(1 1 1) to I(2 0 0); D2 is ratio of I(1 1 1) to I(2 2 0); D3 is ratio of I(1 1 1)to I(3 1 1).
858 D.V. Radziuk et al. / Ultrasonics Sonochemistry 18 (2011) 853–863
indicating the reduction of silver ions and formation of polydis-perse silver clusters [67].
The sonochemical reduction of silver in water and 2-propanolsolutions is performed by water or organic radicals, which areformed during sonolysis of the solutions. The radicals reduce Ag+
ions to yield the Ag0 atoms, which form silver nanoparticles. Thereduction of silver ions occurs faster in 2-propanol solution, be-cause 2-propanol scavenges the OH� radicals and therefore hindersthe oxidation process of zerovalent silver. The reactions of 2-pro-panol with OH� (1) and H� radicals (2) are described below [68].
OH� þ CH3CHðOHÞCH3 ! H2OþH3CC�ðOHÞCH3 ð1Þ
Table 2The FWHM (�) and size (L, nm) values from X-ray diffraction patterns of the goldnanoparticles in the presence of sodium dodecyl sulfate aqueous solution before andafter 60 min of ultrasonic treatment. The error amounts 0.02�.
(h k l) FWHM [�] 2h [�] L [nm]
0 [min] 60 [min] 0 [min] 60 [min]
(1 1 1) 0.33 0.36 38.2 25.01 23.32(2 0 0) 0.31 0.32 44.4 26.61 25.92(2 2 0) 0.33 0.27 64.7 25.31 31.32(3 1 1) 0.34 0.17 77.7 24.34 47.71
H� þ CH3CHðOHÞCH3 ! H2 þH3CC�ðOHÞCH3 ð2Þ
A secondary radical H3CC�ðOHÞCH3 efficiently reduces the precursorsilver ions Ag+ to Ag0.
As the second experiment, silver nitrate aqueous and 2-propa-nol solutions are ultrasonically treated with sodium dodecyl sul-fate or vigorously stirred to reveal the effect of SDS on thereduction rate and on stabilization of silver. The UV–Visible absor-bance spectra of silver nitrate aqueous solution with SDS exhibitenhanced scattering after 60 min of ultrasonic treatment and stir-ring, respectively, due to the presence of SDS (Fig. 3C), but hardlyany plasmon band. In contrast, a broad SPR peak appears near460 nm after 30 min of ultrasonic treatment of silver nitrate withSDS in 2-propanol solution (Fig. 3D). This SPR peak broadens andis blue shifted to 446 nm after additional 30 min of sonication,indicating enhanced reduction of silver. No SPR absorbance of re-duced silver is recorded after either 30 or 60 min of vigorous stir-ring. The reduction of silver occurs in 2-propanol solutions eitherwith or without SDS therefore 2-propanol plays a main role inthe sonochemical formation of silver atoms (clusters). On the otherhand, the SPR peak of silver nanoparticles in 2-propanol is strongerblue shifted in the presence of SDS from 460 to 446 nm) than with-out SDS (from 464 to 454 nm), hence SDS acts as a stabilizer of re-duced silver atoms.
As a third experiment, preformed gold nanoparticles withoutsilver nitrate in the presence of sodium dodecyl sulfate aqueoussolution were ultrasonically treated under similar conditions in or-der to examine the formation of gold particles with elongatedstructure. The UV–Vis absorbance spectrum shows surface plas-mon resonance band near 526 nm before and after one hour of son-ication (Fig. SI.1, supporting information). Without any shift theSPR peak slightly broadens from 58 to 61 nm (full width at halfmaximum), indicating the fusion of gold contact surfaces withoutformation of elongated structures [13]. The crystalline structureof gold sols in the presence of sodium dodecyl sulfate in water isexamined by X-ray powder diffraction (Fig. SI.2, supporting infor-mation). All peaks (1 1 1) at 2h = 38.2�, (2 0 0) at 2h = 44.4�,(2 2 0) at 2h = 64.7�, (3 1 1) at 2h = 77.7� and (2 2 2) at 2h = 81.4�,which are assigned to the face centered cubic structure of goldnanoparticles, are present and not shifted after one hour of ultra-sonic treatment. In spite of the different intensity values of theXRD peaks before and after ultrasonic treatment, the difference be-tween the intensity ratios is <1 (Table 1). The FWHM value of(1 1 1) XRD peaks increases and of (2 2 0) and (3 1 1) decrease sys-tematically with the longer sonication time (Table 2), indicatingthe twinning or stacking faults in the crystalline structure of parti-cles upon heat treatment at temperatures from 300 to 1000 K [69].This coincides with the HRTEM analysis of gold nanoparticles,which fuse at the contact surfaces during sonication [13]. On theother hand, the decreased FWHM values of XRD peaks of sonicatednanoparticles shows the increase of the nanoparticle size afterultrasonic treatment. It is important to emphasize, that the sizeof Au NPs with sodium dodecyl sulfate does not exceeds the double
original diameter and particles with elongated structure are notformed.
As a next experiment, the gold–silver mixture is ultrasonicallytreated for one hour in water and 2-propanol solutions, respec-tively, without SDS to assess if gold–silver nanocomposites witha worm-like structure can be formed. Scanning transmission elec-tron microscopy (STEM) analysis with an angular dark field (ADF)imaging technique is applied to observe the morphology and metalcontent of bimetallic nanostructures ultrasonically prepared with-out SDS (Fig. 4). Fig. 4A shows the STEM image of aggregated nano-structures after ultrasonic treatment of gold nanoparticles insonicated silver nitrate solution in water. Selected areas of soni-cated particles shown by red rectangles in the energy dispersiveX-ray elemental maps of silver (Fig. 4B) and gold (Fig. 4C) detectthe presence of silver with greater amount than of gold due tothe higher image contrast and number of points in the silvermap. Therefore, there are two types of particles: (i) silver clustersand (ii) gold–silver nanoparticles. It is important to emphasize,that the structure of the formed nanoparticles is not worm-likeas it is observed in case of gold–silver with SDS in water.
In contrast, less polydisperse particles are formed after 60 minof ultrasonic treatment at the second step without SDS in 2-propa-nol solution (Fig. 4D). Selected areas of ultrasonically preparednanoparticles represented by ellipses of different colours in silver(Fig. 4E) and gold (Fig. 4F) maps show binary gold–silver nanopar-ticles with a greater amount (80%) than those formed in water(45%). Similarly with results obtained in water without SDS, Au–Ag nanoparticles do not have a worm-like structure in 2-propanol.This fact proves the suggestion that SDS controls the shape and sta-bility of binary nanocomposites. Moreover, the energy dispersiveX-ray fluorescence analysis of Au–Ag nano-worms shows the smal-ler silver content (only 7.94%) after 60 min of sonication in waterthan in 2-propanol (85.73%) (Figs. SI.3A and SI.3B, supporting infor-mation), indicating that the core–shell structure can be formedonly in alcohol solution.
The mechanism of sonochemical formation of gold–silver nano-worms in the presence of SDS can be as follows. Preformed goldnanoparticles aggregate, when mixed with silver nitrate solution.As silver ions are reduced more slowly in water than in 2-propanolsolution, gold nanoparticles continue to aggregate during ultra-sonic treatment in water, and this aggregation is controlled by
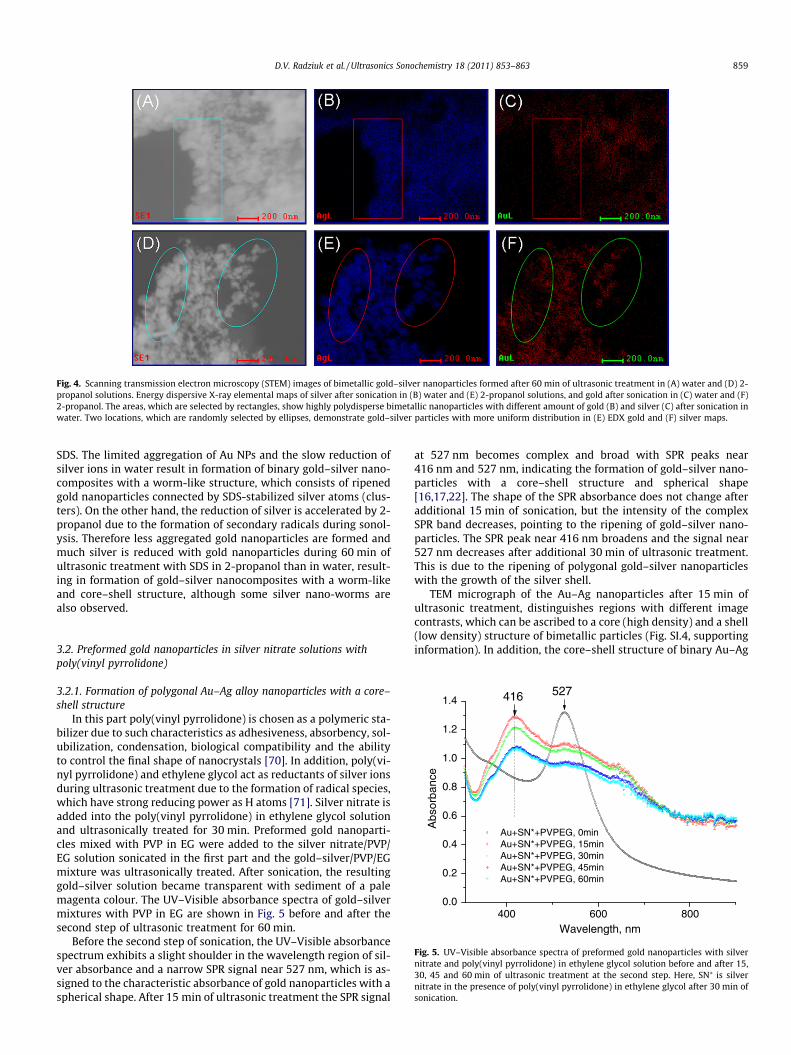
Fig. 4. Scanning transmission electron microscopy (STEM) images of bimetallic gold–silver nanoparticles formed after 60 min of ultrasonic treatment in (A) water and (D) 2-propanol solutions. Energy dispersive X-ray elemental maps of silver after sonication in (B) water and (E) 2-propanol solutions, and gold after sonication in (C) water and (F)2-propanol. The areas, which are selected by rectangles, show highly polydisperse bimetallic nanoparticles with different amount of gold (B) and silver (C) after sonication inwater. Two locations, which are randomly selected by ellipses, demonstrate gold–silver particles with more uniform distribution in (E) EDX gold and (F) silver maps.
D.V. Radziuk et al. / Ultrasonics Sonochemistry 18 (2011) 853–863 859
SDS. The limited aggregation of Au NPs and the slow reduction ofsilver ions in water result in formation of binary gold–silver nano-composites with a worm-like structure, which consists of ripenedgold nanoparticles connected by SDS-stabilized silver atoms (clus-ters). On the other hand, the reduction of silver is accelerated by 2-propanol due to the formation of secondary radicals during sonol-ysis. Therefore less aggregated gold nanoparticles are formed andmuch silver is reduced with gold nanoparticles during 60 min ofultrasonic treatment with SDS in 2-propanol than in water, result-ing in formation of gold–silver nanocomposites with a worm-likeand core–shell structure, although some silver nano-worms arealso observed.
400 600 8000.0
0.2
0.4
0.6
0.8
1.0
1.2
1.4
Abs
orba
nce
Wavelength, nm
Au+SN*+PVPEG, 0min Au+SN*+PVPEG, 15min Au+SN*+PVPEG, 30min Au+SN*+PVPEG, 45min Au+SN*+PVPEG, 60min
416 527
Fig. 5. UV–Visible absorbance spectra of preformed gold nanoparticles with silvernitrate and poly(vinyl pyrrolidone) in ethylene glycol solution before and after 15,30, 45 and 60 min of ultrasonic treatment at the second step. Here, SN⁄ is silvernitrate in the presence of poly(vinyl pyrrolidone) in ethylene glycol after 30 min ofsonication.
3.2. Preformed gold nanoparticles in silver nitrate solutions withpoly(vinyl pyrrolidone)
3.2.1. Formation of polygonal Au–Ag alloy nanoparticles with a core–shell structure
In this part poly(vinyl pyrrolidone) is chosen as a polymeric sta-bilizer due to such characteristics as adhesiveness, absorbency, sol-ubilization, condensation, biological compatibility and the abilityto control the final shape of nanocrystals [70]. In addition, poly(vi-nyl pyrrolidone) and ethylene glycol act as reductants of silver ionsduring ultrasonic treatment due to the formation of radical species,which have strong reducing power as H atoms [71]. Silver nitrate isadded into the poly(vinyl pyrrolidone) in ethylene glycol solutionand ultrasonically treated for 30 min. Preformed gold nanoparti-cles mixed with PVP in EG were added to the silver nitrate/PVP/EG solution sonicated in the first part and the gold–silver/PVP/EGmixture was ultrasonically treated. After sonication, the resultinggold–silver solution became transparent with sediment of a palemagenta colour. The UV–Visible absorbance spectra of gold–silvermixtures with PVP in EG are shown in Fig. 5 before and after thesecond step of ultrasonic treatment for 60 min.
Before the second step of sonication, the UV–Visible absorbancespectrum exhibits a slight shoulder in the wavelength region of sil-ver absorbance and a narrow SPR signal near 527 nm, which is as-signed to the characteristic absorbance of gold nanoparticles with aspherical shape. After 15 min of ultrasonic treatment the SPR signal
at 527 nm becomes complex and broad with SPR peaks near416 nm and 527 nm, indicating the formation of gold–silver nano-particles with a core–shell structure and spherical shape[16,17,22]. The shape of the SPR absorbance does not change afteradditional 15 min of sonication, but the intensity of the complexSPR band decreases, pointing to the ripening of gold–silver nano-particles. The SPR peak near 416 nm broadens and the signal near527 nm decreases after additional 30 min of ultrasonic treatment.This is due to the ripening of polygonal gold–silver nanoparticleswith the growth of the silver shell.
TEM micrograph of the Au–Ag nanoparticles after 15 min ofultrasonic treatment, distinguishes regions with different imagecontrasts, which can be ascribed to a core (high density) and a shell(low density) structure of bimetallic particles (Fig. SI.4, supportinginformation). In addition, the core–shell structure of binary Au–Ag

860 D.V. Radziuk et al. / Ultrasonics Sonochemistry 18 (2011) 853–863
nanoparticles is proved by EDX analysis (Fig. SI.5, supportinginformation).
After one additional hour of ultrasonic treatment at the secondstep, the SPR absorbance of silver is red shifted from 416 to 432 nmand the absorbance of gold disappears (Fig. 6). After one more hourof sonication the SPR band near 432 nm decreased in intensity andbroadens, indicating the formation of polygonal gold–silver alloynanoparticles with a core–shell structure. The red shift of silverplasmon band indicates the enrichment of bimetallic particles insilver. X-ray diffraction pattern of gold–silver mixture after60 min of ultrasonic treatment shows all peaks, which are assignedto face centered cubic structure of gold and silver (Fig. SI.6, sup-porting information). The (1 1 1) peak acquires a sharp shoulderand (2 2 2) disappears after 120 min of sonication. The splittingof (1 1 1) could indicate the gold–silver alloying with slightly dif-ferent lattices, although the lattices of Au and Ag are almost indis-tinguishable and may result from the compressive stress ofultrasound waves on the gold–silver crystalline structure. The dis-appearance of (2 2 2) shows the strongly preferred orientation ofthe silver growth with gold contact surface during sonochemicalreduction with poly(vinyl pyrrolidone) in ethylene glycol or a for-mation of a new (metastable) phase [65].
400 600 8000.0
0.2
0.4
0.6
0.8
1.0
1.2
1.4
Abs
orba
nce
Wavelength, nm
Au+SN*+PVPEG, 60min Au+SN*+PVPEG, 120minAu+SN*+PVPEG, 180min
416
527 432
Fig. 6. UV–Visible absorbance spectra of a gold–silver mixture with poly(vinylpyrrolidone) in ethylene glycol solution after 120 and 180 min of ultrasonictreatment at the second step. Here, SN⁄ is silver nitrate in the presence of poly(vinylpyrrolidone) in ethylene glycol after 30 min of sonication.
Fig. 7. Transmission electron microscopy images of gold nanoparticles in silver nitrate wi(C) 180 min of ultrasonic treatment at the second step.
As a control experiment preformed gold nanoparticles aresubstituted by silver sols for ultrasonic treatment in silver nitratewith poly(vinyl pyrrolidone) in ethylene glycol solution. The UV–Visible absorbance spectra of silver–silver mixture before and after120 min of sonication are shown in Fig. SI.7 (supporting informa-tion). Before ultrasonic treatment, silver nitrate with poly(vinylpyrrolidone) in ethylene glycol solution absorbs light at 301 nm.The surface plasmon resonance peak of silver appears near443 nm after 30 min of sonication, indicating the reduction of sil-ver ions. Original colloidal silver solution exhibits surface plasmonresonance peak near 389 nm, which is assigned to silver nanopar-ticles of 39 nm (Fig. SI.8, supporting information). Before sonica-tion, this SPR band is shifted to 391 nm when preformed silvernanoparticles are mixed with sonicated silver nitrate with PVP inethylene glycol. The full width at half maximum of this peak is120 nm, which is broader than that of original silver nanoparticles(FWHM of 389 nm is 54 nm), indicating the aggregated silvernanoparticles. After 60 and 120 min of sonication SPR is red shiftedto 396 nm, indicating the slight ripening of silver aggregates(Fig. SI.9, supporting information). The crystalline structure ofaggregated silver nanoparticles after 120 min of ultrasonic treat-ment is shown in X-ray diffractogram (Fig. SI.10, supporting infor-mation). The presence of all diffraction peaks indicates facecentered cubic structure of silver. Unfortunately HRTEM micro-graph cannot unambiguously distinguish alloy of gold–silver be-cause the lattice constant of gold and silver are identical andthey are miscible in all proportions. However, one can observethe core–shell structure due to the different electron densities ofgold and silver (Au 79 and Ag 47) [72]. For example, the core–shellstructure of Au–Ag nanoparticles, which are formed after 15 min ofultrasonic treatment in the presence of PVP in ethylene glycol solu-tion, is shown in HRTEM micrograph (Fig. SI.11, supportinginformation).
Fig. 7A shows a TEM image of polydisperse gold nanoparticles inpreviously sonicated silver nitrate with PVP in EG solution beforeultrasonic treatment at the second step. Before the second part ofsonication, gold nanoparticles turn to aggregate because of theinability of Au to coordinate to O (or N) in the pyrrolidone ringof PVP [73], but do not form agglomerates due to the presence ofEG. After 60 min of ultrasonic treatment at the second step, nano-particles with different image contrast are observed (Fig. 7B) andtherefore are divided into three types ascribed to: (i) gold nanopar-ticles with the darkest image contrast and spherical shape; (ii)polygonal gold–silver nanocomposites with a core–shell structureand (iii) silver nanoparticles with the lowest image contrast, asindicated by arrows. Ripened polygonal gold–silver nanocompos-ites with a core–shell structure are detected after additional two
th poly(vinyl pyrrolidone) in ethylene glycol solution (A) before, (B) after 60 min and

D.V. Radziuk et al. / Ultrasonics Sonochemistry 18 (2011) 853–863 861
hours of sonication at the second step (Fig. 7C), which coincideswith the UV–Visible absorbance analysis. Gold–silver nanoparti-cles have gold as a core material (highest image contrast) and a sil-ver shell grown by ultrasound in PVP.
Composition analysis of ultrasonically formed gold–silver nano-particles with a core–shell structure is conducted by an EDX study.Fig. SI.12 (supporting information) shows an EDX pattern of thegold–silver sample sonicated for 180 min at the second step.According to the quantitative data the shell part is composed of sil-ver, while the core is gold, which is in agreement with the TEM andUV–Visible analyses.
Fig. 8. X-ray diffraction pattern of gold–silver mixtures before (A) and afterultrasonic treatment with sodium dodecyl sulfate in water (B) and 2-propanol (C),and poly(vinyl pyrrolidone) in ethylene glycol solutions (D).
Fig. 9. The scheme shows a two step ultrasonic treatment to form bimetallic gold–silversulfate in water or 2-propanol and poly(vinyl pyrrolidone) in ethylene glycol solutions,
3.2.2. Possible formation mechanism of polygonal gold–silvernanoparticles with a core–shell structure
Sonolysis of water produces free hydrogen and hydroxylradicals that are scavenged by R—CH2—OH and yieldsR—CH�—OH, which has strong reducing property as H atom[74,76]. The produced radicals reduce Ag+ ions according toR—CH�—OHþ AgðIÞ ! Ag0 þ R—CHOþHþ [75]. If ultrasonic treat-ment of silver nitrate with PVP in EG solution is substituted by vig-orous stirring for 30 and 60 min with the additives, no SPRabsorbance of silver nanoparticles is detected by UV–Visible absor-bance analysis (Fig. SI.13, supporting information).
Therefore ultrasound is necessary to produce primary radicalspecies to interact with PVP and EG molecules and to form second-ary radicals, which are responsible for the enhanced reduction ofsilver ions. On the other hand, PVP interacts with metal ions, atomsand clusters because it has the structure of a polyvinyl skeletonwith a strongly polar group (pyrrolidone ring), thereby PVP influ-ences the growth and shape of nanoparticles not only at the laststage but also during the process of formation [73,76]. The investi-gation of the Ag/PVP system shows that most of the Ag particlesare covered with PVP polymer, although the product is washedand centrifuged repetitively with water [76]. This is due to the fa-voured complexation process of the sp hybridized Ag+ ions withpolymer chains [77]. Thus, during ultrasonic treatment the silverions are reduced by PVP and EG in contact with preformed goldnanoparticles to form binary gold–silver nanoparticles with a pre-formed core and stabilized and grown by PVP in the EG shell. Thesilver shell grows during sonication due to the reduction of silverwhich readily reaches positions where the conditions for crystalgrowth are preferential and governed by the highly mobile chainsof PVP, and therefore resulting in Au–Ag NPs with polygonalstructure.
3.3. Crystalline structure of gold–silver nano-worms and polygonalalloy nanoparticles
X-ray powder diffraction (XRD) is performed on gold–silvernanoparticles ultrasonically prepared with sodium dodecyl sulfatein water or 2-propanol solutions, poly(vinyl pyrrolidone) in ethyl-ene glycol solution and compared to the XRD pattern of the mix-ture of preformed gold nanoparticles in the presence of sonicatedsilver nitrate aqueous solution before the ultrasonic treatment atthe second step (Fig. 8). The X-ray diffractogram of the gold–silvermixture before ultrasonic treatment exhibits peaks: (1 1 1) at2h = 38.2�, (2 0 0) at 2h = 44.4�, (2 2 0) at 2h = 64.6�; (3 1 1) at2h = 77.2�, (2 2 2) at 2h = 81.4�, indicating the face centered cubicstructure (Fig. 9A). After ultrasonic treatment with sodium dodecylsulfate in water and 2-propanol solutions peaks (2 0 0) and (3 1 1)are shifted in water and 2-propanol, respectively (Fig. 9B and C).
nano-worms and polygonal alloy nanoparticles in the presence of sodium dodecylrespectively.

862 D.V. Radziuk et al. / Ultrasonics Sonochemistry 18 (2011) 853–863
Peaks (2 2 0) and (2 2 2) disappear and the intensity of (1 1 1) dra-matically decreases after sonication in both solutions. In contrast,peak (1 1 1) splits into two after ultrasonic treatment with poly(vi-nyl pyrrolidone) in ethylene glycol solution, so (2 2 0) and (2 2 2)disappear, and (2 0 0) with (3 1 1) are shifted similarly as in caseof SDS in water and 2-propanol solutions (Fig. 9D). The shift tohigher 2h values of the (2 0 0) diffraction peak with the highestintensity as well as the systematic disappearance of the (2 2 0)and (2 2 2) XRD peaks shows the strongly preferred orientationof the silver growth during sonochemical reduction with goldand SDS or PVP. Moreover, the disappearance of peaks like (2 2 0)and (2 2 2) indicates alloying with defined locations of the 2 atomsin the unit cell or formation of a new (metastable) phase [65]. Thesplitting of (1 1 1) in case of PVP may result from the compressivestress of ultrasound waves on the gold–silver crystalline structureand proves that the gold–silver alloys prepared with PVP have aslightly different lattice, although the lattices of Au and Ag are al-most indistinguishable (lattice constant a of Au equals to 4.0783 Åand that of Ag is 4.0851 Å). The systematic shift of the (3 1 1) XRDpeak to lower 2h scattering values may be due to the effect of thetemperature (higher than 700 K) on the crystalline structure ofparticles [78].
Selected area electron diffraction (SAED) analysis is employedon gold–silver nanoparticles ultrasonically prepared with sodiumdodecyl sulfate in water or 2-propanol solutions, poly(vinyl pyrrol-idone) in ethylene glycol solution. It is compared to the SAED pat-tern of the mixture of preformed gold nanoparticles in thepresence of sonicated silver nitrate aqueous solution before theultrasonic treatment at the second step. Each crystallite scattersthe electron beam at different azimuths to yield a characteristicspot pattern, which is a series of rings whose radii are specificfor the substance. In an electron diffraction pattern a 2-dimen-sional particular projection of the 3-D lattice of crystals is ob-served, when all planes are parallel to the incident electronbeam. In a polycrystalline sample, consisting of a random arrange-ment of crystallites, whole sets of different planes are in the correctorientation to produce diffraction maxima. This effect produces awhole series of concentric rings, which are observed on the blackbackground of each SAED pattern (Fig. SI.14, supporting informa-tion), indicating the polycrystalline structure of gold–silvernanocomposites.
In the ED patterns the rings are not solid and consist of eithersmall dots of different sizes and contrast or dashed lines of variouswidths and lengths. Fig. SI.14A shows a SAED pattern of gold NPs insilver nitrate (before sonication at the second step) with a limitednumber of sharp dots making up relatively thin, but badly definedrings, indicating polycrystals with relatively small size and re-stricted number of crystal orientations. The high intensity of thedots is due to the frequent reflectivity repetition of the crystalphase planes and, as a result of it, a more organized structure.
After ultrasonic treatment with sodium dodecyl sulfate, SAEDpatterns of Au–Ag nanocomposites prepared in water and 2-propa-nol solutions exhibit concentric rings of different diameters andcomposition (Figs. SI.14B and SI.14C, respectively). The reflex inFig. SI.14B is due to an increased amount of spherical dots with dif-ferent intensities and larger size organized in rings as compared tothose in Fig. SI.14A, indicating one type of crystallites with pre-ferred orientation (sharp blurred dots) and an increased numberof another type of crystallites randomly oriented (smaller dots offaint intensity contrast). This is ascribed to the reduction of silverat the contact with gold nanoparticles during sonication. In addi-tion, the amount of dots making up the ED rings is different, there-fore the rings are badly resolved, which shows that the sample isnot homogeneous in composition and therefore consists of crystal-lites from both metals. In contrast, the SAED pattern in Fig. SI.14Cconsists of sharp streaks, which differ in angular width or length
and distance in between. The presence of streaks indicates crystals,which are strongly aligned in a preferred orientation. The broadstreaks show that the order within the sample is essentially one-dimensional (e.g. bundles of fibres or particles, which are orderedalong one axis only). In addition as the distance between thesestreaks yields the characteristic spacing of the crystals, the samplein Fig. SI.14C has a worm-like polycrystalline structure with crys-tals ordered along one axis and packed loosely.
Well-resolved concentric rings in the SAED pattern inFig. SI.14D consist of a larger quantity of small dots with similarshape and size in contrast to reflexions observed in Figs. SI.14Aand SI.14B. This indicates an increased number of crystal orienta-tions due to the presence of a larger amount of crystals randomlyoriented. The distances between the rings are similar as comparedto those in Fig. SI.14A, indicating the same crystalline close packingstructure. Therefore ultrasonic treatment of gold nanoparticles insilver nitrate with poly(vinyl pyrrolidone) in ethylene glycol solu-tion leads to the reduction and subsequent growth of silver withgold governed by PVP, resulting in formation of gold–silver nano-particles with increased number of silver crystals which definethe polygonal shape of the NPs.
4. Conclusion
The successive ultrasonic treatment partly reduces silver ions atthe first step and helps to avoid undesirable fusion and aggregationof citrate-protected gold nanoparticles (25 nm). The type of addi-tive influences the rate of sonochemical reduction of silver withgold to form binary Au–Ag nanostructures of different morphology(Fig. 9). Thus Au–Ag nano-worms consisting of ripened gold nano-particles, which are connected by ultrasonically reduced silver, canbe produced in the presence of sodium dodecyl sulfate. Ultrasonictreatment in 2-propanol instead of water leads to formation ofgold–silver nano-worms with a core–shell structure. Polygonalgold–silver alloy nanoparticles with a core–shell structure can begrown by sonication with poly(vinyl pyrrolidone) in ethylene gly-col solution. Sonochemical design of preformed gold nanoparticlesin silver nitrate solutions is achieved by the free primary radicals(hydrogen and hydroxyl) and controlled by secondary radical spe-cies, which depend on the type of additive. All ultrasonicallyformed binary gold–silver nanostructures have defected face cen-tered cubic structure and are polycrystalline with a large numberof crystallites randomly oriented. Moreover, the systematic disap-pearance of XRD peaks such as (2 2 0) and (2 2 2) with splitting of(1 1 1) indicates the formation of Au–Ag alloy nanostructures witha lattice differing from that of the individual metal nanoparticles.In conclusion the work presented has contributed important infor-mation to distinguish physical and chemical effects involved insonochemical particle formation and opened new way to designwell-defined and controlled nanomaterials.
Acknowledgments
This work is supported by EU FP6 project and by the Gay-Lus-sac/Humboldt award to H. Möhwald. The authors gratefully thankHeike Runge and Jürgen Hartmann from the Max-Planck instituteof Colloids and Interfaces for TEM and EDX measurements. WeiZhang from Fritz Haber institute of the Max Planck society isacknowledged for STEM and Energy dispersive X-ray elementalmeasurements.
Appendix A. Supplementary data
Supplementary data associated with this article can be found, inthe online version, at doi:10.1016/j.ultsonch.2010.11.013.

D.V. Radziuk et al. / Ultrasonics Sonochemistry 18 (2011) 853–863 863
References
[1] C. Mirkin, R. Letsinger, R. Mucic, J. Storhoff, Nature 382 (1996) 607–609.[2] J. Storhoff, A. Lazarides, R. Music, C. Mirkin, R. Letsinger, G. Schatz, J. Am. Chem.
Soc. 122 (2000) 4640–4650.[3] W. Zheng, M. Maye, F. Leibowitz, C. Zhong, Analyst 125 (2000) 17–20.[4] A. Kumar, A. Mandale, M. Sastry, Langmuir 16 (2000) 6921–6926.[5] A. Boal, V. Rotello, Langmuir 16 (2000) 9527–9532.[6] J. Carroll, B. Frankamp, V. Rotello, Chem. Commun. (2002) 1892–1893.[7] R. Paulini, B. Frankamp, V. Rotello, Langmuir 18 (2002) 2368–2373.[8] A. Boal, F. Ilhan, J. Derouchey, T. Thurn-Albrecht, T. Russell, V. Rotello, Nature
404 (2000) 746–748.[9] F. Caruso, R. Caruso, H. Mohwald, Science 282 (1998) 1111–1114.
[10] S. Watanabe, M. Sonobe, M. Arai, Y. Tazume, T. Matsuo, T. Nakamura, K.Yoshida, Chem. Commun. (2002) 2866–2867.
[11] S. Lin, S. Liu, C. Lin, C. Chen, Anal. Chem. 74 (2002) 330–335.[12] S. Obare, R. Hollowell, C. Murphy, Langmuir 18 (2002) 10407–10410.[13] D. Radziuk, W. Zhang, D. Su, D. Grigoriev, H. Möhwald, D. Shchukin, J. Phys.
Chem. C 114 (2010) 1835–1843.[14] Y. Mizukoshi, T. Fujimoto, Y. Nagata, R. Oshima, Y. Maeda, J. Phys. Chem. B 104
(2000) 6028–6032.[15] J. Lin, W. Zhou, A. Kumbhar, J. Wiemann, J. Fang, J. Solid State Chem. 159 (2001)
26–31.[16] Y. Sun, Y. Xia, Analyst 128 (2003) 686–691.[17] U. Kreibig, M. Vollmer, Optical Properties of Metal Clusters, Springer, Berlin,
1995.[18] S. Link, M. El-Sayed, J. Annu. Rev. Phys. Chem. 54 (2003) 331–366.[19] K. Kelly, E. Coronado, L. Zhao, G. Schatz, J. Phys. Chem. B 107 (2003) 668–677.[20] P. Mulvaney, Langmuir 12 (1996) 788–800.[21] G. Frens, Nat. Phys. Sci. (London) 241 (1973) 20–22.[22] S. Heard, F. Grieser, C. Barraclough, J. Sanders, J. Colloid Interf. Sci. 93 (1983)
545–555.[23] J. Turkevich, P.C. Stevenson, J. Hillier, Discuss. Faraday Soc. 11 (1951) 55–75.[24] M. Brust, M. Walker, D. Bethel, D. Schiffrin, R. Whyman, J. Chem. Soc., Chem.
Commun. (1994) 801–802.[25] Z.L. Wang, M.B. Mohamed, S. Link, M.A. El-Sayed, Surf. Sci. 440 (1999) 809–
814.[26] Y. Zhou, C. Wang, Y. Zhu, Z. Chen, Chem. Mater. 11 (1999) 2310–2312.[27] K. Mallick, Z. Wang, T. Pal, J. Photochem. Photobiol. A – Chem. 140 (2001) 75–
80.[28] A. Henglein, D. Meisel, Langmuir 14 (1998) 7392–7396.[29] A. Dawson, P. Kamat, J. Phys. Chem. B 104 (2000) 11842–11846.[30] E. Gachard, H. Remita, J. Khatouri, B. Keita, L. Nadjo, J. Belloni, J. New J. Chem.
22 (1998) 1257–1265.[31] J.D. Tanori, T. Castillo-Castro, E. Larios-Rodriguez, Z. Molina-Arenas, M.M.
Castillo-Ortega, Composites Part A (Appl. Sci. Manufact.) 38 (2007) 107–113.[32] M. Nakamoto, M. Yamamoto, M. Fukusumi, Chem. Commun. 15 (2002) 1622–
1623.[33] T. Shimizu, T. Teranishi, S. Hasegawa, M. Miyake, J. Phys. Chem. B 107 (2003)
2719–2724.[34] T. Teranishi, S. Hasegawa, T. Shimizu, M. Miyake, Adv. Mater. 13 (2001) 1699–
1701.[35] S. Yeung, R. Hobson, S. Biggs, F. Grieser, J. Chem. Soc., Chem. Commun. 4 (1993)
378–379.[36] R.A. Caruso, M. Ashokkumar, F. Grieser, Langmuir 18 (2002) 7831–7836.[37] K. Okitsu, M. Ashokkumar, F. Grieser, J. Phys. Chem. B 109 (2005) 20673–
20675.[38] K. Esumi, N. Sato, K. Torigoe, K. Meguro, J. Colloid Interf. Sci. 149 (1992) 295–
298.[39] K. Okitsu, Y. Mizukoshi, H. Bandow, Y. Maeda, T. Yamamoto, Y. Nagata,
Ultrason. Sonochem. 3 (1996) 249–251.
[40] J. Park, M. Atobe, T. Fuchigami, Ultrason. Sonochem. 13 (2006) 237–241.[41] J. Zhang, J. Du, B. Han, Z. Liu, T. Jiang, Z. Zhang, Angew. Chem., Int. Ed. 45 (2006)
1116–1119.[42] K. Okitsu, K. Sharyo, R. Nishimura, Langmuir 25 (2009) 7786–7790.[43] X. Qiu, J. Zhu, H. Chen, J. Cryst. Growth 257 (2003) 378–383.[44] J. Creighton, C. Blatchford, M. Albrecht, J. Chem. Soc., Faraday Trans. II 75
(1979) 790–798.[45] L. Suber, I. Sondi, E. Matijevic, D.V. Goia, J. Colloid Interf. Sci. 288 (2005) 489–
495.[46] K.-S. Chou, Y.-C. Lu, H.-H. Lee, Mater. Chem. Phys. 94 (2005) 429–433.[47] A. Frattini, N. Pellegri, D. Nicastro, O.D. Sanctis, Mater. Chem. Phys. 94 (2005)
148–152.[48] Y. Plyuto, J. Berquier, C. Jacquiod, C. Ricolleau, Chem. Commun. (1999) 1653–
1654.[49] J. Abid, A. Wark, P. Brevet, H. Girault, Chem. Commun. C (2002) 792–793.[50] K.A. Bogle, S.D.D.A.V.N. Bhoraskar, Nanotechnology (2006) 3204–3208.[51] W. Plieth, H. Dietz, A. Anders, G. Sandmann, A. Meixner, M. Weber, H. Kneppe,
Surf. Sci. (2005) 119–126.[52] F. Mafune, J.-Y. Kohno, Y. Takeda, A.T. Kondow, J. Phys. Chem. B (2000) 9111–
9117.[53] J. Zhang, B. Han, M. Liu, D. Liu, Z. Dong, J. Liu, D. Li, J. Wang, B. Dong, H. Zhao, L.
Rong, J. Phys. Chem. B 107 (2003) 3679–3683.[54] Z. Min, W. Zuo-Shan, Z. Ya-Wei, Trans. Nonferrous Met. Soc. China (2006)
1348–1352.[55] G.-W. Yang, H. Li, Mater. Lett. (2008) 2189–2191.[56] R.A. de Barros, W.M. de Azevedo, Synth. Met. (2008) 922–926.[57] X.-K. Wang, L. Shao, W.-L. Guo, J.-G. Wangb, Y.-P. Zhu, C. Wang, Ultrason.
Sonochem. (2009) 747–751.[58] M.T. Nguyen, T.T.T.A.H. Chang, J. Vac. Sci. Technol. B 27 (2009) 1586–1589.[59] Y. Nagata, Y. Watanabe, S. Fujita, T. Dohmaru, S. Taniguchi, J. Chem. Soc., Chem.
Commun. (1992) 1620–1622.[60] R. Salkar, P. Jeevanandam, S. Aruna, Y. Koltypin, A. Gedanken, J. Mater. Chem.
(1999) 1333–1335.[61] Y. Sun, Y. Xia, Analyst (2003) 686–691.[62] S. Link, Z.L. Wang, M.A. El-Sayed, J. Phys. Chem. B (1999) 3529–3533.[63] S. Anandan, F. Grieser, M. Ashokkumar, J. Phys. Chem. C 112 (2008) 15102–
15105.[64] D. Radziuk, D. Shchukin, H. Möhwald, J. Phys. Chem. C 112 (2008) 2462–2468.[65] D. Radziuk, W. Zhang, D. Shchukin, H. Möhwald, Small 6 (2010) 545–553.[66] B. Wunderlich, Macromolecular Physics, Vol. 1, Crystal Structure, Morphology,
Defects, Academic press, New York, 1973.[67] M. Mostafavi, N. Keghouche, M.O. Delcourt, J. Belloni, J. Chem. Phys. Lett. 167
(1990) 193–197.[68] M.K. Temgire, S.S. Joshi, Radiat. Phys. Chem. 71 (2004) 1039–1044.[69] L. Loffler, W. Mader, J. Eur. Ceram. Soc. 25 (2005) 639–648.[70] F. Bonet, V. Delmas, S. Grugeon, R.H. Urbina, P.Y. Silvert, K. Tekaia-Elhsissen,
Nanostruct. Mater. 11 (1999) 1277–1284.[71] Y.W. Cao, R.C. Jin, C.A. Mirkin, J. Am. Chem. Soc. 123 (2001) 7961–7962.[72] Yan Wu, Peng Jiang, Ming Jiang, Tie-Wei Wang, Chuan-Fei Guo, Si-Shen Xie,
Zhong-Lin Wang, Nanotechnology (2009) 305602–305610.[73] T. Sugimoto, Fine Particle-Synthesis Characterization and Mechanisms of
Growth, Dekker, New York, 2000.[74] Y.W. Cao, R. Jin, C.A. Mirkin, J. Am. Chem. Soc. 123 (2001) 7961–7962.[75] C.X. Kan, J.J. Zhu, C.S. Wang, J. Cryst. Growth 311 (2009) 1565–1570.[76] T. Yonezawa, N. Toshima, J. Chem. Soc., Faraday Trans. 91 (1995) 4111–4119.[77] J.J. Zhu, C.X. Kan, X.G. Zhu, J.G. Wan, M. Han, Y. Zhao, B. Wang, G. Wang, J.
Mater. Res. 22 (2007) 1479–1485.[78] I. Shyjumon, M. Gopinadhan, O. Ivanova, M. Quaas, H. Wulff, C.A. Helm, R.
Hippler, Eur. Phys. D 37 (2006) 409–415.