acoustic consequences of articulatory variability during
TRANSCRIPT

Acoustic consequences of articulatory variability during productions of /t/ and /k/ and its
implications for speech error research
Stefania Marina)
Institute of Phonetics and Speech Processing, Ludwig-Maximilians-University Munich,
Germany
Marianne Pouplier
Institute of Phonetics and Speech Processing, Ludwig-Maximilians-University Munich,
Germany
Haskins Laboratories, New Haven, CT, USA
Jonathan Harrington
Institute of Phonetics and Speech Processing, Ludwig-Maximilians-University Munich,
Germany
Running Title: Acoustic consequences of articulatory variability
a) Address for correspondence: Institute für Phonetik und Sprachverarbeitung, Ludwig-
Maximilians Universität München, Schellingstr. 3/II, 80799 München, Germany. E-mail:

2
Abstract
An increasing number of studies has linked certain types of articulatory or acoustic variability
with speech errors, but no study has yet examined the relationship between such articulatory
variability and acoustics. The present study aims to evaluate the acoustic properties of
articulatorily errorful /k/ and /t/ stimuli, to determine whether these errors are consistently
reflected in the acoustics. The most frequent error observed in the articulatory data is the
production of /k/ and /t/ with simultaneous tongue tip and tongue dorsum constrictions. Spectral
analysis of these stimuli’s bursts shows that /k/ and /t/ are differently affected by such co-
production errors: co-production of tongue tip and tongue dorsum during intended /k/ results in
typical /k/ spectra (and hence in tokens robustly classified as /k/), while co-productions during
intended /t/ result in spectra with roughly equal prominence at both the mid-frequency (/k/-like)
and high-frequency (/t/-like) range (and hence in tokens ambiguous between /k/ and /t/). This
outcome is not due to an articulatory timing difference, but to tongue dorsum constriction
having an overall greater effect on the acoustic than a tongue tip constriction when the two are
co-produced.
PACS numbers: 43.70.Fq

3
I. INTRODUCTION
The current study investigates the relationship between articulation and acoustics in utterances
with alternating initial consonants in order to increase our understanding of how articulatory
variability during production of coronal and dorsal stops, potentially resulting in speech errors,
is reflected in the acoustic signal. Several studies have found that the alternating consonants in
such utterances display an increased amount of articulatory and acoustic variability compared to
environments in which these consonants do not alternate. Under certain circumstances, this
variability may be perceived as errorful by listeners (Boucher, 1994; Goldstein, Pouplier, Chen,
& Byrd, 2007; McMillan, Corley, & Lickley, 2009; Mowrey & MacKay, 1990; Pouplier, 2003,
2007, 2008; Pouplier & Goldstein, 2005). However, there has been no systematic study to
examine the relationship between such articulatory variability and the acoustic consequences.
That is, previous studies either examined articulatory variability without a systematic analysis of
its impact on acoustics, or they examined acoustic variability without the availability of
information on the articulations that give rise to the acoustics. Due to the complex, nonlinear
relationship between articulation and acoustics, it is, however, important to gain a principled
understanding of how errorful articulatory and acoustic variability relate to each other. The
present study aims to address this issue by evaluating the acoustic properties of /k/ and /t/
stimuli with known articulatory configurations, in order to determine how the increased
articulatory variability may be reflected acoustically, and also to determine whether it may be
reflected acoustically equally for both intended /k/ and /t/.
An examination of the acoustic properties errors is especially opportune given the great
importance of error data for models of speech production (Dell, 1986; Levelt, 1989; Levelt et al.
1999; Rapp & Goldrick, 2000) and in view of the divergent findings between studies that rely

4
on auditory perception for error detection on the one hand, and studies that investigate errors
articulatorily on the other. Thus based on the former, speech errors have traditionally been
described in categorical terms as substitution of one symbolic phonological unit with another
(Fromkin, 1971, 1973; Shattuck-Hufnagel, 1979, 1983). However, physiological studies have
shown firstly that such perceived categorical substitutions may in fact involve the simultaneous
production of two constrictions (one intended, one errorful), and secondly ����� these
constrictions may be produced along a gradient continuum of magnitudes, exhibiting patterns
intermediate between those typical for a given category (Boucher, 1994; Goldstein et al., 2007;
McMillan et al., 2009; Mowrey & MacKay, 2009; Pouplier, 2003, 2007, 2008).
Different results have also emerged from auditory and articulatory analyses as far as the
extent to which coronals and non-coronals are prone to errors. The auditory analysis of
Stemberger (1991) showed that coronals are disproportionally susceptible to be replaced by non-
coronals in errors. He interprets these results as providing strong evidence for the phonological
underspecification of coronals, since an un(der)specified place of articulation can easily be
“replaced” by any other, phonologically specified place of articulation. Articulatory studies on
the other hand (Goldstein et al., 2007; Pouplier, 2003, 2008), did not observe this asymmetry in
error-proneness between /k/ and /t/: the articulatory errors documented in these studies occurred
with equal frequency during productions of both /k/ and /t/. We are left, then, with the following
discrepancy: auditory analyses suggest a place asymmetry in speech errors, but physiological
analyses have shown that there is none.
An explanation for the discrepancy between these results is that errors involving coronals
may be auditorily more salient. That is, the articulatory deviation due to a production error may
result in a greater acoustic deviation from the corresponding error-free production for coronals

5
than for dorsals. Under this interpretation, the bias reported in auditorily-based analyses may
come about not because coronals are inherently more error-prone, but instead because the
hypothesized greater acoustic deviation makes the error much more noticeable than in the case
of dorsals. It is precisely this issue that we test in the present study by examining the acoustic
properties of speech errors with known articulatory configurations.
Our study is therefore concerned with how articulatory variability is reflected in the
acoustic domain: we investigate ‘partial’ errors that involve simultaneous production
(henceforth co-production) of two constrictions – one intended, one un-intended (or intruding) –
of the type reported by Pouplier (2003) (cf. also Goldstein et al., 2007). Specifically, that study
used a repetition task to elicit productions of /k/ and /t/ in utterances with alternating initial
consonants (e.g. cop top), and the most frequent error observed in their articulatory data was an
intrusion of a second articulatory gesture (or constriction) without the intended gesture being
reduced. This resulted in the simultaneous presence of both tongue tip and tongue dorsum
constrictions during the production of errorful /k/ or /t/: while /k/ is normally produced with
only a tongue dorsum constriction, in an error, a tongue tip constriction is produced
simultaneously with the dorsal constriction, without the intended dorsal constriction being
reduced. The intruding tongue tip gesture can display a range of gestural magnitudes, ranging
from minimal variability to an articulator position typical for the production of a coronal stop.
Likewise during the production of an intended /t/, they observed that the intended tongue tip
constriction can, in errorful tokens, be co-produced with an intruding tongue dorsum
constriction. In terms of their frequency of occurrence, these co-productions were the most
frequent type of error observed; reductions of intended constrictions (e.g., a tongue tip

6
constriction for intended /t/ produced with a reduced constriction) and substitutions (e.g., only a
/k/-like tongue dorsum constriction is observed during intended /t/) were observed only rarely.
Furthermore, co-productions occurred with equal frequency during intended /k/ and /t/.
However, although this type of error was as likely to occur during production of either /k/ or /t/,
there has been a reported asymmetry in the perceptual consequences of co-productions during
/k/ vs. /t/. In their perception experiment, using a subset of the data collected by Pouplier (2003),
Pouplier & Goldstein (2005) found that intruding tongue dorsum gestures during /t/ had a
systematic perceptual effect, resulting in significantly lower correct identification scores and
longer reaction times than for error-free /t/. However, intruding tongue tip gestures during
intended /k/ did not significantly affect identification or reaction times. It seems therefore that
while /k/ and /t/ are equally prone to error at the articulatory level, the perceptual effects of co-
productions are different depending on whether /k/ or /t/ is the intended consonant. Since the
acoustic properties of co-productions have not been investigated so far, it is not known whether
this difference is due to perceptual biases (cf. for instance Hume, Johnson, Seo, Tserdanelis, &
Winters, 1999; Smits, ten Bosch, & Collier, 1996; Winters, 2000, on the lower perceptual
salience of singleton coronals compared to labials and velars), or whether the influence of the
additional constriction exerted on the acoustics varies as a function of the constricting
articulator/place of articulation of the intruding gesture. By examining the acoustic properties of
tokens produced with an intruding gesture, the current study can determine, as described below,
whether the previously reported perceptual asymmetry between coronals and dorsals produced
with an intruding gesture is due to a difference at the acoustic level, or to a perceptual/auditory
bias.
7
It is well established that articulatory changes in the vocal tract will affect the acoustic
output to different degrees, depending on the exact location and size of a given constriction
formation (cf. Stevens, 1972, 1989). Since in co-productions, the intended constriction is
stronger both spatially and temporally compared to the intruding constriction (Pouplier, 2003;
Pouplier & Waltl, 2008), ‘adding’ a coronal constriction to an intended dorsal constriction may
affect the vocal tract area function differently compared to ‘adding’ a dorsal constriction to an
intended coronal constriction. Specifically, an intruding constriction formed behind the main
constriction (as is the case for an intended /t/ with an intruding dorsal constriction) could affect
the pressure build-up and hence the acoustic properties of the consonant release more than an
intruding constriction formed in front of the main constriction (as is the case for an intended /k/
with an intruding coronal constriction). As a result, the acoustics of intended coronals could be
affected more by an intruding tongue dorsum gesture than the acoustics of dorsals by a tongue
tip intrusion. If an intruding constriction (or gesture) affects the acoustic properties of coronals
but not the acoustic properties of dorsals, then the observed perceptual asymmetry could be
based on differences at the acoustic level. Under this hypothesis, we predict that an intruding
tongue dorsum gesture during /t/ will result in tokens acoustically different from error-free /t/,
while an intruding tongue tip gesture during /k/ will result in tokens acoustically similar to error-
free /k/.
On the other hand, Winitz et al. (1971) remark that “it is difficult to smear a high-energy
English /t/ into a /p/ or a /k/, but not difficult to smear /p/ into /k/ or the reverse” (p. 1972-73),
suggesting that acoustically, /t/ bursts should be at least as robust as /k/ bursts, and if anything
dorsals should be acoustically more sensitive to articulatory variability compared to coronals. If
so, the perceptual results reported by Pouplier & Goldstein (2005) could be due not to an
8
asymmetry at the acoustic level, but to a bias exclusively at the auditory/perceptual level. It has
been observed that perception of coronal stops produced by native speakers of several languages
is generally worse than that of non-coronals either in singleton contexts (Hume et al., 1999;
Smits et al., 1996; Winters, 2000)1, or in clusters (Kochetov & So, 2007; Surprenant &
Goldstein, 1998), and also that their perception is degraded more readily than perception of non-
coronals by articulatory variability. Byrd (1992) and Chen (2003) observed, using articulatory
synthesized stimuli, that perception of coronal stops is more vulnerable to increased articulatory
overlap than perception of labial stops. It is not implausible therefore to expect that an intruding
gesture may affect the acoustic properties of both coronals and dorsals, but that perception is
more sensitive to the changes in the acoustic patterns of coronals compared to dorsals (or in
other words, that more acoustic variability is tolerated in dorsals than in coronals before their
perception is degraded). Under this hypothesis, we predict that an intruding tongue dorsum
gesture during either /t/ or /k/ will result in tokens acoustically different from error-free /t/ and
/k/, and that the perceptual patterns reported by Pouplier & Goldstein (2005) may be due to a
bias in how robustly these acoustic changes can be auditorily detected. To decide between these
two possibilities, we analyzed the relationship between articulation and acoustics for /t/ and /k/
tokens that were produced with an intended as well as an intruding gesture, the latter covering a
range of different gestural magnitudes.
A further question we address is whether the acoustic consequences of co-produced
intended and intruding gestures are influenced by the timing relation between these two
gestures. It is conceivable that different timing relations between the two gestures have different
acoustic consequences, depending on which gesture is released last. Pouplier & Goldstein
(2005) did not control for articulatory timing in their experiment. Thus, the perceptual pattern

9
they reported may not be due to an asymmetry in how acoustics and/or perception are affected
by tongue dorsum vs. tongue tip intrusion gestures, but rather to different timing patterns
between intended and intruding articulations. Pouplier & Waltl (2008) performed a detailed
articulatory timing analysis of the Pouplier (2003) data and found that generally the intended
gesture was released last in the case of both intended /k/ and /t/, with relatively few tokens
showing the reverse pattern. In conjunction with the results of the perception experiment, this
suggests that timing patterns are not a strong predictor of the acoustic consequences: the
perception experiment had reported an asymmetry between coronal and dorsal stimuli, yet the
timing revealed that for both coronals and dorsals it was usually the intended gesture that was
released last. However, since timing was not explicitly controlled for in the perception
experiment, it is possible that, by chance, the perceptual experiment included errorful /t/ tokens
with the intruding gesture released last, and no errorful /k/ tokens with the intruding gesture
released last, resulting in the systematic lower identification scores for errorful /t/ than /k/. We
examined therefore the extent to which acoustics were determined not only by the
presence/absence of an intruding gesture, but also by the intruding gesture’s relative timing to
the intended gesture.
II. METHOD
A. Gestural classification
To determine the relationship between the acoustic and articulatory properties of speech errors,
we used data for which both acoustic and articulatory information was available. The dataset
consisted of simultaneously recorded articulatory and acoustic data collected by Pouplier
(2003). Articulatory data were recorded using the Perkell-system articulograph at Haskins
Laboratories (Perkell et al., 1992). For the recordings, four sensors were placed on the tongue:

10
tongue tip (TT; attached about 1cm behind the actual tongue tip), anterior tongue body, posterior
tongue body, tongue dorsum (TD). Additional sensors were placed one each on the upper and
lower lips, the lower teeth to track jaw movement, and, to be able to correct for head movement,
the nose ridge and the upper incisors. Standard calibration and postprocessing techniques were
performed for each experiment. The articulatory data were sampled at 500 Hz and low-pass
filtered at 15 Hz during postprocessing. For the simultaneously recording of acoustic data, a
Sennheiser shotgun microphone was positioned about 1m in front of the subject; acoustic data
were sampled at 20 kHz and for one subject (JP) at 48 kHz.
Data from 7 speakers of American English were recorded. Subjects were instructed to
produce utterances with alternating onset consonants (cop top, top cop, kip tip, tip kip) in
synchrony to a metronome beat. For the duration of each trial, the subjects saw the utterance
they were instructed to pronounce on a computer screen in front of them, and stress placement
was indicated in capital letters (e.g. COP top). Experimental variables included two stress
conditions (iambic vs. trochaic), two vowel contexts (top cop vs. tip kip), phrase position (top
cop vs. cop top) and three speaking rates (fast, at 120 beats per minute, medium at 104 beats per
minute and slow at 80 beats per minute, allowing for speaker-specific adjustments within a +/- 4
beats per minute range of the target rates). Productions of utterances with non-alternating initial
consonants (cop cop, top top, kip kip, tip tip) were also included in the dataset and served as
controls for the analysis of articulator kinematics, but only stops produced in alternating trials
were included in the acoustic analyses. The experimental variables were fully crossed. The data
recording and processing procedures are detailed in Pouplier (2003).
The movement time functions obtained through the EMMA system were analyzed using
software algorithms developed at Haskins Laboratories. For consonants /t/ and /k/, vertical
11
position maxima of the tongue tip and tongue dorsum transducer coils were automatically
determined on the basis of changes in their velocity profiles. As illustrated in Figure 1, a vertical
position maximum (Max) was defined as the kinematic event where velocity was at its
minimum between two velocity peaks corresponding to the articulator moving towards and
away from the constriction. If the labelling algorithm did not find a maximum in one of the
signals (e.g., in tongue dorsum during /t/ and tongue tip during /k/), its vertical amplitude value
was measured at the time of a maximum in the other signal which the algorithm had identified.
For instance, if there was no vertical position maximum for tongue dorsum during /t/ (since the
tongue dorsum is not expected to rise during /t/), tongue dorsum was measured at the time of the
tongue tip maximum (cf. Figure 1b).
[Insert FIGURE 1 about here]
The vertical position maxima in alternating utterances span a whole range of values, from
minimally variable to values typical for a canonical controlled stop constriction. Production of
/k/ and /t/ was determined as “errorful” or “error-free” on the basis of articulator height (cf.
Pouplier 2003). Typical vertical articulatory positions for tongue tip (TT) and tongue dorsum
(TD) during production of /k/ and /t/ were determined on the basis of matching conditions from
the non-alternating utterances (cf. Goldstein et al., 2007; Pouplier, 2003). Based on a working
criterion, tokens were considered errorful if TT height during /k/ and TD height during /t/ were
2 standard deviations away from their mean in non-alternating productions. Errorful tokens were
further classified into two constriction magnitude categories – ‘gradient’ and ‘categorical’: if the
maximal vertical position of TT/TD was within 2 standard deviations of the other category
mean, the error was considered categorical (C), otherwise it was considered gradient (G). In
order to evaluate how the acoustics are affected by different vertical articulator positions

12
(indicative of constriction degree, at least for stop consonants), we followed the classification of
Pouplier (2003) procedure here. Several studies have shown that the increased variability in
articulator height can, in the right circumstances, be perceived as a speech error (Goldrick &
Blumstein, 2006; Pouplier & Goldstein, 2005; Wood, 1997). Under which conditions any given
production can be deemed errorful has been subject to vigorous debate. The current paper
focuses on the acoustic consequences of variability of articulator height which is observed in
utterances that typically elicit speech errors; the question how to negotiate the relationship of
'variability' and 'error' for any given token is not the focus of the paper. The terms “error-free”
and “errorful” are labels of convenience to denote ranges of expected values of articulator
positions.
Co-production errors were defined as simultaneous production of an un-intended (or
intruding) TT or TD gesture with the intended one. An error-free /t/ is produced with an active
TT closure gesture and no actively controlled TD; a co-production error during intended /t/
occurs when a TD gesture is produced along with TT. An error-free /k/ is produced with an
active TD closure gesture and no actively controlled TT; a co-production error during intended
/k/ occurs when TT is produced along with TD. To summarize, on the basis of the articulatory
metric, the following error-free and errorful /k/ and /t/ categories were defined:
- K: error-free /k/ - produced with tongue dorsum and tongue tip heights typical for /k/
as determined on the basis of the non-alternating utterances;
- T: error-free /t/ - produced with tongue dorsum and tongue tip heights determined
typical on the basis of /t/ production in non-alternating utterances;

13
- KC: /k/ produced with a categorical error – tongue dorsum height is typical for /k/ in
non-alternating utterances, tongue tip height is within 2 standard deviations of the
mean of non-alternating /t/;
- KG: /k/ produced with a gradient error – tongue dorsum height is typical for /k/ in
non-alternating utterances, tongue tip height is 2 standard deviations away from the
mean of non-alternating /k/, but not within 2 standard deviations of the mean of non-
alternating /t/;
- TC: /t/ produced with a categorical error – tongue tip height is typical for /t/ in non-
alternating utterances, tongue dorsum height is within 2 standard deviations of a
typical /k/;
- TG: /t/ produced with a gradient error – tongue tip height is typical for /t/ in non-
alternating utterances, tongue dorsum height is 2 standard deviations away from a
typical /t/, but not within 2 standard deviations of a typical /k/.
Figure 2a illustrates the error metric schematically; Figure 2b gives the normalized distribution
of tokens within the “gradient” and “categorical” error categories for speaker JX (the speaker
whose data are used in the classification analysis below).2 The histograms in Figure 2b show
that categorically errorful /k/ and /t/ are similarly distributed within their respective category.
For gradient errors, the TG distribution is skewed leftward, indicating that there are more tokens
with tongue dorsum heights closer to the values for error-free /t/ than for error-free /k/.
[Insert FIGURE 2 about here]
Our data, summarized in Table I, consisted therefore of /k/ and /t/ produced in alternating
utterances (cop top and similar), and defined articulatorily as errorful (KC, KG, TC, TG) or
14
error-free (K, T). Subsets of the data were used for various analyses, as will be detailed in the
following sections.
[Insert TABLE I about here]
B. Acoustic analysis procedure
For each articulatorily classified initial consonant (K, T, KC, KG, TC, TG), the acoustic signal
was labeled in Praat 4.6.38 (Boersma & Weenink, n.d.) from the release burst to the beginning
of periodic vibration for the following vowel. There is evidence that the place of articulation in
an oral stop can be related to the shape of the spectrum in the burst – dorsals are characterized
by a mid-frequency spectral peak, resulting in a ‘compact’ spectrum, while coronals are
characterized by a high-frequency peak of greater energy than at lower frequencies, resulting in
a rising spectrum (Blumstein & Stevens, 1979; Fant, 1960; Halle, Hughes, & Radley, 1957;
Jakobson, Fant, & Halle, 1963; Stevens & Blumstein, 1978; Stevens, 1989). It has also been
established that temporal information in the spectra is important in identification of place of
articulation of stop consonants (Kewley-Port, 1983; Kewley-Port & Luce, 1984; Kewley-Port,
Pisoni, & Studdert-Kennedy, 1983), and that it contains cues that are especially important for
the identification of dorsals, that is, their compact spectrum persists as a function of time in the
burst (Kewley-Port, 1983). Furthermore, previous studies (Forrest, Weismer, Milenkovic, &
Dougall, 1988; Nossair & Zahorian, 1991) have shown that voiceless stops can be successfully
classified on the basis of statistical properties such as mean, slope and curvature of their burst
over time. We therefore analyzed /k/ and /t/ on the basis of the time-varying spectral information
available in their burst (from acoustic release to vowel onset), expressed in terms of the
spectrum mean, slope and curvature; the analysis was performed using the EMU speech data
analysis system (Cassidy & Harrington, 2001). The spectral data were calculated with a 256

15
point DFT with a 40Hz frequency resolution and a 5ms Blackman window shifting in 5ms
increments over the entire length of the burst-to-vowel interval sampled at 20 kHz. The
frequency axis was warped to the auditory Bark scale, in the frequency range 0 to 8500 Hz (0 to
21.26 Bark), using the formula in Traunmüller (1990).
The parameterisation of the spectral data to include time-varying information is
illustrated with an example in Figure 3. After converting the spectra between the burst onset and
vowel onset to Bark, each stop consists of a running spectral display as shown in Figure 1a with
Bark spectra at intervals of 5 ms. The next step was to reduce each individual spectrum from
such a running display to just three values and more specifically to the first three coefficients
(C0, C1, C2) that are obtained after applying the discrete cosine transformation (DCT). For an N-
point Bark spectrum, x(n), extending in frequency from n = 0 to N –1 points, the mth DCT
coefficient, Cm, ( m = 0, 1, 2) was calculated with:
1
0
2 (2 1)( ) cos
2
Nm
mn
k n mC x n
N Nπ−
=
+� �= � �� �
� (1)
1
, 02mk m= = ; 1, 0mk m= ≠
These three coefficients, which are the amplitudes of the first three half-cycle cosine waves
derived from the DCT, are proportional to the spectrum's mean, slope, and curvature
respectively, and are also essentially equivalent to Bark-scaled cepstral coefficients (see
Harrington, Kleber, & Reubold, 2008; Nossair & Zahorian, 1991; Watson & Harrington, 1999
for formulae and further details). Consequently, after applying (1), the stop burst (Figure 3a)
was reduced to a triplet of values (the first three DCT coefficients), with one triplet every 5 ms:
these triplets of DCT-coefficients as a function of time can be used to derive a (cepstrally)

16
smoothed spectrum (Figure 3b). We denote the triplets of DCT-coefficients across time by C0t,
C1t, C2t , as shown in Figure 3c.
We now needed to find a way to compress C0t, C1t, C2t prior to classification. The
approach that we used was to apply (1) again separately to each of the time-varying C0t, C1t, C2t.
This is exactly equivalent to the methodology used in Harrington et al. (2008) for compressing
time-varying formant trajectories. Thus, whereas each time-varying formant of a vowel was
reduced with the DCT to three values in Harrington et al. (2008), here we have reduced
separately the stop burst's time-varying spectral mean (C0t), time-varying spectral slope (C1t)
and time-varying spectral curvature (C2t) each to three values using (1), a procedure equivalent
to a 2nd order polynomial fitting. The end result, then, is that we have compressed the Bark
scaled spectral information of each stop burst between the release and vowel onset (Figure 3a)
to a single point in a nine-dimensional space and moreover in such a way that this compression
encodes time-varying information.
[Insert FIGURE 3 about here]
C. Classification procedure
We classified the stops in the 9-dimensional space described in II.B using a Support Vector
Machine (SVM) algorithm (Baayen, 2008; Bennett & Campbell, 2000; Cortes & Vapnik, 1995;
Duda, Hart, & Stork, 2000). Non-technically, a SVM separates classes not on the basis of their
center or mean, but instead on the basis of their margins; to accomplish this, points are projected
into a high dimensional space and a separating hyperplane is determined in this space. Among
the advantages of this classification method is the fact that SVM makes no assumptions about
normality of the data, and that it can handle cases where a class is broken into non-contiguous
regions. This is especially important with speech data where phonetic classes can contain non-
17
contiguous members due to context. This consideration is also important for our current dataset,
since we collapsed over several experimental variables (rate, vowel, stress, phrase position).3
Previous work on phonetic classification of vowels and consonants in running sentences
(Clarkson & Moreno, 2000) has shown that SVM performs at least as well as Gaussian
classifiers. SVM was implemented using the “e1071” library for R (Mayer, 2001) using a
Gaussian radial basis function kernel. For classification of speech classes (both vowels and
consonants), the choice of kernel is reported not to have a major impact on accuracy (Clarkson
& Moreno, 2000).
For classification, the data were split into separate training and testing parts. Our training
data were correctly produced stops from 6 speakers, and our test data were stops produced by a
new speaker (JX) not included in training (Table II). Speaker JX was selected for testing as this
was the speaker whose production was also used in the perceptual experiment reported by
Pouplier & Goldstein (2005), and we reasoned that selecting data from the same speaker for the
acoustic analysis would allow for an investigation of the relationship between articulation,
acoustics and perception. Furthermore, this speaker’s data set was relatively balanced for
number of error-free /t/ and /k/ tokens, as well as for number of errorful tokens. Splitting this
subject’s data by the conditions stress, rate, phrase position and vowel context resulted in a low
number of errorful tokens for some of the conditions (cf. Table A in the Appendix). For this
reason, the acoustic analyses reported in the main body of the paper were carried out on data
collapsed across the conditions stress, rate, phrase position and vowel context. Analyses by
conditions are, as far as they were feasible in terms of number of tokens, reported in the
Appendix.
[Insert TABLE II about here]

18
D. Acoustic proximity calculations
We further quantified the acoustic properties of each token in the test data by calculating the
Mahalanobis (M) distance of each token to the centroids of both error-free /k/ (Mk) and /t/ (Mt)
in the 9 dimensional space to which each token’s burst properties were compressed. We used the
Mahalanobis distance for its capability to factor in the categories' distributions (in our case the
distributional shapes of error-free /k/ and /t/). Relative proximity, P, of each token to either
error-free /k/ or /t/ was calculated as the difference between the two Mahalanobis distances (on
the logarithmic scale), using the formula in (2):
P = log(Mk) – log(Mt), (2)
where Mk = Mahalanobis distance of a token to the centroid of error-free /k/, and
Mt = Mahalanobis distance of a token to the centroid of error-free /t/.
When P is 0, the token is equidistant between /k/ and /t/; when it is positive, the token is closer
to /t/ than to /k/; and when it is negative, the token is closer to /k/ than to /t/.
E. Measures used from previous studies: d’ perceptual score and articulatory timing
To assess the relationship between acoustics and perception, we used the perceptual measure
employed by Pouplier & Goldstein (2005) in their experiment. To examine the role of relative
timing of the intended and intruding gestures in shaping the tokens’ acoustics, we use the timing
measure employed by Pouplier & Waltl (2008). In what follows we summarize these measures,
and the data subsets for which these measures are available.
Pouplier & Goldstein (2005) used in their perceptual experiment a total of 60 tokens,
selected from each articulatory classification category (no error, gradient error, categorical
error) and covering within their category a range of different articulator heights for the intruding

19
gesture. Ten tokens were selected per category (except for KC that included 11 tokens and KG
that included 9 tokens), all produced by the same speaker (JX). The perceptual responses were
obtained for individual tokens from 11 native speakers of English in a go-no go perceptual
identification task (for details, see Pouplier & Goldstein 2005). For each token, we used the
perceptual scores (d’; (MacMillan & Creelman, 1991) obtained in their experiment.4 These d’
perceptual scores represent the difference between correct and incorrect identification, and were
calculated using (3).
d’ = z(H) –z(F), (3)
where
H = proportion of correct identification responses relative to number of trials, and
F = proportion of incorrect identification responses relative to number of trials
z = standardized score
A d’ score of 4.65 represents perfect accuracy (H=99%, F=1%; MacMillan & Creelman, 1991),
while a negative score means that the proportion of incorrect responses is greater than that of
correct ones. In this way, the consistent correct identification of any given token as either /k/ or
/t/ has a maximum score of +4.65, while consistent incorrect identification has a negative score
to a minimum of -4.65.
For relative timing between intended and intruding articulatory gestures, we used the
timing measure employed by Pouplier & Waltl (2008). For determining articulatory timing, the
vertical movement time series of both the intended and intruding gestures were labeled at
constriction release, as shown in Figure 1a (cf. Pouplier & Waltl, 2008, for details on the
segmentation procedure employed).5 Relative timing at release was calculated as the lag

20
between intended and intruding gesture, by subtracting the release timestamp of tongue tip from
the release timestamp of tongue dorsum (Lag = ReleaseTD – ReleaseTT). A negative lag means
that tongue tip constriction was released last, and a positive lag means that tongue dorsum was
released last. For subject JX, the release lag measure was available for 54 KC tokens, 41 KG
tokens, 28 TC tokens, and 43 TG tokens. Because for most error-free tokens the uncontrolled
articulator could not be measured (cf. Figure 1b), relative timing for these tokens could not be
computed and hence they were not included in the analysis.
III. RESULTS
A. SVM classification
For the classification analysis, training was performed on correctly produced stops from 6
speakers, and testing on stops produced by speaker JX (cf. Table II). Results from both a closed
test (training and testing on the training data), and a semi-open test (training and testing on the
training data using a four-fold cross-validation) show that error-free /k/ and /t/ are correctly
classified by the SVM for the vast majority of cases (Tables III and IV). It must be noted that no
speaker normalization was performed for the training data, and that the data were
undifferentiated for stress conditions, phrase positions, speech rates and vowel contexts (cf.
section II.A).
[Insert TABLE III about here]
[Insert TABLE IV about here]
[Insert TABLE V about here]
The test data from subject JX were classified on the basis of the training results obtained from
error-free data from 6 subjects. The confusion matrix (Table V) for the test data shows that
21
error-free /k/ and /t/ were accurately classified at 90% and 85% respectively. While productions
of /k/ with intruding tongue tip gestures were predominantly classified as /k/ (83% for
categorical intrusions, and 89% for gradient intrusions), there was greater ambiguity in whether
errorful /t/ was classified as /k/ or /t/. Thus, about half of /t/ tokens produced with an intruding
tongue dorsum of categorical magnitude (TC) were classified as /k/, and about half as /t/. The
overall classification pattern, with ambiguity in the classification of TC, remained the same
when the data were split for conditions stress, rate, phrase position and vowel context (Table B
in the Appendix). TC tokens were ambiguously classified as /k/ or /t/ regardless of stress, rate,
phrase position or vowel context, while no such ambiguity was observed for errorful /k/ tokens.
The distribution of posterior probabilities (Figure 4) shows that most TC tokens occupied
a space between unambiguous /k/ and /t/ (rather than being evenly assigned to the center of the
/k/ and /t/ spaces). Thus, while /k/ tokens (errorful or not), and error-free /t/ tokens show a
skewed distribution, with half of the tokens having a probability of 90% or more of being
correctly classified, errorful /t/ tokens show a much flatter distribution along the probability
continuum: for TC, only ¼ of the tokens have a probability over 90% of being classified as /t/,
another ¼ have a probability under 20% of being correctly classified, with half of the tokens
falling in the middle of the continuum. This asymmetry cannot be explained by the distributions
of articulator heights between errorful /k/ and /t/. Articulator height histograms (Figure 2b)
showed that on the basis of vertical position of the intruding articulator, KC and TC were
similarly distributed within their defined intervals. For the gradient categories, there were more
TG tokens close to the boundary between error-free and errorful /t/, than were KG tokens to the
boundary between error-free and errorful /k/ (boundary A in Figure 2). Nevertheless, there were

22
more ambiguous TG tokens than KG tokens, although articulator height distributions alone
would have predicted the opposite pattern.
[Insert FIGURE 4 about here]
B. Proximity measure P
To quantify the acoustic similarity of errorful /k/ and /t/ to either typical velars or alveolars, we
measured each token’s proximity to the centroids of error-free /k/ and /t/. For this measure,
described in section II.D., we expected that error-free /k/ and /t/ should each be close to their
own centroids, resulting in negative P values for /k/ and positive values for /t/, which is indeed
the pattern observed (Figure 5). In terms of acoustic proximity P of the error tokens to either
error-free /k/ or /t/, we observe similar median values for all three /k/ categories (error-free,
categorical and gradient error), but more divergent median values for the /t/ categories, with
(some) error /t/ tokens having intermediate values between /k/ and /t/. A Welch's variance-
weighted ANOVA (to correct for unequal variances) with dependent variable relative proximity
index P and factor Category (K, KC, KG, T, TC, TG) was significant (F(5, 145.765) = 267.183,
p <0.001). A follow-up posthoc test (Games-Howell, appropriate for unequal variances and
group sizes, cf. Toothaker, 1993) showed that none of the /k/ groups differed significantly from
each other (p>0.05), while TC and TG differed from T (p<0.001), but not from each other
(p>0.05); all /t/ groups also differed from the /k/ groups (p<0.001). These results show that
while errorful /k/ tokens are acoustically close to error-free /k/, errorful /t/ tokens as a group are
acoustically close to neither error-free /t/ nor /k/, a result that corroborates the distribution of
probabilities from the classification analysis. This shows that an intruding tongue tip during /k/
results in tokens acoustically similar to error-free /k/, while an intruding tongue dorsum during
/t/ results in tokens acoustically different from error-free /t/. Relative proximity patterns for the

23
data split according to stress, rate, phrase position and vowel context remained similar to the
overall pattern with no diverging pattern in any of the conditions (Figure A in the Appendix).
[Insert FIGURE 5 about here]
C. Relationship between acoustics and perception
Looking exclusively at the data subset used by Pouplier & Goldstein (2005) in their perceptual
experiment (cf. section II.E), we found that errorful TC tokens differed from error-free /t/ tokens
both in terms of their acoustics and in terms of how they were perceived, while errorful /k/
tokens did not differ either acoustically or perceptually from error-free /k/ (Figure 6). For
acoustics, the proximity P measure was used, which quantifies relative proximity of a given
token to either /k/ or /t/ (described in section II.D). For perception, the d’ score from Pouplier &
Goldstein (2005) was used (described in section II.E). Independent samples t-tests showed that
errorful TC tokens were significantly different from error-free /t/ tokens on both the d’ score
measure (Welch’s t(9.363) = 3.145, p = 0.011), and on the acoustic measure (t(18)=4.053, p=
0.001). (TG tokens were not significantly different from error-free /t/, neither on the perceptual
measure (t(18) = 1.42, p= 0.173), nor on the acoustic measure, at alpha level 0.012 corrected for
multiple comparisons (t(18) = 2.284, p= 0.035)).6 Thus, the acoustic results match the
previously reported perceptual results when performed on the same data set (note that the same
acoustic pattern is observed for the larger dataset as well). The asymmetry observed in
perception is matched by an acoustic asymmetry, suggesting that the basis for the asymmetry
observed in perception was not due to a bias at perceptual level (a bias of the perceptual
system), but rather that the bias originated in the acoustic signal and hence the underlying
articulatory pattern.

24
[Insert FIGURE 6 about here]
D. Spectral characteristics of errorful /k/ and /t/
The results so far show that while co-production of an intruding tongue tip had a negligible
acoustic and perceptual influence on /k/, co-production of an intruding tongue dorsum with an
intended tongue tip for /t/ made these tokens more ambiguous acoustically and perceptually. The
question that arises in light of these results is how the characteristics of /k/ and /t/ spectra are
affected by a second intruding constriction so that errorful intended /t/ tokens become
acoustically ambiguous, while intended /k/ tokens remain acoustically unaffected. To address
this question, we looked at the acoustics of errorfree and errorful /k/ and /t/ between the burst
onset and vowel onset in cepstrally-smoothed running spectra (Figure 7), derived from the same
triplets of DCT coefficients that were used to compress the burst to a point in a nine-
dimensional space which had formed part of the acoustic classification and distance analyses
discussed above.
[Insert FIGURE 7 about here]
The main acoustic characteristic of a typical /k/ is a spectral peak at mid-frequency (maintained
over time) due to the long front cavity in front of the dorsal constriction, while a typical /t/ is
mainly characterized by high spectral energy at high frequency, due to the short cavity in front
of the constriction (cf. Blumstein & Stevens, 1979; Stevens, 1989; Stevens & Blumstein, 1978).
Figure 7 shows that while the mid-frequency energy for /k/ is not altered by an intruding coronal
constriction (that is, errorful /k/ spectra do not differ from error-free /k/), the high frequency
energy characteristic for /t/ is affected by an intruding dorsal constriction. More specifically, TC
(and to a lesser extent TG) spectra have less energy at high frequencies than error-free /t/.

25
However, since TC spectra have greater high-frequency energy than /k/ spectra, they are
spectrally neither quite like a /k/ nor a /t/: that is, they are acoustically ambiguous between the
error-free /k/ and /t/ stops. For a more detailed observation, we examined ensemble-averaged
spectra at the burst onset (Figure 8), i.e., the spectra at proportional time point zero in the
running spectral displays in Figure 7. The spectral shape at the burst onset was the same for both
errorful and error-free /k/ tokens, with a spectral energy peak at mid-frequency typical for /k/.
On the other hand, the spectral shape at the burst onset for errorful TC tokens differed from a
typical /t/ spectrum.7 The spectrum for TC (the continuous line in the left panel in Figure 8)
showed energy peaks both at mid-frequency (/k/-like) and at high frequency (/t/-like), albeit
both peaks were reduced in absolute amplitude compared to either typical /k/ or /t/. Crucially,
the energy of the high-frequency peak was considerably lowered so that the mid- and high-
frequency peaks were of roughly similar magnitudes, in contrast to the spectral shape for a
typical /t/ which has an energy peak at high frequencies, resulting in /t/’s characteristic rising
spectrum.
Qualitatively, the same general pattern was observed if the spectral shapes were analyzed
taking into account vowel context (Figure C in the Appendix). Error-free /k/ and /t/ were, not
unexpectedly, different as a function of vowel context: when followed by vowel /�/, the
amplitude at mid-frequency for /k/ and at high-frequency for /t/ was higher than in the /�/-vowel
context. However, the spectral shape for the errorful tokens was qualitatively similar to the
overall observed pattern: errorful /k/ tokens were not different from error-free /k/ in either vowel
context, while errorful /t/ tokens (TC in particular), differed from error-free /k/ and /t/ tokens in
both vowel contexts. In both /�/- and /�/-vowel contexts, TC tokens showed energy peaks of
26
comparable amplitudes at both mid- and high-frequencies, with high-frequency amplitudes
lower than those of error-free /t/ tokens.
Previous research (Blumstein & Stevens, 1980; Ohde & Stevens, 1983) has shown that
lowering the spectral energy at high frequency results in tokens less likely to be identified as /t/.
It is therefore plausible to suggest that the lower energy at high-frequency observed for our TC
tokens, combined with an almost equal energy peak at mid-frequency, is the factor responsible
for these tokens’ acoustic ambiguity both in our classification data, and in Pouplier &
Goldstein’s (2005) perceptual results. The spectral shape for TG was closer to that of T than was
TC (Figure 8): TG’s closer proximity to T also matched the classification and perceptual
analyses.
[Insert FIGURE 8 about here]
Therefore, intrusion of a second constriction affects the spectral properties of the burst
asymmetrically: whereas a tongue tip intrusion during the production of an intended /k/ has a
marginal effect on the spectrum, a tongue dorsum intrusion during an intended /t/ is
accompanied by a change in spectral shape. Recall that the intruding constrictions are weaker
than the intended ones, both spatially and temporally (cf. Pouplier, 2003, Pouplier & Waltl,
2008), so although both errorful /t/ and /k/ involve the same articulatory gestures, they differ in
terms of which gesture is stronger. As shown in Figures 7 and 8, the weaker coronal constriction
during intended /k/ does not affect the spectral shape of the burst. The weaker dorsal
constriction during intended /t/ on the other hand affects the spectrum by lowering the spectral
energy at high frequency enough to result in a qualitative change in spectral shape (from a rising
spectrum typical for /t/ to a flatter one, with comparable mid- and high-frequency peaks),
thereby making TC spectra ambiguous between a /k/ and a /t/. In this sense, it can be stated that

27
the intruding tongue dorsum during an intended /t/ has a qualitative effect on the spectrum,
whereas the effect of the intruding tongue tip is marginal.
E. Relationship between acoustics and articulatory timing
Recall that the articulatory measure used for classifying tokens into errorful or error-free was
maximal vertical position of the intended and intruding gestures (cf. section II.A). This measure
provides no insight into how the two gestures are timed relative to each other. Thus, while both
error /k/ and /t/ were produced with an intended and intruding gesture, these co-produced
gestures might have been timed differently for /t/ and /k/ tokens, and this timing difference may
be the cause of the observed acoustic asymmetry between error /k/ and /t/. If, for instance, TD
were always released last whether intended or intruding, this would lead to an asymmetry in
acoustics between /t/ and /k/, assuming that the gesture released last contributes relatively more
to the overall acoustic shape of the burst. For the timing measure, release lag from Pouplier &
Waltl’s (2008) analysis was used, as described in section II.E. For the classification pattern, we
used the results from the general classification analysis, as described in section III.A, pertaining
to the tokens for which the timing measure was available (50 KC, 41 KG, 28 TC, 34 TG).
Lag values between intended and intruding gestures at release are shown in Figure 9. In
general, median values indicate that most /k/-tokens had positive release lags, and most /t/-
tokens negative lags. This means that for both intended /k/ and /t/, constriction of the intended
gesture (TD and TT respectively) was released last. However, the interquartile range for TC
spans from negative to positive values, indicating a range from tokens with intended (TT)
gesture released last to tokens with intruding (TD) gesture released last. Given this distribution,
one may suspect that the asymmetry observed acoustically does not arise from the mere
presence of an intruding gesture during /t/ but rather from how these intruding gestures are

28
timed, in a way that is similar to the timing pattern observed for the opposite category. If many
of the errorful /t/ tokens show a timing pattern specific to /k/ (i.e., TD released last, possibly as a
result of TD being a slower articulator compared to TT), and these are specifically the tokens
classified as /k/, then the relative timing between intruding and intended gesture may have been
responsible for the acoustic asymmetry between intruded /k/ and /t/. To address this question,
we look at the tokens’ distribution as a function of both classification and timing pattern (Table
VI).
[Insert FIGURE 9 about here]
Overall, as shown in Table VI, intended /k/ and /t/ exhibit distinct timing patterns, with the
intended gesture (TD and TT respectively) being released last in a majority of the tokens,
confirming the result of Pouplier & Waltl (2008) for our subset of data. For errorful /k/, there
were only a couple of tokens for which the intruding gesture was released last, amounting to 2%
of the data. Taking the classification pattern into account, with the exception of one token, /k/
tokens classified acoustically as /t/ exhibited the same timing pattern as the majority of /k/
tokens, that is, a timing pattern with TD constriction released last. For /t/ tokens, the majority of
both TC (64%) and TG (82%) show a pattern with TT released last, and not the timing pattern
common for /k/ tokens (with TD released last). The classification pattern further shows that
more errorful /t/ tokens were classified as /k/ with a /t/-like timing pattern (TT released last) than
with a /k/-like timing pattern (TD released last), indicating that the classification of /t/ tokens as
/k/ is not due to a /k/-like timing pattern. Furthermore, in the case of TC, for tokens with the
same timing pattern (either TT or TD released last), half were classified as /k/ and half as /t/,
indicating that timing pattern is not a good predictor of classification pattern.
[Insert TABLE VI about here]

29
Additionally, if timing were responsible for the observed acoustic asymmetry between the effect
of an intruding gesture during /t/ vs. during /k/, we would expect different timing patterns to
result in different spectral shapes for the ambiguous category TC. Specifically, we have shown
that the spectral shapes of /t/ tokens with categorical intrusion error exhibit spectral properties of
both /t/ and /k/, while errorful /k/ spectra are entirely /k/-like in shape (cf. Figure 8). We have
also seen that of all errorful categories, TC has the most tokens in which intruding gesture is
released last (36%). If the gesture released last shapes the overall acoustic, it may be that the
shape observed for TC is an average between very /k/-like tokens, that is, tokens where TD is
released last (hence the mid-frequency peak energy), and very /t/-like tokens, that is, tokens with
TT released last (hence the high-frequency peak energy). If this is the case, we expect the
spectral shape for TC tokens with TD released last to look /k/-like, and the spectral shape for TC
tokens with TT released last to look /t/-like. Figure 10 shows the spectra of TC tokens with
either release pattern. While the timing pattern shows some effect on the spectral shape of the
TC tokens, overall the spectral shape for TC tokens is ambiguous between /t/ and /k/ for either
timing pattern. The spectra for tokens with TT released last differ from both /k/ and /t/ spectral
shapes by having both a mid-frequency and a high-frequency energy peak. The spectra of tokens
with TD released last look a bit more /k/-like in that the mid-frequency peak is more prominent;
however, unlike /k/, this spectrum still includes an energy peak at high-frequency (roughly equal
to the mid-frequency peak), absent from /k/ tokens. For both timing patterns, the energy peak at
high-frequency is lower for TC tokens than for error-free /t/, and higher than for error-free /k/
tokens. The overall characteristic spectral shape of TC tokens can therefore not be (exclusively)
due to the relative timing between the two gestures, but is instead due to the overall effect that a
tongue dorsum constriction has on the energy of the spectrum at both mid and high-frequencies.
30
[Insert FIGURE 10 about here]
IV. DISCUSSION AND CONCLUSION
Overall, the classification analysis has shown that an intruding tongue dorsum constriction with
a /k/-like amplitude (i.e., TC tokens) results in /k/-like acoustics in about half of the intended /t/
tokens. On the other hand, intruding tongue tip constrictions during /k/, even when in the range
of intended /t/ in terms of articulator height (KC tokens), result in /t/-like acoustics in only about
11% of the tokens. It has also been shown that the relative timing between intended and
intruding gesture cannot explain this asymmetry: instead, the difference is due to different
acoustic consequences of an intruding TT vs. TD constriction. Overall, the presence of a TD
constriction, whether intended or intruding, is likely to result in a /k/ classification for any given
token, due to the mid-frequency spectral energy peak and the lower high frequency energies
caused by a dorsal constriction. This implies that TD will affect the acoustics even when it is co-
produced with a TT constriction with amplitudes in the range for an intended /t/, as is the case
for KC and TC tokens. While KC was predominantly classified as /k/ by the SVM algorithm,
the TC tokens were classified at chance level as either /t/ or /k/. The probability distribution of
the classification algorithm (cf. Figure 6) revealed that many of the TC tokens were ambiguous
between /k/ and /t/. In line with these results, the spectral analysis suggested that the ambiguity
in the case of TC tokens was due to the characteristic shape of these tokens, showing both a
mid-frequency energy peak (/k/-like) and a high-energy peak (/t/-like), although both these
peaks were notably lower than those of error-free /k/ and /t/. For an intruding TT constriction, a
different result became apparent: very few tokens with an intruding TT constriction were
ambiguous between /t/ and /k/ in terms of their classification probabilities. The spectral shape of
these tokens was indistinguishable from that of tokens produced without a tongue tip intrusion.

31
The acoustic cues for /k/ and /t/ are differently affected by the type of articulatory
variability analyzed here. On the one hand, we observed relatively robust mid-frequency
spectral energy in dorsal stops, demonstrated by the lack of difference in spectral shape between
errorful and error-free /k/ tokens. By contrast the high-frequency spectral energy that is a major
cue for coronal stops was much more variable, as shown by the quantitative and qualitative
differences in the spectrum of errorful vs. error-free /t/ tokens. Our finding shows, contra the
prediction by Winitz et al. (1972), that articulatory variability of the type discussed here
“smears” particularly the high-frequency energy of /t/ bursts, while it leaves mid-frequency
energy, and hence /k/ bursts, unaffected. However, the effect is not uniform across our data:
recall that the asymmetry between /t/ and /k/ only became evident for the categorical errors, not
for the gradient ones. This means that articulator height is one of the main factors conditioning
the results: this is because the intruding gesture had to be of a certain magnitude in order to
affect sufficiently the acoustic classification results. However, for categorical errors, the
asymmetric acoustic pattern for /t/ and /k/ showed that articulator height alone is insufficient to
predict the results: unlike for the gradient errors, the location of the constriction becomes
relevant. That is, if two “categorical” constrictions (one intended, one errorful) are present in the
vocal tract during the same time interval, it is the constriction more posterior in the vocal tract
that will dominate the acoustics. Surprisingly, this effect is observed irrespective of the timing
of the release of the constrictions and irrespective of which one of the two constrictions was
intended or intruding.
Our results suggest that the perceptual asymmetry observed by Pouplier & Goldstein
(2005) is matched by an acoustic asymmetry between the robustness of dorsal stops but
vulnerability of coronal stops to articulatory variability. This finding also suggests that coronals’
32
perceptual vulnerability in the context of articulatory variability observed elsewhere (in
consonant clusters for example, cf. Byrd, 1992; Chen, 2003; Kochetov & So, 2007) is likely the
result of their acoustic sensitivity to articulatory variability, rather than the result of a bias
exclusively at the perceptual/auditory level. The results make predictions about when
articulatory variability of the type described here is more likely to be perceived, possibly as a
speech error. If, as suggested by the analyses reported in this paper, co-productions of an
intruding TD constriction on an intended TT constriction for /t/ have more robust acoustic
consequences than co-productions of intruding TT with an intended TD for /k/, then the
expectation is that on the basis of acoustic information alone more variability, and hence more
potential errors, during /t/ can be detected than errors during /k/. This may explain why for
instance /t/ substitution by /k/ is reported more frequently than /k/ substitution by /t/ in studies
that rely on auditory perception for error detection (Stemberger, 1991) (note that at least some of
these transcribed ‘substitutions’ may actually be co-production errors, cf. Boucher, 1994, Wood
1997). Our acoustic results suggest that rather than reflecting an error distribution pattern, the
observed asymmetries between /t/ and /k/ in transcribed speech corpora (Stemberger 1991), and
in error perception (Pouplier & Goldstein 2005) have their basis at the acoustic level. Both
errorful /t/ and /k/ are equally distributed at the articulatory level – intruding gestures are as
likely during intended /t/ and /k/. However, since errors during intended /t/ are more reliably
cued acoustically, they are bound to be more readily detected auditorily. On the other hand, if
errors during intended /k/ are not reflected in the tokens’ acoustics, errorful /k/ productions are
much more likely to be missed and therefore to be underrepresented in transcriptions. The
theoretical implication is that if the transcription asymmetry does not reflect a production
asymmetry, but is instead explained by asymmetric acoustic consequences of intruding gestures

33
at different constriction locations, then no theoretical apparatus (such as for example coronal
underspecification, cf. Stemberger, 1991) is needed to account for the /k/-/t/ asymmetry in
speech errors.
To summarize, the results presented in this paper showed that not all intruding gestures
have detectable acoustic consequences. Thus, while an intruding tongue dorsum during /t/
results in tokens acoustically different from error-free /t/, an intruding tongue tip during /k/ often
has no acoustic consequences, that is, these tokens overall remain similar to error-free /k/. The
observed acoustic pattern is also similar to results from a previous perceptual experiment, and it
explains those results as being grounded in acoustics. While /k/ tokens are more robust
acoustically to co-production of both intended and intruding gestures, /t/ tokens are sensitive
acoustically and perceptually to the presence of a TD intruding gesture. The examination of the
timing pattern of the intruding gesture relative to the intended gesture showed that the timing
pattern could not explain on its own the acoustic properties of the tokens. Rather the amplitude
of the intruding gesture seems to determine the acoustic pattern, and specifically, the amplitude
of TD seems to have an influence on acoustics regardless of whether it is an intended or
intruding gesture.
The study also contributes to the general knowledge on the acoustics of /k/ and /t/. There
is ample evidence that /k/ and /t/ are robustly discriminable on the basis of their acoustic
properties (Blumstein & Stevens, 1979; Fant, 1960; Halle et al., 1957; Jakobson et al., 1963;
Kewley-Port, 1983; Stevens, 1989; Stevens & Blumstein, 1978), and also that the acoustic
properties of /k/ and /t/ show different degrees of sensitivity to vowel context: /t/ is more robust
than /k/ to vowel coarticulation, as shown by the well-known context-dependent variation of
velars (cf. Halle et al., 1957��and by the greater convergence of alveolars to a common locus

34
frequency, even when the following vowel context varies (cf. for example Kewley-Port, 1982;
Lehiste & Peterson, 1961; Lindblom, 1963; Sussman, McCaffrey, & Matthews, 1991). The
results presented here likewise suggest that the acoustic properties of /k/ and /t/ are differently
affected by the type of articulatory variation documented here, namely co-production of an
intruding constriction along with the intended one (in a very general sense, this co-production
could be viewed as coarticulation with another consonant). However, in contrast to vowel
coarticulation, in the case of co-productions the acoustics of /k/ are more robust to this type of
articulatory variation, compared to the acoustics of /t/. These two patterns of results may seem
surprising at first sight but are actually quite consistent with each other when considering that
vowel coarticulation influences low-frequency energy, leaving the salient high-frequency energy
for /t/ unaffected, but shifting the mid-frequency peak for /k/. In the case of co-productions, an
intruding tongue dorsum constriction has a noticeable impact on the high-frequency energy for
/t/, while an intruding tongue tip leaves the mid-frequency peak for /k/ unaffected.�The results of
our study have more general implications for the reliability of acoustic information in detecting
articulatory variations during production of /k/ and /t/, and contribute to our knowledge about
the relationship between different types of articulatory variability and acoustics.
ACKNOWLEDGEMENTS
Work funded by German Research Council grant (PO 1269/1-1) and NIH (RO1DC008780-01).
The authors thank Aleksandra Bigaji, Sophie Sedlmaier, and Susanne Waltl for help with data
analysis, and Louis Goldstein, Tine Mooshammer, Elliot Saltzman, and Mark Tiede for helpful
discussions.
35
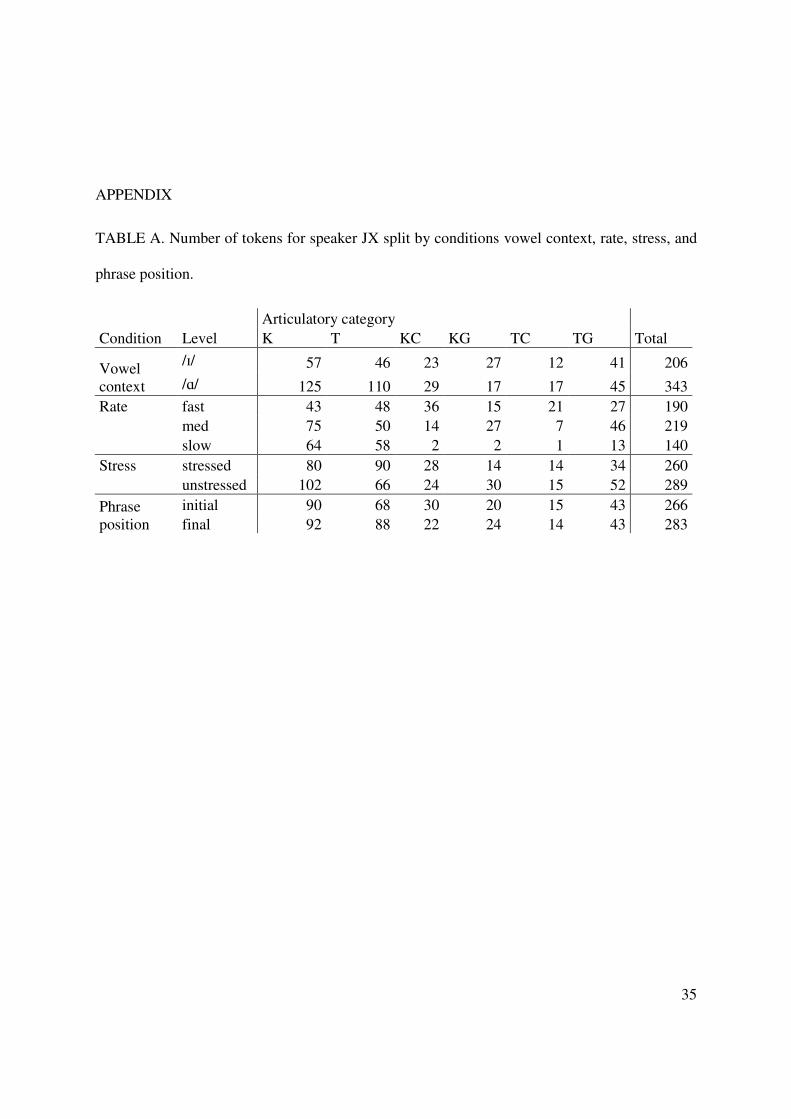
APPENDIX
TABLE A. Number of tokens for speaker JX split by conditions vowel context, rate, stress, and
phrase position.
Articulatory category Condition Level K T KC KG TC TG Total
Vowel context
/�/ 57 46 23 27 12 41 206 /�/ 125 110 29 17 17 45 343
Rate fast 43 48 36 15 21 27 190 med 75 50 14 27 7 46 219 slow 64 58 2 2 1 13 140 Stress stressed 80 90 28 14 14 34 260 unstressed 102 66 24 30 15 52 289 Phrase position
initial 90 68 30 20 15 43 266 final 92 88 22 24 14 43 283

36
TABLE B. Classification scores (%) for speaker JX, split by conditions vowel context, rate,
stress, and phrase position. The numbers represent rounded percentages of tokens classified as
/k/. Because for the slow rate there were very few tokens for some of the errorful categories, the
classification pattern for the slow rate was not included.
Articulatory category Condition Level K T KC KG TC TG
Vowel context
/�/ 86 13 87 89 58 15 /�/ 91 15 79 88 47 38
Rate fast 93 15 83 93 57 41 medium 89 18 79 89 43 22 Stress stressed 86 11 89 93 57 41 unstressed 92 20 75 87 47 17 Phrase position
initial 89 21 90 95 47 26 final 89 10 77 83 57 28

37
[Insert FIGURE A (Figure 11)]
FIGURE A
Boxplots showing the median (thick horizontal bar), interquartile range (boxes), error bars
(vertical lines) and outliers (circles) for the acoustic measure P, the token proximity to /k/
(negative values) or /t/ (positive values), split by conditions vowel context (a), rate (b), stress
(c), and phrase position (d). Because for the slow rate there were very few tokens for some of
the errorful categories, the slow rate was not included in this by-rate analysis.
[Insert FIGURE B (Figure 12)]
FIGURE B (color online)
Ensemble-averaged spectra of error-free and errorful /k/ and /t/, smoothed using three DCT
coefficients. Thin lines show the spectral shape at burst onset, thick lines show spectral shape at
25% (top), 50% (upper middle), 75% (lower middle) and vowel onset (bottom).
[Insert FIGURE C (Figure 13)]
FIGURE C (color online)
Ensemble-averaged spectra of error-free and errorful /k/ and /t/ by vowel context, smoothed
using three DCT coefficients. The figures show spectral shape at burst onset. Pictured on the left
are spectra of tokens produced in the /�/-vowel context, and on the right are spectra of tokens
produced in the /�/-vowel context. At all time-points, TC spectral shape is different from T
spectral shape, except at vowel onset, where /t/ and /k/ spectra are similar in shape, reflecting
the properties of the vowel.

38
39
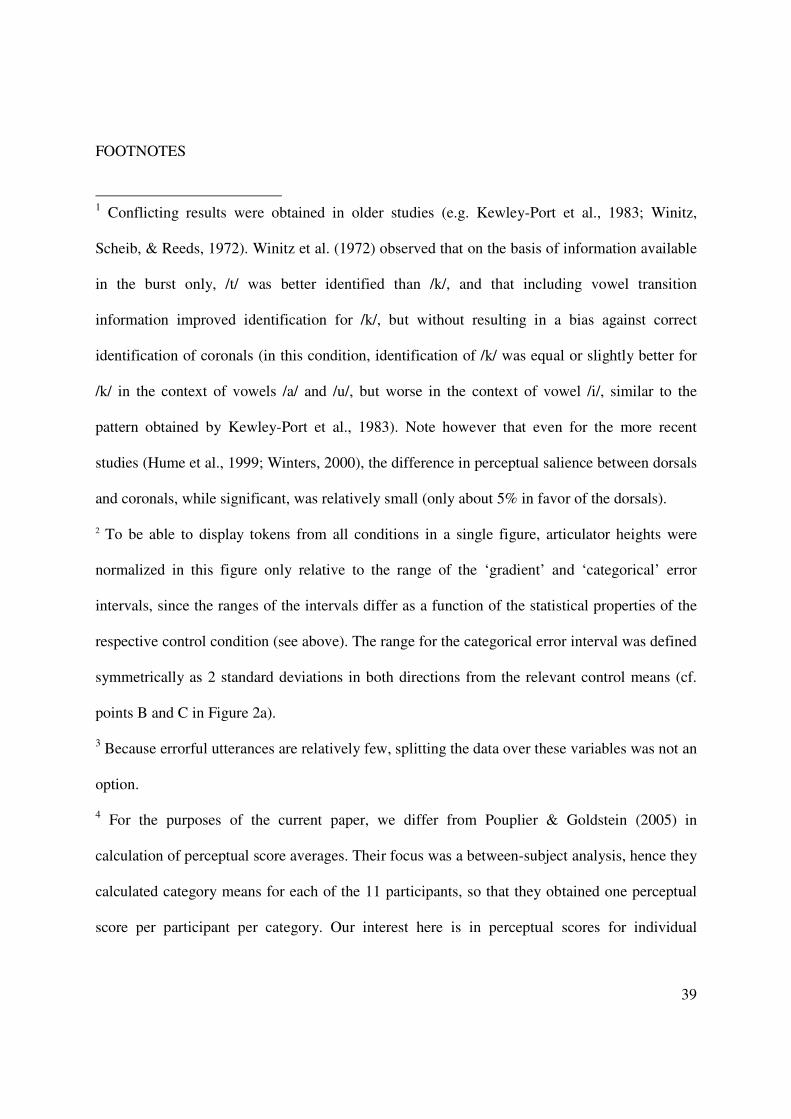
FOOTNOTES
1 Conflicting results were obtained in older studies (e.g. Kewley-Port et al., 1983; Winitz,
Scheib, & Reeds, 1972). Winitz et al. (1972) observed that on the basis of information available
in the burst only, /t/ was better identified than /k/, and that including vowel transition
information improved identification for /k/, but without resulting in a bias against correct
identification of coronals (in this condition, identification of /k/ was equal or slightly better for
/k/ in the context of vowels /a/ and /u/, but worse in the context of vowel /i/, similar to the
pattern obtained by Kewley-Port et al., 1983). Note however that even for the more recent
studies (Hume et al., 1999; Winters, 2000), the difference in perceptual salience between dorsals
and coronals, while significant, was relatively small (only about 5% in favor of the dorsals).
2 To be able to display tokens from all conditions in a single figure, articulator heights were
normalized in this figure only relative to the range of the ‘gradient’ and ‘categorical’ error
intervals, since the ranges of the intervals differ as a function of the statistical properties of the
respective control condition (see above). The range for the categorical error interval was defined
symmetrically as 2 standard deviations in both directions from the relevant control means (cf.
points B and C in Figure 2a).
3 Because errorful utterances are relatively few, splitting the data over these variables was not an
option.
4 For the purposes of the current paper, we differ from Pouplier & Goldstein (2005) in
calculation of perceptual score averages. Their focus was a between-subject analysis, hence they
calculated category means for each of the 11 participants, so that they obtained one perceptual
score per participant per category. Our interest here is in perceptual scores for individual

40
utterances, so we averaged for each token across participants’ perceptual response, obtaining
one d’ perceptual score per individual token.
5 Pouplier & Waltl (2008) included additional gestural landmarks in their analysis. However, we
only refer to relative timing at release since the articulatory configuration at this point is
presumably the one most relevant in shaping the acoustic signal.
6 The perceptual responses on /t/ tokens with gradient intrusion error (TG) were significantly
different from error-free /t/ in the between-subject analysis reported by Pouplier & Goldstein
(2005); in our between-token analysis, however, the difference between T and TG was at trend
level.
7 The difference in spectrum shape between /t/ tokens with categorical errors and error-free /t/ is
maintained for 75% of the burst, as illustrated in the Appendix, Figure B.

REFERENCES
Baayen, R. (2008). Analyzing Linguistic Data: A Practical Introduction to Statistics Using R.
Cambridge UK, New York: Cambridge University Press.
Bennett, K., & Campbell, C. (2000). Support vector machines: Hype or hallelujah? SIGKDD
Explorations, 2.
Blumstein, S., & Stevens, K. N. (1979). Acoustic invariance in speech production: Evidence
from measurements of the spectral characteristics of stops. Journal of the Acoustical
Society of America, 66, 1001-1017.
Blumstein, S., & Stevens, K. N. (1980). Perceptual invariance and onset spectra for stop
consonants in different vowel environments. Journal of the Acoustical Society of
America, 67, 648-662.
Boersma, P., & Weenink, D. (n.d.). Praat: doing phonetics by computer. Retrieved from
http://www.praat.org/ (date last viewed 3/30/09).
Boucher, V. J. (1994). Alphabet-related biases in psycholinguistic enquiries: considerations for
direct theories of speech production and perception. Journal of Phonetics, 22(1), 1-18.
Byrd, D. (1992). Perception of assimilation in consonant clusters: A gestural model. Phonetica,
49, 1-24.
Cassidy, S., & Harrington, J. (2001). Multi-level annotation in the Emu speech database
management system. Speech Communication, 33, 61-77.
Chen, L. (2003). The origins in overlap of place assimilation. In WCCFL 22. Proceedings of the
XXIIth West Coast Conference on Formal Linguistics. Somerville, Massachusetts:
Cascadilla Press.

42
Clarkson, P., & Moreno, P. J. (2000). On the use of Support Vector Machines for phonetic
classification. In Proceedings of the International Conference on Acoustics, Speech and
Signal Processing, vol. 2 (pp. 585-588).
Cortes, C., & Vapnik, V. (1995). Support-vector network. Machine Learning, (20), 1-15.
Dell, G. (1986). A spreading-activation theory of retrieval in sentence production. Psychological
Review, 93, 283-321.
Duda, R. O., Hart, P. E., & Stork, D. G. (2000). Pattern Classification (2nd ed.). New York:�
Wiley-Interscience.
Fant, G. (1960). Acoustic Theory of Speech Production. The Hague:�Mouton De Gruyter.
Forrest, K., Weismer, G., Milenkovic, P., & Dougall, R. N. (1988). Statistical analysis of word-
initial voiceless obstruents: Preliminary data. Journal of the Acoustical Society of
America, 84, 115-123.
Frisch, S., & Wright, R. (2002). The phonetics of phonological speech errors: An acoustic
analysis of slips of the tongue. Journal of Phonetics, 30, 139-162.
Fromkin, V. A. (1971). The non-anomalous nature of anomalous utterances. Language, 47, 27-
52.
Fromkin, V. A. (1973). Speech errors as linguistic evidence. The Hague: Mouton De Gruyter.
Goldrick, M., & Blumstein, S. (2006). Cascading activation from phonological planning to
articulatory processes: Evidence from tongue twisters. Language and Cognitive
processes, 21, 649-683.
Goldstein, L., Pouplier, M., Chen, L., & Byrd, D. (2007). Gestural action units slip in speech
production errors. Cognition, 103(3), 386-412.
43
Halle, M., Hughes, W., & Radley, J. (1957). Acoustic properties of stop consonants. Journal of
the Acoustical Society of America, 29, 107-116.
Harrington, J., Kleber, F., & Reubold, U. (2008). Compensation for coarticulation, /u/-fronting,
and sound change in standard southern British: An acoustic and perceptual study.
Journal of the Acoustical Society of America, 123, 2825–2835.
Hume, E., Johnson, K., Seo, M., Tserdanelis, G., & Winters, S. (1999). A cross-linguistic study
of stop place perception. In Proceedings of the XIVth International Congress of Phonetic
Sciences, San Francisco, USA (pp. 2069-2072).
Jakobson, R., Fant, G., & Halle, M. (1963). Preliminaries to speech analysis. Cambridge
Massachusetts: MIT Press.
Kewley-Port, D. (1982). Measurement of formant transitions in naturally produced stop
consonant-vowel syllables. Journal of the Acoustical Society of America, 72, 379-389.
Kewley-Port, D. (1983). Time-varying features as correlates of place of articulation in stop
consonants. Journal of the Acoustical Society of America, 73, 322-335.
Kewley-Port, D., & Luce, P. A. (1984). Time-varying features of initial stop consonants in
auditory running spectra: A first report. Perception & Psychophysics, 35, 353-360.
Kewley-Port, D., Pisoni, D. B., & Studdert-Kennedy, M. (1983). Perception of static and
dynamic acoustic cues to place of articulation in initial stop consonants. Journal of the
Acoustical Society of America, 73, 1779-1793.
Kochetov, A., & So, C. K. (2007). Place assimilation and phonetic grounding: a cross-linguistic
perceptual study. Phonology, 24, 397–432.
Lehiste, I., & Peterson, G. E. (1961). Transitions, glides and diphthongs. Journal of the
Acoustical Society of America, 33, 268-277.
44
Levelt, W. J. M. (1989). Speaking. From Intention to Articulation. Cambridge, MA: MIT Press.
Levelt, W. J. M., Roelofs, A., & Meyer, A. S. (1999). A theory of lexical access in speech
production. Behavioral and Brain Sciences, 22, 1-75.
Lindblom, B. (1963). On vowel reduction. Report No. 29, Stockholm, Sweden: The Royal
Institute of Technology, Speech Transmission Laboratory.
MacMillan, N. A., & Creelman, C. D. (1991). Detection theory. A user's guide. Cambridge:
Cambridge University Press.
Mayer, D. (2001). Support vector machines. R News, 1(3), 23-26.
McMillan, C., Corley, M., & Lickley, R. (2009). Articulatory evidence for feedback and
competition in speech production. Language and Cognitive Processes, 24(1), 44-66.
Mowrey, R., & MacKay, I. (1990). Phonological primitives: Electromyographic speech error
evidence. Journal of the Acoustical Society of America, 88, 1299-1312.
Nossair, Z., & Zahorian, S. (1991). Dynamical spectral features as acoustic correlates for initial
stop consonants. Journal of the Acoustical Society of America, 89(6), 2978-2991.
Ohde, R. N., & Stevens, K. N. (1983). Effect of burst amplitude on the perception of stop
consonant place of articulation. Journal of the Acoustical Society of America, 74, 706-
714.
Perkell, J., Cohen, M., Svirsky, M., Matthies, M., Garabieta, I., & Jackson, M. (1992).
Electromagnetic midsagittalarticulometer (EMMA) systems for transducing speech
articulatory movements. Journal of the Acoustical Society of America, 92, 3078-3096.
Pouplier, M. (2003). Units of phonological encoding: Empirical evidence. Ph.D Dissertation,
Yale University.

45
Pouplier, M. (2007). Tongue kinematics during utterances elicited with the SLIP technique.
Language and Speech, 50(3), 311-341.
Pouplier, M. (2008). The role of a coda consonant as error trigger in repetition tasks. Journal of
Phonetics, 36, 114-140.
Pouplier, M., & Waltl, S. (2008). Articulatory timing of coproduced gestures and its
implications for models of speech production. Proceedings of the 8th International
Seminar on Speech Production (pp. 19-22).
Pouplier, M., & Goldstein, L. (2005). Asymmetries in the perception of speech production
errors. Journal of Phonetics, 33, 47-75.
Rapp, B. & Goldrick, M. (2000). Discreteness and interactivity in spoken word production.
Psychological Review, 107, 460-499.
Shattuck-Hufnagel, S. (1979). Speech errors as evidence for a serial-ordering mechanism in
sentence production. In Sentence processing: psycholinguistic studies presented to
Merrill Garrett (pp. 295-342). Hillsdale, NJ: Lawrence Erlbaum.
Shattuck-Hufnagel, S. (1983). Sublexical units and suprasegmental structure in speech
production planning. In The production of speech (pp. 109-136). New York: Springer.
Smits, R., ten Bosch, L., & Collier, R. (1996). Evaluation of various sets of acoustic cues for the
perception of prevocalic stop consonants. I. Perception experiment. Journal of the
Acoustical Society of America, 100, 3852-3864.
Stemberger, J. P. (1991). Apparent anti-frequency effects in language production: The addition
bias and phonological underspecification. Journal of Memory and Language, 30, 161-
185.

46
Stevens, K. N. (1972). The quantal nature of speech: Evidence from articulatory-acoustic data.
In Human Communication: A Unified View (pp. 51-66). New York: McGraw-Hill.
Stevens, K. N. (1989). On the quantal nature of speech. Journal of Phonetics, 17, 3-45.
Stevens, K. N., & Blumstein, S. (1978). Invariant cues for place of articulation in stop
consonants. Journal of the Acoustical Society of America, 64, 1358-1368.
Surprenant, A. M., & Goldstein, L. (1998). The perception of speech gestures. Journal of the
Acoustical Society of America, 104, 518-529.
Sussman, H. M., McCaffrey, H. A., & Matthews, S. A. (1991). An investigation of locus
equations as a source of relational invariance for stop place categorization. Journal of the
Acoustical Society of America, 90, 1309-1325.
Toothaker, L. E. (1993). Multiple Comparison Procedures. Thousand Oaks, CA: Sage
Publications.
Traunmüller, H. (1990). Analytical expressions for the tonotopic sensory scale. Journal of the
Acoustical Society of America, 88, 97-100.
Watson, C. I., & Harrington, J. (1999). Acoustic evidence for dynamic formant trajectories in
Australian English Vowels. Journal of the Acoustical Society of America, 106, 458-468.
Winitz, H., Scheib, M. E., & Reeds, J. A. (1972). Identification of stops and vowels for the burst
portion of /p, t, k/ isolated from conversational speech. Journal of the Acoustical Society
of America, 51, 1309–1317.
Winters, S. (2000). Turning phonology inside out: testing the relevant salience of audio and
visual cues for place of articulation. In Ohio State Working Papers in Linguistics (pp.
168-199).

TABLE I. Number of tokens from alternating trials produced by seven subjects.
Articulatory category
K T KC KG TC TG Total
Number of tokens 873 733 125 186 105 282 2304
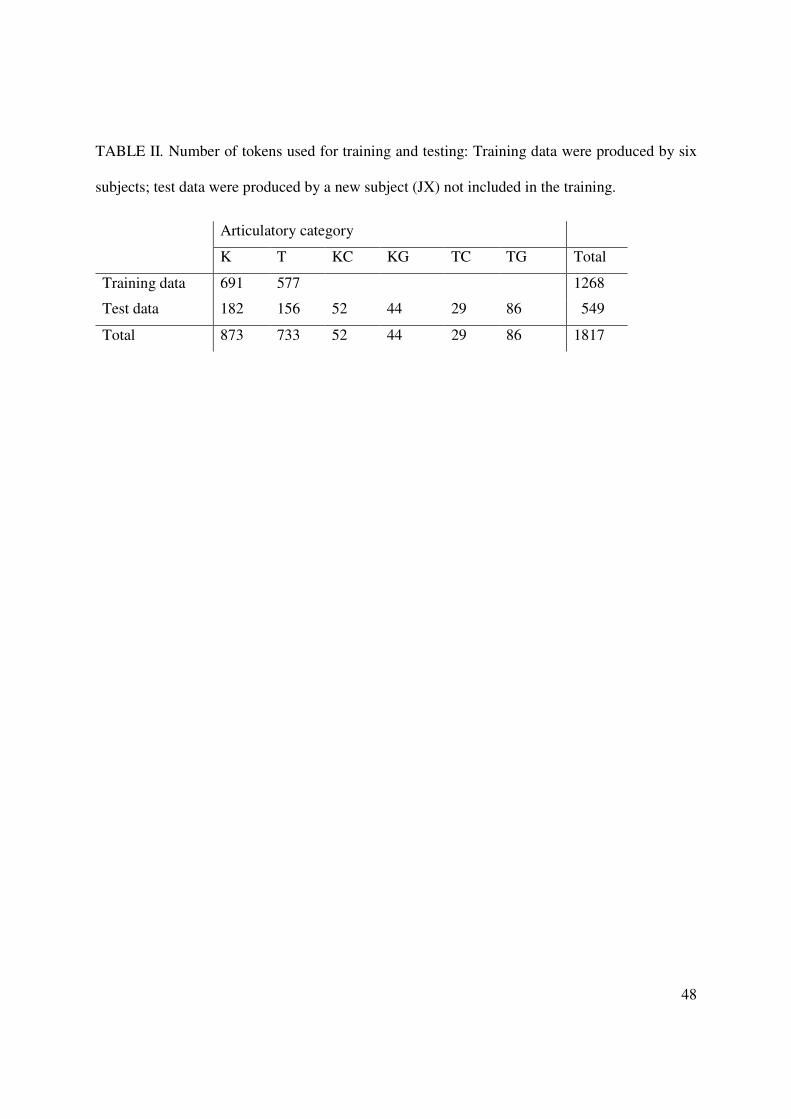
48
TABLE II. Number of tokens used for training and testing: Training data were produced by six
subjects; test data were produced by a new subject (JX) not included in the training.
Articulatory category
K T KC KG TC TG Total
Training data 691 577 1268
Test data 182 156 52 44 29 86 549
Total 873 733 52 44 29 86 1817

49
TABLE III. Classification (%) from an SVM closed test in which training and testing were
carried out on error-free K and T produced by all six subjects. The main diagonal shows the hit-
rate per category. All percentages have been rounded.
Closed test
Articulatory category
K T
Classified as /k/ 95 5
Classified as /t/ 11 89

50
TABLE IV. Classification (%) in a semi-open SVM test using 4-fold cross validation. The
training data were randomly split into four subsets and each time three subsets were used for
training and the fourth was used for testing. All percentages have been rounded.
Semi-open test (4-fold cross-validation)
Total accuracy 89
Single Accuracies 91 84 91 91

51
TABLE V. Classification (%) in an open SVM test. The training data included the error-free T
and K bursts from 6 subjects and testing was carried out on all of subject JX's stops. All
percentages have been rounded.
Articulatory category
K T KC KG TC TG
Classified as /k/ 90 15 83 89 52 27
Classified as /t/ 10 85 17 11 48 73
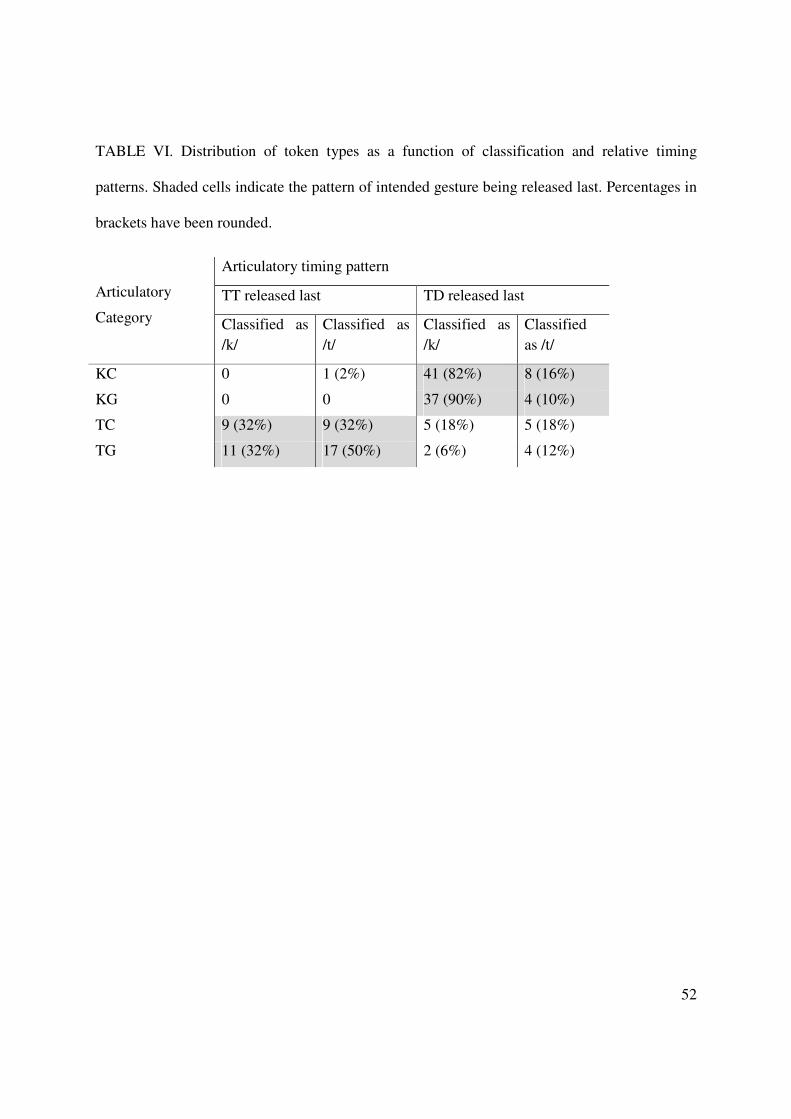
52
TABLE VI. Distribution of token types as a function of classification and relative timing
patterns. Shaded cells indicate the pattern of intended gesture being released last. Percentages in
brackets have been rounded.
Articulatory
Category
Articulatory timing pattern
TT released last TD released last
Classified as /k/
Classified as /t/
Classified as /k/
Classified as /t/
KC 0 1 (2%) 41 (82%) 8 (16%)
KG 0 0 37 (90%) 4 (10%)
TC 9 (32%) 9 (32%) 5 (18%) 5 (18%)
TG 11 (32%) 17 (50%) 2 (6%) 4 (12%)

53
FIGURE 1
Example articulatory measurements for /t/ in “top”, illustrated on the basis of two “cop top”
repetitions produced by subject JX at the fast speaking rate. The panels show vertical position
(mm) and vertical velocity (cm/s) profiles of the Tongue Tip and Tongue Dorsum sensors.
Identified on the figures are maximum velocity points (MAX) during movement towards the
constriction (Peak 1) and away from the constriction (Peak 2), as well as the constriction
maxima and releases. (a) Production of “top” for which both tongue tip and tongue dorsum
movement showed a constriction. Temporal lag between the release of the tongue tip and the
release of the tongue dorsum constriction is indicated by the arrow. (b) Production of “top”
showing a tongue tip constriction only. For such tokens, tongue dorsum height was extracted at
the time of tongue tip maximum. No temporal lag between release of tongue tip and tongue
dorsum could be calculated for such tokens.
FIGURE 2 (color online)
(a) Schematized cut-off points for gradient and categorical errors, determined on the basis of the
distributions of articulator height during /k/ and /t/ production in control (non-alternating)
utterances. The gradient error interval is defined by the cut-off points labeled with A and B; the
categorical error interval is defined by the cut-off points labeled with B and C. (b) Histograms
showing the distribution of normalized articulator heights for errorful tokens within the
respective category ranges (between cut-off points A and B for gradient errors, and between B
and C for categorical errors). Plotted are tokens from speaker JX.
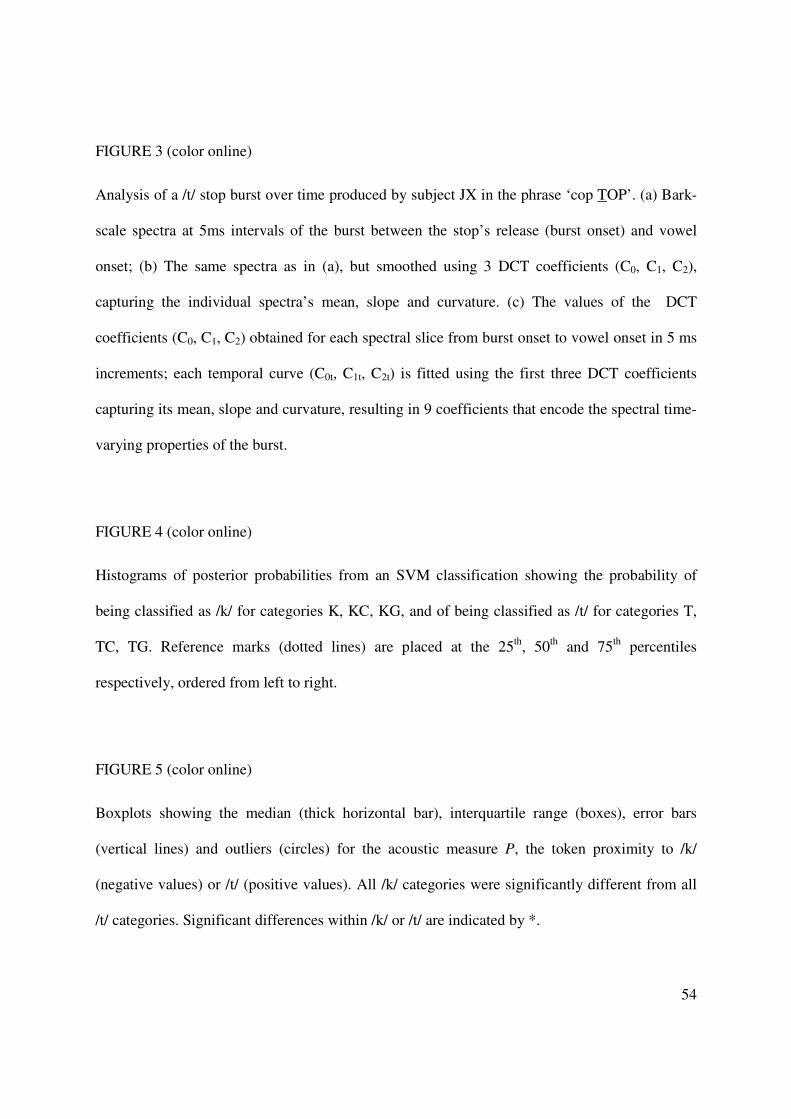
54
FIGURE 3 (color online)
Analysis of a /t/ stop burst over time produced by subject JX in the phrase ‘cop TOP’. (a) Bark-
scale spectra at 5ms intervals of the burst between the stop’s release (burst onset) and vowel
onset; (b) The same spectra as in (a), but smoothed using 3 DCT coefficients (C0, C1, C2),
capturing the individual spectra’s mean, slope and curvature. (c) The values of the DCT
coefficients (C0, C1, C2) obtained for each spectral slice from burst onset to vowel onset in 5 ms
increments; each temporal curve (C0t, C1t, C2t) is fitted using the first three DCT coefficients
capturing its mean, slope and curvature, resulting in 9 coefficients that encode the spectral time-
varying properties of the burst.
FIGURE 4 (color online)
Histograms of posterior probabilities from an SVM classification showing the probability of
being classified as /k/ for categories K, KC, KG, and of being classified as /t/ for categories T,
TC, TG. Reference marks (dotted lines) are placed at the 25th, 50th and 75th percentiles
respectively, ordered from left to right.
FIGURE 5 (color online)
Boxplots showing the median (thick horizontal bar), interquartile range (boxes), error bars
(vertical lines) and outliers (circles) for the acoustic measure P, the token proximity to /k/
(negative values) or /t/ (positive values). All /k/ categories were significantly different from all
/t/ categories. Significant differences within /k/ or /t/ are indicated by *.

55
FIGURE 6 (color online)
Boxplots showing the median (horizontal bar), interquartile range (boxes), error bars (vertical
lines) and outliers (circles) for perceptual d’ score (left panel) and acoustic measure P (right
panel). Significant differences are indicated by *. Total number of tokens across categories for
the data subset is N=60. Perceptual d’ scores (left) range from +4.65 representing maximum
consistent correct identification to -4.65 representing consistent incorrect identification.
Acoustic proximity indices range from close to /t/ (positive values) to close to /k/ (negative
values).
FIGURE 7 (color online)
Ensemble-averaged, linearly time-normalized spectra of errorfree and errorful /k/ and /t/. Time
points are proportional, proceeding in 25% increments from burst onset (release) to vowel onset.
The spectra were smoothed using the first three DCT coefficients. The figures show information
equivalent to the coefficients used for classification and acoustic distance calculation.
FIGURE 8 (color online)
Ensemble-averaged spectra of error-free and errorful /k/ and /t/, at burst onset smoothed using
three DCT coefficients. Arrows indicate spectral energy peaks for spectra of error-free /t/ and
/k/, and for /t/ produced with an intruding tongue dorsum of categorical magnitude (TC).
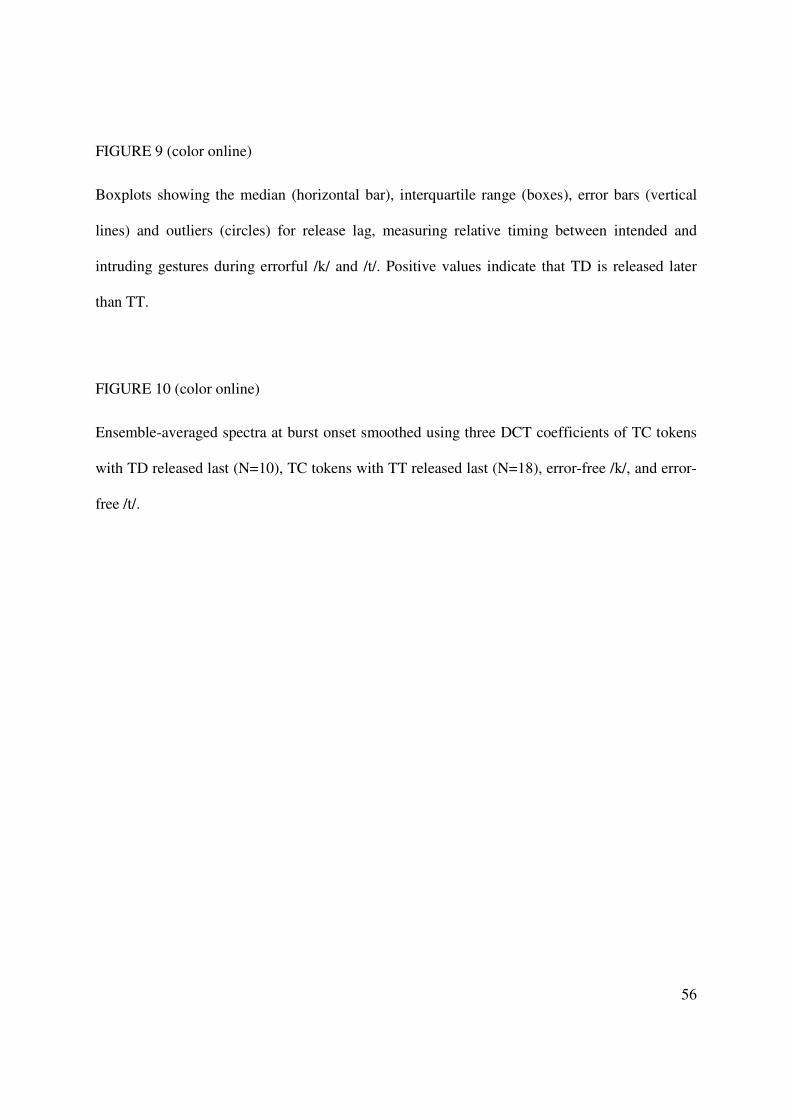
56
FIGURE 9 (color online)
Boxplots showing the median (horizontal bar), interquartile range (boxes), error bars (vertical
lines) and outliers (circles) for release lag, measuring relative timing between intended and
intruding gestures during errorful /k/ and /t/. Positive values indicate that TD is released later
than TT.
FIGURE 10 (color online)
Ensemble-averaged spectra at burst onset smoothed using three DCT coefficients of TC tokens
with TD released last (N=10), TC tokens with TT released last (N=18), error-free /k/, and error-
free /t/.

FIGURE 1. Example articulatory measurements for /t/ in “top”, illustrated on the basis of two “cop top” repetitions produced by subject JX at the fast speaking rate. The panels show vertical position (mm) and vertical velocity (cm/s) profiles of the Tongue Tip and Tongue Dorsum sensors. Identified on the figures are maximum velocity points (MAX) during movement towards the constriction (Peak 1) and away from the constriction (Peak 2), as well as the constriction maxima and releases. (a) Production of “top” for which both tongue tip and tongue dorsum movement showed a constriction. Temporal lag between the release of the tongue tip and the release of the tongue dorsum constriction is indicated by the arrow. (b) Production of “top” showing a tongue tip constriction only. For such tokens, tongue dorsum height was extracted at the time of tongue tip maximum. No temporal lag between release of tongue tip and tongue dorsum could be calculated for such tokens.

FIGURE 2. (a) Schematized cut-off points for gradient and categorical errors, determined on the basis of the distributions of articulator height during /k/ and /t/ production in control (non-alternating) utterances. The gradient error interval is defined by the cut-off points labeled with A and B; the categorical error interval is defined by the cut-off points labeled with B and C. (b) Histograms showing the distribution of articulator heights for errorful tokens within the respective category ranges (between cut-off points A and B for gradient errors, and between B and C for categorical errors). Plotted are tokens from speaker JX.

FIGURE 3. Analysis of a /t/ stop burst over time; example produced by subject JX in the phrase ‘cop TOP’. (a) Bark-scale spectra at 5ms intervals of the burst between the stop’s release (burst onset) and vowel onset; (b) The same spectra as in (a), but smoothed using 3DCT coefficients (C0, C1, C2),

capturing the individual spectra’s mean, slope and curvature. (c) The values of the DCT coefficients (C0, C1, C2) obtained for each spectral slice from burst onset to vowel onset in 5ms increments; each temporal curve (C0t, C1t, C2t) is fitted using the first three DCT coefficients capturing its mean, slope and curvature, resulting in 9 coefficients that capture the spectral time-varying properties of the burst.
FIGURE 4. Histograms of posterior probabilities from an SVM classification showing the probability of being classified as /k/ for categories K, KC, KG, and of being classified as /t/ for categories T, TC, TG. Reference marks (dotted lines) are placed at the 25th, 50th and 75th percentiles respectively, ordered from left to right.
FIGURE 5. Boxplots showing the median (thick horizontal bar), interquartile range (boxes), error bars (vertical lines) and outliers (circles) for the acoustic measure P, the token proximity to /k/ (negative values) or /t/ (positive values). All /k/ categories were significantly different from all /t/ categories. Significant differences within /k/ or /t/ are indicated by *.

FIGURE 6. Boxplots showing the median (horizontal bar), interquartile range (boxes), error bars (vertical lines) and outliers (circles) for perceptual d’ score (left panel) and acoustic measure P (right panel). Significant differences are indicated by *. Total number of tokens across categories for the data subset is N=60. Perceptual d’ scores (left) range from +4.65 representing maximum consistent correct identification to -4.65 representing consistent incorrect identification. Acoustic proximity indices range from close to /t/ (positive values) to close to /k/ (negative values).

FIGURE 7. Ensemble-averaged, linearly time-normalized spectra of errorfree and errorful /k/ and /t/. Time points are proportional, proceeding in 25% increments from burst onset (release) to vowel onset. The spectra were smoothed using the first three DCT coefficients. The figures show information equivalent to the coefficients used for classification and acoustic distance calculation.
FIGURE 8. Ensemble-averaged spectra of error-free and errorful /k/ and /t/, at burst onset smoothed using three DCT coefficients. Arrows indicate spectral energy peaks for spectra of error-free /t/ and /k/, and for /t/ produced with an intruding tongue dorsum of categorical magnitude (TC).

FIGURE 9. Boxplots showing the median (horizontal bar), interquartile range (boxes), error bars (vertical lines) and outliers (circles) for release lag, measuring relative timing between intended and intruding gestures during errorful /k/ and /t/. Positive values indicate that TD is released later than TT.
FIGURE 10. Ensemble-averaged spectra at burst onset smoothed using three DCT coefficients of TC tokens with TD released last (N=10), TC tokens with TT released last (N=18), error-free /k/, and error-free /t/.

FIGURE A. Boxplots showing the median (thick horizontal bar), interquartile range (boxes), error bars (vertical lines) and outliers (circles) for the acoustic measure P, the token proximity to /k/ (negative values) or /t/ (positive values), split by conditions vowel context (a), rate (b), stress (c), and phrase position (d). Because for the slow rate there were very few tokens for some of the errorful categories, the slow rate was not included in this by-rate analysis.

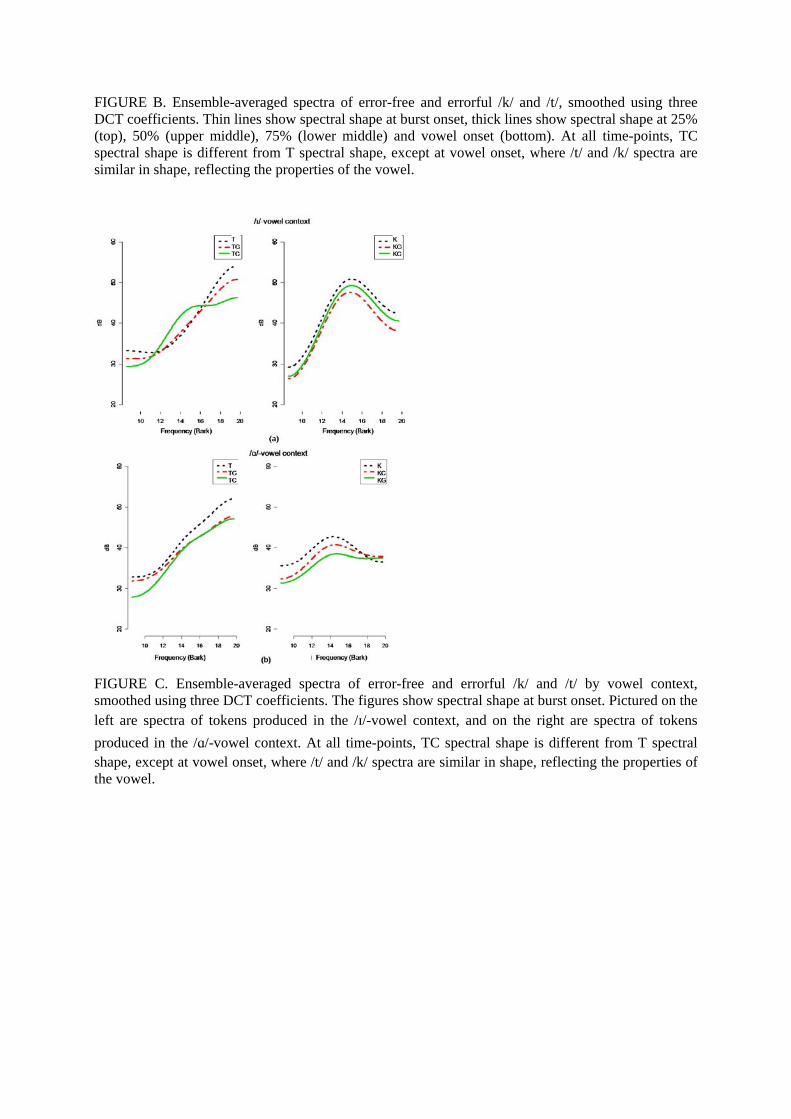
FIGURE B. Ensemble-averaged spectra of error-free and errorful /k/ and /t/, smoothed using three DCT coefficients. Thin lines show spectral shape at burst onset, thick lines show spectral shape at 25% (top), 50% (upper middle), 75% (lower middle) and vowel onset (bottom). At all time-points, TC spectral shape is different from T spectral shape, except at vowel onset, where /t/ and /k/ spectra are similar in shape, reflecting the properties of the vowel.
FIGURE C. Ensemble-averaged spectra of error-free and errorful /k/ and /t/ by vowel context, smoothed using three DCT coefficients. The figures show spectral shape at burst onset. Pictured on the left are spectra of tokens produced in the /ɪ/-vowel context, and on the right are spectra of tokens produced in the /ɑ/-vowel context. At all time-points, TC spectral shape is different from T spectral shape, except at vowel onset, where /t/ and /k/ spectra are similar in shape, reflecting the properties of the vowel.