acquisition - warriorsystem.com 8... · never switch off or disconnect a panel if acquisition is...
TRANSCRIPT

Acquisition
Acquisition is the main logging or data acquisition subset of the Warrior system. It acquires data from the hardware I/O devices, stores the raw data in the Warrior database and provides all the normal well logging functionality. When necessary, it also automatically starts other Warrior programs to perform additional functions in an integrated manner. In the Warrior System group, choose the Acquisition icon. (Double-click the icon,). Note SDS sets up the software to display a Warrior System group on the desktop. However the program group is also available via the Start button.
FIG: 4.1 Acquisition
Never switch off or disconnect a panel if Acquisition is running; always exit Acquisition first. Unpredictable results may occur if communication is lost with a panel during an Acquisition session.
Warrior is sensitive to USB devices being disconnected while it is running. USB devices can disconnect automatically when a computer goes into standby, so it is recommended that all standby/sleep/hibernate functions on the computer are disabled when using Warrior, not forgetting that closing the lid on laptop computers often puts them into standby as well.
4.1 Acquisition – Depth Control

When Acquisition is started, the Warrior Logging System Acquisition menu box will appear, along with the depth display. The Depth window displays the current depth and the line speed and has a [Control] button that causes the Depth Control window to be displayed.
FIG: 4.2 Depth Display
Click on the [Control] button of the Depth window or hit Enter when the Depth window is active. The Depth Control window appears as shown in Fig: 4.3. Enter the current depth in the New Depth field and click on [Apply] (or use the keyboard Enter key).
FIG: 4.3 Apply to Set Depth
FIG: 4.4 Depth reset
The Depth Panel setting should normally be left at None; it is only used when there is a Scientific Data Systems stand-alone depth panel attached to the system. Refer to Depth Panel manual for settings. The Scientific Data Systems Depth, Tension, and Line Speed panel is connected via a USB port, select USB, if there is not panel available select None option.

FIG: 4.5 Depth Panel Type
To configure the Depth Control, click on the [Config] button to access the Parameters and Alarms menu.
FIG: 4.6 Depth Control Configurations.
The depth control box may be displayed at any time by clicking the Control button of the depth display; however the New Depth, Correction, Encoder Resolution and the Wheel Size parameters may not be changed while logging. The Depth Configuration window enables configuration of the depthfrom an encoder input. The depth simulator that was available in previous versions of Warrior is no longer implemented since this was basically the same as a time drive log. The measuring wheel correction, the encoder characteristics, nominal wheel size (distance per encoder revolution), encoder direction, and speed direction are entered from this dialog box. Parameters for the Scientific Data Systems Depth, Tension, and Line Speed panel (if it installed) may also be entered or read by clicking the [Get] button.

FIG: 4.7 Depth Configuration window
If the system has a Scientific Data Systems USBAUX device attached to the shooting panel, the tolerance range for enabling of firing the panel may be adjusted in the Perf stop depth range. The [Alarms] button brings up the Warrior Alarms edit window. This allows the User to set the values, and tolerance for differential alarms, and to active the alarm by checking the On/Off box for that alarm. When the alarm is activated, the computer will normally beep through the speaker. By clicking on the three dot browse button to the right of the Sound file name for each alarm the User can elect to play back a .WAV file for the alarm warning. Under the Differential Alarms section are two depth alarms that have editable name fields. These can be used for alarms such as Packer, Seating Nipple, etc.
FIG: 4.8 Edit Warrior Alarms window

By clicking on the [Hoist] button in the Depth Control window, the Warrior System Hoistman’s Display will come up. The Hoistman’s Display contains depth and gauges for Depth, Line Tension, and Line Speed. The scales for each of the gauges may be individually scaled by right clicking on the gauge.
FIG: 4.9 Click [Hoist] for Hoistman’s Display
FIG: 4.10 Warrior System Hoistman’s Display
4.2 Acquisition - File
The following options can be selected in File: Select Dataset, Load variables, About, Exit, Close All.
FIG: 4.11 Acquisition File Options.

4.2.1 Select Dataset The Warrior well log database can (optionally) contain data from many wells, and within each well, data from many log passes. Each log pass is stored in a dataset. The dataset contains not only log data, but also other information about the logs, e.g. calibration and tool data.
FIG: 4.12 Select Dataset.
The system requires a Windows compliant file name to be defined for the database file within which the data is to be stored. The structure of the Warrior log database allows datasets to be defined by field, well, run and pass. The user may optionally choose to insert in the various fields of the Select Dataset window, abbreviations of the actual field and well names. The run number and pass may also be entered, or they may be used to identify some other features of the dataset. As an example, when running production logging, multiple passes are normally made, and can be difficult to identify later, if the dataset definition is left with the default entries. Another approach is to use the run field to identify the tool being run, e.g. field/well/temperature/pass1. The pass number will automatically increment every time a log is started. If desired, modify the remaining fields to reflect the actual well and log information. Click on OK or hit ENTER.
FIG: 4.13 Select Dataset
Enter a compliant file name in the Select Database field If desired, modify the remaining fields to reflect the actual well and log information. Click on OK or hit ENTER.
FIG: 4.14 Dataset Values
The file names may contain only the following characters: Numbers (0,1-9) Letters (A-Z, a-z) Blank (Theoretically you can have spaces)

ASCII characters greater than 127 Lengths of the file names are limited to 255 characters (260 for full paths). Special characters are not allowed: $ % ' @ ~ ` ! ( ) ^ & + , ; = [ ] The user may choose to store all data from a particular field in one file, or only the data from one log pass, or any intermediate level depending on the requirements. The usual procedure is to store all the data from one job in one file. In this way it is simple to backup the data to another directory before leaving the well site. Data may be merged into a single log file, or split into several files using the Merge program, to be described elsewhere.
4.2.2 Load variables This option allows you to load Zoned Variables from previous database passes. This is particularly useful when repeating runs, but creating a new database. Load Variables from the other Dataset, enabling depth dependent parameters associated with the selected service to be zoned and values to be set.
FIG: 4.15 Load Variables
FIG: 4.16 Load Dataset Values

FIG: 4.17 Dataset Values run1/pass1
4.2.3 About Shows the Software version installed in your computer
FIG: 4.18 Select About
FIG: 4.19 Show the Version Warrior Software

4.2.4 Exit Closes the program in the standard Windows manner. Exit the acquisition window.
4.2.5 Close All Closes all windows that have been opened in a Warrior Acquisition session.
4.3 Acquisition - Service
In the Warrior acquisition window click on Service and select the desired service from the drop down box. The services can be customized using 'Edit Logging Service Details', in Warrior Utilities. None is typically the service that is loaded by default when the Acquisition module starts. Usually the None Service contains no tools (except the tool STD that is a standard “tool” that should be included in every service). It will display depth, and you can monitor line tension and speed.
FIG: 4.3.1 Select Service
When any other service is selected by clicking on it, the tool string editor will appear. The importance of examining the tool string for the correct serial number and placement for each tool cannot be emphasized enough. Length, and sensor offsets will be calculated and calibrations for the selected tool serial numbers will be loaded. If the tool string is not correct than sensor offsets will not be correct. If the correct serial number is not selected, then the calibrations for the desired tool will not be used. The tool string editor will be discussed in further detail in the Acquisition -> Edit -> Tool String section

FIG: 4.3.2 Tool String Editor
After the service has been loaded, the selected service or service title will be listed on the service line in the acquisition window.
FIG: 4.3.2 Warrior Logging System

4.4 Acquisition - Action
FIG: 4.4.1 Acquisition – Action - Power Control
4.4.1 Power Control Select Power Control from the Action menu. The Power Control window appears as shown below. Select the Enable box. Note: Tool voltage and tool current must be calibrated.
FIG: 4.4.2 Power Control

FIG: 4.4.3 TCURR Outputs
When the Tool Current (TCURR) is less of 10 mA for a Time period more than 10 seconds, the tool power supply relay is set to the power disabled position. The Tool Current Open set point value (10mA) is set in wproperties.ini along with several other default values. These values can be controlled in each individual service by adding controls in the Service Editor.
FIG: 4.4.4 Open Line Warning
The Service Editor allows the User to adjust many of these power control values in each specific service. This is done by adding a Control through a Control Key Word and a value. NoMonitor= True to completely disable power monitoring) External= True will allow monitoring (if TVOLT and/or TCURR are measured), but only pop-up message; no cutoff SoftPowerControl=No. If Yes, then the power control slider bars will be enabled in the service Numeric entries: OverCurrent= Maximum allowable TCURR milliamps, 0 = disable over current monitoring. OverVoltage= Maximum allowable TVOLT volts, 0 = disable over voltage monitoring. OverDissipation= Maximum allowable TVOLT/TCURR watts, 0 = disable over dissipation monitoring. ShortVoltage= Minimum TVOLT volts that must be reached before the ShortCurrent value exceeds it set limit. ShortCurrent= Maximum TCURR milliamps for short-circuit detection before ShortVoltage is reached. 0 = disable short monitoring OpenCurrent= Minimum TCURR milliamps, 0=disable OpenCurrent monitoring. OpenTime= Maximum time interval for open-line detection, either 0 = disable OpenCurrent monitoring defaulted to 10 milliamp and 15 seconds. Text entries: ActionOnTrip= ‘None’ will cause the system to do nothing when a power “error” is detected. 'Cut off’ will cause the system to disable power with no message. 'Warn' will provide the User with a message that there has been a power “error. ‘Cut off and warn’ will disable tool power and provide the User with a message why the power was disabled.

FIG: 4.4.5 Add Controls
FIG: 4.4.6 Power Control
When the Warrior system is invoked or the service is changed, the tool power supply relay is set to the power disabled position. Clicking the Enable button sets the relay to the enabled position and allows tool power to be applied to the wireline. Clicking Disable disconnects the power supply from the line and connects the line input to chassis ground. The user may choose to have the Power Control box remain open whenever an action is taken by selecting Keep this box. Otherwise the box will close when any action is taken.

In order to Enable the software Power Control go to Services Editor, select the service, ADD control, select SoftPowerControl , and Save .
FIG: 4.4.7 Services Editor
FIG: 4.4.8 Controls
The Acquisition software module monitors the output current and voltage, and the power dissipation within the tool power supply. It checks for over voltage, over current, excessive power dissipation and short circuit conditions. If any fault condition is detected the power supply will be disconnected from the line and a warning message displayed.
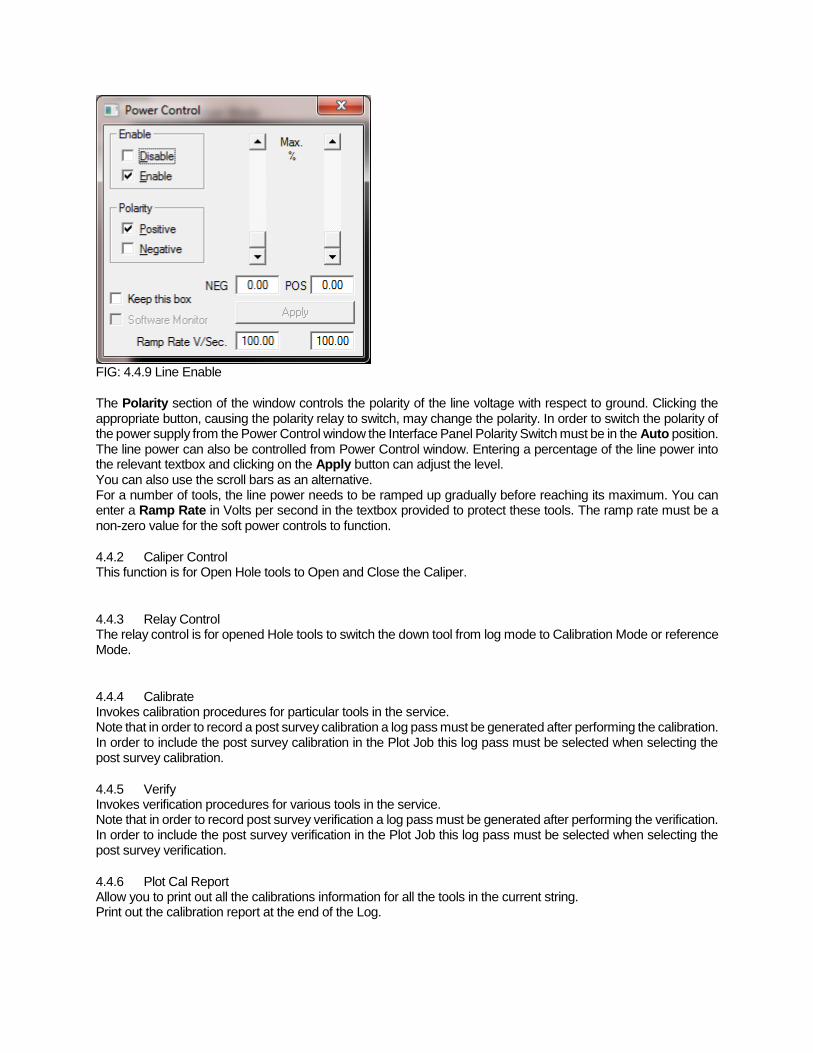
FIG: 4.4.9 Line Enable
The Polarity section of the window controls the polarity of the line voltage with respect to ground. Clicking the appropriate button, causing the polarity relay to switch, may change the polarity. In order to switch the polarity of the power supply from the Power Control window the Interface Panel Polarity Switch must be in the Auto position. The line power can also be controlled from Power Control window. Entering a percentage of the line power into the relevant textbox and clicking on the Apply button can adjust the level. You can also use the scroll bars as an alternative. For a number of tools, the line power needs to be ramped up gradually before reaching its maximum. You can enter a Ramp Rate in Volts per second in the textbox provided to protect these tools. The ramp rate must be a non-zero value for the soft power controls to function.
4.4.2 Caliper Control This function is for Open Hole tools to Open and Close the Caliper.
4.4.3 Relay Control The relay control is for opened Hole tools to switch the down tool from log mode to Calibration Mode or reference Mode.
4.4.4 Calibrate Invokes calibration procedures for particular tools in the service. Note that in order to record a post survey calibration a log pass must be generated after performing the calibration. In order to include the post survey calibration in the Plot Job this log pass must be selected when selecting the post survey calibration.
4.4.5 Verify Invokes verification procedures for various tools in the service. Note that in order to record post survey verification a log pass must be generated after performing the verification. In order to include the post survey verification in the Plot Job this log pass must be selected when selecting the post survey verification.
4.4.6 Plot Cal Report Allow you to print out all the calibrations information for all the tools in the current string. Print out the calibration report at the end of the Log.

4.4.7 Record Up The plot may be paused by using the Pause button and terminated by reselecting Unpause. The plot may be paused at any time and the scroll bar, used to move back through the log to any zone of interest. When moving the scroll bar, the actual log depth, corresponding to the scroll bar position, is indicated in a box in the center of the log plot window. A popup window opens by right clicking on the plot, displaying all the curve's values (Log readings) at the mouse position.
FIG: 4.4.10 Record Up GR/CCL/TEMP

FIG: 4.4.11 Options
FIG: 4.4.12 Tool Position
This option show the tool position

FIG: 4.4.13 Tool Position ON/OFF
4.4.8 Record Down Starts logging down.
4.4.9 Record on Time Sets record on time reference mode. You will be prompted for the sampling rate in samples per second for fast sampling; or seconds per sample for slow sampling.
4.4.10 Replay Replays data from current database.
4.4.11 Independent Replay Replays data from any database.
4.4.12 Depth Shift Makes a linear shift to the depth reference on a data file. This feature is intended to provide a rapid tie-in capability by applying a linear depth shift to a dataset. Once a section of log has been made and is displayed on the screen, select Depth Shift from the Action menu. The window shown in Fig:4.4.15 below appears. Or Apply Linear Depth Shift function is also available from the Utilities program in the Warrior shortcut folder.
FIG: 4.4.14 Depth Shift

FIG: 4.4.15 Down Hole Depth Shift 100 ft.
The database and pass are defaulted to those of the last logged section. The Feet or Meters selection is defaulted to that set in the Control Panel. Enter the required depth shift for the file and click Apply. Note that a positive number, entered here, increases the overall depth of the file. The screen plot of the file is now automatically redrawn, reflecting the applied depth shift
FIG: 4.4.16 Set Depth Shift 100 ft.
Add 100 Ft.
FIG: 4.4.17 Up Hole Depth Shift -100 ft
Subtract 100 Ft.

FIG: 4.4.18 Set Depth Shift -100 ft
The current encoder depth will be automatically updated when the Shift current Encoder Depth also box is selected. This is the default when the depth shift is run from Acquisition. Note also that the shift may be made while logging; and that the encoder depth and log display will update accordingly. This facility may be used to apply a linear depth shift to log data, other than the current database. This can be achieved by using the Select Data button to bring up a file selection box. Ensure that the Shift current Encoder Depth also box is not selected, unless it is required to update the system depth.
4.4.13 Preview Up Allows viewing of the log on screen (Interactive Plot) or hardcopy without permanently recording data to disk.
4.4.14 Preview Down Allows viewing of the log on screen (Interactive Plot) or hardcopy without permanently recording data to disk.
4.4.15 Preview on Time Allows viewing of the log on screen (Interactive Plot) or hardcopy without permanently recording data to disk.
In Preview mode, data is actually being recorded in a special database called Preview.db. When the last program attached to Preview.db is closed this database is automatically deleted. There is no way to recover Preview.db once it has deleted.
4.5 Acquisition - Edit
4.5.1 Edit - Tool String The tool string editor will appear. The correct serial number and placement for each tool should be verified. Select save, depth offsets will be calculated and calibrations for the selected tool serial numbers will be loaded. The Tool String Editor allows a tool string to be built from within the constraints of the selected service. Tools of the correct model may be selected by serial number and placed in the required physical position in the tool string. A tool string diagram is presented on the screen and may also be included in the hardcopy output by including in the plot job. Once the tool string has been assembled, the sensor offsets are automatically calculated using information stored in a tools database. Note that a service will include one or more tools. The tools, which are included in a service, are defined in the services.ini file. Only those tools defined in the services.ini file may be entered into the tool string with the tool String Editor.

FIG: 4.5.1 Select Tool String
Select the required service and select Tool String from the Edit menu. The Tool String Editor will appear with the last saved tool string configuration.
4.5.1.1 Remove Tools in the string To remove a tool from the string Mouse Right click on the tool section and select Remove.
FIG: 4.5.2 Remove Tool
Other way is with Remove button and select the tool(s) to be removed using the >>> button(s) at the left of the tool string diagram. Note that, in the diagram below, the >>> buttons are now positioned at the center point of tools rather than at tool joints as in the above diagram.

FIG: 4.5.3 Remove Tool
4.5.1.2 Add Tools in the string To add tools to the string, click on the tool to be added and drag it into position in the tool string. A line on the drawing will indicate where the tool will be inserted. You can also click on any tool and drag to a new position in the string. To edit the properties of the tool, right click on the tool and select Properties to bring up the tool editor for that tool.
FIG: 4.5.4 Add Tool
The second option is to double click a selected tool. This will add the tool to the top or bottom of the string depending up Tool String Editor options. Another option to Add is select the too with the mouse Left click, then Mouse Left Click over Add Button. Once a tool has been selected the point at which it is to be inserted in the tool string is defined using the >>> buttons which appear to the left of the tool diagram.

FIG: 4.5.5Add Tool
4.5.1.3 Change Tool To change to another tool of the same type, right click on the tool and select Change to see a list of the serial numbers of available tools that can replace the one in the string.
FIG: 4.5.6 Change Tool
4.5.1.4 Tool Properties Mouse Right Click over the tool and select Properties. This will bring up the Tools Editor. The Tools Editor is used to create tools and to modify the physical properties of the tools used by the Warrior Software. This includes length, diameter, software modules used for logging, sensor offset, default filters, and software specific settings. The Tools editor will be discussed in further detail in the Utilities – Edit Logging Tool Details section of this manual. When editing has been completed, the tool string information is saved using the Save button. At this point, the service will be reloaded as the current status; and other parameters of the tool string may have changed.

FIG: 4.5.7 Tool Properties
FIG: 4.5.8 Tool Model Properties
4.5.1.7 Variable Length Items To change the length of a variable length item, right click on the item and select Length from the pulldown menu.
4.5.1.8 Options When clicking on the Options button, a number of options appear below the tool tree diagram. These include the sensor offsets, where to break diagrams of long tools and the scale factor of the diagrams. For long tools, select the Break item option and then enter a break length. You may have to toggle the Break item checkbox to update to a new break length. This will draw any tool that is longer than the break length with a break in the middle so you can fit more objects in a smaller area. Choose a different Scale Factor to display the diagram at a greater resolution.

The Show offsets checkbox displays all the sensor names in the tool string and their offsets.
4.5.1.9 Print Any tool diagram will print to fit on one page. When another scale factor than <auto> is selected, two print choices are available. You can print to fit on one page or you can print to scale. If you print to scale, the image may span multiple pages.
FIG: 4.5.9 SAVE and Exit
4.5.2 Edit – Variables
The Variables Editor is invoked from the Acquisition Edit menu or from Warrior shortcut folder, double-click the Utilities icon. The Utilities menu box will appear, Click on the Edit Variables in a Dataset button. It is used to enter and edit zoned Parameters for use by the logging system. When first invoked it appears similar to the window shown below in Fig. 4.5.32. Displays the Variable (parameter) editor window, enabling depth dependent parameters associated with the selected service to be zoned and values to be set.
FIG: 4.5.10 Variables
A file selection dialog box appears. Select the required database, followed by the log pass (dataset). The Variable Editor is displayed with the variables that were active during the logging session. In this case the well is shown as one zone from top to bottom. To define a new zone press the Zones Button and a window will appear as shown below.

FIG: 4.5.11 Add Zones
FIG: 4.5.12 Set a New Zone
Here boundaries may be inserted and their positions changed, e.g. inserting a new change at 1000ft results in two zones, one from the top to 1000, and one from 1000 to the bottom. Note: if the variable editor is started from the acquisition module when logging, then by selecting the Pick from Log checkbox, the depth of zone changes can be selected by clicking on the appropriate depth on the interactive plot.
FIG: 4.5.13 Edit values and accept
To change the value of the variable in a particular zone, TAB to or click on the variable and enter the New value. When all entries have been made Accept the changes and Close the editor.

FIG: 4.5.14 Insert New Zone
FIG: 4.5.15 Undo Zone
FIG: 4.5.16 Accept and Close
4.5.3 Edit - Heading Edit – Headings invokes the Warrior Heading Editor. This will be discussed in detail in the Heading Editor Section
4.5.4 Edit – Master Log Format Edit – Master Log Format invokes the Warrior Format Editor. This will be discussed in detail in Format Editor Section
4.5.5 Edit – Plot Job Edit – Plot Job invokes the Warrior Plot Job Editor. This will be discussed in detail in the Plot Job Editor Section.
4.5.6 Edit - Sensors Brings up the Edit Sensor window. Once a service has been selected, the Edit Sensors window may be displayed and information concerning the individual sensors, associated with the particular service, may be edited. This

information normally consists of the hardware source of the sensor (Device and Channel number), the depth offset of the sensor from tool zero reference, and the sampling rate. The information contained in Edit Sensors is derived from the current service and current tool string information. For example, sensor depth offsets are derived from the selected tool string and the information is contained in the tools database. The default sample rates and device channel assignments are derived from the services.ini file. The default device and channel settings, and the default sample rates are contained in the services.ini file. The default depth offsets are derived from tool information contained in the tools.ini file. Although the information in Edit Sensors is normally derived automatically from the information contained within the system, it may sometimes be necessary to modify or review a setting.
FIG: 4.5.17 Edit Sensors
Select Sensors from the Edit menu. The Edit Sensors window appears as shown below.

FIG: 4.5.18 Edit
Highlight one or more sensors and select Edit, or double-click on a sensor item. The Edit Sensors dialog box will be displayed for editing as shown in Fig: 4.5.39. The acquisition device may be selected with the Device box. There are several acquisition devices supported within the Warrior system. Do not change this entry unless you know what you are doing. The channel of the device, from which the sensor is to be read, is selected by editing the Channel box. Do not change this entry unless you know what you are doing. The number of samples per foot to be recorded is entered in the Rate box. The maximum sample rate for a sensor is generally limited to the maximum rate set for the particular acquisition device acquiring the data. This maximum rate is set in the services.ini file. The physical depth offset of the sensor from tool zero is entered in the Offset box. Note that the value to be entered in Offset is the physical depth offset, as the system automatically compensates for any lags introduced by filtering.

The change made in Edit Sensors will remain in effect until the service is reloaded; when the sensor parameters are returned to their default values. Sensors should not be edited during logging. Note that sensor cannot be edited while logging.
4.5.7 Edit - Calibrations Warrior allows editing of sensor calibrations. The Warrior system supports many types of calibrated tool response. The calibration parameters may be derived from manual entries, or from calibration procedures, performed by the system itself. Some calibration parameters can be edited from Edit/ Calibrations.
FIG: 4.5.19 Calibrations
Select Calibrations from the Edit menu, and double-click on the sensor to be edited. Alternatively, click once and select and Edit/Edit Selections. The tool type, serial number, calibration name and calibration type are displayed, but cannot be edited. The various calibration parameters can be edited and saved either permanently (with the Perm button) or temporarily (with the Temp button). See Fig: 4.5.20. OLE_LinkFig4
Warrior stores calibrations internally in English units. When editing calibrations in this dialog, the reference values must always be entered in English units. Changes made and saved temporarily stay in effect until the service is reloaded, so when
the calibration parameters are returned to their normal permanent values. Note that calibrations can be changed while logging.

FIG: 4.5.20 Edit Calibrations
4.5.8 Edit - Filters The Filters option displays filter settings and allows them to be edited. Four types of filter options are currently available in the Warrior system.
FIG: 4.5.21 Filters

These are: SQUARE is a simple average of the sensor value over the filter interval selected. GAUSSIAN is a weighted average, where the weights, applied to each sample over the interval, take the form of a Gaussian distribution. The filter interval is in feet, when recording in depth, and in seconds, when recording in time. TRIANGLE is another weighted average that accentuates peaks similar to the Gaussian filter. The Triangle filter is more extreme than the Gaussian. USER is a user-defined filter, but is currently not implemented. Select Filters from the Edit menu, and double-click (or single-click and Edit/Edit Selections) on the sensor, whose filter is to be edited.
FIG: 4.5.22 Edit Filters
The tool type and current filter parameters are displayed for the sensor selected. Typing over the parameter, shown in the Interval box, may change the interval. The filter type can be changed by means of the radio buttons. Note that changes, made here, stay in effect until the service is reloaded, so when the filter parameters are returned to their default values. Default filter settings are contained in the tools file as part of the tool model information. Filters cannot be edited while logging.
4.5.9 Edit - Tool Configuration
FIG: 4.5.23 Tool Configuration

4.5.9.1 STD Tool Configuration The STD tool is normally in every service. The line resistance used to calculate HVOLTA (Head Voltage Apparent) can be edited from here.
FIG: 4.5.24 Set Line Resistance
4.5.9.2 CCL Control The CCL software produces 2 outputs: CCL Casing Collar Locator CCLRT Real Time Casing Collar Locator The real time output bypasses the normal sampling queues so that changes can be seen immediately. The CCL software incorporates a facility to effect a shift of the CCL curve, as is sometimes required when running perforating services. The collar log may also be “filtered” in such a way as to remove noise from the baseline of the curve while still allowing collar signals above a certain threshold to be displayed. When in Acquisition mode, and with a collar tool in the string, the CCL Control box may be displayed with Edit/Tool Configuration/CCL.
FIG: 4.5.25 CCL Control
Shift - CCL Bring up the CCL Control box as described above. Set the amount of shift required in the Step Size dialog. The value entered here should reflect the actual scale set for the log. For example, if the log is scaled at 1 volt per track and it is required to shift the curve 10 (small) divisions, enter a value of 0.1. Clicking the Left or Right buttons produces the shift and the cumulative amount of shift applied appears in the Current Total box. Note that [<<Left] changes the CCL output by a negative value and [Right>>] changes the CCL by a positive value so that left and right only apply is the CCL plot is scaled with a negative value on the left and a positive value on the right. Threshold - CCL

Invoke the CCL Control box and set the Threshold Enabled. Click on Setup and adjust the threshold settings as required. The Positive and Negative Thresholds are set in the same units as the collar log output curve. Any collar curve signal smaller in amplitude than the threshold settings will be suppressed to a value of zero. Any signal greater than the threshold levels will be recorded as its true value.
FIG: 4.5.26 CCL Thresholds
Clamp - CCL The Positive and Negative Clamps cut the signal at the set point value. Any collar curve signal bigger in amplitude than the clamp settings will be set to clamp value.
FIG: 4.5.27 CCL Clamp Limits
Baseline Normalization - CCL Invoke the CCL Control box and set the Baseline Normalization Enabled. Click on Setup and adjust the cycle length (must be greater than 0) and the offset settings as required. The system will attempt to correct a CCL baseline to a value of zero and then recheck it every cycle length.

FIG: 4.5.28 CCL Baseline Zeroing Setup Select Setup, and type in Cycle Length 2 left in Zero Current/Starting Offset. Click over OK Check on the Enable box, and Click on Setup, you find the new value in Current/Starting Offset
FIG: 4.5.29 CCL Baseline Zeroing Setup
4.5.10 Edit - Device Configuration
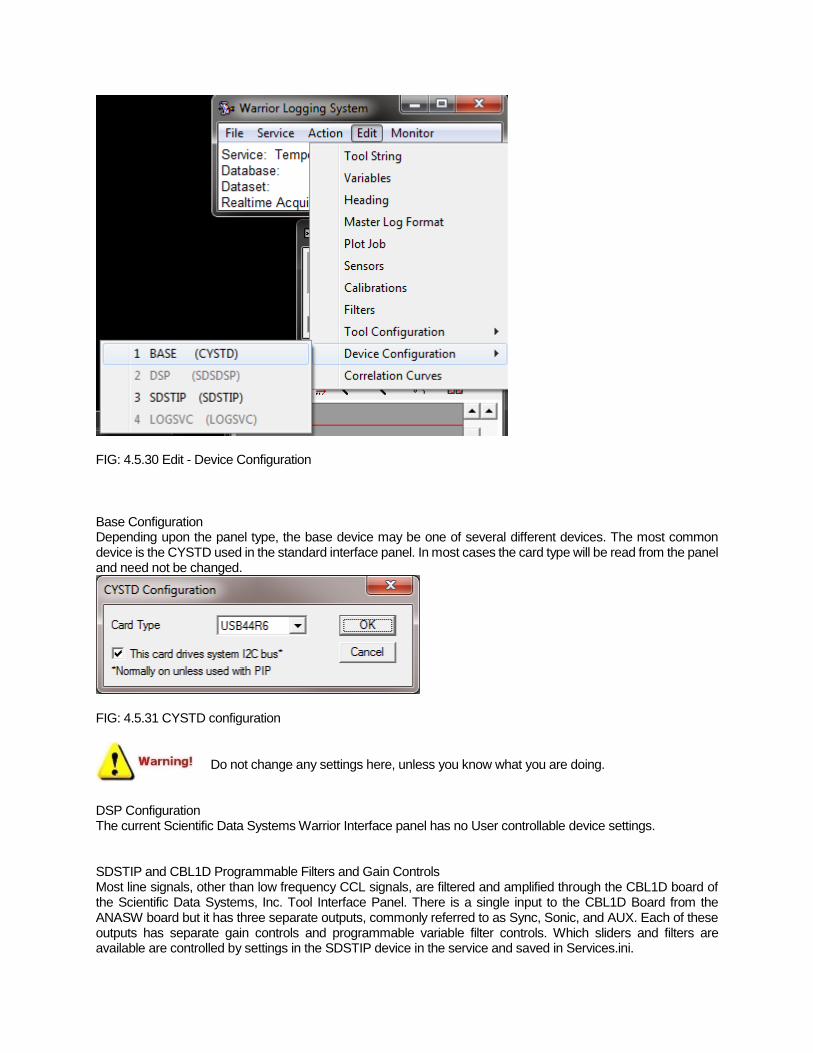
FIG: 4.5.30 Edit - Device Configuration
Base Configuration Depending upon the panel type, the base device may be one of several different devices. The most common device is the CYSTD used in the standard interface panel. In most cases the card type will be read from the panel and need not be changed.
FIG: 4.5.31 CYSTD configuration
Do not change any settings here, unless you know what you are doing.
DSP Configuration The current Scientific Data Systems Warrior Interface panel has no User controllable device settings. SDSTIP and CBL1D Programmable Filters and Gain Controls Most line signals, other than low frequency CCL signals, are filtered and amplified through the CBL1D board of the Scientific Data Systems, Inc. Tool Interface Panel. There is a single input to the CBL1D Board from the ANASW board but it has three separate outputs, commonly referred to as Sync, Sonic, and AUX. Each of these outputs has separate gain controls and programmable variable filter controls. Which sliders and filters are available are controlled by settings in the SDSTIP device in the service and saved in Services.ini.

Each of the Sync, Sonic, and AUX output channels has a programmable attenuator that is controlled through the software by a slider bar in the panel controls. This is necessary to keep the signals from saturating during later stages of filtering and amplification. During normal operation, these are all that is necessary in a service to control the signal gains.
FIG: 4.5.32 Panel Controls
Each of the three channels also has a variable filter that can be set or adjusted. It is not normally necessary to adjust these filters once a service has initially been set up on a logging unit. Access for adjustment of these filters is obtained through the Acquisition Software by selecting Edit -> Device Configuration -> SDSTIP.
FIG: 4.5.33 Device Configuration

FIG: 4.5.34 SDSTIP
Each of the output channels has its own Gain, Q, Corner or Center Frequency, and whether it has a Band Pass or High Pass output. In addition to this, the Sonic channel has a pre-filter to keep the initial input attenuator from saturating. This pre-filter is turned off with a 0 value and is turned on with a value of 8. No other values will work. You will get no sonic signal with any value other than 0 or 8. The Sonic and Aux channels will normally be set to filter a pulse signal, so they will usually have a High Pass filter with as low a corner frequency as possible. The gain for these channels should be set so that the slider bar gain control has a good setting for the service at near mid-range. The Sonic channel will normally be looking at acoustic signals in the 20000 hertz range and should be selected as a Band Pass filter. The Q of the filters is related to the how much frequency change is needed to attenuate the signal by 3DB. The larger the number, the less change from the Fc is needed to attenuate the signal. The following Internet link gives simple explanations of filters and their characteristics. http://en.wikipedia.org/wiki/Electronic_filter#Multipole_types The different hardware revisions of the CBL1D board require that the correct panel type be set in the Warrior
Control Panel for the CBL1D board to respond to slider bar and filter settings. Revisions R1 through R4 will normally have a panel type that ends with the letter a (CPFA). As of this date, Revisions R5 and higher will have panel types that end with a B, C, D or E (CPFB – CPFE).
If the service has a Signaltype Control Keyword, the filter settings may change depending upon the Cable Selection in the Warrior control Panel. This is discussed in further detail
4.6 Acquisition - Monitor
Once a service has been selected, various data monitors are available to the operator as shown in Fig. 4.6.1 below.

FIG: 4.6.1 Monitor Sensors
4.6.1 Monitor - Sensors The sensors for the selected service are displayed along with the values of their current readings. The sensor monitor is used to monitor `raw' data. Select Monitor Sensors from the Edit menu. The Sensor Monitor will be displayed. The sensor monitor is updated at the refresh rate set in the Warrior Control Panel.
FIG: 4.6.2 Sensors
4.6.2 Monitor - Outputs The outputs for the selected service are displayed along with the value of their current readings in engineering units. Select Monitor /Outputs from the menu. The Outputs monitor is displayed as shown in Fig: 4.6.3. When in a logging mode, e.g. Record Up, the readings are updated at each depth sample. When not in logging mode, the outputs are updated at the frequency set in the Control Panel.

FIG: 4.6.3 Outputs
Monitor - Outputs - Gauges Another function of monitor output is the ability to add a meter to a service. With the Monitor – Output window open, right click on any output in the list. You will be given a choice of 4 types of gauges to use. They are Angular Gauge, Histogram Gauge, Bar Gauge, and Numeric Gauge. The gauge will remain on the windows desktop until closed. However, the next time the service is reloaded the gauge will return to the windows desktop. To

permanently remove gauge from the service, Monitor – Outputs again, right click on the gauge that you want to remove from the service, and choose the Delete Gauge option.
FIG: 4.6.4 Outputs – Adding / Deleting a gauge to a service.
The properties of the gauge can be modified by right clicking on the gauge.
FIG: 4.6.5 Changing the properties of a gauge

FIG: 4.6.6 Gauge properties
FIG: 4.6.7 Examples of various Gauge types available.

Monitor - Sample Queues Monitors the status of the internal Warrior sample queues.
4.6.3 Monitor – Tools Some tools may have special monitor windows, such as bond tools. The window will be used to monitor and setup measurement parameters for those tools.
FIG: 4.6.8 Monitor Tools
FIG: 4.6.9 Monitor CS8SCBL

4.6.4 Monitor - Devices Displays the raw data readings of the selected device, channels, irrespective of whether particular channels are being used for the current service.
FIG: 4.6.10 Monitor Devices
Monitor – Devices - Base If the base device is the CYSTD, the 16 possible analog inputs and 4 counter channels will be shown. Note the several of the channels are named for their inputs.

FIG: 4.6.11 Base (CYSTD) Values
Monitor – Devices – DSP Depending upon the DSP script used in the service, the DSP monitor may show a variety of different things
FIG: 4.6.12 Example DSP monitors.
Monitor – Devices – LOGSVC The LOGSVC device is a software device used for processing depth and line speed.
4.6.5 Monitor – Hoistman’s Display
The Hoistman’s display can be loaded by clicking on Monitor / Hostman’s Display or the Hoist button in the Depth Control window. Activating the popup menu can configure the view and scales. Do this by right clicking on the display and selecting the required menu option. Sound alerts for various conditions can also be configured here if a suitable sound card and speaker are available. Note that in multi-monitor systems, the Hoistman's display can be positioned on a second monitor close to the winchman.

FIG: 4.6.13 Monitor Hoistman’s Display
FIG: 4.6.14 Hoistman’s Display
Click Config.
FIG: 4.6.15 Set up Depth Configuration
Right click over the gauge to select Gauge Properties

FIG: 4.6.16 Set Gauge Properties