acquisition of 100 market street final - link reit
TRANSCRIPT

December 2019
Acquisition of Grade A Office
100 Market Street,
Sydney, Australia
Source: JLL
Source: JLL

Key Highlights
1. Sydney is an established and growing global
gateway city with strong tenant demand
2. 100 Market Street is a quality asset in a
premium location
3. A rare single owner asset and 100%
occupied by premium tenants
4. WALE of 8.45 years(1) with annual rental
escalations
5. Immediately accretive transaction funded
with AUD borrowings
6. Large floor plate and high NABERs Energy
Ratings
P.2
A stable, quality asset to drive portfolio diversification
and sustainable growthNote:(1) By rental income as at 16 December 2019
Source: JLL

100 Market Street, Sydney, Australia

vProperty Particulars
Property
100 Market Street(Part of a mixed-use development
which consists of retail, office and the
Sydney Tower)
Location 100 Market Street, Sydney,
NSW 2000, Australia
Major Asset
Enhancement
Completion
2010/2011
No. of Floors 10
Net Lettable
Area 28,385.3 sqm
Early 2020Expected completion
of acquisition(1)
A$683M
Agreed property value
P.4
Note:(1) Subject to Foreign Investment Review Board approval

1 United Kingdom
Australia
United States
Singapore
Hong Kong
Japan
China
2
3
12
13
14
33
…...
Transparent Market Highly Liquid Low Execution Risks
✓ Common law legal system
✓ Favourable tax laws and
structures for long-term
property investors
✓ Professional and mature
eco-system
✓ Foreign investor friendly
Source: JLL Source: Colliers Research
Why Australia?
Australia is a highly transparent, liquid and
investor-friendly real estate market
Transparency Index 2018 Commercial Transaction Volume
P.5
…...
0
5
10
15
20
25
30
35
40
2016 2017 2018 2019YTD
Retail Office Industrial
($B)

vInvestment Rationale Stable Economy and Leasing Market in Sydney
Solid growth in diverse industries
contribute to economic growth in
Sydney
Well-supported Leasing Market
✓Stable GDP growth
✓Low interest rates to spark business
confidence and investment
✓Strong occupier demand and lack of
meaningful supply
✓Current vacancy rate well below 10-year
average of 7% (1)
01
Note:(1) Source: Colliers International Sydney CBD Office Market Advisory Report, Q4 2019
P.6
Sydney CBD vacancy = 3.7%
Sydney is an established and growing global gateway city
with strong tenant demand
Solid GDP
contribution from
services sectors
Source: SGS Economics & Planning
Contr
ibutio
n T
o S
ydney G
DP
Gro
wth
2017
-18

vInvestment Rationale (cont’d)Strategically Located in Sydney CBD
Premium Location
✓Located in Midtown Precinct with
superior amenity and links to other CBD
precincts
✓ In the heart of CBD above Westfield
Sydney and close to 5-star hotels and
shopping destinations
02
David Jones
(department
store)
David Jones
(department
store)
100 Market
Street
Pitt Street Mall
(shopping mall)
Myer
(department store)
Swissotel Sydney
(5-star hotel)
The Strand Aracde
(shopping mall)
Office &
G/F shops
Office &
G/F shops
State Theatre
Westfield
Sydney
(shopping mall)
P.7

Investment Rationale (cont’d)Stable Income with Growth and Funded by
Local Currency
Immediately Accretive Transaction
Funded with Local Borrowings05
✓Positive net spread with immediate contribution
to distribution
✓FX risk mitigated by AUD borrowings
P.8
Stable Income with Long-term
Growth
✓Long WALE(1) (by rental income) of 8.45 years
with leases expiring in 2027 and 2030
✓Pre-set annual rental escalation of ~4%
04
Note:(1) Refers to weighted average lease expiry
10 office floors occupied by
three tenants
✓S&P/ ASX100 listed property investor
✓Commonwealth government body
✓Sovereign wealth fund
A Rare Single-owner Asset
with 100% Occupancy03

Distinctly Large Floor Plate and High NABERS Energy Ratings06
Investment Rationale (cont’d)One of the Largest Office Floor Plates in Sydney CBD
Typical Floor Plate
✓~3,000 sqm(1)
Lift lobby
P.9
Note:
(1) Only 12 assets with large floor plate in Sydney CBD
NABERS Energy Ratings
✓5.5 stars rating
(on a scale of zero to six stars)
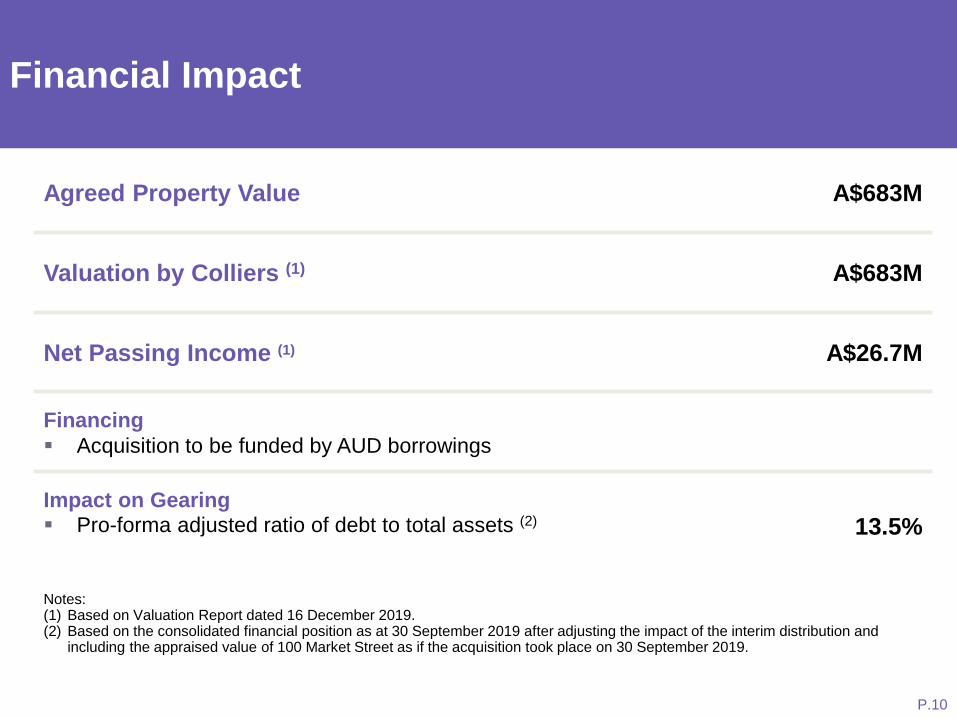
vFinancial Impact
Notes: (1) Based on Valuation Report dated 16 December 2019.(2) Based on the consolidated financial position as at 30 September 2019 after adjusting the impact of the interim distribution and
including the appraised value of 100 Market Street as if the acquisition took place on 30 September 2019.
Agreed Property Value A$683M
Valuation by Colliers (1) A$683M
Net Passing Income (1) A$26.7M
Financing
▪ Acquisition to be funded by AUD borrowings
Impact on Gearing
▪ Pro-forma adjusted ratio of debt to total assets (2) 13.5%
P.10
Investment Strategy Update
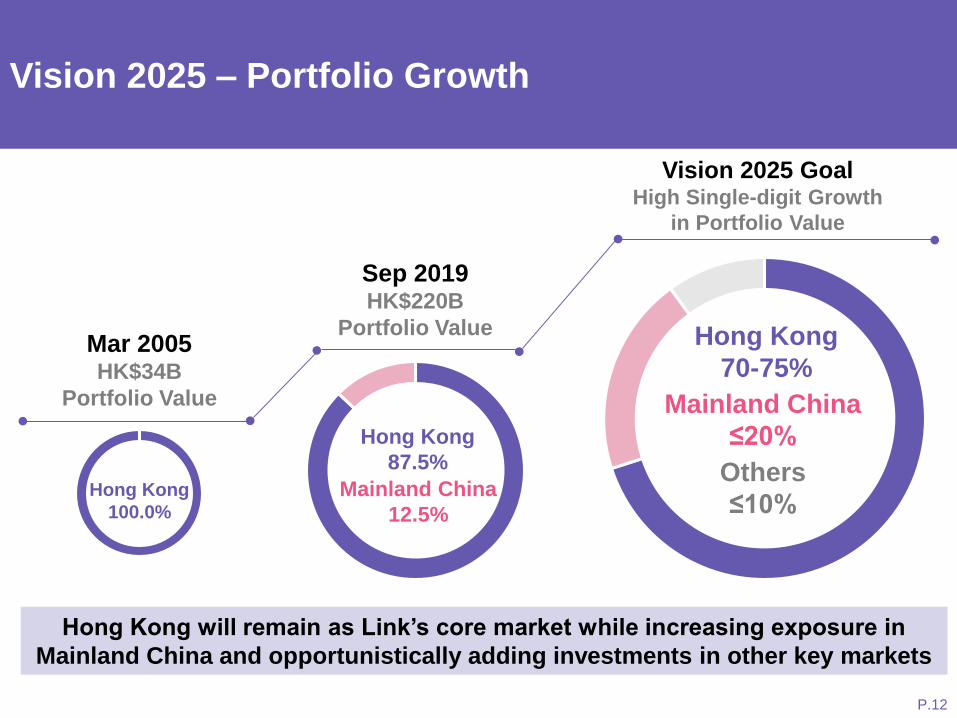
Vision 2025 Goal High Single-digit Growth
in Portfolio Value
…
Hong Kong
100.0%
Mar 2005HK$34B
Portfolio Value
Sep 2019HK$220B
Portfolio Value
Hong Kong
87.5%
Mainland China
12.5%
Hong Kong
70-75%
Mainland China
≤20%
Others
≤10%
Vision 2025 – Portfolio Growth
Hong Kong will remain as Link’s core market while increasing exposure in
Mainland China and opportunistically adding investments in other key markets
P.12
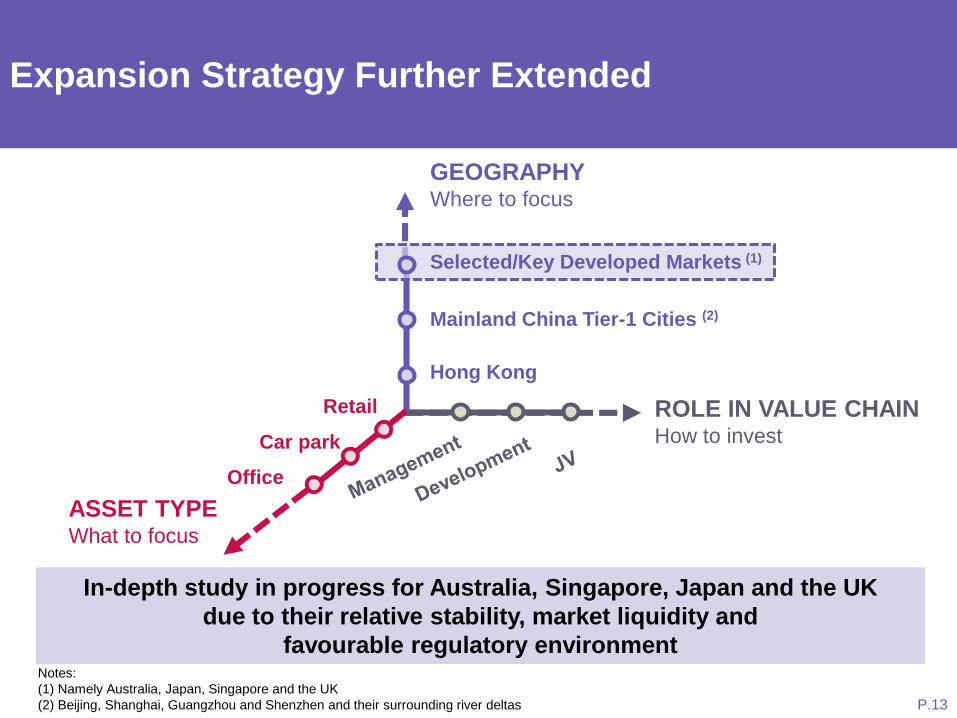
vExpansion Strategy Further Extended
GEOGRAPHYWhere to focus
Hong Kong
Mainland China Tier-1 Cities (2)
In-depth study in progress for Australia, Singapore, Japan and the UK
due to their relative stability, market liquidity and
favourable regulatory environmentNotes:
(1) Namely Australia, Japan, Singapore and the UK
(2) Beijing, Shanghai, Guangzhou and Shenzhen and their surrounding river deltas
ASSET TYPEWhat to focus
Car park
Retail ROLE IN VALUE CHAINHow to invest
Selected/Key Developed Markets (1)
P.13
Office

Dec 2005
IPO of 180 shopping
centres and car parks
in Hong Kong
2011-2012
1st Acquisition
in Hong Kong
Nan Fung Plaza
and Maritime Bay
Jan 2015
1st Development
Acquired a site for
The Quayside
Mar 2015
1st PRC Acquisition
EC Mall in Beijing
July 2015
2nd PRC Acquisition
Link Square in Shanghai
Mar 2019
4th and 5th PRC
Acquisitions
Roosevelt Plaza in Beijing
and CentralWalk in
Shenzhen
Apr 2016
HK Acquisition with
Major Renovation
T.O.P/700 Nathan Road
from HKSAR
Government
2014
Expanded
investment
mandate
Invest beyond
Hong Kong and
include property
development
Early 2020
1st Acquisition beyond Greater China
100 Market Street in Sydney, Australia
Our Journey to become a World Class
Real Estate Investor and Manager
Apr 2017
3rd PRC
Acquisition
Metropolitan
Plaza in
Guangzhou
Link has been gradually diversifying its real estate investments
in the past 14 years
P.14
Source: JLL

65.5%
16.7%
3.9%
1.6%
vDiversified Portfolio Mix
3.2%
Total
portfolio value
HK$224B
9.1%
Pro-forma Portfolio Mix(30 September 2019)
Existing portfolio –HK & Mainland China
New addition –Australia
Hong Kong Retail
Hong Kong Car park
Sydney Office
Hong Kong Office
Mainland China Retail
Mainland China Office
Geography
Hong Kong 70-75%
Mainland China ≤20%
Overseas ≤10%
Asset Class
Office 15-20%
Forward Guidance
P.15

Today’s AgendaAcquisition Criteria
P.16
Hong Kong Mainland China Australia
T.O.PThe
Quayside
EC
Mall
Link
Square
Metropolitan
Plaza
Roosevelt
Plaza
Central-
Walk
100
Market
Street
✓ HK, Mainland China Tier-1 cities,
Selected/key developed markets√ √ √ √ √ √ √ √
✓ Mass-mid market retail √ √ √ √ √
✓ Premium grade-A office √ √ √
✓ Good connectivity √ √ √ √ √ √ √ √
✓ Limited competition √ √ √ √ √
✓ Sizeable catchment √ √ √ √ √ √ √ √
✓ Long-term growth potential √ √ √ √ √ √ √ √
Link will adopt the same degree of prudence and rigour in pursuing
acquisitions in any markets
P.16

Appendix
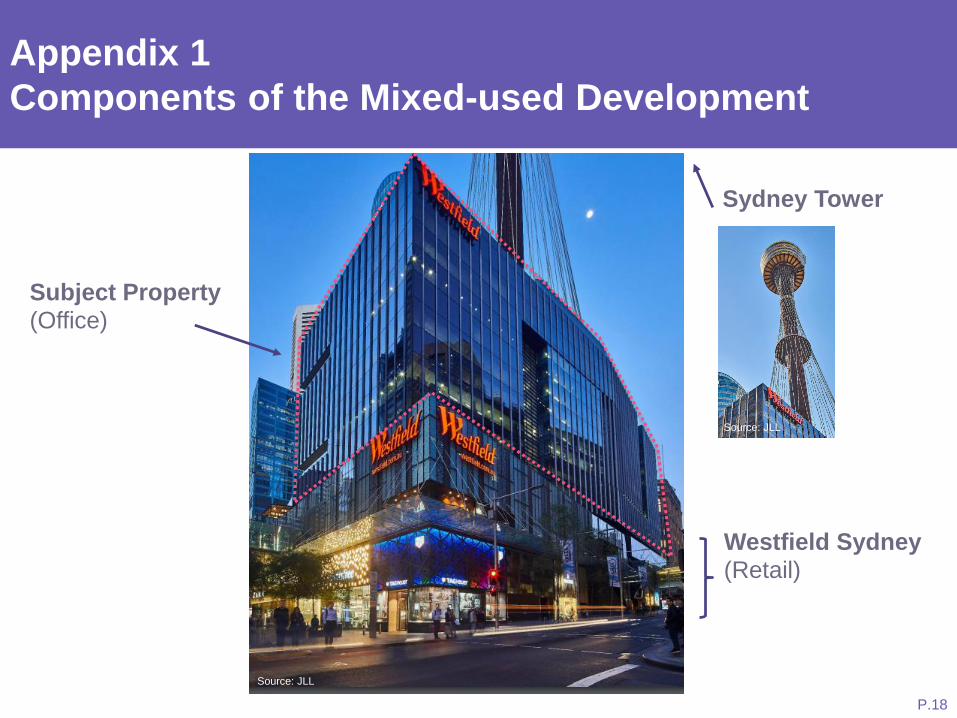
vAppendix 1
Components of the Mixed-used Development
P.18
Subject Property
(Office)
Sydney Tower
Westfield Sydney
(Retail)
Source: JLL
Source: JLL

vAppendix 2
Limited New Office Supply in Sydney CBD
Note:
(1) Source: Colliers International Sydney CBD Office Market Advisory Report, Q4 2019
DaramuHouse
60 MartinPlace
WynyardPlace
275GeorgeStreet
183-185Clarence
Street
210GeorgeStreet
77 MarketStreet(DJs)
QuayQuarterTower
CircularQuayTower
MartinPlaceNorthOSD
MartinPlaceSouthOSD
(39MP)
55 PittStreet
B'RooCentral
Pitt StreetNorthOSD
458GeorgeStreet
DarlingPark 4
YHA SiteCentral /WesternGateway(Block A)
CentralOSD /
WesternGateway(Block B)
CentralOSD /
WesternGateway(Block C)
Mooted / Proposed 0 0 0 0 0 0 0 0 0 0 0 45,000 40,000 45,000 31,119 70,000 60,000 140,000 60,000
New Dev Vacancy 0 2,421 19,969 6,371 4,930 14,963 11,842 20,557 30,207 30,000 20,000 0 0 0 0 0 0 0 0
Known Precommitment 10,032 36,955 47,491 0 2,540 2,000 0 67,305 25,000 40,000 0 0 0 0 0 0 0 0 0
0
10,000
20,000
30,000
40,000
50,000
60,000
70,000
80,000
90,000
100,000
110,000
120,000
130,000
140,000
150,000
2019 2020 2021 2022 2023 2024 2025+
Sydney CBD New Supply Pipeline
2019 – 2022 Total Supply = 302,583sqm (63% committed)
Only new supply in Midtown
P.19

vAppendix 3
Stable Sydney CBD Office Yield
-2.00%
0.00%
2.00%
4.00%
6.00%
8.00%
10.00%
Jun
-97
Jun
-98
Jun
-99
Jun
-00
Jun
-01
Jun
-02
Jun
-03
Jun
-04
Jun
-05
Jun
-06
Jun
-07
Jun
-08
Jun
-09
Jun
-10
Jun
-11
Jun
-12
Jun
-13
Jun
-14
Jun
-15
Jun
-16
Jun
-17
Jun
-18
Jun
-19
Jun
-20
Jun
-21
Jun
-22
Sydney CBD Prime Office Yield Spreads
Prime Spread 10Y Bond Prime Sydney CBD Yield
0.00%
1.00%
2.00%
3.00%
4.00%
5.00%
6.00%
7.00%
8.00%
Sydney Melbourne Brisbane Adelaide Perth Singapore London HongKong
New York Paris Berlin Tokyo
Jun-18 Jan-19 Jun-19
P.20
Note:
(1) Source: Colliers International Sydney CBD Office Market Advisory Report, Q4 2019
Sydney CBD and Global CBD markets Yield Comparison

vAppendix 4
Convenient Access to Transport Networks
L200m
150m
400m
500m
Walking distance to 4 major metro stations
400m
P.21
100 Market
Street
St James
Station
150m
Martin
Place
Station400m
T
T
QVB Light
Rail Station
L
200m
Wynyard
StationT
500m

◼ This document has been prepared by Link Asset Management Limited in its capacity as the Manager (the “Manager”) of Link Real EstateInvestment Trust (“Link REIT”) solely for use at the presentations/meetings held and may not be reproduced or redistributed withoutpermission. Neither this document nor any copy may be taken or transmitted into or distributed, directly or indirectly, in the United States orto any U.S. person (within the meaning of Regulation S under the United States Securities Act of 1933, as amended). Neither this documentnor any copy may be taken or transmitted into or distributed or redistributed in Canada or to the resident thereof. The distribution of thisdocument in other jurisdictions may be restricted by law and persons into whose possession this document comes should informthemselves about, and observe any such restrictions. By attending this presentation/meeting, you are deemed to agree to be bound by theforegoing restrictions and represent that you have understood and accepted the terms of this disclaimer. Any failure to comply with theserestrictions may constitute a violation of applicable securities laws.
◼ All information and data are provided for reference only. All opinions expressed herein are based on information available as of the datehereof and are subject to change without notice. The slides forming part of this document have been prepared solely as a support for oraldiscussion about Link REIT. No representation or warranty, express or implied, is made as to, and no reliance should be placed on, thefairness, accuracy, completeness or suitability of any information or opinion contained herein. None of Link REIT, the Manager, or any of itsdirectors, officers, employees, agents or advisors shall be in any way responsible for the contents hereof, nor shall they be liable for any lossarising from use of the information contained in this presentation or otherwise arising in connection therewith.
◼ This document may contain forward-looking statements. The past performance of Link REIT is not necessary indicative of the futureperformance of Link REIT and that the actual results may differ materially from those set forth in any forward-looking statements herein.Nothing contained in this document is, or shall be relied on, as a promise or forecast as to the future.
◼ This document does not constitute an offer or invitation to purchase or subscribe for any securities of Link REIT and neither any part of itshall form basis of or be relied upon in connection with any contract, commitment or investment decision whatsoever. No action has beentaken or will be taken by Link REIT, the Manager or any of its directors, officers, employees, agents or advisers, to register this document asan offering document or otherwise to permit public distribution of this document.
DisclaimerDisclaimer
P.22