acrp anderson terminal capacity
TRANSCRIPT

11
LONG BEACH, CALIFORNIA

22
Terminal Capacity Evaluation Techniques
LONG BEACH, CALIFORNIA
Bruce AndersonVice presidentLandrum & [email protected]

3
The Transportation Research Board (TRB)Airport Cooperative Research Program (ACRP)combined two research projects,
ACRP 07-04Terminal Planning Spreadsheet Models
&
ACRP 07-05Airport Passenger Terminal Planning Guidebook
Into:
ACRP REPORT 25Volume 1: GuidebookVolume 2: Spreadsheet Models
ACRP Report 25: Volume 1 & 2

4
Report 25: Airport Passenger Terminal Planning Volume 1: Guidebook
• ACRP Project 07-05• Research Agency:
Landrum & Brown
• Principal Investigator: Bruce Anderson
• Subcontractors: Hirsh Associates Kimley-Horn and Associates Jacobs Consultancy The Strategic Airport -Planning Group TranSecure, Inc. Steven Winter Associates, Inc. Five Star Systems (G&T Conveyor) Presentation & Design, Inc.

5
Report 25: Airport Passenger Terminal Planning Volume 2: Spreadsheet Model
• ACRP Project 07-04• Research Agency:
Landrum & Brown
• Principal Investigator: Matt Lee
• Subcontractors: Hirsh Associates Planning Technology, Inc. Presentations & Design, Inc.

6
• To develop a user-friendly spreadsheet model (or models), with an accompanying manual to analyze issues common to airport passenger terminal planning and design.
• To produce a compendium that identifies the types, scopes and availability of spreadsheet and discrete event models that can be used by airport operators for airport passenger terminal planning and design.
ACRP 07-05 Objectives

7
• To produce an Airport Passenger Terminal Planning Guidebook that:
Provides a comprehensive and up-to-date approach to the terminal planning process.
Addresses current issues and emerging trends Will be useful for airport managers, consultants, industry
organizations and other stakeholders of commercial aviation market.
• The Guidebook will now include the results of ACRP 07-04 Spreadsheet Models for Planning and Design and will be published as ACRP Report 25
ACRP 07-05 Objectives

8
• Initial discussions for a new Guide to Terminal Planning began with a call for ‘White Papers’ in 2001.
• Industry professionals and leaders began making conceptual contributions.
• 43 FAA unpublished topic papers produced by 42 industry experts on the subject of airport passenger terminal.
Resource Base – FAA “White Papers”

9
• Aimed at the general airport planning and design industry
Guidebook is broad in scope with basic level of detail supplemented by detailed treatise on selected topics, for example, the development of facility requirements.
Guidebook attempts to bring into one location the various sources of information needed to plan a terminal, in particular, FAA AC references with typical information on how to get updates through the web.
The Guidebook is more of a “how to” approach based on the latest accepted practices as compared to research. Our approach was to provide “guidelines” as a point of departure from which various practicionaries can then impart their creativity.
Relevance to the Aviation Industry

10
19731973 2004200419751975 20102010
Terminal Planning Historical Documents

11
CHAPTER I: INTRODUCTIONCHAPTER II: THE TERMINAL PLANNING AND
DESIGN PROCESSCHAPTER III: PLANNING CONSIDERATIONSCHAPTER IV: FORECASTSCHAPTER V: TERMINAL AIRSIDE FACILITIESCHAPTER VI: TERMINAL BUILDING FACILITIESCHAPTER VII: TERMINAL LANDSIDE FACILITIESAPPENDICES
Guidebook Table of Contents

12
APPENDICESAPPENDIX A – CHECKLISTSAPPENDIX B – OTHER PERTINENT TRB STUDIESAPPENDIX C – FAA WHITE PAPERSAPPENDIX D – AIRCRAFT TYPES AND KEY DIMENSIONAL
CRITERIAAPPENDIX E – DIMENSIONS OF AIRLINE EQUIPMENTAPPENDIX F – REGULATIONSAPPENDIX G – ISSUES AND TRENDSAPPENDIX H – REFERENCESAPPENDIX I – ACRONYMSAPPENDIX J – GLOSSARYAPPENDIX K – QUICK REFERENCE GUIDE FOR
SPREADSHEET MODELS
Guidebook Table of Contents

13
CHAPTER 4: FORECASTS
1. Methodologies
2. Data Sources
3. Typically Forecasted Information
4. Peak Hour Demand Analysis
Chapter Highlights
Figure IV-1 is a chart that is created in the Peak Hour Determination model which is part of the companion set of models developed to work with the material in the guidebook.
Figure IV-1 is a chart that is created in the Peak Hour Determination model which is part of the companion set of models developed to work with the material in the guidebook.

14
Chapter Highlights
CHAPTER 5: TERMINAL AIRSIDE FACILITIES
1. Airside Planning Requirements
2. Terminal Apron Planning
3. Aircraft Gate Requirements
Chapter Highlights

15
CHAPTER 6: TERMINAL BUILDING FACILITIES
1. Terminal Planning and Design Considerations
2. Terminal Concept Development
3. Terminal Facility Requirements
4. Other Facility Considerations
Chapter Highlights
Figure VI-28 depicts a typical holdroom configuration.Figure VI-28 depicts a typical holdroom configuration.

16
• Created to supplement the learning and understanding of the planning principles in the Guidebook.
• Developed as simple Excel spreadsheet models for the purpose of learning basic planning principles as building blocks to more complex space programs.
• Developed in Excel 2003 and compatible with Excel 2000 or newer, and in Windows 2000 or newer and MAC OS.
Spreadsheet Model Contents:

17
Source: FAA White Paper – Considerations for Selecting a Terminal Configuration, David A. Daileda, FAIA
EDS/ETD
Bags Carts
FLOW
INT
1. Design Hour Determination
2. Gate Requirements
3. Curbside Requirements
4. Ticketing/ Check-in
5. Baggage Screening
6. Bag Make Up7. Security
Screening8. Holdrooms9. CBP/FIS10. Circulation11. Baggage Claim
Spreadsheet Model Contents:
11 models are presented in the spreadsheet program.11 models are presented in the spreadsheet program.

18
TABLE OF CONTENTSTabs for developing Demand Parameters
At any point you can jump to the User’s Guide
Tabs jump to the corresponding facility requirements models.
Special Tools – Use a simplified Queue model
and see examples of other Airports and their relative space and use
factorsComments are inserted in each model as necessary to better
explain background and decision making philosophy
Cells are color coded for easy identification, and non-input cells are locked with password protection to
prevent accidental formula loss.
Spreadsheet Model Highlights:

19
DATA CHECKLIST
Each sheet will have a “Return” button
In some cases a specified time period
of data will be suggested
Suggested source for needed data.
Spreadsheet Model Highlights:

20
DESIGN HOUR DETERMINATION
(1) Click the ‘RESET ALL INPUTS’ button to begin.
(2) Access the most recent OAG or Airport date for one entire week within the Peak Month and Input the Arrival and Departure operations and seats data into Cells D9 : G15 in the worksheet. This week should not contain any holidays.
(3) Input the date of the first day of the selected week and Select the first day of the month from the dropdown list in Cells B9 and C9 and the remaining cells will auto fill.
(4) Select a day of the sample week as the average day of the month that closely matches the average weekday. Use the % difference values in H9:J15 to help choose the average day. Avoid any holidays or other anomalies.
(5) Access the most recent OAG or Airport data for the Peak Month Average Day. This data will include 1) Origin or Destination, 2) Time of Departure or Arrival, 3) Seat Configuration, and 4) Published Carrier.
Input Data
(1) Click the ‘RESET ALL INPUTS’ button to begin.
(2) Access the most recent OAG or Airport date for one entire week within the Peak Month and Input the Arrival and Departure operations and seats data into Cells D9 : G15 in the worksheet. This week should not contain any holidays.
(3) Input the date of the first day of the selected week and Select the first day of the month from the dropdown list in Cells B9 and C9 and the remaining cells will auto fill.
(4) Select a day of the sample week as the average day of the month that closely matches the average weekday. Use the % difference values in H9:J15 to help choose the average day. Avoid any holidays or other anomalies.
(5) Access the most recent OAG or Airport data for the Peak Month Average Day. This data will include 1) Origin or Destination, 2) Time of Departure or Arrival, 3) Seat Configuration, and 4) Published Carrier.
Detailed instructions also provide specific needs and comments to keep
each step simple
Each tab follows the same
process: Reset, Input, Proceed
Spreadsheet Model Highlights:

21
(1) Click the ‘RESET ALL INPUTS’ button to clear input cells.
(2) Access the most recent forecast available to the airport and Input the Annual Enplanement Values in Cells C13:C17. If no recent or updated forecast exists at the airport, use the latest TAF forecast from the FAA.
(3) Input the desire or expected Peak Month Factors for the Forecast years into Cells B22:B26
(4) Input the number of Days in the Peak Month selected in Tab 1.
(5) Input the desired or expected Enplaned and Deplaned Design Hour Factors into Cells B41:B45 and D41:D45 respectively.
Input most recent forecast data
Choose peak month factor levels for forecast period
Choose percent of average day levels to
based on expectation of airport growth
Results are the Design Hour enplaning and
deplaning values to use in the other models
DESIGN HOUR DETERMINATION
Spreadsheet Model Highlights:

22
Rolling peak departing seats chart shows likely congestion periods for departing passengers
Summary of Departing Seats schedule
assessment
DESIGN HOUR DETERMINATION
Spreadsheet Model Highlights:

23
GATE DEMAND
Each model has a link to more information and
guidance in appropriate section of the User’s
GuideResets are used in some
spreadsheets to make starting over easier
Input existing and Forecast data
Check the comments to see the difference in approaches
Spreadsheet Model Highlights:

24
CHECK-IN/TICKETING Kiosk and Curbside check-in positions are determined in a similar fashion as are staffed
positions
The dashboard at the top of the spreadsheet tab
summarizes the number of determined positions and
some useful design factors
Space requirements associated with the number of positions are provided in
a Space Summary for Check-In
Spreadsheet Model Highlights:
25
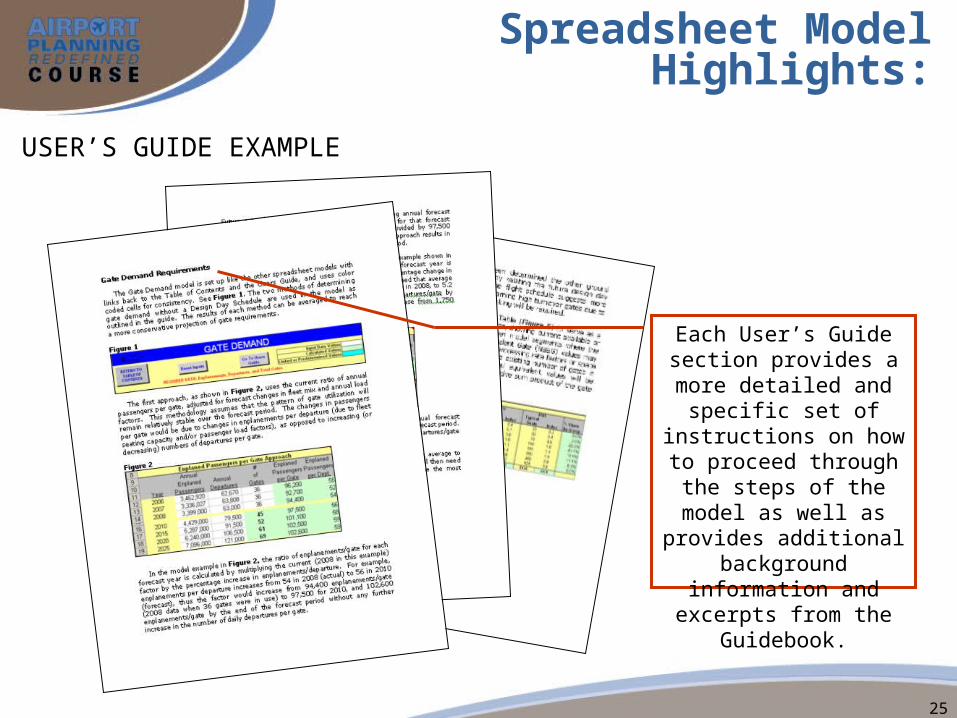
USER’S GUIDE EXAMPLE
Each User’s Guide section provides a more detailed and specific set of instructions on how to
proceed through the steps of the model as well
as provides additional background information and excerpts from the
Guidebook.
Spreadsheet Model Highlights:
