acs 2011 econimic financial - grupoacs.com · 6. on 30 june 2011 the acs group entered into an...
TRANSCRIPT

Economic and FinancialReport of ACS Group2011
Cover photo: La Bañeza’s Town Hall (León, Spain).

02 ANNUAL REPORT 2011 OF ACS GROUP ECONOMIC AND FINANCIAL REPORT
Economic and FinancialReport of ACS Group
03
04 Directors’ Report for the Consolidated Group for 2011 34 Consolidated Financial Statements 204 Auditors’ Report on Consolidated Financial Statements206 Historical Perfomance

04 ANNUAL REPORT 2011 OF ACS GROUP ECONOMIC AND FINANCIAL REPORT
Directors’ report for theConsolidated Group for 2011
01. Business performance of the ACS Group in 2011
01.01. Main events
In 2011 the ACS Group acquired a majority ownership interest in Hochtief, and accordingly its fi nancial statements have been fully consolidated since 1 June.
Against a very complicated economic and fi nancial backdrop, the Group increased its international activity signifi cantly, both through the integration of Hochtief and the organic growth of all its activities. In the United States, sales increased by 432.5%; in Mexico, sales grew by 5.7% and in Australia, EUR 7,291 million was contributed through Hochtief. On the contrary, domestic production in Spain dropped by 17.2%.
The decline in operating margins was mainly due to the incorporation of Hochtief, which contributed with lower margins in relation to its activities in Europe and North America.
The Group’s net profi t decreased by 26.7% in 2011, and included the capital gains on the sale of Abertis. Without taking into account the effect of this sale, the recurrent profi t of the ACS Group rose by 8.8%, in line with the goals established at the beginning of 2011. The ACS Group paid its shareholders dividends of EUR 2.05 per share with a charge to its profi t for 2010.
* Profi t after taxes and profi t from non-controlling interests not including exceptional results or profi t/loss from discontinued operations. Note: Data presented in accordance with ACS Group management criterion.
Key operating and fi nancial indicators
Millions of euros 2010 2011 Var.
Revenue 14,329 28,472 +98.7%
Backlog 27,603 66,152 +139.7%
Months 23 22
Operating Cash Flow (EBITDA) 1,432 2,318 +61.9%
Margin 10.0% 8.1%
Ordinary Operating Profi t (EBIT) 1,039 1,333 +28.3%
Margin 7.3% 4.7%
Ordinary Net Profi t from Continuing Operations* 875 951 +8.8%
Attributable Net Profi t 1,313 962 -26.7%
EPS 4.38 € 3.24 € -26.0%
Cash Flow from Operations 1,339 1,287 -3.9%
Net investments 2,317 2,902 +25.2%
Investments 5,099 4,755 -6.7%
Disposals 2,782 1,854 -33.4%
Total Net Debt 8,003 9,334 +16.6%
Net debt with recourse 957 3,369 +252%
Non-recourse fi nancing 7,047 5,965 -15.3%
05DIRECTORS’ REPORT FOR THE CONSOLIDATED GROUP FOR 2011
Funds generated by operating activities decreased by 3.9% compared to those generated in 2010. This fi gure includes a drop in working capital from operating activities basically due to the decrease in construction activity in Spain and the extraordinary effect of Leighton from Australia.
Investments included the acquisition of shares of Hochtief for EUR 1,080 million. Meanwhile, divestments included the sales of different concession assets and mining contracts concluded in the course of the year.
The total net debt of the ACS Group amounted to EUR 9,334 million, of which EUR 5,965 million related to non-recourse debt.
In 2011 several strategic decisions were made designed to strengthen fi nancial soundness, international expansion of the Group and the creation of value for the shareholder:
1. On 4 February 2011 ACS, Construction and Services Activities, S. A. completed the takeover bid for all the shares of Hochtief A.G. upon acquiring 2,805,599 shares of the German company, which accounted for 3.64% of its share capital.
2. On 10 February 2011 Residencial Monte Carmelo,S.A., fully owned by ACS, Actividades de Construcción y Servicios, S.A. and a holder of shares of Iberdrola, S.A. representing 6.19% of its capital, signed a fi nancing contract with a group of twenty fi nancial entities without recourse against the parent company, amounting to EUR 2,059 million for a term of three years beginning on 28 December 2011. On this date the ACS Group reduced its principal balance to EUR 1,661 million.
3. On 12 May 2011 the Annual General Meeting of Shareholders of Hochtief was held, in which the ACS Group held the majority of present votes. At this meeting a total of four directors were appointed from ACS, which accounts for half of the shareholder representatives on the Board. Later, in June, the ACS Group reported that its ownership interest in Hochtief, plus all the treasury shares of the German group, exceeded 50% of its share capital. Consequently, the fi nancial Statements of Hochtief were fully consolidated in the accounts of the ACS Group starting on 1 June 2011.
4. In June, the ACS Group renewed its “equity swap” contract over the shares of Iberdrola for EUR 2,430 million. Under this agreement, the same contract conditions were maintained and the contract was extended until March 2015.
5. Also in June 2011 the ACS Group reached an agreement with UBS, through its wholly owned company Corporate Funding S. L., for the expansion of its loan agreement to EUR 900 million for three years for the non-recourse fi nancing of the purchase of shares of Iberdrola.
6. On 30 June 2011 the ACS Group entered into an agreement with two companies controlled by the Funds RREEF Pan European Infrastructure Fund LP and by ANTIN Infrastructure Partners for the sale of 90% of its ownership interest in the companies owning the solar thermal power plants Andasol I and Andasol II. It also entered into an agreement with the Gas Natural Fenosa Group for the sale of its ownership interest in the companies owning fi ve wind-powered facilities, with a total capacity of 95.5 MW. The total enterprise value of these assets amounted to approximately EUR 950 million.
7. In August, the ACS Group entered into two agreements with various investment funds managed by Canepa Asset Management and Bridgepoint for the sale of 20 wind-powered facilities, with an installed power of 657 MW. The enterprise value of both transactions amounted to EUR 860 million. In the last quarter of 2011 the sale of fi ve of these facilities with a combined installed capacity of 159 MW was fi nalized.
06 ANNUAL REPORT 2011 OF ACS GROUP ECONOMIC AND FINANCIAL REPORT
Directors’ report for theConsolidated Group for 2011
8. On 27 October 2011, Cariátide, a company wholly owned by ACS, Actividades de Construcción y Servicios, S.A., entered into a contract with a syndicate of banks for the refi nancing until 24 July 2015, of the acquisition of the initial block of shares of Hochtief A.G. in April 2007. This syndicate loan amounts to EUR 602 million euros.
9. In December, the ACS Group completed the sale to a consortium led by Brookfi eld Asset Management of its ownership interest in the Chilean concession operators of the Vespucio Norte highway and the Tunnel of San Cristóbal, for a total price of EUR 216 million.
10. Additionally, in December 2011, the ACS Group closed the transaction with Teachers insurance and annuity Association of America for the sale of 50% of its ownership interest in the American concession operator of the I-595 highway, located in Broward County, Florida (USA) for a total enterprise value of EUR 588 million.
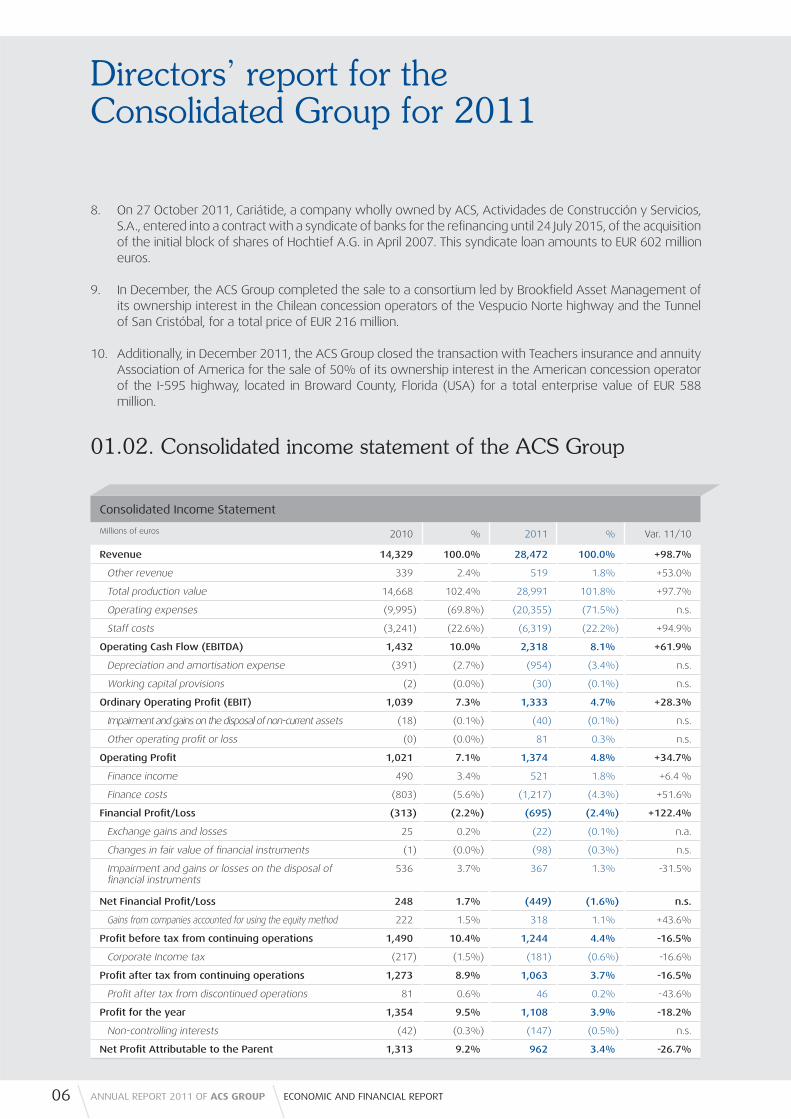
01.02. Consolidated income statement of the ACS Group
Consolidated Income Statement
Millions of euros 2010 % 2011 % Var. 11/10
Revenue 14,329 100.0% 28,472 100.0% +98.7%
Other revenue 339 2.4% 519 1.8% +53.0%
Total production value 14,668 102.4% 28,991 101.8% +97.7%
Operating expenses (9,995) (69.8%) (20,355) (71.5%) n.s.
Staff costs (3,241) (22.6%) (6,319) (22.2%) +94.9%
Operating Cash Flow (EBITDA) 1,432 10.0% 2,318 8.1% +61.9%
Depreciation and amortisation expense (391) (2.7%) (954) (3.4%) n.s.
Working capital provisions (2) (0.0%) (30) (0.1%) n.s.
Ordinary Operating Profi t (EBIT) 1,039 7.3% 1,333 4.7% +28.3%
Impairment and gains on the disposal of non-current assets (18) (0.1%) (40) (0.1%) n.s.
Other operating profi t or loss (0) (0.0%) 81 0.3% n.s.
Operating Profi t 1,021 7.1% 1,374 4.8% +34.7%
Finance income 490 3.4% 521 1.8% +6.4 %
Finance costs (803) (5.6%) (1,217) (4.3%) +51.6%
Financial Profi t/Loss (313) (2.2%) (695) (2.4%) +122.4%
Exchange gains and losses 25 0.2% (22) (0.1%) n.a.
Changes in fair value of fi nancial instruments (1) (0.0%) (98) (0.3%) n.s.
Impairment and gains or losses on the disposal of fi nancial instruments
536 3.7% 367 1.3% -31.5%
Net Financial Profi t/Loss 248 1.7% (449) (1.6%) n.s.
Gains from companies accounted for using the equity method 222 1.5% 318 1.1% +43.6%
Profi t before tax from continuing operations 1,490 10.4% 1,244 4.4% -16.5%
Corporate Income tax (217) (1.5%) (181) (0.6%) -16.6%
Profi t after tax from continuing operations 1,273 8.9% 1,063 3.7% -16.5%
Profi t after tax from discontinued operations 81 0.6% 46 0.2% -43.6%
Profi t for the year 1,354 9.5% 1,108 3.9% -18.2%
Non-controlling interests (42) (0.3%) (147) (0.5%) n.s.
Net Profi t Attributable to the Parent 1,313 9.2% 962 3.4% -26.7%

07DIRECTORS’ REPORT FOR THE CONSOLIDATED GROUP FOR 2011
01.02.01. Revenue and portfolio
The revenue of the ACS Group includes the contribution of EUR 14,882 million by Hochtief, relating to the seven month period from the date of its full consolidation in June of 2011 and inclusion in construction activity.
This amount does not include the sales and portfolio of Clece in both years since this company was included in the Group’s fi nancial statements as a discontinued activity due to the fact that it is in the process of being sold.
Sales by geographical area show the diversifi cation of the Group’s income sources, which are distributed very similarly between Europe, America and Asia Pacifi c.
By geographical area, in addition to the inclusion of the business activity of Hochtief in the rest of Europe, Australia and North America, noteworthy was the growth in Industrial Services in America, and particularly Mexico and Brazil. In Spain the counter-cyclical nature of Environment and Industrial Maintenance activities remained unchanged, while Construction and Industrial Projects dropped due to the general decline in investment activity.
The portfolio includes EUR 40,486 million from Hochtief, of which almost three-quarters relate to activity in Australia.
Sales by Geographical Area (excluding eliminations between activity areas)
Millions of euros Construction Environment Industrial Services
2010 2011 Var. 11/10 2010 2011 Var. 11/10 2010 2011 Var. 11/10
Spain 3,780 2,943 -22.1% 1,227 1,278 +4.1% 4,483 3,662 -18.3%
Rest of Europe 656 2,456 +274.4% 118 208 +75.9% 410 682 +66.3%
America 1,259 5,345 +324.5% 118 126 +6.9% 1,899 2,348 +23.7%
Asia Pacifi c 8 9,056 n.s. 1 26 n.s. 271 224 -17.2%
Rest of the world 1 2 n.s. 46 49 +5.6% 95 128 +35.0%
Total 5,703 19,802 +247.2% 1,511 1,686 +11.6% 7,158 7,045 -1.6%
Sales by Geographical Area
Millions of euros 2010 % 2011 % Var. 11/10
Spain 9,447 65.9% 7,823 27.5% -17.2%
Rest of Europe 1,185 8.3% 3,345 11.7% +182.3%
America 3,275 22.9% 7,819 27.5% +138.7%
Asia Pacifi c 280 2.0% 9,306 32.7% n.s.
Rest of the world 142 1.0% 179 0.6% +26.6%
Total 14,329 28,472 +98.7%

08 ANNUAL REPORT 2011 OF ACS GROUP ECONOMIC AND FINANCIAL REPORT
Directors’ report for theConsolidated Group for 2011
By geographical area, noteworthy once again was Industrial Services in America, with a portfolio that grows more than proportionally to sales, which will have a positive effect on this line of business in the coming years.
01.02.02. Gross profi t and loss from operations
The drop in margins in 2011 was primarily due to the inclusion of the business activity of Hochtief, which has profi t margins below the average for the rest of the Group.
Portfolio by Geographical Area
Millions of euros 2010 % 2011 % Var. 11/10
Spain 15,402 55.8% 12,645 19.1% -17.9%
Rest of Europe 5,444 19.7% 10,392 15.7% +90.9%
America 5,718 20.7% 14,415 21.8% +152.1%
Asia Pacifi c 785 2.8% 28,357 42.9% n.s.
Rest of the World 253 0.9% 344 0.5% +35.9%
Total 27,602 66,152 +139.7%
Portfolio by Geographical areas and Line of Business
Millions of euros Construction Environment Industrial Services
2010 2011 Var. 11/10 2010 2011 Var. 11/10 2010 2011 Var. 11/10
Spain 5,710 4,311 -24.5% 6,236 5,629 -9.7% 3,457 2,705 -21.8%
Rest of Europe 2,241 7,204 +221.5% 2,399 2,321 -3.3% 803 867 +7.9%
America 3,137 11,185 +256.5% 401 370 -7.9% 2,180 2,860 +31.2%
Asia Pacifi c 0 27,636 n.s. 505 479 -5.1% 280 241 -13.7%
Rest of the World 0 0 n.a. 127 142 +11.4% 127 202 +58.5%
Total 11,087 50,336 +354.0% 9,669 8,941 -7.5% 6,846 6,875 +0.4%
Net profi t and loss from operations
Millions of euros 2010 2011 Var. 11/10
Operating Cash Flow (EBITDA) 1,432 2,318 +61.9%
EBITDA margin 10.0% 8.1%
Depreciation and amortisation expense (391) (954) +144.2%
Construction (105) (765) +628.8%
Industrial Services (179) (54) -69.7%
Environment (105) (133) +26.5%
Corporate Unit (1) (1) +3.1%
Working capital provisions (2) (30) n.s.
Ordinary Operating Profi t (EBIT) 1,039 1,333 +28.3%
EBIT Margin 7.3% 4.7%

The signifi cant increase in the depreciation and amortisation expense was due to the incorporation of Hochtief, whose subsidiary Leighton carries out highly capital intensive activities relating to mining contracts. This increase was also due to the amortisation of a greater value of certain assets as a result of purchase price allocation (PPA).
On the other hand, there was a decrease in depreciation and amortisation expenses incurred by Industrial Services as a result of the sale of renewable energy and energy concession assets. The increase in the Environment area’s depreciation and amortisation was due to the growth of the waste treatment line of business, which has a larger capital component than the other urban services.
01.02.03. Net Financial profi t/loss
Finance costs rose by 51.6% as compared to the costs incurred in 2010 primarily due to the following:
There was an increase in debt as a result of the full consolidation of Hochtief beginning on 1 June, which gave rise to fi nance costs amounting to EUR 167 million. The gross debt of the German group amounted to EUR 3,847 million, while the net debt stood at EUR 990 million at the end of 2011.
Large-scale investment in the past 18 months, including:
• Increase in the ownership interest in Iberdrola at the end of 2010, which currently accounts for 18.55% of the share capital of the electric utility and which led to an increase in fi nance costs of EUR 85 million.
• The increase in the ownership interest in Hochtief in 2011, which was increased in the early months of the fi nancial year in order to reach a majority shareholding at the General Meeting of Shareholders held in May, after having invested EUR 1,080 million.
The fi nance income recognised increased by 6.4%. This fi gure includes the dividends paid by the electricity utility amounting to EUR 373 million, net of the adjustment of EUR 180 million made following the principle of prudence to offset the net contribution of Iberdrola to the profi t/loss for the year.
Net Financial profi t/loss
Millions of euros 2010 2011 Var. 11/10
Finance income 490 521 +6.4%
Finance costs (803) (1,217) +51.6%
Financial Profi t/Loss (313) (695) +122.4%
Construction (142) (245) +72.8%
Industrial Services (121) (183) +51.1%
Environment (47) (59) +24.2%
Corporate Unit (2) (209) n.a.
09DIRECTORS’ REPORT FOR THE CONSOLIDATED GROUP FOR 2011
10 ANNUAL REPORT 2011 OF ACS GROUP ECONOMIC AND FINANCIAL REPORT
Directors’ report for theConsolidated Group for 2011
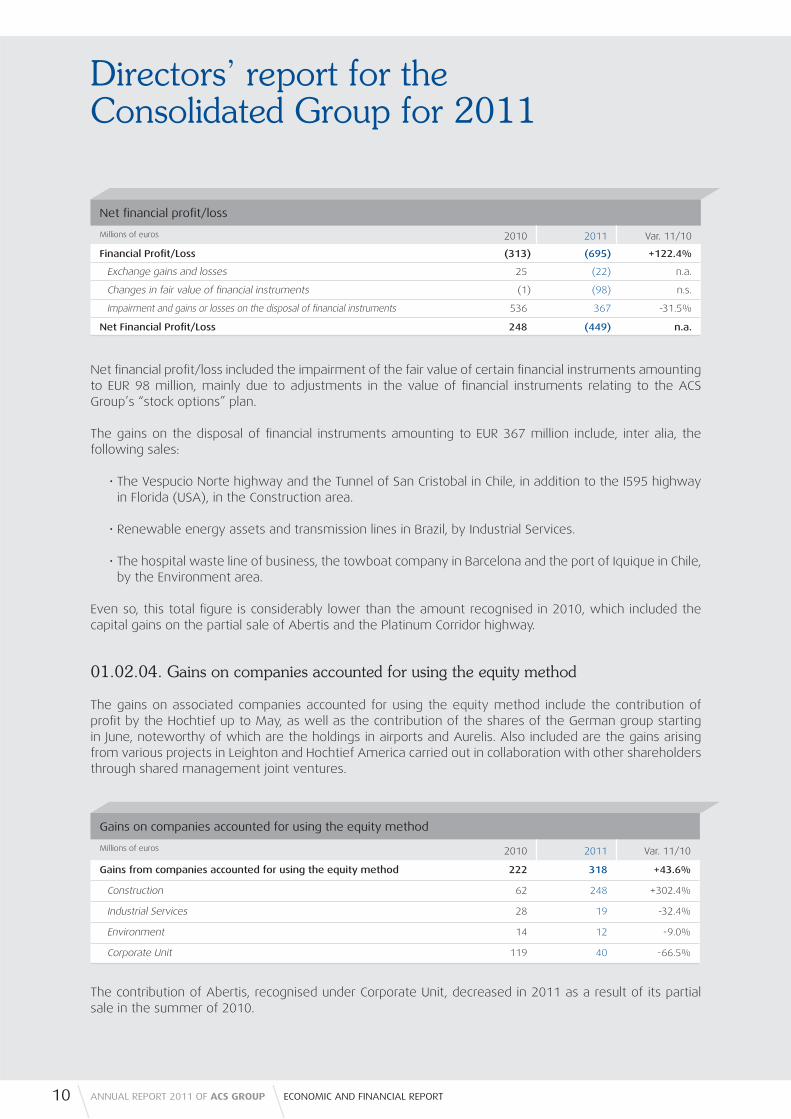
The contribution of Abertis, recognised under Corporate Unit, decreased in 2011 as a result of its partial sale in the summer of 2010.
Net fi nancial profi t/loss included the impairment of the fair value of certain fi nancial instruments amounting to EUR 98 million, mainly due to adjustments in the value of fi nancial instruments relating to the ACS Group’s “stock options” plan.
The gains on the disposal of fi nancial instruments amounting to EUR 367 million include, inter alia, the following sales:
• The Vespucio Norte highway and the Tunnel of San Cristobal in Chile, in addition to the I595 highway in Florida (USA), in the Construction area.
• Renewable energy assets and transmission lines in Brazil, by Industrial Services.
• The hospital waste line of business, the towboat company in Barcelona and the port of Iquique in Chile, by the Environment area.
Even so, this total fi gure is considerably lower than the amount recognised in 2010, which included the capital gains on the partial sale of Abertis and the Platinum Corridor highway.
01.02.04. Gains on companies accounted for using the equity method
The gains on associated companies accounted for using the equity method include the contribution of profi t by the Hochtief up to May, as well as the contribution of the shares of the German group starting in June, noteworthy of which are the holdings in airports and Aurelis. Also included are the gains arising from various projects in Leighton and Hochtief America carried out in collaboration with other shareholders through shared management joint ventures.
Net fi nancial profi t/loss
Millions of euros 2010 2011 Var. 11/10
Financial Profi t/Loss (313) (695) +122.4%
Exchange gains and losses 25 (22) n.a.
Changes in fair value of fi nancial instruments (1) (98) n.s.
Impairment and gains or losses on the disposal of fi nancial instruments 536 367 -31.5%
Net Financial Profi t/Loss 248 (449) n.a.
Gains on companies accounted for using the equity method
Millions of euros 2010 2011 Var. 11/10
Gains from companies accounted for using the equity method 222 318 +43.6%
Construction 62 248 +302.4%
Industrial Services 28 19 -32.4%
Environment 14 12 -9.0%
Corporate Unit 119 40 -66.5%
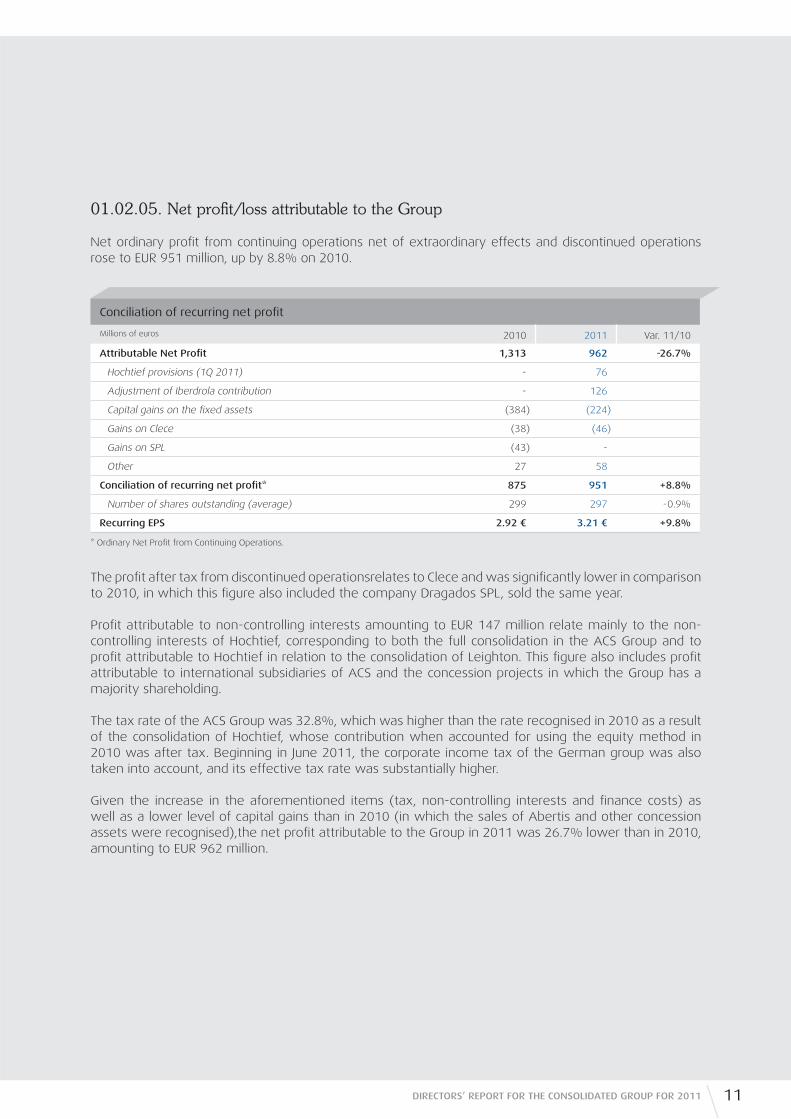
01.02.05. Net profi t/loss attributable to the Group
Net ordinary profi t from continuing operations net of extraordinary effects and discontinued operations rose to EUR 951 million, up by 8.8% on 2010.
Conciliation of recurring net profi t
Millions of euros 2010 2011 Var. 11/10
Attributable Net Profi t 1,313 962 -26.7%
Hochtief provisions (1Q 2011) - 76
Adjustment of Iberdrola contribution - 126
Capital gains on the fi xed assets (384) (224)
Gains on Clece (38) (46)
Gains on SPL (43) -
Other 27 58
Conciliation of recurring net profi t* 875 951 +8.8%
Number of shares outstanding (average) 299 297 -0.9%
Recurring EPS 2.92 € 3.21 € +9.8%
* Ordinary Net Profi t from Continuing Operations.
The profi t after tax from discontinued operationsrelates to Clece and was signifi cantly lower in comparison to 2010, in which this fi gure also included the company Dragados SPL, sold the same year.
Profi t attributable to non-controlling interests amounting to EUR 147 million relate mainly to the non-controlling interests of Hochtief, corresponding to both the full consolidation in the ACS Group and to profi t attributable to Hochtief in relation to the consolidation of Leighton. This fi gure also includes profi t attributable to international subsidiaries of ACS and the concession projects in which the Group has a majority shareholding.
The tax rate of the ACS Group was 32.8%, which was higher than the rate recognised in 2010 as a result of the consolidation of Hochtief, whose contribution when accounted for using the equity method in 2010 was after tax. Beginning in June 2011, the corporate income tax of the German group was also taken into account, and its effective tax rate was substantially higher.
Given the increase in the aforementioned items (tax, non-controlling interests and fi nance costs) as well as a lower level of capital gains than in 2010 (in which the sales of Abertis and other concession assets were recognised),the net profi t attributable to the Group in 2011 was 26.7% lower than in 2010, amounting to EUR 962 million.
11DIRECTORS’ REPORT FOR THE CONSOLIDATED GROUP FOR 2011
12 ANNUAL REPORT 2011 OF ACS GROUP ECONOMIC AND FINANCIAL REPORT
Directors’ report for theConsolidated Group for 2011
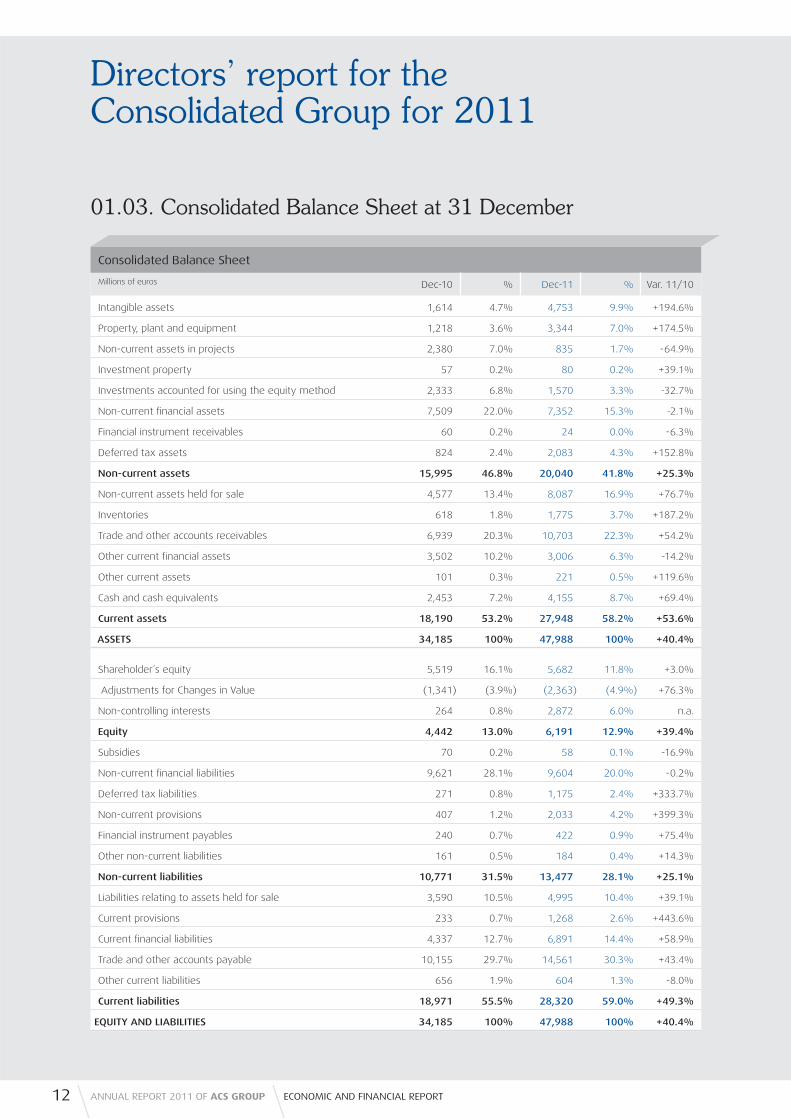
Consolidated Balance Sheet
Millions of euros Dec-10 % Dec-11 % Var. 11/10
Intangible assets 1,614 4.7% 4,753 9.9% +194.6%
Property, plant and equipment 1,218 3.6% 3,344 7.0% +174.5%
Non-current assets in projects 2,380 7.0% 835 1.7% -64.9%
Investment property 57 0.2% 80 0.2% +39.1%
Investments accounted for using the equity method 2,333 6.8% 1,570 3.3% -32.7%
Non-current fi nancial assets 7,509 22.0% 7,352 15.3% -2.1%
Financial instrument receivables 60 0.2% 24 0.0% -6.3%
Deferred tax assets 824 2.4% 2,083 4.3% +152.8%
Non-current assets 15,995 46.8% 20,040 41.8% +25.3%
Non-current assets held for sale 4,577 13.4% 8,087 16.9% +76.7%
Inventories 618 1.8% 1,775 3.7% +187.2%
Trade and other accounts receivables 6,939 20.3% 10,703 22.3% +54.2%
Other current fi nancial assets 3,502 10.2% 3,006 6.3% -14.2%
Other current assets 101 0.3% 221 0.5% +119.6%
Cash and cash equivalents 2,453 7.2% 4,155 8.7% +69.4%
Current assets 18,190 53.2% 27,948 58.2% +53.6%
ASSETS 34,185 100% 47,988 100% +40.4%
Shareholder´s equity 5,519 16.1% 5,682 11.8% +3.0%
Adjustments for Changes in Value (1,341) (3.9%) (2,363) (4.9%) +76.3%
Non-controlling interests 264 0.8% 2,872 6.0% n.a.
Equity 4,442 13.0% 6,191 12.9% +39.4%
Subsidies 70 0.2% 58 0.1% -16.9%
Non-current fi nancial liabilities 9,621 28.1% 9,604 20.0% -0.2%
Deferred tax liabilities 271 0.8% 1,175 2.4% +333.7%
Non-current provisions 407 1.2% 2,033 4.2% +399.3%
Financial instrument payables 240 0.7% 422 0.9% +75.4%
Other non-current liabilities 161 0.5% 184 0.4% +14.3%
Non-current liabilities 10,771 31.5% 13,477 28.1% +25.1%
Liabilities relating to assets held for sale 3,590 10.5% 4,995 10.4% +39.1%
Current provisions 233 0.7% 1,268 2.6% +443.6%
Current fi nancial liabilities 4,337 12.7% 6,891 14.4% +58.9%
Trade and other accounts payable 10,155 29.7% 14,561 30.3% +43.4%
Other current liabilities 656 1.9% 604 1.3% -8.0%
Current liabilities 18,971 55.5% 28,320 59.0% +49.3%
EQUITY AND LIABILITIES 34,185 100% 47,988 100% +40.4%
01.03. Consolidated Balance Sheet at 31 December
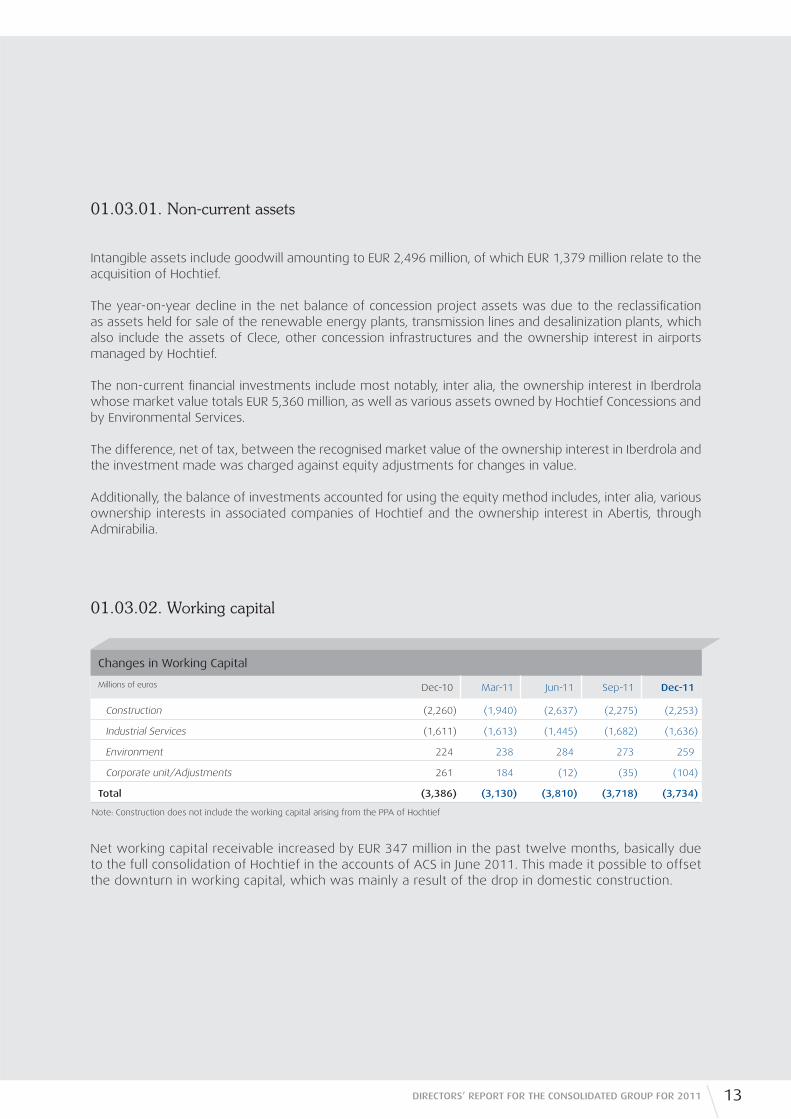
01.03.01. Non-current assets
01.03.02. Working capital
Intangible assets include goodwill amounting to EUR 2,496 million, of which EUR 1,379 million relate to the acquisition of Hochtief.
The year-on-year decline in the net balance of concession project assets was due to the reclassifi cation as assets held for sale of the renewable energy plants, transmission lines and desalinization plants, which also include the assets of Clece, other concession infrastructures and the ownership interest in airports managed by Hochtief.
The non-current fi nancial investments include most notably, inter alia, the ownership interest in Iberdrola whose market value totals EUR 5,360 million, as well as various assets owned by Hochtief Concessions and by Environmental Services.
The difference, net of tax, between the recognised market value of the ownership interest in Iberdrola and the investment made was charged against equity adjustments for changes in value.
Additionally, the balance of investments accounted for using the equity method includes, inter alia, various ownership interests in associated companies of Hochtief and the ownership interest in Abertis, through Admirabilia.
Changes in Working Capital
Millions of euros Dec-10 Mar-11 Jun-11 Sep-11 Dec-11
Construction (2,260) (1,940) (2,637) (2,275) (2,253)
Industrial Services (1,611) (1,613) (1,445) (1,682) (1,636)
Environment 224 238 284 273 259
Corporate unit/Adjustments 261 184 (12) (35) (104)
Total (3,386) (3,130) (3,810) (3,718) (3,734)
Note: Construction does not include the working capital arising from the PPA of Hochtief
Net working capital receivable increased by EUR 347 million in the past twelve months, basically due to the full consolidation of Hochtief in the accounts of ACS in June 2011. This made it possible to offset the downturn in working capital, which was mainly a result of the drop in domestic construction.
13DIRECTORS’ REPORT FOR THE CONSOLIDATED GROUP FOR 2011

14 ANNUAL REPORT 2011 OF ACS GROUP ECONOMIC AND FINANCIAL REPORT
Directors’ report for theConsolidated Group for 2011
Net borrowings
Millions of euros
Construction EnvironmentIndustrial Services
Corporate unit/Adjustments
ACS Group
Long-term bonds and debentures 723 - - - 723
Short-term bonds and debentures 46 - - - 46
Bonds and Debentures 769 - - - 769
Non-current bank borrowings 2,170 96 172 85 2,523
Current bank borrowings 1,642 1,178 582 2,689 6,091
Bank borrowings 3,812 1,274 754 2,774 8,614
Other non-current fi nancial liabilities 989 11 31 (561) 470
Other current fi nancial liabilities 982 157 11 (474) 676
Other fi nancial liabilities 1,971 168 42 (1,035) 1,147
Cash and cash equivalents 4,875 513 1,677 97 7,161
Net Debt / (Cash) 1,677 929 (880) 1,642 3,369
Non-current non-recourse fi nancing 742 170 35 4,941 5,888
Current non-recourse fi nancing 23 24 10 21 77
Non-recourse fi nancing 764 194 45 4,962 5,965
Net Borrowings 2,442 1,124 (835) 6,604 9,334
Note: Construction including Dragados, Hochtief and Iridium, as well as the acquisition debt of Hochtief (EUR 1.618 mn).
The total net debt of the ACS Group, which at the end of the reporting period amounted to EUR 9,334 million, is mainly composed of the following items:
• EUR 4,962 million of non-recourse debt included in the vehicles created for the acquisition of ACS’s ownership interest in Iberdrola, which currently amounts to 18.55% of its capital.
• The remainder of the Group’s non-recourse debt amounting to EUR 1,004 million, relates to various operating activity concession projects as well as non-recourse fi nancing arranged for the initial acquisition of Hochtief.
• Net recourse debt relating to operational activities amounted to EUR 1,726 million, of which EUR 990 million arose from Hochtief.
The net recourse debt relating to the corporate unit amounted to EUR 1,642 million, noteworthy being the syndicated loan recently refi nanced until July 2015 for an amount of EUR 1,411 million.
Changes in cash
Millions of euros Dec-10 Mar-11 Jun-11 Sep-11 Dec-11
Gross recourse debt 6,911 6,607 9,704 10,159 10,530
Gross non-recourse debt 7,047 7,154 7,739 7,098 5,966
Gross Borrowings 13,958 13,761 17,442 17,257 16,496
Cash and cash equivalents 5,955 4,958 7,593 7,558 7,161
Net Borrowings 8,003 8,803 9,849 9,699 9,334
Hochtief AG - - 710 766 990
ACS (ex Hochtief) 8,003 8,803 9,139 8,932 8,344

Net debt relating to concession projects held for sale (renewable assets, transmission lines, desalination plants, concessions and Clece) amounted to EUR 3,723 million, and has been reclassifi ed under assets and liabilities held for sale in the consolidated balance sheet of the Group at the end of the reporting period until the completion of their respective sales processes.
01.03.03. Equity
This amount includes EUR 2,363 million arising from adjustments for changes in value, mainly due to the performance of the market price of Iberdrola shares, which amounted to EUR 1,791 million, and the effect of exchange rates. The year-on-year increase in the adjustment for changes in value relating to Iberdrola amounted to EUR 595 million.
The signifi cant increase in the balance of non-controlling interests was due to the full consolidation of Hochtief beginning on 1 June 2011, and includes both the holdings of the minority shareholders of Hochtief as well as its non-controlling interests included in the balance sheet of the German company, and mainly relating to the minority shareholders of Leighton Holdings.
01.03.04. Net Cash fl ows
Equity
Millions of euros Dec-10 Dec-11 Var. 11/10
Shareholders´ Equity 5,519 5,682 +3.0%
Adjustments for Changes in Value (1,341) (2,363) +76.3%
Non-controlling interests 264 2,872 n.a.
Equity 4,442 6,191 +39.4%
Net Cash fl ows
Millions of euros 2010 2011 Var. 11/10
Net profi t 1,313 962 -26.7%
Adjustments to profi t/loss not giving rise to operating cash fl ows (177) 1,210
Cash fl ows from operating activities net of working capital 1,135 2,172 +91.3%
Changes in operating working capital 203 (885)
Net cash fl ows from operating activities 1,339 1,287 -3.9%
1. Investment payables (4,854) (4,417)
2. Divestment receivables 2,784 1,691
Net cash fl ows from investing activities (2,069) (2,725) +31.7%
1. Purchase of treasury shares (333) (255)
2. Dividends payable (618) (614)
3. Other adjustments (74) 90
Other cash fl ows (1,025) (779) -24.0%
Cash generated / (used) (1,755) (2,217) +26.3%
15DIRECTORS’ REPORT FOR THE CONSOLIDATED GROUP FOR 2011
16 ANNUAL REPORT 2011 OF ACS GROUP ECONOMIC AND FINANCIAL REPORT
Directors’ report for theConsolidated Group for 2011
The changes in the Group’s working capital gave rise to a cash outfl ow of EUR 885 million, which was signifi cantly higher than in the same period of the previous year and basically related to Construction activity, both by Dragados and by Hochtief in the last seven months of the year. The full consolidation of Hochtief made it possible to offset this effect.
Net borrowings recognised on the balance sheet increased by EUR 1,331 million in 2011; the difference compared to the fi gure recognised in this statement of cash fl ows being mainly due to the full consolidation of Hochtief and the changes in non-recourse fi nancing for the assets held for sale since December 2010.
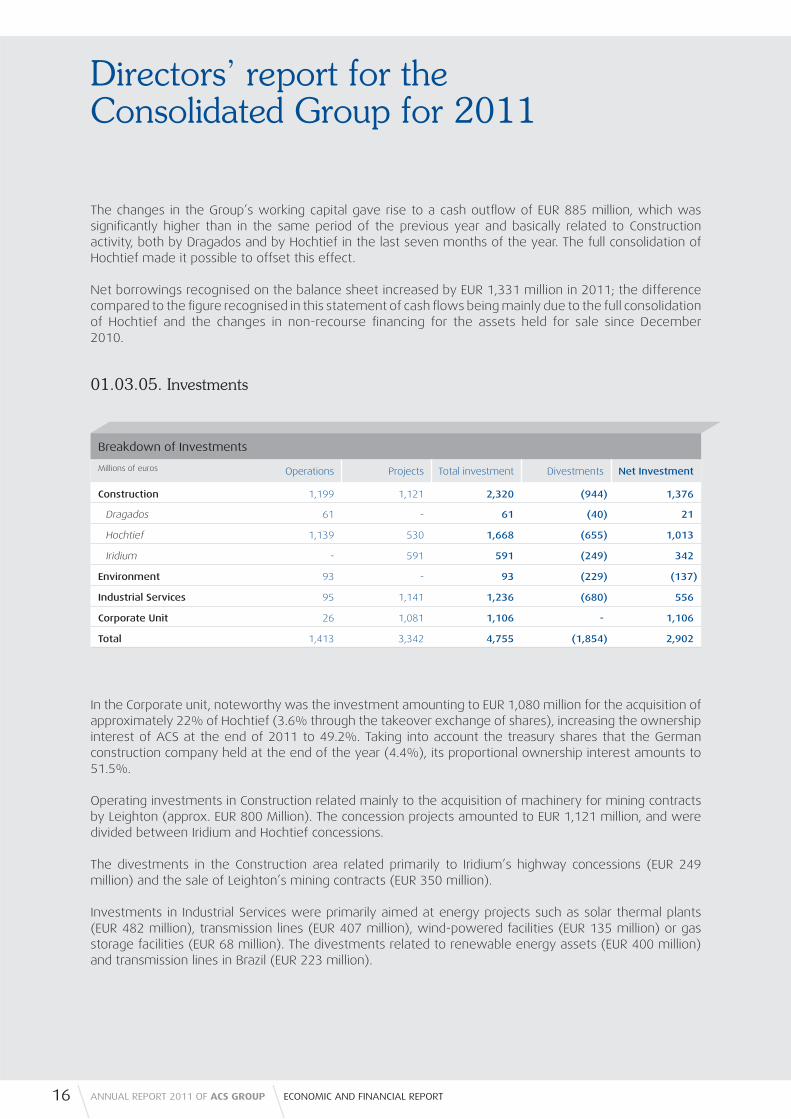
01.03.05. Investments
In the Corporate unit, noteworthy was the investment amounting to EUR 1,080 million for the acquisition of approximately 22% of Hochtief (3.6% through the takeover exchange of shares), increasing the ownership interest of ACS at the end of 2011 to 49.2%. Taking into account the treasury shares that the German construction company held at the end of the year (4.4%), its proportional ownership interest amounts to 51.5%.
Operating investments in Construction related mainly to the acquisition of machinery for mining contracts by Leighton (approx. EUR 800 Million). The concession projects amounted to EUR 1,121 million, and were divided between Iridium and Hochtief concessions.
The divestments in the Construction area related primarily to Iridium’s highway concessions (EUR 249 million) and the sale of Leighton’s mining contracts (EUR 350 million).
Investments in Industrial Services were primarily aimed at energy projects such as solar thermal plants (EUR 482 million), transmission lines (EUR 407 million), wind-powered facilities (EUR 135 million) or gas storage facilities (EUR 68 million). The divestments related to renewable energy assets (EUR 400 million) and transmission lines in Brazil (EUR 223 million).
Breakdown of Investments
Millions of euros Operations Projects Total investment Divestments Net Investment
Construction 1,199 1,121 2,320 (944) 1,376
Dragados 61 - 61 (40) 21
Hochtief 1,139 530 1,668 (655) 1,013
Iridium - 591 591 (249) 342
Environment 93 - 93 (229) (137)
Industrial Services 95 1,141 1,236 (680) 556
Corporate Unit 26 1,081 1,106 - 1,106
Total 1,413 3,342 4,755 (1,854) 2,902

17DIRECTORS’ REPORT FOR THE CONSOLIDATED GROUP FOR 2011
01.03.06. Net cash fl ows from fi nancing activities
The fi nancing needs of the Group, including an increase in debt relating to assets held for sale, rose to EUR 2,217 million as a result of the heavy volume of investments.
In 2011 the Group paid its shareholders dividends of EUR 614 million with a charge against profi t for 2010, equivalent to EUR 2.05 per share.
Transactions with treasury shares entered into by the Group in the year led to a net cash outfl ow of EUR 255 million. Treasury shares held by ACS at 31 December 2011 stood at 7.5% of its share capital.
01.04. Performance of Business areas
01.04.01. Construction
Total Construction sales in 2011 reached EUR 19,802 million. This fi gure takes into account the activity of all construction companies in ACS worldwide, including the contribution of Hochtief from the date of its full consolidation on 1 June 2011, and Iridium, the ACS Group’s Concession activity.
The Construction area’s EBITDA margin dropped to 6.1 per cent as a result of the incorporation of Hochtief, which contributed an EBITDA margin of 5.3% to the ACS Group’s profi t and loss.
Key operating and fi nancial indicators
Millions of euros 2010 2011 Var.
Sales 5,703 19,802 +247.2%
EBITDA 427 1,210 +183.4%
Margin 7.5% 6.1%
EBIT 343 449 +30.8%
Margin 6.0% 2.3%
Net Profi t 187 370 +97.5%
Margin 3.3% 1.9%
Backlog 11,088 50,336 +354.0%
Months 24 22
Net investments 747 1,376 +84.3%
Concessions (Gross) 729 1,121
Working capital (2,260) (2,253) -0.3%
Net debt 1,221 2,442 +99.9%
ND/EBITDA 2.9x 2.0x
18 ANNUAL REPORT 2011 OF ACS GROUP ECONOMIC AND FINANCIAL REPORT
Directors’ report for theConsolidated Group for 2011
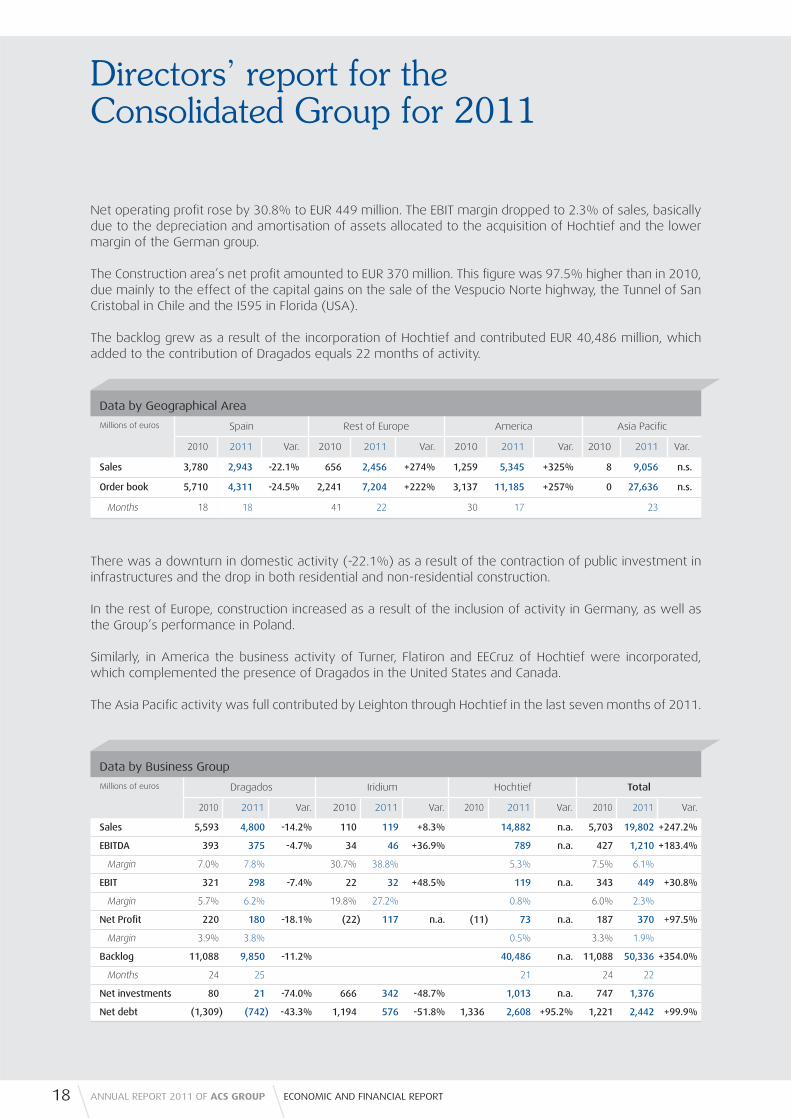
Net operating profi t rose by 30.8% to EUR 449 million. The EBIT margin dropped to 2.3% of sales, basically due to the depreciation and amortisation of assets allocated to the acquisition of Hochtief and the lower margin of the German group.
The Construction area’s net profi t amounted to EUR 370 million. This fi gure was 97.5% higher than in 2010, due mainly to the effect of the capital gains on the sale of the Vespucio Norte highway, the Tunnel of San Cristobal in Chile and the I595 in Florida (USA).
The backlog grew as a result of the incorporation of Hochtief and contributed EUR 40,486 million, which added to the contribution of Dragados equals 22 months of activity.
There was a downturn in domestic activity (-22.1%) as a result of the contraction of public investment in infrastructures and the drop in both residential and non-residential construction.
In the rest of Europe, construction increased as a result of the inclusion of activity in Germany, as well as the Group’s performance in Poland.
Similarly, in America the business activity of Turner, Flatiron and EECruz of Hochtief were incorporated, which complemented the presence of Dragados in the United States and Canada.
The Asia Pacifi c activity was full contributed by Leighton through Hochtief in the last seven months of 2011.
Data by Geographical Area
Millions of euros Spain Rest of Europe America Asia Pacifi c
2010 2011 Var. 2010 2011 Var. 2010 2011 Var. 2010 2011 Var.
Sales 3,780 2,943 -22.1% 656 2,456 +274% 1,259 5,345 +325% 8 9,056 n.s.
Order book 5,710 4,311 -24.5% 2,241 7,204 +222% 3,137 11,185 +257% 0 27,636 n.s.
Months 18 18 41 22 30 17 23
Data by Business Group
Millions of euros Dragados Iridium Hochtief Total
2010 2011 Var. 2010 2011 Var. 2010 2011 Var. 2010 2011 Var.
Sales 5,593 4,800 -14.2% 110 119 +8.3% 14,882 n.a. 5,703 19,802 +247.2%
EBITDA 393 375 -4.7% 34 46 +36.9% 789 n.a. 427 1,210 +183.4%
Margin 7.0% 7.8% 30.7% 38.8% 5.3% 7.5% 6.1%
EBIT 321 298 -7.4% 22 32 +48.5% 119 n.a. 343 449 +30.8%
Margin 5.7% 6.2% 19.8% 27.2% 0.8% 6.0% 2.3%
Net Profi t 220 180 -18.1% (22) 117 n.a. (11) 73 n.a. 187 370 +97.5%
Margin 3.9% 3.8% 0.5% 3.3% 1.9%
Backlog 11,088 9,850 -11.2% 40,486 n.a. 11,088 50,336 +354.0%
Months 24 25 21 24 22
Net investments 80 21 -74.0% 666 342 -48.7% 1,013 n.a. 747 1,376
Net debt (1,309) (742) -43.3% 1,194 576 -51.8% 1,336 2,608 +95.2% 1,221 2,442 +99.9%
19DIRECTORS’ REPORT FOR THE CONSOLIDATED GROUP FOR 2011
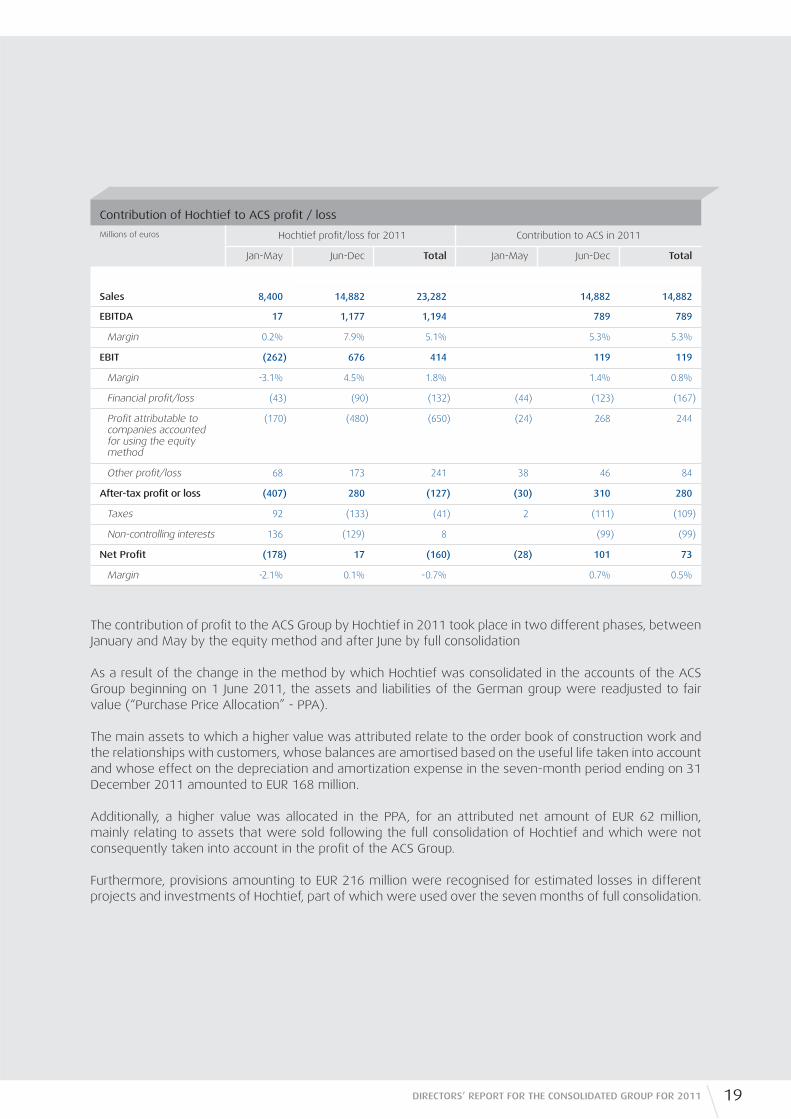
The contribution of profi t to the ACS Group by Hochtief in 2011 took place in two different phases, between January and May by the equity method and after June by full consolidation
As a result of the change in the method by which Hochtief was consolidated in the accounts of the ACS Group beginning on 1 June 2011, the assets and liabilities of the German group were readjusted to fair value (“Purchase Price Allocation” - PPA).
The main assets to which a higher value was attributed relate to the order book of construction work and the relationships with customers, whose balances are amortised based on the useful life taken into account and whose effect on the depreciation and amortization expense in the seven-month period ending on 31 December 2011 amounted to EUR 168 million.
Additionally, a higher value was allocated in the PPA, for an attributed net amount of EUR 62 million, mainly relating to assets that were sold following the full consolidation of Hochtief and which were not consequently taken into account in the profi t of the ACS Group.
Furthermore, provisions amounting to EUR 216 million were recognised for estimated losses in different projects and investments of Hochtief, part of which were used over the seven months of full consolidation.
Contribution of Hochtief to ACS profi t / loss
Millions of euros Hochtief profi t/loss for 2011 Contribution to ACS in 2011
Jan-May Jun-Dec Total Jan-May Jun-Dec Total
Sales 8,400 14,882 23,282 14,882 14,882
EBITDA 17 1,177 1,194 789 789
Margin 0.2% 7.9% 5.1% 5.3% 5.3%
EBIT (262) 676 414 119 119
Margin -3.1% 4.5% 1.8% 1.4% 0.8%
Financial profi t/loss (43) (90) (132) (44) (123) (167)
Profi t attributable to companies accounted for using the equity method
(170) (480) (650) (24) 268 244
Other profi t/loss 68 173 241 38 46 84
After-tax profi t or loss (407) 280 (127) (30) 310 280
Taxes 92 (133) (41) 2 (111) (109)
Non-controlling interests 136 (129) 8 (99) (99)
Net Profi t (178) 17 (160) (28) 101 73
Margin -2.1% 0.1% -0.7% 0.7% 0.5%
20 ANNUAL REPORT 2011 OF ACS GROUP ECONOMIC AND FINANCIAL REPORT
Directors’ report for theConsolidated Group for 2011
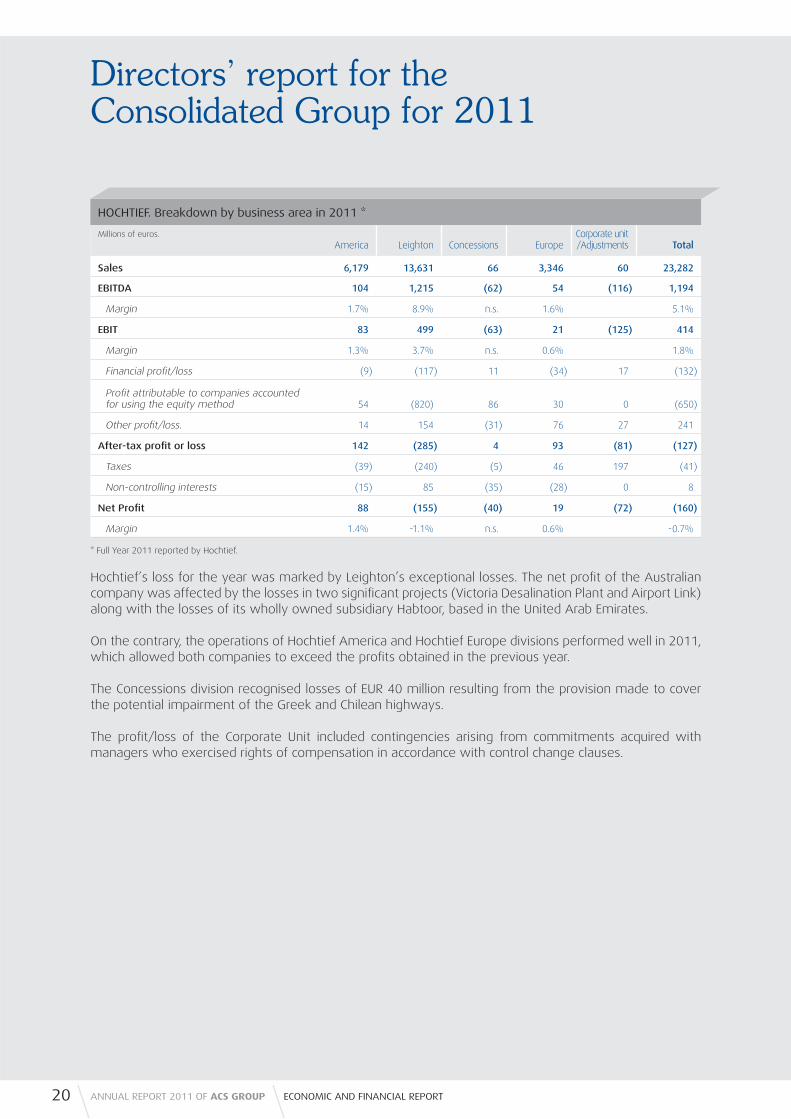
Hochtief’s loss for the year was marked by Leighton’s exceptional losses. The net profi t of the Australian company was affected by the losses in two signifi cant projects (Victoria Desalination Plant and Airport Link) along with the losses of its wholly owned subsidiary Habtoor, based in the United Arab Emirates.
On the contrary, the operations of Hochtief America and Hochtief Europe divisions performed well in 2011, which allowed both companies to exceed the profi ts obtained in the previous year.
The Concessions division recognised losses of EUR 40 million resulting from the provision made to cover the potential impairment of the Greek and Chilean highways.
The profi t/loss of the Corporate Unit included contingencies arising from commitments acquired with managers who exercised rights of compensation in accordance with control change clauses.
HOCHTIEF. Breakdown by business area in 2011 *
Millions of euros.
America Leighton Concessions EuropeCorporate unit /Adjustments Total
Sales 6,179 13,631 66 3,346 60 23,282
EBITDA 104 1,215 (62) 54 (116) 1,194
Margin 1.7% 8.9% n.s. 1.6% 5.1%
EBIT 83 499 (63) 21 (125) 414
Margin 1.3% 3.7% n.s. 0.6% 1.8%
Financial profi t/loss (9) (117) 11 (34) 17 (132)
Profi t attributable to companies accounted for using the equity method 54 (820) 86 30 0 (650)
Other profi t/loss. 14 154 (31) 76 27 241
After-tax profi t or loss 142 (285) 4 93 (81) (127)
Taxes (39) (240) (5) 46 197 (41)
Non-controlling interests (15) 85 (35) (28) 0 8
Net Profi t 88 (155) (40) 19 (72) (160)
Margin 1.4% -1.1% n.s. 0.6% -0.7%
* Full Year 2011 reported by Hochtief.
21DIRECTORS’ REPORT FOR THE CONSOLIDATED GROUP FOR 2011
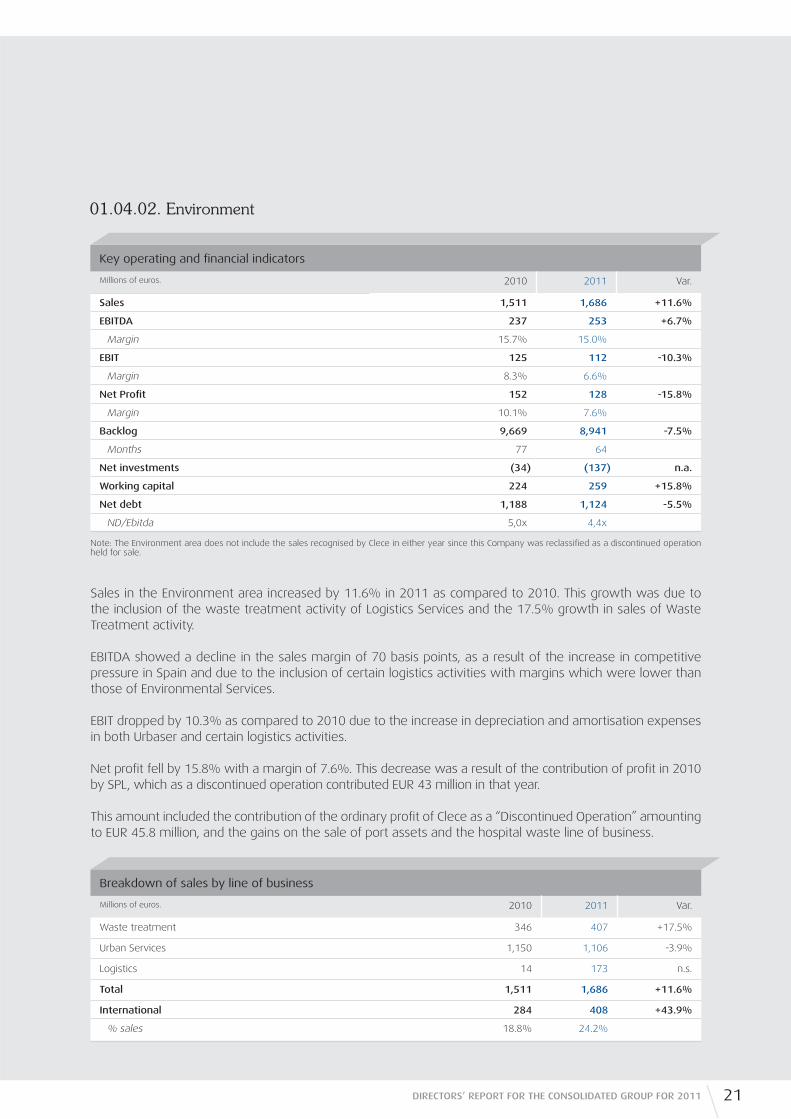
Sales in the Environment area increased by 11.6% in 2011 as compared to 2010. This growth was due to the inclusion of the waste treatment activity of Logistics Services and the 17.5% growth in sales of Waste Treatment activity.
EBITDA showed a decline in the sales margin of 70 basis points, as a result of the increase in competitive pressure in Spain and due to the inclusion of certain logistics activities with margins which were lower than those of Environmental Services.
EBIT dropped by 10.3% as compared to 2010 due to the increase in depreciation and amortisation expenses in both Urbaser and certain logistics activities.
Net profi t fell by 15.8% with a margin of 7.6%. This decrease was a result of the contribution of profi t in 2010 by SPL, which as a discontinued operation contributed EUR 43 million in that year.
This amount included the contribution of the ordinary profi t of Clece as a “Discontinued Operation” amounting to EUR 45.8 million, and the gains on the sale of port assets and the hospital waste line of business.
Breakdown of sales by line of business
Millions of euros. 2010 2011 Var.
Waste treatment 346 407 +17.5%
Urban Services 1,150 1,106 -3.9%
Logistics 14 173 n.s.
Total 1,511 1,686 +11.6%
International 284 408 +43.9%
% sales 18.8% 24.2%
Note: The Environment area does not include the sales recognised by Clece in either year since this Company was reclassifi ed as a discontinued operation held for sale.
Key operating and fi nancial indicators
Millions of euros. 2010 2011 Var.
Sales 1,511 1,686 +11.6%
EBITDA 237 253 +6.7%
Margin 15.7% 15.0%
EBIT 125 112 -10.3%
Margin 8.3% 6.6%
Net Profi t 152 128 -15.8%
Margin 10.1% 7.6%
Backlog 9,669 8,941 -7.5%
Months 77 64
Net investments (34) (137) n.a.
Working capital 224 259 +15.8%
Net debt 1,188 1,124 -5.5%
ND/Ebitda 5,0x 4,4x
01.04.02. Environment

22 ANNUAL REPORT 2011 OF ACS GROUP ECONOMIC AND FINANCIAL REPORT
Directors’ report for theConsolidated Group for 2011
The Environment backlog was EUR 8,941 million, equivalent to over fi ve years of production, and up 7.5% on the previous year. The 9.7% drop in the order book in Spain was a result of the decrease in the contracts for cleaning and garbage collection in Spain.
The capital intensive waste treatment activity, which includes recycling plants, treatment, incineration, landfi lls and methane production and other renewable energy production facilities, recorded growth of 17.5% in 2011, due to the investment in this type of assets in recent years, especially in France and the United Kingdom.
Urban Services activity included urban solid waste collection, gardening, cleaning and other urban management services provided to city councils. This is an activity mainly carried out in Spain which is labour-intensive, and whose sales dropped by 3.9% in 2011.
Logistics relates mainly to port waste activities, which are basically international, as well as transport following the sale of SPL in 2010.
International sales rose by 43.9% and now account for a 24.2% of total sales, more than fi ve percentage points above those reported last year.
Breakdown of backlog by activity
Millions of euros. 2010 2011 Var.
Waste treatment 5,464 5,166 -5.5%
Urban Services 3,700 3,295 -10.9%
Logistics 505 479 -5.1%
Total 9,669 8,941 -7.5%
International 3,433 3,311 -3.5%
% backlog 35.5% 37.0%
Sales by Geographical Area
Millions of euros. 2010 2011 Var.
Spain 1,227 1,278 +4.1%
Rest of Europe 118 208 +75.9%
America 118 126 +6.9%
Asia Pacifi c 1 26 n.s.
Rest of the World 46 49 +5.6%
Total 1,511 1,686 +11.6%
This growth was the result of heavy waste treatment plant activity in international markets, and was due to the contracts awarded and the investments made in recent years.

23DIRECTORS’ REPORT FOR THE CONSOLIDATED GROUP FOR 2011
01.04.03. Industrial Services
Sales in Industrial Services dropped by 1.6% in 2011 to EUR 7,045 million, due to a lower level of Integrated Project activity in the Spanish market.
The EBITDA margin was higher than last year as a result of the change in mix experienced, especially noteworthy being the greater proportion of Renewable Energy activity even after the sale of assets in the year.
The net profi t for the area rose by 23.0% to EUR 492 million as a result of a growth in operations and capital gains on the sale of renewable assets during the period.
The international order book, which basically relates to Environmental Services, accounted for a total 37.0% of the total order book and dropped by 3.5%.
Backlog by Geographical Area
Millions of euros. 2010 2011 Var.
Spain 6,236 5,629 -9.7%
Rest of Europe 2,399 2,321 -3.3%
America 401 370 -7.9%
Asia Pacifi c 505 479 -5.1%
Rest of the World 127 142 +11.4%
Total 9,669 8,941 -7.5%
Key operating and fi nancial indicators
Millions of euros. 2010 2011 Var.
Sales 7,158 7,045 -1.6%
EBITDA 821 907 +10.5%
Margin 11.5% 12.9%
EBIT 628 828 +31.8%
Margin 8.8% 11.7%
Net Profi t 400 492 +23.0%
Margin 5.6% 7.0%
Order book 6,846 6,875 +0.4%
Months 11 12
Net investments 1,105 556 -49.7%
Projects (Gross Inv) 1,311 1,141
Working capital (1,611) (1,636) +1.5%
Net debt (520) (835) +60.5%
DN/Ebitda -0,6x -0,9x
24 ANNUAL REPORT 2011 OF ACS GROUP ECONOMIC AND FINANCIAL REPORT
Directors’ report for theConsolidated Group for 2011
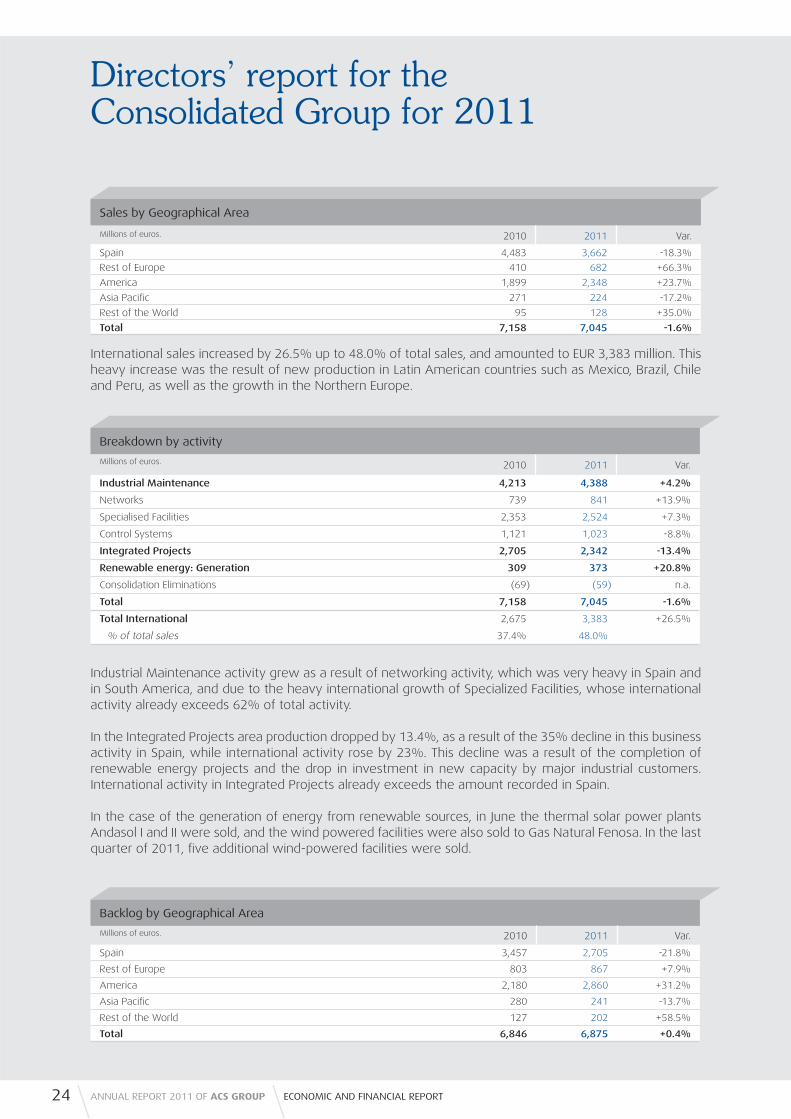
International sales increased by 26.5% up to 48.0% of total sales, and amounted to EUR 3,383 million. This heavy increase was the result of new production in Latin American countries such as Mexico, Brazil, Chile and Peru, as well as the growth in the Northern Europe.
Industrial Maintenance activity grew as a result of networking activity, which was very heavy in Spain and in South America, and due to the heavy international growth of Specialized Facilities, whose international activity already exceeds 62% of total activity.
In the Integrated Projects area production dropped by 13.4%, as a result of the 35% decline in this business activity in Spain, while international activity rose by 23%. This decline was a result of the completion of renewable energy projects and the drop in investment in new capacity by major industrial customers. International activity in Integrated Projects already exceeds the amount recorded in Spain.
In the case of the generation of energy from renewable sources, in June the thermal solar power plants Andasol I and II were sold, and the wind powered facilities were also sold to Gas Natural Fenosa. In the last quarter of 2011, fi ve additional wind-powered facilities were sold.
Sales by Geographical Area
Millions of euros. 2010 2011 Var.
Spain 4,483 3,662 -18.3%
Rest of Europe 410 682 +66.3%
America 1,899 2,348 +23.7%
Asia Pacifi c 271 224 -17.2%
Rest of the World 95 128 +35.0%
Total 7,158 7,045 -1.6%
Breakdown by activity
Millions of euros. 2010 2011 Var.
Industrial Maintenance 4,213 4,388 +4.2%
Networks 739 841 +13.9%
Specialised Facilities 2,353 2,524 +7.3%
Control Systems 1,121 1,023 -8.8%
Integrated Projects 2,705 2,342 -13.4%
Renewable energy: Generation 309 373 +20.8%
Consolidation Eliminations (69) (59) n.a.
Total 7,158 7,045 -1.6%
Total International 2,675 3,383 +26.5%
% of total sales 37.4% 48.0%
Backlog by Geographical Area
Millions of euros. 2010 2011 Var.
Spain 3,457 2,705 -21.8%
Rest of Europe 803 867 +7.9%
America 2,180 2,860 +31.2%
Asia Pacifi c 280 241 -13.7%
Rest of the World 127 202 +58.5%
Total 6,846 6,875 +0.4%
25DIRECTORS’ REPORT FOR THE CONSOLIDATED GROUP FOR 2011
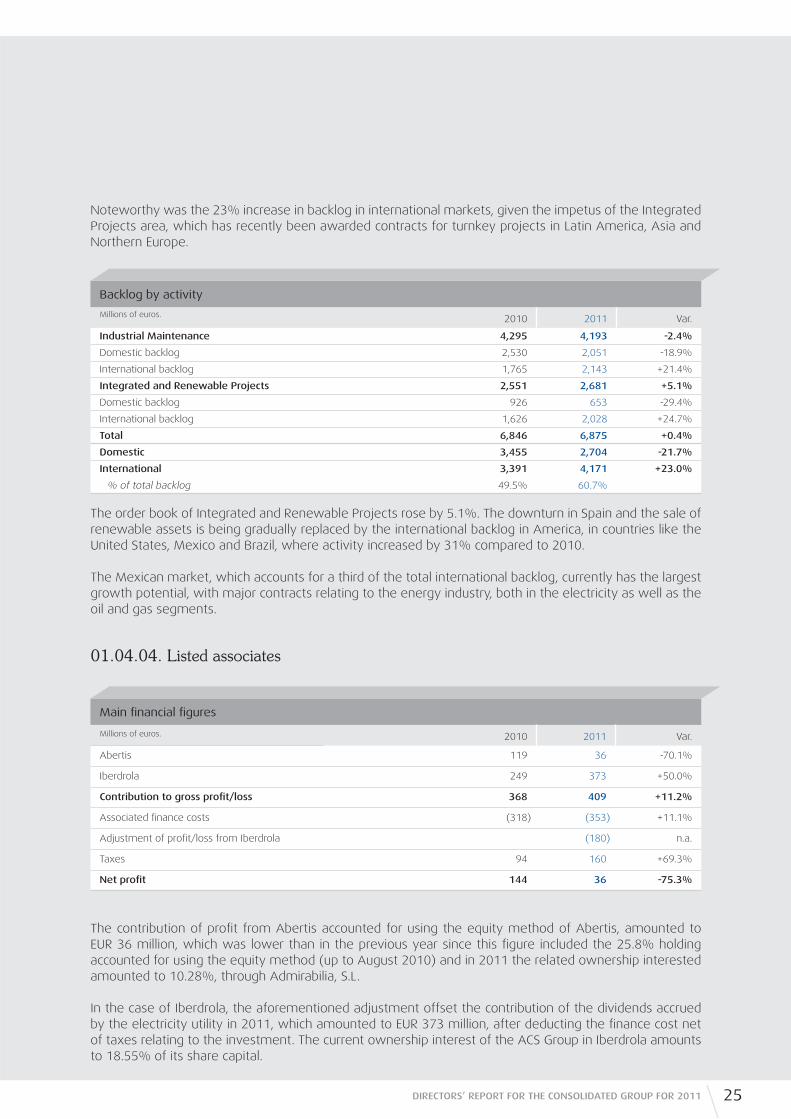
Noteworthy was the 23% increase in backlog in international markets, given the impetus of the Integrated Projects area, which has recently been awarded contracts for turnkey projects in Latin America, Asia and Northern Europe.
The order book of Integrated and Renewable Projects rose by 5.1%. The downturn in Spain and the sale of renewable assets is being gradually replaced by the international backlog in America, in countries like the United States, Mexico and Brazil, where activity increased by 31% compared to 2010.
The Mexican market, which accounts for a third of the total international backlog, currently has the largest growth potential, with major contracts relating to the energy industry, both in the electricity as well as the oil and gas segments.
01.04.04. Listed associates
The contribution of profi t from Abertis accounted for using the equity method of Abertis, amounted to EUR 36 million, which was lower than in the previous year since this fi gure included the 25.8% holding accounted for using the equity method (up to August 2010) and in 2011 the related ownership interested amounted to 10.28%, through Admirabilia, S.L.
In the case of Iberdrola, the aforementioned adjustment offset the contribution of the dividends accrued by the electricity utility in 2011, which amounted to EUR 373 million, after deducting the fi nance cost net of taxes relating to the investment. The current ownership interest of the ACS Group in Iberdrola amounts to 18.55% of its share capital.
Main fi nancial fi gures
Millions of euros. 2010 2011 Var.
Abertis 119 36 -70.1%
Iberdrola 249 373 +50.0%
Contribution to gross profi t/loss 368 409 +11.2%
Associated fi nance costs (318) (353) +11.1%
Adjustment of profi t/loss from Iberdrola (180) n.a.
Taxes 94 160 +69.3%
Net profi t 144 36 -75.3%
Backlog by activity
Millions of euros. 2010 2011 Var.
Industrial Maintenance 4,295 4,193 -2.4%
Domestic backlog 2,530 2,051 -18.9%
International backlog 1,765 2,143 +21.4%
Integrated and Renewable Projects 2,551 2,681 +5.1%
Domestic backlog 926 653 -29.4%
International backlog 1,626 2,028 +24.7%
Total 6,846 6,875 +0.4%
Domestic 3,455 2,704 -21.7%
International 3,391 4,171 +23.0%
% of total backlog 49.5% 60.7%
26 ANNUAL REPORT 2011 OF ACS GROUP ECONOMIC AND FINANCIAL REPORT
Directors’ report for theConsolidated Group for 2011
02. Stock market performance
02.01. Stock market information for 2011
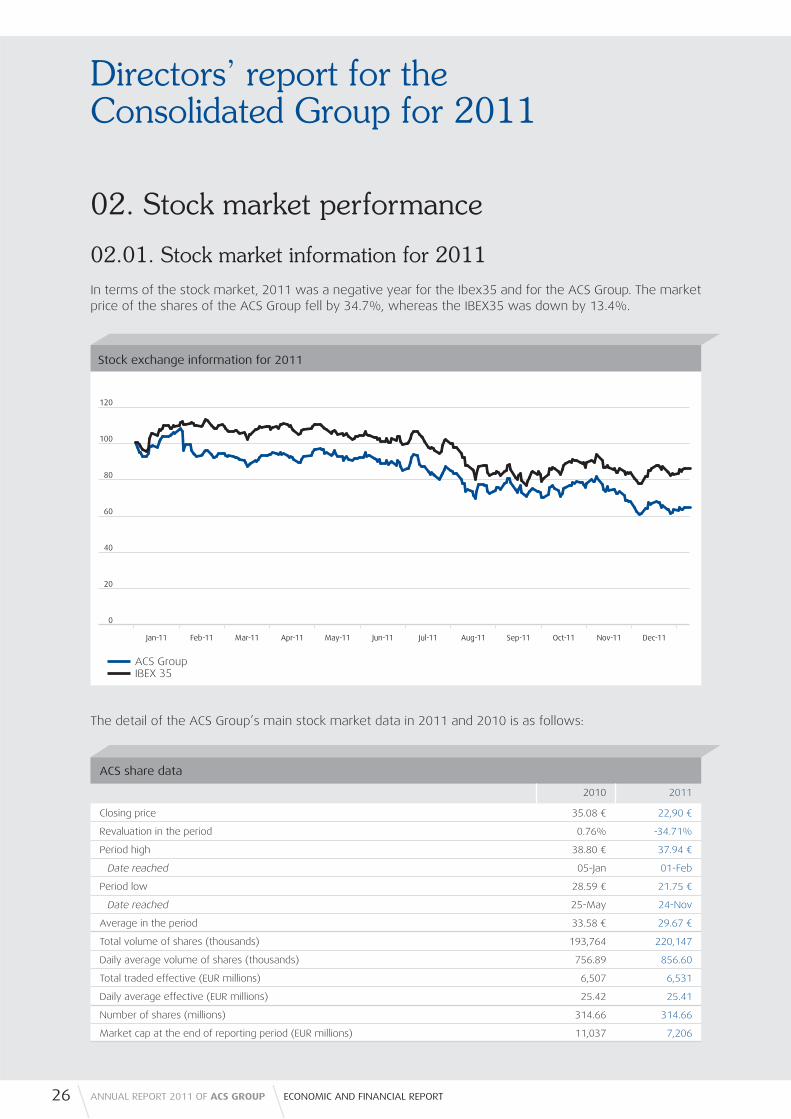
In terms of the stock market, 2011 was a negative year for the Ibex35 and for the ACS Group. The market price of the shares of the ACS Group fell by 34.7%, whereas the IBEX35 was down by 13.4%.
The detail of the ACS Group’s main stock market data in 2011 and 2010 is as follows:
ACS share data
2010 2011
Closing price 35.08 € 22,90 €
Revaluation in the period 0.76% -34.71%
Period high 38.80 € 37.94 €
Date reached 05-Jan 01-Feb
Period low 28.59 € 21.75 €
Date reached 25-May 24-Nov
Average in the period 33.58 € 29.67 €
Total volume of shares (thousands) 193,764 220,147
Daily average volume of shares (thousands) 756.89 856.60
Total traded effective (EUR millions) 6,507 6,531
Daily average effective (EUR millions) 25.42 25.41
Number of shares (millions) 314.66 314.66
Market cap at the end of reporting period (EUR millions) 11,037 7,206
Stock exchange information for 2011
120
100
80
60
40
20
0
Mar-11Feb-11Jan-11 Apr-11 Jun-11 Aug-11May-11 Jul-11 Sep-11 Oct-11 Nov-11 Dec-11
ACS Group IBEX 35

27DIRECTORS’ REPORT FOR THE CONSOLIDATED GROUP FOR 2011
02.02. Treasury shares
At 31 December 2011, the ACS Group had 23,608,833 treasury shares, accounting for 7.5% of its share capital. The detail of the transactions performed in the year is as follows:
On 4 February 2011, in completion of the takeover bid for Hochtief AG, the ACS Group handed over 5,050,085 shares of ACS as consideration for the shares held by the shareholders of Hochtief AG, who accepted the bid.
Closing Price
42 €
40 €
38 €
36 €
34 €
32 €
30 €
28 €
26 €
24 €
22 €
20 €
5,500
5,000
4,500
4,000
3,500
3,000
2,500
2,000
1,500
1,000
500
0
Mar-11Feb-11Jan-11 Apr-11 Jun-11 Agu-11May-11 Jul-11 Sep-11 Oct-11 Nov-11 Dec-11
Closing pride Trading volume
Trading Volume (thousands)
8-February: Interim dividend payment
5-July: Complementarydividend payment
24-February: 2010 Results release
30-August:2Q/11 Results release
14-November:3Q/11 Results release
10-May: 1Q/11 Results release
0,90 per share 1,15 per share
2011 2010
Number of Shares Thousands of Euros Number of Shares Thousands of Euros
At beginning of year 19,542,383 683,491 9,835,633 350,747
Purchases 9,845,100 279,253 10,200,612 350,047
Sales (5,778,650) (202,093) (493,862) (17,303)
At end of reporting period 23,608,833 760,651 19,542,383 683,491

28 ANNUAL REPORT 2011 OF ACS GROUP ECONOMIC AND FINANCIAL REPORT
Directors’ report for theConsolidated Group for 2011
03. Information about the main risks and doubts intrinsic to the ACS Group’s activity and management of fi nancial riskThe ACS Group operates in sectors, countries and social, economic and legal environments which involve the exposure to different risk levels intrinsic to the businesses in which they engage.
The ACS Group monitors and controls the aforementioned risks in order to prevent an impairment of profi tability for its shareholders, a danger to its employees or corporate reputation, a problem for its customers or a negative impact on the Group as a whole. For this purpose, the ACS Group has instruments enabling it to identify such risks suffi ciently in advance to manage them appropriately either by avoiding them or by minimising the impact thereof, prioritizing their signifi cance as necessary. Noteworthy are the systems relating to control in the bidding for, contracting, planning and management of works and projects, as well as the quality, environmental and human resource management systems.
In addition to the risks arising from the different lines of businesses in which the ACS Group engages, it is exposed to various fi nancial risks, including the risks of changes in interest rates and exchange rates, as well as liquidity and credit risk.
Risks arising from changes in interest rates affecting cash fl ows are mitigated by hedging the rates through the use of fi nancial instruments which cushion their fl uctuation.
The risk of fl uctuations in the rate of exchange is managed by acquiring debt instruments in the same effective currency as the assets that the Group fi nances abroad. In order to hedge net positions in currencies other than the Euro, the Group arranges different fi nancial instruments to reduce the exposure to the risk of changes in exchange rates.
To manage the liquidity risk arising from temporary imbalances between funding requirements and receipt of the necessary funds, a balance is procured between the two terms involved while, at the same time, the Group borrows on a fl exible basis designed to cater for its funding needs at any given time. This is linked to the management of capital by maintaining a fi nancial-equity structure which is optimal for reducing costs, while safeguarding the capacity to continue operating with appropriate debt ratios. In this connection, noteworthy is the recent arrangement of a forward-start facility maturing in July 2015 for corporate fi nancing, which has contributed to an improvement in the average duration of the Group’s fi nancial liabilities.
Finally, credit risk caused by the non-payment of commercial loans is dealt with through the preventive assessment of the solvency rating of potential Group customers, both at the commencement of the relationship with these customers for each work or project and during the term of the contract, through the evaluation of the credit quality of the outstanding amounts and the revision of the estimated recoverable amounts in the case of balances considered to be doubtfully collectible.
A more in-depth explanation of these risks and of the related risk control instruments is provided in the ACS Group’s Annual Corporate Governance and Corporate Responsibility reports and the ACS Group’s consolidated fi nancial statements (www.grupoacs.com) Likewise, the Annual Report of Hochtief (www.hochtief.com) details the risks intrinsic in the German company and its control mechanisms.
Based on the information currently available, in the next six months following the closing of the accounts referred to in this document, the ACS Group does not expect to face situations of risk and uncertainty signifi cantly different to those faced in the second half of 2011 except those arising from:
29DIRECTORS’ REPORT FOR THE CONSOLIDATED GROUP FOR 2011
• The internationalization of the activities resulting from the incorporation of the Hochtief Group; • The reduction of construction due to the Spanish Government’s domestic plans to cut public investment
in line with the budgetary adjustment policies in order to ensure the fi scal consolidation required by the European Union; and
• The economic and fi nancial uncertainties arising from the international crisis.
The ACS Group’s 2011 Corporate Governance report details these risk control instruments, as well as the risks and uncertainties to which it was exposed over the year.
04. Human ResourcesAt the end of the reporting period, the ACS Group employed a total of 162,262 people, 36,634 of whom are university graduates. The increase in staff this year was due to the incorporation of the Hochtief Group, which contributed 75,449 staff, of whom 20,832 are higher level university graduates.
Some of the fundamental principles governing the corporate human resource policies of the companies in the Group are based on the following common aims:
• Attracting, preserving and motivating talented individuals.
• Promoting teamwork and quality control as tools to reinforce excellence through work well done.
• Acting quickly, promoting the assumption of responsibilities and minimizing bureaucracy.
• Supporting and increasing training and learning.
• Innovating to improve processes, products and services.
The ACS Group is an active advocate of the human and labour rights recognized by the various international bodies. It fosters, respects and protects the forming of labour unions and employees’ rights to freedom of association; and granting equal opportunities and treatment, without discriminating on the basis of sex, ideology, religion, etc. or any other social or individual circumstance or condition.
The Group also promotes the professional development of its workers. To this end, it has an employment policy which generates wealth in the areas where it operates and produces links that create positive synergies for the environment. In addition, it shows a special interest in ensuring decent working conditions, subject to the most advanced measures of occupational safety and health, promoting skills management, performance evaluation and management of the professional career of its workers.
The Annual Corporate Responsibility Report provides more in-depth information regarding all the issues associated with corporate human resource policies, mainly in key areas for the Group as talent management and occupational safety.

30 ANNUAL REPORT 2011 OF ACS GROUP ECONOMIC AND FINANCIAL REPORT
Directors’ report for theConsolidated Group for 2011
05. Technological innovation and environmental protection
05.01. Research and development activities
The ACS Group is committed to a policy providing for the ongoing improvement of its processes and of applied technology in all activities. Its involvement with research, development and innovation is evidenced by the increase in the ACS Group’s R&D+i investment and efforts year after year, These investments lead to inter alia, tangible improvements in productivity, quality, client satisfaction, work safety, the obtainment of new and better materials and products, and the design of more effi cient production processes and systems.
For this purpose, the ACS Group has an in-house research programme aimed at developing new technological know-how in the design of processes, systems, new materials, etc. in each activity. R&D management is carried out through a system that, in the most important companies and in general lines, follows the guidelines of the UNE 166002:2006 standard and is audited by independent technicians.
This program is based on three premises of action:
1) Development of projects which most benefi t the technical and technological progress of the company, for which purpose it has procedures to analyse and discriminate the projects it undertakes prior to their implementation.
2) Development of projects together with other prestigious research institutions, both at national and European level, to complement the skills of the researchers of the ACS Group.
3) Increased and responsible investment for implementing research and generating patents and operational techniques consistently and effi ciently.
The main lines of research to which the Group is currently devoting efforts are:
• Search for effi ciency in the use of resources. • Minimization of the environmental impacts of services. • Energy effi ciency and the fi ght against climate change. • Development of initiatives that promote sustainable transport. • Information and communication technologies. • Improvement of transport infrastructure maintenance techniques. • Improvement and optimization of processes.
The recent incorporation of Hochtief in the ACS Group will allow the best practices in the fi eld of research and development to be combined and exchanged in order to improve resource effi ciency and the safety of operations.

31DIRECTORS’ REPORT FOR THE CONSOLIDATED GROUP FOR 2011
05.02. Environmental protection
The ACS Group carries out activities that involve a significant environmental impact, either directly as a consequence of changes in the environment or indirectly through the consumption of materials, energy and water resources.
The ACS Group carries out its activities in accordance with law, by adopting the most efficient measures to reduce these effects, and by reporting its activity in the mandatory environmental impact studies.
Additionally, it develops policies and adapts processes so that a high percentage of the Group activity is certified to the ISO 14001 standard, which involves an additional commitment required by the law in respect of good environmental practice.
• Commitment to pollution prevention. • Commitment to continuous improvement. • Commitment to transparency, communication and training to the Group’s employees, suppliers,
customers and other interest groups.
Additionally, ACS has various ongoing action plans in their companies to reduce the environmental impact in more specific areas. The main initiatives in development are:
• Actions that contribute to the reduction of climate change.
• Initiatives to enhance energy efficiency in its activities.
• Procedures that help to minimize the impact on biodiversity in those projects where necessary.
• Promotion of good practices aimed at saving water in those locations considered to have high water stress.
The detail of the results of R&D+i and environmental policies of the ACS Group are frequently collects and published in the web page of the ACS Group (www.grupoacs.com) and in the Annual Corporate Responsibility Report.
Hochtief also maintains its own environmental performance, social protection and research and development plans, which characterizes it as one of the most effective international building groups in terms of sustainability. These policies are detailed in the sustainability report of the German group, published in March of this year and available at www.hochtief.com.

32 ANNUAL REPORT 2011 OF ACS GROUP ECONOMIC AND FINANCIAL REPORT
Directors’ report for theConsolidated Group for 2011
06. Signifi cant events subsequent to year-endOn 9 February 2012, ACS Construction Activities and Services, S. A. entered into a contract with a syndicate of banks, composed of 32 Spanish and foreign entities, for a three-year refi nancing of the syndicated loan at maturity (July 2012). The loan amounts to EUR 1,377 million, and can be increased up to May 2012 to EUR 1,650 million. At the date of the preparation of this Directors’ Report, EUR 34 million had been drawn down by entities.
On 8 March 2012, the ACS Group sold an ownership interest of 23.5% of Clece, S.A. to various funds managed by Mercapital, to which it has also granted the option to buy the remaining capital. Following this date control of Clece is to be exercised by the acquiring funds and by ACS, and the company is to be accounted for using the equity method rather than being fully consolidated. The purchase price was EUR 80 million, which represents a total enterprise valueof EUR 505.7 million.
On 19 March 2012, Hochtief, A. G. issued a corporate bond amounting to EUR 500 million maturing in fi ve years and with a coupon of 5.50% per annum.
07. Outlook for 2012In 2012 the ACS Group projects that its consolidated revenue will be close to EUR 35,000 million, while its EBITDA is expected to reach EUR 2,700 million. Net debt at the end of the year is expected to be less than three times the EBITDA mentioned.
To achieve these objectives, the ACS Group will continue to fully consolidate HOCHTIEF, while continuing to follow its operating policy of internationalisation, operational effi ciency and promotion of profi tability.
In terms of debt, the divestment plan started in the year 2010 will continue to be carried out in order to divest those assets that are considered to be mature and non-strategic. These include the sale of wind-powered facilities and solar thermal energy plants, transmission lines and mature infrastructure concessions and other businesses carried on.
08. Annual Corporate Governance ReportIn accordance with corporate law, following is the Annual Corporate Governance Report, which forms an integral part of the 2011 Directors’ Report.

33DIRECTORS’ REPORT FOR THE CONSOLIDATED GROUP FOR 2011

ConsolidatedFinancial Statements
Consolidated statement of fi nancial position at 31 December 2011
Assets
Thousands of euros Note 31/12/2011 31/12/2010
NON-CURRENT ASSETS 20,039,669 15,995,005
Intangible assets 04 4,753,432 1,613,732
Goodwill 2,496,438 1,149,374
Other intangible assets 2,256,994 464,358
Tangible assets - property, plant and equipment 05 3,343,538 1,218,161
Non-current assets in projects 06 834,692 2,380,286
Investment property 07 79,511 57,176
Investments accounted for using the equity method 09 1,569,911 2,333,359
Non-current fi nancial assets 10 7,351,522 7,508,570
Financial instrument receivables 22 23,739 59,766
Deferred tax assets 26.06 2,083,324 823,955
CURRENT ASSETS 27,947,941 18,189,522
Inventories 11 1,774,714 618,025
Trade and other receivables 12 10,703,493 6,939,239
Trade receivables for sales and services 9,625,068 5,880,970
Other receivables 951,857 1,009,275
Current tax assets 26 126,568 48,994
Other current fi nancial assets 10 3,006,222 3,502,218
Other current assets 13 221,278 100,764
Cash and cash equivalents 14 4,155,177 2,452,570
Non-current assets held for sale and discontinued operations 03.09 8,087,057 4,576,706
TOTAL ASSETS 47,987,610 34,184,527
The accompanying notes 01 to 39 and Appendices I to IV are an integral part of the consolidated statement of fi nancial position at 31 December 2011.
34 ANNUAL REPORT 2011 OF ACS GROUP ECONOMIC AND FINANCIAL REPORT

Equity and liabilities
Thousands of euros Note 31/12/2011 31/12/2010
EQUITY 15 6,191,264 4,442,386
SHAREHOLDERS' EQUITY 5,682,274 5,519,213
Share Capital 157,332 157,332
Share premium 897,294 897,294
Reserves 4,709,557 4,118,719
(Treasury shares and equity interests) (760,651) (683,491)
Profi t for the year of the parent 961,940 1,312,557
(Interim dividend) (283,198) (283,198)
ADJUSTMENTS FOR CHANGES IN VALUE (2,363,192) (1,340,666)
Available-for-sale fi nancial assets (1,839,361) (1,200,304)
Hedging instruments (648,120) (335,271)
Exchange differences 124,289 194,909
EQUITY ATTRIBUTABLE TO THE PARENT 3,319,082 4,178,547
NON-CONTROLLING INTERESTS 2,872,182 263,839
NON-CURRENT LIABILITIES 13,476,553 10,771,005
Grants 16 58,132 69,949
Non-current provisions 20 2,033,463 407,243
Non-current fi nancial liabilities 9,604,305 9,621,194
Bank borrowings, debt instruments and other marketable securities 17 3,605,979 4,717,777
Project fi nance with limited recourse 18 5,888,061 4,860,106
Other fi nancial liabilities 19 110,265 43,311
Derivative fi nancial instruments 22 421,705 240,435
Deferred tax liabilities 26.06 1,174,599 270,835
Other non-current liabilities 184,349 161,349
CURRENT LIABILITIES 28,319,793 18,971,136
Current provisions 20 1,268,481 233,344
Current fi nancial liabilities 6,891,279 4,336,735
Bank borrowings, debt instruments and other marketable securities 17 6,271,497 2,136,685
Project fi nance with limited recourse 18 77,432 2,186,426
Other fi nancial liabilities 19 542,350 13,624
Trade and other payables 23 14,560,695 10,154,737
Suppliers 8,186,905 3,155,493
Other payables 6,285,641 6,915,324
Current tax liabilities 26 88,149 83,920
Other current liabilities 24 603,997 656,270
Liabilities relating to non-current assets held for sale and discontinued operations 03.09 4,995,341 3,590,050
TOTAL EQUITY AND LIABILITIES 47,987,610 34,184,527
The accompanying Notes 01 to 39 and Appendices I to IV are an integral part of the consolidated statement of fi nancial position at 31 December 2011.
35CONSOLIDATED FINANCIAL STATEMENTS

ConsolidatedFinancial Statements
Consolidated income statement for the year ended 31 December 2011
Earnings per share
Euros per share Note 31/12/2011 31/12/2010
Basic earnings per share 31 3.24 4.38
Diluted earnings per share 31 3.24 4.38
Basic earnings per share from discontinued operations 31 0.15 0.27
Basic earnings per share from continuing operations 31 3.09 4.11
The accompanying notes 01 to 39 and Appendices I to IV are an integral part of the consolidated income statement at 31 December 2011.
36 ANNUAL REPORT 2011 OF ACS GROUP ECONOMIC AND FINANCIAL REPORT
Thousands of euros Note 31/12/2011 31/12/2010
Revenue 27 28,471,883 14,328,505
Changes in inventories of fi nished goods and work in progress (219,903) 14,561
Capitalised expenses of in-house work on assets 27 17,494 37,008
Procurements 28.01 (17,767,484) (8,483,033)
Other operating income 518,922 339,109
Staff costs 28.02 (6,318,521) (3,241,267)
Other operating expenses (2,419,658) (1,568,531)
Depreciation and amortisation charge 04,05,06 and 07 (953,952) (390,622)
Allocation of grants relating to non-fi nancial assets and others 16 4,525 3,438
Impairments and gains and losses on the disposal of non-current assets (40,289) (18,399)
Other profi t or loss 81,134 (248)
Operating income 1,374,151 1,020,521
Financial income 28.06 521,055 489,891
Financial costs (1,216,514) (802,637)
Changes in the fair value of fi nancial instruments 22 and 28.05 (98,195) (546)
Exchange differences (22,152) 25,219
Impairments and gains or losses on the disposal of fi nancial instruments 29 367,087 536,223
Financial result (448,719) 248,150
Results of companies accounted for using the equity method 09 318,469 221,766
Profi t before tax 1,243,901 1,490,437
Income tax 26.04 (181,220) (217,210)
Profi t for the year from continuing operations 1,062,681 1,273,227
Profi t for the year from discontinued operations ( * ) 45,690 81,650
Profi t for the year 1,108,371 1,354,877
Profi t attributed to non-controlling interests 15.07 (146,528) (41,803)
Profi t from discontinued operations attributable to non-controlling interests 15.07 97 (517)
Profi t attributable to the parent 961,940 1,312,557
(*) Profi t after tax from discontinued operations attributable to non-controlling interests 03.09 45.787 81.133

Consolidated statement of comprehensive income for the year ended 31 December 2011
The accompanying notes 01 to 39 and Appendices I to IV are an integral part of the consolidated statement of comprehensive income at 31 December 2011.
37CONSOLIDATED FINANCIAL STATEMENTS
Thousands of euros 31/12/2011 31/12/2010
Of the Parent
Of non-controlling
interests TOTALOf the parent
Of non-controlling
interests TOTAL
A) Total consolidated profi t 961,940 146,431 1,108,371 1,312,557 42,320 1,354,877
Profi t from continuing operations 916,153 146,528 1,062,681 1,231,424 41,803 1,273,227
Profi t from discontinued operations 45,787 (97) 45,690 81,133 517 81,650
B) Income and expenses recognised directly in equity (1,082,158) 20,811 (1,061,347) (470,343) 2,014 (468,329)
Measurement of fi nancial instruments (896,832) (10,520) (907,352) (651,746) - (651,746)
Cash fl ow hedges (523,700) (75,197) (598,897) (239,763) (13,714) (253,477)
Exchange differences (7,017) 111,891 104,874 197,734 11,614 209,348
Actuarial profi t and loss (25,330) (46,340) (71,670) - - -
Tax effect 370,721 40,977 411,698 223,432 4,114 227,546
C) Transfers to profi t or loss 43,278 (8,777) 34,501 135,825 2,540 138,365
Reversal of fi nancial instruments - - - 12,637 - 12,637
Cash fl ow hedges 133,735 15,901 149,636 176,185 2,540 178,725
Exchange differences (63,603) (19,195) (82,798) (11,587) - (11,587)
Tax effect (26,854) (5,483) (32,337) (41,410) - (41,410)
Total comprehensive income for the year (76,940) 158,465 81,525 978,039 46,874 1,024,913

ConsolidatedFinancial Statements
Consolidated statement of changes in equity for the year ended 31 December 2011
The accompanying notes 01 to 39 and Appendices I to IV are an integral part of the consolidated statement of changes in equity at 31 December 2011.
38 ANNUAL REPORT 2011 OF ACS GROUP ECONOMIC AND FINANCIAL REPORT
Thousands of euros
Share capital
Share premium
Retained Earnings
and other reserves
Treasury shares
Adjustments for changes in
value
Profi t attributable
to the Parent
Interim dividend
Non-controlling
interests TOTAL
Balance at 31 December 2009
157,332 897,294 2,871,360 (350,747) (1,005,111) 1,951,531 (283,198) 287,555 4,526,016
IFRIC 12. Service concession arrangements
- - (12,440) - (1,037) (5,344) - 1,303 (17,518)
NIC 31- Change in Integration method
- - - - - 1 - (579) (578)
Adjusted balance at 1 January 2010
157,332 897,294 2,858,920 (350,747) (1,006,148) 1,946,188 (283,198) 288,279 4,507,920
Revenue (expenses) for the year recognised in equity
- - - - (334,518) 1,312,557 - 46,874 1,024,913
Stock options - - 6,177 - - - - - 6,177
Distribution of profi t from the prior year
To reserves - - 1,301,126 - - (1,301,126) - - -
To dividends - - 26,858 - - (645,062) 283,198 (15,374) (350,380)
Treasury shares - - (126) (332,744) - - - - (332,870)
Changes in quoted investee companies for actuarial profi t and others
- - (24,253) - - - - - (24,253)
Change in the scope of consolidation and other effects of a lesser amount
- - (49,983) - - - - (55,940) (105,923)
2010 interim dividend - - - - - - (283,198) - (283,198)
Balance at 31 December 2010
157,332 897,294 4,118,719 (683,491) (1,340,666) 1,312,557 (283,198) 263,839 4,442,386
Revenue (expenses) for the year recognised in equity
- - (16,354) - (1,022,526) 961,940 - 158,465 81,525
Stock options - - 8,709 - - - - - 8,709
Distribution of profi t from the prior year
To reserves - - 667,495 - - (667,495) - - -
To dividends - - 46,714 - - (645,062) 283,198 (55,437) (370,587)
Treasury shares - - (892) (77,160) - - - - (78,052)
Changes in quoted investee companies for actuarial profi t and others
- - (111,814) - - - - - (111,814)
Change in the scope of consolidation and other effects of a lesser amount
- - (3,020) - - - - 2,505,315 2,502,295
2010 interim dividend - - - - - - (283,198) - (283,198)
Balance at 31 December 2011
157,332 897,294 4,709,557 (760,651) (2,363,192) 961,940 (283,198) 2,872,182 6,191,264

Consolidated statement of cash fl ows for the year ended 31 December 2011
The accompanying notes 01 to 39 and Appendices I to IV are an integral part of the consolidated statement of cash fl ows at 31 December 2011.
39CONSOLIDATED FINANCIAL STATEMENTS
Thousands of euros 31/12/2011 31/12/2010
A) Cash fl ows from operating activities 1,286,649 1,338,617
1. Profi t before tax 1,243,901 1,490,437
2. Adjustments to profi t: 1,463,613 (18,227)
Depreciation and amortisation charge 953,952 390,622
Other adjustments to profi t (net) (Note 03.23) 509,661 (408,849)
3. Changes in working capital (884,922) 203,238
4. Other cash fl ows from operating activities: (535,943) (336,831)
Interest payable (1,225,747) (828,459)
Dividends receivable 541,434 369,640
Interest receivable 313,760 243,870
Income tax payment /proceeds (165,390) (121,882)
B) Cash fl ows from investing activities (454,907) (2,063,005)
1. Investment payables: (2,146,363) (4,845,160)
Group companies, associates and business units 836,351 (25,127)
Tangible assets - property, plant and equipment, intangible assets and property investments (2,317,385) (1,470,583)
Other fi nancial assets (364,185) (2,816,543)
Other assets (301,144) (532,907)
2. Divestment: 1,691,456 2,782,155
Group companies, associates and business units 1,052,974 2,743,348
Tangible assets - property, plant and equipment, intangible assets and property investments 612,722 24,245
Other fi nancial assets 12,149 11,742
Other assets 13,611 2,820
C) Cash fl ows from fi nancing activities 695,476 1,005,670
1. Equity instrument proceeds (and payment): (253,788) (332,870)
Acquisition (279,253) (350,047)
Disposal 25,465 17.177
2. Liability instrument proceeds (and payment): 1,687,448 2,125,714
Issue 3,914,476 2.982.016
Refund and repayment (2,227,028) (856,302)
3. Dividends paid and remuneration relating to other equity instruments (613,858) (618,204)
4. Other cash fl ows from fi nancing activities: (124,326) (168,970)
Other fi nancing activity proceeds and payables (124,326) (168,970)
D) Effect of changes in exchange rates 175,389 -
E) Net increase (decrease) in cash and cash equivalents 1,702,607 281,282
F) Cash and cash equivalents at beginning of the year 2,452,570 2,171,288
G) Cash and cash equivalents at end of the year 4,155,177 2,452,570
1. Cash fl ows from operating activities 14,016 6,622
2. Cash fl ows from investing activities - 124,828
3. Cash fl ows from fi nancing activities (14,016) 35,551
Net cash fl ows from discontinued operations - 167,001
Cash and cash equivalents at end of year
Cash and banks 3,086,946 1,625,306
Other fi nancial assets 1,068,231 827,264
Total cash and cash equivalents at end of year 4,155,177 2,452,570

ConsolidatedFinancial Statements
Notes to the consolidated fi nancial statements for the year ended 31 December 2011
01. Group activityThe Parent ACS, Actividades de Construcción y Servicios, S.A. is a company incorporated in Spain in accordance with the Spanish Consolidated Companies Law. Its registered offi ce is at Avda. de Pío XII, 102, 28036 Madrid.
In addition to the operations carried on directly by it, ACS, Actividades de Construcción y Servicios, S.A. is the head of a group of subsidiaries that engage in various business activities and which compose, together with it, the ACS Group. Therefore, ACS, Actividades de Construcción y Servicios, S.A. is obliged to prepare, in addition to its own individual fi nancial statements, the Group’s consolidated fi nancial statements, which also include the interests in joint ventures and investments in associates.
In accordance with its company objects, the main business activities of ACS, Actividades de Construcción y Servicios, S.A., the Parent of the ACS Group, are as follows:
1. The business of constructing all kinds of public and private works, as well as the provision of services, for the conservation, maintenance and operation motorways, highways, roads and, in general any type of public or private ways and any other type of works, and any kind of industrial, commercial and fi nancial actions and operations which bear a direct or indirect relationship thereto.
2. Promoting, constructing, restoring and selling housing developments and all kinds of buildings intended for industrial, commercial or residential purposes, either alone or through third parties. Carrying out conservation and maintenance of works, facilities and services, whether urban or industrial.
3. The direction and execution of all manner of works, facilities, assemblies and maintenance related to production plants and lines, electric power transmission and distribution, substations, transformation, interconnection and switching centres, generation and conversion stations, electric, mechanical and track installations for railways, metros and light rail, railway, light rail and trolleybus electrifi cation, electric dam installations, purifying plants, drinking water treatment plants, wharfs, ports, airports, docks, ships, shipyards, platforms, fl otation elements, and any other elements for diagnostics, tests, security and protection, controls for interlocking, operating, metering – either directly remotely – for industries and buildings as well as those suited to the above listed, facilities, electrifi cation, public lighting and illumination, electric installations in mines, refi neries and explosive environments; and in general all manner of, facilities related to the production, transmission, distribution, upkeep, recovery and use of electric energy in all its stages and systems, as well as the operation repair, replacement and upkeep of the components thereof. Control and automation of all manner of electric networks and installations, remote controls and computer equipment required for the management, computerization and rationalisation of all kinds of energy consumption.
4. The direction and execution of all manner of works, facilities, assemblies and maintenance related to the electronics of systems and networks for telephone, telegraph, signalling and S.O.S. communications, civil defence, defence and traffi c, voice and data transmission and use, measurements and signals, as well as transmission, broadcast, repetition and reception of all manner of waves, antennas, relays, radio-links, navigation aids, equipment and elements required for the execution of such works, assemblies and facilities.
40 ANNUAL REPORT 2011 OF ACS GROUP ECONOMIC AND FINANCIAL REPORT
5. The direction and execution of all manner of works, facilities, assemblies and maintenance related to the development, production, transformation, storage, transmission, channelling, distribution, use, metering and maintenance of any other kind of energy and energy product, and of any other energy that may be used in the future, including the supply of special equipment, elements required for installation and erection, and materials of all kinds.
6. The direction and execution of all manner of works, assemblies, facilities and maintenance of hydroelectric works to develop, store, raise, drive or distribute water, and its piping, transport and distribution, including water and gas treatment facilities.
7. The direction and execution of all manner of works, assemblies, facilities and maintenance for developing, transporting, channelling and distributing liquid and solid gases for all kinds of uses.
8. The direction and execution of all manner of works, assemblies, facilities and maintenance of ventilation, heating, air conditioning and refrigeration works and works to improve the environment, for all kinds of uses.
9. The direction and execution of all manner of works, facilities, assemblies and maintenance related to cable cars, gondola lifts, chair lifts and aerial lifts for both passenger and material transport by means of systems of cables or any type of mechanical element. The retrieval of ships and submerged elements, maritime salvages, ship breaking, naval fl eet repairs, repairs and assembly of engines and mechanical elements for ships, and underwater work and sale of aquatic and sports material.
10. The manufacture, transformation, processing, handling, repair, maintenance and all manner of operations of an industrial nature for commercialisation related to machinery, elements, tools, equipment, electric protection material, bare and insulated conductors, insulators, metal fi ttings, machines, tools and auxiliary equipment for assemblies and installation of railways, metros and light trains, electric power transmission and distribution plants, lines and networks and for telephone and telegraph communications, telecommunication, security, traffi c, telematics and voice and data transmission systems; of elements and machines for the development, transformation, transmission and use of all kinds of energies and energy products; of fl uid and gas lift pumps, piping and other elements, mechanisms, accessory instruments, spare parts and materials required for execution and performance of any industrial, agricultural, naval, transport, communication and mining works, facilities and assemblies and others listed in the preceding paragraphs. Managing the business of production, sale and use of electric energy, as well as other energy sources, and carrying out studies related thereto, and managing the business of production, prospecting, sale and use of all kinds of primary solid, liquid or gaseous energy resources, specifi cally including hydrocarbons and gas, whether natural, liquid or in another state, in their different forms and classes. Energy planning and rationalisation of the use of energy and cogeneration of same. Research, development and operation of all aspects of communication and computing systems.
11. The manufacture, installation, assembly, erection, supply, maintenance and commercialisation of all kinds of products and elements pertaining to or derived from concrete, ceramics, resins, varnishes, paints, plastics or synthetic materials; as well as metal structures for industrial plants and buildings, bridges, towers and supports of metal or reinforced concrete or any synthetic material for all manner of communications and electric power transmission or distribution, or any other class of energy material or product related to all types of energy.
12. The manufacture, preparation, handling and fi nishing, diagnosis, treatment and impregnation for protection and preservation and sale of wood in general, and especially of posts used for electric, telephone and telegraph lines, impregnation or servicing for mine and gallery timbering, building supports, construction woodwork, crossties for railways and barricades, and the production and commercialisation of antiseptic products and running of procedures for preserving wood,
41CONSOLIDATED FINANCIAL STATEMENTS

ConsolidatedFinancial Statements
elements, tools and equipment of this nature. The acquisition, provision, application and use of paints, varnishes, coverings, plating and, in general, construction materials.
13. The management and execution of reforestation and agricultural and fi shery restocking works, as well as the maintenance and improvement thereof. Landscaping, planting, revegetation, reforestation, maintenance and conservation of parks, gardens and accessory elements.
14. The manufacture, installation, distribution and use in any way of all manner of ads and advertising supports. The design, construction, fabrication, installation, maintenance, cleaning, upkeep and advertising use of all manner of street furniture and similar elements.
15. The provision of all manner of public and private services of an urban nature, including the execution of any necessary works and facilities, either by administrative concession or leasing. The treatment, recycling and recovery of all kinds of urban, urban-similar, industrial and sanitary waste; the treatment and sale of waste products, as well as the management and operation of waste treatment and transfer plants. Drafting and processing of all manner of environment-related projects.
16. The cleaning services for buildings, constructions and works of any kind, of offi ces, commercial premises and public places. Preparation, upkeep, maintenance, sterilisation, disinfection and extermination of rodents. Cleaning, washing, ironing, sorting and transportation of clothing.
17. Furniture assemblies and installations, including tables, shelves, offi ce material, and similar or complementary objects.
18. Transports of all kinds, especially ground transportation of passengers and merchandise, and the activities related thereto. Management and operation, as well as provision of auxiliary and complementary services, of all manner of buildings and properties or complexes for public or private use, intended for use as service areas or stations, recreational areas, and bus or intermodal transportation stations.
19. The provision of integral health care and social assistance services by qualifi ed personnel (physicians, psychologists, educators, university graduates in nursing, social workers, physical therapists and therapists) and performance of the following tasks: home care service; tele-home care and social health care; total or partial running or management of homes, day care centres, therapeutic communities and other shelters and rehabilitation centres; transportation and accompaniment of the above-mentioned collectives; home hospitalisation and medical and nursing home care; supply of oxygen therapy, gas control, electro-medicine, and associated activities.
20. Provision of auxiliary services in housing developments, urban properties, industrial facilities, roadway networks, shopping centres, offi cial agencies and administrative departments, sports or recreational facilities, museums, fairgrounds, exhibition galleries, conference and congress halls, hospitals, conventions, inaugurations, cultural and sports centres, sporting, social and cultural events, exhibits, international conferences, general shareholders’ and owners’ association meetings, receptions, press conferences, teaching centres, parks, farming facilities (agricultural, livestock and fi sheries), forests, rural farms, hunting reserves, recreational and entertainment areas, and in general all kinds of properties and events, by means of porters, superintendents, janitors, ushers, guards or controllers, console operators, auditorium personnel, concierges, receptionists, ticket clerks (including ticket collection), telephone operators, collectors, caretakers, fi rst aid personnel, hostesses and similar personnel or personnel who complement their functions, consisting of the maintenance and upkeep of the premises, as well as attention and service to neighbours, occupants, visitors and/or users, by undertaking the appropriate tasks, excluding in all cases those which the law reserves for security fi rms. Collection and tallying of cash, and the making, collection and charging of bills and receipts. The development, promotion, exhibition, performance, acquisition, sale and provision of
42 ANNUAL REPORT 2011 OF ACS GROUP ECONOMIC AND FINANCIAL REPORT
services in the fi eld of art, culture and recreation, in their different activities, forms, expressions and styles.
21. Provision of emergency, prevention, information, telephone switchboard, kitchen and dining hall services. Opening, closing and custody of keys. Turning on and off, running, supervision, maintenance and repair of engines and heating and air conditioning, electricity and lift installations, water, gas and other supply pipes, and fi re protection systems. The operation of rapid communication systems with public assistance services, such as police, fi remen, hospitals and medical centres. Fire fi ghting and prevention services in general, in woodlands, forests, rural farms, and industrial and urban facilities.
22. Integral management or operation of public or private educational or teaching centres, as well as surveillance, service, education and control of student bodies or other educational collectives.
23. Reading of water, gas and electricity meters, maintenance, repair and replacement thereof, monitoring and transcription of readouts, meter inspection, data acquisition and updating, and instalment of alarms. Temperature and humidity measurements on roadways and, in general, all kinds of properties and real estate, and public and private facilities, providing all the controls required for proper upkeep and maintenance thereof, or of the goods deposited or guarded therein.
24. Handling, packing and distribution of food or consumer products; processing, fl avouring and distribution of food for own consumption or supply to third parties; servicing, replacement and maintenance of equipment, machinery and dispensing machines of the mentioned products; and participation in operations with raw materials, manufactured goods and supplies.
25. Provision of ground services to passengers and aircraft. Integral logistic freight services, such as: loading, unloading, stowing and unstowing, transport, distribution, placement, sorting, warehouse control, inventory preparation, replacement, control of warehouse stocks and storage of all kinds of merchandise, excluding the activities subject to special legislation. Management and operation of places of distribution of merchandise and goods in general, and especially perishable products, such as fi sh exchanges and wholesale and retail markets. Reception, docking, mooring and service connections to boats.
26. Direct advertising services, postage and mailing of printed advertising and publicity material and, in general, all kinds of documents and packages, on behalf of the clients.
27. Management, operation, administration, maintenance, upkeep, refurbishment and fitting out of all kinds of concessions in the broadest sense of the word, including those that are part of the concessionary firm’s shareholders and those that have any type of contractual relation to develop any of the above-listed activities.
28. The acquisition, holding, use, administration and disposal of all manner of own-account securities, excluding activities that special legislation, and in particular the legislation on the stock market, exclusively ascribes to other entities.
29. Manage and administer representative securities of the shareholders’ equity of non-resident entities in Spanish territory, through the appropriate organisation of personal and material means suited to this end.
30. Preparation of all manner of studies, reports and projects, and entering into contracts concerning the activities indicated in this article, as well as supervision, direction and consulting in the execution thereof.
31. Occupational training and recycling of people who provide the services described in the preceding points.
43CONSOLIDATED FINANCIAL STATEMENTS

ConsolidatedFinancial Statements
02. Basis of presentation of the consolidated fi nancial statements and basis of consolidation
02.01. Basis of presentation
The consolidated fi nancial statements for 2011 of the ACS Group were prepared:
• By the Directors of the Parent, at the Board of Directors’ Meeting held on 22 March 2012.
• In accordance with International Financial Reporting Standards (IFRSs), as adopted by the European Union, in conformity with Regulation (EC) no. 1606/2002 of the European Parliament and of the Council. The principal accounting policies and measurement bases applied in preparing the Group’s consolidated fi nancial statements for 2011 are summarised in Notes 02 and 03.
• Taking into account all the mandatory accounting policies and rules and measurement bases with a material effect on the consolidated fi nancial statements, as well as the alternative treatments permitted by the relevant legislation in this connection, which are specifi ed in Note 03 (accounting policies).
• So that they present fairly the Group’s consolidated equity and fi nancial position at 31 December 2011, and the results of its operations, the changes in consolidated equity and the consolidated cash fl ows in the year then ended.
• On the basis of the accounting records kept by the Company and by the other Group companies.
However, since the accounting policies and measurement bases used in preparing the Group’s consolidated fi nancial statements for 2011 (IFRSs as adopted by the European Union) differ from those used by the Group companies (local standards), the required adjustments and reclassifi cations were made on consolidation to unify the policies and methods used and to make them compliant with the International Financial Reporting Standards adopted in Europe.
The ACS Group’s consolidated fi nancial statements for 2010, (IFRSs as adopted by the European Union) were approved by the shareholders at the Annual General Meeting of ACS, S.A. on 14 April 2011. The 2011 consolidated fi nancial statements of the Group have not yet been approved by the shareholders at the
Annual General Meeting. However, the Parent’s Board of Directors considers that the aforementioned fi nancial statements will be approved without any material changes.
44 ANNUAL REPORT 2011 OF ACS GROUP ECONOMIC AND FINANCIAL REPORT

At the end of the fi rst quarter of 2011, the ACS Group took the decision to sell its integral maintenance line of business headed by Clece, which was sold in March 2012 (Note 32). Consequently, this line of business was recognised as a discontinued operation, and in accordance with IFRS 5, the assets and liabilities relating to this line of business were recognised as assets held-for-sale and liabilities associated with the assets held for sale under a separate heading in the consolidated statement of fi nancial position. Additionally, the heading “Profi t for the year from discontinued operations net of taxes” in the consolidated income statement for the year ended 31 December 2010 includes the net profi t and loss from this line of business. The related items were reclassifi ed in the 2010 consolidated income statement. For this reason, the fi gures recognised in this income statement differ from the income statement presented in the previous year, the main effects being as follow:
However, in accordance with the IFRS 5, there was no restatement of the assets and liabilities related to this line of business in the statement of fi nancial position as compared to the previous year. Therefore the ACS Group did not present the statement of fi nancial position for the beginning of the fi rst comparative year (i.e. 1 January 2010) since it was the same as the statement presented for comparative purposes in the 2010 consolidated fi nancial statements.
45CONSOLIDATED FINANCIAL STATEMENTS
Thousands of euros
31/12/2010 Restated
Consideration of Clece as
discontinued operation 31/12/2010
Revenue 14,328,505 (1,051,159) 15,379,664
OPERATING INCOME 1,020,521 (56,435) 1,076,956
Financial profi t 248,150 2,831 245,319
Results of companies accounted for using the equity method 221,766 (450) 222,216
Profi t before tax 1,490,437 (54,054) 1,544,491
Income tax (217,210) 15,752 (232,962)
Profi t for the year from continuing operations 1,273,227 (38,302) 1,311,529
Profi t after tax from discontinued operations (*) 81,650 38,302 43,348
Profi t for the year 1,354,877 - 1,354,877
Profi t attributable to non-controlling interests (41,803) 391 (42,194)
Profi t from discontinued operations attributable to non-controlling interests (517) (391) (126)
Profi t attributable to the parent 1,312,557 - 1,312,557
(*) Profi t after tax from discontinued operations attributed to non-controlling interests 81,133 37,911 43,222

ConsolidatedFinancial Statements
Responsibility for the information and for the estimates made
The information in these fi nancial statements is the responsibility of the Directors of the Parent of the Group.
The accompanying consolidated fi nancial statements were prepared from the 2011 accounting records of ACS, Actividades de Construcción y Servicios, S.A. and of its subsidiaries whose respective individual fi nancial statements were approved by the directors of each company and business segment, once they were adapted on consolidation in conformity with International Financial Reporting Standards, as adopted by the European Union.
In the Group’s consolidated fi nancial statements estimates were occasionally made in order to quantify certain of the assets, liabilities, income, expenses and commitments reported herein. These estimates relate basically to the following:
• The impairment losses on certain assets (Notes 03.01, 03.06 and 10.01).
• The fair value of assets acquired in business combinations (Note 02.02.f).
• The measurement of goodwill and the assignment of assets on acquisitions (Note 03.01).
• The recognition of earnings in construction contracts (Note 03.16.01).
• The amount of certain provisions (Note 03.13).
• The assumptions used in the calculation of liabilities and commitments to employees (Note 03.12).
• The market value of the derivatives, especially the “equity swaps”, mentioned in the Notes 09 and 10.
• The useful life of the intangible and tangible assets - property, plant and equipment (Notes 03.02 and 03.03).
Although these estimates were made on the basis of the best information available at the date of this consolidate fi nancial statements on the events analysed, events that take place in the future might make it necessary to change these estimates (upwards or downwards) in coming years. Changes in accounting estimates would be applied prospectively, recognising the effects of the change in estimates in the related future consolidated fi nancial statements.
Changes in accounting estimates and policies and correction of fundamental errors
Changes in accounting estimates. The effect of any change in accounting estimates is recorded under the same heading in the income statements in which the revenue or expense based on the previous estimate was recorded.
Changes in accounting policies and correction of fundamental errors. The effect of any change in accounting policies or correction of fundamental errors is recorded in accordance with IAS 8, in the following manner: the cumulative effect at the beginning of the year is adjusted in reserves whereas the effect on the year is recorded under profi t/loss for the year. Also, in these cases the fi nancial date on the comparative year presented together with the year in course is restated.
No errors were corrected in the 2010 fi nancial statements.
46 ANNUAL REPORT 2011 OF ACS GROUP ECONOMIC AND FINANCIAL REPORT

Except as indicated in the following paragraphs and the entry into force of new accounting standards, the consolidation criteria applied in 2011 are consistent with those applied in the 2010 consolidated fi nancial statements.
Functional currency
These consolidated fi nancial statements are presented in euros, since this is the functional currency in the area in which the Group operates. Transactions in currencies other than the euro are recognised in accordance with the policies established in Note 03.21.
02.02. Basis of consolidation
a) Balances and transactions with Group companies and associates
All signifi cant intra-Group balances and transactions are eliminated on consolidation. Accordingly, all gains obtained by associates up to their percentage of ownership interest and all gains obtained by fully consolidated companies were eliminated.
However, in accordance with the criteria provided by IFRIC 12, balances and transactions relating to construction projects undertaken by the Construction and Industrial Services division companies for concession companies are not eliminated on consolidation since these transactions are considered to have been performed for third parties as the projects are being completed.
b) Standardisation of items
In order to uniformly present the various items comprising these consolidated fi nancial statements, accounting standardisation criteria have been applied to the individual fi nancial statements of the companies included in the scope of consolidation.
In 2011 and 2010 the reporting date of the fi nancial statements of all the companies included in the scope of consolidation was the same or was temporarily standardised to that of the Parent.
c) Subsidiaries
“Subsidiaries” are defi ned as companies over which the ACS Group has the capacity to exercise effective control; control is, generally but not exclusively, presumed to exist when the Parent owns directly or indirectly half or more of the voting power of the investee or, even if this percentage is lower or zero, when, for example, there are agreements with other shareholders of the investee that give the Parent control. In accordance with IAS 27, control is the power to govern the fi nancial and operating policies of a company so as to benefi t from its activities.
The fi nancial statements of the subsidiaries are fully consolidated with those of the Parent. Where necessary, adjustments are made to the fi nancial statements of the subsidiaries to adapt the accounting policies used to those applied by the Group.
47CONSOLIDATED FINANCIAL STATEMENTS

ConsolidatedFinancial Statements
Also, the Group has an effective ownership interest of less than 50% in certain companies considered to be subsidiaries since the Group holds the majority of the voting power of these companies as a result of the shareholder structure and composition thereof. Most relevant in this connection is Hochtief A. G. in which the Group held a 49.17% ownership interest at the end of 2011 (Note 02.02.f).
The ACS Group companies with dividend rights of more than 50% which are not fully consolidated include: Admirabilia, S.L., Hospital Majadahonda, S.A., Leighton Welspun and Autovía de los Pinares, S.A. This circumstance arises because the control over these companies is exercised by other shareholders or because decisions require the affi rmative vote of another or other shareholders, and consequently, they have been recognised as joint ventures or companies accounted for using the equity method.
On acquisition, the assets, liabilities and contingent liabilities of a subsidiary are measured at their fair values at the date of acquisition. Any excess of the cost of acquisition over the fair values of the identifi able net assets acquired is recognised as goodwill. Any defi ciency of the cost of acquisition below the fair values of the identifi able net assets acquired (i.e. a discount on acquisition) is credited to profi t and loss on the acquisition date. The interest of non-controlling shareholders is stated at the non-controlling interest’s proportion of the fair value of the assets and liabilities recognised.
Also, the share of third parties of:
• The equity of their investees is presented within the Group’s equity under “Non-Controlling Interests” in the consolidated statement of fi nancial position.
• The profi t or loss for the year is presented under “Profi t Attributable to Non-Controlling Interests” and “Profi t from Discontinued Operations Attributable to Non-Controlling Interests” in the consolidated income statement and in the consolidated statement of changes in equity.
The results of subsidiaries acquired during the year are included in the consolidated income statement from the date of acquisition to year-end. Similarly, the results of subsidiaries disposed of during the year are included in the consolidated income statement from the beginning of the year to the date of disposal.
Appendix I to these notes to the consolidated fi nancial statements details the subsidiaries and information thereon.
Section f) of this note contains information on acquisitions, disposals, as well as increases and decreases in ownership interest.
d) Joint ventures
A “joint venture” is a contractual arrangement whereby two or more companies (“venturers”) have interests in entities (jointly controlled entities) or undertake operations or hold assets so that strategic fi nancial and operating decisions affecting the joint venture require the unanimous consent of all venturers. By applying the alternative provided in IAS 31, “interests in joint ventures” the ACS Group has accounted for jointly controlled companies by the equity method under the heading “Investments accounted for using the equity method” in the accompanying consolidated statement of fi nancial position. The interest in the profi t after tax of these companies is included under “Results of companies accounted for using the equity method” in the accompanying consolidated income statement.
48 ANNUAL REPORT 2011 OF ACS GROUP ECONOMIC AND FINANCIAL REPORT

Within the area of business in which the ACS Group operates, mention should be made of the Spanish UTEs (Unincorporated joint venture), which are entities with no separate legal personality, through which cooperation arrangements are entered into with other venturers in order to carry out a project or provide a service for a limited period of time. In cases where individual control of the assets and associated operations is evidenced, as in the case of Economic Interest Groupings, the companies are accounted for in the accompanying consolidated fi nancial statements based upon the Group’s ownership interest therein, in accordance with IAS 31.
The assets and liabilities assigned to unincorporated Joint Ventures and other similar entities are recognised in the consolidated statement of fi nancial position, classifi ed according to their specifi c nature and the Group’s percentage of ownership interest therein. Likewise, income and expense arising from these entities is presented in the consolidated income statement on the basis of their specifi c nature and the Group’s percentage of ownership therein.
Note 08 and Appendix II contain relevant information on the main joint ventures.
e) Associates
Associates are companies over which the Group is in a position to exercise signifi cant infl uence, but not control or joint control, usually because it holds (directly or indirectly) 20% or more of the voting power of the investee.
Exceptionally, the following entities (in which the Group owns 20% or more of the voting rights) are not considered to be Group associates since they do not have a signifi cant infl uence, or are fully inoperative and are irrelevant for the Group as a whole.
In the case of Iberdrola, S.A., the ACS Group directly and indirectly owns 18.8% of the voting rights, and is the main shareholder of this electricity utility company. Consequently, it should be assumed to exercise signifi cant infl uence on Iberdrola, S.A. However, temporarily and to date, it has not been possible to secure a position on the Board of Directors of Iberdrola, S.A., circumstance which led the ACS Group to challenge the resolutions adopted by the shareholders at the Annual General Meetings of Iberdrola, S.A. held in March 2010 and 2011 in court. However, the ACS Group aims to ultimately gain access to the Board of Directors of Iberdrola, S.A., which would lead the investment in Iberdrola, S.A. to be recognised as an associate. This is a very unique and absolutely exceptional circumstance, and although a ruling had been handed down by the Commercial Court of First Instance of Bilbao against the interests of the ACS Group at the date of the presentation of these fi nancial statements, the Group’s Management has full confi dence that the court will ultimately rule in the Company’s favour.
Investments in associates are accounted for using the equity method, i.e. they are measured initially at acquisition cost, and subsequently, on each reporting date, are measured at cost, plus the variations in the net assets of the associate according to the Group’s percentage of ownership. The excess of the cost of acquisition over the fair value of the nets assets of the associate at the date of acquisition is recognised as goodwill. The goodwill relating to an associate is included in the carrying amount of the investment and is not amortised. Any excess in the Group’s share in the fair value of the net assets of the associate over acquisition cost at the acquisition date is recognised in profi t or loss.
The profi t or loss of associates net of taxes is included in the Group’s consolidated income statement under “Results of companies accounted for using the equity method” according to the Group’s percentage of ownership interest, after the required adjustments have been made to take into account the depreciation of the depreciable assets based on their fair value at the date of acquisition.
49CONSOLIDATED FINANCIAL STATEMENTS
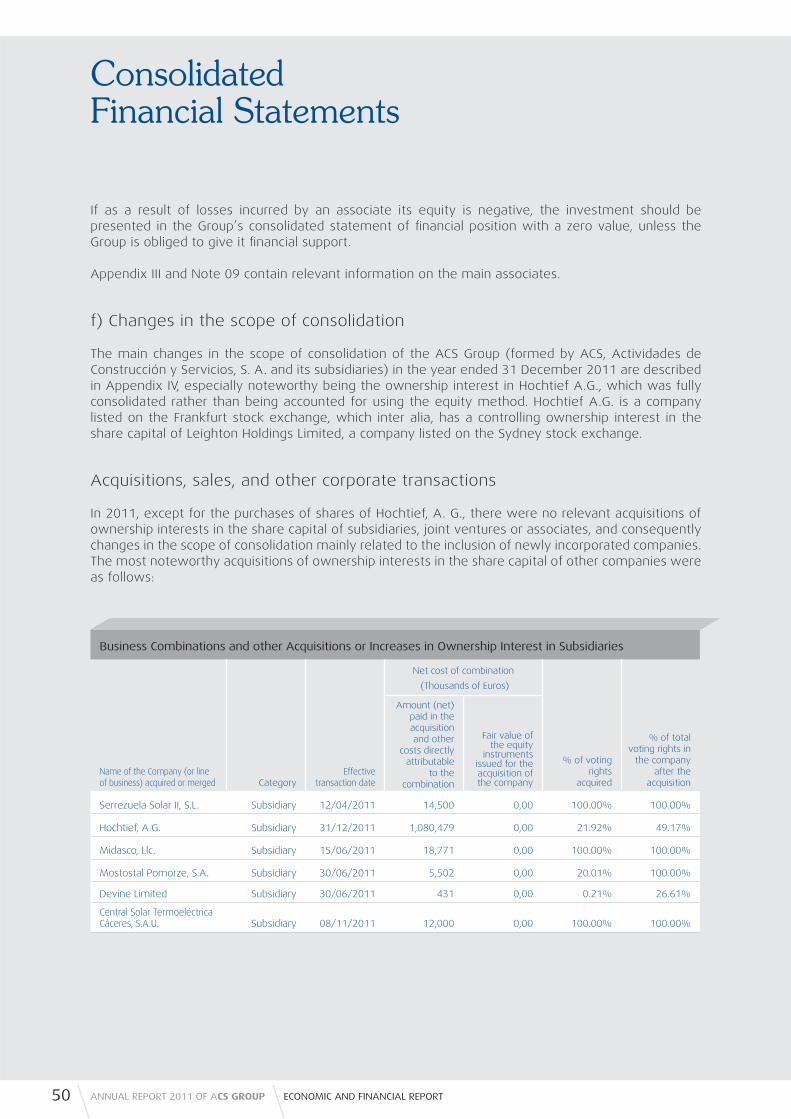
ConsolidatedFinancial Statements
If as a result of losses incurred by an associate its equity is negative, the investment should be presented in the Group’s consolidated statement of fi nancial position with a zero value, unless the Group is obliged to give it fi nancial support.
Appendix III and Note 09 contain relevant information on the main associates.
f) Changes in the scope of consolidation
The main changes in the scope of consolidation of the ACS Group (formed by ACS, Actividades de Construcción y Servicios, S. A. and its subsidiaries) in the year ended 31 December 2011 are described in Appendix IV, especially noteworthy being the ownership interest in Hochtief A.G., which was fully consolidated rather than being accounted for using the equity method. Hochtief A.G. is a company listed on the Frankfurt stock exchange, which inter alia, has a controlling ownership interest in the share capital of Leighton Holdings Limited, a company listed on the Sydney stock exchange.
Acquisitions, sales, and other corporate transactions
In 2011, except for the purchases of shares of Hochtief, A. G., there were no relevant acquisitions of ownership interests in the share capital of subsidiaries, joint ventures or associates, and consequently changes in the scope of consolidation mainly related to the inclusion of newly incorporated companies. The most noteworthy acquisitions of ownership interests in the share capital of other companies were as follows:
Business Combinations and other Acquisitions or Increases in Ownership Interest in Subsidiaries
Name of the Company (or line of business) acquired or merged Category
Effective transaction date
Net cost of combination
(Thousands of Euros)
% of voting rights
acquired
% of total voting rights in
the company after the
acquisition
Amount (net) paid in the acquisition and other
costs directly attributable
to the combination
Fair value of the equity
instruments issued for the acquisition of the company
Serrezuela Solar II, S.L. Subsidiary 12/04/2011 14,500 0,00 100.00% 100.00%
Hochtief, A.G. Subsidiary 31/12/2011 1,080,479 0,00 21.92% 49.17%
Midasco, Llc. Subsidiary 15/06/2011 18,771 0,00 100.00% 100.00%
Mostostal Pomorze, S.A. Subsidiary 30/06/2011 5,502 0,00 20.01% 100.00%
Devine Limited Subsidiary 30/06/2011 431 0,00 0.21% 26.61%
Central Solar Termoeléctrica Cáceres, S.A.U. Subsidiary 08/11/2011 12,000 0,00 100.00% 100.00%
50 ANNUAL REPORT 2011 OF ACS GROUP ECONOMIC AND FINANCIAL REPORT
Hochtief, A.G.
On 16 September 2010, ACS, Actividades de Construcción y Servicios, S.A., decided to launch a takeover bid targeting all of the shareholders of the German company Hochtief A.G., payable in shares at a rate of 8 shares of ACS for every 5 shares of Hochtief. This exchange ratio was a result of the average market price of both companies in the three previous months.
On 1 December 2010, ACS, Actividades de Construcción y Servicios, S.A. published the voluntary bid document, which was amended on 15 December through a new document whereby the bid was increased to 9 shares of ACS for 5 shares of Hochtief, A.G. The bid period expired on 29 December 2010, and the following additional period expired on 18 January 2011. Finally, once the period for possible withdrawals was fi nalised on 1 February 2011, the bid for a total of 2,805,599 shares was accepted, which represented 3.6436% of the share capital of Hochtief, A. G. These shares were physically delivered on 4 February 2011.
At 31 December 2010, the Group held an ownership interest of 27.25% in the share capital of Hochtief, A. G, with a carrying amount of EUR 1,594,702 thousand at this date. Additionally, ACS, Actividades de Construcción y Servicios, S. A. signed two equity swaps in 2010, to be settled only for differences in relation to the 2.99% and 2.35% of the share capital of Hochtief A.G. These equity swaps were fi nally settled in full in February 2011. At 31 December 2010, the fair value of these swaps was recognised under the heading “Financial instrument receivables” on the asset side of the accompanying consolidated statement of fi nancial position” the effect of their valuation being recognised in the consolidated income statement since they were not considered to be hedging instruments (Note 28.05).
On 12 May 2011, the Annual General Meeting of Hochtief was held, and since the ACS Group held a majority of its shares (ACS held 63.21% of the votes present or represented at the meeting), four members of the Board of Directors of Hochtief were appointed as proprietary members in representation of ACS which was half the board members not representing employees on this Board. On 16 June 2011, the ACS Group notifi ed the supervisory authority of the German stock market (abbreviated “Bafi n”) that it held 50.16% of the voting rights including 4.46% of the treasury shares of Hochtief, in accordance with the criteria stipulated by Bafi n. From the end of the additional bid acceptance period up to 31 December 2011, the ACS Group acquired an additional 14,070,782 shares of Hochtief, A. G., which added to the shares previously held and the result of the takeover bid exchange, totalled 37,860,381 shares representing 49.17% of the share capital of Hochtief, A. G.
Consequently, the ACS Group considered the conditions to be appropriate to fully consolidate its investment in Hochtief A. G, with effect from 1 June 2011. Therefore, only its income and expenses for the last seven months of the year were recognised in the consolidated income statement.
In accordance with accounting regulations, the ACS Group assessed the fair value of its ownership interest in Hochtief at the date of its full consolidation. In this regard, considering the increase in the share price of Hochtief in the Frankfurt Stock Exchange in the fi rst half of 2011, the appraisals of the consensus of analysts who monitor the company and the appraisals requested from independent experts of recognised prestige, the ACS Group has not experienced any loss nor, for reasons of prudence, any gain arising from the valuation of its ownership interest prior to its full consolidation.
The costs associated with the purchase of shares of Hochtief, A. G. were recognised in the consolidated income statement for the related year, and consequently, were not capitalised.
51CONSOLIDATED FINANCIAL STATEMENTS

ConsolidatedFinancial Statements
At that date, in accordance with IFRS 3, it was necessary to make an assessment so as to recognise the fair value of identifi able assets and liabilities acquired from Hochtief, A. G. separately from goodwill, the fair value of the identifi able assets and liabilities assumed from Hochtief, A.G. (“Purchase Price Allocation” or PPA) at the acquisition date. Since the ACS Group did not have all the information required for a fi nal assessment at the reporting date of the consolidated fi nancial statements, and in accordance with IFRS 3, the following provisional allocation was made, subsequent to which the Group is required to permanently allocate the purchase of the shares within 12 months:
The main adjustments made to the carrying amount of the assets and liabilities of Hochtief, A. G. were as follows.
• The main assets to which a higher value was attributed relate to the backlog of construction work and the relationships with customers, whose balances are amortised based on the useful life taken into account and whose effect on depreciation in the seven-month period ending on 31 December 2011 amounted to EUR 168 million.
• Additionally, a higher value was allocated in the PPA, for an attributed net amount of EUR 62 million, mainly relating to assets that were sold following the full consolidation of Hochtief and which were not consequently taken into account in the profi t of the ACS Group.
• Additionally, provisions amounting to EUR 216 million were recognised for estimated losses in different projects and investments of Hochtief, part of which were used over the seven months of full consolidation.
• Hochtief’s sales in 2011 amounted to EUR 23,282,236 thousand and the net loss attributable to the parent was EUR 160,288 thousand. Also, in 2010 the company’s sales for the whole year amounted to EUR 20,159,286 thousand, with a net profi t attributable to the parent of EUR 288,030 thousand.
52 ANNUAL REPORT 2011 OF ACS GROUP ECONOMIC AND FINANCIAL REPORT
Thousands of euros
Carrying amount
Allocation of net assets
Fair value of net assets
Tangible assets - property, plant and equipment 2,041,252 - 2,041,252
Intangible assets 565,832 1,504,370 2,070,202
Remainder of non-current assets 3,825,626 (28,918) 3,796,708
Current assets 9,131,438 (68,355) 9,063,083
Non-current liabilities (2,903,875) (1,692,459) (4,596,334)
Current liabilities (8,836,023) (254,227) (9,090,250)
Total net assets 3,824,250 (539,589) 3,284,661
Non-controlling interests (1,268,420) 120,423 (1,147,997)
Fair value of the fully acquired net assets 2,136,664
Fair value of assets relating to non-controlling interests 1,172,663
Fair value of the net assets of the acquirer 964,001
Cumulative reserves from the purchase to the fi rst date of full consolidation (28,353)
Purchase price 2,371,136
Goodwill (Note 04.01) 1,378,782

In accordance with IAS 27, in all purchases of shares of Hochtief, A. G. subsequent to 1 June 2011, given that the company’ was fully consolidated, the goodwill relating to the purchases was recognised against reserves (EUR 123,018 thousand).
The changes in the scope of consolidation include, inter alia, the sale of certain wind powered facilities and solar thermal power plants as well as the sale of ownership interests in various Brazilian concession companies providing electric power transmission lines in that country, as well as the sale of certain mining contracts of Henry Walker Eltin in addition to the ownership interest in the mining company Burton through Leighton. These disposals had no impact on the income statement of the ACS Group since the capital gains had been eliminated as a result of the adjustments made in the PPA.
Other disposals of ownership interests in the share capital of subsidiaries, joint ventures or associates in 2011 were as follows:
The most signifi cant changes in the scope of consolidation in 2010 were as follows:
The sale on 31 August 2010, to the investment fund advisor CVC Capital Partners, of 25.83% of the ownership interest in Abertis Infraestructuras, S.A. for EUR 15 per share to two companies, Admirabilia, S L. and Trebol International, B.V. Under this agreement Admirabilia, S.L. acquired a 10.28% share in Abertis through a contribution and sale, and Trebol acquired the remaining 15.55% through a sale. The share capital of Admirabilia, S.L. was distributed among the shareholders as follows: at a rate of 99%, for the ACS Group and 1% for Trebol. The ownership interest in Trebol was distributed among the shareholders at a rate of 99% for Trebol Holdings S.A.R.L. and 1% for the ACS Group. At both companies 60% of the voting rights pertain to Trebol Holdings S.A.R.L. and the remaining 40% to the ACS Group. Accordingly, Admirabilia, S.L. was accounted for using the equity method. After having eliminated the profi t earned by companies of the same ACS Group, thus reducing the carrying amount of the company, the gain on the disposal of the company net of taxes amounted to EUR 519,977 thousand, which was recognised under “Impairment and gains or losses on the disposal of fi nancial instruments” in the accompanying consolidated income statement.
Decrease in ownership interest in Subsidiaries, Joint Ventures and/or Investments in Associates or Other Operations of a Similar Nature
Name of the company (line of business)sold, spun-off or winded-up Category
Effective transaction date
% of voting power
disposed of
% of voting power in the
company following disposal
Gain (loss) (Thousands of
Euros)
Iquique Terminal Internacional, S.A. Associate 17/06/2011 40.00% 0.00% 13,821
Pt Operational Services Pty Ltd. Associate 01/06/2011 33.40% 0.00% 4,578
Vectra, S.A. Subsidiary 30/06/2011 100.00% 0.00% 6,322
Remolcadores de Barcelona, S.A. Subsidiary 30/06/2011 75.98% 0.00% 5,657
Taurus Holdings Chile S.A. Subsidiary 20/12/2011 100.00% 0.00% 156,988
I 595 Express, Llc. Subsidiary 07/12/2011 50.00% 50.00% 51,870
Servicios Hospitalarios Line of business 20/09/2011 100.00% 0.00% 33,497
53CONSOLIDATED FINANCIAL STATEMENTS
ConsolidatedFinancial Statements
For the partial fi nancing of this acquisition, an agreement was reached by Admirabilia, S.L. and Trebol International, B.V. with a syndicate of banks (including La Caixa, Banco Santander, Mediobanca and Société General) for the arrangement of a loan amounting to EUR 1,500 million divided into two tranches: One amounting to EUR 1,250 million, maturing in three years; and the other to EUR 250 million and maturing in one year.
Also noteworthy was the sale in December 2010 of its ownership interests in different Brazilian concession companies providing a total of eight power transmission lines in this country, with combined gains net of taxes amounting to EUR 38,799 thousand, which were recognised under the heading “Impairment and gains or losses on the disposal of fi nancial instruments” in the accompanying consolidated income statement.
In 2010 the ACS Group sold its ownership interest in the Platinum Corridor highway in South Africa with gains net of taxes amounting to EUR 57,856 thousand, which were recognised under the heading “Impairment and gains or losses on the disposal of fi nancial instruments” in the accompanying consolidated income statement (Note 29).
Finally, also notable was the sale of assets relating to the port and logistics activities which had been classifi ed as a discontinued operation (Note 03.09), and whose parent was Dragados SPL.
There were no signifi cant business combinations after the end of the reporting period and before the preparation of these consolidated fi nancial statements, except those indicated under the Note “Subsequent Events” in relation to the sale of Clece (Note 32).
Appendix IV contains information on the remaining acquisitions and disposals, as well as increases and decreases in ownership interest affecting the scope of consolidation.
03. Accounting policiesThe principal accounting policies used in preparing the Group’s consolidated fi nancial statements, in accordance with International Financial Reporting Standards (IFRSs), as adopted by the European Union, were as follows:
03.01. Goodwill
Goodwill arising on consolidation represents the excess of the cost of acquisition over the Group’s interest in the fair value of the identifi able assets and liabilities of a subsidiary or jointly controlled entity at the date of acquisition.
Any excess of the cost of the investments in the consolidated companies over the corresponding underlying carrying amounts acquired, adjusted at the date of fi rst-time consolidation, is allocated as follows:
• Those attributable to specifi c assets and liabilities of the companies acquired, by increasing the value of the assets (or reducing the value of the liabilities) whose market values were higher (lower) than the carrying amounts at which they had been recognised in their statements of fi nancial position and whose accounting treatment was similar to that of the same assets (liabilities) of the Group: amortisation, accrual, etc. Those attributable to specifi c intangible assets, by recognizing them explicitly in the consolidated statement of fi nancial position provided that the fair value at the date of acquisition can be measured reliably.
54 ANNUAL REPORT 2011 OF ACS GROUP ECONOMIC AND FINANCIAL REPORT
• Goodwill is only recognised when it has been acquired for consideration and represents, therefore, a payment made by the acquirer in anticipation of future economic benefi ts from assets of the acquired company that are not capable of being individually identifi ed and separately recognised.
• Goodwill acquired on or after 1 January 2004, is measured at acquisition cost and that acquired earlier is recognised at the carrying amount at 31 December 2003.
In both cases, at the end of each reporting period goodwill is reviewed for impairment (i.e. a reduction in its recoverable amount to below its carrying amount) and any impairment is written down with a charge to “Impairment and Net Gains or Losses on the Disposal of Non-Current Assets” in the consolidated income statement, since, as stipulated in IFRS 3, goodwill is not amortised.
An impairment loss recognised for goodwill must not be reversed in a subsequent period.
On disposal of a subsidiary or jointly controlled entity, the attributable amount of goodwill is included in the determination of the gain or loss on disposal.
Goodwill arising on the acquisition of companies with a functional currency other than the Euro is translated to Euros at the exchange rates prevailing at the date of the consolidated statement of fi nancial position, and changes are recorded as either exchange gains or losses or impairment losses.
Any negative differences between the cost of investments in consolidated companies and associates below the related underlying carrying amounts acquired, adjusted at the date of fi rst-time consolidation, is are classifi ed as negative goodwill and is allocated as follows:
• If the negative goodwill is attributable to specifi c assets and liabilities of the companies acquired, by increasing the value of the liabilities (or reducing the value of the assets) whose market values were higher (lower) than the carrying amounts at which they had been recognised in their statements of fi nancial position and whose accounting treatment was similar to that of the same assets (liabilities) of the Group: amortisation, accrual, etc.
• The remaining amounts are presented under “Other Profi t or Loss” in the consolidated income statement for the year in which the share capital of the subsidiary or associate is acquired.
03.02. Other intangible assets
The other intangible assets are identifi able non-cash assets without physical substance which arise as a result of a legal transaction or which are developed internally by the consolidated companies. Only assets whose cost can be estimated reliably and from which the consolidated companies consider it probable that future economic benefi ts will be generated are recognised.
Intangible assets are measured initially at acquisition or production cost and are subsequently measured at cost less any accumulated amortisation and any accumulated impairment losses. These assets are amortised over their useful life.
The ACS Group recognises any impairment loss on the carrying amount of these assets with a charge to “Impairment and Gains on the Disposal of Non-Current current Assets” in the consolidated income statement. The criteria used to recognise the impairment losses on these assets and, where applicable, the reversal of impairment losses recognised in prior years are similar to those used for tangible assets - property, plant and equipment (Note 03.06).
55CONSOLIDATED FINANCIAL STATEMENTS

ConsolidatedFinancial Statements
03.02.01. Development Expenditure
Development expenditure is only recognised as intangible assets if the all of the following conditions are met:
a) an identifi able asset is created (such as computer software or new processes); b) it is probable that the asset created will generate future economic benefi ts; and c) the development cost of the asset can be measured reliably.
Internally generated intangible assets are amortised on a straight-line basis over their useful lives (over a maximum of fi ve years). Where no internally generated intangible asset can be recognised, development expenditure is recognised as an expense in the year in which it is incurred.
03.02.02. Administrative Concessions
Concessions may only be recognised as assets when they have been acquired by the Group for a consideration (in the case of concessions that can be transferred) or for the amount of the expenses incurred to directly obtain the concession from the State or from the related public agency.
Concessions are generally amortised on a straight-line basis over the term of the concession.
In the event of non-compliance, leading to the loss of the concession rights, the carrying amount of the concession is written off.
03.02.03. Computer Software
The acquisition and development costs incurred in relation to the basic computer systems used in the Group’s management are recorded with a charge to “Other Intangible Assets” in the consolidated statement of fi nancial position.
Computer system maintenance costs are recognised with a charge to the consolidated income statement for the year in which they are incurred.
Computer software may be contained in a tangible asset or have physical substance and, therefore, incorporate both tangible and intangible elements. These assets will be recognised as tangible assets - property, plant and equipment if they constitute an integral part of the related tangible asset, which cannot operate without that specifi c software.
Computer software is amortised on a straight-line basis over a period of between three and four years from the entry into service of each application.
03.02.04. Remaining Intangible Assets
The remaining intangible assets relate to the acquired companies’ construction order book and client base. These intangible assets are measured at fair value on the date of their acquisition, and if material, on the basis of independent external reports. The assets are amortised in the fi ve to ten year period in which it is estimated that profi t will be contributed to the Group.
56 ANNUAL REPORT 2011 OF ACS GROUP ECONOMIC AND FINANCIAL REPORT
03.03. Tangible assets - property, plant and equipment
Land and buildings acquired for use in the production or supply of goods or services or for administrative purposes are stated in the balance sheet at acquisition or production cost less any accumulated depreciation and any recognised impairment losses.
Capitalised costs include borrowing costs relating to external fi nancing incurred only during the period of construction of the assets, provided that it is probable that they will give rise to future economic benefi ts for the Group. The capitalised borrowing costs relate both to specifi c fi nancing expressly for the acquisition of assets and to general fi nancing in accordance with the criteria of IAS 23. Investment income earned on the temporary investment of specifi c borrowings pending their expenditure on qualifying assets is deducted from the borrowing costs eligible for capitalisation. All other interest costs are recognised in profi t or loss in the year in which they are incurred.
Replacements or renewals of complete items that lead to a lengthening of the useful life of the assets or to an increase in their economic capacity are recognised as additions to tangible assets - property, plant and equipment, and the items replaced or renewed are derecognised.
Periodic maintenance, upkeep and repair expenses are recognised in profi t or loss on an accrual basis as incurred.
Fixtures and equipment are stated at cost less accumulated depreciation and any recognised impairment loss.
Depreciation is calculated, using the straight-line method, on the basis of the acquisition cost of the assets less their residual value; the land on which the buildings and other structures stand has an indefi nite useful life and, therefore, is not depreciated.
The period tangible assets - property, plant and equipment depreciation charge is recognised in the consolidated income statement and is basically based on the application of depreciation rates determined on the basis of the following average years of estimated useful life of the various assets:
Notwithstanding the foregoing, the fi xed assets relating to certain service contracts which reverse back to the contracting body at the end of the term of the contract are depreciated over the lesser of the contract term or the useful life of the assets.
Assets held under fi nance leases are recognised in the corresponding asset category at the current value of the minimum payments to be made including their residual value, and are depreciated over their expected useful lives on the same basis as owned assets or, where shorter, over the term of the relevant lease.
Years of estimated useful life
Buildings 20-50
Plant and machinery 3-20
Other fi xtures, tools and furniture 3-14
Other items of tangible assets - property plant and equipment 4-12
57CONSOLIDATED FINANCIAL STATEMENTS
ConsolidatedFinancial Statements
Leases are classifi ed as fi nance leases whenever the terms of the lease transfer substantially all the risks and rewards of ownership to the lessee. All other leases are classifi ed as operating leases.
Assets held under fi nance leases are depreciated on a basis similar to that of owned assets. If there is no reasonable certainty that the lessee will ultimately obtain ownership of the asset upon the termination of the lease, the asset is depreciated over the shorter of its useful life or the term of the lease.
Interest relating to the fi nancing of assets held under fi nance leases is charged to consolidated profi t for the year in accordance with the effective interest method, on the basis of the repayment of the debt. All other interest costs are recognised in profi t or loss in the year in which they are incurred.
The gain or loss arising on the disposal or retirement of an asset is determined as the difference between the sales proceeds and the carrying amount of the asset and is recognised in the consolidated income statement.
The future costs that the Group will have to incur in respect of dismantling, restoration and environmental rehabilitation of certain facilities are capitalised to the cost of the asset, at present value, and the related provision is recognised. The Group reviews each year its estimates of these future costs, adjusting the value of the provision recognised based on the related studies.
03.04. Non-current assets in projects
This heading includes the amount of investments, mainly in transport, energy and environmental infrastructures which are operated by ACS Group subsidiaries and which are fi nanced by the project fi nance method (limited recourse fi nancing applied to projects).
These fi nancing structures are applied to projects capable in their own right of providing suffi cient guarantees to the participating fi nancial institutions with regard to the repayment of the funds borrowed to fi nance them. Thus, each project is performed through specifi c companies in which the project’s assets are fi nanced, on the one hand, through a contribution of funds by the developers, which is limited to a determined amount, and on the other, generally of a larger amount, through borrowed funds in the form of long-term debt. The debt servicing of these credit facilities or loans is mainly supported by the cash fl ows generated by the project in the future, and also by real guarantees on the project assets.
These assets are valued at the costs directly allocable to construction incurred through their entry into operation (studies and designs, compulsory purchases, reinstatement of services, project execution, project management and administration expenses, installations and facilities and similar items) and the portion relating to other indirectly allocable costs, to the extent that they relate to the construction period.
Also included under this heading will be the borrowing costs incurred prior to the entry into operation of the assets arising from external fi nancing thereof. The capitalised borrowing costs relate to specifi c fi nancing expressly for the acquisition of assets.
Repair and maintenance expenses which do not lead to a lengthening of the useful life of the assets or an extension of their production capacity are expensed currently.
The residual value, useful life and depreciation method used are reviewed periodically to ensure that the depreciation method used refl ects the pattern in which the economic benefi ts arising from operating the assets are received.
58 ANNUAL REPORT 2011 OF ACS GROUP ECONOMIC AND FINANCIAL REPORT

This heading also includes the amounts relating to concessions to which IFRIC 12 has been applied. These mainly relate to investments in transport, energy and environmental infrastructures operated by ACS Group subsidiaries and fi nanced by the method known as “Project fi nance” (limited recourse fi nancing applied to projects), regardless of whether the demand risk is assumed by the group or the fi nancial institution. The related loans are generally secured by the project cash fl ows.
The main features to be considered in relation to non-current assets in projects are as follows:
• The assets under concession are owned by the grantor in most cases.
• The grantor controls or regulates the service offered by the concession operator and the conditions under which it should be provided.
• The assets are operated by the concession operator as established in the concession tender specifi cations for an established concession period. At the end of this period, the assets are returned to the grantor, and the concession operator has no right whatsoever over these assets.
• The concession operator receives revenues for the services provided either directly from the users or through the grantor.
Generally, there are two clearly differentiated phases: the fi rst where the concessionaire renders construction or improvement services to be recognised based on degree of completion in accordance with IAS 11 “Construction contracts”, with a balancing entry as either an intangible or fi nancial asset, and a second phase where a series of maintenance or operating services are rendered for the aforementioned infrastructures to be recognised in accordance with IAS 18 “Revenue”.
Either an intangible asset or fi nancial asset is recognised depending on whether demand risk is assumed by the concessionaire or the fi nancing party, respectively, since the concessionaire has an unconditional contractual right to charge for construction or improvement services. The fee amounts paid are also recognised under these asset items.
Combinations may also exist where the demand risk is shared between the concessionaire and the fi nancing party. This fi gure is irrelevant at the ACS Group.
All the infrastructures of the ACS Group concessionaires were built by Group companies, there being no infrastructures built by third parties. The revenue and expenses relating to infrastructure construction or improvement services are recognised at their gross amount (record of sales and associated costs), the construction margin being recognised in the consolidated fi nancial statements.
Intangible assets
For concessions classifi ed as intangible assets the provisions made for dismantling, removal or restoration are capitalised at the commencement of the concession, in addition to measures for improving and expanding capacity from which income is projected in the initial contract. The amortisation of these assets and the discounting of the aforementioned provisions are recognised in profi t and loss. Period provisions for infrastructure replacement and repairs are systematically recognised in the income statement as the obligation is incurred.
59CONSOLIDATED FINANCIAL STATEMENTS

ConsolidatedFinancial Statements
The interest arising from the fi nancing of the infrastructure is recognized in profi t or loss, excluding the interest accrued during the construction phase in the intangible asset model, which is capitalised until the infrastructures enter into operation.
Intangible assets are amortised on the basis of the expected consumption pattern, which is understood as the trend and best estimate of the production units for each of the different activities. Quantitatively, the most important concession business is highway construction, and the related assets are amortised on the basis of concession traffi c.
Financial assets
The concessions classifi ed as fi nancial assets are recognised at the fair value of the construction or improvement services rendered. According to the amortised cost method, the related revenue is recognised according to the interest rate of the accounts receivable arising from forecasted fl ows of concession collections and payments, and are recognised as net sales in the accompanying consolidated income statement. As explained above, for the provision of maintenance or operation services, revenue and expenses are charged to income in accordance with IAS 18 “Revenue”, as well as the interest costs associated with the concession, which are recognised according to their nature in the accompanying consolidated income statement.
Interest income on the concessions to which the accounts receivable model is applied is recognised as sales, since these are considered to be ordinary activities, forming part of the overall objective of the concessionaire, and are carried on and provide income on a regular basis.
Replacements or renewals of complete items that lead to a lengthening of the useful life of the assets or to an increase in their economic capacity are recognised as additions to tangible assets - property, plant and equipment, and the items replaced or renewed are derecognised.
The work performed by the Group for its fi xed assets are assessed at the production cost, with the exception of the work carried out for concession companies, which are assessed at the sale price.
Concession operators cover all the investment made on completion of the concession term by way of amortisation.
The non-current assets in projects are amortized amortised on the basis of their pattern of use, which is usually determined in the case of highways, by the expected traffi c for each year. However, there may be certain contracts that are characterised by having a term which is shorter than the useful life of the non-current assets in the same project, in which case the assets are amortized amortised based upon this term.
Companies periodically assess, at least at the end of each reporting period, whether there are signs of deterioration of any tangible asset or set of tangible assets -property, plant or equipment, as indicated in Note 03.06, in order to make or reverse provisions for the deterioration of the assets to adjust their net book value to their usage value.
The companies consider that the periodic maintenance plans of their facilities, whose cost is allocated to expenses in the year they are incurred, are suffi cient to ensure that the assets used are reverted in good working condition on completion of the concession terms and that, accordingly, no signifi cant expenses will arise as a result of the reversion.
60 ANNUAL REPORT 2011 OF ACS GROUP ECONOMIC AND FINANCIAL REPORT

03.05. Investment property
The Group classifies as investment property the investments in land and structures held either to earn rentals or for capital appreciation, rather than for their use in the production or supply of goods or services or for administrative purposes; or for their sale in the ordinary course of business. Investment property is measured initially at cost, which is the fair value of the consideration paid for the acquisition thereof, including transaction costs. Subsequently, accumulated depreciation, and where applicable, impairment losses are deducted from the initial cost.
In accordance with IAS 40, the ACS Group has elected not to periodically revaluate its investment property on the basis of its market value, but rather to recognise it at cost, net of the related accumulated depreciation, following the same criteria as for plant, property and equipment.
Properties in the course of construction for production, rental or administrative purposes, or for purposes not yet determined, are carried at cost, less any recognised impairment loss. Cost includes professional fees and, for qualifying assets, borrowing costs capitalised in accordance with the Group’s accounting policy. Amortisation of these assets, on the same basis as other property assets, commences when the assets are ready for their projected use.
Investment property is derecognised on disposal or when the investment property is permanently withdrawn from use and no future economic benefits are expected from its sale or disposal by any other means.
Gains or losses arising from the retirement, sale or disposal of the investment property by other means are determined as the difference between the net disposal proceeds from the transaction and the carrying amount of the asset, and is recognised in profit or loss in the period of the retirement or disposal.
Investment property is depreciated on a straight-line basis over its useful life, which is estimated to range from 25 to 50 years based on the features of each asset, less its residual value, if material.
03.06. Impairment of property, plant and equipment and intangible assets excluding goodwill
At the end of each reporting period, the Group reviews the carrying amount of its tangible and intangible assets, as well as its investment properties, to determine whether there is any indication that those assets have suffered an impairment loss. If any such indication exists, the recoverable amount of the asset is estimated in order to determine the extent of the impairment loss (if any). Where the asset itself does not generate cash fl ows that are independent from other assets, the Group estimates the recoverable amount of the cash-generating unit to which the asset belongs.
Recoverable amount is the higher of fair value less costs to sell and value in use. In assessing value in use, the estimated future cash fl ows are discounted to their present value using a pre-tax discount rate that refl ects current market assessments of the time value of money and the risks specifi c to the asset for which the estimates of future cash fl ows have not been adjusted.
61CONSOLIDATED FINANCIAL STATEMENTS

ConsolidatedFinancial Statements
If the recoverable amount of an asset (or cash-generating unit) is estimated to be less than its carrying amount, the carrying amount of the asset (cash-generating unit) is reduced to its recoverable amount. An impairment loss is recognised as an expense immediately.
Where an impairment loss subsequently reverses, the carrying amount of the asset (cash-generating unit) is increased to the revised estimate of its recoverable amount, but so that the increased carrying amount does not exceed the carrying amount that would have been determined had no impairment loss been recognised for the asset (cash-generating unit) in prior years. A reversal of the impairment loss is recognised as income immediately.
03.07. Inventories
Inventories are stated at the lower of cost and net realisable value. Cost comprises direct materials and, where applicable, direct labour costs and overheads incurred in bringing the inventories to their present location and condition.
Trade discounts, rebates and other similar items are deducted in determining the costs of purchase.
The cost of inventories is calculated by using the weighted average cost formula. Net realisable value is the estimated selling price less the estimated costs of completion and costs to be incurred in marketing, selling and distribution.
The Group assesses the net realisable value of the inventories at year-end and recognises the appropriate loss if the inventories are overstated. When the circumstances that previously caused inventories to be written down no longer exist or when there is clear evidence of an increase in net realisable value because of changed economic circumstances, the amount of the write-down is reversed.
03.08. Non-current and other fi nancial assets
Except in the case of fi nancial assets at fair value through profi t or loss, fi nancial assets are initially recognised at fair value, plus directly attributable transaction costs. The Group classifi es its fi nancial investments in four categories regardless of whether they are long- or short-term, excluding investments in associates and assets held for sale.
In the statement of fi nancial position, fi nancial assets maturing within no more than 12 months are classifi ed as current assets and those maturing within more than 12 months as non-current assets.
03.08.01. Loans and receivables
These are non-derivative fi nancial assets with fi xed or determinable payments not traded in an active market. After their initial recognition, they are measured at amortised cost using the effective interest method.
The amortised cost is understood to be the initial cost of a fi nancial asset or liability minus principal repayments, plus or minus the cumulative amortisation of any difference between that initial amount and the maturity amount. As regards fi nancial assets, amortised cost includes any impairment losses that the asset may have suffered.
62 ANNUAL REPORT 2011 OF ACS GROUP ECONOMIC AND FINANCIAL REPORT
The effective interest rate is the discount rate that exactly matches the net carrying amount of a fi nancial instrument to all its estimated cash fl ows of all kinds through its residual life.
Deposits and guarantees given are recognised at the amount delivered to meet contractual commitments, regarding gas, water and lease agreements, etc.
Period changes for impairment and reversals of impairment losses on fi nancial assets are recognised in the consolidated income statement for the difference between their carrying amount and the present value of the recoverable cash fl ows.
03.08.02. Held-to-maturity investments
These are non-derivative fi nancial assets with fi xed or determinable payments and fi xed maturity that the Group has the positive intention and ability to hold to the date of maturity. After their initial recognition, they are also measured at amortised cost.
03.08.03. Financial assets at fair value through profi t or loss
These include the fi nancial assets held for trading and fi nancial assets managed and measured using the fair value model. These assets are measured at fair value in the consolidated statement of fi nancial position and changes are recognised in the consolidated income statement.
03.08.04. Available-for-sale investments
These are non-derivative fi nancial assets designated as available for sale or not specifi cally classifi ed within any of the previous categories. These relate mainly to investments in the share capital of companies not included in the scope of consolidation.
After their initial recognition at acquisition cost, these investments are measured at fair value, and the gains and losses from changes in fair value are recognised directly in equity until the asset is disposed of or it is determined that it has become impaired, at which time the cumulative gains or losses previously recognised in equity under the heading “Adjustments for changes in value” are recognised in the profi t or loss for the year of the related fi nancial assets.
The fair value of investments actively traded in organised fi nancial markets is determined by reference to their closing market price at year-end. Investments for which there is no active market and whose fair value may not reliably be determined are valued at cost or at a lesser cost in the event that impairment is evidenced.
03.08.05. Derecognition of fi nancial assets
The Company derecognises a fi nancial asset when the contractual rights to the cash fl ows from the assets have expired or have been transferred and the Company has transferred substantially all the risks and rewards of ownership, as in the case of fi rm sales, transfers of trade receivables in factoring transactions in which no credit or interest risk is retained, sales of fi nancial assets in relation to which repurchase agreements have been entered into at fair value or securitizations of fi nancial assets in which the assignor does not retain subordinating fi nancing or grant any type of guarantee or assume any other type of risk.
63CONSOLIDATED FINANCIAL STATEMENTS
ConsolidatedFinancial Statements
On the contrary, the Group does not derecognise fi nancial assets, and recognises a fi nancial liability for an amount equal to the consideration received where the Company retains substantially all the risks and rewards of ownership of the transferred asset, as in the case of draft discounting facilities, recourse factoring, the sale of fi nancial assets in relation to which a repurchase agreement is entered into at a fi xed price or at the sale price plus interest, and the securitisation of fi nancial assets in which the assignor retains subordinated fi nancing or other types of guarantees covering substantially all of the projected losses.
03.08.06. Fair value hierarchy
The assets and liabilities measured at fair value are broken down by levels in accordance with IFRS 7:
Level 1: Quoted prices (not adjusted) on active markets for identical assets or liabilities instruments.
Level 2: Data other than the listed price included in Level 1 that is observable for the asset or liability instrument, both directly (i.e. the prices) and indirectly (i.e. derived from the prices).
Level 3: Data for the asset or liability instrument that is not based upon observable market data.
03.09. Non-current assets held for sale, liabilities relating to non-current assets held-for-sale and discontinued operations
At 31 December 2011, the non-current assets held for sale related mainly to renewable energy assets (wind farms and solar thermal plants),ownership interests in the airports managed by Hochtief, certain concession assets relating to highways, transmission lines, logistics and integral maintenance activities carried on by Clece S.A. (the latter was considered to be a discontinued operation). In all the above cases a formal decision was made by the Group to sell these assets, a plan for their sale was initiated, the assets were made available-for-sale in their current condition and the sale is expected to be completed within a period of 12 months from the date of their classifi cation as assets held for sale.
Additionally, in 2011 some circumstances arose which were considered to be unlikely in 2010 and certain assets classifi ed as held-for-sale at the end of 2010 were not sold in 2011 (primarily assets relating to the renewable energy line of business). However, the group remains committed to its sale plans and all such assets are actively being marketed at a reasonable price which is higher than their book value. It is highly probable that these assets will be sold within the next twelve months.
Since the Group continued to have control over the Clece group (comprising Clece S.A., and its subsidiaries) at 31 December 2011, the “Non-controlling interests” related to this ownership interest continued to be recognised until control was lost on 8 March 2012 (see Note 32). At 31 December 2010, there were no assets held for sale relating to discontinued operations.
At 31 December 2010, the non-current assets held for sale related mainly to renewable energy assets (wind farms and solar thermal plants), whether domestic or international, certain power transmission lines in Brazil, which were sold in the fi rst months of 2011, and certain ports and logistics assets such as Remolcadores de Barcelona, S.A., whose sale had not been fi nalised at the date of this report.
64 ANNUAL REPORT 2011 OF ACS GROUP ECONOMIC AND FINANCIAL REPORT
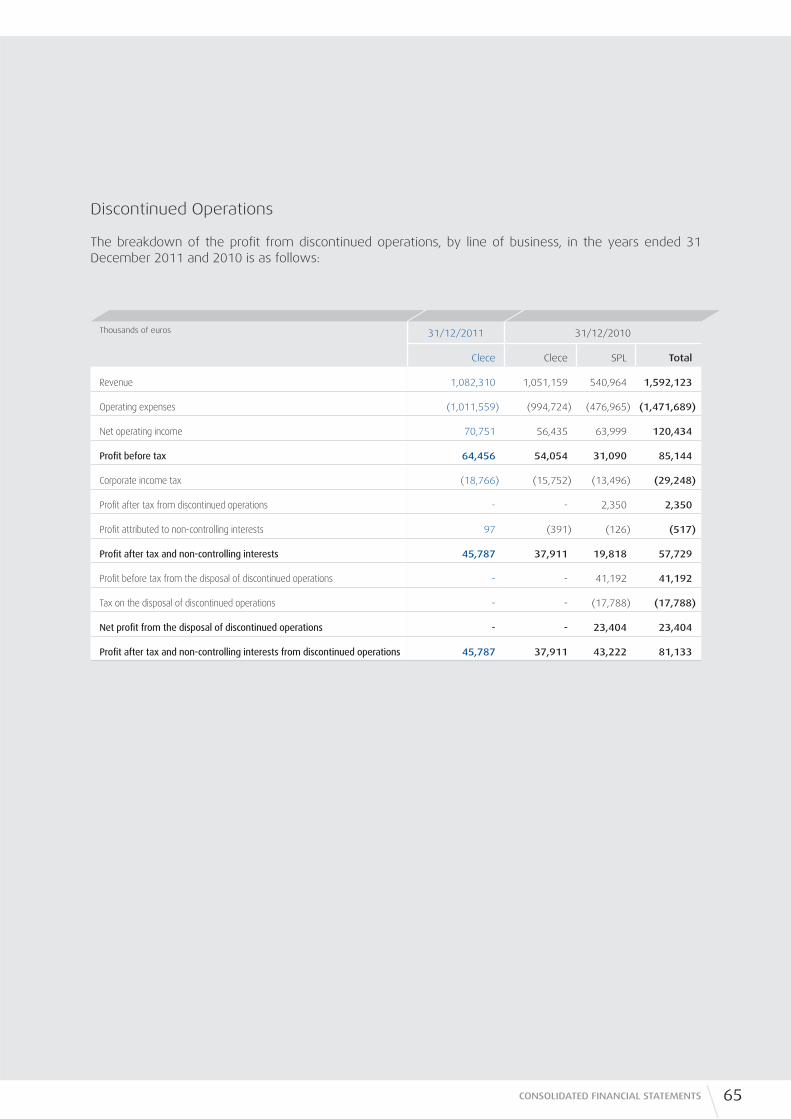
Discontinued Operations
The breakdown of the profi t from discontinued operations, by line of business, in the years ended 31 December 2011 and 2010 is as follows:
65CONSOLIDATED FINANCIAL STATEMENTS
Thousands of euros 31/12/2011 31/12/2010
Clece Clece SPL Total
Revenue 1,082,310 1,051,159 540,964 1,592,123
Operating expenses (1,011,559) (994,724) (476,965) (1,471,689)
Net operating income 70,751 56,435 63,999 120,434
Profi t before tax 64,456 54,054 31,090 85,144
Corporate income tax (18,766) (15,752) (13,496) (29,248)
Profi t after tax from discontinued operations - - 2,350 2,350
Profi t attributed to non-controlling interests 97 (391) (126) (517)
Profi t after tax and non-controlling interests 45,787 37,911 19,818 57,729
Profi t before tax from the disposal of discontinued operations - - 41,192 41,192
Tax on the disposal of discontinued operations - - (17,788) (17,788)
Net profi t from the disposal of discontinued operations - - 23,404 23,404
Profi t after tax and non-controlling interests from discontinued operations 45,787 37,911 43,222 81,133
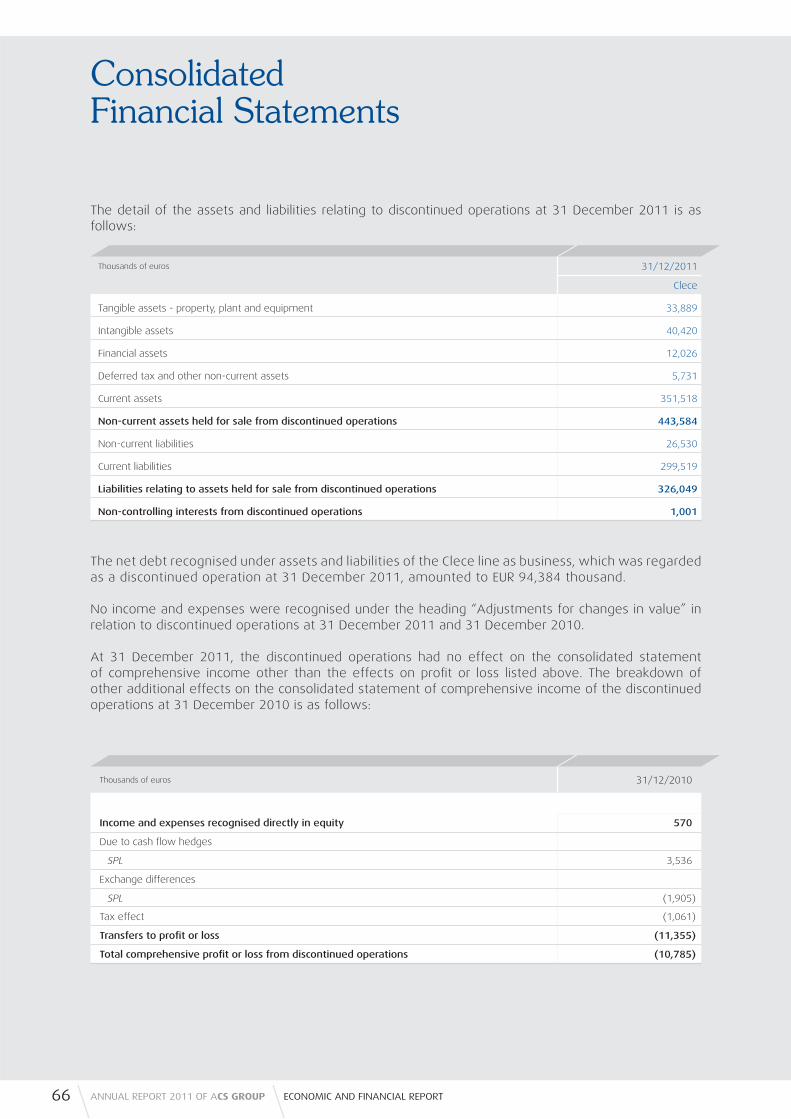
ConsolidatedFinancial Statements
The detail of the assets and liabilities relating to discontinued operations at 31 December 2011 is as follows:
The net debt recognised under assets and liabilities of the Clece line as business, which was regarded as a discontinued operation at 31 December 2011, amounted to EUR 94,384 thousand.
No income and expenses were recognised under the heading “Adjustments for changes in value” in relation to discontinued operations at 31 December 2011 and 31 December 2010.
At 31 December 2011, the discontinued operations had no effect on the consolidated statement of comprehensive income other than the effects on profi t or loss listed above. The breakdown of other additional effects on the consolidated statement of comprehensive income of the discontinued operations at 31 December 2010 is as follows:
66 ANNUAL REPORT 2011 OF ACS GROUP ECONOMIC AND FINANCIAL REPORT
Thousands of euros 31/12/2011
Clece
Tangible assets - property, plant and equipment 33,889
Intangible assets 40,420
Financial assets 12,026
Deferred tax and other non-current assets 5,731
Current assets 351,518
Non-current assets held for sale from discontinued operations 443,584
Non-current liabilities 26,530
Current liabilities 299,519
Liabilities relating to assets held for sale from discontinued operations 326,049
Non-controlling interests from discontinued operations 1,001
Thousands of euros 31/12/2010
Income and expenses recognised directly in equity 570
Due to cash fl ow hedges
SPL 3,536
Exchange differences
SPL (1,905)
Tax effect (1,061)
Transfers to profi t or loss (11,355)
Total comprehensive profi t or loss from discontinued operations (10,785)

The breakdown of the effect of the discontinued operations on the 2011 and 2010 statement of cash fl ows is as follows:
Non-current assets held for sale
The lines of business relating to the renewable energy assets and power transmission lines are included under the Industrial Services activity area. Certain of the remaining port and logistics assets are included in the Environmental activity area and lastly, certain concession assets such as highways and airports managed by Hochtief are included in the Construction activity area.
In addition to the aforementioned assets and liabilities, also included as non-current assets and liabilities relating to non-current assets are certain immaterial assets and liabilities held for sale from among the ACS Group companies.
The breakdown of the main assets and liabilities held for sale at 31 December 2011 and 2010 is as follows:
Thousands of euros 31/12/2011 31/12/2010
Clece Clece SPL Total
Cash fl ows from operating activities 14,016 37,851 (31,229) 6,622
Cash fl ows from investing activities - (7,260) 132,088 124,828
Cash fl ows from fi nancing activities (14,016) 4,322 31,229 35,551
Net cash fl ows from discontinued operations - 34,913 132,088 167,001
67CONSOLIDATED FINANCIAL STATEMENTS
Thousands of euros 31/12/2011 31/12/2010
SPLRenewable
energyTransmission
lines Concessions
Airports managed by
Hochtief Other Total SPLRenewable
energyTransmission
lines Total
Tangible assets - property, plant and equipment 31,050 21,451 - 770 201 9,092 62,564 77,820 19,204 - 97,024
Intangible assets 37,435 32,173 - 1,072 5,910 22,865 99,455 68,589 93,667 - 162,256
Non-current assets in projects - 3,169,416 - 946,727 - 10,897 4,127,040 - 3,626,348 159,082 3,785,430
Non-current fi nancial assets 5,875 97,593 31,090 31,935 1,397,734 150,372 1,714,599 13,675 89,888 4,821 108,384
Deferred taxes and other non-current assets 1,276 81,338 789,272 43,695 975 294,778 1,211,334 192 57,412 3,339 60,943
Current assets 51,398 161,246 32,359 94,680 51,011 37,787 428,481 71,356 276,793 13,960 362,109
Non-current assets held for sale 127,034 3,563,217 852,721 1,118,879 1,455,831 525,791 7,643,473 231,632 4,163,312 181,202 4,576,146
Non-current liabilities 14,531 2,838,659 322,140 872,047 3,174 264,824 4,315,375 28,471 3,204,215 68,320 3,301,006
Current liabilities 36,031 198,002 21,739 56,689 16,097 25,359 353,917 36,505 237,495 15,044 289,044
Liabilities related to non-current assets held for sale 50,562 3,036,661 343,879 928,736 19,271 290,183 4,669,292 64,976 3,441,710 83,364 3,590,050
Non-controlling interests held for sale 14,841 2,109 - - 372,939 18,804 408,693 18,843 13,794 47,940 80,577
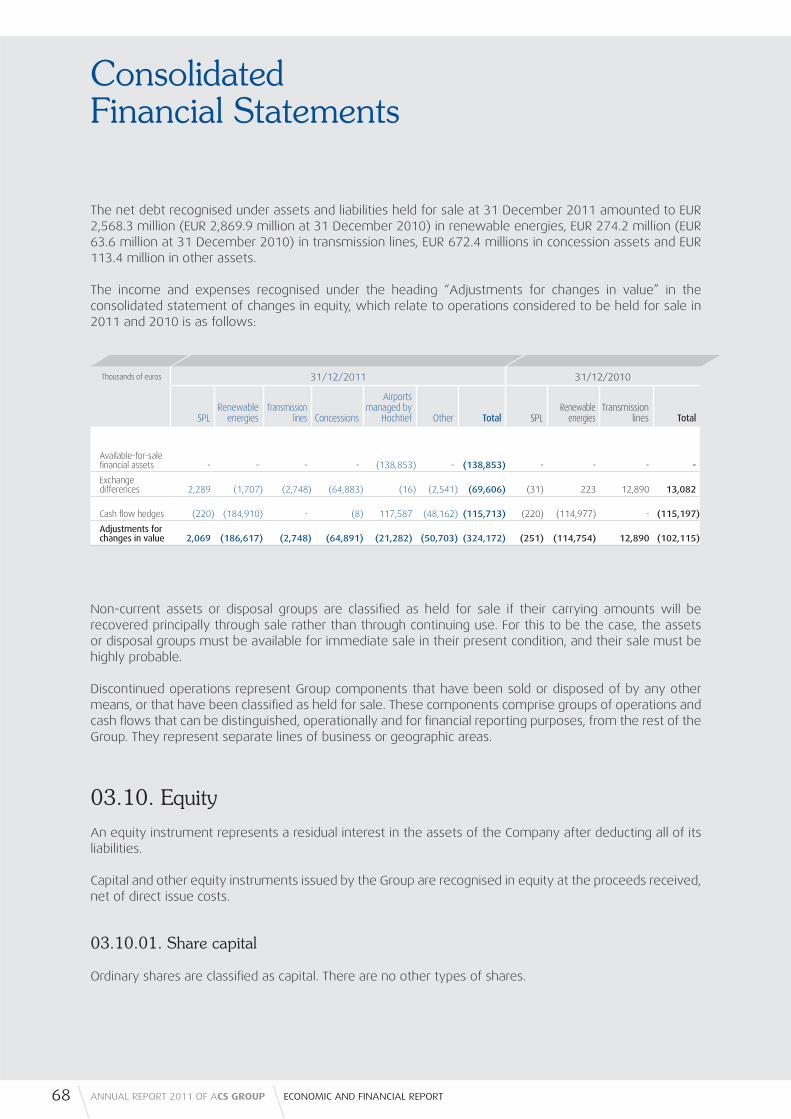
ConsolidatedFinancial Statements
The net debt recognised under assets and liabilities held for sale at 31 December 2011 amounted to EUR 2,568.3 million (EUR 2,869.9 million at 31 December 2010) in renewable energies, EUR 274.2 million (EUR 63.6 million at 31 December 2010) in transmission lines, EUR 672.4 millions in concession assets and EUR 113.4 million in other assets.
The income and expenses recognised under the heading “Adjustments for changes in value” in the consolidated statement of changes in equity, which relate to operations considered to be held for sale in 2011 and 2010 is as follows:
Non-current assets or disposal groups are classifi ed as held for sale if their carrying amounts will be recovered principally through sale rather than through continuing use. For this to be the case, the assets or disposal groups must be available for immediate sale in their present condition, and their sale must be highly probable.
Discontinued operations represent Group components that have been sold or disposed of by any other means, or that have been classifi ed as held for sale. These components comprise groups of operations and cash fl ows that can be distinguished, operationally and for fi nancial reporting purposes, from the rest of the Group. They represent separate lines of business or geographic areas.
03.10. Equity
An equity instrument represents a residual interest in the assets of the Company after deducting all of its liabilities.
Capital and other equity instruments issued by the Group are recognised in equity at the proceeds received, net of direct issue costs.
03.10.01. Share capital
Ordinary shares are classifi ed as capital. There are no other types of shares.
68 ANNUAL REPORT 2011 OF ACS GROUP ECONOMIC AND FINANCIAL REPORT
Thousands of euros 31/12/2011 31/12/2010
SPLRenewable
energiesTransmission
lines Concessions
Airports managed by
Hochtief Other Total SPLRenewable
energiesTransmission
lines Total
Available-for-sale fi nancial assets - - - - (138,853) - (138,853) - - - -
Exchange differences 2,289 (1,707) (2,748) (64,883) (16) (2,541) (69,606) (31) 223 12,890 13,082
Cash fl ow hedges (220) (184,910) - (8) 117,587 (48,162) (115,713) (220) (114,977) - (115,197)
Adjustments for changes in value 2,069 (186,617) (2,748) (64,891) (21,282) (50,703) (324,172) (251) (114,754) 12,890 (102,115)

Expenses directly attributable to the issue or acquisition of new shares are recognised in equity as a deduction from the amount thereof.
03.10.02. Treasury shares
Note 15.04 summarises the transactions performed with treasury shares in 2011 and 2010. Such shares are recognised as a reduction of equity in the accompanying statement of fi nancial position at 31 December 2011 and 2010.
When the Group acquires or sells treasury shares the amount paid or received for the treasury shares is recognised directly recognised in equity. No loss or gain from the purchase, sale, issue or amortisation of the Group’s own equity instruments is recognised in the consolidated income statement for the year.
The shares of the Parent are measured at average acquisition cost.
03.10.03. Stock Options
The Group has granted options on ACS, Actividades de Construcción y Servicios, S.A. shares to certain employees.
In accordance with IFRS 2, the options granted are deemed to be equity-settled share-based payment transactions and are therefore measured at fair value at the grant date and are expensed over the vesting period with a credit to equity, based on the periods of irrevocability of the options.
Since market prices are not available, the value of the share options has been determined using valuation techniques taking into consideration all factors and conditions that would have been applied in an arm’s length transaction between knowledgeable parties (Note 28.03).
In addition, the Hochtief Group has granted options on Hochtief, A. G. shares to management members.
03.11. Grants
The ACS Group has received grants from various government agencies mainly to fi nance investments in tangible assets - property, plant and equipment relating to environmental activity. Evidence of compliance with the conditions established in the related grant resolutions was provided to the relevant competent agencies.
Public grants given to the Group to acquire assets are carried to the consolidated income statement of the same period and on the same basis as those applied to depreciate the asset relating to the aforementioned grants.
Offi cial grants to compensate offset costs are recognised as income on a systematic basis over the periods necessary to match them with the related costs which they are intended to offset.
Offi cial grants receivable to offset for expenses or losses already incurred, or for the purpose of giving fi nancial support with no future related costs, are recognised as income in the period in which they become receivable.
69CONSOLIDATED FINANCIAL STATEMENTS
ConsolidatedFinancial Statements
03.12. Financial liabilities
Financial liabilities are classifi ed in accordance with the content and the substance of the contractual arrangements, bearing in mind the economic substance thereof.
The main fi nancial liabilities held by the Group companies relate to held-to-maturity fi nancial liabilities which are measured at amortised cost.
The fi nancial risk management policies of the ACS Group are detailed in Note 21.
03.12.01. Bank borrowings, debt and other securities
Interest-bearing bank loans and overdrafts are recognised at the proceeds received, net of direct issue costs. Finance charges, including premiums payable on settlement or redemption and direct issue costs, are recognised in profi t or loss on an accrual basis using the effective interest method and are added to the carrying amount of the instrument to the extent that they are not settled in the period in which they arise.
Loans are classifi ed as current items unless the Group has the unconditional right to defer repayment of the debt for at least 12 months from the end of the reporting period.
03.12.02. Trade and other payables
Trade payables are not interest bearing and are stated at their nominal value, which does not differ signifi cantly from their fair value.
03.12.03. Current/Non-current classifi cation
In the accompanying consolidated statement of fi nancial position debts due to be settled within 12 months are classifi ed as current items and those due to be settled within more than 12 months as non-current items.
Loans due within 12 months but whose long-term refi nancing is assured at the Group’s discretion, through existing long-term credit loan facilities, are classifi ed as non-current liabilities.
Limited recourse fi nancing of projects and debts is classifi ed based on the same criteria, and the detail thereof is shown in Note 18.
70 ANNUAL REPORT 2011 OF ACS GROUP ECONOMIC AND FINANCIAL REPORT

03.12.04. Retirement benefi t obligations
a) Post-employment benefi t obligations
Certain Group companies have post-employment benefi t obligations of various kinds to their employees. These obligations are classifi ed by group of employees and may relate to defi ned contribution or defi ned benefi t plans.
Under the defi ned contribution plans, the contributions made are recognised as expenditure under “Staff costs” in the consolidated income statements as they accrue, whereas for the defi ned benefi t plans actuarial studies are conducted once a year by independent experts using market assumptions and the expenditure relating to the obligations is recognised on an accrual basis, classifying the normal cost for the current employees over their working lives under “Staff costs” and recognising the associated fi nance cost, in the event that the obligation were to be fi nanced, by applying the rates relating to investment-grade bonds on the basis of the obligation recognised at the beginning of each year (see Note 21).
The post-employment benefi t obligations include, inter alia, those arising from certain companies of the Hochtief Group, for which the Group has recognised the related liabilities and whose recognition criteria are explained in Note 03.13.
b) Other employee benefi t obligations
The expense relating to termination benefi ts is recognised in full when there is an agreement or when the interested parties have a valid expectation that such an agreement will be reached that will enable the employees, individually or collectively and unilaterally or by mutual agreement with the company, to cease working for the Group in exchange for a termination benefi t. If a mutual agreement is required, a provision is only recognised in situations in which the Group considers that it will give its consent to the termination of the employees. If a mutual agreement is required, a provision is only recognised in situations in which the Group considers that it will give its consent to the termination of the employees.
03.12.05. Termination benefi ts
Under current legislation, the Spanish consolidated companies and certain foreign companies are required to pay termination benefi ts to employees terminated without just cause. There are no redundancy plans making it necessary to record a provision in this connection.
03.13. Provisions
The Group’s consolidated fi nancial statements include all the material provisions with respect to which it is considered that it is more likely than not that the obligation will have to be settled. Contingent liabilities are not recognised in the consolidated fi nancial statements, but rather are disclosed, as required by IAS 37.
Provisions, which are quantifi ed on the basis of the best information available on the consequences of the event giving rise to them and are reviewed and adjusted at the end of each year, are used to cater for the specifi c obligations for which they were originally recognised. Provisions are fully or partially reversed when such obligations cease to exist or are reduced.
71CONSOLIDATED FINANCIAL STATEMENTS
ConsolidatedFinancial Statements
Litigation and/or claims in process
At the end of 2011 certain litigation and claims were in process against the consolidated companies forming part of the ACS Group arising from the ordinary course of their operations. The Group’s legal advisers and directors consider that the outcome of litigation and claims will not have a material effect on the fi nancial statements for the years in which they are settled.
Provisions for termination benefi ts to employees
Also, pursuant to current legislation, a provision is recognised to meet the cost of termination of temporary employees with a contract for project work.
Provisions for pensions and similar obligations
In the case of foreign companies whose post-employment benefi t obligations are not externalised, noteworthy are the provisions for pensions and similar obligations recorded by various Hochtief Group companies as explained below.
Provisions for pensions and similar obligations are recognised as current and future benefi t payments for current employees and former employees and their dependants. The obligations mainly relate to basic and other optional supplementary pension benefi ts. Individual benefi t obligations vary from one country to another and are mostly determined by length of service and salary scale. The Turner Group’s obligation to pay the healthcare costs of its retired employees is also included in the provisions for pensions, due to its pension-related nature.
Provisions for pensions and similar obligations are calculated using the projected unit credit method, by which the present value of future rights are determined taking into account the current and future benefi ts already known on the reporting date, in addition to the expected increase in wages and pensions and, for the Turner Group, healthcare costs. The calculation is based on actuarial evaluations which use biometric criteria. The plan assets, as defi ned in IAS 19, are listed separately, as deductions from pension obligations. The plan assets include assets transferred to pension funds to meet the pension obligations, shares in investment funds acquired in accordance with deferred remuneration agreements, and qualifi ed insurance policies in the form of pension liability insurance. If the fair value of the plan assets is greater than the present value of the benefi ts to the employees, the difference is indicated under the heading “Non-current Assets”, subject to the limits set by IAS 19.
Under the option provided in IAS 19, actuarial gains and losses are recognised directly in equity in the period in which they occur. Current costs for the year are recognised under the heading “Staff Costs”. The interest effect on the increase in the pension obligations, reduced by the estimated return on the plan assets, is recognised as net investments and fi nancial income.
Past service costs are expensed currently, unless the changes in the pension plan depend on whether employees continue to work for a specifi c period of time (the tenure or vesting period). In this case, the past service costs are recorded under income from amortisation on a straight line basis in the year.
Provisions for completion of construction projects
Inspection fee expenses, estimated costs for site clearance and other expenses that may be incurred from completion of the project through fi nal settlement thereof are accrued over the execution period on the basis of production volumes and are recognised under “Current Provisions” on the liability side of the consolidated statements of fi nancial position.
72 ANNUAL REPORT 2011 OF ACS GROUP ECONOMIC AND FINANCIAL REPORT
Dismantling of non-current assets and environmental restoration
The Group is obliged to dismantle certain facilities at the end of their useful life, such as those associated with the closing of landfi lls, and to ensure the environmental restoration of the sites where they are located. The related provisions have been made for this purpose and the present value of the cost that these tasks would represent have been estimated, a concession asset being recorded as a balancing item.
Other provisions
Other provisions include mainly provisions for warranty costs.
03.14. Risk management policy
The ACS Group is exposed to certain risks which it manages by applying risk identifi cation, measurement, concentration limitation and monitoring systems.
The main principles defi ned by the Group for its risk management policy are as follows:
• Compliance with corporate governance standards.
• Establishment by the Group’s various lines of business and companies of the risk management controls required to assure that market transactions are performed in accordance with the policies, standards and procedures of the ACS Group.
• Special attention to the management of fi nancial risk, basically including interest rate risk, foreign currency risk, liquidity risk and credit risk (see Note 21).
The ACS Group’s risk management is of a preventative nature and is aimed at the medium- and long-term taking into account the most probable scenarios with respect to the performance of the variables affecting each risk.
03.15. Derivative fi nancial instruments
The Group’s activities are exposed mainly to fi nancial risks of changes in foreign exchange rates and interest rates. The transactions performed are in line with the risk management policy defi ned by the Group.
Derivatives are initially recognised at acquisition cost in the consolidated statement of fi nancial position and the required value adjustments are subsequently made to refl ect their fair value at all times. These adjustments are recorded under “Financial Instrument Receivables” in the consolidated statement of fi nancial position if they are positive and under “Financial Instrument Payables” if they are negative. Gains and losses from fair value changes are recognised in the consolidated income statement, unless the derivative has been designated and is highly effective as a hedge, in which case it is recognised as follows:
73CONSOLIDATED FINANCIAL STATEMENTS
ConsolidatedFinancial Statements
Fair value hedges
The hedged item and hedging instrument are both measured at fair value, and changes in fair value are recognised in the consolidated income statement under “Changes in the Fair Value of Financial Instruments”.
Cash fl ow hedges
Changes in the fair value of the derivatives are recognised, in respect of the effective portion of the hedges, in equity under “Adjustments for Changes in Value” in the accompanying consolidated statement of fi nancial position. Hedges are considered to be effective or effi cient for derivatives in relation to which the effectiveness test results are within a range of 80% to 125%. The cumulative gain or loss recognised in this account is transferred to the consolidated income statement to the extent that the underlying has an impact on this account in relation to the hedged risk, and the related effect is deducted from the same heading in the consolidated income statement.
Hedge accounting is discontinued when the hedging instrument expires or is sold, terminated or exercised, or no longer qualifi es for hedge accounting. At that time, any cumulative gain or loss on the hedging instrument recognised in equity is retained in equity until the forecast transaction occurs. If a hedged transaction is no longer expected to occur, the net cumulative gain or loss recognised in equity is transferred to net profi t or loss for the year.
Derivatives embedded in other fi nancial instruments or other host contracts are treated as separate derivatives when their risks and characteristics are not closely related to those of the host contracts and the host contracts are not carried at fair value with unrealised gains or losses reported in the income statement.
The fair value of the derivative fi nancial instruments is calculated as follows:
• For derivatives whose underlying is quoted in an organized organised market, valuation is based on a Value at Risk (VaR) analysis, which determines the asset’s expected value, taking into consideration its exposure to risk for a certain confi dence level on the basis of market performance, the asset’s characteristics and the potential loss arising under a scenario which is highly unlikely to occur. The analysis is based on applying a normal distribution to the daily evolution of the asset’s price and the use of the expected volatility required on the basis of the derivative’s characteristics to establish the probability associated to the required confi dence level. For the purposes of this calculation, the periods required to undo this position without affecting the market are taken into account. The outstanding fi nancial costs associated with each derivative evaluated is deducted from the values obtained.
• Derivatives not traded in organised markets are valued using normal fi nancial market techniques, i.e., discounting the expected cash fl ows in the contract in view of its characteristics, such as the notional amount and the collection and payment schedule, based on spot and forward market conditions at the reporting date. Interest rate swaps are measured using zero-coupon curves, which is determined on the basis of the deposits and swaps traded at a given time through a bootstrapping process through which the discount factors are obtained. For derivatives with caps and fl oors or combinations thereof, occasionally tied to the fulfi lment of special obligations, the interest rates used are the same as in the case of interest rate swaps. However, in order to allow for the random exercise of options, the Black-Scholes methodology is used, as is standard practice in the fi nancial market.
74 ANNUAL REPORT 2011 OF ACS GROUP ECONOMIC AND FINANCIAL REPORT
03.16. Revenue recognition
Revenue is recognised to the extent that the economic benefi ts associated with the transaction fl ow to the Group. Revenue is measured at the fair value of the consideration received or receivable and represents the amounts receivable for the goods and services provided in the normal course of business, net of discounts, VAT and other sales-related taxes.
Sales of goods are recognised when substantially all the risks and rewards arising from their ownership have been transferred.
Revenue associated with the rendering of services is recognised by reference to the stage of completion of the transaction at the end of the reporting period date, provided the outcome of the transaction can be estimated reliably.
In an agency relationship, when the reporting company acts as a commission agent, the gross infl ows of economic benefi ts for amounts collected on behalf of the principal do not result in increases in equity for the company. Therefore, these infl ows are not revenue and, instead, revenue is the amount of commissions.
Interest income is accrued on a time proportion basis, by reference to the principal outstanding and the effective interest rate applicable, which is the rate that exactly discounts estimated future cash receipts through the expected life of the fi nancial asset to that asset’s net carrying amount.
Dividend income from investments is recognised when the shareholder’s rights to receive payment have been established.
Following is a disclosure of specifi c revenue recognition criteria for certain activities carried on by the Group.
03.16.01. Construction business
In the construction business, the outcome of a construction contract is recognised by the percentage of completion method. The amount of production carried out until the reporting date is recognised as revenue on the basis of the percentage of completion of the entire project. The percentage of completion is measured by reference to the state of completion of the construction work, i.e. the percentage of work performed until the reporting date with respect to the total contract work performed. In these cases, this percentage of completion is determined by measuring the work performed.
In the construction line of business, the estimated revenues and costs of construction projects are susceptible to changes during the performance period which cannot be readily foreseen or objectively quantifi ed. In this connection, production each year is valued at certifi cation price of the units completed in the period that, since they are covered in the contract entered into with the owners, or in approved addenda or amendments thereto, do not give rise to any doubts regarding their certifi cation. In addition, production is valued at certifi cation price of other project units that have already been completed for which management of the consolidated companies consider there is reasonable assurance of recovery.
75CONSOLIDATED FINANCIAL STATEMENTS

ConsolidatedFinancial Statements
Should the amount of production from inception, valued at certifi cation price, of each project be greater than the amount certifi ed through the date of the statement of fi nancial position, the difference between the two amounts is recorded under “Trade and Other Receivables” on the asset side of the consolidated statement of fi nancial position. Should the amount of production from inception be lower than the amount of the certifi cates issued, the difference is recorded as “Customer Advances” under the heading “Trade and Other Payables” on the liability side of the consolidated statement of fi nancial position.
Machinery or other fi xed assets acquired for a specifi c project are depreciated over the estimated project execution period and on the basis of the consumption pattern thereof Permanent facilities are depreciated on a straight-line basis over the project execution period. The other assets are depreciated in accordance with the general criteria indicated in these notes to fi nancial statements.
Late-payment interest arising in relation to delays in the collection of certifi cation amounts is recognised when collected.
03.16.02. Industrial Services, environment and other service businesses
Group companies recognise as the outcome from the rendering of services for each year the difference between production (valued at the sale price of the services provided during the period, which are covered by the initial contract entered into with the customer or in approved modifi cations or addenda thereto, and of services which have not yet been approved but there is reasonable assurance of recovery) and the costs incurred in the year.
Price increases recognised in the initial contract entered into with the customer are recognised as revenue on an accrual basis, regardless of whether they have been approved annually by it.
Late-payment interest is recognised as fi nancial income when fi nally approved or collected.
03.17. Expense recognition
An expense is recognised in the consolidated income statement when there is a decrease in the future economic benefi ts as a result of a reduction of an asset, or an increase in a liability, which can be measured reliably. This means that an expense is recognised simultaneously to the recognition of the increase in a liability or the reduction of an asset.
Additionally, an expense is recognised immediately when a disbursement does not give rise to future economic benefi ts or when the requirements for recognition as an asset are not met.
Also, an expense is recognised when a liability is incurred and no asset is recognised, as in the case of a liability relating to a guarantee.
In the specifi c case of expenses associated with commission income when the commission agent does not have any inventory risk, as in the case of certain Group logistics service companies, the cost to sell or to render the related service does not constitute an expense for the company (commission agent) since the latter does not assume the inherent risks. In these cases, as indicated in the section on revenue recognition, the sale or service rendered is recognised for the net amount of the commission.
76 ANNUAL REPORT 2011 OF ACS GROUP ECONOMIC AND FINANCIAL REPORT

03.18. Offsetting
Asset and liability balances must be offset and, therefore, the net amount thereof is presented in the consolidated statement of financial position only when they arise from transactions in which, contractually or by law, offsetting is permitted and the Group intends to settle them on a net basis, or to realise the asset and settle the liability simultaneously.
03.19. Corporation tax
The corporation tax expense represents the sum of the current tax expense and the change in deferred tax assets and liabilities.
The current income tax expense is calculated by aggregating the current tax arising from the application of the tax rate to the taxable profi t for the year, after deducting the tax credits allowable for tax purposes, plus the change in deferred tax assets and liabilities.
Deferred tax assets and liabilities include temporary differences measured at the amount expected to be payable or recoverable on differences between the carrying amounts of assets and liabilities and their tax bases, and tax loss and tax credit carryforwards.
Deferred tax liabilities are recognised for all taxable temporary differences, unless the temporary difference arises from the initial recognition of goodwill or the initial recognition (except in the case of a business combination) of other assets and liabilities in a transaction that affects neither accounting profi t nor taxable profi t.
Deferred tax assets are recognised for temporary differences to the extent that it is considered probable that the consolidated companies will have suffi cient taxable profi ts in the future against which the deferred tax asset can be utilised, and the deferred tax assets do not arise from the initial recognition (except in a business combination) of other assets and liabilities in a transaction that affects neither accounting profi t nor taxable profi t. The other deferred tax assets (tax loss and tax credit carryforwards) are only recognised if it is considered probable that the consolidated companies will have suffi cient future taxable profi ts against which they can be utilised.
The deferred tax assets and liabilities recognised are reassessed at the end of each reporting period in order to ascertain whether they still exist, and the appropriate adjustments are made on the basis of the fi ndings of the analyses performed.
Spanish companies in which the Parent ownership interest is higher than 75% of their share capital fi le consolidated tax returns in accordance with the current regulations as part of Tax Group 30/99.
77CONSOLIDATED FINANCIAL STATEMENTS

ConsolidatedFinancial Statements
03.20. Earnings per share
Basic earnings per share are calculated by dividing net profi t attributable to the Parent by the weighted average number of ordinary shares outstanding during the year, excluding the average number of shares of the Parent held by the Group companies (see Note 31.01).
Diluted earnings per share are calculated by dividing net profi t attributable to ordinary shareholders adjusted by the effect attributable to the dilutive potential ordinary shares by the weighted average number of ordinary shares outstanding during the year, adjusted by the weighted average number of ordinary shares that would have been outstanding assuming the conversion of all the potential ordinary shares into ordinary shares of the Parent. For these purposes, it is considered that the shares are converted at the beginning of the year or at the date of issue of the potential ordinary shares, if the latter were issued during the current period.
At 31 December 2011 and 2010, basic earnings per share were the same as diluted earnings per shares since none of the aforementioned circumstances arose.
03.21. Foreign currency transactions
The Group’s functional currency is the euro. Therefore, transactions in currencies other than the euro are deemed to be “Foreign Currency Transactions” and are recognised by applying the exchange rates prevailing at the date of the transaction.
Foreign currency transactions are initially recognised in the functional currency of the Group by applying the exchange rates prevailing at the date of the transaction.
At the end of each reporting period, monetary assets and liabilities denominated in foreign currencies are translated to euros at the rates prevailing at the end of the reporting period date. Non-cash items measured at historical cost are translated to euros at the exchange rates prevailing on the date of the transaction.
Any exchange differences arising on settlement or translation at the closing rates of monetary items are recognised in the consolidate income statement for the year, except for items that form part of an investment in a foreign operation, which are recognised directly in equity net of taxes until the date of disposal.
On certain occasions, in order to hedge its exposure to certain foreign currency risks, the Group enters into forward currency contracts and options (see Note 21 for details of the Group’s accounting policies in respect of such derivative fi nancial instruments).
On consolidation, the assets and liabilities of the Group’s foreign operations are translated to euros at the exchange rates prevailing at the end of the reporting period date. Income and expense items are translated at the average exchange rates for the year, unless exchange rates fl uctuate signifi cantly. Any exchange differences arising are classifi ed as equity. Such exchange differences are recognised as income or as expenses in the year in which the operation is disposed of.
Goodwill and fair value adjustments arising on the acquisition of a foreign company are treated as assets and liabilities of the foreign company and translated at the closing rate.
78 ANNUAL REPORT 2011 OF ACS GROUP ECONOMIC AND FINANCIAL REPORT

03.22. Entities and branches located in hyperinfl ationary economies
At the end of 2009, given the economic situation in Venezuela and in accordance with the defi nition of hyperinfl ationary economy provided by IAS 29, the country was classifi ed as hyperinfl ationary and at the end of 2011 it continued to be classifi ed as such. The ACS Group has investments in Venezuela through its subsidiaries of the Construction, Environment and Industrial Services segments, the amounts outstanding at 31 December 2011 and 2010, and the volume of transactions in the years 2011 and 2010 being immaterial.
No other of the functional currencies of the consolidated subsidiaries and associates located abroad relate to hyperinfl ationary economies as defi ned by IFRSs. Accordingly, at the 2011 and 2010 reporting period dates it was not necessary to adjust the fi nancial statements of any of the subsidiaries or associates to correct for the effect of infl ation.
03.23. Consolidated statement of cash fl ows
The following terms are used in the consolidated cash fl ow statements with the meanings specifi ed:
Cash fl ows: infl ows and outfl ows of cash and cash equivalents, which are short-term, highly liquid investments that are subject to an insignifi cant risk of changes in value.
Operating activities: the principal revenue-producing activities of the Group and other activities that are not investing or fi nancing activities.
Investing activities: the acquisition and disposal of non-current assets and other investments not included in cash and cash equivalents.
Financing activities: activities that result in changes in the size and composition of the equity and borrowings of the Group that are not operating activities.
In view of the diversity of the Group’s businesses and activities, the Group opted to report cash fl ows using the indirect method.
For the purpose of the preparation of the consolidated statement of cash fl ows, “cash and cash equivalents” were considered to consist of cash and demand deposits, in addition to short-term, highly liquid investments that are convertible into cash, being subject to an insignifi cant risk of changes in value.
Additionally, in the preparation of the consolidated statement of cash fl ows for the year 2011, within the cash fl ows for investing in Group companies, associates and business units, the cash and cash equivalents recognised as a result of the consolidation of Hochtief, A,G, amounting to EUR 2,270,041 thousand were considered to reduced the value of the investment paid to acquire this company in 2011 amounting to EUR 903,923 thousand (excluding the treasury shares delivered in the takeover).
79CONSOLIDATED FINANCIAL STATEMENTS

ConsolidatedFinancial Statements
The breakdown of the heading “Other Adjustments to Profi t (net)” in the statement of cash fl ows is as follows:
03.24. Entry into force of new accounting standards
In 2011, the following interpretations of standards already adopted by the European Union came into force, and, if applicable, were used by the Group in the preparation of the accompanying consolidated fi nancial statements: (1) New standards, amendments and interpretations of standards whose application is mandatory
in the year commencing 1 January 2011:
New standards, amendments and interpretations of standards:
Mandatory application in the year commencing:
Approved for use in the European Union
Amendment of IAS 32 Financial Instruments: Presentation - Classifi cation of Rights Issues
Amends the accounting treatment of the rights, options and warrants denominated in a currency other than the functional currency
Annual periods commencing
1 February 2011
Revision of IAS 24 - Related Party Disclosures
It amends the defi nition of the related party and reduces the information disclosure requirements for the related companies only because they are under control, common control or under signifi cant infl uence of the Government
Annual periods commencing
1 January 2011
Improvements in the IFRS (published in May 2010) Amendments to a number of standards
Mostly mandatory in periods commencing 1 January 2011; some are mandatory in periods commencing
1 July 2011
Amendment of IFRIC 14 - Prepayments of minimum funding requirements
Prepayments of contributions under minimum funding requirements may give rise to an asset
Annual periods commencing
1 January 2011
IFRIC 19 Extinguishing fi nancial liabilities with equity instruments
Treatment of the extinction of fi nancial liabilities through the issue of shares
Annual periods commencing
1 July 2011
80 ANNUAL REPORT 2011 OF ACS GROUP ECONOMIC AND FINANCIAL REPORT
Thousands of euros 2011 2010
Financial income (521,055) (489,572)
Financial costs 1,216,514 802,637
Profi t (loss) from disposals (465,110) (582,932)
Results of companies accounted for using the equity method (318,469) (221,766)
Adjustments relating to the full consolidation of Hochtief which do not give rise to cash 333,350 -
Other effects 264,431 82,784
Total 509,661 (408,849)

The breakdown detail of the improvements in the IFRS (published in May 2010) is as follows:
Obligatory changes in periods commencing 1 January 2011:
The application of the standards entering into force in 2011 did not have a signifi cant impact on the
fi nancial statements of the ACS Group.
(2) New standards, amendments and interpretations of standards whose application is mandatory subsequent to the year commencing 1 January 2011 (applicable beginning in 2012):
At the date of the approval of these fi nancial statements, the following standards and interpretations had been published by the IASB but had not yet entered into force, either because the date they were to enter into force was subsequent to the date of the fi nancial statements, or because they had not yet been adopted by the European Union:
81CONSOLIDATED FINANCIAL STATEMENTS
Standard Amendment
IFRS 3 The following clarifi cations and amendments to the standard were made:
The free choice of the method of valuation of non-controlling is limited to the existing holdings which give the holder the right to a proportional share of the net assets of the entity in the event of liquidation (e.g. ordinary shares). All other components of non-controlling interests (e.g. stock options) are measured at fair value on the acquisition date, unless another valuation criteria is required in accordance with the IFRS.
An improved guide is include regarding the treatment of share-based payments of an acquiree, as well as voluntarily replaced share-based payments by the acquiree at the acquisition date.
In the transitional provisions it is stipulated that contingent consideration that arose from acquisitions preceding the application of the Revised IFRS 3 are to be accounted for in accordance with the former standard.
IAS 27 Clarifi cation regarding the effective dates of the parallel amendments of IAS 2, IAS 28 and IAS 31 as a result of the amendment of IAS 27 (amended in 2008).
Standard Amendment
IFRS 1 The following clarifi cations and amendments to the standard were made:
It describes the disclosures required when an company amends its accounting policies or applies exemptions from the IFRS 1 in the period between the publication of its fi rst interim fi nancial report in accordance with IFRS and its fi rst fi nancial statements in accordance with IFRS. It also specifi es that IAS 8 Accounting policies, changes in accounting estimates and errors is not applicable to these amendments.
Property, plant and equipment and intangible assets used in regulated activities may be included in the amount calculated in accordance with previous GAAP (such as estimated cost) and be tested for impairment on the date of transition to the IFRSs.
IFRS 7 It recommends strengthening qualitative disclosures and clarifi es the level of disclosure required regarding credit risk and collateral.
IAS 1 It clarifi es the items that are required to be disclosed in the Statement of Changes in Equity.
It indicates that entities should present an analysis of other comprehensive income for each component of equity, either in the statement of changes in equity or in the notes to the fi nancial statements. Also to be included in either the statement of changes in equity or the notes to the fi nancial statements are the dividends distributed to shareholders and dividends per share.
IAS 34 This amendment specifi es the events and transactions that are required to be included in interim fi nancial statements.
IFRIC 13 Clarifi cation regarding the measurement at fair value of award credits granted to clients.
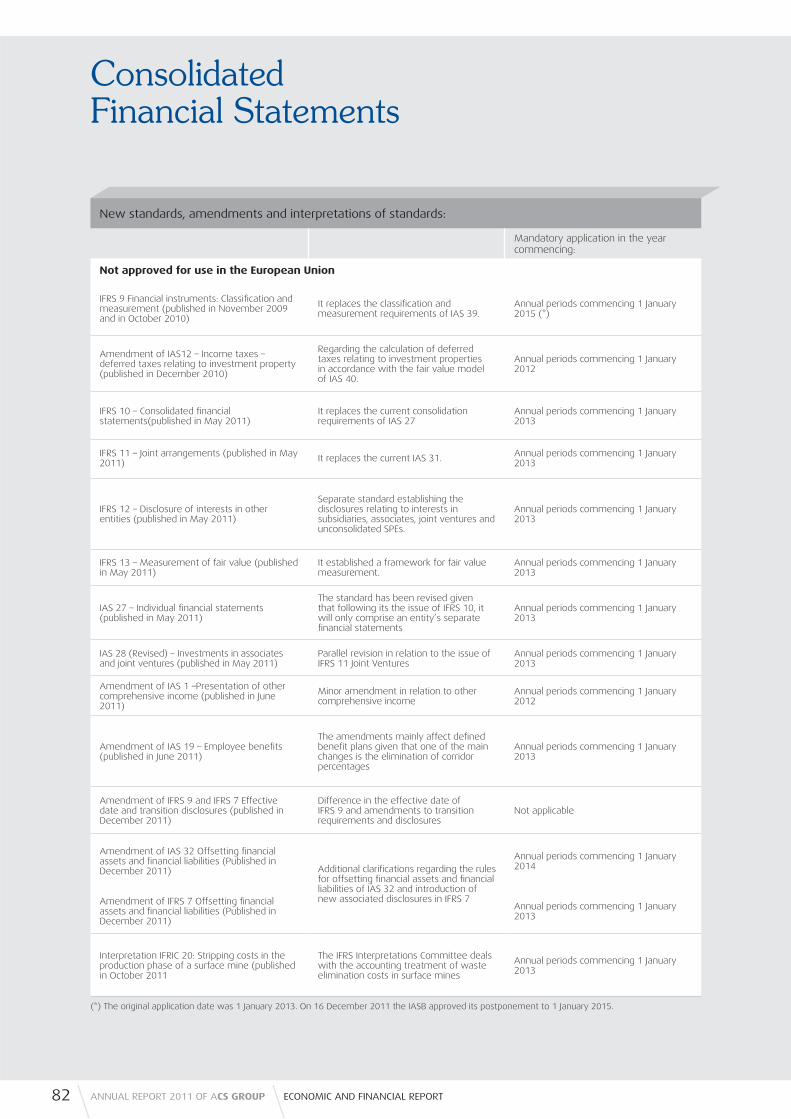
ConsolidatedFinancial Statements
New standards, amendments and interpretations of standards:
Mandatory application in the year commencing:
Not approved for use in the European Union
IFRS 9 Financial instruments: Classifi cation and measurement (published in November 2009 and in October 2010)
It replaces the classifi cation and measurement requirements of IAS 39.
Annual periods commencing 1 January 2015 (*)
Amendment of IAS12 – Income taxes – deferred taxes relating to investment property (published in December 2010)
Regarding the calculation of deferred taxes relating to investment properties in accordance with the fair value model of IAS 40.
Annual periods commencing 1 January 2012
IFRS 10 – Consolidated fi nancial statements(published in May 2011)
It replaces the current consolidation requirements of IAS 27
Annual periods commencing 1 January 2013
IFRS 11 – Joint arrangements (published in May 2011) It replaces the current IAS 31. Annual periods commencing 1 January
2013
IFRS 12 – Disclosure of interests in other entities (published in May 2011)
Separate standard establishing the disclosures relating to interests in subsidiaries, associates, joint ventures and unconsolidated SPEs.
Annual periods commencing 1 January 2013
IFRS 13 – Measurement of fair value (published in May 2011)
It established a framework for fair value measurement.
Annual periods commencing 1 January 2013
IAS 27 – Individual fi nancial statements (published in May 2011)
The standard has been revised given that following its the issue of IFRS 10, it will only comprise an entity’s separate fi nancial statements
Annual periods commencing 1 January 2013
IAS 28 (Revised) – Investments in associates and joint ventures (published in May 2011)
Parallel revision in relation to the issue of IFRS 11 Joint Ventures
Annual periods commencing 1 January 2013
Amendment of IAS 1 –Presentation of other comprehensive income (published in June 2011)
Minor amendment in relation to other comprehensive income
Annual periods commencing 1 January 2012
Amendment of IAS 19 – Employee benefi ts (published in June 2011)
The amendments mainly affect defi ned benefi t plans given that one of the main changes is the elimination of corridor percentages
Annual periods commencing 1 January 2013
Amendment of IFRS 9 and IFRS 7 Effective date and transition disclosures (published in December 2011)
Difference in the effective date of IFRS 9 and amendments to transition requirements and disclosures
Not applicable
Amendment of IAS 32 Offsetting fi nancial assets and fi nancial liabilities (Published in December 2011) Additional clarifi cations regarding the rules
for offsetting fi nancial assets and fi nancial liabilities of IAS 32 and introduction of new associated disclosures in IFRS 7
Annual periods commencing 1 January 2014
Amendment of IFRS 7 Offsetting fi nancial assets and fi nancial liabilities (Published in December 2011)
Annual periods commencing 1 January 2013
Interpretation IFRIC 20: Stripping costs in the production phase of a surface mine (published in October 2011
The IFRS Interpretations Committee deals with the accounting treatment of waste elimination costs in surface mines
Annual periods commencing 1 January 2013
(*) The original application date was 1 January 2013. On 16 December 2011 the IASB approved its postponement to 1 January 2015.
82 ANNUAL REPORT 2011 OF ACS GROUP ECONOMIC AND FINANCIAL REPORT

IFRS 9 “Financial instruments”.- The partially published IFRS 9 (not yet complete to date) replaces IAS 39 in the classifi cation and measurement of fi nancial assets (part published in November 2009) and fi nancial liabilities (published in October 2010), The standard published in October 2010 also includes recognition and Derecognition requirements, which are essentially the same as in IAS 39. This standard could have a potentially signifi cant effect on the fi nancial statements of the ACS Group to the extent that the eventual impact of the impairment of the investment in Iberdrola indicated in Note 10.1 would not have to be recycled in the Group’s income statement. Although the application date for this IFRS 9 is 1 January 2015, early application is voluntary once the standard has been adopted for use by the European Union.
Amendment of IAS 12 “Income taxes – Deferred taxes relating to investment property”.- The amendment introduces an exception to the general principles of IAS 12 affecting deferred taxes relating to investment property measured according to the fair value model of IAS 40 “Investment property”. In these cases, for the purpose of calculating the applicable deferred taxes, it is presumed that the carrying value of these assets will be fully recovered through their sale. This presumption can be rejected when the investment property is amortisable and its business model requires the use of the property over time to earn fi nancial profi t rather than its sale.
IFRS 10 “Consolidated fi nancial statements, IFRS 11 “Joint ventures”, IFRS 12 “Disclosure of interests in other entities”, IAS 27 (Revised) “Individual fi nancial statements” and IAS 28 (Revised) “Investments in associates and joint ventures”.- This block of standards and amendments is issued together and will replace the current standards in relation to the consolidation and recording of investments in subsidiaries, associates and joint ventures, as well as the related disclosures. With respect to the recognitions of joint values, the standard is not expected to have a signifi cant effect for the ACS Group since it accounts for its jointly controlled companies using the equity method.
IFRS 13 “Measurement of fair value”.- The aim of this standard is to be the only standard for calculating the fair value of assets and liabilities where such valuation is required by other standards. In this regard, it does not amend current valuation criteria in any way and is applicable to the valuation of fi nancial and non-fi nancial items. The standard changes the defi nition of fair value and introduces new particularities to be considered, focusing on the fair value hierarchy for its calculation, which is conceptually similar to that used by IFRS 7 for certain fi nancial instrument disclosures.
Amendment of IAS 1 “Presentation of other comprehensive income. This amendment basically consists in the requirement to record a separate total of income and expenses under “other comprehensive income” in relation to those items which will and will not be recycled to profi t and loss in the future.
Amendment of IAS 19 “Employee benefi ts”.- The main changes in this amendment of IAS 19 affects defi ned benefi t plans.
Amendment of IAS 32 Financial instruments: presentation – Offsetting fi nancial assets and liabilities”.- This amendment introduces a number of additional clarifi cations as a guide for following the requirements to be able to offset fi nancial assets and liabilities on the statement of fi nancial position which is provided in paragraph 42. IAS 32 already stipulates that a fi nancial asset and liability can only be offset when the entity currently has the legal right to offset the amounts recognised.
Amendment of IAS 7 Financial instruments: Disclosures- Transfer of fi nancial assets”.- It strengthens the disclosure requirements applicable to the transfer of assets, both when they are not derecognised on the statement of fi nancial position, and those which are derecognised but in relation to which the entity is continually involved.
83CONSOLIDATED FINANCIAL STATEMENTS
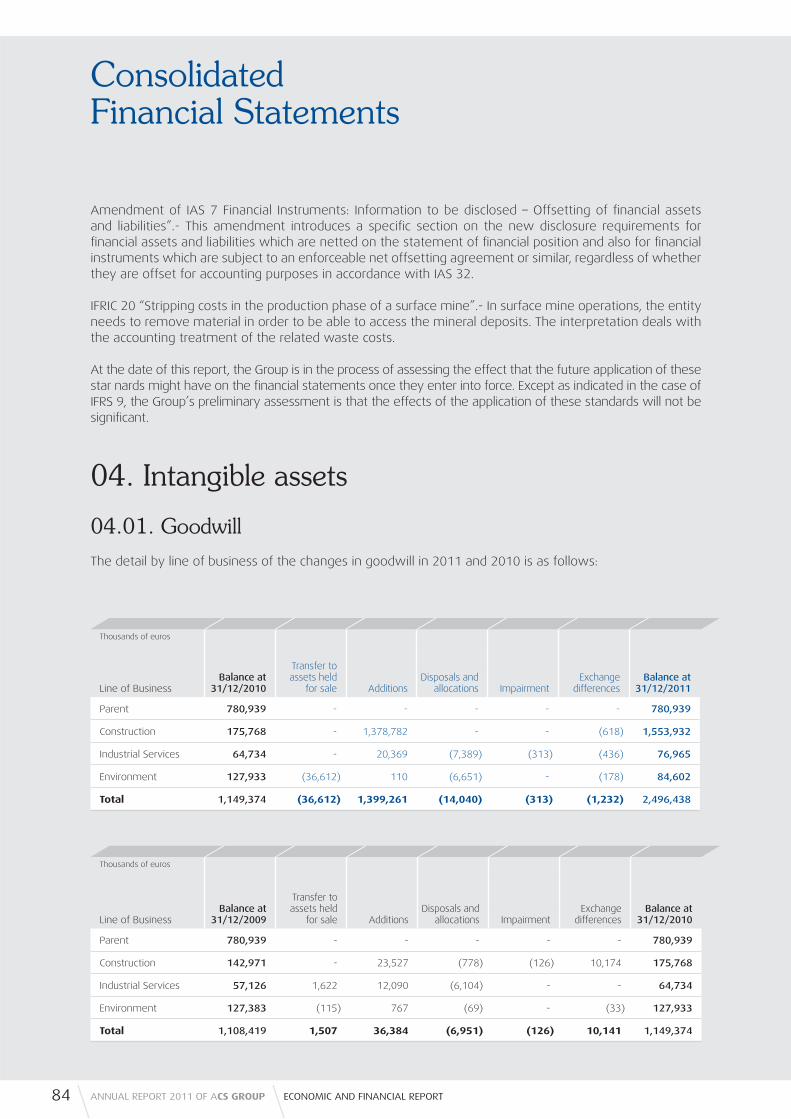
ConsolidatedFinancial Statements
Amendment of IAS 7 Financial Instruments: Information to be disclosed – Offsetting of fi nancial assets and liabilities”.- This amendment introduces a specifi c section on the new disclosure requirements for fi nancial assets and liabilities which are netted on the statement of fi nancial position and also for fi nancial instruments which are subject to an enforceable net offsetting agreement or similar, regardless of whether they are offset for accounting purposes in accordance with IAS 32.
IFRIC 20 “Stripping costs in the production phase of a surface mine”.- In surface mine operations, the entity needs to remove material in order to be able to access the mineral deposits. The interpretation deals with the accounting treatment of the related waste costs.
At the date of this report, the Group is in the process of assessing the effect that the future application of these star nards might have on the fi nancial statements once they enter into force. Except as indicated in the case of IFRS 9, the Group’s preliminary assessment is that the effects of the application of these standards will not be signifi cant.
04. Intangible assets
04.01. Goodwill
The detail by line of business of the changes in goodwill in 2011 and 2010 is as follows:
84 ANNUAL REPORT 2011 OF ACS GROUP ECONOMIC AND FINANCIAL REPORT
Thousands of euros
Balance at 31/12/2010
Transfer to assets held
for sale AdditionsDisposals and
allocations ImpairmentExchange
differencesBalance at
31/12/2011Line of Business
Parent 780,939 - - - - - 780,939
Construction 175,768 - 1,378,782 - - (618) 1,553,932
Industrial Services 64,734 - 20,369 (7,389) (313) (436) 76,965
Environment 127,933 (36,612) 110 (6,651) - (178) 84,602
Total 1,149,374 (36,612) 1,399,261 (14,040) (313) (1,232) 2,496,438
Thousands of euros
Balance at 31/12/2009
Transfer to assets held
for sale AdditionsDisposals and
allocations ImpairmentExchange
differencesBalance at
31/12/2010Line of Business
Parent 780,939 - - - - - 780,939
Construction 142,971 - 23,527 (778) (126) 10,174 175,768
Industrial Services 57,126 1,622 12,090 (6,104) - - 64,734
Environment 127,383 (115) 767 (69) - (33) 127,933
Total 1,108,419 1,507 36,384 (6,951) (126) 10,141 1,149,374

In 2011 the most signifi cant addition amounting to EUR 1,378,782 thousand is a result of the full consolidation of Hochtief A.G (see Note 02.02.f).
In 2010 the most signifi cant additions amounting to EUR 23,527 thousand relate to the Construction area and specifi cally, the recalculation of goodwill, after the 12 month period provided in IFRS 3, which arose in 2009 on the acquisitions of Pol-Aqua, John P. Picone, Inc. and Pulice Construction, Inc.
In the case of the ACS Group’s goodwill, annually the carrying amount of the company or cash-generating unit is compared to the value in use obtained by means of the cash fl ow discounting measurement method.
At 31 December 2011, the market value of the ACS Group’s ownership interest in Hochtief amounted to EUR 1,692,170 thousand. In relation to the goodwill arising from the purchase of Hochtief in 2011, in accordance with IAS 36.80, this provisional goodwill was temporarily assigned to the main cash generating unit including Hochtief Asia Pacifi c and Hochtief Americas. For the purpose of testing the impairment of the goodwill of Hochtief assigned to Hochtief Asia Pacifi c, the ACS Group based its valuation on the projections made by the Leighton analysts, discounting the free cash fl ows at a weighted average cost of capital (WACC) of 12.0%, and using a perpetual growth rate of 2.5%. This value was compared to the analysts’ average target value according to the consensus of Factset and to Leighton’s cash fl ow discounting valuation, it being concluded that there was no impairment in any of the scenarios analysed.
For the valuation of the Hochtief Americas division the average sum of parts valuations of analysts was used. This value was compared to the internal cash fl ow discounting valuation of Hochtief Americas. Based on the results of these valuations it can be concluded that there was no impairment of the goodwill assigned to this cash generating unit.
Along with the goodwill arising from the full consolidation of Hochtief A.G. the most signifi cant goodwill, which amounted to EUR 780,939 thousand, arose from the merger with Dragados Group in 2003, and related to the amount paid in excess of the value of the assets on the acquisition date. This goodwill was assigned mainly to the cash generating units of the Construction and Industrial Services areas. The ACS Group assessed the recoverability thereof in 2011 and 2010.
For the purposes of testing the impairment of the goodwill of the Dragados Group, excluding the Iridium’s concession line of business whose carrying value was conservatively taken into consideration, the cash fl ow discounting method was used to obtain a valuation based on internal projections for each of the business units for the 2012-2016 period, by applying perpetual growth rates of 1.8%. The discount rate used (weighted average cost of capital or WACC) was 10.6% for Construction, 5.8% for Environment and 6.9% for Industrial Services. The combined result of the cash fl ow discounting valuation of the operating businesses and the valuation of the concession businesses signifi cantly exceeds the carrying value plus the goodwill of the Dragados Group. Similarly, said value was compared to the valuations of analysts through the sum of the parts, and the value of the ACS Group on the market, there being no signs of impairment in any of the analysed cases.
The Group conducted sensitivity analyses on the goodwill impairment test carried out, concluding that reasonable changes in the main assumptions would not give rise to the need to recognise an impairment loss. In the case of the impairment test of Hochtief, the valuations of the cash-generating units evidence a gap of more than 10% compared to their carrying values.
The remaining goodwill, excluding that generated by the merger between ACS and the Dragados Group and the goodwill arising from the full consolidation of Hochtief A.G., is very fragmented. Thus, in the case of the Industrial Services area, the total goodwill on the statement of fi nancial position amounts to EUR 76,965 thousand, which relates to 19 companies from this business area, the most signifi cant relating to the acquisition of Midasco, LLC for EUR 15,723 thousand.
85CONSOLIDATED FINANCIAL STATEMENTS

ConsolidatedFinancial Statements
In the Environmental area, total goodwill amounted to EUR 84,602 million, relating to 27 different companies, the largest amount being related to the purchase of the portion corresponding to the minority interests of Tecmed, now merged into Urbaser, for EUR 38,215 thousand. Additionally, EUR 36,612 thousand was reclassifi ed to assets held for sale arising from the goodwill of Clece.
In the Construction area, in addition to the goodwill arising from the full consolidation of Hochtief A.G. noteworthy is the goodwill arising on the acquisitions of Pol-Aqua (EUR 39,485 thousand), Pulice (EUR 41,775 thousand), John P. Picone (EUR 41,765 thousand) and Schiavone (EUR 46,125 thousand).
In these areas, the calculated impairment tests are based upon scenarios similar to those that have been described for each area of activity or in the case of Dragados Group goodwill, taking into account the necessary adjustments based upon the peculiarities, geographic markets and specifi c circumstances of the affected companies.
According to the estimates and projections available to the directors of the Group and of each of the companies concerned, the projected cash fl ows attributable to these cash-generating units (or groups of units) to which the goodwill is allocated will make it possible to recover the net value of the goodwill recognised at 31 December 2011 and 2010. The impairment losses on goodwill in 2011 amounted to EUR 313 thousand (2010 EUR 126 thousand).
04.02. Other intangible assets
The changes in this consolidated statement of fi nancial position heading in 2011 and 2010 were as follows:
86 ANNUAL REPORT 2011 OF ACS GROUP ECONOMIC AND FINANCIAL REPORT
Thousands of euros
Development expenditure
Computer software Concessions
Other intangible
assets
Total other intangible
assetsAccumulated amortisation
Impairment losses
Total other intangible
assets, net
Balance at 1 January 2010 10,885 34,601 75,561 546,534 667,581 (100,570) (50) 566,961
Changes in the scope of consolidation - 20 2 793 815 (770) - 45
Additions or charges for the year 95 3,018 73,982 40,074 117,169 (22,366) (19,252) 75,551
Disposals or reductions (279) (1,551) (2) (99,004) (100,836) 2,129 2,277 (96,430)
Exchange differences - 90 - 5,973 6,063 (78) (324) 5,661
Transfers to/from other assets (2,505) 351 5,485 (90,384) (87,053) 7,242 (7,619) (87,430)
Balance at 31 December 2010 8,196 36,529 155,028 403,986 603,739 (114,413) (24,968) 464,358
Changes in the scope of consolidation 902 (1,994) 94,605 2,004,861 2,098,374 (70,644) - 2,027,730
Additions or charges for the year 212 3,277 12,792 31,898 48,179 (224,136) (18,254) (194,211)
Disposals or reductions (90) (6,217) (47,743) (238,582) (292,632) 34,856 - (257,776)
Exchange differences (3) (24) 7,858 6,019 13,850 (3,741) (49) 10,060
Transfers to/from other assets 2,598 194 181,468 34,577 218,837 (11,944) (60) 206,833
Balance at 31 December 2011 11,815 31,765 404,008 2,242,759 2,690,347 (390,022) (43,331) 2,256,994

The main additions in 2011 relate to the fair value assigned to intangible assets of the Hochtief Group, of which EUR 1,977,901 thousand were included under the heading “Other intangible assets” (see Note 02.02.f). The business combinations have focused on business characterised by the existence, inter alia, of a significant construction order book and client base, including many contracts which expire in the short-medium term and are subject to periodic renewals (on tacit occasions), thus establishing a recurring relationship over time with its most significant clients. In these cases, the ACS Group deems that, according to IFRS 3, part of the gain must be allocated to said contracts and generally to the contractual relationship with clients. The assessment of the order book signed on the acquisition date of the contractual relationships with clients, takes the planned margins (EBITDA) after taxes, the CAPEX forecasts and signed contractual period as a reference. This assessment gives rise to the generation of an intangible asset, which will be amortised over the remaining term of the contract and the term of the aforementioned contractual relationship, proportionally to the estimated cash flows.
At 31 December 2011, the main assets recognised under the heading “Other intangible assets” related to the order book of Hochtief (mainly including contracts in the areas of America and Pacific Asia) amounting to EUR 708,476 thousand, to the various trademarks of the Hochtief Group (EUR 221,020 thousand) and to the contractual relationships with clients of the Hochtief Group (EUR 813,140 thousand) generated in the first consolidation process (PPA) described in Note 02.02.f.
The intangible assets identified above are amortised on a straight-line basis over the estimated period in which they generate cash flows for the company. Additionally, “Other intangible assets” includes EUR 16,505 thousand relating to the highway concession in Santiago de Chile, which is to be reverted to the Chilean state upon the expiration of the concession in 2033.
Investments in 2011 amounted to EUR 48,179 thousand (EUR 117,169 thousand in 2010).
Disposals, retirements and reductions relate mainly to assets from the Hochtief Group, and primarily those associated with the sale of mining contracts of Henry Walter Eltin.
In 2011 the impairment losses included under “Other intangible assets” amounted to EUR 16,633 thousand and related to the Construction area (EUR 19,268 thousand in 2010). Impairment losses have not reverted to the income statements of 2011 and 2010.
No significant development expenditure was recognised as an expense in the 2011 and 2010 consolidated income statement.
At 31 December 2011, the amount of assets with an indefinite useful life other than those reported as goodwill, relate mainly to several trademarks of the Hochtief Group: Turner amounting to EUR 25,341 thousand, Flatiron amounting to EUR 2,860 thousands, E. E. Cruz amounting to EUR 2,628 thousand and Devine Ltd. amounting to EUR 18,864 thousand. Trademarks are not amortized systematically, but are checked for possible impairment annually. In 2011 there was no such impairment. At 31 December 2010, the amount of assets with an indefinite useful life other than those reported as goodwill was not material.
There were no material intangible asset items whose title was restricted in 2011 or 2010.
87CONSOLIDATED FINANCIAL STATEMENTS
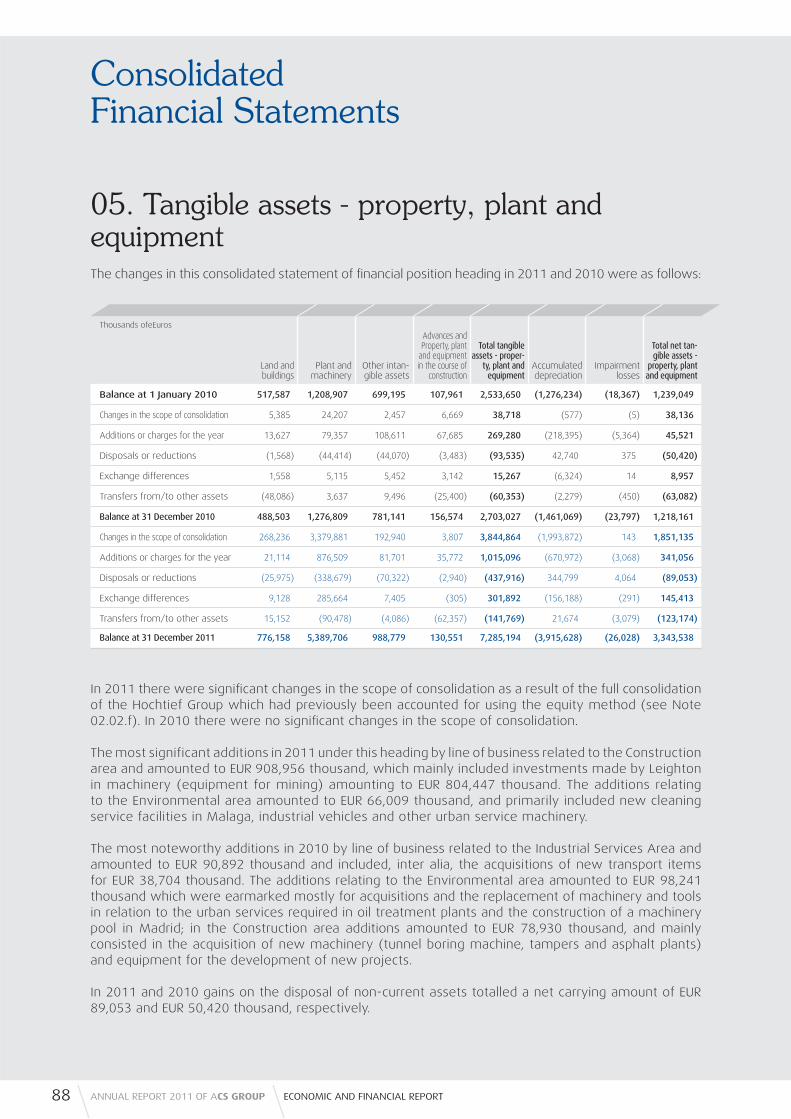
ConsolidatedFinancial Statements
05. Tangible assets - property, plant and equipmentThe changes in this consolidated statement of fi nancial position heading in 2011 and 2010 were as follows:
In 2011 there were signifi cant changes in the scope of consolidation as a result of the full consolidation of the Hochtief Group which had previously been accounted for using the equity method (see Note 02.02.f). In 2010 there were no signifi cant changes in the scope of consolidation.
The most significant additions in 2011 under this heading by line of business related to the Construction area and amounted to EUR 908,956 thousand, which mainly included investments made by Leighton in machinery (equipment for mining) amounting to EUR 804,447 thousand. The additions relating to the Environmental area amounted to EUR 66,009 thousand, and primarily included new cleaning service facilities in Malaga, industrial vehicles and other urban service machinery.
The most noteworthy additions in 2010 by line of business related to the Industrial Services Area and amounted to EUR 90,892 thousand and included, inter alia, the acquisitions of new transport items for EUR 38,704 thousand. The additions relating to the Environmental area amounted to EUR 98,241 thousand which were earmarked mostly for acquisitions and the replacement of machinery and tools in relation to the urban services required in oil treatment plants and the construction of a machinery pool in Madrid; in the Construction area additions amounted to EUR 78,930 thousand, and mainly consisted in the acquisition of new machinery (tunnel boring machine, tampers and asphalt plants) and equipment for the development of new projects.
In 2011 and 2010 gains on the disposal of non-current assets totalled a net carrying amount of EUR 89,053 and EUR 50,420 thousand, respectively.
88 ANNUAL REPORT 2011 OF ACS GROUP ECONOMIC AND FINANCIAL REPORT
Thousands ofeEuros
Land and buildings
Plant and machinery
Other intan-gible assets
Advances and Property, plant
and equipment in the course of
construction
Total tangible assets - proper-
ty, plant and equipment
Accumulated depreciation
Impairment losses
Total net tan-gible assets -
property, plant and equipment
Balance at 1 January 2010 517,587 1,208,907 699,195 107,961 2,533,650 (1,276,234) (18,367) 1,239,049
Changes in the scope of consolidation 5,385 24,207 2,457 6,669 38,718 (577) (5) 38,136
Additions or charges for the year 13,627 79,357 108,611 67,685 269,280 (218,395) (5,364) 45,521
Disposals or reductions (1,568) (44,414) (44,070) (3,483) (93,535) 42,740 375 (50,420)
Exchange differences 1,558 5,115 5,452 3,142 15,267 (6,324) 14 8,957
Transfers from/to other assets (48,086) 3,637 9,496 (25,400) (60,353) (2,279) (450) (63,082)
Balance at 31 December 2010 488,503 1,276,809 781,141 156,574 2,703,027 (1,461,069) (23,797) 1,218,161
Changes in the scope of consolidation 268,236 3,379,881 192,940 3,807 3,844,864 (1,993,872) 143 1,851,135
Additions or charges for the year 21,114 876,509 81,701 35,772 1,015,096 (670,972) (3,068) 341,056
Disposals or reductions (25,975) (338,679) (70,322) (2,940) (437,916) 344,799 4,064 (89,053)
Exchange differences 9,128 285,664 7,405 (305) 301,892 (156,188) (291) 145,413
Transfers from/to other assets 15,152 (90,478) (4,086) (62,357) (141,769) 21,674 (3,079) (123,174)
Balance at 31 December 2011 776,158 5,389,706 988,779 130,551 7,285,194 (3,915,628) (26,028) 3,343,538

Operating costs relating directly to capitalised tangible assets- property, plant and equipment in the course of construction in 2011 amounted to EUR 2,467 thousand, there being no material costs in 2010.
The Group has taken out insurance policies to cover the possible risks to which its tangible assets- property, plant and equipment are subject and the claims that might be filed against it for carrying on its business activities. These policies are considered to adequately cover the related risks.
The indemnities received for claims covered by insurance policies recognised in profit or loss were not significant in 2011 or 2010.
The Group has mortgaged land and buildings with a carrying amount of approximately EUR 74,945 thousand (EUR 75,816 thousand in 2010) to secure banking facilities granted to the Group.
At 31 December 2011 the Group had recognised a net EUR 2,599,751 thousand relating to tangible assets - property, plant and equipment owned by foreign companies and branches of the Group (EUR 360,002 thousand in 2010).
At 31 December 2011, the Group had entered into contractual commitments for the future acquisition of tangible assets - property, plant and equipment amounting to EUR 520,534 thousand, including, inter alia, EUR 507,255 thousand mostly relating to mining operations in Leighton. The commitments entered into at 31 December 2010 amounted to EUR 25,484 thousand.
The impairment losses recognised in profit and loss at 31 December 2011 amounted to EUR 1,988 thousand and mainly related to the sale and impairment of machinery of Dragados (EUR 2,679 thousand in 2010). The impairment losses reversed and recognised in profit and loss in 2010 amounted to EUR 45 thousand (EUR 55 thousand in 2010).
The leased assets recognised under tangible assets - property, plant and equipment were as follows:
The increase in leased assets at 31 December 2011 with respect to the previous year, is mainly a result of the full consolidation of the Hochtief Group, which had previously been accounted for using the equity method and amounted to EUR 410,571 thousand, mostly relating to plant and machinery of Leighton.
89CONSOLIDATED FINANCIAL STATEMENTS
Thousands of euros
Land and buildings
Plant and machinery
Other tangible assets - property,
plant and equipment
Total tangible assets -
property, plant and equipment
Accumulated depreciation
Total net tangible assets
- property, plant and equipment
Balance at 31 December 2010 3,228 19,153 34,372 56,753 (14,106) 42,647
Balance at 31 December 2011 3,147 432,064 26,341 461,552 (8,533) 453,019

ConsolidatedFinancial Statements
06. Non-current assets in projectsThe balance of “Non-Current Assets in Projects” in the consolidated statement of fi nancial position at 31 December 2011, includes the costs incurred by the fully and proportionally consolidated companies in the construction of transport, service and power plant infrastructures whose operation constitutes the purpose of their respective concessions, the detail being as follows: These amounts related to tangible assets - property, plant and equipment associated with projects fi nanced by means of the “project fi nance” fi gure and concessions identifi ed as intangible assets or those that are included as a fi nancial asset according to the criteria discussed in Note 03.24 above. The Group considers it to be more appropriate to present its infrastructure projects in a grouped manner for improved interpretation of this activity, although they are broken down by type of asset (fi nancial or intangible) in this note.
All the project investments made by the ACS Group at 31 December 2011, and the related changes in the balance of this heading in 2011 are as follows:
The changes in this heading in 2011 and 2010 were as follows:
90 ANNUAL REPORT 2011 OF ACS GROUP ECONOMIC AND FINANCIAL REPORT
Thousands of euros
Type of infrastructureEnd date of
operation InvestmentAccumulated depreciation
Net carrying amount of non-current assets in
projects
Waste treatment 2015 - 2038 588,701 (211,274) 377,427
Highways/roads 2012 - 2050 247,534 (17,208) 230,326
Police stations 2024 - 2032 79,543 - 79,543
Water management 2028 - 2037 39,235 (5,655) 33,580
Security 2014 64,128 (40,476) 23,652
Interchangers 2026 - 2040 18,348 - 18,348
Wind powered facilities 2020 - 2036 17,802 (512) 17,290
Energy transport 2038 9,980 (501) 9,479
Thermal solar power plants 2035 - 2036 8,564 - 8,564
Other infrastructures - 41,845 (5,362) 36,483
Total 1,115,680 (280,988) 834,692
Thousands of euros 2011 2010
InvestmentAccumulated depreciation
Net carrying amount Investment
Accumulated depreciation
Net carrying amount
Beginning balance 2,670,903 (290,617) 2,380,286 4,963,554 (461,030) 4,502,524
Changes in the scope of consolidation
(499,733) 7,265 (492,468) (166,203) - (166,203)
Additions or charges for the year
1,445,587 (95,815) 1,349,772 1,797,941 (160,077) 1,637,864
Exchange differences (9,978) 182 (9,796) 14,355 (1,286) 13,069
Disposals or reductions (163,151) 9,019 (154,132) (42,191) 28,760 (13,431)
Transfers (2,327,948) 88,978 (2,238,970) (3,896,553) 303,016 (3,593,537)
Ending balance 1,115,680 (280,988) 834,692 2,670,903 (290,617) 2,380,286
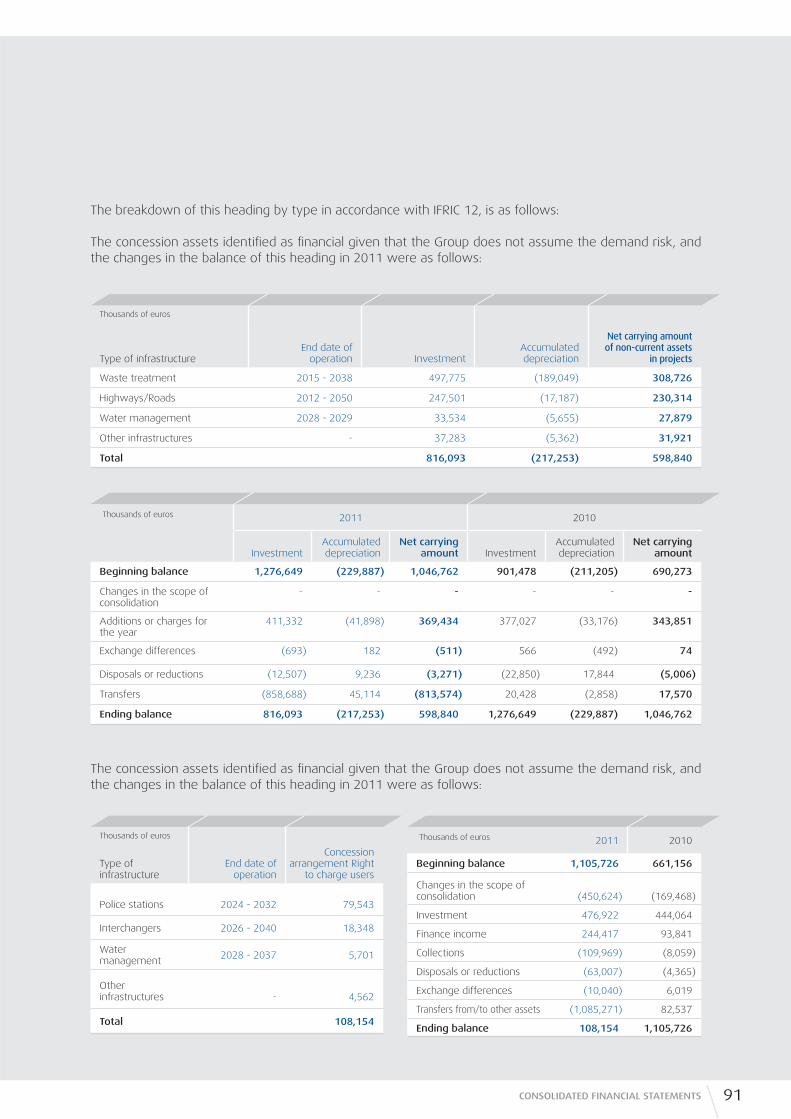
The breakdown of this heading by type in accordance with IFRIC 12, is as follows:
The concession assets identifi ed as fi nancial given that the Group does not assume the demand risk, and the changes in the balance of this heading in 2011 were as follows:
The concession assets identifi ed as fi nancial given that the Group does not assume the demand risk, and the changes in the balance of this heading in 2011 were as follows:
91CONSOLIDATED FINANCIAL STATEMENTS
Thousands of euros
Type of infrastructureEnd date of
operation InvestmentAccumulated depreciation
Net carrying amount of non-current assets
in projects
Waste treatment 2015 - 2038 497,775 (189,049) 308,726
Highways/Roads 2012 - 2050 247,501 (17,187) 230,314
Water management 2028 - 2029 33,534 (5,655) 27,879
Other infrastructures - 37,283 (5,362) 31,921
Total 816,093 (217,253) 598,840
Thousands of euros 2011 2010
InvestmentAccumulated depreciation
Net carrying amount Investment
Accumulated depreciation
Net carrying amount
Beginning balance 1,276,649 (229,887) 1,046,762 901,478 (211,205) 690,273
Changes in the scope of consolidation
- - - - - -
Additions or charges for the year
411,332 (41,898) 369,434 377,027 (33,176) 343,851
Exchange differences (693) 182 (511) 566 (492) 74
Disposals or reductions (12,507) 9,236 (3,271) (22,850) 17,844 (5,006)
Transfers (858,688) 45,114 (813,574) 20,428 (2,858) 17,570
Ending balance 816,093 (217,253) 598,840 1,276,649 (229,887) 1,046,762
Thousands of euros
Type of infrastructure
End date of operation
Concession arrangement Right
to charge users
Police stations 2024 - 2032 79,543
Interchangers 2026 - 2040 18,348
Water management
2028 - 2037 5,701
Other infrastructures - 4,562
Total 108,154
Thousands of euros 2011 2010
Beginning balance 1,105,726 661,156
Changes in the scope of consolidation (450,624) (169,468)
Investment 476,922 444,064
Finance income 244,417 93,841
Collections (109,969) (8,059)
Disposals or reductions (63,007) (4,365)
Exchange differences (10,040) 6,019
Transfers from/to other assets (1,085,271) 82,537
Ending balance 108,154 1,105,726

ConsolidatedFinancial Statements
In accordance with the valuation criteria provided by IFRIC 12 and in Note 03.04, the financial income included under “Net sales” amounted to EUR 244,417 thousand in 2011 (EUR 93,841 thousand in 2010).
The borrowing costs accrued in relation to the financing of the concessions classified under the financial asset model amounted to EUR 28,910 thousand in 2011 (EUR 39,085 thousand in 2010).
The breakdown of the financial assets financed by means of “project finance” not meeting the requirements for recognition in accordance with IFRIC 12, and the changes in the balance of this heading in 2011 were as follows:
Thousands of euros 2011 2010
InvestmentAccumulated depreciation
Net carrying amount Investment
Accumulated depreciation
Net carrying amount
Beginning balance 288,528 (60,730) 227,798 3,400,920 (249,825) 3,151,095
Changes in the scope of consolidation
(49,109) 7,265 (41,844) 3,265 - 3,265
Additions or charges for the year
422,885 (53,917) 368,968 891,068 (126,901) 764,167
Exchange differences 755 - 755 7,770 (794) 6,976
Disposals or reductions (87,637) (217) (87,854) (14,976) 10,916 (4,060)
Transfers (383,989) 43,864 (340,125) (3,999,519) 305,874 (3,693,645)
Ending balance 191,433 (63,735) 127,698 288,528 (60,730) 227,798
92 ANNUAL REPORT 2011 OF ACS GROUP ECONOMIC AND FINANCIAL REPORT
Thousands of euros
Type of infrastructureEnd date of
operation InvestmentAccumulated depreciation
Net carrying amount of non-current assets in
projects
Waste treatment 2019 - 2034 90,926 (22,225) 68,701
Security 2014 64,128 (40,476) 23,652
Wind powered facilities 2020 - 2036 17,802 (512) 17,290
Energy transport 2038 9,980 (501) 9,479
Highways/roads 2012 - 2043 33 (21) 12
Thermal solar power plants 2035 - 2036 8,564 - 8,564
Total 191,433 (63,735) 127,698

In 2011 and 2010 the acquisitions of non-current assets in projects amounted to EUR 1,445,587 thousand and EUR 1,797,941 thousand, respectively.
The main project investments in 2011 were investments made by Industrial Services area in power lines amounting to EUR 584,268 (EUR 201,906 thousand in 2010), investments in photovoltaic and solar thermal power plants amounting to EUR 310,938 thousand (EUR 633,056 thousand in 2010) and investments in wind powered facilities amounting to EUR 72,191 (EUR 240,707 thousand in 2010). Additionally, most noteworthy of the investments made by Construction area were investments in highway concessions amounting to EUR 414,127 thousand (EUR 570,574 thousand in 2010). However, as a result of sales decisions in 2011 the balances relating to certain assets were transferred to assets held for sale.
Noteworthy in 2011 was the sale of 50% of the I-595 highway Express, Llc which led to a cost reduction amounting to EUR 5,378 thousand. In 2010 there were no material disposals of non-current assets in projects.
Interest capitalised in 2011 amounted to EUR 56,776 thousand (EUR 2,717 thousand in 2010). Said capitalisation was performed by applying an average capitalisation rate of 3.59% in 2011 (3.26% in 2010).
The impairment losses recognised in the income statement at 31 December 2011 amounted to EUR 37,910 thousand. No significant impairment losses were recognised in the income statement at December 31, 2010.
At 31 December 2011 and 2010, the Group had entered into contractual commitments for the acquisition of non-current assets or the completion of projects amounting to EUR 244,990 thousand and EUR 954,902 thousand, respectively, which mainly relate to the Group’s current concession agreements. The year-on year decrease relates mainly to the sale of highway I-595.
The financing relating to non-current assets in projects is explained in Note 18.
The concession operator’s obligations include, inter alia, the maintenance of restricted cash balances, known as reserve accounts and included under the heading “Other Current Financial Assets” (Note 10.05).
93CONSOLIDATED FINANCIAL STATEMENTS

ConsolidatedFinancial Statements
07. Investment propertyThe changes in this heading in 2011 and 2010 were as follows:
The Group’s investment property relates mostly to subsidized housing in Madrid earmarked for lease by the lessee IVIMA (Madrid Housing Institute) and maturing from 2023 to 2024. The rest relates to housing, car parks and commercial premises to be leased.
The rental income earned from investment property amounted to EUR 9,831 thousand in 2011 (EUR 8,785 thousand in 2010). The average occupancy level of the aforementioned assets was 54% with an average rentable area of 97,538 square meters in the year.
The direct operating expenses arising from investment properties included under “Other Operating Expenses”, amounted to EUR 9,895 thousand (EUR 9,626 thousand in 2010).
There were no contractual commitments for the acquisition, construction or development of investment property, or for repairs, maintenance and improvements.
At the beginning of 2011, the gross carrying amount was EUR 70,515 thousand and accumulated depreciation (increased by accumulated impairment losses) amounted to EUR 13,339 thousand. At year-end, the gross carrying amount and accumulated depreciation were EUR 126,022 thousand and EUR 46,511 thousand, respectively. There were no material differences with respect to fair value in the accompanying consolidated fi nancial statements.
Thousands of euros 2011 2010
Beginning balance 57,176 61,021
Changes in the scope of consolidation 23,788 -
Additions 866 -
Charges for the year (3,179) (3,121)
Impairment losses (281) (675)
Transfers from/to other assets 1,141 (49)
Ending balance 79,511 57,176
94 ANNUAL REPORT 2011 OF ACS GROUP ECONOMIC AND FINANCIAL REPORT

08. Joint venturesThe main aggregates included in the accompanying consolidated fi nancial statements relating to joint ventures for 2011 and 2010, in proportion to the percentage of ownership interest in the share capital of each joint venture, are as follows:
In accordance with the opinion set forth in IAS 31, the companies are accounted for using the equity method (Note 02.01).
The identifi cation data relating to the main ACS Group unincorporated joint ventures (UTEs) are detailed in Appendix II.
09. Investments in companies accounted for using the equity methodThe changes in the balance of this heading were as follows:
Thousands of euros 2011 2010
Beginning balance 2,333,359 4,193,671
Additions 1,015,484 206,475
Disposals (815,800) (1,732,223)
Elimination of unrealised gains - (358,501)
Change in consolidation method (269,770) (5,314)
Profi t for the year 318,469 221,766
Changes in the equity of associates
Exchange differences/other 241,865 32,500
Cash fl ow hedges (241,326) (34,748)
Available-for-sale fi nancial assets (38,285) (61,200)
Transfer to non-current assets held for sale/discontinued operations (770,603) (12,038)
Distribution of dividends (203,482) (117,029)
Ending balance 1,569,911 2,333,359
95CONSOLIDATED FINANCIAL STATEMENTS
Thousands of eurosUTE´s, EIG´s Companies
Balance at 31/12/2011
Balance at 31/12/2010
Balance at 31/12/2011
Balance at 31/12/2010
Activos no corrientes 447,347 359,801 2,330,097 309,474
Activos corrientes 3,569,457 4,519,076 1,271,061 182,244
Pasivos no corrientes 257,668 134,603 1,894,036 190,050
Pasivos corrientes 3,190,991 4,267,427 1,083,639 168,740
Ingresos 3,815,390 4,312,606 1,843,756 230,672
Resultado del ejercicio 426,610 309,841 (259,359) 14,529

ConsolidatedFinancial Statements
The detail, by company, of the investments accounted for by the equity method is as follows:
The detail, by line of business, of the investments in companies accounted for by the equity method at December 31 2011 and 2010 is as follows:
Hochtief, A.G.
At 31 December 2010 the Group held an ownership interest of 27.25% of the share capital of Hochtief, A. G, with a carrying value of EUR 1,594,702 thousand at this date. Since the Group now holds the majority of voting rights, as indicated in Note 02.02.f) this company had to be fully consolidated rather than being accounted for by the equity method as in the past. Additionally, the ownership interests held by Hochtief and accounted for by the equity method were recognised in accordance with the alternative provided by IAS 31 regardless of whether they are associates or joint ventures and amounted to EUR 1,019,884 thousand at 31 December 2011, noteworthy being the ownership interest in Aurelis Real Estate in Germany amounting to EUR 249,664 thousand.
Admirabilia, S.L. (Abertis Infraestructuras, S.A.)
This company holds the indirect ownership of the ACS Group in Abertis Infraestructuras, S.A., which amounts to 10.28% of its share capital. This company is accounted for by the equity method because the Group holds 40% of the voting rights in Admirabilia, S. L. (which, together with Trebol International, holds a 25.83% ownership interest in the share capital of Abertis Infraestructuras, S.A.) and because the ACS Group is a member of the Board of Directors of Abertis Infraestructuras, S.A.
96 ANNUAL REPORT 2011 OF ACS GROUP ECONOMIC AND FINANCIAL REPORT
Thousands of euros
31/12/2011 31/12/2010
Company % ownership Total carrying amount % ownership Total carrying amount
Hochtief, A.G. - - 27.25% 1,594,702
Admirabilia 99.00% 233,473 99.00% 239,221
Hochtief associates - 1,019,884 - -
Other associates - 316,554 - 499,436
Total 1,569,911 2,333,359
Thousands of euros
2011 2010
Line of businessShare of net
assetsProfi t for the
yearTotal carrying
amountShare of net
assetsProfi t for the
yearTotal carrying
amount
Construction 864,750 247,556 1,112,306 1,648,269 61,523 1,709,792
Industrial Services 105,954 18,702 124,656 237,018 27,662 264,680
Environment 84,054 12,343 96,397 102,548 13,561 116,109
Corporate unit 196,684 39,868 236,552 123,758 119,020 242,778
Total 1,251,442 318,469 1,569,911 2,111,593 221,766 2,333,359
The sale on 31 August 2010 to the investment fund advisor CVC Capital Partners, of 25.83% of the ownership interest in Abertis Infraestructuras, S.A. at a price of EUR 15 per share to two companies, Admirabilia, S L. and Trebol International, B.V. Under this agreement Admirabilia, S.L. acquired a 10.28% share in Abertis through a contribution and sale, and Trebol acquired the remaining 15.55% through a sale. The share capital of Admirabilia, S.L. was distributed among the shareholders as follows: at a rate of 99%, for the ACS Group and 1% for Trebol.
The gains on this transaction before taxes, once having eliminated the profi t arising between ACS Group companies, amounted to EUR 519,977 thousand, which was included under “Impairment and gains or losses on the disposal of fi nancial instruments” in the accompanying consolidated income statement for 2010. In relation to this transaction, the ACS Group is entitled to additional compensation, which has not been considered in the calculation of the gain on the transaction, for the ownership interest sold in the event that certain corporate transactions are performed in the future at Abertis Infraestructuras, S.A. On the other hand, there are no agreements between shareholders giving rise to the transfer of risks and benefi ts associated with this ownership interest nor does the ACS Group maintain risks associated with the ownership interest in Abertis, which is considered to be an associate, since the Group continues to have signifi cant infl uence on the management of the company through its positions on the board of directors.
In relation to the goodwill arising from the ownership interest in Abertis Infraestructuras, S.A. through Admirabilia, S.L., the ACS Group has tested the goodwill for impairment. In this regard, since the investee company is traded through the Spanish computerised trading system and as a result of the value of the transaction described above, the analysis has been conducted in comparison with the company’s market price at the end of the reporting period, and accordingly no signs of impairment were considered to exist.
The market value of the associates accounted for by the equity method for which there are prices quoted in the stock market at December 31 of 2011 amounted to EUR 1,151,633 thousand (EUR 2,540,816 thousand in 2010). The year-on-year decrease was a result of the full consolidation of the ownership interest in Hochtief A.G.
At 31 December 2011, the main listed investee was Abertis Infraestructuras, S.A., whose attributable market value amounted to EUR 989,444 thousand (EUR 1,027,473 thousand in 2010).
In addition to the above-mentioned impairment tests, the Group has performed the corresponding impairment testing to verify the recoverability of the rest of the assets. for the purpose of carrying out these impairment tests, the Group considered the future cash fl ow projections as well as the discounting of dividends and external market valuations for each of the ownership interests in accordance with available information. Especially in relation to the underlying goodwill, the tests did not disclose the need to for a provision to cover signifi cant impairment in the consolidated income statement at the end of 2011 and 2010.
The assets, liabilities, attributable equity, sales and profi t for the year the companies included under this heading, as well as the ownership interest of the ACS Group in this company are presented in Appendix III.
97CONSOLIDATED FINANCIAL STATEMENTS
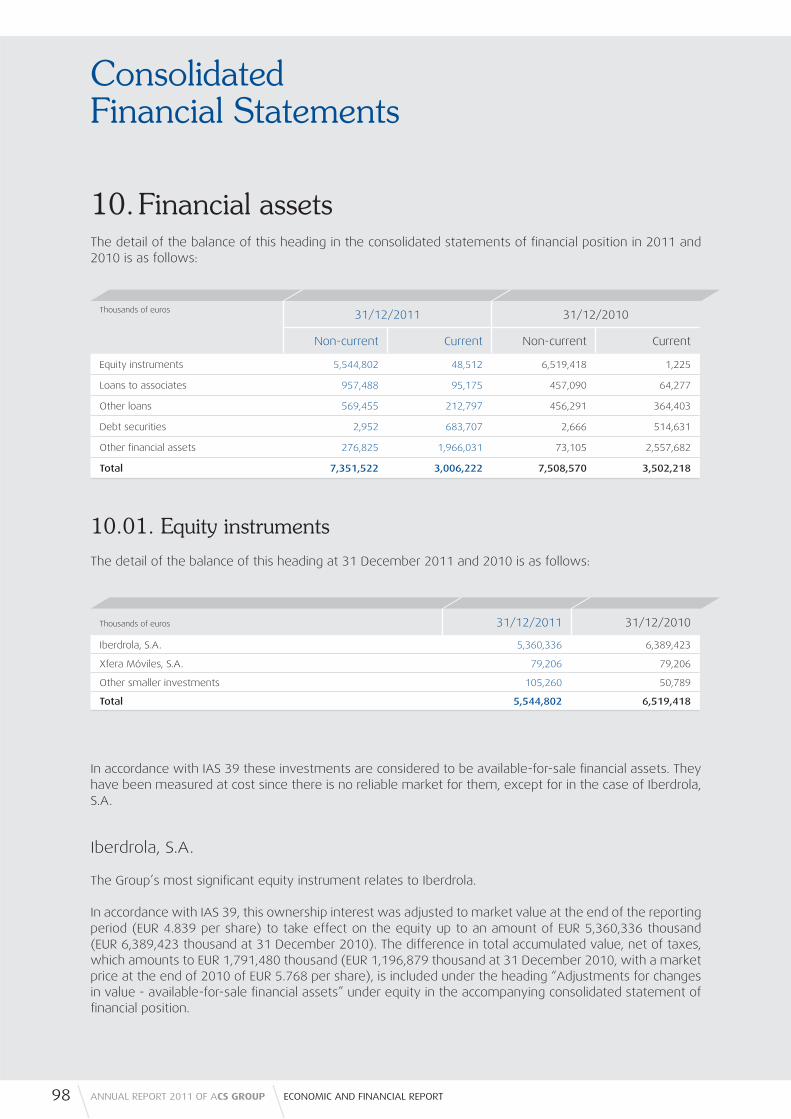
ConsolidatedFinancial Statements
10. Financial assetsThe detail of the balance of this heading in the consolidated statements of fi nancial position in 2011 and 2010 is as follows:
10.01. Equity instruments
The detail of the balance of this heading at 31 December 2011 and 2010 is as follows:
In accordance with IAS 39 these investments are considered to be available-for-sale fi nancial assets. They have been measured at cost since there is no reliable market for them, except for in the case of Iberdrola, S.A.
Iberdrola, S.A.
The Group’s most signifi cant equity instrument relates to Iberdrola.
In accordance with IAS 39, this ownership interest was adjusted to market value at the end of the reporting period (EUR 4.839 per share) to take effect on the equity up to an amount of EUR 5,360,336 thousand (EUR 6,389,423 thousand at 31 December 2010). The difference in total accumulated value, net of taxes, which amounts to EUR 1,791,480 thousand (EUR 1,196,879 thousand at 31 December 2010, with a market price at the end of 2010 of EUR 5.768 per share), is included under the heading “Adjustments for changes in value - available-for-sale fi nancial assets” under equity in the accompanying consolidated statement of fi nancial position.
98 ANNUAL REPORT 2011 OF ACS GROUP ECONOMIC AND FINANCIAL REPORT
Thousands of euros 31/12/2011 31/12/2010
Non-current Current Non-current Current
Equity instruments 5,544,802 48,512 6,519,418 1,225
Loans to associates 957,488 95,175 457,090 64,277
Other loans 569,455 212,797 456,291 364,403
Debt securities 2,952 683,707 2,666 514,631
Other fi nancial assets 276,825 1,966,031 73,105 2,557,682
Total 7,351,522 3,006,222 7,508,570 3,502,218
Thousands of euros 31/12/2011 31/12/2010
Iberdrola, S.A. 5,360,336 6,389,423
Xfera Móviles, S.A. 79,206 79,206
Other smaller investments 105,260 50,789
Total 5,544,802 6,519,418

At 31 December 2011, the ACS Group held 1,107,736,286 shares representing 18.83% of the share capital of Iberdrola, S.A. at that date (20.2% of the share capital of Iberdrola at 31 December 2010).
In 2011 there were no purchases or disposals of shares of Iberdrola, S.A., the decrease in the percentage of ownership interest being a result of the diluting effects of corporate transactions and the fl exible Iberdrola dividend. The most signifi cant change in 2010 was the acquisition of 477,457,327 shares for a total of EUR 2,752,617 thousand to reach a total of 1,107,736,286 shares at 31 December 2010.
This investment was mostly fi nanced through a syndicated loan with different banks secured by the shares of Iberdrola, S.A., subordinated debt of ACS, Actividades de Construcción y Servicios, S. A. and an “equity swap” (Note 18).
In relation to the potential impairment of the ownership interest in Iberdrola, the following should be highlighted:
The ACS Group analyses the existence of signs of impairment of all relevant equity instruments. If any such signs of impairment exist, the calculations and estimates considered to be necessary are made to determine whether there is a signifi cant or prolonged decline in the fair value of an investment, and if necessary, recognise an impairment loss. Additionally, it should be indicated that as concluded by the IASB, the international agency responsible for the development of the international fi nancial reporting standards, there is wide diversity in the market in terms of the practical application of the concepts of signifi cant or prolonged decline, and, in any case, the interpretation of the meaning of these concepts requires the professional judgment of the company’s management. In fact, and to eliminate such diversity in the practical application of these concepts the IASB issued International Financial Reporting Standard 9 on Financial Instruments, which amended the international standards relating to the calculation of impairment, and required all changes in the fair value of fi nancial instruments that are classifi ed as ‘available for sale” to be recognized in the company’s equity, without the possibility of recycling this adjustment in the consolidated income statement. Finally, as mentioned in Note 03.24 it should be indicated that this new standard is not yet in force in Spain since it has not yet been endorsed by the EU.
ACS has declared its investment in Iberdrola to be a strategic and long-term holding. In fact, to strengthen the strategic nature of this holding and as already indicated signifi cant purchases of shares of Iberdrola were made in 2010. However, temporarily and to date, it has not been possible to secure a position on the Board of Directors of Iberdrola, S.A., a circumstance which caused the ACS Group to challenge the resolutions adopted by the shareholders at the Annual General Meetings of Iberdrola, S.A. held in March 2010 and 2011 in court. This is a very unique and absolutely exceptional circumstance, and although a ruling had been handed down by the Courts of First and second Instance against the interests of the ACS Group at the date of the approval of these fi nancial statements, the Group’s Management has full confi dence that the court will ultimately rule in the Company’s favour.
Taking into account that the ownership interest is strategic in nature; the ACS Group is the largest shareholder of the company; he market value does not accurately refl ect the value of such a signifi cant block of shares of Iberdrola; and that the Group does not plan to recover its investment through stock market transactions, although there are signs of impairment considering that the market price of the shares has continued to decline, the ACS Group does not consider there to be objective evidence of the impairment of the ownership interest in Iberdrola. In this respect, paragraph 59 of IAS 39 provides that “a fi nancial asset or a group of fi nancial assets is impaired and impairment losses are incurred if, and only if, there is objective evidence of impairment as a result of one or more events that occurred after the initial recognition of the asset (a “loss event” and that loss event (or events) has an impact on the estimated future cash fl ows of the fi nancial asset or group of fi nancial assets that can be reliably estimated”.
99CONSOLIDATED FINANCIAL STATEMENTS

ConsolidatedFinancial Statements
Loss events which might have an effect on the future estimated cash fl ows of the investment have not been identifi ed in either the 2010 fi nancial statements of Iberdrola or other public information published by Iberdrola and the shareholders of Iberdrola represented on the Board of Directors. Additionally, it is noteworthy that according to the information published by Iberdrola, the stock market capitalisation of Iberdrola at 31 December 2011 was 0.85 times its accounting value, EBITDA grew 1.6% with respect to 2010 and its net recurring profi t increased by 1.2% in 2011.
Therefore, since there is no objective evidence of impairment, in the case that in accordance with the reports drawn up by independent experts and the dividend and cash fl ow discounting calculations, the recoverable value of the investment is higher than its carrying value, the ACS Group does not consider the drop in the shares’ market price to necessarily be a reason for the recognition of an impairment loss.
In order to assess whether or not there was a need to recognise an impairment of the investment, several valuations by independent experts have been requested which evidence that the value of the investment is higher than the consolidated average cost of the shares of Iberdrola, S.A. prior to their adjustment to market value. These valuations do not include a premium, which would always be included in corporate transactions relating to an ownership percentage such as that held by the ACS Group in Iberdrola.
As a complement to the analysis, the ACS Group has conducted in-house an impairment test on their ownership interest in Iberdrola based on the discounting of future dividends and other information available on its investee Iberdrola, which also allowed it to conclude that there was no impairment.
The main assumptions of the impairment test are based on the latest information on dividends announced by the company, as well as the policy of shareholder compensation maintenance of Iberdrola (measured as a percentage of the recurring net profi t). A perpetual growth rate of 3% was estimated (in this regard, it should be noted that the cumulative annual growth rate of dividends paid by Iberdrola in the period 1990-2010 was 6% and that the International Monetary Fund has estimated growth in Spain in terms of real GDP of 1.8% and infl ation of 1.8% in 2016, according to its “World Economic Outlook” report of September 2011). The equity discount rate used was 8.04%.
As a result of all the analyses mentioned above, the directors of the ACS Group considered that there were no factors evidencing the existence of impairment at the end of 2011. Therefore, having analysed the signs of impairment of the investment existing at the end of the reporting period, and based on the above arguments, having concluded that there is no signifi cant or prolonged decline in the fair value of the investment, the Company maintained the adjustments in value amounting to EUR 1,791,480 thousand under this heading without recognising any impairment in profi t or loss.
However, the impairment test did evidence a very small gap in the recoverable amount as compared to the carrying amount, and it is highly sensitivity to changes in the discount rates, growth in residual value and the performance of the company’s dividends, meaning that changes in these assumptions might give rise to the need to recognise impairment. In this context, and in accordance with the principle of prudence, the ACS Group has decided not to recognise the profi t before taxes arising from its ownership interest in Iberdrola, S.A. in its consolidated income statement for 2011 (Note 28.06).
100 ANNUAL REPORT 2011 OF ACS GROUP ECONOMIC AND FINANCIAL REPORT
Xfera Móviles, S.A. (Yoigo)
At 31 December 2011 and 2010, the ACS Group had a 17% ownership interest in the share capital of Xfera Mobile, S.A. through ACS Telefonía Móvil, S.L. after the sale of part of its interest in 2006 to the Telia Sonera Group. In relation to the indirect ownership interest in Xfera Móviles, S.A., there is an unrecognized contingent price and in certain scenarios, puts and calls on the ACS interests, for which the conditions for exercising are unlikely to be met.
The carrying value of the ownership interest in Xfera amounted to EUR 198,376 thousand at 31 December 2011 and 2010, which following write-downs in previous years, relates to the contributions made in the years 2006 and later, including the participation loans associated with the same included under the heading “Other non-current loans”. This carrying value relates to the contributions made after 2006, since the Group had recorded very signifi cant provisions in relation to this ownership interest in the years previous to 2006.
In order to calculate the recoverable value of this investment the ACS Group used the discounted cash-fl ow method, on the basis of the company’s internal projections for the period 2011-2016, using the weighted average cost of capital (WACC) of 10.4% as the discount rate and a perpetual growth rate of 2%. A sensitivity analysis was also performed taking into consideration different discount rates, a perpetual growth rate and even deviations of up to minus 50% in the business plan estimates for the company. Both in the baseline and in the rest of the scenarios considered, the recoverable value of this investment would be above its carrying value. This conclusion is consistent with the valuations of Xfera published by analysts and by its controlling shareholder Notwithstanding the foregoing, in accordance with the principle of prudence, and considering that Xfera is in the fi nal stages of its launch phase, the Group has not revalued its ownership interest to its estimated market value.
Other investments
In 2011, other investments related to non-controlling interests including inter alia, the ownership interests held by subsidiaries of Hochtief amounting to a net EUR 64,718 thousand.
In 2010 noteworthy were the ownership interests held by the ACS Group in Accesos de Madrid Concesionaria Española, S.A. and the collection rights on future dividends of Sociedad Autovía de la Mancha, S.A., which were recognised as an equity instrument since it was conceptually considered to better refl ect the true and fair image since it relates to future dividends of the shadow toll concession for a maximum period of 30 years, which is guaranteed by the fl ows generated by this Company.
The Group has assessed the recoverability of the assets included under this heading, recognising the related impairment on the basis of the recoverability analysis performed.
101CONSOLIDATED FINANCIAL STATEMENTS

ConsolidatedFinancial Statements
10.02. Loans to associates
The detail of the balances of “Loans to Associates” and of the scheduled maturities at 31 December 2011, is as follows:
At 31 December 2011, the non-current loans in euros include, inter alia, the loan granted in relation to the acquisition of Aurelis Real Estate for EUR 142,010 thousand maturing in 2013. Also of signifi cance were the non-current loans in euros granted to Línea Nueve (Tranches two and four) amounting to EUR 49,601 thousand, to Celtic Road Group (Waterford and Portlaoise) amounting to EUR 45,566 thousand, to Circunvalación de Alicante, S.A. amounting to EUR 42,793 thousand, to Infrastructuras y Radiales, S.A. amounting to EUR 41,177 thousand, to TP Ferro Concesionaria, S.A. amounting to EUR 30,901 thousand, and to Intercambiador de Transportes de Plaza Castilla, S.A. amounting to EUR 25,152 thousand.
Also, in relation to foreign currency loans, noteworthy is the loan granted to Habtoor Leighton Group for EUR 380,993 thousand, which matures in 2013. In relation to the loan to Habtoor Leighton Group, the investment in this company was fully provisioned in the accompanying fi nancial statements, and other provisions were also recognised to cover other risks relating to this ownership interest.
The detail of the balances of “Loans to Associates” and of the scheduled maturities at 31 December 2010, is as follows:
At 31 December 2010, among the loans to associates, noteworthy was the current loan granted to the transmission line in Brazil Brillante Transmissora de Energía for EUR 34,104 thousand. Non-current loans included the loan granted to Escal UGS, S.L. for the amount of EUR 75,916 thousand. Among the non-current loans granted in euros, of signifi cance was the loan granted to Circunvalación de Alicante, S.A. for EUR 41,967 thousand, to TP Ferro Concesionaria, S.A. for EUR 29,713 thousand, and to Intercambiador de Transportes de Plaza Castilla, S.A. for EUR 27,637 thousand, maturing in 2034, 2035 and 2039, respectively. In relation to foreign currency loans, noteworthy was the loan granted to Sociedad Concesionaria Vespucio Norte Express, S.A. in Chilean pesos for EUR 45,106 thousand, which matures after 2011.
These loans bear market interest.
102 ANNUAL REPORT 2011 OF ACS GROUP ECONOMIC AND FINANCIAL REPORT
Thousands of euros Current Non-current
2012 2013 2014 20152016 and
subsequent years
Total non-
current
Loans to associates 95,175 581,847 349 80,153 295,139 957,488
Thousands of euros Current Non-current
2011 2012 2013 20142015 and
subsequent years
Total non-
current
Loans to associates 64,277 20,821 - 10,828 425,441 457,090
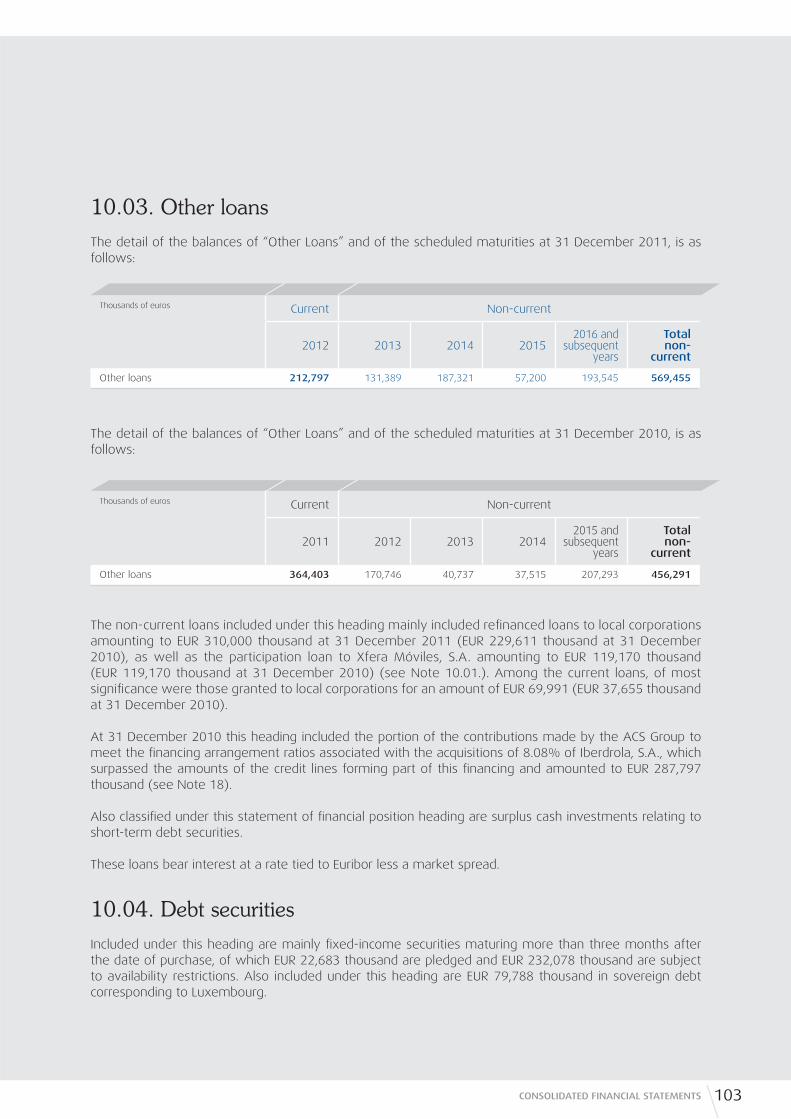
10.03. Other loans
The detail of the balances of “Other Loans” and of the scheduled maturities at 31 December 2011, is as follows:
The detail of the balances of “Other Loans” and of the scheduled maturities at 31 December 2010, is as follows:
The non-current loans included under this heading mainly included refi nanced loans to local corporations amounting to EUR 310,000 thousand at 31 December 2011 (EUR 229,611 thousand at 31 December 2010), as well as the participation loan to Xfera Móviles, S.A. amounting to EUR 119,170 thousand (EUR 119,170 thousand at 31 December 2010) (see Note 10.01.). Among the current loans, of most signifi cance were those granted to local corporations for an amount of EUR 69,991 (EUR 37,655 thousand at 31 December 2010).
At 31 December 2010 this heading included the portion of the contributions made by the ACS Group to meet the fi nancing arrangement ratios associated with the acquisitions of 8.08% of Iberdrola, S.A., which surpassed the amounts of the credit lines forming part of this fi nancing and amounted to EUR 287,797 thousand (see Note 18).
Also classifi ed under this statement of fi nancial position heading are surplus cash investments relating to short-term debt securities.
These loans bear interest at a rate tied to Euribor less a market spread.
10.04. Debt securities
Included under this heading are mainly fi xed-income securities maturing more than three months after the date of purchase, of which EUR 22,683 thousand are pledged and EUR 232,078 thousand are subject to availability restrictions. Also included under this heading are EUR 79,788 thousand in sovereign debt corresponding to Luxembourg.
103CONSOLIDATED FINANCIAL STATEMENTS
Thousands of euros Current Non-current
2012 2013 2014 20152016 and
subsequent years
Total non-
current
Other loans 212,797 131,389 187,321 57,200 193,545 569,455
Thousands of euros Current Non-current
2011 2012 2013 20142015 and
subsequent years
Total non-
current
Other loans 364,403 170,746 40,737 37,515 207,293 456,291
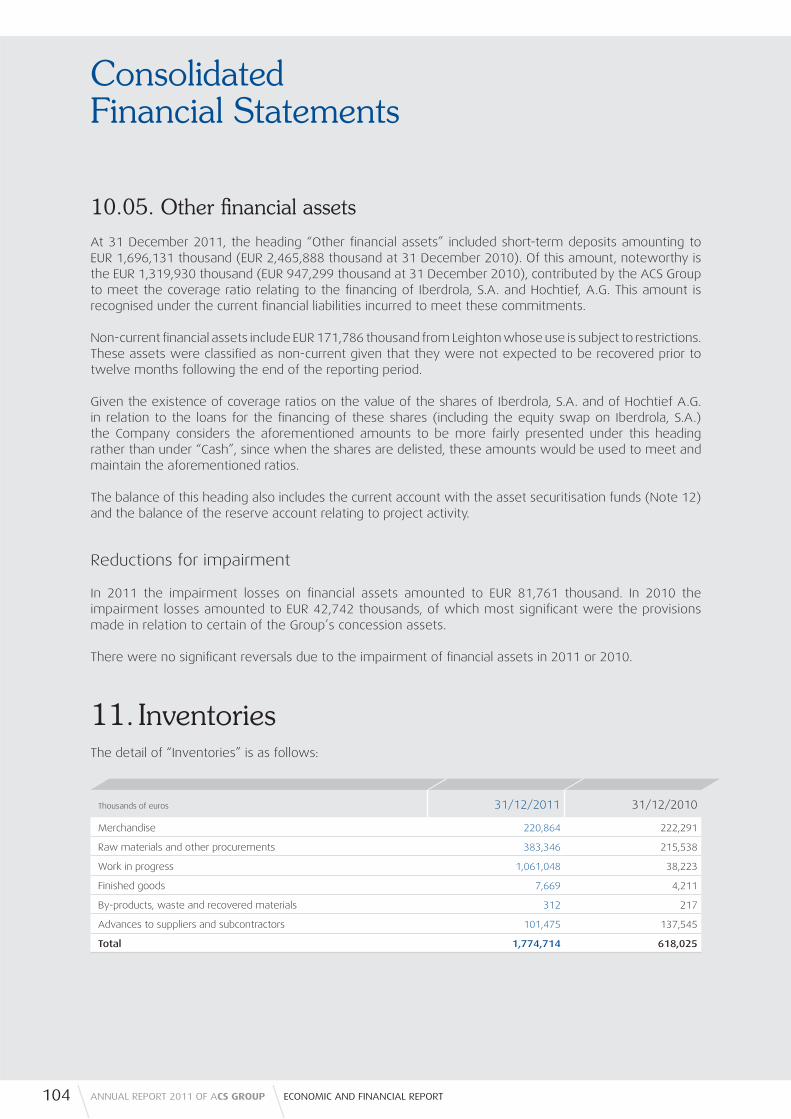
ConsolidatedFinancial Statements
10.05. Other fi nancial assets
At 31 December 2011, the heading “Other fi nancial assets” included short-term deposits amounting to EUR 1,696,131 thousand (EUR 2,465,888 thousand at 31 December 2010). Of this amount, noteworthy is the EUR 1,319,930 thousand (EUR 947,299 thousand at 31 December 2010), contributed by the ACS Group to meet the coverage ratio relating to the fi nancing of Iberdrola, S.A. and Hochtief, A.G. This amount is recognised under the current fi nancial liabilities incurred to meet these commitments.
Non-current fi nancial assets include EUR 171,786 thousand from Leighton whose use is subject to restrictions. These assets were classifi ed as non-current given that they were not expected to be recovered prior to twelve months following the end of the reporting period.
Given the existence of coverage ratios on the value of the shares of Iberdrola, S.A. and of Hochtief A.G. in relation to the loans for the fi nancing of these shares (including the equity swap on Iberdrola, S.A.) the Company considers the aforementioned amounts to be more fairly presented under this heading rather than under “Cash”, since when the shares are delisted, these amounts would be used to meet and maintain the aforementioned ratios.
The balance of this heading also includes the current account with the asset securitisation funds (Note 12) and the balance of the reserve account relating to project activity.
Reductions for impairment
In 2011 the impairment losses on fi nancial assets amounted to EUR 81,761 thousand. In 2010 the impairment losses amounted to EUR 42,742 thousands, of which most signifi cant were the provisions made in relation to certain of the Group’s concession assets.
There were no signifi cant reversals due to the impairment of fi nancial assets in 2011 or 2010.
11. InventoriesThe detail of “Inventories” is as follows:
104 ANNUAL REPORT 2011 OF ACS GROUP ECONOMIC AND FINANCIAL REPORT
Thousands of euros 31/12/2011 31/12/2010
Merchandise 220,864 222,291
Raw materials and other procurements 383,346 215,538
Work in progress 1,061,048 38,223
Finished goods 7,669 4,211
By-products, waste and recovered materials 312 217
Advances to suppliers and subcontractors 101,475 137,545
Total 1,774,714 618,025
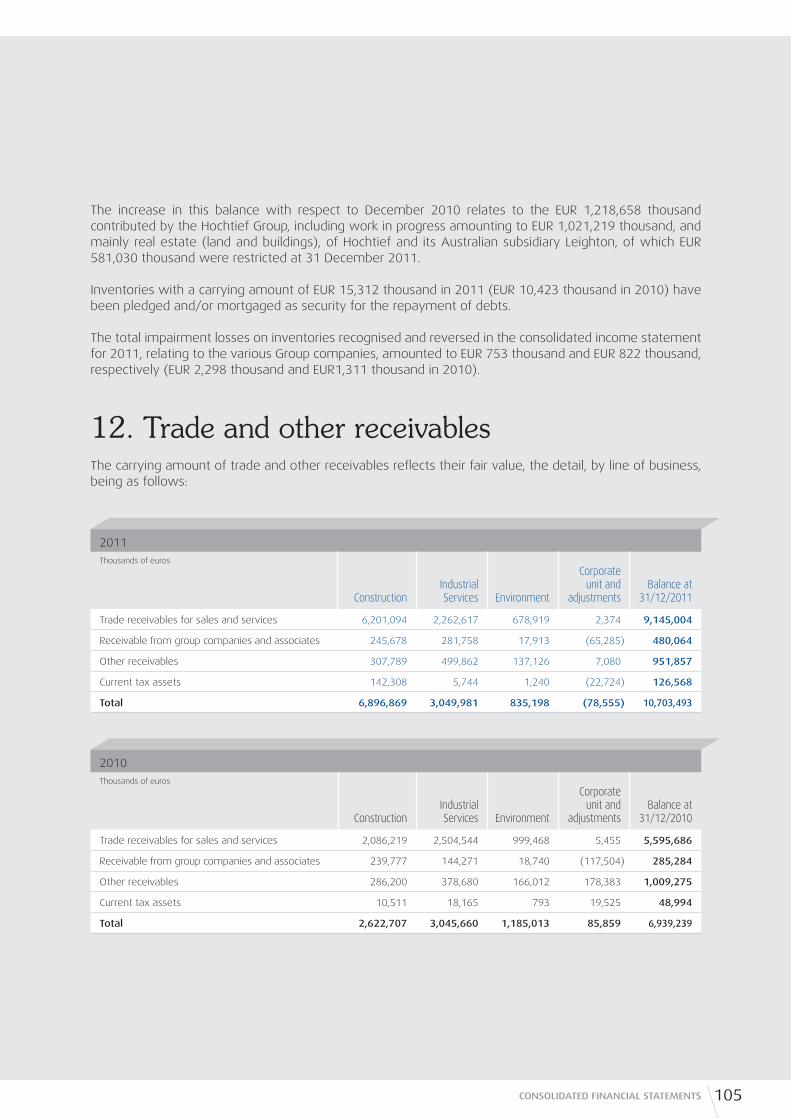
The increase in this balance with respect to December 2010 relates to the EUR 1,218,658 thousand contributed by the Hochtief Group, including work in progress amounting to EUR 1,021,219 thousand, and mainly real estate (land and buildings), of Hochtief and its Australian subsidiary Leighton, of which EUR 581,030 thousand were restricted at 31 December 2011.
Inventories with a carrying amount of EUR 15,312 thousand in 2011 (EUR 10,423 thousand in 2010) have been pledged and/or mortgaged as security for the repayment of debts.
The total impairment losses on inventories recognised and reversed in the consolidated income statement for 2011, relating to the various Group companies, amounted to EUR 753 thousand and EUR 822 thousand, respectively (EUR 2,298 thousand and EUR 1,311 thousand in 2010).
12. Trade and other receivablesThe carrying amount of trade and other receivables refl ects their fair value, the detail, by line of business, being as follows:
2011
Thousands of euros
ConstructionIndustrial Services Environment
Corporate unit and
adjustmentsBalance at
31/12/2011
Trade receivables for sales and services 6,201,094 2,262,617 678,919 2,374 9,145,004
Receivable from group companies and associates 245,678 281,758 17,913 (65,285) 480,064
Other receivables 307,789 499,862 137,126 7,080 951,857
Current tax assets 142,308 5,744 1,240 (22,724) 126,568
Total 6,896,869 3,049,981 835,198 (78,555) 10,703,493
2010
Thousands of euros
ConstructionIndustrial Services Environment
Corporate unit and
adjustmentsBalance at
31/12/2010
Trade receivables for sales and services 2,086,219 2,504,544 999,468 5,455 5,595,686
Receivable from group companies and associates 239,777 144,271 18,740 (117,504) 285,284
Other receivables 286,200 378,680 166,012 178,383 1,009,275
Current tax assets 10,511 18,165 793 19,525 48,994
Total 2,622,707 3,045,660 1,185,013 85,859 6,939,239
105CONSOLIDATED FINANCIAL STATEMENTS
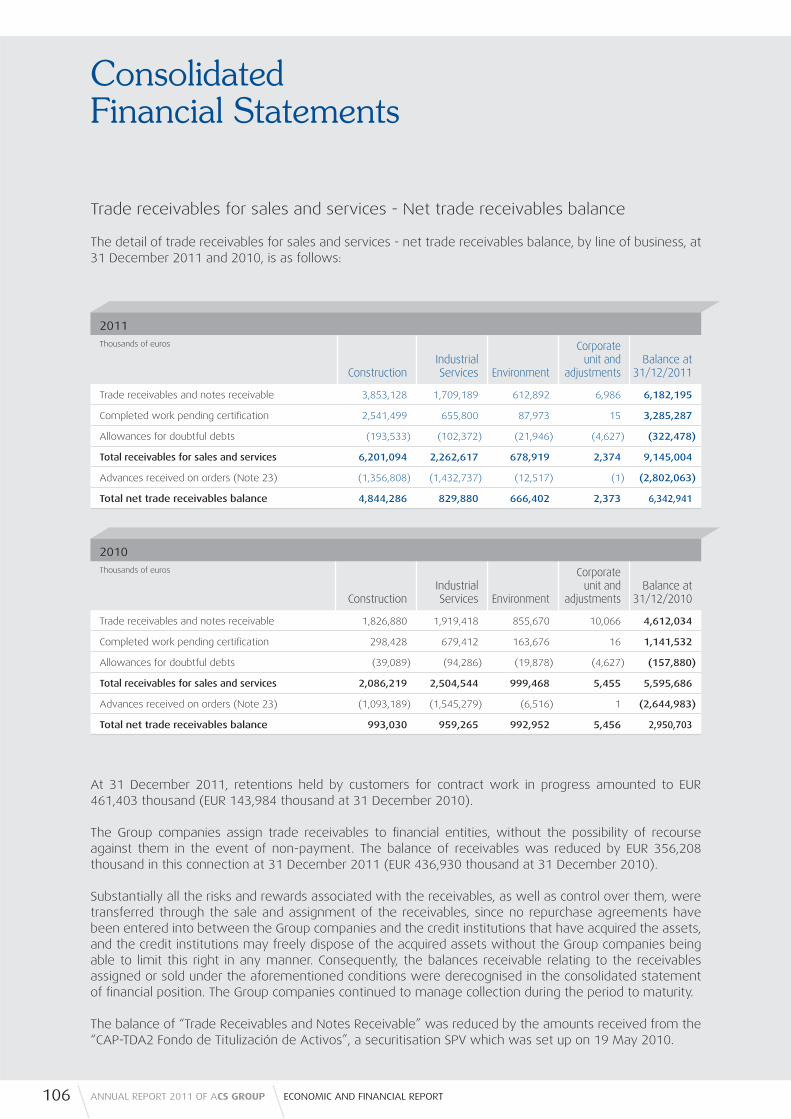
ConsolidatedFinancial Statements
Trade receivables for sales and services - Net trade receivables balance
The detail of trade receivables for sales and services - net trade receivables balance, by line of business, at 31 December 2011 and 2010, is as follows:
At 31 December 2011, retentions held by customers for contract work in progress amounted to EUR 461,403 thousand (EUR 143,984 thousand at 31 December 2010).
The Group companies assign trade receivables to fi nancial entities, without the possibility of recourse against them in the event of non-payment. The balance of receivables was reduced by EUR 356,208 thousand in this connection at 31 December 2011 (EUR 436,930 thousand at 31 December 2010).
Substantially all the risks and rewards associated with the receivables, as well as control over them, were transferred through the sale and assignment of the receivables, since no repurchase agreements have been entered into between the Group companies and the credit institutions that have acquired the assets, and the credit institutions may freely dispose of the acquired assets without the Group companies being able to limit this right in any manner. Consequently, the balances receivable relating to the receivables assigned or sold under the aforementioned conditions were derecognised in the consolidated statement of fi nancial position. The Group companies continued to manage collection during the period to maturity.
The balance of “Trade Receivables and Notes Receivable” was reduced by the amounts received from the “CAP-TDA2 Fondo de Titulización de Activos”, a securitisation SPV which was set up on 19 May 2010.
2011
Thousands of euros
ConstructionIndustrial Services Environment
Corporate unit and
adjustmentsBalance at
31/12/2011
Trade receivables and notes receivable 3,853,128 1,709,189 612,892 6,986 6,182,195
Completed work pending certifi cation 2,541,499 655,800 87,973 15 3,285,287
Allowances for doubtful debts (193,533) (102,372) (21,946) (4,627) (322,478)
Total receivables for sales and services 6,201,094 2,262,617 678,919 2,374 9,145,004
Advances received on orders (Note 23) (1,356,808) (1,432,737) (12,517) (1) (2,802,063)
Total net trade receivables balance 4,844,286 829,880 666,402 2,373 6,342,941
2010
Thousands of euros
ConstructionIndustrial Services Environment
Corporate unit and
adjustmentsBalance at
31/12/2010
Trade receivables and notes receivable 1,826,880 1,919,418 855,670 10,066 4,612,034
Completed work pending certifi cation 298,428 679,412 163,676 16 1,141,532
Allowances for doubtful debts (39,089) (94,286) (19,878) (4,627) (157,880)
Total receivables for sales and services 2,086,219 2,504,544 999,468 5,455 5,595,686
Advances received on orders (Note 23) (1,093,189) (1,545,279) (6,516) 1 (2,644,983)
Total net trade receivables balance 993,030 959,265 992,952 5,456 2,950,703
106 ANNUAL REPORT 2011 OF ACS GROUP ECONOMIC AND FINANCIAL REPORT
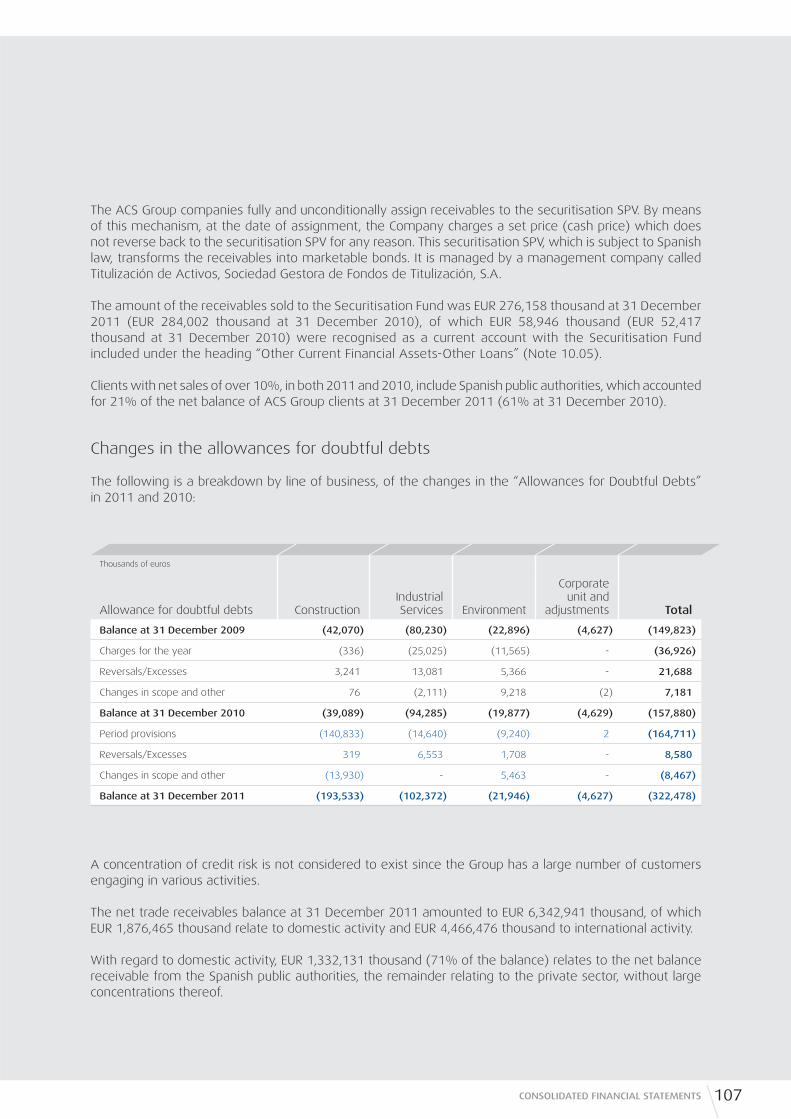
A concentration of credit risk is not considered to exist since the Group has a large number of customers engaging in various activities.
The net trade receivables balance at 31 December 2011 amounted to EUR 6,342,941 thousand, of which EUR 1,876,465 thousand relate to domestic activity and EUR 4,466,476 thousand to international activity.
With regard to domestic activity, EUR 1,332,131 thousand (71% of the balance) relates to the net balance receivable from the Spanish public authorities, the remainder relating to the private sector, without large concentrations thereof.
The ACS Group companies fully and unconditionally assign receivables to the securitisation SPV. By means of this mechanism, at the date of assignment, the Company charges a set price (cash price) which does not reverse back to the securitisation SPV for any reason. This securitisation SPV, which is subject to Spanish law, transforms the receivables into marketable bonds. It is managed by a management company called Titulización de Activos, Sociedad Gestora de Fondos de Titulización, S.A.
The amount of the receivables sold to the Securitisation Fund was EUR 276,158 thousand at 31 December 2011 (EUR 284,002 thousand at 31 December 2010), of which EUR 58,946 thousand (EUR 52,417 thousand at 31 December 2010) were recognised as a current account with the Securitisation Fund included under the heading “Other Current Financial Assets-Other Loans” (Note 10.05).
Clients with net sales of over 10%, in both 2011 and 2010, include Spanish public authorities, which accounted for 21% of the net balance of ACS Group clients at 31 December 2011 (61% at 31 December 2010).
Changes in the allowances for doubtful debts
The following is a breakdown by line of business, of the changes in the “Allowances for Doubtful Debts” in 2011 and 2010:
107CONSOLIDATED FINANCIAL STATEMENTS
Thousands of euros
Allowance for doubtful debts ConstructionIndustrial Services Environment
Corporate unit and
adjustments Total
Balance at 31 December 2009 (42,070) (80,230) (22,896) (4,627) (149,823)
Charges for the year (336) (25,025) (11,565) - (36,926)
Reversals/Excesses 3,241 13,081 5,366 - 21,688
Changes in scope and other 76 (2,111) 9,218 (2) 7,181
Balance at 31 December 2010 (39,089) (94,285) (19,877) (4,629) (157,880)
Period provisions (140,833) (14,640) (9,240) 2 (164,711)
Reversals/Excesses 319 6,553 1,708 - 8,580
Changes in scope and other (13,930) - 5,463 - (8,467)
Balance at 31 December 2011 (193,533) (102,372) (21,946) (4,627) (322,478)

ConsolidatedFinancial Statements
In relation to foreign activity, this balance mainly relates to the activity carried on by Hochtief, A. G. and amounts to EUR 4,268,372 thousand. This figure includes amounts which were outstanding but not impaired at 31 December 2011, of which EUR 137,191 was up to 30 days overdue, EUR 36,817 thousand between 31 and 90 days overdue and EUR 66,432 thousand more than 90 days overdue.
Group management considers that the carrying amount of the trade receivables reflects their fair value. The Group companies are responsible for managing the accounts receivable and determining the need for an allowance, since each Company best knows its exact position and the relationship with each of its clients. However, each line of business lays down certain guidelines on the basis that each client has its own peculiarities depending on the business activity performed. In this regard, for the Construction area, the accounts receivable from public authorities pose no recoverability problems of significance, and international activity mainly relates to work performed for public authorities in foreign countries, which reduces the possibility of experiencing significant insolvency. On the other hand, for private clients there is an established guarantee policy prior to the beginning of construction, which significantly reduces the risk of insolvency.
In the Environmental area, the main problems are related to arrears from local public authorities. In these cases, the affected companies renegotiate with the public authorities involved for the collection of the receivable if it is not possible to recover the receivable in the short-term, by setting a long-term payment schedule. At 31 December 2011, this amount totalled EUR 300,960 thousand (EUR 229,611 thousand at 31 December 2010), which was included under the heading “Other Loans”, and matures as follows:
Additionally, the existence of arrears and of a possible default are low since besides the fact that the Group also has the right to request late interest from public authorities, its private clients are assigned a maximum risk level before contracting a service.
In the Industrial Services area, of most significance are private contracts, for which a maximum level of risk is assigned and collection conditions are based upon the solvency profile that is initially analysed for a client and for a specific project, depending on its size. In the case of foreign private clients, the practice is to require payments in advance at the beginning of the project and short-term collection periods allowing for positive management of working capital.
108 ANNUAL REPORT 2011 OF ACS GROUP ECONOMIC AND FINANCIAL REPORT
Thousands of euros
2012 2013 20142015 and
subsequent years Total
52,417 48,348 47,933 152,262 300,960

13. Other current assetsThis heading in the statement of fi nancial position fundamentally includes short-term accruals of prepaid expenses and interest.
14. Cash and cash equivalentsThe “Cash and cash equivalents” heading includes the Group’s cash and short-term bank deposits with an original maturity of three months or less. The carrying amount of these assets amounting to EUR 85,212 refl ect their fair value and there are no restrictions as to their use.
15. Equity
15.01. Capital
At 31 December 2011, the share capital of the Parent amounted to EUR 157,332 thousand and was represented by 314,664,594 fully subscribed and paid shares with a par value of EUR 0.5 each, all with the same voting and dividend rights.
Expenses directly attributable to the issue or acquisition of new shares are recognised in equity as a deduction from the amount thereof.
The General Shareholders’ Meeting held on 25 May 2009 authorised the Company’s Board of Directors to increase capital by up to half the Company’s share capital at the date of this resolution on one or more occasions, and at the date, in the amount and under the conditions freely agreed in each case, within fi ve years following 25 May 2009, and without having previously submitted a proposal to the General Shareholders’ Meeting. Accordingly, the Board of Directors may set the terms and conditions under which capital is increased as well as the features of the shares, investors and markets at which the increases are aimed and the issue procedure, freely offer the unsubscribed shares in the preferential subscription period; and in the event of incomplete subscription, cancel the capital increase or increase capital solely by the amount of the subscribed shares.
The capital increase or increases may be carried out through the issue of new shares, either ordinary, without voting rights, preference or recoverable. The new shares shall be payable by means of monetary contributions equal to the par value of the shares and any share premium which may be agreed.
The Board of Directors was expressly empowered to exclude preferential subscription rights in full or in part in relation to all or some of the issues agreed under the scope of this authorisation, where it is in the interest of the company and as long as the par value of the shares to be issued plus any share premium agreed is equal to the fair value of the Company’s shares based on a report to be drawn up at the Board’s request, by an independent auditor other than the Company’s auditor, which is appointed for this purpose by the Spanish Mercantile Register on any occasion in which the power to exclude preferential subscription rights is exercised.
109CONSOLIDATED FINANCIAL STATEMENTS

ConsolidatedFinancial Statements
Additionally, the Company’s Board of Directors is authorised to request the listing or delisting of any shares issued, in Spanish or foreign organised secondary markets.
Also, at its meeting held on 25 May 2009 and in accordance with applicable legislation, the Shareholder´s Meeting resolved to delegate to the Board of Directors the power to issue fi xed income securities, either simple and exchangeable or convertible, and warrants on the Company’s newly issued shares or shares in circulation, under the following terms: Securities may be issued on one or more occasions within fi ve years following the resolution date. The total amount of the issue or issues of securities, plus the total number of shares listed by the Company, plus the total number of shares listed by the Company and outstanding at the issue date may not exceed a maximum limit of eighty per cent of the equity of ACS Actividades de Construcción y Servicios, SA. according to the latest approved statement of fi nancial position.
The shares of ACS, Actividades de Construcción y Servicios, S.A. are listed on the Madrid, Barcelona, Bilbao and Valencia Stock Exchanges and traded through the Spanish computerised trading system.
In addition to Parent, the companies included in the scope of consolidation whose shares are listed on securities markets are Hochtief A.G. on the Frankfurt Stock Exchange (Germany), Dragados y Construcciones Argentina, S.A.I.C.I. on the Buenos Aires Stock Exchange (Argentina),Leighton Holdings Ltd., Macmahon Holdings Limited, Sedgman Limited on the Australia Stock Exchange and Pol-Aqua on the Warsaw Stock Exchange (Poland).
At 31 December 2011, the shareholders with an ownership interest of over 10% in the share capital of the Parent were Corporación Financiera Alba, S.A. with an ownership interest of 18.305%, Corporación Financiera Alcor, S.A. with an ownership interest of 12.625% and Inversiones Vesán, S.A. with an ownership interest of 12.521%.
15.02. Share premium
The share premium at 31 December 2011 and 2010 amounted to EUR 897,294 thousand. There have been no changes in the share premium account in the past two years.
The Consolidated Spanish Limited Liability Companies Law expressly permits the use of the share premium account balance to increase capital and does not establish any specifi c restrictions as to its use.
15.03. Retained earnings and other returns
The detail of this heading at 31 December 2011 and 2010 is as follows:
110 ANNUAL REPORT 2011 OF ACS GROUP ECONOMIC AND FINANCIAL REPORT
Thousands of eurosBalance at 31/12/2011 Balance at 31/12/2010
Reserves of the Parent 1,815,975 1,364,904
Reserves at consolidated companies 2,893,582 2,753,815
Total 4,709,557 4,118,719

15.03.01. Reserves of the Parent
This heading includes the reserves set up by the Group’s Parent, mainly in relation to retained earnings, and if applicable, in compliance with the various applicable legal provisions.
The detail of this heading at 31 December 2011 and 2010 is as follows:
Legal reserve
Under the Consolidated Spanish Limited Liability Companies Law, 10% of net profi t for each year must be transferred to the legal reserve until the balance of this reserve reaches at least 20% of the share capital.
The legal reserve can be used to increase capital provided that the remaining reserve balance does not fall below 10% of the increased share capital amount. Otherwise, until the legal reserve exceeds 20% of share capital, it can only be used to offset losses, provided that suffi cient other reserves are not available for this purpose.
The legal reserve recognised by the Group’s Parent, which amounts to EUR 35,287 thousand, has reached the stipulated level at 31 December 2011 and 2010.
Voluntary reserves
These are reserves, the use of which is not limited or restricted, freely set up by means of the allocation of the Parent’s profi ts, after the payment of dividends and the required appropriations to the legal or other restricted reserves in accordance with current legislation.
Pursuant to the Consolidated Limited Liability Companies Law, the distribution of profi t is prohibited unless the amount of the unrestricted legal reserves is at least equal to the amount of research and development expenses included under assets in the statement of fi nancial position. In this case the reserves allocated to meet this requirement are considered to be restricted reserves.
Thousands of euros Balance at 31/12/2011 Balance at 31/12/2010
Legal reserve 35,287 35,287
Voluntary reserves 1,024,546 961,200
Reserve for redenomination of share capital in euros 162 162
Goodwill reserve 123,623 82,416
Other retained earnings 632,357 285,839
Total 1,815,975 1,364,904
111CONSOLIDATED FINANCIAL STATEMENTS
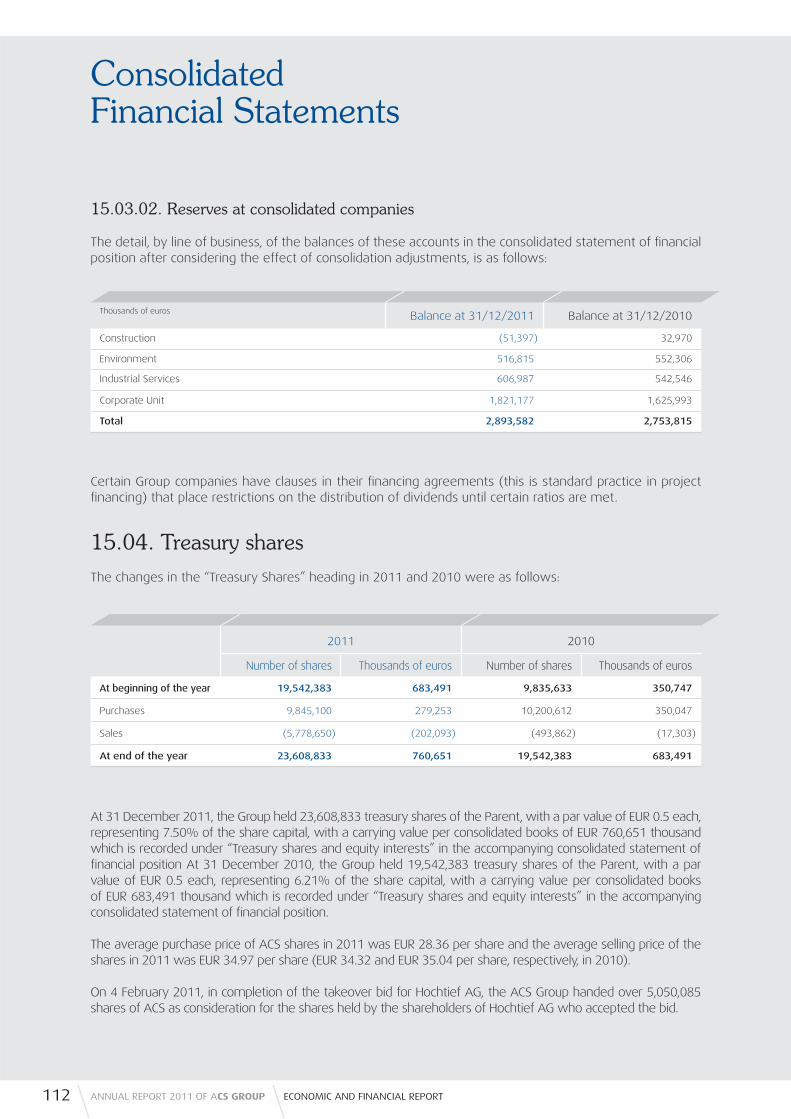
ConsolidatedFinancial Statements
15.03.02. Reserves at consolidated companies
The detail, by line of business, of the balances of these accounts in the consolidated statement of fi nancial position after considering the effect of consolidation adjustments, is as follows:
Certain Group companies have clauses in their fi nancing agreements (this is standard practice in project fi nancing) that place restrictions on the distribution of dividends until certain ratios are met.
15.04. Treasury shares
The changes in the “Treasury Shares” heading in 2011 and 2010 were as follows:
At 31 December 2011, the Group held 23,608,833 treasury shares of the Parent, with a par value of EUR 0.5 each, representing 7.50% of the share capital, with a carrying value per consolidated books of EUR 760,651 thousand which is recorded under “Treasury shares and equity interests” in the accompanying consolidated statement of fi nancial position At 31 December 2010, the Group held 19,542,383 treasury shares of the Parent, with a par value of EUR 0.5 each, representing 6.21% of the share capital, with a carrying value per consolidated books of EUR 683,491 thousand which is recorded under “Treasury shares and equity interests” in the accompanying consolidated statement of fi nancial position.
The average purchase price of ACS shares in 2011 was EUR 28.36 per share and the average selling price of the shares in 2011 was EUR 34.97 per share (EUR 34.32 and EUR 35.04 per share, respectively, in 2010).
On 4 February 2011, in completion of the takeover bid for Hochtief AG, the ACS Group handed over 5,050,085 shares of ACS as consideration for the shares held by the shareholders of Hochtief AG who accepted the bid.
112 ANNUAL REPORT 2011 OF ACS GROUP ECONOMIC AND FINANCIAL REPORT
Thousands of euros Balance at 31/12/2011 Balance at 31/12/2010
Construction (51,397) 32,970
Environment 516,815 552,306
Industrial Services 606,987 542,546
Corporate Unit 1,821,177 1,625,993
Total 2,893,582 2,753,815
2011 2010
Number of shares Thousands of euros Number of shares Thousands of euros
At beginning of the year 19,542,383 683,491 9,835,633 350,747
Purchases 9,845,100 279,253 10,200,612 350,047
Sales (5,778,650) (202,093) (493,862) (17,303)
At end of the year 23,608,833 760,651 19,542,383 683,491
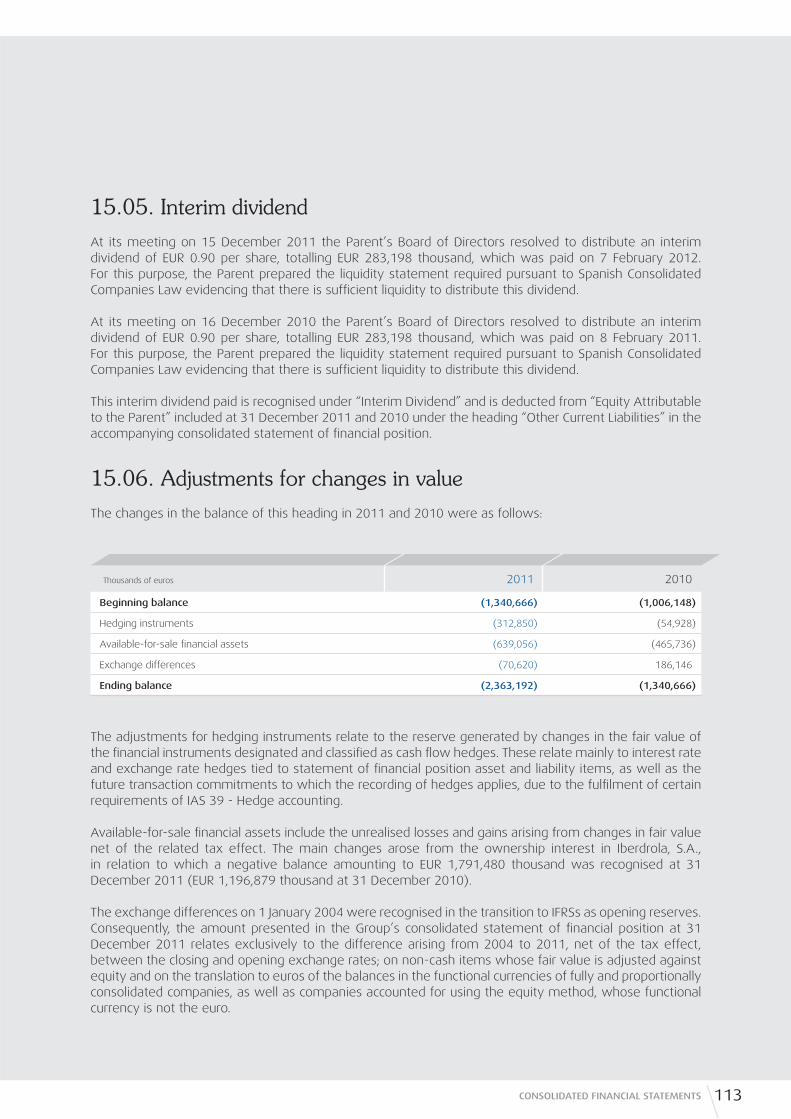
15.05. Interim dividend
At its meeting on 15 December 2011 the Parent’s Board of Directors resolved to distribute an interim dividend of EUR 0.90 per share, totalling EUR 283,198 thousand, which was paid on 7 February 2012. For this purpose, the Parent prepared the liquidity statement required pursuant to Spanish Consolidated Companies Law evidencing that there is suffi cient liquidity to distribute this dividend.
At its meeting on 16 December 2010 the Parent’s Board of Directors resolved to distribute an interim dividend of EUR 0.90 per share, totalling EUR 283,198 thousand, which was paid on 8 February 2011. For this purpose, the Parent prepared the liquidity statement required pursuant to Spanish Consolidated Companies Law evidencing that there is suffi cient liquidity to distribute this dividend.
This interim dividend paid is recognised under “Interim Dividend” and is deducted from “Equity Attributable to the Parent” included at 31 December 2011 and 2010 under the heading “Other Current Liabilities” in the accompanying consolidated statement of fi nancial position.
15.06. Adjustments for changes in value
The changes in the balance of this heading in 2011 and 2010 were as follows:
The adjustments for hedging instruments relate to the reserve generated by changes in the fair value of the fi nancial instruments designated and classifi ed as cash fl ow hedges. These relate mainly to interest rate and exchange rate hedges tied to statement of fi nancial position asset and liability items, as well as the future transaction commitments to which the recording of hedges applies, due to the fulfi lment of certain requirements of IAS 39 - Hedge accounting.
Available-for-sale fi nancial assets include the unrealised losses and gains arising from changes in fair value net of the related tax effect. The main changes arose from the ownership interest in Iberdrola, S.A., in relation to which a negative balance amounting to EUR 1,791,480 thousand was recognised at 31 December 2011 (EUR 1,196,879 thousand at 31 December 2010).
The exchange differences on 1 January 2004 were recognised in the transition to IFRSs as opening reserves. Consequently, the amount presented in the Group’s consolidated statement of fi nancial position at 31 December 2011 relates exclusively to the difference arising from 2004 to 2011, net of the tax effect, between the closing and opening exchange rates; on non-cash items whose fair value is adjusted against equity and on the translation to euros of the balances in the functional currencies of fully and proportionally consolidated companies, as well as companies accounted for using the equity method, whose functional currency is not the euro.
113CONSOLIDATED FINANCIAL STATEMENTS
Thousands of euros 2011 2010
Beginning balance (1,340,666) (1,006,148)
Hedging instruments (312,850) (54,928)
Available-for-sale fi nancial assets (639,056) (465,736)
Exchange differences (70,620) 186,146
Ending balance (2,363,192) (1,340,666)

ConsolidatedFinancial Statements
Following are the main exchange differences by currency:
15.07. Non-controlling interests
The detail, by line of business, of the balance of “Non-Controlling Interests” in the consolidated statement of fi nancial position at 31 December 2011 and 2010 is presented below:
The signifi cant increase in the balance of non-controlling interests is due to the full consolidation of Hochtief beginning on 1 June 2011, and includes both the holdings of the minority shareholders of Hochtief as well as its non-controlling interests included in the balance sheet of the German company, which mainly relate to the minority shareholders of Leighton Holdings.
This heading in the accompanying consolidated statement of fi nancial position refl ects the proportional share of the equity of the companies in which the Group’s minority shareholders have an interest. The changes in 2011, by item, were as follows:
114 ANNUAL REPORT 2011 OF ACS GROUP ECONOMIC AND FINANCIAL REPORT
Thousands of euros Balance at 31/12/2011 Balance at 31/12/2010
Australian dollar 174,553 197
Brazilian real 84,476 129,444
Mexican peso (16,679) 353
Argentine peso (14,945) (16,524)
US dollar 13,351 13,858
Venezuelan bolivar (9,996) (11,106)
Polish zloty (9,307) 7,244
Other currencies (1,051) 4,185
Exchange differences of companies accounted for using the equity method (96,113) 67,258
124,289 194,909
Thousands of euros
Balance at 31/12/2011 Balance at 31/12/2010
Line of Business
Non-controlling
interests
Profi t attributed to
non-controlling interests
Profi t from discontinued
operations
Non-controlling
interests
Profi t attributed to
non-controlling interests
Profi t from discontinued
operations
Construction 2,609,544 104,160 - 51,894 2,060 -
Industrial Services 70,005 37,769 - 108,452 35,434 -
Environment 46,202 4,599 (97) 61,173 4,309 517
Total 2,725,751 146,528 (97) 221,519 41,803 517

The changes in 2010, by item, were as follows:
The detail of this balance at 31 December 2011, by business segment, is as follows:
The detail of this balance at 31 December 2010, by business segment, was as follows:
Thousands of euros
Balance at 31 December 2010 263.839
Profi t for the year from continuing operations 146,528
Loss for the year from discontinued operations (97)
Dividends received (55,437)
Change in scope of consolidation 2,473,013
Changes in share capital and other 32,302
Adjustments for changes in value 12,034
Balance at 31 December 2011 2,872,182
Thousands of euros
Balance at 31 December 2009 288,279
Profi t for the year from continuing operations 41,803
Profi t for the year from discontinued operations 517
Dividends received (15,374)
Change in scope of consolidation (38,585)
Changes in share capital and other (17,355)
Adjustments for changes in value 4,554
Balance at 31 December 2010 263,839
Thousands of euros
Line of BusinessShare
Capital ReservesProfi t for the
year
Profi t from discontinued
operations Total
Construction 1,424,848 1,184,696 104,160 - 2,713,704
Industrial Services 43,298 26,707 37,769 - 107,774
Environment 21,504 24,698 4,599 (97) 50,704
Total 1,489,650 1,236,101 146,528 (97) 2,872,182
Thousands of euros
Line of BusinessShare
Capital ReservesProfi t for the
year
Profi t from discontinued
operations Total
Construction 34,235 17,659 2,060 - 53,954
Industrial Services 95,699 12,753 35,434 - 143,886
Environment 22,328 38,845 4,309 517 65,999
Total 152,262 69,257 41,803 517 263,839
115CONSOLIDATED FINANCIAL STATEMENTS

ConsolidatedFinancial Statements
At 31 December 2011, the shareholders with an ownership interest equal to or exceeding 10% of the share capital of the Group’s main subsidiaries were as follows:
Additionally, according to the available information, at 31 December 2011, the sole minority shareholder of Hochtief, A.G. with an ownership percentage greater than or equal to 10% is Qatar Holding Luxembourg (10%), there being no minority shareholder in the case of Leighton Holdings, Ltd.
( * ) There is a purchase commitment of 20% for which the related liability was recognised.
116 ANNUAL REPORT 2011 OF ACS GROUP ECONOMIC AND FINANCIAL REPORT
Group Percentage of ownership Shareholder
Construction
John P. Picone, Inc. ( * ) 20.00% John P. Picone
Besalco Dragados S.A. 50.00% Besalco, S.A.
Autovía de La Mancha S.A. Conces. JCC Cast-La Mancha 25.00% CYOP, S.A.
Concesionaria Santiago Brión, S.A. 30.00% Francisco Gómez y CIA, S.L. (15%)
Extraco Construcciones e Proyectos, S.A. (15%)
Intercambiador de Transportes de Príncipe Pío, S.A. 30.00% Empresa de Blas y Compañía, S.L.
Autovía del Pirineo, S.A. 28.00% Construcciones Mariezcurrena, S.L. (20%)
Sociedad Concesionaria Ruta del Canal, S.A. 20.00% Claro, Vicuña, Valenzuela, S.A.
Industrial Services
Beni Saf Water Company Spa. 49.00% Algerian Energy Company -SPA
Emurtel, S.A. 49.90% Ginés Heredia (20%)
José María Rodríguez (29.9%)
Procme, S.A. 25.46% José Reis Costa
Iberoamericana de Hidrocarburos S.A. de C.V. 40.50% Monclova Pirineos Gas, S.A. de C.V.
Serpista, S.A. 49.00% Temg Mantenimiento, S.A. (10%)
Iberia, S.A. (39%)
Triana do Brasil Projetos e Serviços, Ltda. 50.00% CTEEP Compañía de Transmisión Eléctrica Paulista
Sistemas Sec, S.A. 49.00% Compañía Amerinana de Multiservicios Limitada
Environment
Centro de Transferencias, S.A. 30.00% Emgrisa
Residuos Sólidos Urbanos de Jaén, S.A. 40.00% Diputación Provincial de Jaén
Tirmadrid, S.A. 33.64% Enel Unión Fenosa Renovables, S.A. (18.64%)
Enel Green Power España, S.L. (15%)
Urbana de Servicios Ambientales, S.L. 30.00% Construcciones Sánchez Domínguez (20%)
Ecoparc de Barcelona, S.A. 33.60% Comsa Medio Ambiente S.L.(28.30%)
Residuos Industriales de Zaragoza, S.A. 36,30% Marcor Ebro, S.A.
Jingtang International Container Terminal Co. Ltd. 45.72% Tangshan Port Industrial Group Co., Ltd.
Vertederos de Residuos, S.A. 16.03% Fomento de Construcciones y Contratas, S.A.
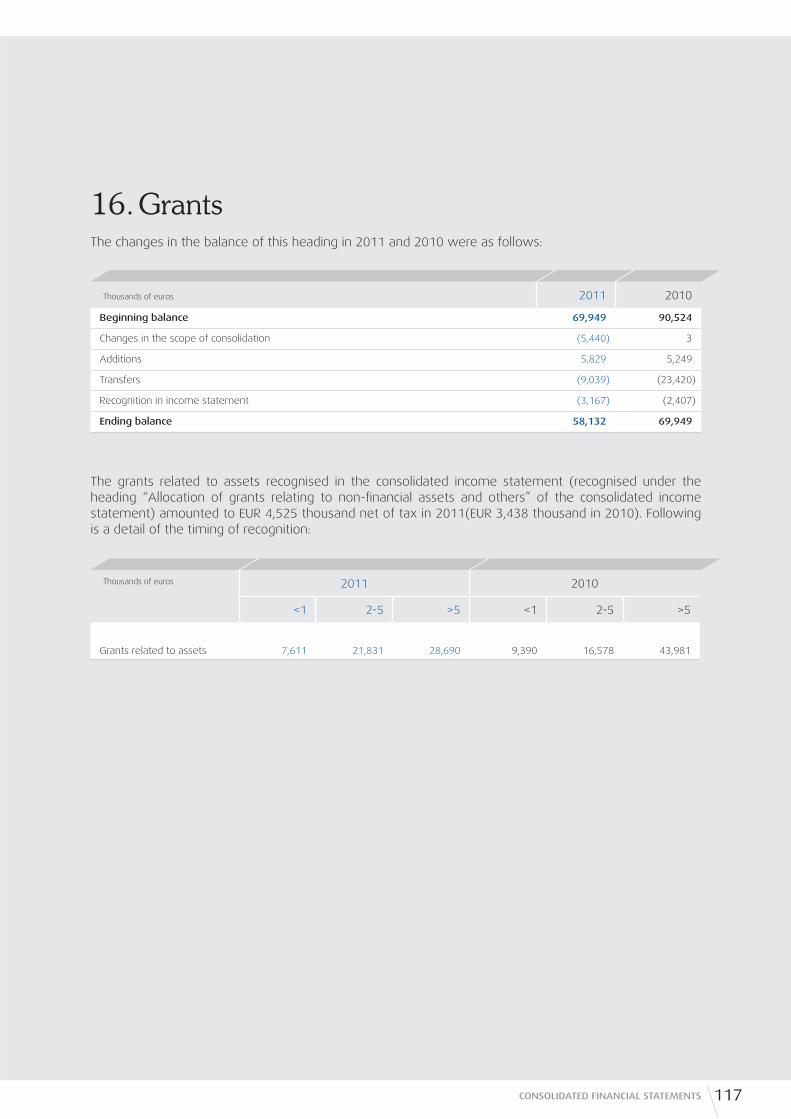
16. GrantsThe changes in the balance of this heading in 2011 and 2010 were as follows:
The grants related to assets recognised in the consolidated income statement (recognised under the heading “Allocation of grants relating to non-fi nancial assets and others” of the consolidated income statement) amounted to EUR 4,525 thousand net of tax in 2011(EUR 3,438 thousand in 2010). Following is a detail of the timing of recognition:
117CONSOLIDATED FINANCIAL STATEMENTS
Thousands of euros 2011 2010
Beginning balance 69,949 90,524
Changes in the scope of consolidation (5,440) 3
Additions 5,829 5,249
Transfers (9,039) (23,420)
Recognition in income statement (3,167) (2,407)
Ending balance 58,132 69,949
Thousands of euros 2011 2010
<1 2-5 >5 <1 2-5 >5
Grants related to assets 7,611 21,831 28,690 9,390 16,578 43,981
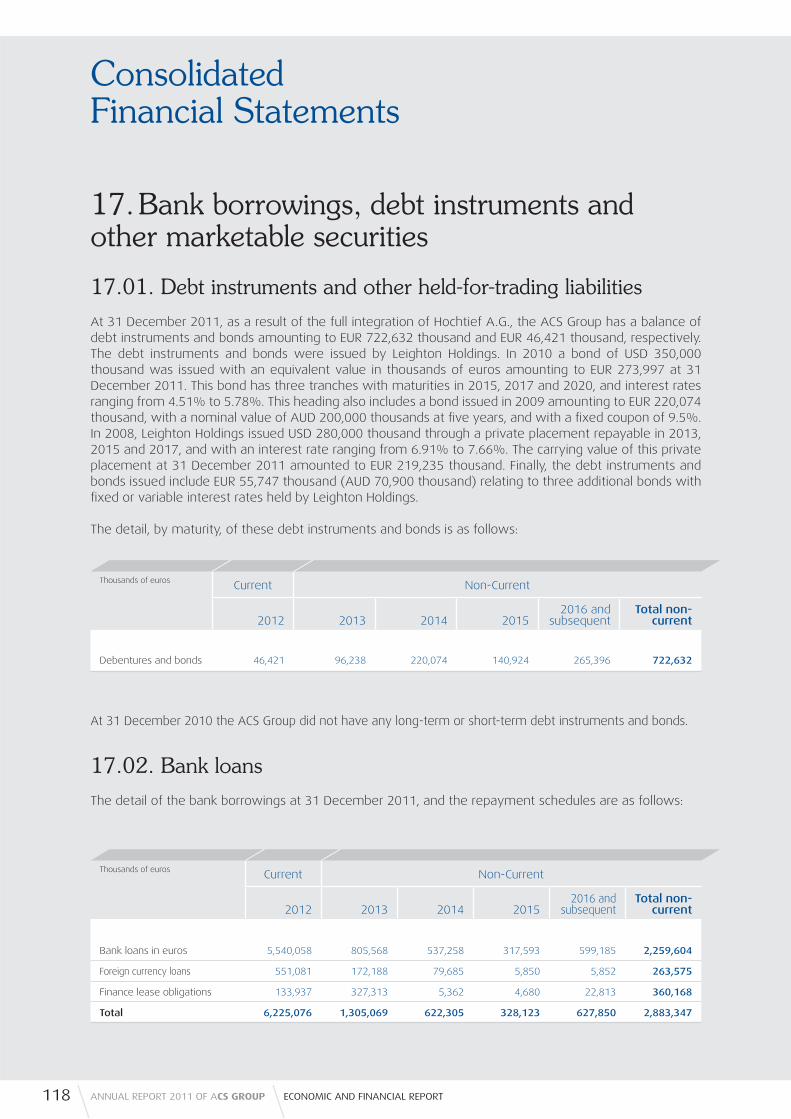
ConsolidatedFinancial Statements
17. Bank borrowings, debt instruments and other marketable securities
17.01. Debt instruments and other held-for-trading liabilities
At 31 December 2011, as a result of the full integration of Hochtief A.G., the ACS Group has a balance of debt instruments and bonds amounting to EUR 722,632 thousand and EUR 46,421 thousand, respectively. The debt instruments and bonds were issued by Leighton Holdings. In 2010 a bond of USD 350,000 thousand was issued with an equivalent value in thousands of euros amounting to EUR 273,997 at 31 December 2011. This bond has three tranches with maturities in 2015, 2017 and 2020, and interest rates ranging from 4.51% to 5.78%. This heading also includes a bond issued in 2009 amounting to EUR 220,074 thousand, with a nominal value of AUD 200,000 thousands at fi ve years, and with a fi xed coupon of 9.5%. In 2008, Leighton Holdings issued USD 280,000 thousand through a private placement repayable in 2013, 2015 and 2017, and with an interest rate ranging from 6.91% to 7.66%. The carrying value of this private placement at 31 December 2011 amounted to EUR 219,235 thousand. Finally, the debt instruments and bonds issued include EUR 55,747 thousand (AUD 70,900 thousand) relating to three additional bonds with fi xed or variable interest rates held by Leighton Holdings.
The detail, by maturity, of these debt instruments and bonds is as follows:
At 31 December 2010 the ACS Group did not have any long-term or short-term debt instruments and bonds.
17.02. Bank loans
The detail of the bank borrowings at 31 December 2011, and the repayment schedules are as follows:
118 ANNUAL REPORT 2011 OF ACS GROUP ECONOMIC AND FINANCIAL REPORT
Thousands of euros Current Non-Current
2012 2013 2014 20152016 and
subsequentTotal non-
current
Debentures and bonds 46,421 96,238 220,074 140,924 265,396 722,632
Thousands of euros Current Non-Current
2012 2013 2014 20152016 and
subsequentTotal non-
current
Bank loans in euros 5,540,058 805,568 537,258 317,593 599,185 2,259,604
Foreign currency loans 551,081 172,188 79,685 5,850 5,852 263,575
Finance lease obligations 133,937 327,313 5,362 4,680 22,813 360,168
Total 6,225,076 1,305,069 622,305 328,123 627,850 2,883,347
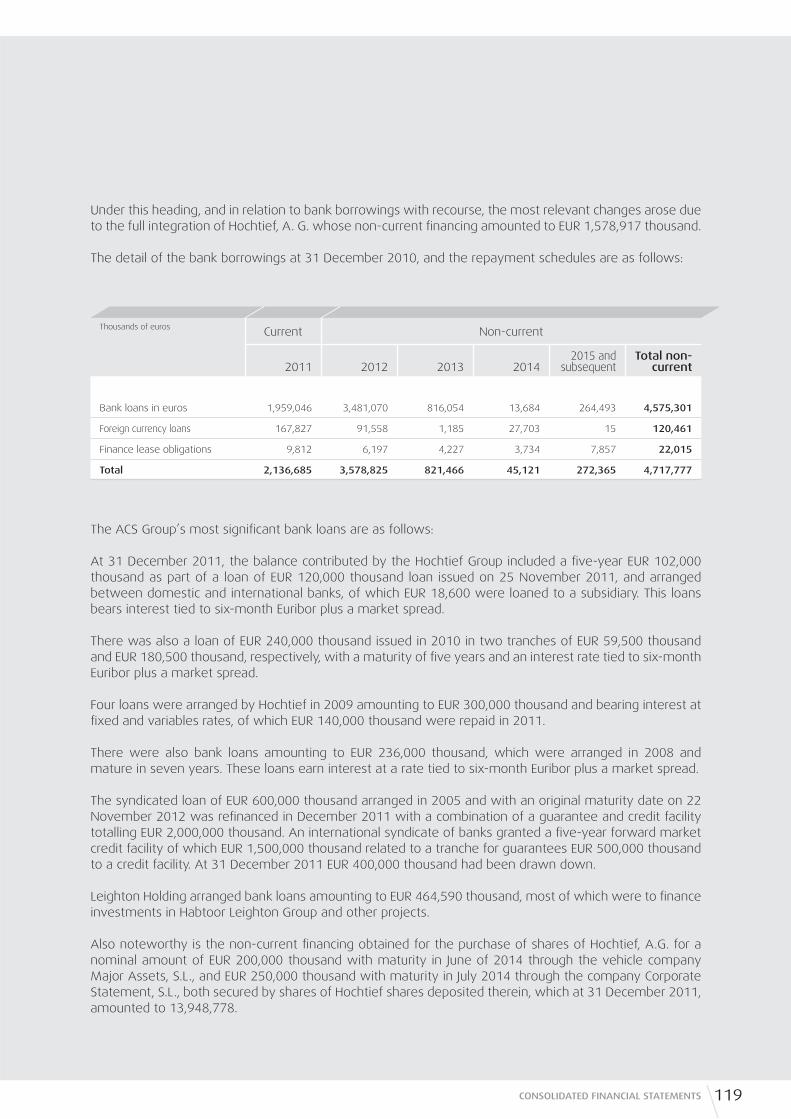
Under this heading, and in relation to bank borrowings with recourse, the most relevant changes arose due to the full integration of Hochtief, A. G. whose non-current fi nancing amounted to EUR 1,578,917 thousand.
The detail of the bank borrowings at 31 December 2010, and the repayment schedules are as follows:
The ACS Group’s most signifi cant bank loans are as follows:
At 31 December 2011, the balance contributed by the Hochtief Group included a fi ve-year EUR 102,000 thousand as part of a loan of EUR 120,000 thousand loan issued on 25 November 2011, and arranged between domestic and international banks, of which EUR 18,600 were loaned to a subsidiary. This loans bears interest tied to six-month Euribor plus a market spread.
There was also a loan of EUR 240,000 thousand issued in 2010 in two tranches of EUR 59,500 thousand and EUR 180,500 thousand, respectively, with a maturity of fi ve years and an interest rate tied to six-month Euribor plus a market spread.
Four loans were arranged by Hochtief in 2009 amounting to EUR 300,000 thousand and bearing interest at fi xed and variables rates, of which EUR 140,000 thousand were repaid in 2011.
There were also bank loans amounting to EUR 236,000 thousand, which were arranged in 2008 and mature in seven years. These loans earn interest at a rate tied to six-month Euribor plus a market spread.
The syndicated loan of EUR 600,000 thousand arranged in 2005 and with an original maturity date on 22 November 2012 was refi nanced in December 2011 with a combination of a guarantee and credit facility totalling EUR 2,000,000 thousand. An international syndicate of banks granted a fi ve-year forward market credit facility of which EUR 1,500,000 thousand related to a tranche for guarantees EUR 500,000 thousand to a credit facility. At 31 December 2011 EUR 400,000 thousand had been drawn down.
Leighton Holding arranged bank loans amounting to EUR 464,590 thousand, most of which were to fi nance investments in Habtoor Leighton Group and other projects.
Also noteworthy is the non-current fi nancing obtained for the purchase of shares of Hochtief, A.G. for a nominal amount of EUR 200,000 thousand with maturity in June of 2014 through the vehicle company Major Assets, S.L., and EUR 250,000 thousand with maturity in July 2014 through the company Corporate Statement, S.L., both secured by shares of Hochtief shares deposited therein, which at 31 December 2011, amounted to 13,948,778.
119CONSOLIDATED FINANCIAL STATEMENTS
Thousands of euros Current Non-current
2011 2012 2013 20142015 and
subsequentTotal non-
current
Bank loans in euros 1,959,046 3,481,070 816,054 13,684 264,493 4,575,301
Foreign currency loans 167,827 91,558 1,185 27,703 15 120,461
Finance lease obligations 9,812 6,197 4,227 3,734 7,857 22,015
Total 2,136,685 3,578,825 821,466 45,121 272,365 4,717,777

ConsolidatedFinancial Statements
Additionally, in relation to the purchases of shares of Iberdrola, S.A. in 2010, ACS, Actividades de Construcción y Servicios, S.A. obtained fi nancing that fi nally matures on 27 June 2012 with a balance of EUR 628,117 thousand at 31 December 2010. This fi nancing amount was reduced to EUR 205,684 thousand at 31 December 2011 and was reclassifi ed to short-term. At the same time as this fi nancing, a prepaid forward share contract was signed which can only be repaid in cash, in relation to which the ACS Group is able to make advance payments or repay in full at any time.
On 9 February 2012 ACS Actividades de Construcción y Servicios, S. A. entered into a contract with a syndicate of banks, composed of 32 Spanish and foreign entities, for the refi nancing of the syndicated loan which now matures in July 2015. The amount contracted amounted to EUR 1,377 million, which could be increased until May 2012, to EUR 1,650 million. This contract was already adhered to by four banks for EUR 1,411 million at the date of the presentation of these consolidated fi nancial statements. This refi nancing ensures the liquidity of the ACS Group’s operations. At 31 December 2011, this loan amounting to EUR 1,589,911 thousand was recognised under the heading “Current Liabilities” in the accompanying statement of fi nancial position.
At 31 December 2011 the balance of current loans included the syndicate loan of Urbaser, S.A. amounting to EUR 750,000 thousand, which matures in May 2012 and is in the process of being renewed at the date of the preparation of these fi nancial statements. Various interest rate swaps were arranged to fully hedge this loan, which matures in May 2012, at the same time as the notional amount.
The ACS Group held mortgage loans for an amount of EUR 57,877 thousand at 31 December 2011 (EUR 57,580 thousand at 31 December 2010).
At 31 December 2011 the Group companies had been granted credit facilities with limits of 6,886,169 thousand (EUR 3,636,110 thousand in 2010), of which the amount of EUR 2,633,253 thousand (EUR 1,528,887 thousand at 31 December 2010) were undrawn. These credit facilities suffi ciently cover all the Group’s needs in relation to its short-term commitments.
At 31 December 2011, the current and non-current bank borrowings in foreign currency amounted to EUR 814,656 thousand (EUR 288,288 thousand in 2010), of which EUR 464,590 thousand were in Australian dollars, EUR 222,676 thousand in US dollars (EUR 120,867 thousand in 2010), EUR 28,608 thousand in Canadian dollars (EUR 27,703 thousand in 2010), EUR 28,544 thousand in Moroccan dirham (EUR 23,255 thousand in 2010), EUR 28,462 thousand in Chilean pesos (EUR 42,626 thousand in 2010), EUR 15,120 thousand in Chinese yuan, EUR 9,602 thousand in Polish zloty EUR 8,120 thousand in 2010), EUR 4,194 thousand in Argentine pesos (EUR 8,017 thousand in 2010) and EUR 3,122 thousand in Brazilian reals (EUR 47,744 thousand in 2010).
Foreign currency loans and credits are recognised at their equivalent euro value at each year-end, calculated at the exchange rates prevailing at 31 December.
In 2011 the Group’s euro loans and credits bore average annual interest of 3.30% (2.92% in 2010). Foreign currency loans and credits bore average annual interest of 3.94% (3.51% in 2010).
In accordance with its risk management policy and in order to reduce liquidity risk, the ACS Group attempts to achieve a reasonable balance between non-current fi nancing for the Group’s strategic investments (above all, limited recourse fi nancing as described in Note 18) and current fi nancing for the management of working capital.
120 ANNUAL REPORT 2011 OF ACS GROUP ECONOMIC AND FINANCIAL REPORT
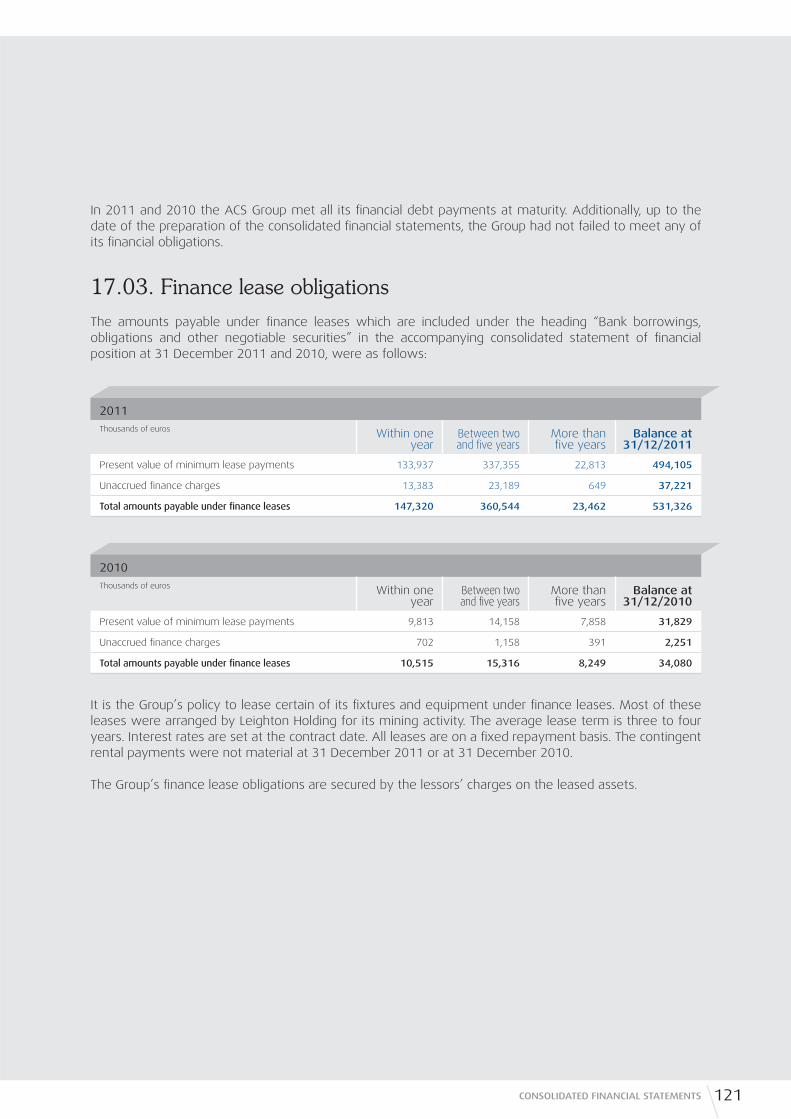
In 2011 and 2010 the ACS Group met all its fi nancial debt payments at maturity. Additionally, up to the date of the preparation of the consolidated fi nancial statements, the Group had not failed to meet any of its fi nancial obligations.
17.03. Finance lease obligations
The amounts payable under fi nance leases which are included under the heading “Bank borrowings, obligations and other negotiable securities” in the accompanying consolidated statement of fi nancial position at 31 December 2011 and 2010, were as follows:
It is the Group’s policy to lease certain of its fi xtures and equipment under fi nance leases. Most of these leases were arranged by Leighton Holding for its mining activity. The average lease term is three to four years. Interest rates are set at the contract date. All leases are on a fi xed repayment basis. The contingent rental payments were not material at 31 December 2011 or at 31 December 2010.
The Group’s fi nance lease obligations are secured by the lessors’ charges on the leased assets.
2011
Thousands of euros Within one year
Between two and fi ve years
More than fi ve years
Balance at 31/12/2011
Present value of minimum lease payments 133,937 337,355 22,813 494,105
Unaccrued fi nance charges 13,383 23,189 649 37,221
Total amounts payable under fi nance leases 147,320 360,544 23,462 531,326
2010
Thousands of euros Within one year
Between two and fi ve years
More than fi ve years
Balance at 31/12/2010
Present value of minimum lease payments 9,813 14,158 7,858 31,829
Unaccrued fi nance charges 702 1,158 391 2,251
Total amounts payable under fi nance leases 10,515 15,316 8,249 34,080
121CONSOLIDATED FINANCIAL STATEMENTS
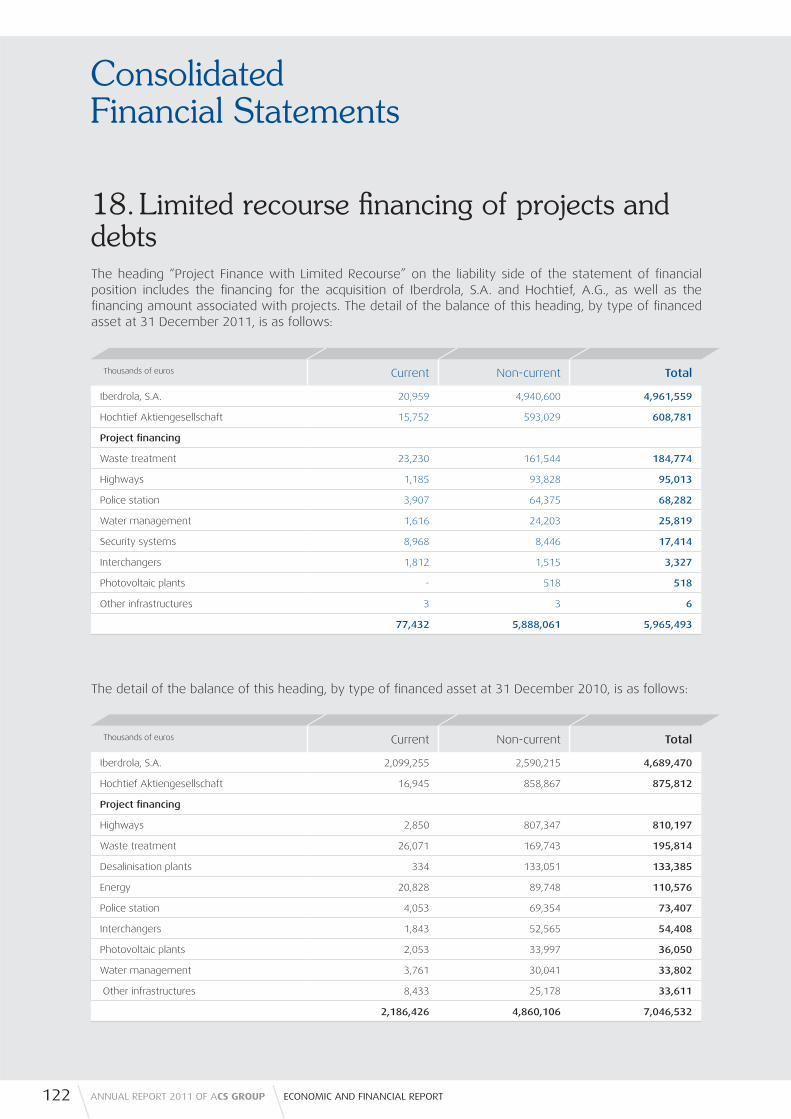
ConsolidatedFinancial Statements
18. Limited recourse fi nancing of projects and debtsThe heading “Project Finance with Limited Recourse” on the liability side of the statement of fi nancial position includes the fi nancing for the acquisition of Iberdrola, S.A. and Hochtief, A.G., as well as the fi nancing amount associated with projects. The detail of the balance of this heading, by type of fi nanced asset at 31 December 2011, is as follows:
The detail of the balance of this heading, by type of fi nanced asset at 31 December 2010, is as follows:
122 ANNUAL REPORT 2011 OF ACS GROUP ECONOMIC AND FINANCIAL REPORT
Thousands of euros Current Non-current Total
Iberdrola, S.A. 20,959 4,940,600 4,961,559
Hochtief Aktiengesellschaft 15,752 593,029 608,781
Project fi nancing
Waste treatment 23,230 161,544 184,774
Highways 1,185 93,828 95,013
Police station 3,907 64,375 68,282
Water management 1,616 24,203 25,819
Security systems 8,968 8,446 17,414
Interchangers 1,812 1,515 3,327
Photovoltaic plants - 518 518
Other infrastructures 3 3 6
77,432 5,888,061 5,965,493
Thousands of euros Current Non-current Total
Iberdrola, S.A. 2,099,255 2,590,215 4,689,470
Hochtief Aktiengesellschaft 16,945 858,867 875,812
Project fi nancing
Highways 2,850 807,347 810,197
Waste treatment 26,071 169,743 195,814
Desalinisation plants 334 133,051 133,385
Energy 20,828 89,748 110,576
Police station 4,053 69,354 73,407
Interchangers 1,843 52,565 54,408
Photovoltaic plants 2,053 33,997 36,050
Water management 3,761 30,041 33,802
Other infrastructures 8,433 25,178 33,611
2,186,426 4,860,106 7,046,532

The detail, by maturity, of non-current fi nancing at 31 December 2011 and 2010 is as follows:
The most signifi cant fi nancing arrangements were as follows:
• Financing of the acquisition of Iberdrola, S.A.
The limited recourse fi nancing for the acquisition of shares of Iberdrola included the fi nancing of Residencial Monte Carmelo, S.A. (which holds 8.08% of the shares of Iberdrola) reached EUR 1,661,143 thousand which entered into force on 28 December 2011, the maturity date of the previous fi nancing, which was extended three years to 28 December 2014. This was the main reason for the year-on-year increase in non-current fi nancing. The main characteristics of the fi nancing arrangement include the maintenance of a hedging ratio over the market value of the shares of Iberdrola, S.A. If this ratio were not to be met, the pledge could be executed.
Additionally, Corporate Funding, S.L. has limited recourse fi nancing maturing in June 2014 which was increased with respect to 31 December 2010 by EUR 300,000 thousand, reaching a nominal amount of EUR 900,000 thousand, with interest tied to Euribor plus a spread and which was secured by shares amounting to EUR 283,523,297 at 31 December 2011. The main characteristics of the fi nancing arrangement include the maintenance of a hedging ratio over the market value of the shares of Iberdrola, S.A. which obligates the contribution of funds up to a limit of EUR 450,000 thousand. If this ratio were not to be met, the pledge could be executed.
On 14 June 2011, the Company extended the maturity of its “equity swap” over shares of Iberdrola, S.A. to March 2015 for an amount of EUR 2,432,272 thousand (EUR 2,430,619 thousand at 31 December 2010). This loan is secured by shares amounting to 4.73% of the ownership interest in Iberdrola, S.A. and bears interest at a rate tied to Euribor. As in the case of the other loans described above, the ACS Group is required to meet a hedging ratio on this ownership interest.
Both at 31 December 2011 and at the date of the preparation of these fi nancial statements, this hedging ratio was being met.
123CONSOLIDATED FINANCIAL STATEMENTS
Thousands of euros Maturity in
2013 2014 20152016 and
subsequent years Total
Balance at 31 December 2011 35,006 3,123,234 2,454,058 275,763 5,888,061
Thousands of euros Maturity in
2012 2013 20142015 and
subsequent years Total
Balance at 31 December 2010 3,509,221 52,995 236,177 1,061,713 4,860,106
ConsolidatedFinancial Statements
• Financing of the acquisition of Hochtief, A.G.
An ownership interest of 22.80% of Hochtief was acquired in 2007 by means of fi nancing amounting to an initial amount of EUR 948,000 thousand in which BBVA acted as the agent bank. Of this amount EUR 87,000 was repaid in advance in previous years. This fi nancing is secured by the shares acquired and has a fi nance cost tied to Euribor. Its sole and fi nal maturity date is 24 July 2012.
The main characteristics of the fi nancing arrangement include the maintenance of a hedging ratio over the market value of the shares of Hochtief, A.G. If this ratio were not to be met, the pledge could be executed. If the aforementioned hedging ratio were not to be met and the ACS Group were to decide to maintain the fi nancing, ACS, Actividades de Construcción y Servicios, S.A. would be required to provide funds up to a limit of EUR 316,000 thousand in the form of a subordinated loan.
In relation to the aforementioned loan, on 27 October 2011, Cariátide, S.A., entered into a contract with a syndicate of banks for the refi nancing of the nominal amount of EUR 602,000 thousand until 24 July 2015.
Both at 31 December 2011, and at the date of the preparation of these fi nancial statements, this hedging ratio was being met.
To cover the ratios required to be met for the fi nancing of Hochtief A.G. and Iberdrola, S.A., the Group contributed funds amounting to EUR 1,547,918 thousand at 31 December 2011 (EUR 590,904 thousand at 31 December 2010). These funds reduced the limited recourse fi nancing and the portion exceeding the credit facility amounts was recognised on the asset sided of the statement of fi nancial position under “Other Current Financial Assets” (see Note 10.05).
In 2011 and 2010 the ACS Group met all its fi nancial debt payments at maturity. Additionally, up to the date of the preparation of the consolidated fi nancial statements, the Group had not failed to meet any of its fi nancial obligations.
Project fi nancing
The most signifi cant change in this heading in the consolidated statement of fi nancial position relates to the reclassifi cation of wind powered facilities, solar thermal plants and certain highways and power transmission lines to assets held for sale (see Note 03.09).
The remainder of project fi nancing at 31 December 2011 included, inter alia, the fi nancing relating to waste treatment at the plant owned by Ecoparc de Barcelona, S.A. In this connection a loan was arranged on 30 July 2009 amounting to EUR 53,000 thousand at a fl oating interest rate tied to Euribor plus a market spread. This loan matures on 30 July 2024. The purpose of the fi nancing is to construct, administer and operate the Metropolitan Integrated Water Treatment Plant located in the Zone Franca, Barcelona.
The Group has arranged various interest rate hedges in connection with the aforementioned fi nancing (see Note 22).
The average interest rate for this type of project fi nancing amounted to an annual 4.42% in 2011 and 4.11% in 2010.
The debts relating to limited recourse fi nancing are secured by non-current assets in projects and include clauses requiring that certain ratios be complied with by the project and which were being met in all cases at 31 December 2011.
124 ANNUAL REPORT 2011 OF ACS GROUP ECONOMIC AND FINANCIAL REPORT
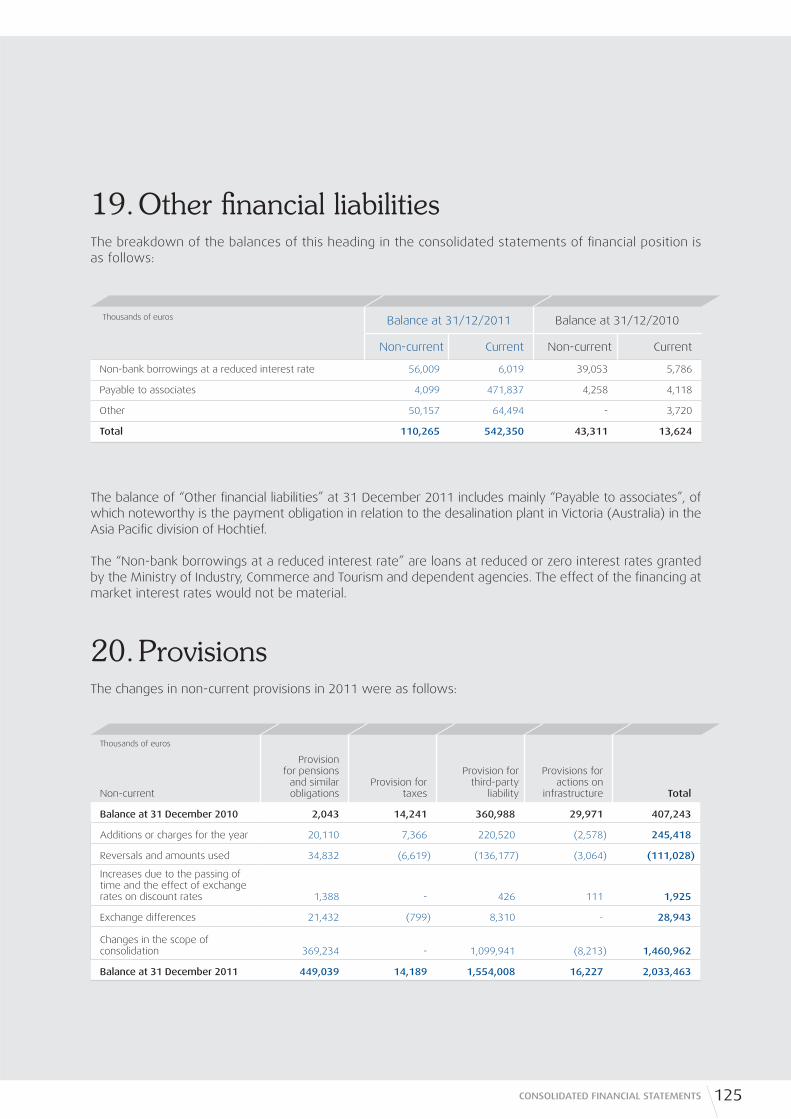
19. Other fi nancial liabilitiesThe breakdown of the balances of this heading in the consolidated statements of fi nancial position is as follows:
The balance of “Other fi nancial liabilities” at 31 December 2011 includes mainly “Payable to associates”, of which noteworthy is the payment obligation in relation to the desalination plant in Victoria (Australia) in the Asia Pacifi c division of Hochtief.
The “Non-bank borrowings at a reduced interest rate” are loans at reduced or zero interest rates granted by the Ministry of Industry, Commerce and Tourism and dependent agencies. The effect of the fi nancing at market interest rates would not be material.
20. ProvisionsThe changes in non-current provisions in 2011 were as follows:
125CONSOLIDATED FINANCIAL STATEMENTS
Thousands of euros Balance at 31/12/2011 Balance at 31/12/2010
Non-current Current Non-current Current
Non-bank borrowings at a reduced interest rate 56,009 6,019 39,053 5,786
Payable to associates 4,099 471,837 4,258 4,118
Other 50,157 64,494 - 3,720
Total 110,265 542,350 43,311 13,624
Thousands of euros
Non-current
Provision for pensions
and similar obligations
Provision for taxes
Provision for third-party
liability
Provisions for actions on
infrastructure Total
Balance at 31 December 2010 2,043 14,241 360,988 29,971 407,243
Additions or charges for the year 20,110 7,366 220,520 (2,578) 245,418
Reversals and amounts used 34,832 (6,619) (136,177) (3,064) (111,028)
Increases due to the passing of time and the effect of exchange rates on discount rates 1,388 - 426 111 1,925
Exchange differences 21,432 (799) 8,310 - 28,943
Changes in the scope of consolidation 369,234 - 1,099,941 (8,213) 1,460,962
Balance at 31 December 2011 449,039 14,189 1,554,008 16,227 2,033,463

ConsolidatedFinancial Statements
The Group companies recognised provisions on the liability side of the accompanying consolidated statement of fi nancial position, for those current obligations that have arisen due to past events. At the maturity of said obligations and in order to pay them, the companies deem it probable that an outfl ow of fi nancial resources will likely take place. A charge is made to provision at the date on which the related obligation arises, and the amount recognised is the best estimate, at the date of the accompanying fi nancial statements, of the current value of the future disbursement required to cancel the obligation, the effect on the fi nancial profi t or loss being dependent on changes in this provision in the year.
Following is detailed information on the Group’s provisions, distributed into three large groups:
Provisions for pensions and similar obligations
On the one hand, the defi ned benefi t pension commitments were entered into by companies included in the group as a result of the merger by absorption of the Dragados Group in 2003. These commitments have been externalised through collective life insurance contracts, in which investments have been allocated whose fl ows coincide in time and amounts with the time and amounts of the payment of the insured benefi ts. Based on the valuation made, the amounts required to meet the commitments to current and retired employees amounted to EUR 27,026 thousand at 31 December 2011 (EUR 36,442 thousand at 31 December 2010) and EUR 193,627 thousand at 31 December 2011 (EUR 194,728 thousand in 2010), respectively. The actuarial assumptions used in the 2011 and 2010 valuations detailed above, are as follows:
The interest rates applied beginning on the date of the externalisation of the previous commitments ranged between a maximum 5.93% and a minimum 3.02%. The interest rate applied was 4.85% in 2011 and 4.81% in 2010.
The aforementioned amounts relating to pension commitments recognised under “Staff Costs” in the consolidated income statement for 2011, gave rise to an expense of EUR 471 thousand in 2011 (EUR 146 thousand of income in 2010).
Additionally, ACS, Actividades de Construcción y Servicios, S.A. and other Group companies have alternative pension system obligations to certain members of the management team and Board of Directors of the Parent. These obligations have been formalised through several group savings insurance policies which provide benefi ts in the form of a lump sum. The contribution required in this connection amounted to EUR 4,455 thousand (2010: EUR 4,483 thousand) and was recognised under the heading “Staff costs” in the consolidated statement of fi nancial position. The portion relating to the Parent’s directors who performed executive duties in 2011 amounted to EUR 1,955 thousand (EUR 2,152 thousand in 2010) (see Note 34).
Except as indicated above, the Spanish Group companies do not generally have pension plans which are supplementary to social security benefi ts. However, in accordance with the provisions of the Spanish Consolidated Pension Plan and Fund Regulation Law, in specifi c cases where there are similar obligations,
Annual rate of increase of maximum social security pension benefi t 2.00%
Annual wage increase 2.35%
Annual CPI growth rate 2.00%
Mortality table (*) PERM/F-2000 P
126 ANNUAL REPORT 2011 OF ACS GROUP ECONOMIC AND FINANCIAL REPORT
(*) Guaranteed assumptions which will not vary.
companies may externalise these pension and similar obligations to employees. The Group has no liability in this connection. Some of the Group’s foreign companies are obligated to supplement the retirement benefi t and other similar obligations to its employees, including those from the Hochtief Group. The valuation of the accrued liabilities and, if appropriate, of assets, was carried out by expert independent actuaries, using generally accepted actuarial methods and techniques, and are included in the consolidated statement of fi nancial position, under the heading “Pensions and Similar Obligations - Non-Current Provisions” in accordance with the criteria provided by the IFRS.
The retirement benefi ts of the Hochtief Group include both defi ned contribution and defi ned benefi t plans. Under the defi ned contribution plans, certain group companies voluntarily make payments to a public or private pension fund in accordance with legal and contractual stipulations and have no obligation to make additional contributions. Under the defi ned benefi t plans, the obligation of certain Hochtief Group companies is to provide benefi ts to current and former employees. The defi ned benefi t plans can be funded externally or through pension provisions.
The defi ned benefi t plans are mostly used in Hochtief A.G., its subsidiaries in Germany and the Turner Group, as related to the services agreed upon up to 31 December 2003.
Since 1 January 2000, the pension arrangements in the Hochtief Group in Germany have consisted of a basic pension fi nanced by the company in the form of a modular defi ned contribution plan as well as a supplementary pension linked to the company’s performance. The size of the basic pension depends on the income and age of the employee (which results in an annual conversion factor) and a general pension contribution reviewed by Hochtief every three years. The size of the supplementary pension depends on profi t growth based on IFRS after taxes. A total of 20% of the basic pension can be supplemented in this way. The types of pensions in force until 31 December 1999 included groups of benefi ts based on collective agreements. These benefi ts were integrated into the new system of retirement benefi ts as a component of the initial pension. The benefi ts include a retirement pension, a disability pension and pensions for dependants.
Turner changed from defi ned benefi t to defi ned contribution plans, which have been in force subsequent to January 1 2004. Depending on the length of employment and salary level, from 3 to 6 per cent of an employee’s salary is paid in an external fund. In addition, the employees of Turner have the option to pay up to 5 per cent of their wages in an investment fund. Turner increased its deferred remuneration up to 100 per cent depending on the length of employment. Employees can benefi t from the plan after three years of service. Tax exemptions are given through payments to the fund; the employees assuming the investment risk. Similarly, Leighton and Flatiron have defi ned contribution plans and pay between 4 and 10 per cent of the employee’s salary (before deductions) to an external fund.
The fi nancing of the pensions of Hochtief A.G. was restructured through the creation of a contractual trust agreement (CTA) on 31 December 2004. This agreement was extended to all the major German companies of the Hochtief Group from 2005 to 2007. The transferred assets are managed in trust by Hochtief Pension Trust e. V. and are used solely to fi nance the pension obligations. The cash transferred is invested in the capital market in accordance with the investment principles established in the trust agreement. The defi ned benefi t plans suspended on 31 December 2003 by the Turner Group, are covered by an external fund.
127CONSOLIDATED FINANCIAL STATEMENTS
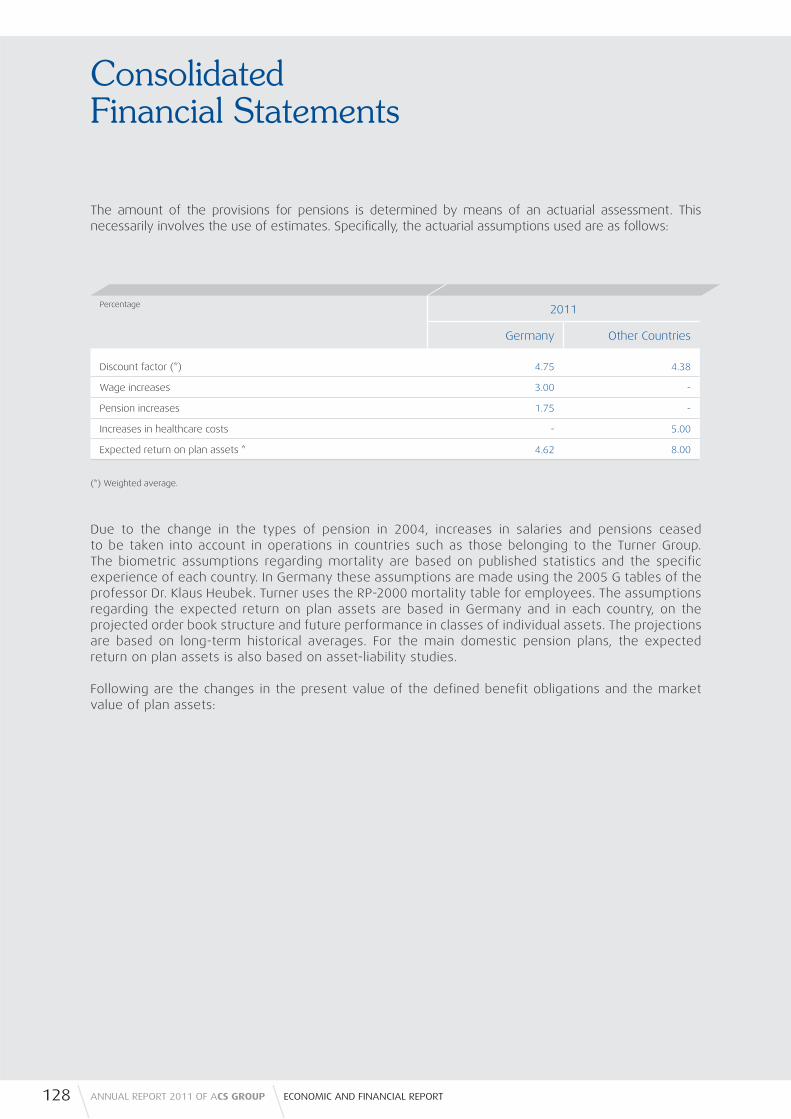
ConsolidatedFinancial Statements
The amount of the provisions for pensions is determined by means of an actuarial assessment. This necessarily involves the use of estimates. Specifi cally, the actuarial assumptions used are as follows:
Due to the change in the types of pension in 2004, increases in salaries and pensions ceased to be taken into account in operations in countries such as those belonging to the Turner Group. The biometric assumptions regarding mortality are based on published statistics and the specific experience of each country. In Germany these assumptions are made using the 2005 G tables of the professor Dr. Klaus Heubek. Turner uses the RP-2000 mortality table for employees. The assumptions regarding the expected return on plan assets are based in Germany and in each country, on the projected order book structure and future performance in classes of individual assets. The projections are based on long-term historical averages. For the main domestic pension plans, the expected return on plan assets is also based on asset-liability studies.
Following are the changes in the present value of the defined benefit obligations and the market value of plan assets:
(*) Weighted average.
128 ANNUAL REPORT 2011 OF ACS GROUP ECONOMIC AND FINANCIAL REPORT
Percentage 2011
Germany Other Countries
Discount factor (*) 4.75 4.38
Wage increases 3.00 -
Pension increases 1.75 -
Increases in healthcare costs - 5.00
Expected return on plan assets * 4.62 8.00
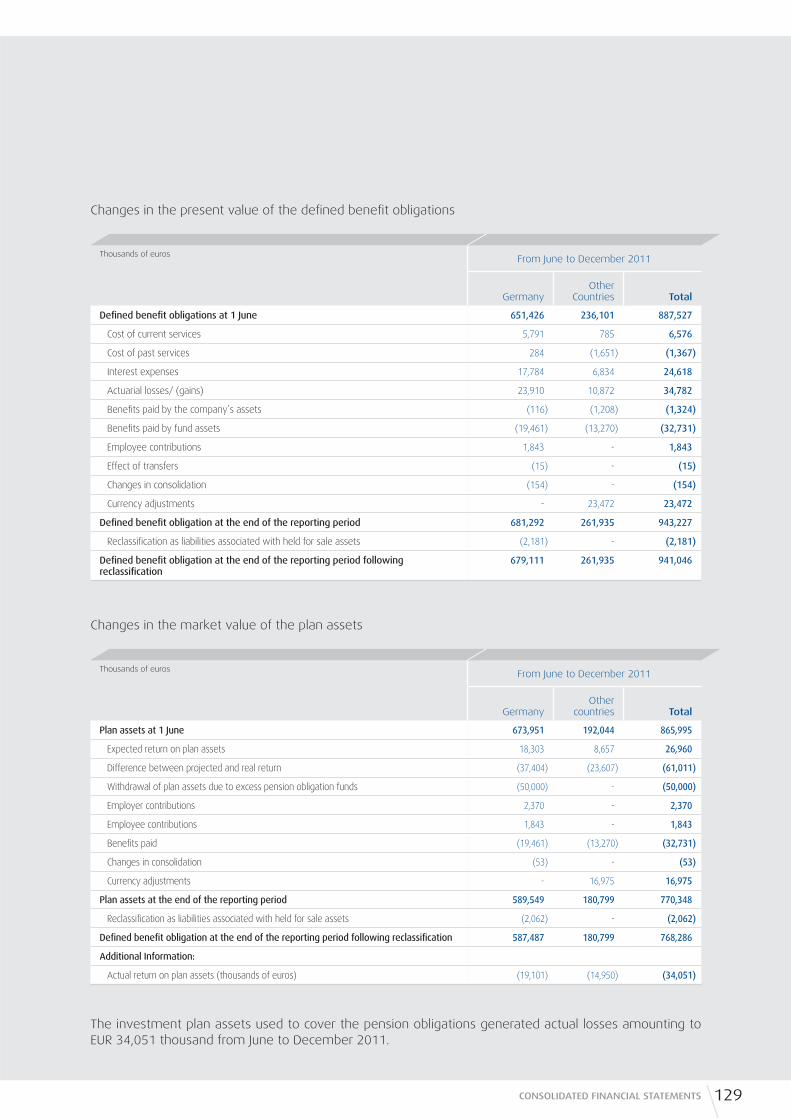
Changes in the present value of the defi ned benefi t obligations
Changes in the market value of the plan assets
The investment plan assets used to cover the pension obligations generated actual losses amounting to EUR 34,051 thousand from June to December 2011.
129CONSOLIDATED FINANCIAL STATEMENTS
Thousands of euros From June to December 2011
GermanyOther
Countries Total
Defi ned benefi t obligations at 1 June 651,426 236,101 887,527
Cost of current services 5,791 785 6,576
Cost of past services 284 (1,651) (1,367)
Interest expenses 17,784 6,834 24,618
Actuarial losses/ (gains) 23,910 10,872 34,782
Benefi ts paid by the company’s assets (116) (1,208) (1,324)
Benefi ts paid by fund assets (19,461) (13,270) (32,731)
Employee contributions 1,843 - 1,843
Effect of transfers (15) - (15)
Changes in consolidation (154) - (154)
Currency adjustments - 23,472 23,472
Defi ned benefi t obligation at the end of the reporting period 681,292 261,935 943,227
Reclassifi cation as liabilities associated with held for sale assets (2,181) - (2,181)
Defi ned benefi t obligation at the end of the reporting period following reclassifi cation
679,111 261,935 941,046
Thousands of euros From June to December 2011
GermanyOther
countries Total
Plan assets at 1 June 673,951 192,044 865,995
Expected return on plan assets 18,303 8,657 26,960
Difference between projected and real return (37,404) (23,607) (61,011)
Withdrawal of plan assets due to excess pension obligation funds (50,000) - (50,000)
Employer contributions 2,370 - 2,370
Employee contributions 1,843 - 1,843
Benefi ts paid (19,461) (13,270) (32,731)
Changes in consolidation (53) - (53)
Currency adjustments - 16,975 16,975
Plan assets at the end of the reporting period 589,549 180,799 770,348
Reclassifi cation as liabilities associated with held for sale assets (2,062) - (2,062)
Defi ned benefi t obligation at the end of the reporting period following reclassifi cation 587,487 180,799 768,286
Additional Information:
Actual return on plan assets (thousands of euros) (19,101) (14,950) (34,051)

ConsolidatedFinancial Statements
The defi ned benefi t obligations are covered by the plan assets as follows:
Pension provisions are determined as follows:
The fair values of plan assets are divided between the classes of assets as follows:
130 ANNUAL REPORT 2011 OF ACS GROUP ECONOMIC AND FINANCIAL REPORT
Thousands of euros Balance at 31 December 2011
Defi ned benefi t obligation
Plan
assets
Not covered by plan assets 53,840 -
Partially covered by plan assets 840,184 705,209
Incompletely covered by plan assets 894,024 705,209
Fully covered by plan assets 47,022 63,077
Total 941,046 768,286
Thousands of euros Balance at 31 December 2011
Defi ned benefi t obligation 941,046
(Less) plan assets (768,286)
Level of fi nancing: 172,760
Adjustments arising from the IAS limit in 19.58 -
Pension plan assets with excess funding 16,055
Provisions for pensions and similar obligations 188,815
Thousands of euros Balance at 31 December 2011
Market value %
Equity securities 166,336 21.65
Fixed-income securities 456,630 59.43
Real estate 26,777 3.49
Insurance policies 62,599 8.15
Commodities 35,858 4.67
Cash 20,086 2.61
Total 768,286 100.00
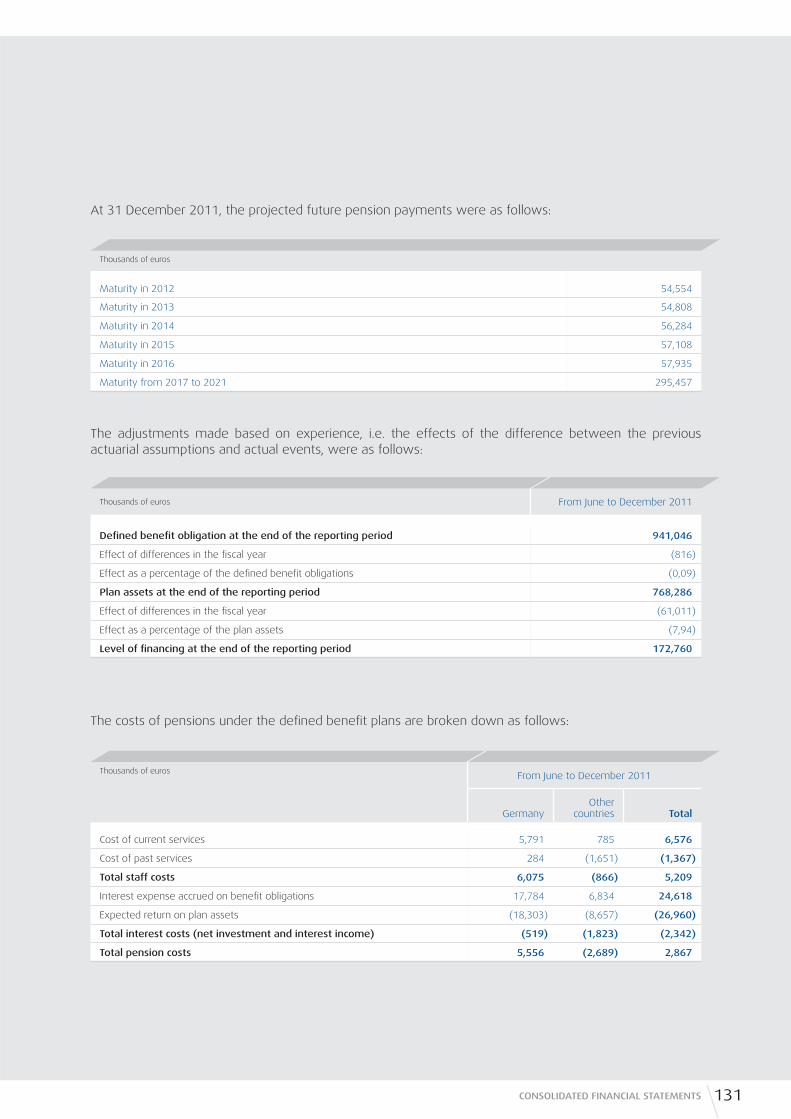
At 31 December 2011, the projected future pension payments were as follows:
The adjustments made based on experience, i.e. the effects of the difference between the previous actuarial assumptions and actual events, were as follows:
The costs of pensions under the defi ned benefi t plans are broken down as follows:
Thousands of euros
Maturity in 2012 54,554
Maturity in 2013 54,808
Maturity in 2014 56,284
Maturity in 2015 57,108
Maturity in 2016 57,935
Maturity from 2017 to 2021 295,457
Thousands of euros From June to December 2011
Defi ned benefi t obligation at the end of the reporting period 941,046
Effect of differences in the fi scal year (816)
Effect as a percentage of the defi ned benefi t obligations (0,09)
Plan assets at the end of the reporting period 768,286
Effect of differences in the fi scal year (61,011)
Effect as a percentage of the plan assets (7,94)
Level of fi nancing at the end of the reporting period 172,760
Thousands of euros From June to December 2011
GermanyOther
countries Total
Cost of current services 5,791 785 6,576
Cost of past services 284 (1,651) (1,367)
Total staff costs 6,075 (866) 5,209
Interest expense accrued on benefi t obligations 17,784 6,834 24,618
Expected return on plan assets (18,303) (8,657) (26,960)
Total interest costs (net investment and interest income) (519) (1,823) (2,342)
Total pension costs 5,556 (2,689) 2,867
131CONSOLIDATED FINANCIAL STATEMENTS
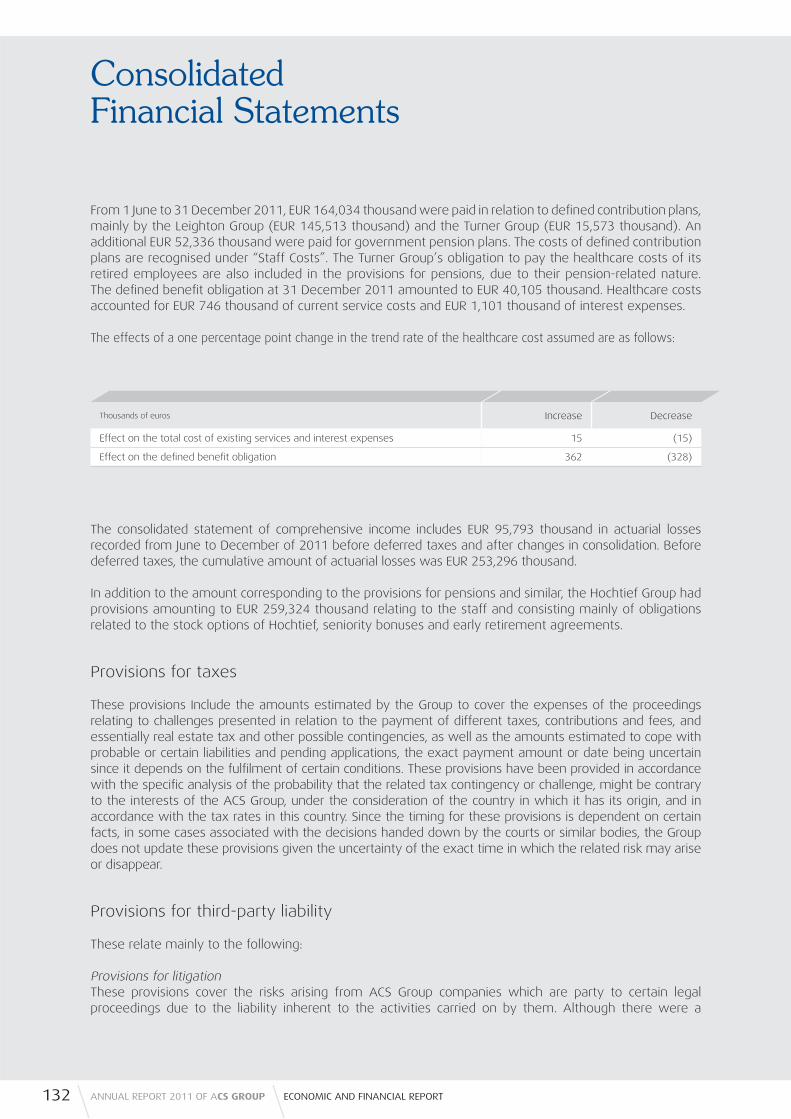
ConsolidatedFinancial Statements
From 1 June to 31 December 2011, EUR 164,034 thousand were paid in relation to defi ned contribution plans, mainly by the Leighton Group (EUR 145,513 thousand) and the Turner Group (EUR 15,573 thousand). An additional EUR 52,336 thousand were paid for government pension plans. The costs of defi ned contribution plans are recognised under “Staff Costs”. The Turner Group’s obligation to pay the healthcare costs of its retired employees are also included in the provisions for pensions, due to their pension-related nature. The defi ned benefi t obligation at 31 December 2011 amounted to EUR 40,105 thousand. Healthcare costs accounted for EUR 746 thousand of current service costs and EUR 1,101 thousand of interest expenses.
The effects of a one percentage point change in the trend rate of the healthcare cost assumed are as follows:
The consolidated statement of comprehensive income includes EUR 95,793 thousand in actuarial losses recorded from June to December of 2011 before deferred taxes and after changes in consolidation. Before deferred taxes, the cumulative amount of actuarial losses was EUR 253,296 thousand.
In addition to the amount corresponding to the provisions for pensions and similar, the Hochtief Group had provisions amounting to EUR 259,324 thousand relating to the staff and consisting mainly of obligations related to the stock options of Hochtief, seniority bonuses and early retirement agreements.
Provisions for taxes
These provisions Include the amounts estimated by the Group to cover the expenses of the proceedings relating to challenges presented in relation to the payment of different taxes, contributions and fees, and essentially real estate tax and other possible contingencies, as well as the amounts estimated to cope with probable or certain liabilities and pending applications, the exact payment amount or date being uncertain since it depends on the fulfi lment of certain conditions. These provisions have been provided in accordance with the specifi c analysis of the probability that the related tax contingency or challenge, might be contrary to the interests of the ACS Group, under the consideration of the country in which it has its origin, and in accordance with the tax rates in this country. Since the timing for these provisions is dependent on certain facts, in some cases associated with the decisions handed down by the courts or similar bodies, the Group does not update these provisions given the uncertainty of the exact time in which the related risk may arise or disappear.
Provisions for third-party liability
These relate mainly to the following:
Provisions for litigationThese provisions cover the risks arising from ACS Group companies which are party to certain legal proceedings due to the liability inherent to the activities carried on by them. Although there were a
132 ANNUAL REPORT 2011 OF ACS GROUP ECONOMIC AND FINANCIAL REPORT
Thousands of euros Increase Decrease
Effect on the total cost of existing services and interest expenses 15 (15)
Effect on the defi ned benefi t obligation 362 (328)

signifi cant number of lawsuits, they were for amounts of little relevance considered individually, none of which was particularly noteworthy, excluding the lawsuit fi led by Boliden-Apirsa in 2004. In relation to this case, the Supreme court fi nally dismissed the lawsuit fi led by Boliden-Apirsa in accordance with its judgement handed down on 11 January 2012. Period charges to these provisions are made based on an analysis of the lawsuits or claims in progress, according to the reports prepared by the legal advisers of the ACS Group. As in the case of provisions for taxes, these amounts are not updated to the extent that the time at which the risk arises or disappears depends on circumstances linked to judgments or arbitration and it is impossible to determine the date on which they will be resolved. Additionally, these provisions are not derecognised until the judgements handed down are fi nal and payment is made, or there is no doubt as to the disappearance of the associated risk.
Environmental ProvisionsThe ACS Group has an environmental policy based, not only on strict compliance with the law in force on the improvement and protection of the environment, but also on going even further through the establishment of proactive planning based on analysis and minimization of the environmental impact of the activities carried on by Group. These provisions are made to cover any likely environmental risks which might arise.
Guarantees and contractual and legal obligationsThese provisions cover the expenses relating to obligations arising from contractual and legal obligations which are not of an environmental nature. A signifi cant portion of these provisions is made by increasing the value of those assets related to the obligations in relation to administrative concession, whose effect on profi t or loss occurs when the asset is depreciated in accordance with depreciation rates. Additionally, it includes provisions for highway concession companies, in relation to the costs of future expropriations borne by the concession companies in accordance with agreements with the grantors, as well as the current value of the investments made in concession contracts, according to the respective fi nancial economic models.
Period charges to these provisions are generally mainly made to cover the costs of sealing and post-closing maintenance, as well as amounts associated with highway concession contracts and other activities undertaken in the form of a concession. The additions for the year relate mainly to companies which have initiated their activity and assume the contractual obligation of sealing or replacement. The uses and reversals of such provisions arise from the sealing of different vessels associated with waste treatment companies in the Group, in addition to the payment of amounts associated with the expropriation of land on which there are real estate assets. In this regard, noteworthy in 2011 were the changes in scope resulting from the full consolidation of Hochtief.
Such provisions are made when the associated commitments arise, the timing of their use being conditional in the case of waste treatment, on the number of tonnes treated and the fi ll rate of the different vessels, and in the case of concessions or other activities, on the use of the infrastructure and/or its wear. Timing is analysed according to the fi nancial and economic model of each concession, considering related historical information in order to adjust for possible deviations that might arise in the payment schedule set for these models.
Provision for construction contract settlements and project lossesThese relate to the expected or estimated losses incurred during the performance of construction work, as well as the related costs following the fi nal contract settlement, calculated systematically according to the percentage of production value over the period in which the work is performed based on past experience with construction work.
133CONSOLIDATED FINANCIAL STATEMENTS

ConsolidatedFinancial Statements
Line of Business
Thousands of euros
Construction 1,245,570
Industrial Services 108,361
Environment 154,916
Corporate unit 45,161
Total 1,554,008
The breakdown of the provision for liabilities, by line of business, is as follows:
The amount of the most signifi cant provisions in the construction area related to the change in the scope of consolidation due to the full consolidation of the Hochtief Group, for which period provisions were made at 31 December 2011 amounting to EUR 451,555 thousand for employee obligations and claims. In addition to these amounts, as a result of the full consolidation of Hochtief, provisions were made to cover risks associated with certain investments and other liabilities of this group.
The changes in current provisions in 2011 were as follows:
The most important change relates to the incorporation of the Hochtief Group.
134 ANNUAL REPORT 2011 OF ACS GROUP ECONOMIC AND FINANCIAL REPORT
Thousands of euros
CurrentProvision for
termination benefi tsProvision for contract
work completion Operating allowance Total
Balance at 31 December 2010 14,488 110,684 108,172 233,344
Additions or charges for the year 8,360 14,762 305,408 328,530
Amounts used (2,384) (18,803) (386,377) (407,564)
Reversals (921) (1,178) (56,213) (58,312)
Exchange differences (419) (100) 29,541 29,022
Changes in the scope of consolidation (2,145) 145 1,145,461 1,143,461
Balance at 31 December 2011 16,979 105,510 1,145,992 1,268,481
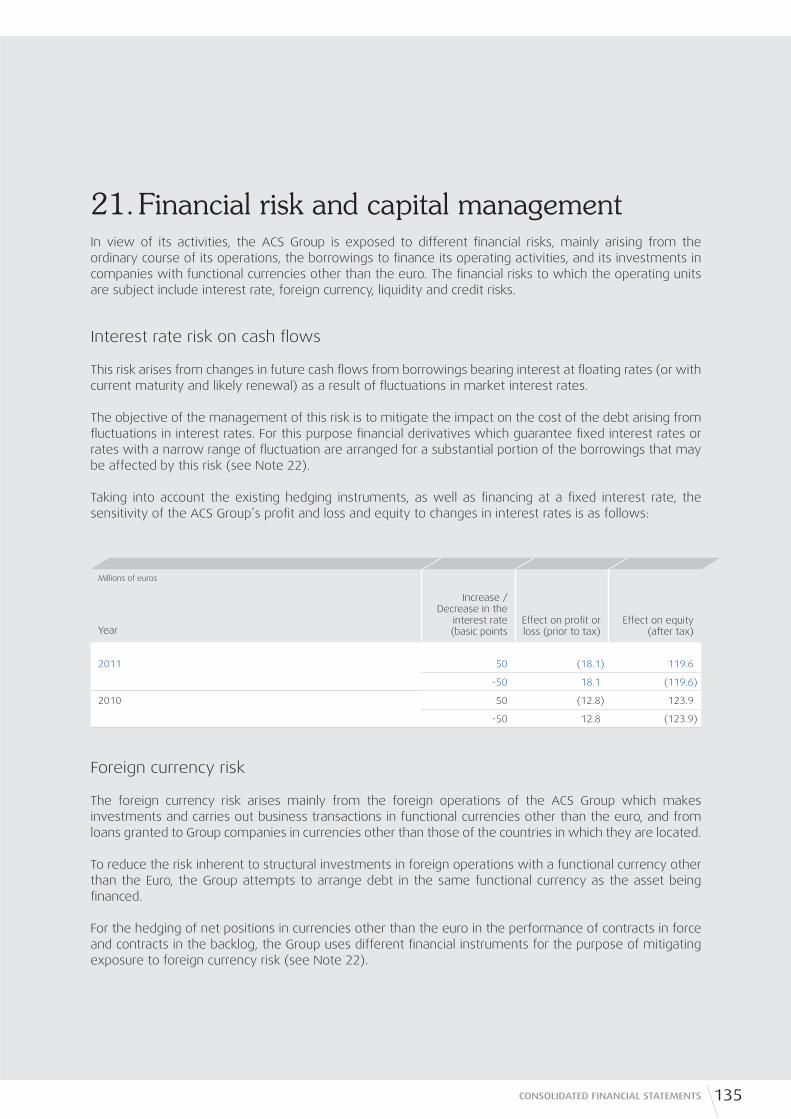
21. Financial risk and capital managementIn view of its activities, the ACS Group is exposed to different fi nancial risks, mainly arising from the ordinary course of its operations, the borrowings to fi nance its operating activities, and its investments in companies with functional currencies other than the euro. The fi nancial risks to which the operating units are subject include interest rate, foreign currency, liquidity and credit risks.
Interest rate risk on cash fl ows
This risk arises from changes in future cash fl ows from borrowings bearing interest at fl oating rates (or with current maturity and likely renewal) as a result of fl uctuations in market interest rates.
The objective of the management of this risk is to mitigate the impact on the cost of the debt arising from fl uctuations in interest rates. For this purpose fi nancial derivatives which guarantee fi xed interest rates or rates with a narrow range of fl uctuation are arranged for a substantial portion of the borrowings that may be affected by this risk (see Note 22).
Taking into account the existing hedging instruments, as well as fi nancing at a fi xed interest rate, the sensitivity of the ACS Group’s profi t and loss and equity to changes in interest rates is as follows:
Foreign currency risk
The foreign currency risk arises mainly from the foreign operations of the ACS Group which makes investments and carries out business transactions in functional currencies other than the euro, and from loans granted to Group companies in currencies other than those of the countries in which they are located.
To reduce the risk inherent to structural investments in foreign operations with a functional currency other than the Euro, the Group attempts to arrange debt in the same functional currency as the asset being fi nanced.
For the hedging of net positions in currencies other than the euro in the performance of contracts in force and contracts in the backlog, the Group uses different fi nancial instruments for the purpose of mitigating exposure to foreign currency risk (see Note 22).
135CONSOLIDATED FINANCIAL STATEMENTS
Millions of euros
Year
Increase / Decrease in the
interest rate (basic points
Effect on profi t or loss (prior to tax)
Effect on equity (after tax)
2011 50 (18.1) 119.6
-50 18.1 (119.6)
2010 50 (12.8) 123.9
-50 12.8 (123.9)

ConsolidatedFinancial Statements
The sensitivity analysis shown below refl ects the potential effect on the ACS Group, both on equity and on the consolidated income statement of a fi ve per cent fl uctuation in the most signifi cant currencies in comparison with the functional currency of each Group company, based on the situation at the end of the reporting period.
Effect on profi t or loss before tax
Effect on equity before tax.
Following is the breakdown of the major currencies of the fi nancial assets and liabilities of the ACS Group:
At 31 December 2011Thousands of euros
US Dollar (USD)
Brazilian Real (BRL)
Moroccan Dirham (MAD)
Chilean Peso (CLP)
Mexican Peso
(MXP)
Australian Dollar (AUD)
Egyptian Libra (EGP)
Indian Rupia (INR)
Other currencies
Balance at 31/12/2011
Marketable securities (portfolio of short- and long-term investments
57,142 274 - 32,092 - - - - 61 89,569
Loans to associates 43,911 59,386 40 - 116,629 388,657 84,444 22,227 3,693 718,987
Other loans 398,259 1,251 1,332 2,566 3,588 208,954 - - 10,068 626,018
Bank borrowings (non-current)
114,059 3,122 24,294 1,037 1,630 1,158,468 - - 13,920 1,316,530
Bank borrowings (current)
96,074 8,619 4,477 (18,484) 3,109 526,444 - 11,033 28,297 659,569
136 ANNUAL REPORT 2011 OF ACS GROUP ECONOMIC AND FINANCIAL REPORT
Millions of euros 2011 2010
Functional currency Currency 5% -5% 5% -5%
EUR USD 4.5 -4.5 12.2 -12.2
EUR BRL 13.2 -13.2 2.4 -2.4
AUD USD 5.5 5.5 - -
CZK EUR -2.5 -2.5 - -
Millions of euros 2011 2010
Functional currency Currency 5% -5% 5% -5%
EUR USD 13.3 -13.2 37.4 -37.4
EUR BRL 38.6 -38.6 34.5 -34.5
EUR CHF 2.1 2.1 - -

Liquidity risk
This risk results from the timing gaps between fund requirements for business investment commitments, debt maturities, working capital requirements, etc. and the funds arising from cash generated in the course of the Group’s ordinary operations, different forms of bank fi nancing, capital market operations and divestments.
The current fi nancial market environment is marked by a liquidity crisis caused by the general downturn of credit. The ACS Group has a policy for the proactive management of liquidity risk through the comprehensive monitoring of cash and anticipation of the expiration of fi nancial operations. The Group also manages liquidity risk through the effi cient management of investments and working capital and the arrangement of lines of long-term fi nancing.
The Group’s objective with respect to the management of liquidity risk to maintain a balance between the fl exibility, term and conditions of the credit facilities arranged on the basis of projected short-, medium-, and long-term fund requirements. In this connection, noteworthy is the use of limited recourse fi nancing of projects and debts as described in Note 18, and current fi nancing for working capital requirements.
In 2012 prior to the presentation of the fi nancial statements, ACS, Actividades de Construcción y Servicios, S.A. entered into a contract with a syndicate of banks for the refi nancing of the syndicated loan facility maturing in July 2012 until July 2015. he amount currently contracted amounts to EUR 1,411 million, which can be increased to EUR 1,650 million until May 2012. This refi nancing ensures the liquidity of the ACS Group’s operations.
In addition to the above, as a result of the substantial refi nancing of debt in 2011, mainly in connection with the fi nancing of Iberdrola and the acquisition of Hochtief, the Group has signifi cantly extended the maturity dates of its fi nancing.
Lastly, it should be noted in relation to this risk that as a precautionary measure, at its General Meeting of Shareholders held in 2009 and for a period of fi ve years the ACS Group authorised the Board of Directors of ACS, Actividades de Construcción y Servicios, S.A. to increase the share capital, as well as the issuance of debt securities, simple, redeemable or convertible, etc. as detailed in Note 15.01.
At its Annual General Meeting held in 2011, the shareholders of the Hochtief Group also took measures to allow for an increase in capital.
At 31 December 2010Thousands of euros
US Dollar (USD)
Brazilian Real (BRL)
Moroccan Dirham (MAD)
Chilean Peso (CLP)
Mexican Peso
(MXP)
Australian Dollar (AUD)
Egyptian Libra (EGP)
Indian Rupia (INR)
Other currencies
Balance at 31/12/2010
Marketable securities (portfolio of short- and long-term investments
887 5,965 5 52,380 44,961 4,889 - - 28,002 137,089
Loans to associates 58 143,857 40 60,678 14,446 - 48,471 54,512 4,978 327,040
Other loans - 307 167 702 1,862 5 - - 12,362 15,405
Bank borrowings (non-current)
346,443 25,619 24,230 - - - - - 11,600 407,892
Bank borrowings (current)
34,728 87,120 (590) (14,971) 11,811 1 44,427 81,976 59,654 304,156
137CONSOLIDATED FINANCIAL STATEMENTS

ConsolidatedFinancial Statements
Credit risk
This risk mainly relates to the non-payment of trade receivables. The objective of credit risk management is to reduce the impact of credit risk exposure as far as possible by means of the preventive assessment of the solvency rating of the Group’s potential clients. When contracts are being performed, the credit rating of the outstanding amounts receivable is periodically evaluated and the estimated recoverable doubtful receivables are adjusted and written down with a charge profi t and loss for the year. The credit risk has historically been very limited.
Additionally, the ACS Group is exposed to the risk of breach by its counterparties in transactions involving fi nancial derivatives and cash placement. The Corporate management of the ACS Group establishes counterparty selection criteria based on the quality of credit of the fi nancial institutions which translates into a portfolio of entities of high quality and solvency. In this regard, there were no signifi cant payment defaults in 2011 or 2010.
Exposure to publicly traded share price risk
The ACS Group is exposed to risks relating to the performance of the share price of listed companies.
This exposure relates to derivative agreements which are related to remuneration systems linked to the performance of the ACS share price (see Note 22). These equity swaps eliminate the uncertainty regarding the period price of remunerations systems. However, since the derivatives are not considered to comply with hedge accounting criteria, their market value has an effect on the consolidated statement of income (positive in the case of an increase in the share price and negative on the contrary).
The ACS Group is also exposed to the risk of changes in the price of shares of Abertis, Hochtief and Iberdrola. In the case of Abertis, since this investee is considered to be an associate and there are signifi cant capital gains on its consolidated value, the performance of its share price does not have a direct effect on the consolidated fi nancial statements (see Note 09). In the case of Hochtief, the exposure is mainly focused on the possible risk of impairment of derivatives relating to remuneration Systems linked to the price of Hochtief shares (see Notes 04.01 and 28.03). Lastly, in the case of Iberdrola, changes in market value have an effect on equity and are an indicator of possible impairment (see Note 10.01).
Capital management
The ACS Group’s objectives in relation to capital management are to maintain an optimal fi nancial-equity structure in order to reduce the cost of capital, while safeguarding the Company’s ability to continue operating with an adequately stable debt-to-equity ratio.
The capital structure is mainly controlled through the debt ratio which is calculated by dividing net fi nancial debt by net equity. Net fi nancial debt is understood to comprise the following:
+ Net recourse debt: + Non-current bank borrowings + Current bank borrowings + Issue of bonds and debentures - Cash and other current fi nancial assets+ Project fi nancing debt.
138 ANNUAL REPORT 2011 OF ACS GROUP ECONOMIC AND FINANCIAL REPORT

The Group’s directors consider the leverage to be appropriate at 31 December 2011 and 2010. Following is the detail thereof:
Estimation of fair value
The breakdown at 31 December 2011 and 2010 of the ACS Group’s assets and liabilities measured at fair value according to the hierarchy levels mentioned in Note 03.08.06 is as follows:
Thousands of euros31/12/2011 31/12/2010
Net recourse debt 3,368,692 956,610
Non-current bank borrowings 2,883,347 4,717,777
Current bank borrowings 6,225,075 2,136,685
Issue of bonds and debentures 769,053 -
Other fi nancial liabilities 652,616 56,935
Other current fi nancial assets and cash (7,161,399) (5,954,787)
Project fi nancing 5,965,493 7,046,531
Equity 6,191,264 4,442,386
Leverage 151% 180%
Leverage to net recourse debt 54% 22%
139CONSOLIDATED FINANCIAL STATEMENTS
Thousands of EurosValue at
31/12/2011 Level 1 Level 2 Level 3
Assets 5,865,505 5,697,710 119,040 48,755
Equity instruments 5,434,562 5,385,807 - 48,755
Debt securities 392,831 311,903 80,928 -
Financial instrument receivables
Non-current 23,739 - 23,739 -
Current 14,373 - 14,373 -
Liabilities 476,548 - 445,848 30,700
Financial instrument receivables
Non-current 421,705 - 421,705 -
Current 54,843 - 24,143 30,700
Thousands of EurosValue at
31/12/2010 Level 1 Level 2 Level 3
Assets 6,449,189 6,389,423 59,766 -
Equity instruments 6,389,423 6,389,423 - -
Debt securities - - - -
Financial instrument receivables
Non-current 59,766 - 59,766 -
Current - - - -
Liabilities 240,806 - 240,806 -
Financial instrument receivables
Non-current 240,435 - 240,435 -
Current 371 - 371 -
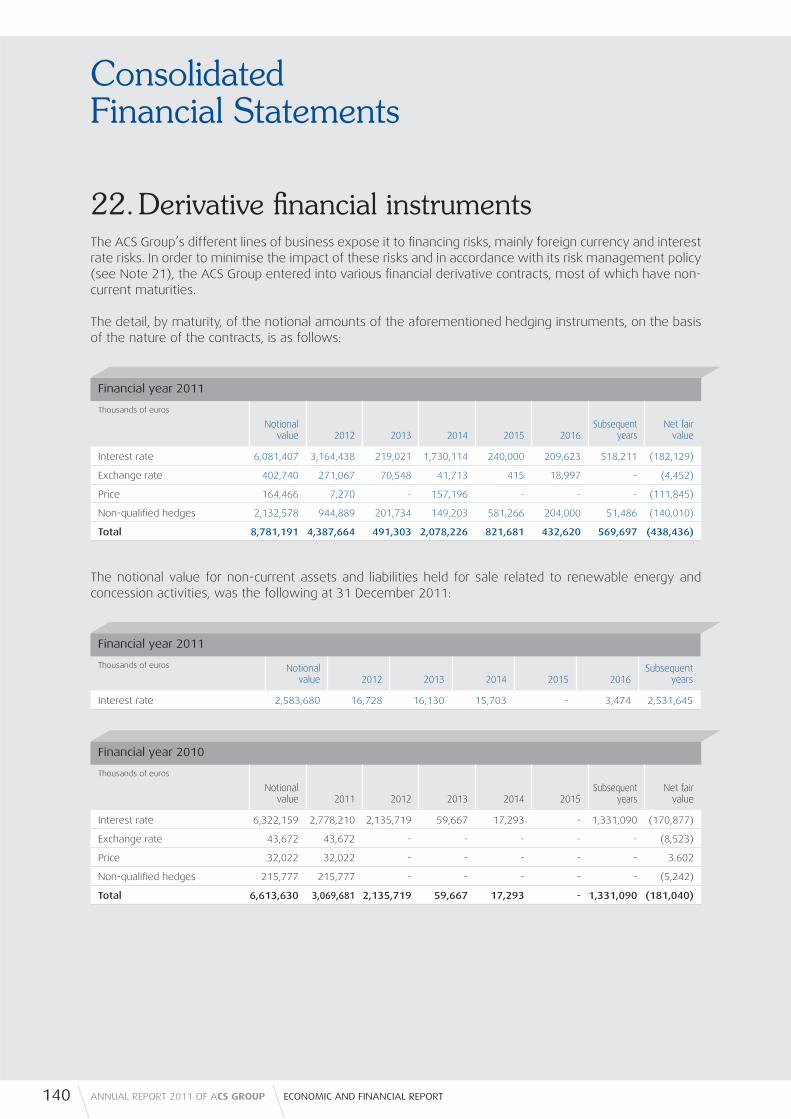
ConsolidatedFinancial Statements
22. Derivative fi nancial instrumentsThe ACS Group’s different lines of business expose it to fi nancing risks, mainly foreign currency and interest rate risks. In order to minimise the impact of these risks and in accordance with its risk management policy (see Note 21), the ACS Group entered into various fi nancial derivative contracts, most of which have non-current maturities.
The detail, by maturity, of the notional amounts of the aforementioned hedging instruments, on the basis of the nature of the contracts, is as follows:
The notional value for non-current assets and liabilities held for sale related to renewable energy and concession activities, was the following at 31 December 2011:
Financial year 2011
Thousands of euros
Notional value 2012 2013 2014 2015 2016
Subsequent years
Net fair value
Interest rate 6,081,407 3,164,438 219,021 1,730,114 240,000 209,623 518,211 (182,129)
Exchange rate 402,740 271,067 70,548 41,713 415 18,997 - (4,452)
Price 164,466 7,270 - 157,196 - - - (111,845)
Non-qualifi ed hedges 2,132,578 944,889 201,734 149,203 581,266 204,000 51,486 (140,010)
Total 8,781,191 4,387,664 491,303 2,078,226 821,681 432,620 569,697 (438,436)
Financial year 2011
Thousands of euros Notional value 2012 2013 2014 2015 2016
Subsequent years
Interest rate 2,583,680 16,728 16,130 15,703 - 3,474 2,531,645
Financial year 2010
Thousands of euros
Notional value 2011 2012 2013 2014 2015
Subsequent years
Net fair value
Interest rate 6,322,159 2,778,210 2,135,719 59,667 17,293 - 1,331,090 (170,877)
Exchange rate 43,672 43,672 - - - - - (8,523)
Price 32,022 32,022 - - - - - 3.602
Non-qualifi ed hedges 215,777 215,777 - - - - - (5,242)
Total 6,613,630 3,069,681 2,135,719 59,667 17,293 - 1,331,090 (181,040)
140 ANNUAL REPORT 2011 OF ACS GROUP ECONOMIC AND FINANCIAL REPORT
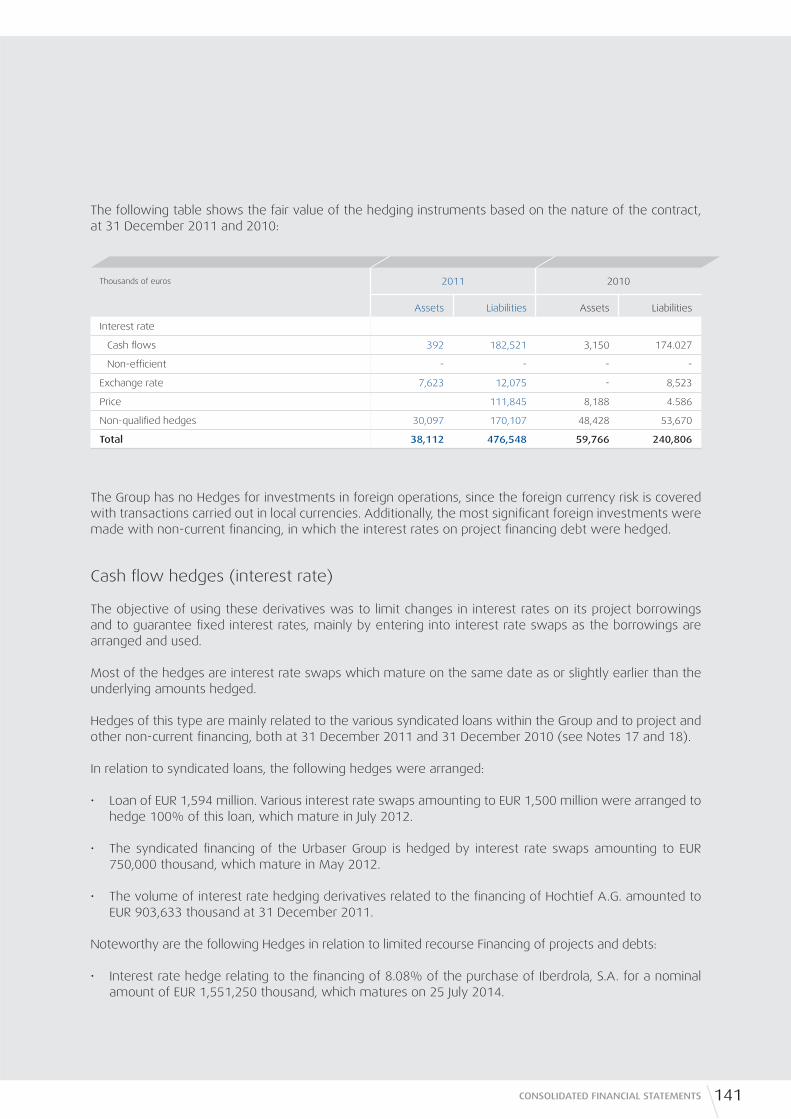
The following table shows the fair value of the hedging instruments based on the nature of the contract, at 31 December 2011 and 2010:
The Group has no Hedges for investments in foreign operations, since the foreign currency risk is covered with transactions carried out in local currencies. Additionally, the most signifi cant foreign investments were made with non-current fi nancing, in which the interest rates on project fi nancing debt were hedged.
Cash fl ow hedges (interest rate)
The objective of using these derivatives was to limit changes in interest rates on its project borrowings and to guarantee fi xed interest rates, mainly by entering into interest rate swaps as the borrowings are arranged and used.
Most of the hedges are interest rate swaps which mature on the same date as or slightly earlier than the underlying amounts hedged.
Hedges of this type are mainly related to the various syndicated loans within the Group and to project and other non-current fi nancing, both at 31 December 2011 and 31 December 2010 (see Notes 17 and 18).
In relation to syndicated loans, the following hedges were arranged:
• Loan of EUR 1,594 million. Various interest rate swaps amounting to EUR 1,500 million were arranged to hedge 100% of this loan, which mature in July 2012.
• The syndicated fi nancing of the Urbaser Group is hedged by interest rate swaps amounting to EUR 750,000 thousand, which mature in May 2012.
• The volume of interest rate hedging derivatives related to the fi nancing of Hochtief A.G. amounted to EUR 903,633 thousand at 31 December 2011.
Noteworthy are the following Hedges in relation to limited recourse Financing of projects and debts:
• Interest rate hedge relating to the fi nancing of 8.08% of the purchase of Iberdrola, S.A. for a nominal amount of EUR 1,551,250 thousand, which matures on 25 July 2014.
141CONSOLIDATED FINANCIAL STATEMENTS
Thousands of euros 2011 2010
Assets Liabilities Assets Liabilities
Interest rate
Cash fl ows 392 182,521 3,150 174.027
Non-effi cient - - - -
Exchange rate 7,623 12,075 - 8,523
Price 111,845 8,188 4.586
Non-qualifi ed hedges 30,097 170,107 48,428 53,670
Total 38,112 476,548 59,766 240,806
ConsolidatedFinancial Statements
• Interest rate swap to hedge of the loan for the acquisition of 22.80% of Hochtief, A.G. for EUR 632,000 thousand, which matures in July 2012.
The derivative liabilities relating to solar thermal plants, wind powered facilities and highway concessions were reclassifi ed to liabilities relating to assets held for sale. In this regard, there are interest rate swaps to hedge 75 to 100% of the fi nancing of the solar thermal plants, which mature between 2019 and 2022, and interest rate swaps to hedge the Financing of the wind powered facilities, which mature between 2011 and 2024. In the case of highway concessions, noteworthy are the interest rate hedges:
• Autovía de La Mancha and Inversora de La Mancha have interest rate swaps amounting to EUR 139,060 thousand which mature in 2032.
• La Concesionaria Santiago Brión, S.A. has entered into two interest rate swaps amounting to EUR 27,000 thousand and maturing in 2032.
• Autovía del Pirineo has interest rate swaps amounting to EUR 151,162 thousand which mature in 2030.
• Eje Diagonal has interest rate swaps amounting to EUR 249 million which mature in 2017.
• Fraser Transportation Group has interest rate swaps amounting to CDN 169,260 thousand which mature in 2033.
Cash fl ow hedges (exchange rate)
The foreign currency risk relates mainly to contract work in which payables and/or receivables are in a currency other than the functional currency.
The most signifi cant derivatives contracted to hedge these risks relate to foreign currency hedges arranged mostly by Leighton (subsidiary of the Hochtief group) for a notional amount of EUR 253,724 thousand, which mature between 2012 and 2014.
In the case of Industrial Services, the most signifi cant derivatives relate to exchange rate hedges for foreign projects for a nominal amount of EUR 52,083 thousand in 2011, which mature between 2012 and 2014 (EUR 43,672 thousand in 2010 and with maturity in 2011).
Price hedges
The fair value of the price hedges amounted to EUR 111,845 thousand at 31 December 2011. These hedges relate Leighton’s payment obligation with respect to an infrastructure project in Australia, which matures in 2014.
Derivative Instruments not classifi ed as hedges
The liabilities relating to fi nancial instruments not qualifi ed as hedges include the fair value of the derivatives which do not meet hedging conditions. In this connection the most signifi cant liability relates to the derivative included in the externalisation to a fi nancial institution of the 2010 stock option plan amounting to EUR 80,249 thousand at 31 December 2011 (EUR 53,670 thousand at 31 December 2010). The fi nancial institution has acquired these
142 ANNUAL REPORT 2011 OF ACS GROUP ECONOMIC AND FINANCIAL REPORT

shares on the market for delivery to the management who are benefi ciaries of this Plan in accordance with the conditions therein, at the exercise price of the option.
In the contract with the fi nancial institution, the latter does not assume any risk relating to the drop of the listed share price below the exercise price. The exercise price of the option for the 2010 plan is EUR 34.155 per share. Therefore this risk in the drop in the market price below the option price is assumed by ACS, Actividades de Construcción y Servicios, S.A., and was not subject to any hedging with another fi nancial institution. This right in favour of the fi nancial institution, called a “put”, is recognised at fair value at the end of the reporting period, and therefore the Group recognises a liability in profi t or loss with respect to the value of the option in the previous year, which in the case of the 2010 Plan is zero since it was newly created. The risk of an increase in the share price is not assumed by either the fi nancial institution or the Group, since in this case, the management would exercise its call option and directly acquire the shares from the fi nancial institution which agrees to sell them to the benefi ciaries at the exercise price. Consequently, upon completing the plan, if the shares have a higher market price than the value of the option, the derivative will have zero value at this date.
Additionally, according to the contract, at the time of fi nal maturity of the Plan, in the event that there are options that have not been exercised by their directors (i.e. due to voluntary resignation in the ACS Group), the pending options are settled by differences. In order words, the fi nancial institution sells the pending options on the market, and the result of the settlement, whether positive or negative, is received by ACS in cash (never in shares). Consequently, at the end of the Plan, the Company does not ever receive shares derived from the same, and therefore it is not considered treasury stock.
Additionally, the ACS Group had derivative instruments not qualifi ed as hedges on shares of the Parent, which are settled by differences and whose negative market value amounted to EUR 47,605 thousand at 31 December 2011.
In addition to the derivatives of ACS, Actividades de Construcción y Servicios, S.A., Hochtief has derivatives not qualifi ed as Hedges which represent a liability amounting to EUR 42,253 thousand, noteworthy being those relating to price risk in the case of options on equity instruments and forwards on shares. In this connection and on an individual basis, in relation to the sale in 2007 and 2008 of 16.25% of its ownership interest in the Chilean highway Vespucio Norte Express, Hochtief, A.G. gave its investors a guarantee which expires on 31 December 2012. This guarantee had a fair value of EUR 30,700 thousand at the end of the reporting period.
Assets relating to derivatives not qualifi ed as hedging include the measurement at fair value of derivative fi nancial instruments in Hochtief which are settled by differences, which amounted to EUR 30,005 thousand at 31 December 2010 (see Note 02.02.f). These derivatives were settled at the beginning of 2011 with a gain of EUR 2,083 thousand, which was recognised as a gain in “Change in the fair value of fi nancial instruments” in the consolidated statement of income for 2011 (see Note 28.05.).
At the end of December 2010, the ACS Group purchased a fi rm ownership interest of 1.9% in the shares of Iberdrola, S.A. which granted it with all the voting and dividend rights associated with the same. To fi nance this acquisition, the ACS Group structured the transaction through the signing of a prepaid forward share with a fi nancial institution, which matures at 27 June 2012, can only be settled in cash and can be partially or fully settled at any time. The related derivate is secured by the shares of Iberdrola as underlying assets. This transaction was offset at the beginning of 2011 with a “reverse collar”, and therefore, at 31 December 2011 the fair value of the two derivatives is offset and has no signifi cant impact on the consolidated fi nancial statements.
143CONSOLIDATED FINANCIAL STATEMENTS
ConsolidatedFinancial Statements
23. Trade and other payablesThis heading mainly includes the amounts outstanding for trade purchases and related costs, as well as customer advances for contract work amounting to EUR 2,802,063 thousand in 2011 (EUR 2,644,983 thousand in 2010) (see Note 12).
Disclosures on the deferral of payments to suppliers. Additional Provision Three. “Duty of Disclosure” of Spanish Law 15/2010, of 5 July.
In relation to the disclosures required by Additional Provision Three of Law 15/2010, of 5 July for these fi rst fi nancial statements prepared since the entry into force of the Law, at 31 December 2010, there were balances payable to suppliers that were past due by more than the maximum payment period at 31 December 2011 amounting to EUR 235,640 thousand (EUR 67,007 thousand at 31 December 2010).
This balance relates to Spanish consolidated group companies which due to their nature are trade creditors with payables to suppliers of goods and services and included under the heading “Current Liabilities” in the consolidated statement of fi nancial position at 31 December 2011 and 2010. Amounts payable to non-current asset suppliers and fi nance lease payables are not included in this balance.
The maximum payment period applicable to the Spanish consolidated group companies under Law 3/2004, of 29 December, on combating late payment in commercial transactions ranges between 85 and 120 days.
The following table provides information relating to the deferral of payments to suppliers, in accordance with the Spanish Accounting and Audit Institute resolution of 29 September 2010 implementing the duty of disclosure regulations provided in Spanish Law 15/2010 of 5 July:
PMPE is the Spanish abbreviation for “Plazo medio ponderado excedido de pagos” (Weighted average days outstanding), i.e. the sum of each of the payments made to suppliers subsequent to the maximum legal period for payment and the number of days outstanding divided by the total payments made in the year later subsequent to the maximum legal period.
24. Other current liabilitiesThe detail of this heading at 31 December 2011 and 2010 is as follows:
144 ANNUAL REPORT 2011 OF ACS GROUP ECONOMIC AND FINANCIAL REPORT
Thousands of euros %
With maximum legal period 5,579,062 85%
Other 1,000,285 15%
Total 6,579,347 100%
Weighted average days outstanding 108 days
Deferrals exceeding legal maximum limit at 31 December (PMPE) 235,640
Thousands of eurosBalance at 31/12/2011 Balance at 31/12/2010
Advance payments received 50,921 27,283
Payable to non-current asset suppliers 13,295 166,424
Interim dividend payable (Note 15.05) 283,198 283,198
Deposits and guarantees received 4,941 9,356
Other 251,642 170,009
Total 603,997 656,270
25. Segments
25.01. Basis of segmentation
The structure of the ACS Group refl ects its focus on different lines of business or activity areas. Segment reporting based on the different lines of business includes information regarding the Group’s internal organisation, taking into account the bodies involved in monitoring operations and taking decisions.
25.01.01. Primary segments – business segments
The business segments used to manage the ACS Group are as follows:
• Construction. This segment includes the activities carried on mainly by Dragados, Hochtief and Iridium which are focused on the construction of civil works, residential and non-residential buildings, concession activity (mainly transport infrastructures), mining and real estate.
• Industrial Services. This segment is engaged in the development of applied engineering services, installations and the maintenance of industrial infrastructures in the energy, communications and control systems sectors.
• Environment. This segment groups together environmental services such as road cleaning, waste collection and transport, treatment and recycling of urban, commercial and industrial waste, integral management of the water cycle and urban landscaping. Also included in this segment are integral building maintenance activities (which are now considered to be discontinued activities since they were carried on through Clece).
• Corporate Unit. This comprises the business activity carried on by ACS, Actividades de Construcción y Servicios, S.A., and also groups together strategic investments in energy (Iberdrola, S.A.), telecommunications (Xfera Móviles, S.A.) and concessions (Abertis Infraestructuras, S.A.).
The full consolidation of the Hochtief Group in 2011 led to a change in the Group’s segment structure. Hochtief was previously accounted for using the equity method and is now fully consolidated within the Construction area. In 2010 the concessions area was consolidated within the construction area. The comparative information in the 2010 notes to the fi nancial statements was reclassifi ed in accordance with the new grouping for the purpose of uniformity.
25.01.02. Geographical segments
The ACS Group is managed by business segments and the management based on geographical segments is irrelevant. Accordingly, a distinction is made between Spain and the rest of the world, in accordance with the stipulations of IFRS 8.
25.02. Basis and methodology for business segment reporting
The reporting structure is designed in accordance with the effective management of the different segments comprising the ACS Group. Each segment has its own resources based on the entities engaging in the related business, and accordingly, has the assets required to operate the business.
Each of the business segments relates mainly to a legal structure, in which the companies report to a holding company representing each activity for business purposes. Accordingly, each legal entity has the assets and resources required to perform its business activities in an autonomous manner.
Segment reporting for these businesses is presented below.
145CONSOLIDATED FINANCIAL STATEMENTS

ConsolidatedFinancial Statements
25.02.01. Income statement by business segment: 2011
146 ANNUAL REPORT 2011 OF ACS GROUP ECONOMIC AND FINANCIAL REPORT
Thousands of Euros
Construction EnvironmentIndustrial Services
Corporate unit and
adjustments Total Group
Revenue 19,801,527 1,685,710 7,045,007 (60,361) 28,471,883
Changes in inventories of fi nished goods and work in progress (224,948) 5,864 (819) - (219,903)
Capitalised expenses of in-house work on assets 9,232 7,540 86 636 17,494
Procurements (13,214,312) (434,131) (4,166,324) 47,283 (17,767,484)
Other operating income 427,801 47,770 42,631 720 518,922
Staff costs (4,078,602) (801,217) (1,407,591) (31,111) (6,318,521)
Other operating expenses (1,506,899) (270,428) (631,455) (10,876) (2,419,658)
Depreciation and amortisation charge (765,128) (133,194) (54,317) (1,313) (953,952)
Allocation of grants relating to non-fi nancial assets and other 180 4,062 283 - 4,525
Impairment and gains on the disposal of non-current assets (3,073) 647 (37,863) - (40,289)
Other profi t or loss 55,254 (578) 5,777 20,681 81,134
Operating income 501,032 112,045 795,415 (34,341) 1,374,151
Finance income 145,945 43,648 130,703 200,759 521,055
Finance costs (390,734) (102,557) (313,883) (409,340) (1,216,514)
Changes in the fair value of fi nancial instruments (24,960) (5) - (73,230) (98,195)
Exchange differences (18,399) (423) (3,346) 16 (22,152)
Impairment and gains on the disposal of non-current assets 208,604 52,967 106,321 (805) 367,087
Financial profi t /loss (79,544) (6,370) (80,205) (282,601) (448,719)
Results of companies accounted for using the equity method 247,556 12,343 18,702 39,868 318,469
Profi t before tax 669,044 118,018 733,912 (277,074) 1,243,901
Corporate income tax (194,618) (30,995) (204,549) 248,942 (181,220)
Profi t for the year from continuing operations 474,426 87,023 529,363 (28,132) 1,062,681
Profi t after tax from discontinued operations - 45,690 - - 45,690
Profi t for the year 474,426 132,713 529,363 (28,132) 1,108,371
Profi t attributed to non-controlling interests (104,160) (4,599) (37,769) - (146,528)
Profi t from discontinued operations attributed to non-controlling interests - 97 - - 97
Profi t attributable to the parent 370,266 128,211 491,594 (28,132) 961,940
147CONSOLIDATED FINANCIAL STATEMENTS
25.02.02. Income statement by business segment: 2010
Thousands of Euros
Construction EnvironmentIndustrial Services
Corporate unit and
adjustments Total Group
Revenue 5,703,291 1,510,669 7,157,818 (43,273) 14,328,505
Changes in inventories of fi nished goods and work in progress (27,080) 41,800 (443) 284 14,561
Capitalised expenses of in-house work on assets 27,609 8,051 273 1,075 37,008
Procurements (3,765,969) (414,719) (4,356,747) 54,402 (8,483,033)
Other operating income 272,995 39,147 44,972 (18,005) 339,109
Staff costs (1,091,939) (760,021) (1,360,540) (28,767) (3,241,267)
Other operating expenses (670,917) (197,473) (679,150) (20,991) (1,568,531)
Depreciation and amortisation charge (104,979) (105,289) (179,079) (1,275) (390,622)
Allocation of grants relating to non-fi nancial assets and other 174 2,631 633 - 3,438
Impairment and gains on the disposal of non-current assets (19,596) 1,258 (62) 1 (18,399)
Other profi t or loss (5,589) 2,484 (8,933) 11,790 (248)
Operating income 318,000 128,538 618,742 (44,759) 1,020,521
Finance income 59,291 30,236 119,052 281,312 489,891
Finance costs (200,957) (77,664) (240,267) (283,749) (802,637)
Changes in the fair value of fi nancial instruments (460) 7 - (93) (546)
Exchange differences 12,957 1 12,243 18 25,219
Impairment and gains on the disposal of non-current assets (18,759) (244) 39,129 516,097 536,223
Financial profi t /loss (147,928) (47,664) (69,843) 513,585 248,150
Results of companies accounted for using the equity method 61,523 13,561 27,662 119,020 221,766
Profi t before tax 231,595 94,435 576,561 587,846 1,490,437
Corporate income tax (42,076) (18,991) (141,587) (14,556) (217,210)
Profi t for the year from continuing operations 189,519 75,444 434,974 573,290 1,273,227
Profi t after tax from discontinued operations - 81,650 - - 81,650
Profi t for the year 189,519 157,094 434,974 573,290 1,354,877
Profi t attributed to non-controlling interests (2,060) (4,309) (35,434) - (41,803)
Profi t from discontinued operations attributed to non-controlling interests - (517) - - (517)
Profi t attributable to the parent 187,459 152,268 399,540 573,290 1,312,557
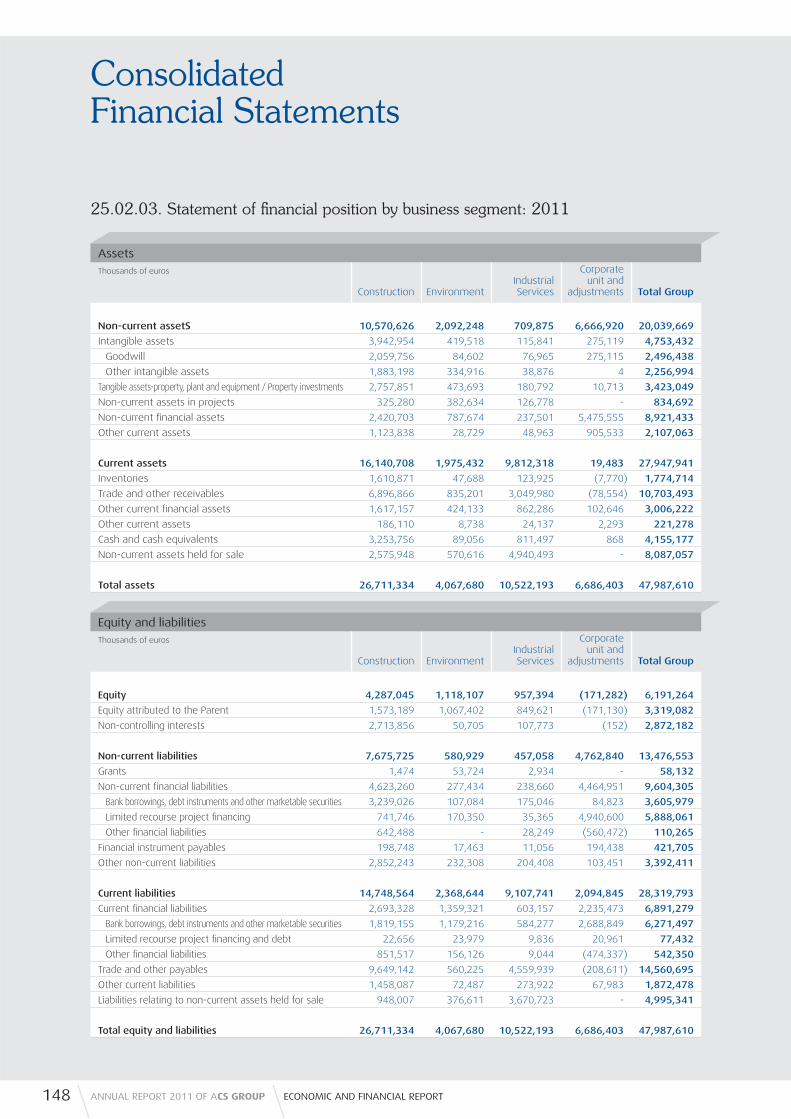
ConsolidatedFinancial Statements
25.02.03. Statement of fi nancial position by business segment: 2011
AssetsThousands of euros
Construction EnvironmentIndustrial Services
Corporate unit and
adjustments Total Group
Non-current assetS 10,570,626 2,092,248 709,875 6,666,920 20,039,669
Intangible assets 3,942,954 419,518 115,841 275,119 4,753,432
Goodwill 2,059,756 84,602 76,965 275,115 2,496,438
Other intangible assets 1,883,198 334,916 38,876 4 2,256,994
Tangible assets-property, plant and equipment / Property investments 2,757,851 473,693 180,792 10,713 3,423,049
Non-current assets in projects 325,280 382,634 126,778 - 834,692
Non-current fi nancial assets 2,420,703 787,674 237,501 5,475,555 8,921,433
Other current assets 1,123,838 28,729 48,963 905,533 2,107,063
Current assets 16,140,708 1,975,432 9,812,318 19,483 27,947,941
Inventories 1,610,871 47,688 123,925 (7,770) 1,774,714
Trade and other receivables 6,896,866 835,201 3,049,980 (78,554) 10,703,493
Other current fi nancial assets 1,617,157 424,133 862,286 102,646 3,006,222
Other current assets 186,110 8,738 24,137 2,293 221,278
Cash and cash equivalents 3,253,756 89,056 811,497 868 4,155,177
Non-current assets held for sale 2,575,948 570,616 4,940,493 - 8,087,057
Total assets 26,711,334 4,067,680 10,522,193 6,686,403 47,987,610
Equity and liabilitiesThousands of euros
Construction EnvironmentIndustrial Services
Corporate unit and
adjustments Total Group
Equity 4,287,045 1,118,107 957,394 (171,282) 6,191,264
Equity attributed to the Parent 1,573,189 1,067,402 849,621 (171,130) 3,319,082
Non-controlling interests 2,713,856 50,705 107,773 (152) 2,872,182
Non-current liabilities 7,675,725 580,929 457,058 4,762,840 13,476,553
Grants 1,474 53,724 2,934 - 58,132
Non-current fi nancial liabilities 4,623,260 277,434 238,660 4,464,951 9,604,305
Bank borrowings, debt instruments and other marketable securities 3,239,026 107,084 175,046 84,823 3,605,979
Limited recourse project fi nancing 741,746 170,350 35,365 4,940,600 5,888,061
Other fi nancial liabilities 642,488 - 28,249 (560,472) 110,265
Financial instrument payables 198,748 17,463 11,056 194,438 421,705
Other non-current liabilities 2,852,243 232,308 204,408 103,451 3,392,411
Current liabilities 14,748,564 2,368,644 9,107,741 2,094,845 28,319,793
Current fi nancial liabilities 2,693,328 1,359,321 603,157 2,235,473 6,891,279
Bank borrowings, debt instruments and other marketable securities 1,819,155 1,179,216 584,277 2,688,849 6,271,497
Limited recourse project fi nancing and debt 22,656 23,979 9,836 20,961 77,432
Other fi nancial liabilities 851,517 156,126 9,044 (474,337) 542,350
Trade and other payables 9,649,142 560,225 4,559,939 (208,611) 14,560,695
Other current liabilities 1,458,087 72,487 273,922 67,983 1,872,478
Liabilities relating to non-current assets held for sale 948,007 376,611 3,670,723 - 4,995,341
Total equity and liabilities 26,711,334 4,067,680 10,522,193 6,686,403 47,987,610
148 ANNUAL REPORT 2011 OF ACS GROUP ECONOMIC AND FINANCIAL REPORT

149CONSOLIDATED FINANCIAL STATEMENTS
25.02.04. Statement of fi nancial position by business segment: 2010
AssetsThousands of euros
Construction EnvironmentIndustrial Services
Corporate unit and
adjustments Total Group
Non-current assets 5,062,351 2,129,142 1,489,937 7,313,575 15,995,005
Intangible assets 812,053 420,336 106,229 275,114 1,613,732
Goodwill 681,588 127,938 64,734 275,114 1,149,374
Other intangible assets 130,465 292,398 41,495 - 464,358
Tangible assets-property, plant and equipment / Property investments 550,240 523,623 197,836 3,638 1,275,337
Non-current assets in projects 1,254,184 405,073 722,333 (1,304) 2,380,286
Non-current fi nancial assets 2,171,879 767,852 406,356 6,495,842 9,841,929
Other current assets 273,995 12,258 57,183 540,285 883,721
Current assets 5,553,425 1,902,853 9,175,356 1,557,888 18,189,522
Inventories 437,335 33,501 154,886 (7,697) 618,025
Trade and other receivables 2,634,007 1,185,014 3,045,661 74,557 6,939,239
Other current fi nancial assets 1,037,997 327,964 674,644 1,461,613 3,502,218
Other current assets 61,601 11,845 26,321 997 100,764
Cash and cash equivalents 1,382,485 112,897 928,770 28,418 2,452,570
Non-current assets held for sale - 231,632 4,345,074 - 4,576,706
Total assets 10,615,776 4,031,995 10,665,293 8,871,463 34,184,527
Equity and liabilitiesThousands of euros
Construction EnvironmentIndustrial Services
Corporate unit and
adjustments Total Group
Equity 1,121,562 1,075,838 1,011,476 1,233,510 4,442,386
Equity attributed to the Parent 1,067,451 1,009,839 867,590 1,233,667 4,178,547
Non-controlling interests 54,111 65,999 143,886 (157) 263,839
Non-current liabilities 3,125,647 1,365,467 712,863 5,567,028 10,771,005
Grants 6,334 52,613 11,002 - 69,949
Non-current fi nancial liabilities 2,654,168 1,110,134 504,862 5,352,030 9,621,194
Bank borrowings, debt instruments and other marketable securities 446,956 928,460 191,176 3,151,185 4,717,777
Limited recourse project fi nancing 1,788,134 181,266 300,490 2,590,216 4,860,106
Other fi nancial liabilities 419,078 408 13,196 (389,371) 43,311
Financial instrument payables 122,345 6,796 20,055 91,239 240,435
Other non-current liabilities 342,800 195,924 176,944 123,759 839,427
Current liabilities 6,368,567 1,590,690 8,940,954 2,070,925 18,971,136
Current fi nancial liabilities 987,495 518,982 578,047 2,252,211 4,336,735
Bank borrowings, debt instruments and other marketable securities 827,403 486,619 542,196 280,467 2,136,685
Limited recourse project fi nancing and debt 25,693 28,211 33,268 2,099,254 2,186,426
Other fi nancial liabilities 134,399 4,152 2,583 (127,510) 13,624
Trade and other payables 5,076,553 914,527 4,570,672 (407,015) 10,154,737
Other current liabilities 304,519 92,206 267,160 225,729 889,614
Liabilities relating to non-current assets held for sale - 64,975 3,525,075 - 3,590,050
Total equity and liabilities 10,615,776 4,031,995 10,665,293 8,871,463 34,184,527
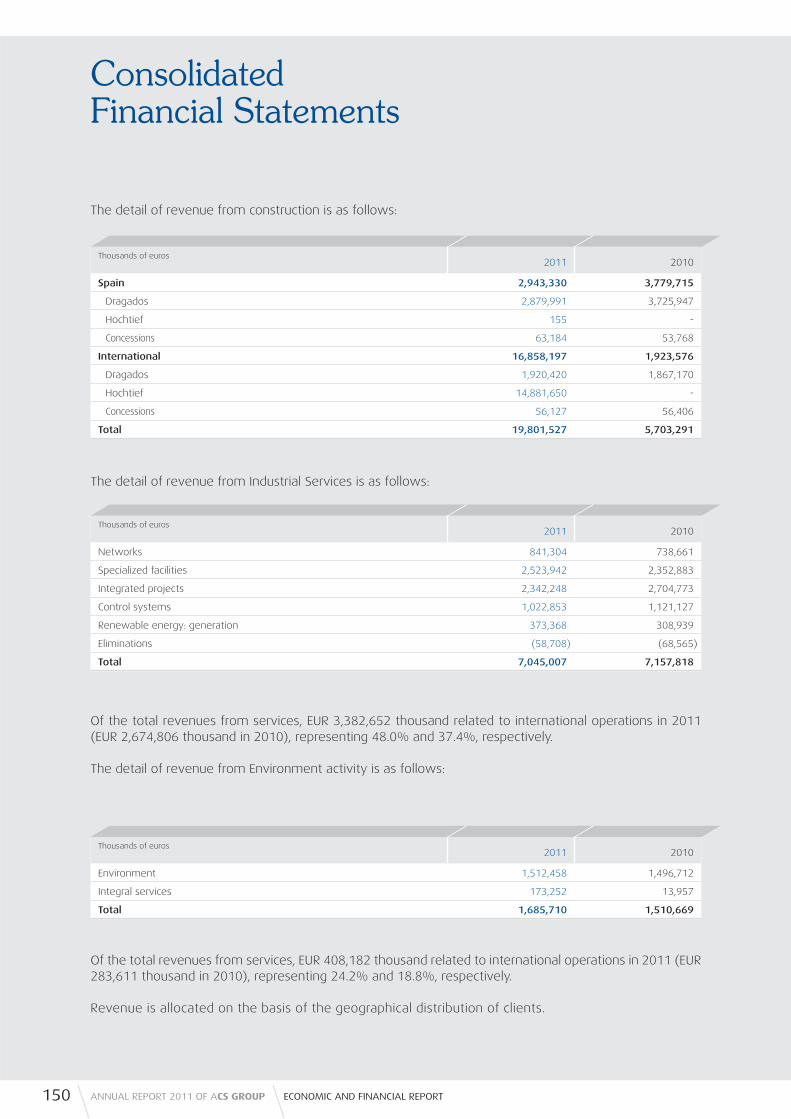
ConsolidatedFinancial Statements
The detail of revenue from construction is as follows:
The detail of revenue from Industrial Services is as follows:
Of the total revenues from services, EUR 3,382,652 thousand related to international operations in 2011 (EUR 2,674,806 thousand in 2010), representing 48.0% and 37.4%, respectively.
The detail of revenue from Environment activity is as follows:
Of the total revenues from services, EUR 408,182 thousand related to international operations in 2011 (EUR 283,611 thousand in 2010), representing 24.2% and 18.8%, respectively.
Revenue is allocated on the basis of the geographical distribution of clients.
150 ANNUAL REPORT 2011 OF ACS GROUP ECONOMIC AND FINANCIAL REPORT
Thousands of euros2011 2010
Spain 2,943,330 3,779,715
Dragados 2,879,991 3,725,947
Hochtief 155 -
Concessions 63,184 53,768
International 16,858,197 1,923,576
Dragados 1,920,420 1,867,170
Hochtief 14,881,650 -
Concessions 56,127 56,406
Total 19,801,527 5,703,291
Thousands of euros2011 2010
Networks 841,304 738,661
Specialized facilities 2,523,942 2,352,883
Integrated projects 2,342,248 2,704,773
Control systems 1,022,853 1,121,127
Renewable energy: generation 373,368 308,939
Eliminations (58,708) (68,565)
Total 7,045,007 7,157,818
Thousands of euros2011 2010
Environment 1,512,458 1,496,712
Integral services 173,252 13,957
Total 1,685,710 1,510,669

151CONSOLIDATED FINANCIAL STATEMENTS
The reconciliation of ordinary income by business segment to consolidated ordinary income at 31 December 2011 and 2010 is as follows:
The reconciliation of profi t/loss by Business segment with consolidated profi t/loss before taxes at 31 December 2011 and 2010 is as follows:
Net revenue by geographical area at 31 December 2011 and 2010 was as follows:
Thousands of euros
31/12/2011 31/12/2010
SegmentsExternal income
Inter-segment
incomeTotal
incomeExternal income
Inter-segment
incomeTotal
income
Construction 19,790,819 10,708 19,801,527 5,703,805 (514) 5,703,291
Environment 1,681,075 4,635 1,685,710 1,505,354 5,315 1,510,669
Industrial Services 6,999,989 45,018 7,045,007 7,111,488 46,330 7,157,818
Corporate unit - - - 7,858 - 7,858
(-) Adjustment and elimination of ordinary income between segments
- (60,361) (60,361) - (51,131) (51,131)
Total 28,471,883 - 28,471,883 14,328,505 - 14,328,505
Thousands of euros 31/12/2011 31/12/2010
Segments
Construction 474,426 189,519
Environment 132,713 157,094
Industrial Services 529,363 434,974
Total profi t for reported segments 1,136,502 781,587
(+/-) Non-assigned profi t (28,034) 572,773
(+/-) Elimination of internal profi t (between segments) - -
(+/-) Other profi t or loss - -
(+/-) Income tax and/or profi t from discontinued operations 135,433 136,077
Profi t before tax 1,243,901 1,490,437
Revenue by geographical area
Thousands of euros31/12/2011 31/12/2010
Domestic market 7,822,852 9,446,512
Foreign market 20,649,031 4,881,993
a) European Union 3,265,180 1,181,298
b) OECD countries 13,861,025 2,139,200
c) Other countries 3,522,826 1,561,495
Total 28,471,883 14,328,505

ConsolidatedFinancial Statements
Inter-segment sales are made on an arm´s length basis at market prices.
The breakdown of certain of the Group’s consolidated balances based on the geographical location of the companies that gave rise to them is as follows:
The additions to non-current assets, by line of business, were as follows:
26. Tax matters
26.01. Consolidated tax group
Pursuant to current legislation, ACS, Actividades de Construcción y Servicios, S.A. is the Parent of the Tax Group 30/99, which includes the Spanish subsidiaries in which the Parent has a direct or indirect ownership interest of at least 75% which meet the requirements provided for in Spanish legislation regulating the tax consolidation regime.
The Group’s other subsidiaries fi le individual tax returns in accordance with the tax legislation in force in each country.
26.02. Tax Audit
In 2010 the tax audit being performed on the consolidated companies included in Tax Group 30/99 by the Spanish tax authorities in relation to Corporation tax for the years 2003 and 2005 as well as the other taxes applicable to the ACS Group companies was completed, the total effect being recognised in the fi nancial statements for 2010. An audit on the years 2006 to 2011 is still pending in relation to consolidated income tax for the Tax Group 30/99.
152 ANNUAL REPORT 2011 OF ACS GROUP ECONOMIC AND FINANCIAL REPORT
Thousands of euros Spain Rest of the world
2011 2010 2011 2010
Revenue 7,822,852 9,446,512 20,649,031 4,881,993
Segment assets 25,953,620 27,633,874 22,033,990 6,550,653
Total net investments 523,422 2,055,185 2,378,437 269,176
Thousands of euros2011 2010
Construction 1,365,396 665,800
Environment 92,052 185,297
Industrial Services 1,148,096 1,246,293
Corporate unit and adjustments 7 1,220
Total 2,605,551 2,098,610
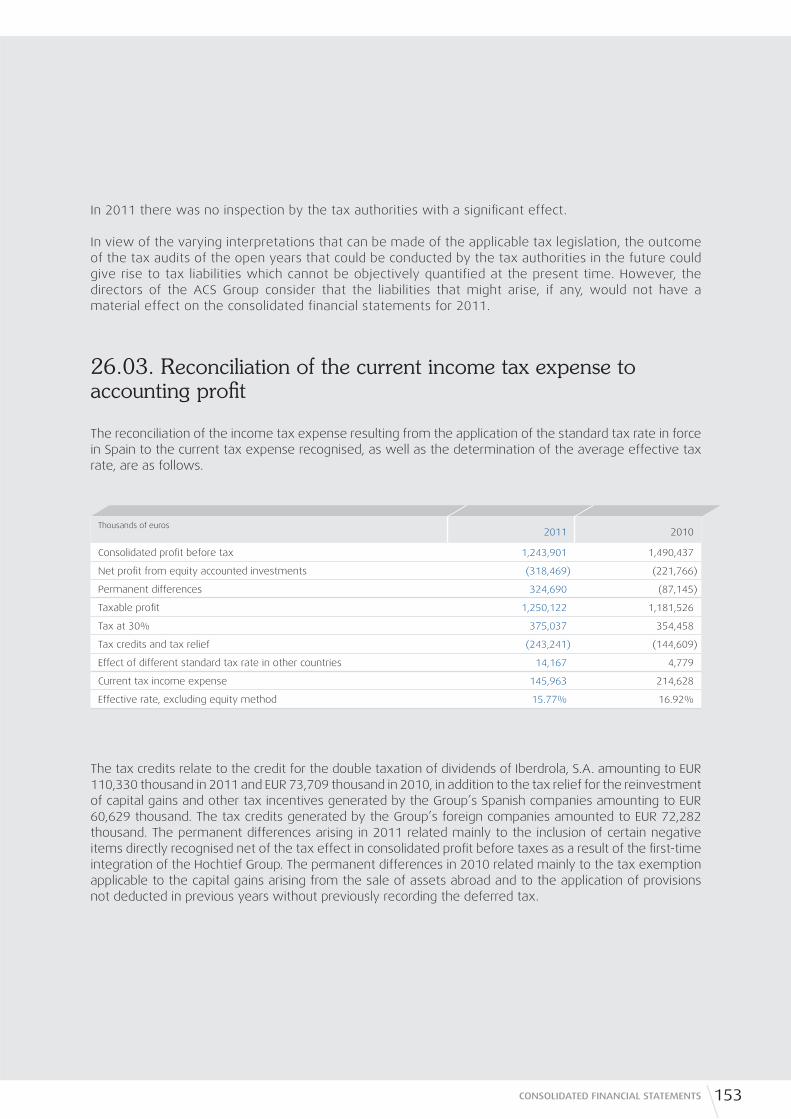
153CONSOLIDATED FINANCIAL STATEMENTS
In 2011 there was no inspection by the tax authorities with a signifi cant effect.
In view of the varying interpretations that can be made of the applicable tax legislation, the outcome of the tax audits of the open years that could be conducted by the tax authorities in the future could give rise to tax liabilities which cannot be objectively quantified at the present time. However, the directors of the ACS Group consider that the liabilities that might arise, if any, would not have a material effect on the consolidated financial statements for 2011.
26.03. Reconciliation of the current income tax expense to accounting profi t
The reconciliation of the income tax expense resulting from the application of the standard tax rate in force in Spain to the current tax expense recognised, as well as the determination of the average effective tax rate, are as follows.
The tax credits relate to the credit for the double taxation of dividends of Iberdrola, S.A. amounting to EUR 110,330 thousand in 2011 and EUR 73,709 thousand in 2010, in addition to the tax relief for the reinvestment of capital gains and other tax incentives generated by the Group’s Spanish companies amounting to EUR 60,629 thousand. The tax credits generated by the Group’s foreign companies amounted to EUR 72,282 thousand. The permanent differences arising in 2011 related mainly to the inclusion of certain negative items directly recognised net of the tax effect in consolidated profi t before taxes as a result of the fi rst-time integration of the Hochtief Group. The permanent differences in 2010 related mainly to the tax exemption applicable to the capital gains arising from the sale of assets abroad and to the application of provisions not deducted in previous years without previously recording the deferred tax.
Thousands of euros2011 2010
Consolidated profi t before tax 1,243,901 1,490,437
Net profi t from equity accounted investments (318,469) (221,766)
Permanent differences 324,690 (87,145)
Taxable profi t 1,250,122 1,181,526
Tax at 30% 375,037 354,458
Tax credits and tax relief (243,241) (144,609)
Effect of different standard tax rate in other countries 14,167 4,779
Current tax income expense 145,963 214,628
Effective rate, excluding equity method 15.77% 16.92%
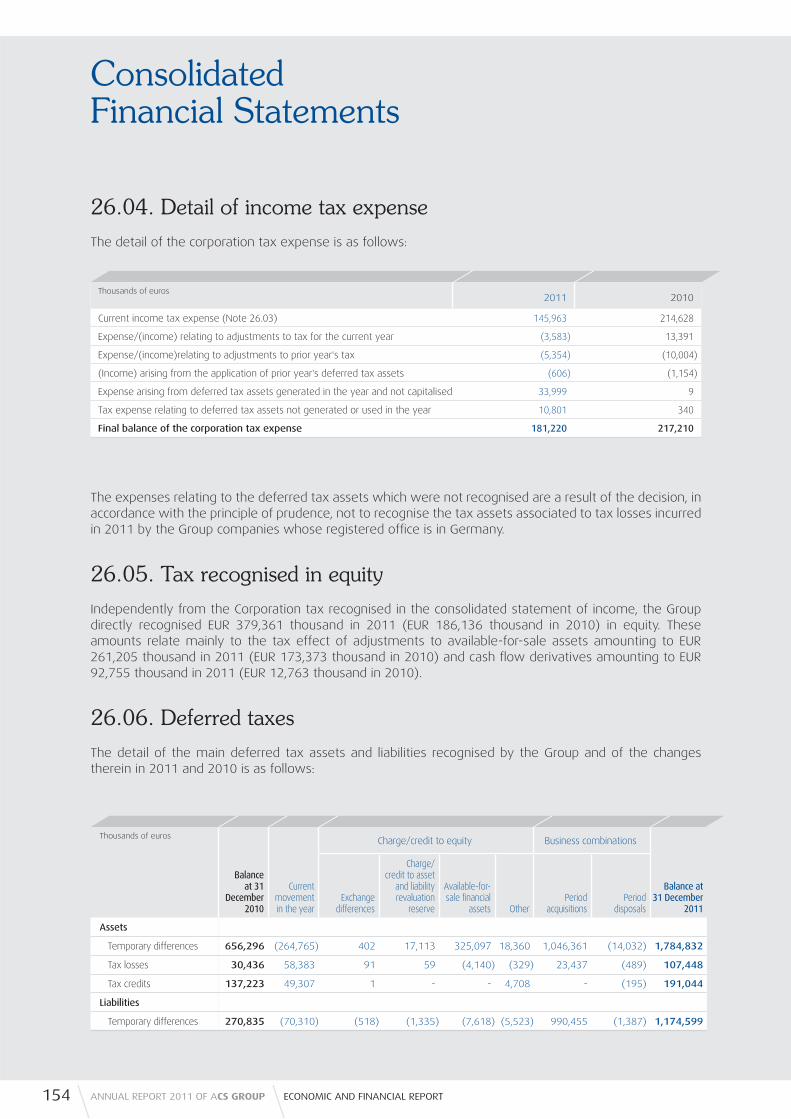
ConsolidatedFinancial Statements
26.04. Detail of income tax expense
The detail of the corporation tax expense is as follows:
The expenses relating to the deferred tax assets which were not recognised are a result of the decision, in accordance with the principle of prudence, not to recognise the tax assets associated to tax losses incurred in 2011 by the Group companies whose registered offi ce is in Germany.
26.05. Tax recognised in equity
Independently from the Corporation tax recognised in the consolidated statement of income, the Group directly recognised EUR 379,361 thousand in 2011 (EUR 186,136 thousand in 2010) in equity. These amounts relate mainly to the tax effect of adjustments to available-for-sale assets amounting to EUR 261,205 thousand in 2011 (EUR 173,373 thousand in 2010) and cash fl ow derivatives amounting to EUR 92,755 thousand in 2011 (EUR 12,763 thousand in 2010).
26.06. Deferred taxes
The detail of the main deferred tax assets and liabilities recognised by the Group and of the changes therein in 2011 and 2010 is as follows:
154 ANNUAL REPORT 2011 OF ACS GROUP ECONOMIC AND FINANCIAL REPORT
Thousands of euros2011 2010
Current income tax expense (Note 26.03) 145,963 214,628
Expense/(income) relating to adjustments to tax for the current year (3,583) 13,391
Expense/(income)relating to adjustments to prior year's tax (5,354) (10,004)
(Income) arising from the application of prior year's deferred tax assets (606) (1,154)
Expense arising from deferred tax assets generated in the year and not capitalised 33,999 9
Tax expense relating to deferred tax assets not generated or used in the year 10,801 340
Final balance of the corporation tax expense 181,220 217,210
Thousands of euros Charge/credit to equity Business combinations
Balance at 31
December 2010
Current movement in the year
Exchange differences
Charge/credit to asset
and liability revaluation
reserve
Available-for-sale fi nancial
assets OtherPeriod
acquisitionsPeriod
disposals
Balance at 31 December
2011
Assets
Temporary differences 656,296 (264,765) 402 17,113 325,097 18,360 1,046,361 (14,032) 1,784,832
Tax losses 30,436 58,383 91 59 (4,140) (329) 23,437 (489) 107,448
Tax credits 137,223 49,307 1 - - 4,708 - (195) 191,044
Liabilities
Temporary differences 270,835 (70,310) (518) (1,335) (7,618) (5,523) 990,455 (1,387) 1,174,599
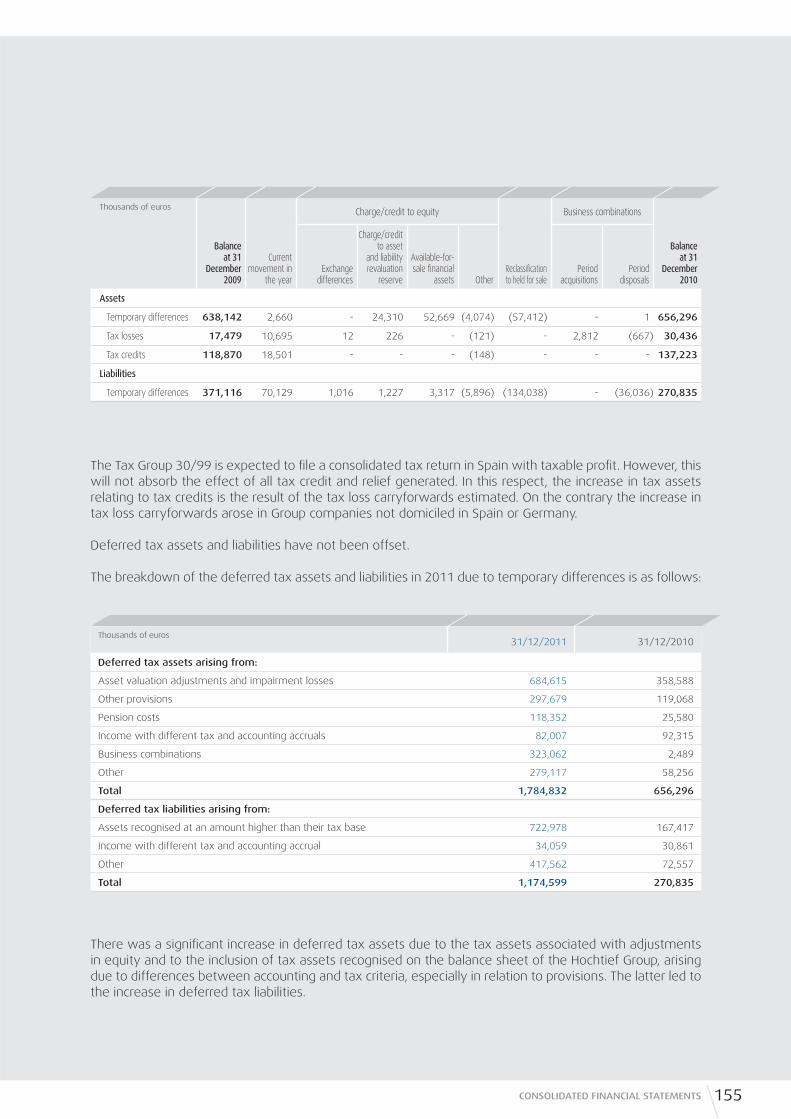
155CONSOLIDATED FINANCIAL STATEMENTS
The Tax Group 30/99 is expected to fi le a consolidated tax return in Spain with taxable profi t. However, this will not absorb the effect of all tax credit and relief generated. In this respect, the increase in tax assets relating to tax credits is the result of the tax loss carryforwards estimated. On the contrary the increase in tax loss carryforwards arose in Group companies not domiciled in Spain or Germany.
Deferred tax assets and liabilities have not been offset.
The breakdown of the deferred tax assets and liabilities in 2011 due to temporary differences is as follows:
There was a signifi cant increase in deferred tax assets due to the tax assets associated with adjustments in equity and to the inclusion of tax assets recognised on the balance sheet of the Hochtief Group, arising due to differences between accounting and tax criteria, especially in relation to provisions. The latter led to the increase in deferred tax liabilities.
Thousands of euros Charge/credit to equity Business combinations
Balance at 31
December 2009
Current movement in
the yearExchange
differences
Charge/credit to asset
and liability revaluation
reserve
Available-for-sale fi nancial
assets OtherReclassifi cation to held for sale
Period acquisitions
Period disposals
Balance at 31
December 2010
Assets
Temporary differences 638,142 2,660 - 24,310 52,669 (4,074) (57,412) - 1 656,296
Tax losses 17,479 10,695 12 226 - (121) - 2,812 (667) 30,436
Tax credits 118,870 18,501 - - - (148) - - - 137,223
Liabilities
Temporary differences 371,116 70,129 1,016 1,227 3,317 (5,896) (134,038) - (36,036) 270,835
Thousands of euros31/12/2011 31/12/2010
Deferred tax assets arising from:
Asset valuation adjustments and impairment losses 684,615 358,588
Other provisions 297,679 119,068
Pension costs 118,352 25,580
Income with different tax and accounting accruals 82,007 92,315
Business combinations 323,062 2,489
Other 279,117 58,256
Total 1,784,832 656,296
Deferred tax liabilities arising from:
Assets recognised at an amount higher than their tax base 722,978 167,417
Income with different tax and accounting accrual 34,059 30,861
Other 417,562 72,557
Total 1,174,599 270,835

ConsolidatedFinancial Statements
In addition to the amounts recognised on the asset side of the statement of fi nancial position, as detailed above, the Group has other deferred tax assets and tax loss and tax credit carryforwards not recognised on the asset side of the statement of fi nancial position because it is impossible to predict the related future fl ows of profi t, which are signifi cant in the Group companies domiciled in Germany. Therefore the tax assets relating to income tax loss carryforwards amounting to EUR 833,521 thousand, and to municipal taxes amounting to EUR 1,044,718 thousand were not recognised.
27. RevenueThe distribution of revenue relating to the Group’s ordinary operations, by business segment, is as follows:
In 2011 foreign currency transactions relating to sales and services amounted to EUR 16,552,597 thousand (EUR 1,293,323 thousand in 2010) and those relating to purchases and services received amounted to EUR 1,364,559 thousand (EUR 934,176 thousand in 2010).
The distribution of revenue relating to the Group’s ordinary operations, by the main countries where it operates, excluding the domestic market, is as follows:
Revenue by country
Thousands of euros2011 2010
Australia 7,291,262 19,728
USA 4,919,673 923,911
Germany 1,392,950 2,926
Mexico 1,094,552 1,035,126
Indonesia 603,707 -
Poland 602,098 459,045
Brazil 485,378 397,066
Portugal 424,877 349,409
China 398,476 14,426
United Arab Emirates 313,845 31,112
Canada 308,701 158,385
Other 2,813,512 1,490,859
Total 20,649,031 4,881,993
156 ANNUAL REPORT 2011 OF ACS GROUP ECONOMIC AND FINANCIAL REPORT
Thousands of euros2011 2010
Construction 19,801,527 5,703,291
Industrial Services 7,045,007 7,157,818
Environment 1,685,710 1,510,669
Corporate unit and other (60,361) (43,273)
Total 28,471,883 14,328,505
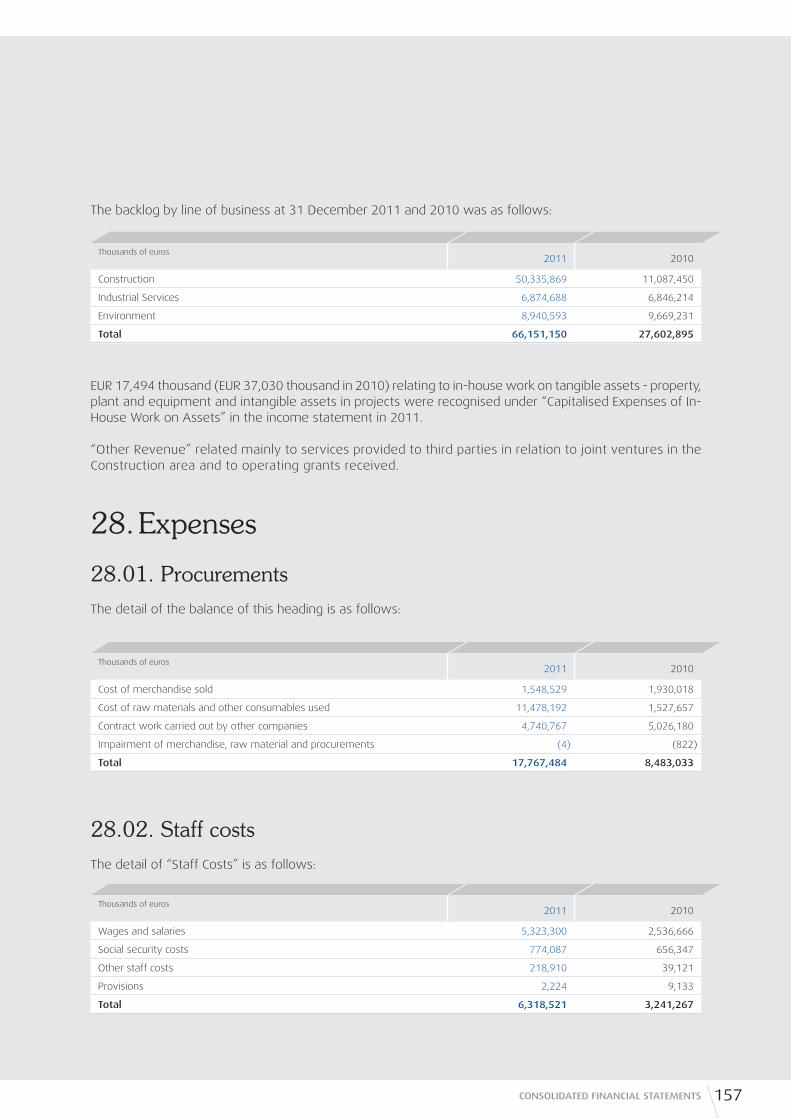
157CONSOLIDATED FINANCIAL STATEMENTS
The backlog by line of business at 31 December 2011 and 2010 was as follows:
EUR 17,494 thousand (EUR 37,030 thousand in 2010) relating to in-house work on tangible assets - property, plant and equipment and intangible assets in projects were recognised under “Capitalised Expenses of In-House Work on Assets” in the income statement in 2011.
“Other Revenue” related mainly to services provided to third parties in relation to joint ventures in the Construction area and to operating grants received.
28. Expenses
28.01. Procurements
The detail of the balance of this heading is as follows:
28.02. Staff costs
The detail of “Staff Costs” is as follows:
Thousands of euros2011 2010
Construction 50,335,869 11,087,450
Industrial Services 6,874,688 6,846,214
Environment 8,940,593 9,669,231
Total 66,151,150 27,602,895
Thousands of euros2011 2010
Cost of merchandise sold 1,548,529 1,930,018
Cost of raw materials and other consumables used 11,478,192 1,527,657
Contract work carried out by other companies 4,740,767 5,026,180
Impairment of merchandise, raw material and procurements (4) (822)
Total 17,767,484 8,483,033
Thousands of euros2011 2010
Wages and salaries 5,323,300 2,536,666
Social security costs 774,087 656,347
Other staff costs 218,910 39,121
Provisions 2,224 9,133
Total 6,318,521 3,241,267

ConsolidatedFinancial Statements
Staff costs amounting to EUR 8,709 thousand in 2011 and EUR 6,177 thousand in 2010 relating to the ACS, Actividades de Construcción y Servicios, S.A. stock option plans were charged to profi t and loss and are recognised under “Wages and Salaries”.
The average number of employees at Group companies in 2011 was 164,923 (90,877 employees in 2010).
The detail of the average number of employees, by professional category and sex is as follows:
The distribution of the average number of employees, by line of business, was as follows:
28.03. Share-based payment systems
A total of 2,720,000 stock options relating to the 2004 Plan 2004 were exercised in 2010 at an exercise price of 13.91 euros per share, with an average weighted market price of 34.68 euros per share. In 2010 these options were fully exercised.
The stock options relating to the 2005 Plan (extension of 2004 Plan 2004), have an exercise price of 24.10 euros per share. A total of 795,632 stock options relating to this plan were exercised in 2010 with a weighted average market price of 35.24 euros per share. There were a total of 3,918,525 options which had no yet been exercised at the end of 2010. All 2005 Plan stock options which had not yet been exercised were exercised in the fi rst quarter of 2011 with an average weighted market price for all benefi ciaries of 34.06 euros per share.
Category Average number of employees at 31/12/2011 Average number of employees at 31/12/2010
Men Women Total Men Women Total
University graduates 21,538 5,985 27,523 5,254 1,657 6,911
Junior college graduates 7,355 2,043 9,398 4,172 1,091 5,263
Non-graduate line personnel 17,111 2,843 19,954 8,212 1,268 9,480
Clerical personnel 4,259 5,128 9,387 2,229 2,681 4,910
Other staff 91,177 7,484 98,661 59,543 4,780 64,323
Total 141,440 23,483 164,923 79,410 11,477 90,887
158 ANNUAL REPORT 2011 OF ACS GROUP ECONOMIC AND FINANCIAL REPORT
Number of employees2011 2010
Construction 91,957 19,288
Industrial Services 42,044 40,630
Environment 30,865 30,915
Corporate Unit and Other 57 54
Total 164,923 90,887
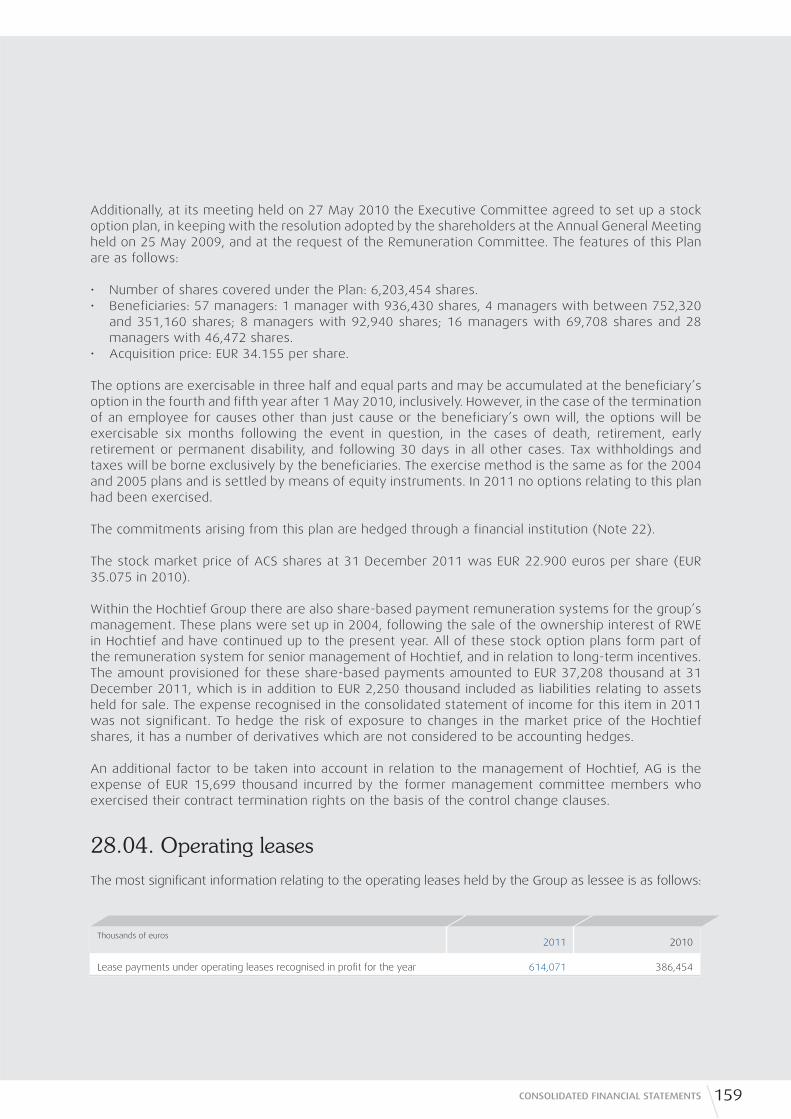
159CONSOLIDATED FINANCIAL STATEMENTS
Additionally, at its meeting held on 27 May 2010 the Executive Committee agreed to set up a stock option plan, in keeping with the resolution adopted by the shareholders at the Annual General Meeting held on 25 May 2009, and at the request of the Remuneration Committee. The features of this Plan are as follows:
• Number of shares covered under the Plan: 6,203,454 shares.• Beneficiaries: 57 managers: 1 manager with 936,430 shares, 4 managers with between 752,320
and 351,160 shares; 8 managers with 92,940 shares; 16 managers with 69,708 shares and 28 managers with 46,472 shares.
• Acquisition price: EUR 34.155 per share.
The options are exercisable in three half and equal parts and may be accumulated at the beneficiary’s option in the fourth and fifth year after 1 May 2010, inclusively. However, in the case of the termination of an employee for causes other than just cause or the beneficiary’s own will, the options will be exercisable six months following the event in question, in the cases of death, retirement, early retirement or permanent disability, and following 30 days in all other cases. Tax withholdings and taxes will be borne exclusively by the beneficiaries. The exercise method is the same as for the 2004 and 2005 plans and is settled by means of equity instruments. In 2011 no options relating to this plan had been exercised.
The commitments arising from this plan are hedged through a financial institution (Note 22).
The stock market price of ACS shares at 31 December 2011 was EUR 22.900 euros per share (EUR 35.075 in 2010).
Within the Hochtief Group there are also share-based payment remuneration systems for the group’s management. These plans were set up in 2004, following the sale of the ownership interest of RWE in Hochtief and have continued up to the present year. All of these stock option plans form part of the remuneration system for senior management of Hochtief, and in relation to long-term incentives. The amount provisioned for these share-based payments amounted to EUR 37,208 thousand at 31 December 2011, which is in addition to EUR 2,250 thousand included as liabilities relating to assets held for sale. The expense recognised in the consolidated statement of income for this item in 2011 was not significant. To hedge the risk of exposure to changes in the market price of the Hochtief shares, it has a number of derivatives which are not considered to be accounting hedges.
An additional factor to be taken into account in relation to the management of Hochtief, AG is the expense of EUR 15,699 thousand incurred by the former management committee members who exercised their contract termination rights on the basis of the control change clauses.
28.04. Operating leases
The most signifi cant information relating to the operating leases held by the Group as lessee is as follows:
Thousands of euros2011 2010
Lease payments under operating leases recognised in profi t for the year 614,071 386,454

ConsolidatedFinancial Statements
At the end of the reporting period, the Group had outstanding commitments for future minimum lease payments under non-cancellable operating leases, which fall due as follows:
The Group has no material operating leases as lessor.
28.05. Changes in the fair value of fi nancial instruments
This heading includes the effect on the income statement of derivative instruments which do not meet the effi ciency criteria provided in IAS 39, or which are not hedging instruments. The most signifi cant effect in 2011 is a result of the derivative valuation of the ACS Group’s 2010 stock option plan and the market valuation of certain derivatives amounting to EUR 78,112 thousand. In 2010 this heading included the negative effect of the fair value measurement of the derivative relating to stock option plans which were partially offset by the fair value measurements of the equity swaps of Hochtief AG and of the derivative relating to the “prepaid forward share” of Iberdrola.
28.06. Finance income
The balance of fi nance income includes the dividends of Iberdrola, S.A. amounting to EUR 373,099 thousand (EUR 245,702 thousand in 2010) net of the adjustment made of EUR 179, 657 on the basis of the prudence principle to neutralise the net contribution of this company to the profi t or loss for the year.
29. Impairment and gains or losses on the disposal of fi nancial instrumentsIn 2011, noteworthy were the net capital gains arising from the sale of certain concessions such as the Vespucio Norte Express highway and the Tunnel of San Cristóbal in Chile for EUR 156,988 thousand, certain renewable energy assets, the sale of certain transmission lines in Brazil, the capital gains on the sale of concession assets (mainly the I-595 highway for EUR 51,870 thousand), as well as the gains on the sales of ownership interests in logistics and other environmental businesses. Also included under this heading are the provisions made in relation to certain concession assets amounting to EUR 57,200 thousand.
In the period ended 31 December 2010 noteworthy were the gains on the sale of Abertis Infraestructuras, S.A. amounting to EUR 519,977 thousand, the sale of ownership interests in different Brazilian concession companies of a total of eight power transmission lines for a combined EUR 38,799 thousand and the sale
160 ANNUAL REPORT 2011 OF ACS GROUP ECONOMIC AND FINANCIAL REPORT
Thousands of euros2011 2010
Within one year 393,992 32,854
Between two and fi ve years 838,358 61,148
Over fi ve years 237,260 40,454
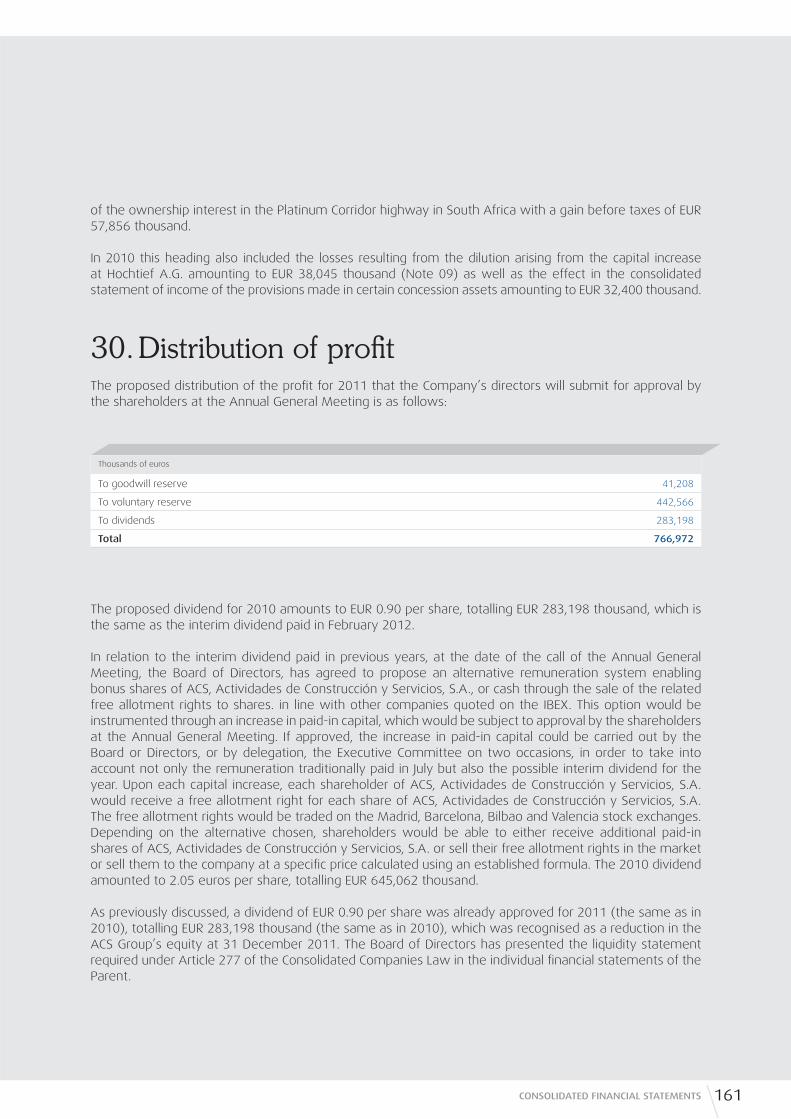
161CONSOLIDATED FINANCIAL STATEMENTS
of the ownership interest in the Platinum Corridor highway in South Africa with a gain before taxes of EUR 57,856 thousand.
In 2010 this heading also included the losses resulting from the dilution arising from the capital increase at Hochtief A.G. amounting to EUR 38,045 thousand (Note 09) as well as the effect in the consolidated statement of income of the provisions made in certain concession assets amounting to EUR 32,400 thousand.
30. Distribution of profi tThe proposed distribution of the profi t for 2011 that the Company’s directors will submit for approval by the shareholders at the Annual General Meeting is as follows:
The proposed dividend for 2010 amounts to EUR 0.90 per share, totalling EUR 283,198 thousand, which is the same as the interim dividend paid in February 2012.
In relation to the interim dividend paid in previous years, at the date of the call of the Annual General Meeting, the Board of Directors, has agreed to propose an alternative remuneration system enabling bonus shares of ACS, Actividades de Construcción y Servicios, S.A., or cash through the sale of the related free allotment rights to shares. in line with other companies quoted on the IBEX. This option would be instrumented through an increase in paid-in capital, which would be subject to approval by the shareholders at the Annual General Meeting. If approved, the increase in paid-in capital could be carried out by the Board or Directors, or by delegation, the Executive Committee on two occasions, in order to take into account not only the remuneration traditionally paid in July but also the possible interim dividend for the year. Upon each capital increase, each shareholder of ACS, Actividades de Construcción y Servicios, S.A. would receive a free allotment right for each share of ACS, Actividades de Construcción y Servicios, S.A. The free allotment rights would be traded on the Madrid, Barcelona, Bilbao and Valencia stock exchanges. Depending on the alternative chosen, shareholders would be able to either receive additional paid-in shares of ACS, Actividades de Construcción y Servicios, S.A. or sell their free allotment rights in the market or sell them to the company at a specifi c price calculated using an established formula. The 2010 dividend amounted to 2.05 euros per share, totalling EUR 645,062 thousand.
As previously discussed, a dividend of EUR 0.90 per share was already approved for 2011 (the same as in 2010), totalling EUR 283,198 thousand (the same as in 2010), which was recognised as a reduction in the ACS Group’s equity at 31 December 2011. The Board of Directors has presented the liquidity statement required under Article 277 of the Consolidated Companies Law in the individual fi nancial statements of the Parent.
Thousands of euros
To goodwill reserve 41,208
To voluntary reserve 442,566
To dividends 283,198
Total 766,972

ConsolidatedFinancial Statements
31. Earnings per share
31.01. Basic earnings per share
Basic earnings per share are calculated by dividing the net profi t attributed to the Group by the weighted average number of ordinary shares outstanding during the year, excluding the average number of treasury shares held in the year.
Accordingly:
31.02. Diluted earnings per share
The diluted earnings per share were the same as basic earnings per share. At 31 December 2011 and 2010, the ACS Group had no ordinary shares that could potentially be diluted since no convertible debt had been issued and as stipulated in Note 28.03, the share based payments would not involve an increase in capital for the Group given the manner in which they operate. Therefore, in no case would exercising share options lead to diluted earnings.
32. Events after the reporting periodOn 9 February 2012 ACS Actividades de Construcción y Servicios, S. A. entered into a contract with a syndicate of banks, composed of 32 Spanish and foreign entities, for the refi nancing of the syndicated loan which now matures in July 2015. The amount contracted amounted to EUR 1,377 million, which could be increased until May 2012, to EUR 1,650 million. This contract was already adhered to by four banks for EUR 1,411 million at the date of the presentation of these consolidated fi nancial statements.
On 8 March 2012, the ACS Group sold an ownership interest of 23.5% of Clece S.A. to various funds managed by Mercapital, to which it has also granted the option to buy the remaining capital. Following this date control of Clece is to be exercised jointly by the acquiring funds and by ACS, and the company is to be accounted for using the equity method rather than being fully consolidated. The purchase price was EUR 80 million, which represents a total enterprise value of EUR 505.7 million (Note 03.09).
On 19 March 2012, Hochtief, A. G. issued a corporate bond amounting to EUR 500 million maturing in fi ve years and with a coupon of 5.50% per annum.
162 ANNUAL REPORT 2011 OF ACS GROUP ECONOMIC AND FINANCIAL REPORT
31/12/2011 31/12/2010 Variación (%)
Net profi t for year (Thousands of Euros) 961,940 1,312,557 (26.71)
Weighted average number of shares outstanding 296,612,696 299,368,861 (0.92)
Basic earnings per share (Euros) 3.24 4.38 (26.03)
Profi t after tax and non-controlling interests of discontinued operations (Thousands of Euros) 45,787 81,133 (43.57)
Basic earnings per share (Euros) 0.15 0.27 (44.44)
Basic earnings per share from discontinued operations (Euros) 3.09 4.11 (24.82)
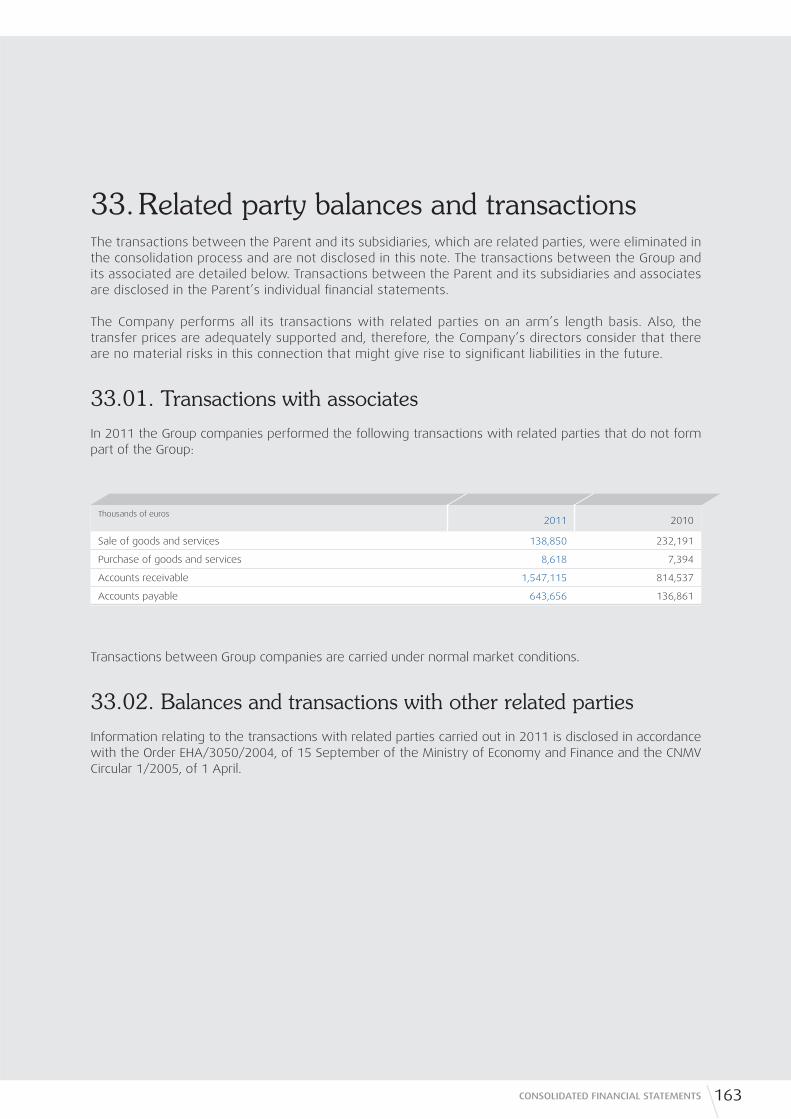
163CONSOLIDATED FINANCIAL STATEMENTS
33. Related party balances and transactionsThe transactions between the Parent and its subsidiaries, which are related parties, were eliminated in the consolidation process and are not disclosed in this note. The transactions between the Group and its associated are detailed below. Transactions between the Parent and its subsidiaries and associates are disclosed in the Parent’s individual fi nancial statements.
The Company performs all its transactions with related parties on an arm’s length basis. Also, the transfer prices are adequately supported and, therefore, the Company’s directors consider that there are no material risks in this connection that might give rise to signifi cant liabilities in the future.
33.01. Transactions with associates
In 2011 the Group companies performed the following transactions with related parties that do not form part of the Group:
Transactions between Group companies are carried under normal market conditions.
33.02. Balances and transactions with other related parties
Information relating to the transactions with related parties carried out in 2011 is disclosed in accordance with the Order EHA/3050/2004, of 15 September of the Ministry of Economy and Finance and the CNMV Circular 1/2005, of 1 April.
Thousands of euros2011 2010
Sale of goods and services 138,850 232,191
Purchase of goods and services 8,618 7,394
Accounts receivable 1,547,115 814,537
Accounts payable 643,656 136,861
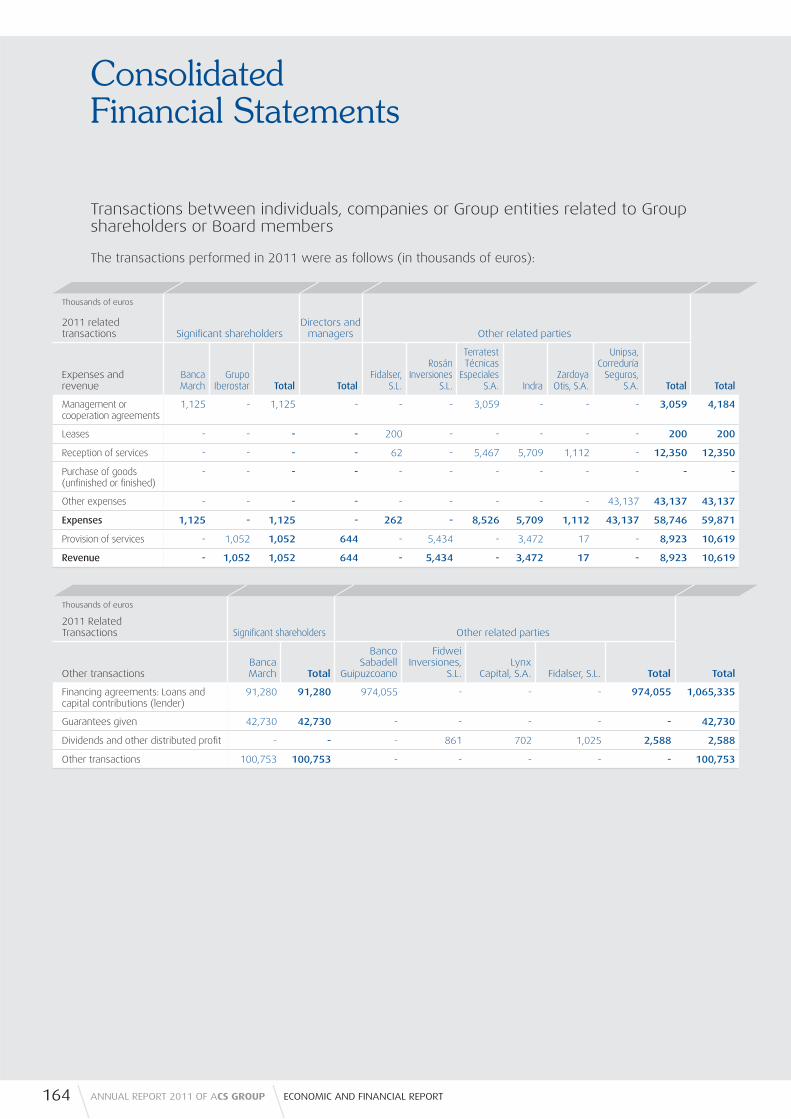
ConsolidatedFinancial Statements
Transactions between individuals, companies or Group entities related to Group shareholders or Board members
The transactions performed in 2011 were as follows (in thousands of euros):
164 ANNUAL REPORT 2011 OF ACS GROUP ECONOMIC AND FINANCIAL REPORT
Thousands of euros
2011 related transactions Signifi cant shareholders
Directors andmanagers Other related parties
Expenses and revenue
Banca March
Grupo Iberostar Total Total
Fidalser, S.L.
Rosán Inversiones
S.L.
Terratest Técnicas
Especiales S.A. Indra
Zardoya Otis, S.A.
Unipsa, Correduría
Seguros, S.A. Total Total
Management or cooperation agreements
1,125 - 1,125 - - - 3,059 - - - 3,059 4,184
Leases - - - - 200 - - - - - 200 200
Reception of services - - - - 62 - 5,467 5,709 1,112 - 12,350 12,350
Purchase of goods (unfi nished or fi nished)
- - - - - - - - - - - -
Other expenses - - - - - - - - - 43,137 43,137 43,137
Expenses 1,125 - 1,125 - 262 - 8,526 5,709 1,112 43,137 58,746 59,871
Provision of services - 1,052 1,052 644 - 5,434 - 3,472 17 - 8,923 10,619
Revenue - 1,052 1,052 644 - 5,434 - 3,472 17 - 8,923 10,619
Thousands of euros
2011 Related Transactions Signifi cant shareholders Other related parties
Other transactionsBanca March Total
Banco Sabadell
Guipuzcoano
Fidwei Inversiones,
S.L.Lynx
Capital, S.A. Fidalser, S.L. Total Total
Financing agreements: Loans and capital contributions (lender)
91,280 91,280 974,055 - - - 974,055 1,065,335
Guarantees given 42,730 42,730 - - - - - 42,730
Dividends and other distributed profi t - - - 861 702 1,025 2,588 2,588
Other transactions 100,753 100,753 - - - - - 100,753

165CONSOLIDATED FINANCIAL STATEMENTS
The transactions performed in 2010 were as follows (in thousands of euros):
At 31 December 2011, the outstanding balance payable to Banca March for credit facilities and loans granted to ACS Group companies amounted to EUR 53,722 thousands (EUR 75,398 thousand in 2010). The transactions being maintained at 31 December 2011, in accordance with the information available to ACS Group companies amounted to EUR 24,770 thousand (EUR 45,277 thousand at 31 December 2010) of guarantees, EUR 29,230 thousand(EUR 59,504 thousand at 31 December 2010) of confi rming transactions to suppliers and EUR 756 thousand at 31 December 2010 for factoring transactions.
At 31 December 2011. the balance payable to Banco Sabadell Guipuzcoano amounted to EUR 477,036 (64,007 thousand in 2010) for loans and credit facilities granted to ACS Group companies. The transactions being maintained at 31 December 2011, in accordance with the information available to ACS Group companies amounted to EUR 191,600 thousand (EUR 85,486 thousand at 31 December 2010) of guarantees, EUR 634thousand(EUR 8,864 thousand at 31 December 2010) of confi rming transactions to suppliers and EUR 21,825 thousand at 31 December 2010 for factoring transactions.
Thousands of euros
2010 Related transactions Signifi cant shareholders
Directors and managers Other related parties
Expenses and revenue
Alba participacio-
nes, S.A.
Inversiones Vesán,
S.A.
Rosán Inversio-nes, S.L.
Grupo Iberostar Total Total
Fidalser, S.L.
Terratest Técnicas
Especiales, S.A. Indra
Zardoya Otis, S.A.
Unipsa Correduría de Seguros, S.A. Geblasa Total Total
Management or cooperation agreements
- - - - - - - 3,806 - - - - 3,806 3,806
Leases - - - - - - 302 - - - - - 302 302
Reception of services - - - 8 8 - 50 1,548 2,999 1,762 - - 6,359 6,367
Purchase of goods (unfi nished or fi nished)
- - - - - - - - - - - 8 8 8
Other expenses 15,291 2,885 - 2,860 21,036 - - - - - 52,835 - 52,835 73,871
Expenses 15,291 2,885 - 2,868 21,044 - 352 5,354 2,999 1,762 52,835 8 63,310 84,354
Provision of services - - 428 1,019 1,447 10 - - 1,453 - - - 1,453 2,910
Revenue - - 428 1.019 1.447 10 - - 1.453 - - - 1.453 2.910
Thousands of euros
2010 Related transactions
Signifi cant shareholders Other related parties
Other transactionsBanca March Total
Banco Sabadell
Guipuzcoano
Fidwei Inversiones,
S.L.Lynx
Capital, S.A. Fidalser, S.L. Total Total
Financing agreements: Loans and capital contributions (lender)
81,003 81,003 97,079 - - - 97,079 178,082
Guarantees given 60,230 60,230 100,635 - - - 100,635 160,865
Dividends and other distributed profi t - - - 1,311 916 575 2,802 2,802
Other transactions 149,687 149,687 - - - - - 149,687

ConsolidatedFinancial Statements
Banca March is considered to be a signifi cant shareholder given that it is a shareholder of Corporación Financiera Alba, S.A., the main direct shareholder of ACS, Actividades de Construcción y Servicios, S.A.. Banca March has performed typical transactions relating to its ordinary course of business such as granting loans, providing guarantees for bid offers and/or the execution of works, confi rming and non-recourse factoring to several ACS Group Companies.
The Iberostar is disclosed due to its tie as a direct shareholder of ACS, Actividades de Construcción y Servicios, S.A. As a tourism and travel agency, this Group has provided services to ACS Group entities as part of its business transactions. The ACS Group has also carried out air-conditioning activities in main hotels owned by Iberostar.
Rosán Inversiones, S.L. is listed due to its relation with its Chairman and CEO of the Company which holds a signifi cant ownership interest through Inversiones Vesán, S.A., since it has received services by part of certain Group companies in relation to its construction contract, of which the Board was informed at the time it was contracted and subsequently amended.
With the three aforementioned shareholders (Corporación Financiera Alba, S.A., Iberostar Hoteles and Apartamentos, S.L. e Inversiones Vesán, S.A.), ACS, Actividades de Construcción y Servicios, S.A. entered into share loan commitment agreements by which 93,113,937 shares of ACS (representing 29.59% of the share capital) were made available so that combined with their portfolio, they could be used in the takeover bid for Hochtief. In the end, these shares were not authorised by the German regulator in the prospectus giving rise to the approval of the takeover bid. The expenses incurred by ACS in relation to this share loan commitment are included under the heading “Other expenses” in the related table in 2010 and amounted to EUR 21,036 thousand.
The transactions with other related parties, are listed due to the relationship of certain Board Members of ACS, Actividades de Construcción y Servicios, S.A. with companies in which they are either shareholders or a senior management position. In this connection, the transactions with Fidalser, S.L., Terratest Técnicas Especiales, S.A., Fidwei Inversiones, S.L and Lynx Capital, S.A. are listed given the relationship of the Board Member Pedro López Jiménez with them. Transactions with Indra are listed due to its relationship with the Board Member Javier Monzón. Transactions with Geblasa are listed due to its relationship with the Board Member Julio Sacristán, and the transactions with Zardoya Otis, S.A. due to its relationship with the Board Member José María Loizaga. Transactions with Banco Guipuzcoano are listed due to the relationship of the Board Member Javier Echenique. Transactions with Unipsa, Compañía de Seguros, S.A. are listed due to the relationship with Banca March, although in this case, the fi gures listed are intermediate premiums paid by companies of the ACS Group, and these amounts are not consideration for insurance Brokerage services. Finally, pursuant to case no. 63/2011 of 17 March 2011 tried in the Madrid court of fi rst instance no. 18 de Madrid, a sentence was handed down ordering Hochtief A.G. EUR 1,857 thousand to Percacer, S.L. and to Comercio y Finanzas, S.L. (shareholders f ACS) on 20 June 2011 for principal and ordinary interest in addition to late payment interest (in relation to the lawsuit fi led against Hochtief in 1999 in relation to “PACSA Peninsular de Asfaltos y Construcciones, S.A”).
The heading “Other Transactions” includes all transactions not related to the specifi c sections include in the period public information reported in accordance with the regulations published by the CNMV. In 2011 “Other transactions” related exclusively to Banca March, to the extent that it is the main shareholder of Corporación Financiera Alba, S.A., which is a direct shareholder of the ACS Group. As a fi nancial institution La Banca March provides different fi nancial services to several ACS Group companies as part of its normal business operations amounting to EUR 100,753 thousand (EUR149,687 thousand in 2010) in relation to “confi rming” lines for suppliers amounting to EUR 100,753 thousand (EUR148,597 thousand in 2010) and advance invoice payments and trade receivables amounting to EUR 1,090 thousand in 2010.
166 ANNUAL REPORT 2011 OF ACS GROUP ECONOMIC AND FINANCIAL REPORT

167CONSOLIDATED FINANCIAL STATEMENTS
All these commercial transactions were carried out on an arm’s length basis in the ordinary course of business and relate to the normal operations of the Group companies.
The transactions performed between ACS consolidated group companies were eliminated in the consolidation process and form part of the normal business of the companies in terms of their company object and conditions. The transactions are performed on an arm’s length basis and the related information is not necessary to fairly present the equity, fi nancial position and results of the Group’s operations.
In accordance with the information available to ACS, Actividades de Construcción y Servicios, S.A. the members of the Board of Directors had not confl icts of interest in 2011, in the terms provided by Article 229 of the Consolidated Spanish Limited Liability Companies Law.
34. Board of Directors and senior executivesIn 2011 the members of the Board of Directors de ACS, Actividades de Construcción y Servicios, S.A. received the following remuneration for membership of the Boards of Directors of the Parent or Group companies and/or for being senior executives of the Group companies.
EUR 808 thousand and EUR 1,324 thousand were charged to income in relation to share options granted to members of the Board of Directors with executive duties in 2011 and 2010, respectively. The year-on-year increase is a result of the new stock option plan approved on 1 May 2010. This amount corresponds to a proportion of the plan’s value at its concession date.
The benefi ts relating to pension funds and plans, and life insurance premiums are as follows:
The amount recognised under “Pension Funds and Plans: Contributions” relates to disbursements by the Company during the year. The amount recognised under “Pension Funds and Plans: Obligations Assumed” relates, in addition to the foregoing, to obligations charged to income in the year in this connection, even if they
Other Benefi ts
Thousands of euros2011 2010
Pension funds and plans: contributions 1,955 2,152
Pension funds and plans: obligations assumed 1,955 2,152
Life insurance premiums 16 16
Thousands of euros2011 2010
Fixed remuneration 3,617 3,563
Variable remuneration 3,788 3,629
By-law stipulated director’s emoluments 3,278 3,559
Other 1 121
Total 10,684 10,872

ConsolidatedFinancial Statements
had been disbursed prior to the related year. The obligations assumed in relation to pension plans are the same as the amounts contributed in this connection, since these obligations have been externalized and transferred to an insurance company. Accordingly, the Group has not assumed any outstanding obligation other than the contribution of the annual premium.
The ACS Group has not granted any advances, loans or guarantees to any of the Board members.
Remuneration, by type of director, including the amounts charged to the income statement relating to share options, were as follows:
34.01. Transactions with members of the Board of Directors
The transactions with members of the Board of Directors or with companies in which they have an ownership interest giving rise to a relation with the ACS Group are indicated in Note 33.02 on transactions with related parties.
34.02. Remuneration of senior executives
The remuneration of the Group’s senior executives in 2011 and 2010, excluding those who are simultaneously executive directors, was as follows:
EUR 6,901 thousand and EUR 4,8523 thousand were charged to income in relation to share options granted to the Group’s senior executives in 2011 and 2010, respectively. The year-on-year increase is a result of the new stock option plan approved on 1 May 2010. As discussed in the case of board members, this amount corresponds to a proportion of the plan’s value at its concession date.
There were no other ACS Group transactions with senior executives other than those previously mentioned on remuneration.
Thousands of euros2011 2010
Executive Directors 8,243 8,217
Non-executive nominee Directors 1,436 1,675
Non-executive independent Directors 687 713
Other Non-Executive Directors 318 267
Total 10,684 10,872
Other Benefi ts
Thousands of euros2011 2010
Salaries (fi xed and variable) 27,352 30,842
Pension Plans 2,165 2,221
Life insurance 44 56
168 ANNUAL REPORT 2011 OF ACS GROUP ECONOMIC AND FINANCIAL REPORT

169CONSOLIDATED FINANCIAL STATEMENTS
35. Other disclosures concerning the Board of DirectorsPursuant to Article 229 of the Spanish Capital Companies Law, following is a detail of the companies engaging in an activity that is identical, similar or complementary to the activity that constitutes the company object of ACS, Actividades de Construcción y Servicios, S.A. in which the sole director (ACS, Actividades de Construcción y Servicios, S.A.)own equity interests, of the functions, if any, that they discharge thereat:
Owner Investee Line of BusinessOwnership
Interest Functions
Pablo Vallbona Vadell Abertis Infraestructuras, S.A. Concessions 0.001% Board Member
Joan David Grimá Terré Cory Environmental Management Limited Environment 0.000% Board Member
Pedro López Jiménez GTCEISU Construcción, S.A. Grupo Terratest Special Foundations 45.00% Chairman (through Fapindus, S.L.)
Santos Martinez-Conde Gutiérrez-Barquín
Fomento de Construcciones y Contratas, S.A. Construction and Services
0.004% None
Santos Martinez-Conde Gutiérrez-Barquín
Técnicas Reunidas, S.A. Construction of Industrial Facilities
0.002% None
Santos Martinez-Conde Gutiérrez-Barquín
Repsol YPF, S.A. Energy 0.001% None
Santos Martinez-Conde Gutiérrez-Barquín
Indra Sistemas, S.A. Information technologies and defence systems
0.004% None
Santos Martinez-Conde Gutiérrez-Barquín
Endesa, S.A. Energy 0.000% None
Santos Martinez-Conde Gutiérrez-Barquín
Ferrovial, S.A. Construction and Services
0.001% None
Santos Martinez-Conde Gutiérrez-Barquín
Telefónica, S.A. Telephony 0.001% None
Santos Martinez-Conde Gutiérrez-Barquín
Abertis Infraestructuras, S.A. Concessions 0.001% None
Santos Martinez-Conde Gutiérrez-Barquín
Gas Natural SDG, S.A. Energy 0.001% None
Santos Martinez-Conde Gutiérrez-Barquín
Enagas, S.A. Energy 0.002% None
Santos Martinez-Conde Gutiérrez-Barquín
Iberdrola, S.A. Energy 0.001% None
Julio Sacristán Fidalgo Abertis Infraestructuras, S.A. Concessions 0.00% None
José Luis del Valle Pérez Del Valle Inversiones, S.A. Real Estate 33.33% Board Member acting severally
José Luis del Valle Pérez Sagital, S.A. Private security and integral building maintenance
5.10% None
Juan March de la Lastra Indra Sistemas, S.A. Information technologies and defence systems
0.005% Board Member
Florentino Pérez Rodríguez Abertis Infraestructuras, S.A. Concessions 0.00% Deputy Chairman

ConsolidatedFinancial Statements
Also pursuant to the aforementioned law, following is a detail of the activities performed by the directors, as independent professionals or as employees, that are identical, similar or complementary to the activity that constitutes the company object of ACS, Actividades de Construcción y Servicios, S.A.
170 ANNUAL REPORT 2011 OF ACS GROUP ECONOMIC AND FINANCIAL REPORT
Name Activity PerformedType of Arrangement
Company through which the Activity is Performed
Position or Function at the Company Concerned
Pablo Valbona Vadell Concessions Employee Abertis Infraestructuras, S.A. Board Member
Pablo Valbona Vadell Holding Employee Corporación Financiera Alba, S.A. Deputy Chairman
Manuel Delgado Solís Construction Employee Dragados, S.A. Board Member
Javier Echenique Landiribar Industrial Services Employee ACS, Servicios, Comunicaciones y Energía, S.L.
Board Member
Javier Echenique Landiribar Finance Employee Banco Sabadell Deputy Chairman
Javier Echenique Landiribar Energy Employee Repsol YPF, S.A. Board Member
Javier Echenique Landiribar Paper Employee Ence, S.A. Board Member
Juan March de la Lastra Holding Employee Corporación Financiera Alba, S.A. Board Member
Juan March de la Lastra Information Technologies
Employee Indra Sistemas, S.A. Board Member
José María Loizaga Viguri Lifts Employee Zardoya Otis, S.A. Deputy Chairman
José María Loizaga Viguri Venture Capital Independent Professional
Cartera Industrial REA, S.A. Chairman
Antonio García Ferrer Construction Employee Dragados, S.A. Board Member
Antonio García Ferrer Industrial Services Employee ACS, Servicios, Comunicaciones y Energía, S.L.
Board Member
Antonio García Ferrer Urban services and concessions
Employee ACS, Servicios y Concesiones, S.L. Board Member
Agustín Batuecas Torrego Transport interchange Employee Intercambiador de Transporte de Avenida de América
Chairman
Agustín Batuecas Torrego Rail transport of goods Employee Continental Rail, S.A. Individual representing Continental Auto, S.L. Chairman and CEO
Agustín Batuecas Torrego Transport interchange Employee Intercambiador de Transportes Príncipe Pío, S.A.
Individual representing Continental Auto, S.L. Chairman and CEO
Agustín Batuecas Torrego Transport interchange Employee Intercambiador de Transportes Plaza de Castilla, S.A.
Individual representing Continental Auto, S.L. Chairman and CEO
Agustín Batuecas Torrego Rail transport of goods Employee Construrail, S.A. Board Member
Agustín Batuecas Torrego Rail transport Employee Logitren Joint Director
Pedro José López Jiménez Construction and Services Employee Hochtief, A.G. Board Member

171CONSOLIDATED FINANCIAL STATEMENTS
Name Activity PerformedType of Arrangement
Company through which the Activity is Performed
Position or Function at the Company Concerned
Pedro José López Jiménez Paper Employee Ence, S.A. Board Member
Pedro José López Jiménez Industrial Services Employee ACS, Servicios, Comunicaciones y Energía, S.L.
Board Member
Pedro José López Jiménez Construction Employee Dragados, S.A. Deputy Chairman
Pedro José López Jiménez Urban services and concessions
Employee ACS, Servicios y Concesiones, S.L.
Board Member
Pedro José López Jiménez Special Foundations Employee GTCEISU Construcción, S.A.
Chairman(through Fapindus, S.L.)
Santos Martínez-Conde Gutiérrez-Barquín
Finance Employee Banca March, S.A. Board Member
Santos Martínez-Conde Gutiérrez-Barquín
Holding Employee Alba Participaciones, S.A.
Chairman
Santos Martínez-Conde Gutiérrez-Barquín
Steel Employee Acerinox, S.A. Board Member
Santos Martínez-Conde Gutiérrez-Barquín
Holding Employee Corporación Financiera Alba, S.A.
Board Member - CEO
Javier Monzón de Cáceres Urban services and concessions
Employee ACS, Servicios y Concesiones, S.L.
Board Member
Javier Monzón de Cáceres Information Technologies Employee Indra Sistemas, S.A. Chairman
Miguel Roca Junyent Infrastructure Concessions Employee Abertis Infraestructuras, S.A.
Non-Board Member secretary
Miguel Roca Junyent Textile Employee La Seda de Barcelona, S.A.
Chairman of the AGM
Miguel Roca Junyent Finance Employee Banco Sabadell, S.A. Non-Board Member secretary
Miguel Roca Junyent Energy Employee Endesa Independent External Board Member
Álvaro Cuervo García Stock Exchange Employee BME-Bolsas y Mercados Españoles, S.A.
Board Member
José Luis del Valle Pérez Urban services and concessions
Employee ACS, Servicios y Concesiones, S.L.
Board Member-Secretary
José Luis del Valle Pérez Industrial Services Employee ACS, Servicios, Comunicaciones y Energía, S.L.
Board Member-Secretary
José Luis del Valle Pérez Engineering and Assembly Work
Employee Cobra Gestión de Infraestructuras, S.L.
Board Member-Secretary
José Luis del Valle Pérez Infrastructure Concessions Employee Iridium Concesiones de Infraestructuras, S.A.
Board Member
José Luis del Valle Pérez Integral Maintenance Employee Clece, S.A. Board Member

ConsolidatedFinancial Statements
In 2011 the ACS Group had commercial relationships with companies in which certain of its directors hold management functions. All these commercial transactions were carried out on an arm’s-length basis in the ordinary course of business, and related to ordinary Company transactions.
The members of the Company’s Board of Directors have had no confl icts of interest over the year.
36. Guarantee commitments to third partiesAt 31 December 2011, the ACS Group had provided guarantees to third parties in connection with its business activities totalling EUR 13,548,136 thousand.
Noteworthy are the guarantees given by Hochtief. In this connection the syndicated guarantee lines obtained by Hochtief A.G. in 2007 were refi nanced together with a syndicated credit facility in December 2011, with a combined credit and guarantee line of EUR 2,000,000 thousand by an international syndicate of banks. The guarantee tranche amounted to EUR 1,500,000 thousand, of which EUR 1,120,200 thousand had been drawn down at the end of the reporting period. This line is available for ordinary activities, mainly relating to the concession are and Europe division of Hochtief, and has been granted for a fi ve year term, expiring on 13 December 2016.
The Hochtief Group also has undrawn guarantee lines amounting to EUR 5,740,000 thousand from insurance companies and banks.
172 ANNUAL REPORT 2011 OF ACS GROUP ECONOMIC AND FINANCIAL REPORT
Name Activity PerformedType of Arrangement
Company through which the Activity is Performed
Position or Function at the Company Concerned
José Luis del Valle Pérez Urban Services Employee Urbaser, S.A. Board Member
José Luis del Valle Pérez Investments EmployeeDel Valle Inversiones, S.A.
Board Member acting severally
José Luis del Valle PérezConstruction and Services
Employee Hochtief, A.G.Member of the Supervisory Board
José Luis del Valle Pérez Concessions Employee Admirabilia, S.L. Board Member
José Luis del Valle Pérez Concessions Employee Trebol Internacional Board Member
Joan David Grimá Terré Environment EmployeeCory Environmental Management Limited
Board Member
Florentino Pérez Rodríguez Concessions EmployeeAbertis Infraestructuras, S.A.
Deputy Chairman
Julio Sacristán Fidalgo Construction Employee Dragados, S.A. Board Member
Julio Sacristán Fidalgo Industrial Services EmployeeACS, Servicios, Comunicaciones y Energía, S.L.
Board Member
Sabina Fluxá Thienemann Tourism EmployeeIberostar Hoteles y Apartamentos, S.L.
Board Member

173CONSOLIDATED FINANCIAL STATEMENTS
Hochtief A.G. has arranged a limited guarantee line for US insurance companies in relations to the obligations of the Turner and Flatiron Groups. This is the type of Financing used in the United Sates to guarantee the performance of public works and for certain clients. E Financing totalled US $6,500,000 thousand of which US $4,417,000 thousand has been used in 2011. The guarantee furnished by Hochtief has never been called and it is not projected that this will occur in the future.
The Group’s directors consider that no material liabilities additional to those recognised in the accompanying consolidated balance sheet will arise as a result of the transactions described in this Note.
The contingent liabilities include that relating to the normal liability of the companies with which the Group carries on its business activities. Normal liability is that related to compliance with the contractual obligations assumed in the course of the provision of construction, Industrial Services or urban services by the companies or the joint ventures of which they are venturers.
This coverage is achieved by means of the corresponding guarantees provided to secure the performance of the contracts, compliance with the obligations assumed in the concession contracts, etc.
Lastly, the various Group companies are exposed to the risk of having court and out-of-courts claims fi led against them. In this connection, in relation to one of the concession companies in which the Company holds an indirect ownership interest, the non-controlling interests have a potential option to sell. However, the Group and its legal advisors do not consider that the conditions stipulated for its execution have been met, and accordingly, no liability was recognised in this connection in the accompanying fi nancial statements. In these cases, the directors of the Group companies consider that the possible effect on the fi nancial statements would not be material.
In relationship to the ownership interest held by Hochtief in the airport of Budapest, the minority shareholders have the option to sell their interest in the event of a change of control in Hochtief, at a price that would be set by a third party. This would obligate Hochtief to purchase these assets. However, to date there is no knowledge of action taken by the minority shareholders. The Group and its legal advisors are to the understanding in the case that action were to be taken, this control option would have to be assessed exclusively to the direct ownership interest of ACS en Hochtief, which is less than 50%.
37. Information on the environmentThe ACS combines its business aims with the objective of protecting the environment and appropriately managing the expectations of its stakeholders in this area. The environmental policy of the ACS Group attempts to provide a Framework which defi nes broad policies to be followed (principles as well as the particularities of each line of business and Project.
The principles are the general environmental commitments of the ACS Group. These are fl exible enough to accommodate elements of the policy and planning of companies in the different business areas. Additionally, these commitments have to abide by the requirements of the ISO 14001 Standard:
• Commitment to compliance with law.• Commitment to pollution prevention.• Commitment to continuous improvement.• Commitment to transparency, communication and training for the Group’s employees, suppliers, customers
and other interest groups.
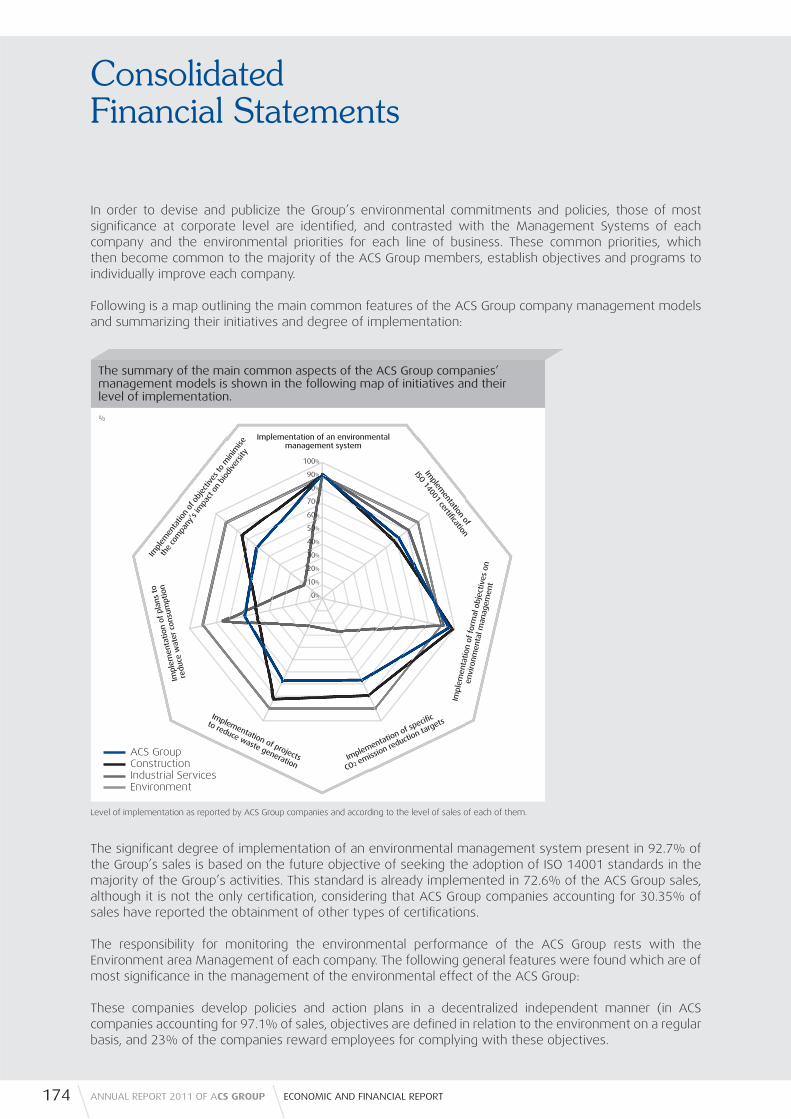
ConsolidatedFinancial Statements
In order to devise and publicize the Group’s environmental commitments and policies, those of most signifi cance at corporate level are identifi ed, and contrasted with the Management Systems of each company and the environmental priorities for each line of business. These common priorities, which then become common to the majority of the ACS Group members, establish objectives and programs to individually improve each company.
Following is a map outlining the main common features of the ACS Group company management models and summarizing their initiatives and degree of implementation:
The signifi cant degree of implementation of an environmental management system present in 92.7% of the Group’s sales is based on the future objective of seeking the adoption of ISO 14001 standards in the majority of the Group’s activities. This standard is already implemented in 72.6% of the ACS Group sales, although it is not the only certifi cation, considering that ACS Group companies accounting for 30.35% of sales have reported the obtainment of other types of certifi cations.
The responsibility for monitoring the environmental performance of the ACS Group rests with the Environment area Management of each company. The following general features were found which are of most signifi cance in the management of the environmental effect of the ACS Group:
These companies develop policies and action plans in a decentralized independent manner (in ACS companies accounting for 97.1% of sales, objectives are defi ned in relation to the environment on a regular basis, and 23% of the companies reward employees for complying with these objectives.
The summary of the main common aspects of the ACS Group companies’ management models is shown in the following map of initiatives and their level of implementation.
%
ACS Group Construction Industrial Services Environment
Implementation of an environmental management system
Implem
entation of
ISO 14001 certifi cation
Impl
emen
tatio
n of
obj
ectiv
es to
min
imise
the
com
pany
’s im
pact
on
biod
iver
sity
Imple
men
tati
on o
f pla
ns
to
reduc
e w
ater
co
nsu
mpt
ion
Implementation of projects
to reduce waste generationImplementation of sp
ecifi c
CO2 emission reductio
n targets
Imple
men
tati
on o
f fo
rmal
ob
ject
ives
on
envi
ronm
enta
l man
agem
ent
100%
90%
80%
70%
60%
50%
40%
30%
20%
10%
0%
Level of implementation as reported by ACS Group companies and according to the level of sales of each of them.
174 ANNUAL REPORT 2011 OF ACS GROUP ECONOMIC AND FINANCIAL REPORT
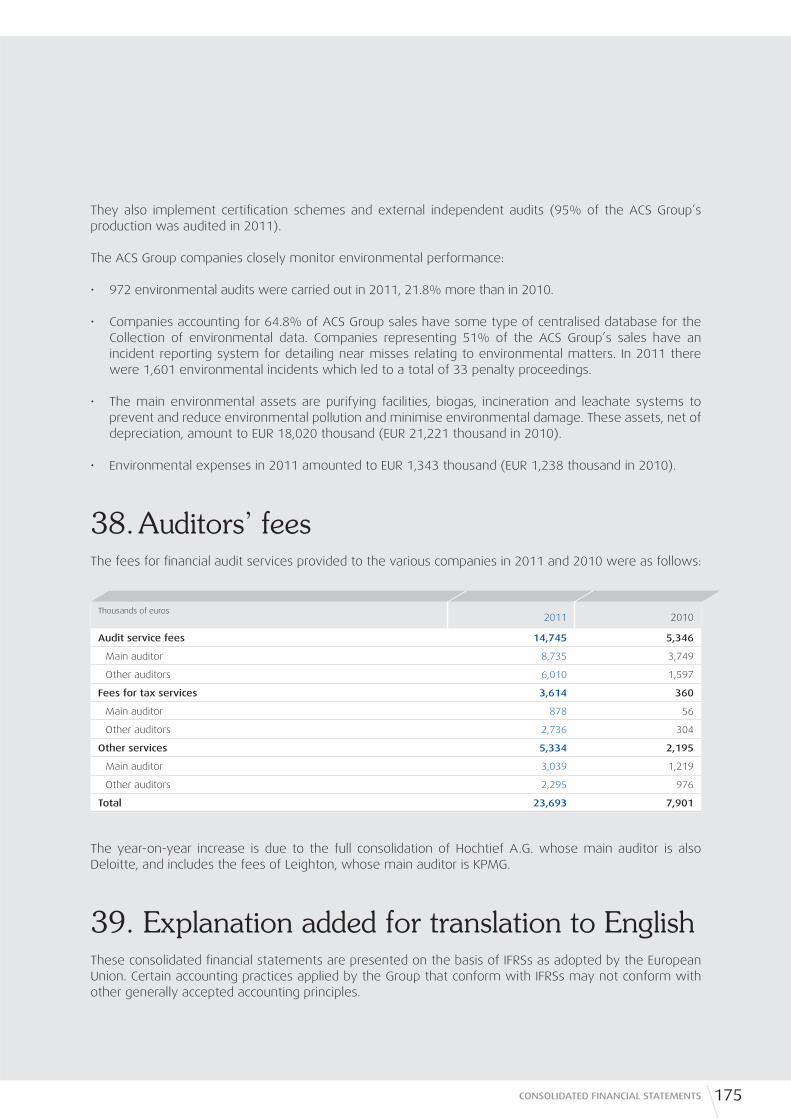
175CONSOLIDATED FINANCIAL STATEMENTS
They also implement certifi cation schemes and external independent audits (95% of the ACS Group’s production was audited in 2011).
The ACS Group companies closely monitor environmental performance:
• 972 environmental audits were carried out in 2011, 21.8% more than in 2010.
• Companies accounting for 64.8% of ACS Group sales have some type of centralised database for the Collection of environmental data. Companies representing 51% of the ACS Group’s sales have an incident reporting system for detailing near misses relating to environmental matters. In 2011 there were 1,601 environmental incidents which led to a total of 33 penalty proceedings.
• The main environmental assets are purifying facilities, biogas, incineration and leachate systems to prevent and reduce environmental pollution and minimise environmental damage. These assets, net of depreciation, amount to EUR 18,020 thousand (EUR 21,221 thousand in 2010).
• Environmental expenses in 2011 amounted to EUR 1,343 thousand (EUR 1,238 thousand in 2010).
38. Auditors’ feesThe fees for fi nancial audit services provided to the various companies in 2011 and 2010 were as follows:
The year-on-year increase is due to the full consolidation of Hochtief A.G. whose main auditor is also Deloitte, and includes the fees of Leighton, whose main auditor is KPMG.
39. Explanation added for translation to EnglishThese consolidated fi nancial statements are presented on the basis of IFRSs as adopted by the European Union. Certain accounting practices applied by the Group that conform with IFRSs may not conform with other generally accepted accounting principles.
Thousands of euros2011 2010
Audit service fees 14,745 5,346
Main auditor 8,735 3,749
Other auditors 6,010 1,597
Fees for tax services 3,614 360
Main auditor 878 56
Other auditors 2,736 304
Other services 5,334 2,195
Main auditor 3,039 1,219
Other auditors 2,295 976
Total 23,693 7,901

ConsolidatedFinancial Statements
AppendixAs stated in Note 2 to the fi nancial statements, Appendices I, II and III list the subsidiaries, Joint ventures and associates of most signifi cance in the ACS Group in 2011, including their registered offi ce and the Group’s effective percentage of ownership.
The information is grouped in accordance with the management criteria of the ACS Group on the basis of the different business segments or lines of business carried on.
1. Corporate UnitThis includes the Parent of the Group, ACS, Actividades de Construcción y Servicios, S.A., and companies with strategic ownership interests in energy, telecommunications and concessions.
2. ConstructionInformation is separated on the basis of the two companies heading this line of business:
• Dragados. This includes both domestic and foreign activities relating to civil construction works (highways and roads, railways, hydraulic infrastructures, coasts and ports, etc., as well as residential and non-residential buildings.
• Hochtief. This segment includes the activities carried on by the different business segments of this company:
– Hochtief Americas. Its activity is mainly carried on in the USA and Canada and relates to the construction of buildings (public and private), infrastructures, civil engineering, and educational and Sports facilities.
– Hochtief Asia Pacifi c. Its activities are carried on by its Australian subsidiary Leighton, noteworthy being construction, mining contracts and the operation and development of real estate infrastructures.
– Hochtief Concessions. This segment operates concession relating to airports, roads, tunnels and social infrastructure (schools, and public centres), most with public and private collaboration.
– Hochtief Europe. This segment mainly operates through Hochtief Solutions A.G., which designs, develops, constructs and operates infrastructure projects, real estate and facilities.
• Iridium. It carries out infrastructure promotion and development, both in relation to transport and public facilities, managing different public-private collaboration models.
3. Industrial ServicesThis segment is engaged in the development of applied engineering services, installations and the maintenance of industrial infrastructures in the energy, communications and control systems sectors.
4. EnvironmentalThis segment groups together environmental services such as road Cleaning, waste collection and transport, treatment and recycling of urban, commercial and industrial waste, integral management of the water cycle and urban landscaping.
176 ANNUAL REPORT 2011 OF ACS GROUP ECONOMIC AND FINANCIAL REPORT
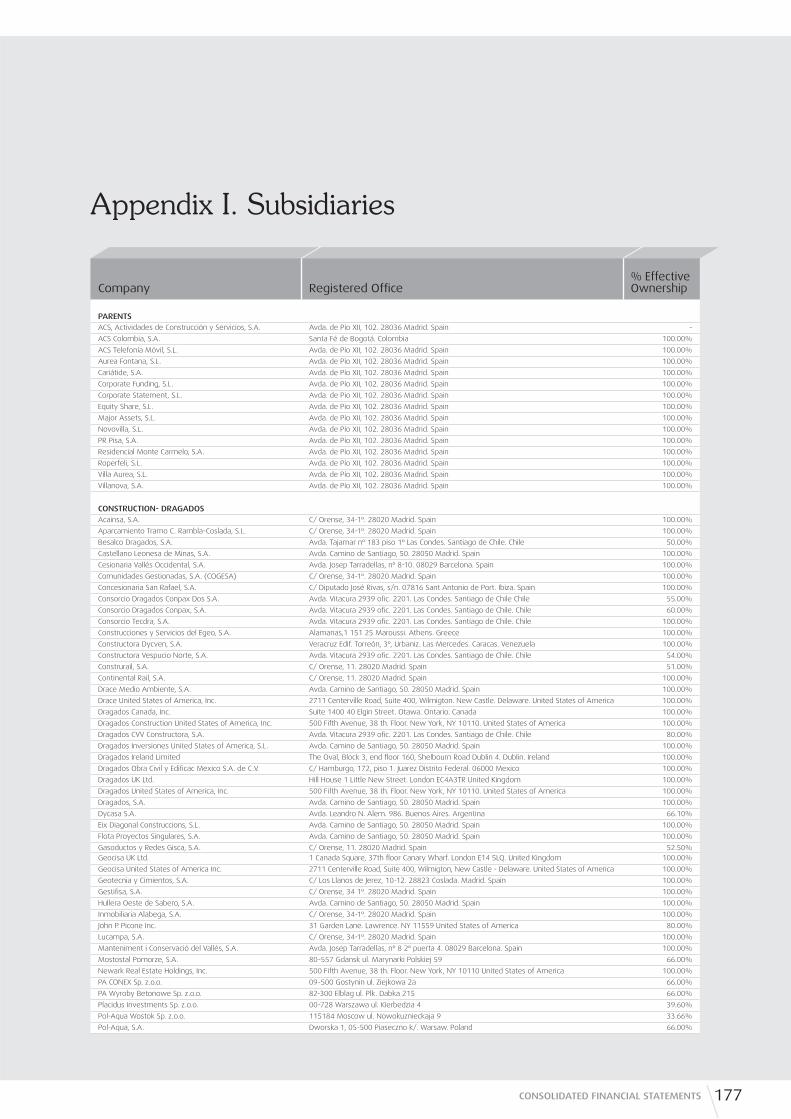
177CONSOLIDATED FINANCIAL STATEMENTS
Appendix I. Subsidiaries
Company Registered Offi ce% Effective Ownership
PARENTSACS, Actividades de Construcción y Servicios, S.A. Avda. de Pío XII, 102. 28036 Madrid. Spain -
ACS Colombia, S.A. Santa Fé de Bogotá. Colombia 100.00%
ACS Telefonía Móvil, S.L. Avda. de Pío XII, 102. 28036 Madrid. Spain 100.00%
Aurea Fontana, S.L. Avda. de Pío XII, 102. 28036 Madrid. Spain 100.00%
Cariátide, S.A. Avda. de Pío XII, 102. 28036 Madrid. Spain 100.00%
Corporate Funding, S.L. Avda. de Pío XII, 102. 28036 Madrid. Spain 100.00%
Corporate Statement, S.L. Avda. de Pio XII, 102. 28036 Madrid. Spain 100.00%
Equity Share, S.L. Avda. de Pio XII, 102. 28036 Madrid. Spain 100.00%
Major Assets, S.L. Avda. de Pío XII, 102. 28036 Madrid. Spain 100.00%
Novovilla, S.L. Avda. de Pío XII, 102. 28036 Madrid. Spain 100.00%
PR Pisa, S.A. Avda. de Pío XII, 102. 28036 Madrid. Spain 100.00%
Residencial Monte Carmelo, S.A. Avda. de Pío XII, 102. 28036 Madrid. Spain 100.00%
Roperfeli, S.L. Avda. de Pío XII, 102. 28036 Madrid. Spain 100.00%
Villa Aurea, S.L. Avda. de Pío XII, 102. 28036 Madrid. Spain 100.00%
Villanova, S.A. Avda. de Pío XII, 102. 28036 Madrid. Spain 100.00%
CONSTRUCTION- DRAGADOSAcainsa, S.A. C/ Orense, 34-1º. 28020 Madrid. Spain 100.00%
Aparcamiento Tramo C. Rambla-Coslada, S.L. C/ Orense, 34-1º. 28020 Madrid. Spain 100.00%
Besalco Dragados, S.A. Avda. Tajamar nº 183 piso 1º Las Condes. Santiago de Chile. Chile 50.00%
Castellano Leonesa de Minas, S.A. Avda. Camino de Santiago, 50. 28050 Madrid. Spain 100.00%
Cesionaria Vallés Occidental, S.A. Avda. Josep Tarradellas, nº 8-10. 08029 Barcelona. Spain 100.00%
Comunidades Gestionadas, S.A. (COGESA) C/ Orense, 34-1º. 28020 Madrid. Spain 100.00%
Concesionaria San Rafael, S.A. C/ Diputado José Rivas, s/n. 07816 Sant Antonio de Port. Ibiza. Spain 100.00%
Consorcio Dragados Conpax Dos S.A. Avda. Vitacura 2939 ofi c. 2201. Las Condes. Santiago de Chile Chile 55.00%
Consorcio Dragados Conpax, S.A. Avda. Vitacura 2939 ofi c. 2201. Las Condes. Santiago de Chile. Chile 60.00%
Consorcio Tecdra, S.A. Avda. Vitacura 2939 ofi c. 2201. Las Condes. Santiago de Chile. Chile 100.00%
Construcciones y Servicios del Egeo, S.A. Alamanas,1 151 25 Maroussi. Athens. Greece 100.00%
Constructora Dycven, S.A. Veracruz Edif. Torreón, 3º, Urbaniz. Las Mercedes. Caracas. Venezuela 100.00%
Constructora Vespucio Norte, S.A. Avda. Vitacura 2939 ofi c. 2201. Las Condes. Santiago de Chile. Chile 54.00%
Construrail, S.A. C/ Orense, 11. 28020 Madrid. Spain 51.00%
Continental Rail, S.A. C/ Orense, 11. 28020 Madrid. Spain 100.00%
Drace Medio Ambiente, S.A. Avda. Camino de Santiago, 50. 28050 Madrid. Spain 100.00%
Drace United States of America, Inc. 2711 Centerville Road, Suite 400, Wilmigton. New Castle. Delaware. United States of America 100.00%
Dragados Canada, Inc. Suite 1400 40 Elgin Street. Otawa. Ontario. Canada 100.00%
Dragados Construction United States of America, Inc. 500 Fifth Avenue, 38 th. Floor. New York, NY 10110. United States of America 100.00%
Dragados CVV Constructora, S.A. Avda. Vitacura 2939 ofi c. 2201. Las Condes. Santiago de Chile. Chile 80.00%
Dragados Inversiones United States of America, S.L. Avda. Camino de Santiago, 50. 28050 Madrid. Spain 100.00%
Dragados Ireland Limited The Oval, Block 3, end fl oor 160, Shelbourn Road Dublin 4. Dublin. Ireland 100.00%
Dragados Obra Civil y Edifi cac Mexico S.A. de C.V. C/ Hamburgo, 172, piso 1. Juarez Distrito Federal. 06000 Mexico 100.00%
Dragados UK Ltd. Hill House 1 Little New Street. London EC4A3TR United Kingdom 100.00%
Dragados United States of America, Inc. 500 Fifth Avenue, 38 th. Floor. New York, NY 10110. United States of America 100.00%
Dragados, S.A. Avda. Camino de Santiago, 50. 28050 Madrid. Spain 100.00%
Dycasa S.A. Avda. Leandro N. Alem. 986. Buenos Aires. Argentina 66.10%
Eix Diagonal Construccions, S.L. Avda. Camino de Santiago, 50. 28050 Madrid. Spain 100.00%
Flota Proyectos Singulares, S.A. Avda. Camino de Santiago, 50. 28050 Madrid. Spain 100.00%
Gasoductos y Redes Gisca, S.A. C/ Orense, 11. 28020 Madrid. Spain 52.50%Geocisa UK Ltd. 1 Canada Square, 37th fl oor Canary Wharf. London E14 5LQ. United Kingdom 100.00%
Geocisa United States of America Inc. 2711 Centerville Road, Suite 400, Wilmigton, New Castle - Delaware. United States of America 100.00%
Geotecnia y Cimientos, S.A. C/ Los Llanos de Jerez, 10-12. 28823 Coslada. Madrid. Spain 100.00%
Gestifi sa, S.A. C/ Orense, 34 1º. 28020 Madrid. Spain 100.00%
Hullera Oeste de Sabero, S.A. Avda. Camino de Santiago, 50. 28050 Madrid. Spain 100.00%
Inmobiliaria Alabega, S.A. C/ Orense, 34-1º. 28020 Madrid. Spain 100.00%
John P. Picone Inc. 31 Garden Lane. Lawrence. NY 11559 United States of America 80.00%
Lucampa, S.A. C/ Orense, 34-1º. 28020 Madrid. Spain 100.00%
Manteniment i Conservació del Vallés, S.A. Avda. Josep Tarradellas, nº 8 2º puerta 4. 08029 Barcelona. Spain 100.00%
Mostostal Pomorze, S.A. 80-557 Gdansk ul. Marynarki Polskiej 59 66.00%
Newark Real Estate Holdings, Inc. 500 Fifth Avenue, 38 th. Floor. New York, NY 10110 United States of America 100.00%
PA CONEX Sp. z.o.o. 09-500 Gostynin ul. Ziejkowa 2a 66.00%
PA Wyroby Betonowe Sp. z.o.o. 82-300 Elblag ul. Plk. Dabka 215 66.00%
Placidus Investments Sp. z.o.o. 00-728 Warszawa ul. Kierbedzia 4 39.60%
Pol-Aqua Wostok Sp. z.o.o. 115184 Moscow ul. Nowokuznieckaja 9 33.66%
Pol-Aqua, S.A. Dworska 1, 05-500 Piaseczno k/. Warsaw. Poland 66.00%

ConsolidatedFinancial Statements
178 ANNUAL REPORT 2011 OF ACS GROUP ECONOMIC AND FINANCIAL REPORT
Company Registered Offi ce% Effective Ownership
Protide, S.A. C/ Orense,34-1º 28020 Madrid. Spain 100.00%
Pulice Construction, Inc. 2033 W Mountain View Rd. Phoenix. AZ 85021 Phoenix. United States of America 100.00%
Remodelación Ribera Norte, S.A. Avda. Josep Tarradellas, nº 8 2º puerta 4. 08029 Barcelona. Spain 100.00%
Residencial Leonesa, S.A. C/ Orense, 34-1º. 28020 Madrid. Spain 100.00%
Schiavone Construction Company 150 Meadowlands Parkway Seacaucus. New Jersey 07068. United States of America 100.00%
Servia Conservación y Mantenimiento, S.A. Avda. Camino de Santiago, 50. 28050 Madrid. Spain 51.00%
Sicsa Rail Transport, S.A. C/ Orense, 11. 28020 Madrid. Spain 76.00%
Sussex Realty, Llc. 31 Garden Lane Lawrence, NY 11559. United States of America 90.00%
Técnicas e Imagen Corporativa, S.L. Avda. de Paris, 1. 19200 Azuqueca de Henares. Guadalajara. Spain 100.00%
TECO Sp. z.o.o. 51-502 Wroclaw ul. Mydlana 1 66.00%
Tecsa Empresa Constructora, S.A. Avda. Madariaga, 1, 4º. 48014 Bilbao. Spain 100.00%
Tedra Australia Pty. L.T.D. 293 Queen Street, Altona, Meadows VIC 3028. Australia 100.00%
Vias Canada Inc. 150 King Street West, Suite 805. Toronto ON. Canada 100.00%
Vias United States of America Inc. 2711 Centerville Road, Suite 400, Wilmington. New Castle. Delaware. United States of America 100.00%
Vías y Construcciones, S.A. C/ Orense,11. 28020 Madrid. Spain 100.00%
Weneda Sp. z.o.o. 45-355 Opole ul. 1-go Maja 77/1 66.00%
CONSTRUCTION - IRIDIUM (Concessions)
ACS Infrastructure Canada, Inc. 150 King Street West, Suite 805, P.O. Box 48, M5H 1J9 ON Canada 100.00%
ACS Infrastructure Development, Inc. Corporation Trust Company, Corporation Trust Center, 1209 Orange Street. Wilmington New Castle. Delaware 19801. United States of America
100.00%
ACS WEP Holdings, Inc. 1 Germain Street Suite 1500. Saint John NB E2L4V1. Canada. 100.00%
Autovía de La Mancha, S.A. Concesionaria JCC Castilla La Mancha
21.500 de la CM-42 en el 45.430 de Mascaraque. Toledo. Spain 75.00%
Autovia del Camp del Turia, S.A. C/ Alvaro de Bazán, nº 10 Entlo. 46010 Valencia. Spain 65.00%
Autovía del Pirineo, S.A. C/Emilio Arrieta 8 - 6º, 31002 Pamplona (Navarra). Spain 72.00%
Autovía Medinaceli-Calatayud Soc. Conces. Estado, S.A. Avda. Camino de Santiago, 50. 28050 Madrid. Spain 95.00%
Can Brians 2, S.A. Avinguda Josep Tarradellas, 34-36, 9º. 08029 Barcelona. Spain 100.00%
CAT Desenvolupament de Concessions Catalanes, S.L. Avinguda Josep Tarradellas, 34-36, 9º. 08029 Barcelona. Spain 100.00%
Concesionaria Santiago Brión, S.A. Centro de Control AG-56 Enlace de Pardiñas - Costola. 15895 Ames. A Coruña. Spain 70.00%
Concesiones Viarias Chile Tres, S.A. José Antonio Soffi a N°2747, Ofi cina 602, Comuna de Providencia. Santiago de Chile. Chile 100.00%
Concesiones Viarias Chile, S.A. José Antonio Soffi a N°2747, Ofi cina 602, Comuna de Providencia. Santiago de Chile. Chile 100.00%
Desarrollo de Concesionarias Viarias Dos, S.L. Avenida del Camino de Santiago, 50. 28050 Madrid. Spain 100.00%
Desarrollo de Concesionarias Viarias Uno, S.L. Avenida del Camino de Santiago, 50. 28050 Madrid. Spain 100.00%
Desarrollo de Concesiones Ferroviarias, S.L. Avenida del Camino de Santiago, 50. 28050 Madrid. Spain 100.00%
Desarrollo de Equipamientos Públicos, S.L. Avenida del Camino de Santiago, 50. 28050 Madrid. Spain 100.00%
Dragados Concessions, Ltd. Hill House, 1 - Little New Street. London EC4A 3TR. England 100.00%
Dragados Waterford Ireland, Ltd. The Oval, Building 3. 160 Shelbourne Rd. Ballsbridge. Dublin. Ireland 100.00%
Eix Diagonal Concessionària de la Generalitat de Catalunya, S.A.
Av. Josep Tarradellas, 34-36, 9º Dcha 08029 Barcelona 100.00%
Estacionament Centre Direccional, S.A. Puerto Tarraco-Moll de Llevant. Edifi cio B5, 1ª Planta.43004 Tarragona. Spain 100.00%
Explotación Comercial de Intercambiadores, S.A. Avda. de America, 9A (Intercambiador de Tptes) Madrid. Spain 100.00%
FTG Fraser Transportation Group Partnership 1300 - 777 Dunsmuir Street Po Box 10424 Stn Pacifi c Ctr. Vancouver Bc V7Y 1K2. Canada 75.00%
FTG Holding Limited Partnership 1300 - 777 Dunsmuir Street Po Box 10424 Stn Pacifi c Ctr. Vancouver Bc V7Y 1K2. Canada 100.00%
FTG Holdings, Inc. 1300 - 777 Dunsmuir Street Po Box 10424 Stn Pacifi c Ctr. Vancouver Bc V7Y 1K2. Canada 100.00%
Green Canal Golf, S.A. Avenida Philippines, s/n esquina Avenida Pablo Iglesias s/n 28003 Madrid. Spain 100.00%
I 595 ITS Solutions, Llc. Corporation Trust Company, Corporation Trust Center, 1209 Orange Street. Wilmington New Castle. Delaware 19801. United States of America
100.00%
Intercambiador de Transportes de Avda. de América, S.A. Avda. América, 2-17-B. 28002 Madrid. Spain 100.00%
Intercambiador de Transportes de Príncipe Pío, S.A. Avda. América, 2-17-B. 28002 Madrid. Spain 70.00%
Inversora de la Autovía de la Mancha, S.A. Avda. Camino de Santiago, 50 28050 Madrid. Spain 75.00%
Iridium Aparcamientos, S.L. Avda. Camino de Santiago, 50 28050 Madrid. Spain 100.00%
Iridium Concesiones de Infraestructuras, S.A. Avda. Camino de Santiago, 50. 28050 Madrid. Spain 100.00%
Iridium Nouvelle Autoroute 30, Inc. 1, Place Ville-Marie 37e étage Montreal. Quebec H3B 3P4. Canada 100.00%
Iridium Portlaoise Ireland Limited The Oval, Building 3. 160 Shelbourne Rd. Ballsbridge. Dublin. Ireland 100.00%
Marestrada-Operações e Manutenção Rodoviária, S.A. Rua Julieta Ferrão, nº 10 – 6º andar 1600-131 Lisboa. Portugal 70.00%
Parking Mérida III, S.A. Avenida Lusitania, 15 1º Puerta 7. Mérida. Badajoz. Spain 100.00%
Parking Nou Hospital del Camp, S.L. Avenida de la Universitat, s/n. 43201 Reus. Tarragona. Spain 100.00%
Parking Palau de Fires, S.L. Avenida de la Universitat, s/n. Spain. 43201 Reus. Tarragona 100.00%
Planestrada - Operação e Manutenção Rodoviária, S.A. Cerrado das Aranhas, lote 18. 7570-115 Grândola. Portugal 70.00%
Reus-Alcover Conc de la Generalitat de Catalunya, S.A. Avinguda Josep Tarradellas, 34-36, 9º. 08029 Barcelona. Spain 100.00%
Sociedad Concesionaria Ruta del Canal, S.A. Antonio Varas Nº 216, Ofi cina 701. Puerto Montt. Chile 80.00%
Sociedad Inversora de Infraestructuras de la Mancha, S.L. Avda. de Tenerife, 4-6. 28703 San Sebastián de los Reyes. Madrid. Spain 66.67%
The Currituck Development Group, Llc. Corporation Trust Company, Corporation Trust Center, 1209 Orange Street. Wilmington New Castle. Delaware 19801. United States of America
100.00%

179CONSOLIDATED FINANCIAL STATEMENTS
Company Registered Offi ce% Effective Ownership
CONSTRUCTION - HOCHTIEFHochtief Aktiengesellschaft Essen, Germany 51.46%
Beggen PropCo Sàrl Strassen, Luxembourg 51.46%
Builders' Credit Reinsurance Company S.A. Steinfort, Luxembourg 51.46%
Eurafrica Baugesellschaft mbH Essen, Germany 51.46%
Hochtief Global One GmbH Essen, Germany 51.46%
Hochtief Insurance Broking and Risk Management Solutions GmbH Essen, Germany 51.46%
Steinfort Capital Growth SICAV-SIF Bertrange, Luxembourg 51.46%
Steinfort Fund of Funds SICAV-SIF Findel-Golf, Luxembourg 51.46%
Steinfort Propco Sàrl Strassen, Luxembourg 51.46%
Vintage Real Estate HoldCo Sàrl Strassen, Luxembourg 51.46%
Hochtief Americas2501 Constructors LLC DC, United States of America 51.46%
ASI-Flatiron Inc. Longmont, United States of America 51.46%
Auburndale Company, Inc. Ohio, United States of America 51.46%
Audubon Bridge Constructors New Roads, United States of America 27.79%
Bethesda View Constructors LLC Maryland, United States of America 51.46%
California Steel Advisory Services Walnut Creek, United States of America 51.46%
Canadian Turner Construction Company (Nova Scotia) Nova Scotia, Canada 51.46%
Canadian Turner Construction Company Ltd. Markham, Canada 51.46%
Capitol Building Services LLC Maryland, United States of America 51.46%
Caribbean Operations, Inc. Delaware, United States of America 51.46%
DCN, United States of America Inc. Delaware, United States of America 51.46%
E. E. Cruz and Company Inc. Holmdel, United States of America 51.46%
Facilities Management Solutions, LLC Delaware, United States of America 51.46%
FCI Constructors/Balfour Beatty San Marco, United States of America 36.02%
FCI Constructors/Cleveland Bridge Longmont, United States of America 28.30%
FECO Equipment Denver, United States of America 51.46%
Flatiron Construction Corp. Wilmington, United States of America 51.46%
Flatiron Construction Services Vancouver, United States of America 51.46%
Flatiron Constructors Canada Limited Vancouver, Canada 51.46%
Flatiron Constructors Inc. Wilmington, United States of America 51.46%
Flatiron Constructors Inc. Canadian Branch Vancouver, Canada 51.46%
Flatiron Electric AL Group Wilmington, United States of America 51.46%
Flatiron Equipment Company Canada Calgary, Canada 51.46%
Flatiron Holding Inc. Wilmington, United States of America 51.46%
Flatiron Parsons Los Angeles, United States of America 36.02%
Flatiron West Inc. Wilmington, United States of America 51.46%
Flatiron West Inc., San Marcos Wilmington, United States of America 51.46%
Flatiron/C.M. Piech Longmont, United States of America 26.24%
Flatiron/Kiewit, a Joint Venture Longmont, United States of America 33.45%
Flatiron/Turner Construction of New York LLC New York, United States of America 51.46%
Flatiron/United Chocowinity, United States of America 30.88%
Flatiron-Lane Longmont, United States of America 28.30%
Flatiron-Manson Minneapolis, United States of America 36.02%
Flatiron-Tidewater Skanska Tampa, United States of America 30.88%
Henry Street Builders, LLC Virginia, United States of America 51.46%
Hochtief Americas GmbH Essen, Germany 51.46%
Hochtief Argentina S.A. Buenos Aires, Argentina 51.46%
Hochtief United States of America INC. Wilmington, United States of America 51.46%
HT CONSTRUCTION INC. Dover, United States of America 51.46%
Lacona, Inc. Tennessee, United States of America 51.46%
Maple Red Insurance Company Vermont, United States of America 51.46%
Metacon Technology Solutions, LLC Texas, United States of America 51.46%
Mideast Construction Services, Inc. Delaware, United States of America 51.46%
Misener Constru-Marina S.A. de C.V. Ciudad Juarez, Mexico 51.46%
Misener Servicios S.A. de D.V. Ciudad Juarez, Mexico 51.46%
North Carolina Constructors Longmont, United States of America 30.88%
Offshore Services, Inc. Delaware, United States of America 51.46%
OMM Inc. Plantation, United States of America 51.46%
Palmetto Transportation Constructors Longmont, United States of America 33.45%
Saddleback Constructors Mission Viejo, United States of America 27.79%
Services Products Buildings, Inc. Ohio, United States of America 51.46%
TC Professional Services, LLC Delaware, United States of America 51.46%
TCCO of South Carolina, LLC South Carolina, United States of America 51.46%
TGS/SamCorp JV (Paso del Norte - Port of Entry) District of Columbia, United States of America 51.46%
The Lathrop Company, Inc. Delaware, United States of America 51.46%
The Turner Corporation Dallas, United States of America 51.46%
Tompkins Builders, Inc. Washington, United States of America 51.46%

ConsolidatedFinancial Statements
180 ANNUAL REPORT 2011 OF ACS GROUP ECONOMIC AND FINANCIAL REPORT
Company Registered Offi ce% Effective Ownership
Tompkins Turner Grunley Kinsley JV (C4ISR Aberdeen) District of Columbia, United States of America 26.24%
Tompkins/Gilford JV (Prince George's Community College Center)
District of Columbia, United States of America 36.02%
Turner (East Asia) Pte. Ltd. Singapore 51.46%
Turner Alpha Limited Trinidad, Trinidad y Tobago 36.02%
Turner Caribe, Inc. Delaware, United States of America 51.46%
Turner Cayman Ltd. United Kingdom 51.46%
Turner Construction Company New York, United States of America 51.46%
Turner Construction Company - Singapore (US) Singapore 51.46%
Turner Construction Company of Indiana, LLC Indiana, United States of America 51.46%
Turner Construction Company of Ohio LLC Delaware, United States of America 51.46%
Turner Construction Company of Texas Texas, United States of America 51.46%
Turner Cornerstone Korea South Korea 51.46%
Turner Cross Management IV (Blackrock Wilmington 400 Bellevue)
New York, United States of America 36.02%
Turner Cross Management IV (Blackrock) New York, United States of America 30.88%
Turner Davis JV (Laurelwood/Rowney) New York, United States of America 26.24%
Turner Development Corporation Delaware, United States of America 51.46%
Turner Hochtief Construction Management GmbH Essen, Germany 51.46%
Turner International (East Asia) Pte. Limited Sri Lanka 51.46%
Turner International (Hong Kong) Limited Hong Kong 51.46%
Turner International (UK) Ltd. London, Great Britain 51.46%
Turner International Consulting Co. Shanghai, China 51.46%
Turner International Industries, Inc. Delaware, United States of America 51.46%
Turner International Korea LLC South Korea 51.46%
Turner International Limited Bermuda, United States of America 51.46%
Turner International LLC Delaware, United States of America 51.46%
Turner International Malaysia SDN BHD Malaysia 51.46%
Turner International Mexico SRL United States of America 51.46%
Turner International Professional Services, S. De R. L. De C. V
Mexico 51.46%
Turner International Pte. Limited Singapore 51.46%
Turner International Support Services, S. De R. L. De C. V. Mexico 51.46%
Turner Logistics Canada Ltd. New Brunswick, Canada 51.46%
Turner Logistics, LLC Delaware, United States of America 51.46%
Turner Project Management India Private Ltd. India 51.46%
Turner Support Services, Inc. Delaware, United States of America 51.46%
Turner Surety & Insurance Brokerage Inc. New Jersey, United States of America 51.46%
Turner Trotter JV (Clarian Fishers Medical Center) New York, United States of America 38.60%
Turner Vietnam Co. Ltd. Vietnam 51.46%
Turner/ADCo DTA (OUSD downtown education center) New York, United States of America 36.02%
Turner/Con-Real - Forest/JV New York, United States of America 30.88%
Turner/Con-Real (Tarratn County college District SE Campus New Wing)
New York, United States of America 36.02%
Turner/Hallmark JV1 (Beaumont ISD Athletic Complex) New York, United States of America 51.46%
Turner/HSC JV (Cooper University Hospital) New York, United States of America 36.02%
Turner/JGM JV (Proposition Q) New York, United States of America 34.48%
Turner/Trevino JV1 (HISD Program Management) New York, United States of America 33.45%
Turner-Davis Atlanta Airport joint Venture (Hartsfi eld Jackson Intnl Ariport DOA Secutiry Offi ce Renovation)
New York, United States of America 30.88%
Turner-Penick JV (US Marine Corp BEQ Pkg 4 & 7) New York, United States of America 30.88%
Turner-Tooles JV New York, United States of America 41.17%
Universal Construction Company, Inc. Delaware, United States of America 51.46%
West Coast Rail Constructors San Marco, United States of America 33.45%
Hochtief Asia Pacifi c111 Margaret Street Pty Limited Victoria, Australia 13.75%
145 Ann Street Pty. Ltd. Australia 27.50%
145 Ann Street Trust Australia 27.50%
512 Wickham Street Pty. Ltd. Australia 27.50%
512 Wickham Street Trust Australia 27.50%
A.C.N. 126 130 738 Pty. Ltd. Australia 27.50%
A.C.N. 151 868 601 Pty Ltd Victoria, Australia 27.50%
Ashmore Developments Pty Limited Australia 27.50%
Ausindo Holdings Pte. Ltd. Singapore 27.50%
Australia-Singapore Cable (International) Limited Australia 27.50%
Australia-Singapore Cable (Singapore) Pte Ltd Bermuda, Great Britain 27.50%
Boggo Road Project Pty Limited Singapore 27.50%
Boggo Road Project Trust Queensland, Australia 27.50%
BOS Australia Pty. Ltd. South Bank, Australia 27.50%
Broad Construction Services (NSW/VIC) Pty. Ltd. Newcastle, Australia 22.27%

181CONSOLIDATED FINANCIAL STATEMENTS
Company Registered Offi ce% Effective Ownership
Broad Construction Services (NT) Pty. Ltd. Perth, Australia 22.27%
Broad Construction Services (QLD) Pty. Ltd. Gold Coast, Australia 22.27%
Broad Construction Services (SA) Pty. Ltd. Eastwood, Australia 22.27%
Broad Construction Services (VIC) Pty. Ltd. Melbourne, Australia 22.27%
Broad Construction Services (WA) Pty Ltd. Australia 22.27%
Broad Group Holdings Pty. Ltd. Perth, Australia 24.75%
Deep Blue Consortium Pty Ltd Australia 10.05%
Delron Cleaning Pty Ltd Australia 21.99%
Delron Group Facility Services Pty Limited Australia 21.99%
Devine Bacchus Marsh Pty Limited WA, Australia 6.88%
Devine Constructions Pty Limited Queensland, Australia 6.88%
Devine Funds Pty Limited Queensland, Australia 6.88%
Devine Funds Unit Trust Victoria, Australia 6.88%
Devine Homes Pty Limited Australia 6.88%
Devine Land Pty Limited Queensland, Australia 6.88%
Devine Ltd. Australia 13.77%
Devine Management Services Pty Limited Queensland, Australia 6.88%
Devine Queensland No. 10 Pty Limited Queensland, Australia 6.88%
Devine Springwood No. 1 Pty Limited Queensland, Australia 6.88%
Devine Springwood No. 2 Pty Limited NSW, Australia 6.88%
DMB Pty Limited Queensland, Australia 6.88%
DPS Leighton Offshore Engineering Sdn Bhd Queensland, Australia 27.50%
Ewenissa Pty Ltd. Sydney, Australia 27.50%
Giddens Investment Ltd. Hong Kong 27.50%
Green Construction Company Wilmington, U.S.A. 27.50%
Gridcomm Pty. Ltd. Melbourne, Australia 27.50%
Hamilton Harbour Australia 20.62%
Hamilton Harbour Unit Trust (Devine Hamilton Unit Trust) Australia 20.62%
Hochtief Asia Pacifi c GmbH Essen, Alemania 51.46%
Hochtief AUSTRALIA HOLDINGS LIMITED Sydney, Australia 51.46%
Hunter Valley Earthmoving Co. Pty Ltd. Rutherford, Australia 27.50%
HWE Cockatoo Pty Ltd Australia 27.50%
HWE Maintenance Services Pty. Ltd. Australia 27.50%
HWE Mining Pty Ltd Australia 27.50%
HWE Newman Assets Pty Ltd Australia 27.50%
Infoplex Pty. Ltd. Sydney, Australia 27.50%
Jarrah Wood Pty. Ltd. Australia 22.27%
JH Rail Holdings Pty. Limited Australia 16.22%
JH Rail Investments Pty. Limited Australia 16.22%
JH Rail Operations Pty. Limited Australia 16.22%
JHG Mutual Limited Australia 27.50%
Joetel Pty. Limited Australia 16.22%
John Holland - Leighton (South East Asia) Joint Venture Hong Kong 27.50%
John Holland (NZ) Ltd. New Zealand 27.50%
John Holland AD Holdings Pty. Ltd. Abbotsford, Australia 27.50%
John Holland AD Investments Pty. Ltd. Abbotsford, Australia 27.50%
John Holland AD Operations Pty. Ltd. Abbotsford, Australia 27.50%
John Holland Aviation Services Pty. Ltd. Australia 27.50%
John Holland Development & Investment Pty. Ltd. Abbotsford, Australia 27.50%
John Holland Engineering Pty. Ltd. Australia 27.50%
John Holland Group Pty Ltd. Abbotsford, Australia 27.50%
John Holland Infrastructure Nominees Pty. Ltd. Australia 27.50%
John Holland Infrastructure Pty. Ltd. Australia 27.50%
John Holland Infrastructure Trust Australia 27.50%
John Holland Investment Pty. Ltd. Australia 27.50%
John Holland Melbourne Rail Franchise Pty. Ltd. Australia 27.50%
John Holland Pty Ltd. Abbotsford, Australia 27.50%
John Holland Queensland Pty. Ltd. Australia 27.50%
John Holland Rail Pty. Ltd. Abbotsford, Australia 27.50%
John Holland Services Pty. Ltd. Australia 27.50%
Kingscliff Resort Trust Australia 27.50%
LCPL (PNG) Limited Papua New Guinea 27.50%
Leighton (PNG) Limited Papua New Guinea 27.50%
Leighton Admin Services Pty Ltd. Sydney, Australia 27.50%
Leighton Arranging Pty. Ltd. Australia 27.50%
Leighton Asia (China) Limited Hong Kong 27.50%
Leighton Asia (Hong Kong) Holdings (No. 2) Limited Hong Kong 27.50%
Leighton Asia Ltd. Hong Kong 27.50%
Leighton Asia Southern Pte. Ltd. Singapore 27.50%

ConsolidatedFinancial Statements
182 ANNUAL REPORT 2011 OF ACS GROUP ECONOMIC AND FINANCIAL REPORT
Company Registered Offi ce% Effective Ownership
Leighton Botswana (Proprietary) Limited Botswana 27.50%
Leighton Construction and Mining Africa Botswana 27.50%
Leighton Contractors (Asia) Ltd. Hong Kong 27.50%
Leighton Contractors (China) Ltd. Hong Kong 27.50%
Leighton Contractors (Indo-China) Ltd. Hong Kong 27.50%
Leighton Contractors (Laos) Company Ltd. Laos 27.50%
Leighton Contractors (Malasia) Sdn. Bhd. Malaysia 27.50%
Leighton Contractors (Philippines) Inc. Philippines 11.00%
Leighton Contractors Asia (Cambodia) Co. Ltd. Camboya 27.50%
Leighton Contractors Asia (Vietnam) Limited Vietnam 27.50%
Leighton Contractors Inc. Wilmington, United States of America 27.50%
Leighton Contractors Infrastructure Nominees Pty. Ltd. Australia 27.50%
Leighton Contractors Infrastructure Pty. Ltd. Australia 27.50%
Leighton Contractors Infrastructure Trust Australia 27.50%
Leighton Contractors Lanka (Private) Ltd. Sri Lanka 27.50%
Leighton Contractors Mauricio Ltd. Mauritius 27.50%
Leighton Contractors Pty Ltd. Sydney, Australia 27.50%
Leighton Engineering & Construction (Singapore) Pte Ltd Singapur 27.50%
Leighton Finance (U.S.A.) Pty. Ltd. Australia 27.50%
Leighton Finance International Pty Ltd. Australia 27.50%
Leighton Finance Ltd. Sydney, Australia 27.50%
Leighton Foundation Engineering (Asia) Ltd. Hong Kong 27.50%
Leighton Funds Management Pty Ltd. Sydney, Australia 27,50%
Leighton Geotech Ltd. Bangkok, Thailandia 6.60%
Leighton Harbour Trust Australia 27.50%
Leighton Holdings Infrastructure Nominees Pty. Ltd. Australia 27.50%
Leighton Holdings Infrastructure Pty. Ltd. Australia 27.50%
Leighton Holdings Infrastructure Trust Australia 27.50%
Leighton Holdings Investments Pty. Ltd. Australia 27.50%
Leighton Holdings Limited Sydney, Australia 27.50%
Leighton Holland Browse JV Australia 27.50%
Leighton Infrastructure Investments Pty. Ltd. Sydney, Australia 27.50%
Leighton International FZ LLC Australia 27.50%
Leighton International Holdings Limited United Arab Emirates 27.50%
Leighton International Ltd. Cayman Islands, Great Britain 27.50%
Leighton International Mauricio Holdings Limited No. 3 Mauritius 27.50%
Leighton International Mauricio Holdings Limited No. 4 Mauritius 27.50%
Leighton International Mauricio Holdings Limited No. 5 Mauritius 27.50%
Leighton International Mauricio Holdings Limited No. 6 Mauritius 27.50%
Leighton International Mauricio Holdings Limited No. 7 Mauritius 27.50%
Leighton Investments Mauricio Limited Mauritius 27.50%
Leighton Investments Mauricio Limited No. 3 Mauritius 27.50%
Leighton Investments Mauricio Limited No. 4 Mauritius 27.50%
Leighton Investments Mauricio Limited No. 5 Mauritius 27.50%
Leighton Investments Mauricio Limited No. 6 Mauritius 27.50%
Leighton Investments Mauricio Limited No. 7 Mauritius 27.50%
Leighton John Holland Joint Venture (Lai Chi Kok) Hong Kong 27.50%
Leighton LLC Mongolia 27.50%
Leighton Mauricio (Africa) Limited Mauritius 27.50%
Leighton Motorway Investments No. 2 Pty. Ltd. Sydney, Australia 27.50%
Leighton Offshore Australia Pty. Ltd. Australia 27.50%
Leighton Offshore Pte. Ltd. Singapore 27.50%
Leighton Offshore Sdn Bhd (formerly Leighton International Sdn. Bhd.)
Malasia 27.50%
Leighton Offshore-John Holland Joint Venture (LTA Project) Australia 27.50%
Leighton Pacifi c St Leonards Pty. Ltd. Australia 27.50%
Leighton Pacifi c St Leonards Unit Trust Australia 27.50%
Leighton Portfolio Services Pty Ltd. Sydney, Australia 27.50%
Leighton Project Management Sdn. Bhd. Malaysia 27.50%
Leighton Projects Consulting (Shanghai) Ltd. China 27.50%
Leighton Properties (Brisbane) Pty Ltd. Sydney, Australia 27.50%
Leighton Properties (VIC) Pty Ltd. Sydney, Australia 27.50%
Leighton Properties (WA) Pty. Ltd. Australia 27.50%
Leighton Properties Pty Ltd. Sydney, Australia 27.50%
Leighton Properties Resorts Pty Limited Australia 27.50%
Leighton Property Development Pty Ltd. Sydney, Australia 27.50%
Leighton Property Funds Management Ltd. Sydney, Australia 27.50%
Leighton Property Management Pty Ltd. Sydney, Australia 27.50%
Leighton Residential Investments Pty. Ltd. Australia 27.50%
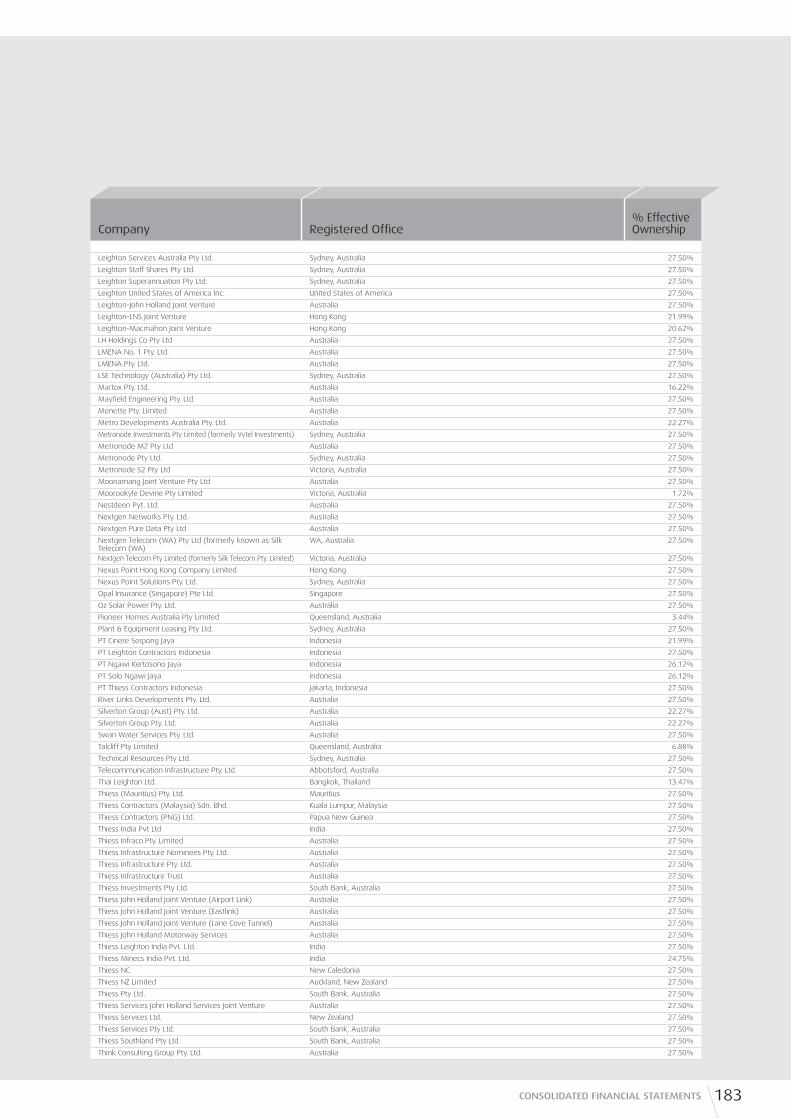
183CONSOLIDATED FINANCIAL STATEMENTS
Company Registered Offi ce% Effective Ownership
Leighton Services Australia Pty Ltd. Sydney, Australia 27.50%
Leighton Staff Shares Pty Ltd. Sydney, Australia 27.50%
Leighton Superannuation Pty Ltd. Sydney, Australia 27.50%
Leighton United States of America Inc. United States of America 27.50%
Leighton-John Holland Joint Venture Australia 27.50%
Leighton-LNS Joint Venture Hong Kong 21.99%
Leighton-Macmahon Joint Venture Hong Kong 20.62%
LH Holdings Co Pty Ltd Australia 27.50%
LMENA No. 1 Pty. Ltd. Australia 27.50%
LMENA Pty. Ltd. Australia 27.50%
LSE Technology (Australia) Pty Ltd. Sydney, Australia 27.50%
Martox Pty. Ltd. Australia 16.22%
Mayfi eld Engineering Pty. Ltd. Australia 27.50%
Menette Pty. Limited Australia 27.50%
Metro Developments Australia Pty. Ltd. Australia 22.27%
Metronode Investments Pty Limited (formerly Vytel Investments) Sydney, Australia 27.50%
Metronode M2 Pty Ltd Australia 27.50%
Metronode Pty Ltd. Sydney, Australia 27.50%
Metronode S2 Pty Ltd Victoria, Australia 27.50%
Moonamang Joint Venture Pty Ltd Australia 27.50%
Moorookyle Devine Pty Limited Victoria, Australia 1.72%
Nestdeen Pyt. Ltd. Australia 27.50%
Nextgen Networks Pty. Ltd. Australia 27.50%
Nextgen Pure Data Pty Ltd Australia 27.50%
Nextgen Telecom (WA) Pty Ltd (formerly known as Silk Telecom (WA)
WA, Australia 27.50%
Nextgen Telecom Pty Limited (formerly Silk Telecom Pty. Limited) Victoria, Australia 27.50%
Nexus Point Hong Kong Company Limited Hong Kong 27.50%
Nexus Point Solutions Pty. Ltd. Sydney, Australia 27.50%
Opal Insurance (Singapore) Pte Ltd. Singapore 27.50%
Oz Solar Power Pty. Ltd. Australia 27.50%
Pioneer Homes Australia Pty Limited Queensland, Australia 3.44%
Plant & Equipment Leasing Pty Ltd. Sydney, Australia 27.50%
PT Cinere Serpong Jaya Indonesia 21.99%
PT Leighton Contractors Indonesia Indonesia 27.50%
PT Ngawi Kertosono Jaya Indonesia 26.12%
PT Solo Ngawi Jaya Indonesia 26.12%
PT Thiess Contractors Indonesia Jakarta, Indonesia 27.50%
River Links Developments Pty. Ltd. Australia 27.50%
Silverton Group (Aust) Pty. Ltd. Australia 22.27%
Silverton Group Pty. Ltd. Australia 22.27%
Swan Water Services Pty. Ltd. Australia 27.50%
Talcliff Pty Limited Queensland, Australia 6.88%
Technical Resources Pty Ltd. Sydney, Australia 27.50%
Telecommunication Infrastructure Pty. Ltd. Abbotsford, Australia 27.50%
Thai Leighton Ltd. Bangkok, Thailand 13.47%
Thiess (Mauritius) Pty. Ltd. Mauritius 27.50%
Thiess Contractors (Malaysia) Sdn. Bhd. Kuala Lumpur, Malaysia 27.50%
Thiess Contractors (PNG) Ltd. Papua New Guinea 27.50%
Thiess India Pvt Ltd India 27.50%
Thiess Infraco Pty. Limited Australia 27.50%
Thiess Infrastructure Nominees Pty. Ltd. Australia 27.50%
Thiess Infrastructure Pty. Ltd. Australia 27.50%
Thiess Infrastructure Trust Australia 27.50%
Thiess Investments Pty Ltd. South Bank, Australia 27.50%
Thiess John Holland Joint Venture (Airport Link) Australia 27.50%
Thiess John Holland Joint Venture (Eastlink) Australia 27.50%
Thiess John Holland Joint Venture (Lane Cove Tunnel) Australia 27.50%
Thiess John Holland Motorway Services Australia 27.50%
Thiess Leighton India Pvt. Ltd. India 27.50%
Thiess Minecs India Pvt. Ltd. India 24.75%
Thiess NC New Caledonia 27.50%
Thiess NZ Limited Auckland, New Zealand 27.50%
Thiess Pty Ltd. South Bank, Australia 27.50%
Thiess Services John Holland Services Joint Venture Australia 27.50%
Thiess Services Ltd. New Zealand 27.50%
Thiess Services Pty Ltd. South Bank, Australia 27.50%
Thiess Southland Pty Ltd. South Bank, Australia 27.50%
Think Consulting Group Pty. Ltd. Australia 27.50%
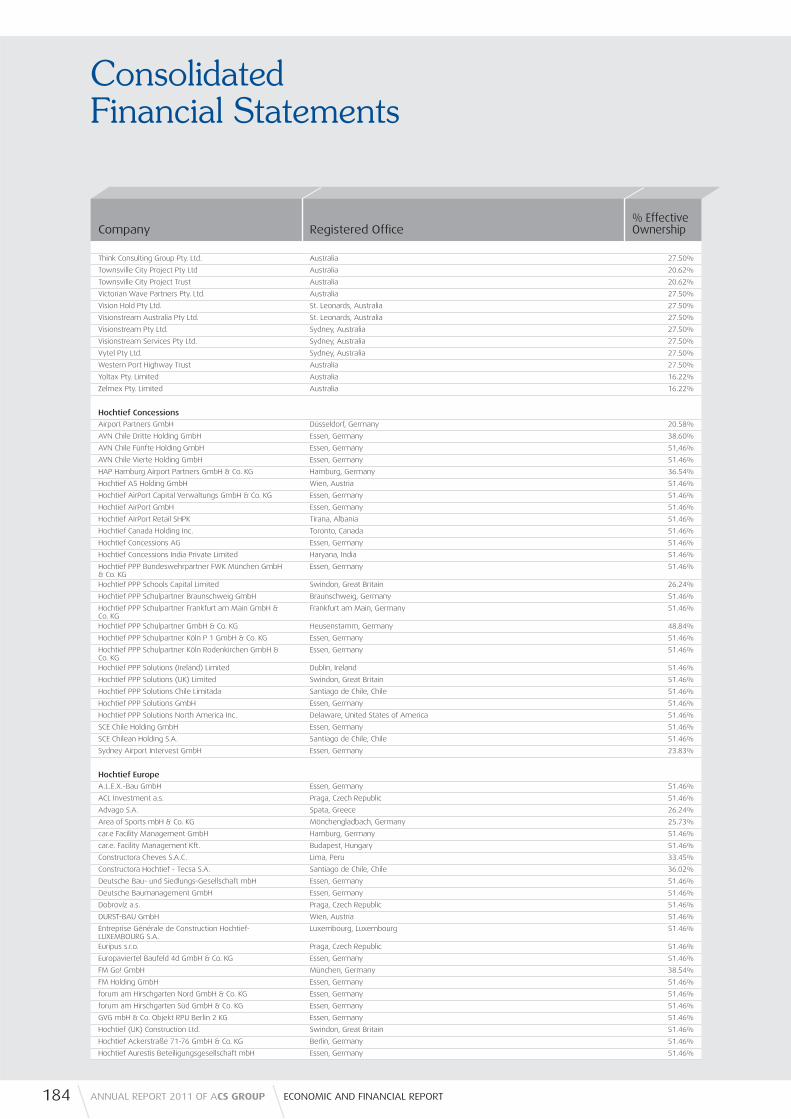
ConsolidatedFinancial Statements
184 ANNUAL REPORT 2011 OF ACS GROUP ECONOMIC AND FINANCIAL REPORT
Company Registered Offi ce% Effective Ownership
Think Consulting Group Pty. Ltd. Australia 27.50%
Townsville City Project Pty Ltd Australia 20.62%
Townsville City Project Trust Australia 20.62%
Victorian Wave Partners Pty. Ltd. Australia 27.50%
Vision Hold Pty Ltd. St. Leonards, Australia 27.50%
Visionstream Australia Pty Ltd. St. Leonards, Australia 27.50%
Visionstream Pty Ltd. Sydney, Australia 27.50%
Visionstream Services Pty Ltd. Sydney, Australia 27.50%
Vytel Pty Ltd. Sydney, Australia 27.50%
Western Port Highway Trust Australia 27.50%
Yoltax Pty. Limited Australia 16.22%
Zelmex Pty. Limited Australia 16.22%
Hochtief Concessions
Airport Partners GmbH Düsseldorf, Germany 20.58%
AVN Chile Dritte Holding GmbH Essen, Germany 38.60%
AVN Chile Fünfte Holding GmbH Essen, Germany 51,46%
AVN Chile Vierte Holding GmbH Essen, Germany 51.46%
HAP Hamburg Airport Partners GmbH & Co. KG Hamburg, Germany 36.54%
Hochtief A5 Holding GmbH Wien, Austria 51.46%
Hochtief AirPort Capital Verwaltungs GmbH & Co. KG Essen, Germany 51.46%
Hochtief AirPort GmbH Essen, Germany 51.46%
Hochtief AirPort Retail SHPK Tirana, Albania 51.46%
Hochtief Canada Holding Inc. Toronto, Canada 51.46%
Hochtief Concessions AG Essen, Germany 51.46%
Hochtief Concessions India Private Limited Haryana, India 51.46%
Hochtief PPP Bundeswehrpartner FWK München GmbH & Co. KG
Essen, Germany 51.46%
Hochtief PPP Schools Capital Limited Swindon, Great Britain 26.24%
Hochtief PPP Schulpartner Braunschweig GmbH Braunschweig, Germany 51.46%
Hochtief PPP Schulpartner Frankfurt am Main GmbH & Co. KG
Frankfurt am Main, Germany 51.46%
Hochtief PPP Schulpartner GmbH & Co. KG Heusenstamm, Germany 48.84%
Hochtief PPP Schulpartner Köln P 1 GmbH & Co. KG Essen, Germany 51.46%
Hochtief PPP Schulpartner Köln Rodenkirchen GmbH & Co. KG
Essen, Germany 51.46%
Hochtief PPP Solutions (Ireland) Limited Dublin, Ireland 51.46%
Hochtief PPP Solutions (UK) Limited Swindon, Great Britain 51.46%
Hochtief PPP Solutions Chile Limitada Santiago de Chile, Chile 51.46%
Hochtief PPP Solutions GmbH Essen, Germany 51.46%
Hochtief PPP Solutions North America Inc. Delaware, United States of America 51.46%
SCE Chile Holding GmbH Essen, Germany 51.46%
SCE Chilean Holding S.A. Santiago de Chile, Chile 51.46%
Sydney Airport Intervest GmbH Essen, Germany 23.83%
Hochtief Europe
A.L.E.X.-Bau GmbH Essen, Germany 51.46%
ACL Investment a.s. Praga, Czech Republic 51.46%
Advago S.A. Spata, Greece 26.24%
Area of Sports mbH & Co. KG Mönchengladbach, Germany 25.73%
car.e Facility Management GmbH Hamburg, Germany 51.46%
car.e. Facility Management Kft. Budapest, Hungary 51.46%
Constructora Cheves S.A.C. Lima, Peru 33.45%
Constructora Hochtief - Tecsa S.A. Santiago de Chile, Chile 36.02%
Deutsche Bau- und Siedlungs-Gesellschaft mbH Essen, Germany 51.46%
Deutsche Baumanagement GmbH Essen, Germany 51.46%
Dobrovíz a.s. Praga, Czech Republic 51.46%
DURST-BAU GmbH Wien, Austria 51.46%
Entreprise Générale de Construction Hochtief-LUXEMBOURG S.A.
Luxembourg, Luxembourg 51.46%
Euripus s.r.o. Praga, Czech Republic 51.46%
Europaviertel Baufeld 4d GmbH & Co. KG Essen, Germany 51.46%
FM Go! GmbH München, Germany 38.54%
FM Holding GmbH Essen, Germany 51.46%
forum am Hirschgarten Nord GmbH & Co. KG Essen, Germany 51.46%
forum am Hirschgarten Süd GmbH & Co. KG Essen, Germany 51.46%
GVG mbH & Co. Objekt RPU Berlin 2 KG Essen, Germany 51.46%
Hochtief (UK) Construction Ltd. Swindon, Great Britain 51.46%
Hochtief Ackerstraße 71-76 GmbH & Co. KG Berlin, Germany 51.46%
Hochtief Aurestis Beteiligungsgesellschaft mbH Essen, Germany 51.46%
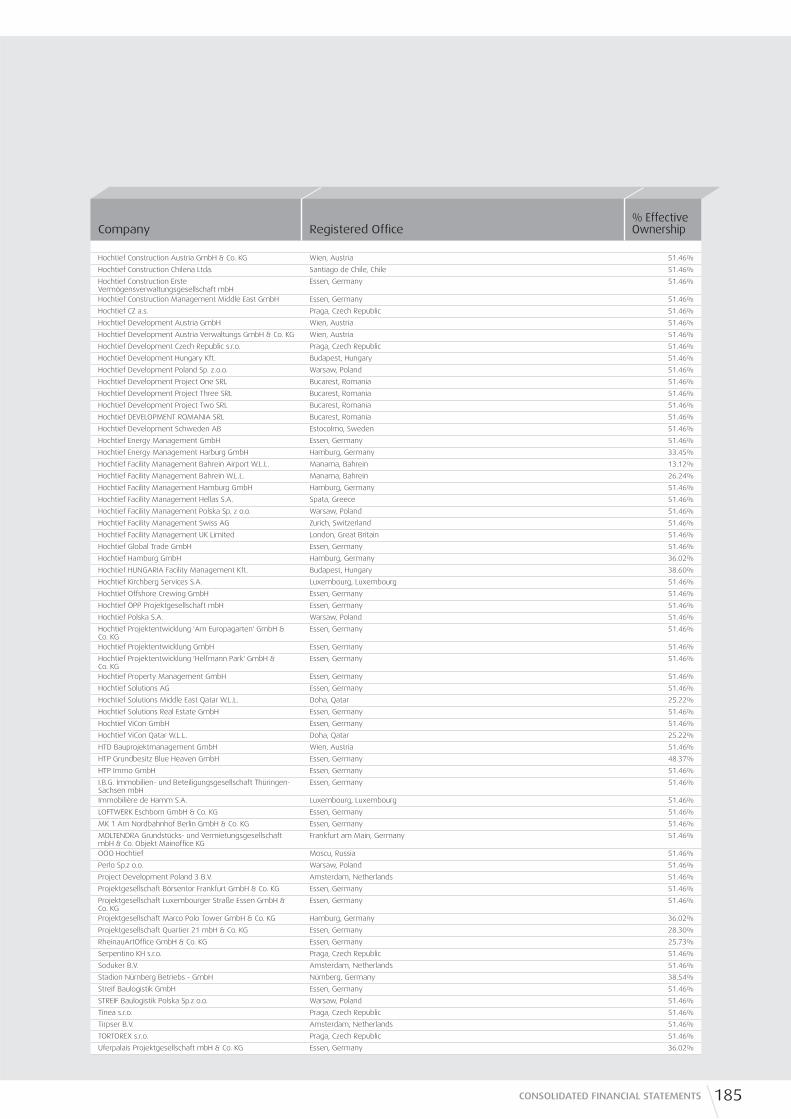
185CONSOLIDATED FINANCIAL STATEMENTS
Company Registered Offi ce% Effective Ownership
Hochtief Construction Austria GmbH & Co. KG Wien, Austria 51.46%
Hochtief Construction Chilena Ltda. Santiago de Chile, Chile 51.46%
Hochtief Construction Erste Vermögensverwaltungsgesellschaft mbH
Essen, Germany 51.46%
Hochtief Construction Management Middle East GmbH Essen, Germany 51.46%
Hochtief CZ a.s. Praga, Czech Republic 51.46%
Hochtief Development Austria GmbH Wien, Austria 51.46%
Hochtief Development Austria Verwaltungs GmbH & Co. KG Wien, Austria 51.46%
Hochtief Development Czech Republic s.r.o. Praga, Czech Republic 51.46%
Hochtief Development Hungary Kft. Budapest, Hungary 51.46%
Hochtief Development Poland Sp. z.o.o. Warsaw, Poland 51.46%
Hochtief Development Project One SRL Bucarest, Romania 51.46%
Hochtief Development Project Three SRL Bucarest, Romania 51.46%
Hochtief Development Project Two SRL Bucarest, Romania 51.46%
Hochtief DEVELOPMENT ROMANIA SRL Bucarest, Romania 51.46%
Hochtief Development Schweden AB Estocolmo, Sweden 51.46%
Hochtief Energy Management GmbH Essen, Germany 51.46%
Hochtief Energy Management Harburg GmbH Hamburg, Germany 33.45%
Hochtief Facility Management Bahrein Airport W.L.L. Manama, Bahrein 13.12%
Hochtief Facility Management Bahrein W.L.L. Manama, Bahrein 26.24%
Hochtief Facility Management Hamburg GmbH Hamburg, Germany 51.46%
Hochtief Facility Management Hellas S.A. Spata, Greece 51.46%
Hochtief Facility Management Polska Sp. z o.o. Warsaw, Poland 51.46%
Hochtief Facility Management Swiss AG Zurich, Switzerland 51.46%
Hochtief Facility Management UK Limited London, Great Britain 51.46%
Hochtief Global Trade GmbH Essen, Germany 51.46%
Hochtief Hamburg GmbH Hamburg, Germany 36.02%
Hochtief HUNGARIA Facility Management Kft. Budapest, Hungary 38.60%
Hochtief Kirchberg Services S.A. Luxembourg, Luxembourg 51.46%
Hochtief Offshore Crewing GmbH Essen, Germany 51.46%
Hochtief ÖPP Projektgesellschaft mbH Essen, Germany 51.46%
Hochtief Polska S.A. Warsaw, Poland 51.46%
Hochtief Projektentwicklung 'Am Europagarten' GmbH & Co. KG
Essen, Germany 51.46%
Hochtief Projektentwicklung GmbH Essen, Germany 51.46%
Hochtief Projektentwicklung 'Helfmann Park' GmbH & Co. KG
Essen, Germany 51.46%
Hochtief Property Management GmbH Essen, Germany 51.46%
Hochtief Solutions AG Essen, Germany 51.46%
Hochtief Solutions Middle East Qatar W.L.L. Doha, Qatar 25.22%
Hochtief Solutions Real Estate GmbH Essen, Germany 51.46%
Hochtief ViCon GmbH Essen, Germany 51.46%
Hochtief ViCon Qatar W.L.L. Doha, Qatar 25.22%
HTD Bauprojektmanagement GmbH Wien, Austria 51.46%
HTP Grundbesitz Blue Heaven GmbH Essen, Germany 48.37%
HTP Immo GmbH Essen, Germany 51.46%
I.B.G. Immobilien- und Beteiligungsgesellschaft Thüringen-Sachsen mbH
Essen, Germany 51.46%
Immobilière de Hamm S.A. Luxembourg, Luxembourg 51.46%
LOFTWERK Eschborn GmbH & Co. KG Essen, Germany 51.46%
MK 1 Am Nordbahnhof Berlin GmbH & Co. KG Essen, Germany 51.46%
MOLTENDRA Grundstücks- und Vermietungsgesellschaft mbH & Co. Objekt Mainoffi ce KG
Frankfurt am Main, Germany 51.46%
OOO Hochtief Moscu, Russia 51.46%
Perlo Sp.z o.o. Warsaw, Poland 51.46%
Project Development Poland 3 B.V. Amsterdam, Netherlands 51.46%
Projektgesellschaft Börsentor Frankfurt GmbH & Co. KG Essen, Germany 51.46%
Projektgesellschaft Luxembourger Straße Essen GmbH & Co. KG
Essen, Germany 51.46%
Projektgesellschaft Marco Polo Tower GmbH & Co. KG Hamburg, Germany 36.02%
Projektgesellschaft Quartier 21 mbH & Co. KG Essen, Germany 28.30%
RheinauArtOffi ce GmbH & Co. KG Essen, Germany 25.73%
Serpentino KH s.r.o. Praga, Czech Republic 51.46%
Soduker B.V. Amsterdam, Netherlands 51.46%
Stadion Nürnberg Betriebs - GmbH Nürnberg, Germany 38.54%
Streif Baulogistik GmbH Essen, Germany 51.46%
STREIF Baulogistik Polska Sp.z o.o. Warsaw, Poland 51.46%
Tinea s.r.o. Praga, Czech Republic 51.46%
Tirpser B.V. Amsterdam, Netherlands 51.46%
TORTOREX s.r.o. Praga, Czech Republic 51.46%
Uferpalais Projektgesellschaft mbH & Co. KG Essen, Germany 36.02%
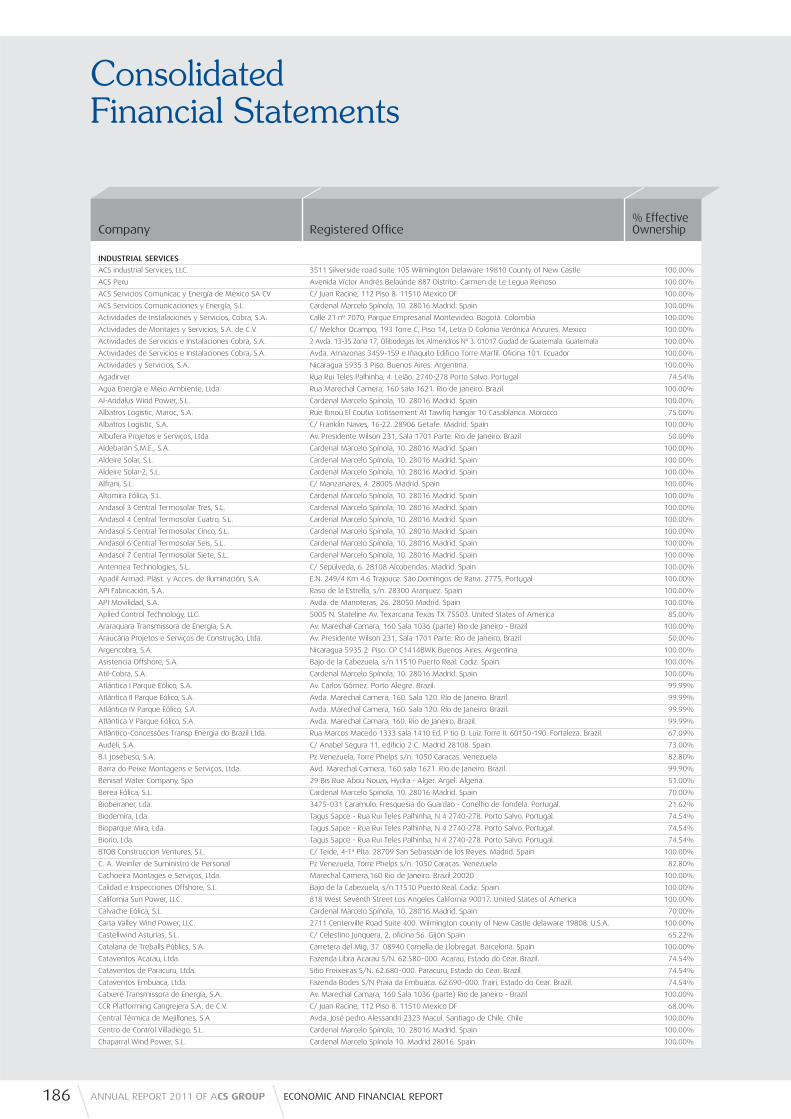
ConsolidatedFinancial Statements
186 ANNUAL REPORT 2011 OF ACS GROUP ECONOMIC AND FINANCIAL REPORT
Company Registered Offi ce% Effective Ownership
INDUSTRIAL SERVICES
ACS industrial Services, LLC. 3511 Silverside road suite 105 Wilmington Delaware 19810 County of New Castle 100.00%
ACS Peru Avenida Víctor Andrés Belaúnde 887 Distrito: Carmen de Le Legua Reinoso 100.00%
ACS Servicios Comunicac y Energía de Mexico SA CV C/ Juan Racine, 112 Piso 8. 11510 Mexico DF 100.00%
ACS Servicios Comunicaciones y Energía, S.L. Cardenal Marcelo Spínola, 10. 28016 Madrid. Spain 100.00%
Actividades de Instalaciones y Servicios, Cobra, S.A. Calle 21 nº 7070, Parque Empresarial Montevideo. Bogotá. Colombia 100.00%
Actividades de Montajes y Servicios, S.A. de C.V. C/ Melchor Ocampo, 193 Torre C, Piso 14, Letra D Colonia Verónica Anzures. Mexico 100.00%
Actividades de Servicios e Instalaciones Cobra, S.A. 2 Avda. 13-35 Zona 17, Ofi bodegas los Almendros Nº 3. 01017 Ciudad de Guatemala. Guatemala 100.00%
Actividades de Servicios e Instalaciones Cobra, S.A. Avda. Amazonas 3459-159 e Iñaquito Edifi cio Torre Marfi l. Ofi cina 101. Ecuador 100.00%
Actividades y Servicios, S.A. Nicaragua 5935 3 Piso. Buenos Aires. Argentina. 100.00%
Agadirver Rua Rui Teles Palhinha, 4. Leião. 2740-278 Porto Salvo. Portugal 74.54%
Agua Energía e Meio Ambiente, Ltda. Rua Marechal Camera, 160 sala 1621. Rio de Janeiro. Brazil. 100.00%
Al-Andalus Wind Power, S.L. Cardenal Marcelo Spínola, 10. 28016 Madrid. Spain 100.00%
Albatros Logistic, Maroc, S.A. Rue Ibnou El Coutia. Lotissement At Tawfi q hangar 10 Casablanca. Morocco 75.00%
Albatros Logistic, S.A. C/ Franklin Naves, 16-22. 28906 Getafe. Madrid. Spain 100.00%
Albufera Projetos e Serviços, Ltda. Av. Presidente Wilson 231, Sala 1701 Parte. Rio de Janeiro. Brazil 50.00%
Aldebarán S.M.E., S.A. Cardenal Marcelo Spínola, 10. 28016 Madrid. Spain 100.00%
Aldeire Solar, S.L. Cardenal Marcelo Spínola, 10. 28016 Madrid. Spain 100.00%
Aldeire Solar-2, S.L. Cardenal Marcelo Spínola, 10. 28016 Madrid. Spain 100.00%
Alfrani, S.L. C/ Manzanares, 4. 28005 Madrid. Spain 100.00%
Altomira Eólica, S.L. Cardenal Marcelo Spínola, 10. 28016 Madrid. Spain 100.00%
Andasol 3 Central Termosolar Tres, S.L. Cardenal Marcelo Spínola, 10. 28016 Madrid. Spain 100.00%
Andasol 4 Central Termosolar Cuatro, S.L. Cardenal Marcelo Spínola, 10. 28016 Madrid. Spain 100.00%
Andasol 5 Central Termosolar Cinco, S.L. Cardenal Marcelo Spínola, 10. 28016 Madrid. Spain 100.00%
Andasol 6 Central Termosolar Seis, S.L. Cardenal Marcelo Spínola, 10. 28016 Madrid. Spain 100.00%
Andasol 7 Central Termosolar Siete, S.L. Cardenal Marcelo Spínola, 10. 28016 Madrid. Spain 100.00%
Antennea Technologies, S.L. C/ Sepúlveda, 6. 28108 Alcobendas. Madrid. Spain 100.00%
Apadil Armad. Plást. y Acces. de Iluminación, S.A. E.N. 249/4 Km 4.6 Trajouce. Sâo Domingos de Rana. 2775, Portugal 100.00%
API Fabricación, S.A. Raso de la Estrella, s/n. 28300 Aranjuez. Spain 100.00%
API Movilidad, S.A. Avda. de Manoteras, 26. 28050 Madrid. Spain 100.00%
Aplied Control Technology, LLC. 5005 N. Stateline Av. Texarcana Texas TX 75503. United States of America 85.00%
Araraquara Transmissora de Energía, S.A. Av. Marechal Camara, 160 Sala 1036 (parte) Rio de Janeiro - Brazil 100.00%
Araucária Projetos e Serviços de Construção, Ltda. Av. Presidente Wilson 231, Sala 1701 Parte. Rio de Janeiro. Brazil 50.00%
Argencobra, S.A. Nicaragua 5935 2� Piso. CP C1414BWK Buenos Aires. Argentina 100.00%
Asistencia Offshore, S.A. Bajo de la Cabezuela, s/n.11510 Puerto Real. Cadiz. Spain. 100.00%
Atil-Cobra, S.A. Cardenal Marcelo Spínola, 10. 28016 Madrid. Spain 100.00%
Atlántica I Parque Eólico, S.A. Av. Carlos Gómez. Porto Alegre. Brazil. 99.99%
Atlántica II Parque Eólico, S.A. Avda. Marechal Camera, 160. Sala 120. Río de Janeiro. Brazil. 99.99%
Atlántica IV Parque Eólico, S.A. Avda. Marechal Camera, 160. Sala 120. Río de Janeiro. Brazil. 99.99%
Atlántica V Parque Eólico, S.A. Avda. Marechal Camara, 160. Rio de Janeiro. Brazil. 99.99%
Atlântico-Concessôes Transp Energia do Brazil Ltda. Rua Marcos Macedo 1333 sala 1410 Ed. P tio D. Luiz Torre II. 60150-190. Fortaleza. Brazil. 67.09%
Audeli, S.A. C/ Anabel Segura 11, edifi cio 2 C. Madrid 28108. Spain. 73.00%
B.I. Josebeso, S.A. Pz Venezuela, Torre Phelps s/n. 1050 Caracas. Venezuela 82.80%
Barra do Peixe Montagens e Serviços, Ltda. Avd. Marechal Camera, 160 sala 1621. Rio de Janeiro. Brazil. 99.90%
Benisaf Water Company, Spa 29 Bis Rue Abou Nouas, Hydra - Alger. Argel. Algeria. 51.00%
Berea Eólica, S.L. Cardenal Marcelo Spínola, 10. 28016 Madrid. Spain 70.00%
Biobeiraner, Lda. 3475-031 Caramulo. Fresquesia do Guardao - Conelho de Tondela. Portugal. 21.62%
Biodemira, Lda. Tagus Sapce - Rua Rui Teles Palhinha, N 4 2740-278. Porto Salvo. Portugal. 74.54%
Bioparque Mira, Lda. Tagus Sapce - Rua Rui Teles Palhinha, N 4 2740-278. Porto Salvo. Portugal. 74.54%
Biorio, Lda. Tagus Sapce - Rua Rui Teles Palhinha, N 4 2740-278. Porto Salvo. Portugal. 74.54%
BTOB Construccion Ventures, S.L. C/ Teide, 4-1ª Plta. 28709 San Sebastián de los Reyes. Madrid. Spain 100.00%
C. A. Weinfer de Suministro de Personal Pz Venezuela, Torre Phelps s/n. 1050 Caracas. Venezuela 82.80%
Cachoeira Montages e Serviços, Ltda. Marechal Camera,160 Rio de Janeiro. Brazil 20020 100.00%
Calidad e Inspecciones Offshore, S.L. Bajo de la Cabezuela, s/n.11510 Puerto Real. Cadiz. Spain. 100.00%
California Sun Power, LLC. 818 West Seventh Street Los Angeles California 90017. United States of America 100.00%
Calvache Eólica, S.L. Cardenal Marcelo Spínola, 10. 28016 Madrid. Spain 70.00%
Carta Valley Wind Power, LLC. 2711 Centerville Road Suite 400. Wilmington county of New Castle delaware 19808. U.S.A. 100.00%
Castellwind Asturias, S.L. C/ Celestino Junquera, 2, ofi cina 56. Gijón Spain 65.22%
Catalana de Treballs Públics, S.A. Carretera del Mig, 37. 08940 Cornella de Llobregat. Barcelona. Spain 100.00%
Cataventos Acarau, Ltda. Fazenda Libra Acarau S/N. 62.580-000. Acarau, Estado do Cear. Brazil. 74.54%
Cataventos de Paracuru, Ltda. Sitio Freixeiras S/N. 62.680-000. Paracuru, Estado do Cear. Brazil. 74.54%
Cataventos Embuaca, Ltda. Fazenda Bodes S/N Praia da Embuaca. 62.690-000. Trairi, Estado do Cear. Brazil. 74.54%
Catxeré Transmissora de Energía, S.A. Av. Marechal Camara, 160 Sala 1036 (parte) Rio de Janeiro - Brazil 100.00%
CCR Platforming Cangrejera S.A. de C.V. C/ Juan Racine, 112 Piso 8. 11510 Mexico DF 68.00%
Central Térmica de Mejillones, S.A Avda. José pedro Alessandri 2323 Macul. Santiago de Chile. Chile 100.00%
Centro de Control Villadiego, S.L. Cardenal Marcelo Spínola, 10. 28016 Madrid. Spain 100.00%
Chaparral Wind Power, S.L. Cardenal Marcelo Spínola 10. Madrid 28016. Spain 100.00%
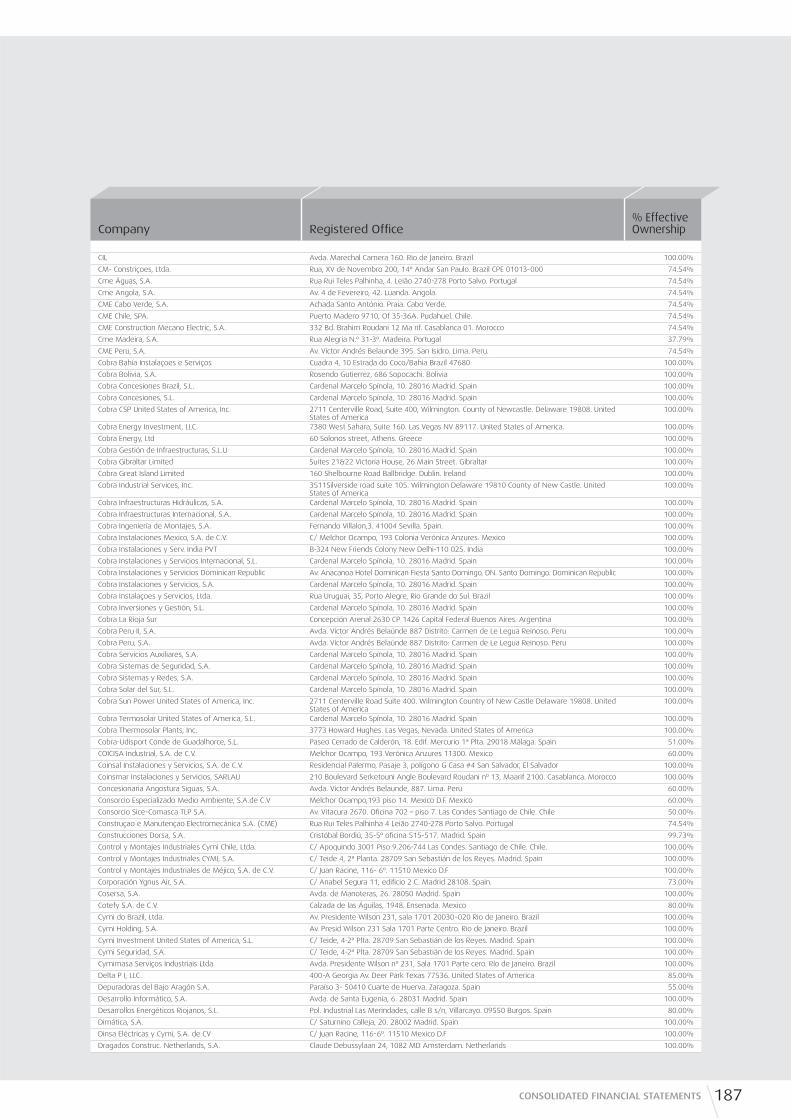
187CONSOLIDATED FINANCIAL STATEMENTS
Company Registered Offi ce% Effective Ownership
CIL Avda. Marechal Camera 160. Rio de Janeiro. Brazil 100.00%
CM- Constriçoes, Ltda. Rua, XV de Novembro 200, 14º Andar San Paulo. Brazil CPE 01013-000 74.54%
Cme Águas, S.A. Rua Rui Teles Palhinha, 4. Leião 2740-278 Porto Salvo. Portugal 74.54%
Cme Angola, S.A. Av. 4 de Fevereiro, 42. Luanda. Angola. 74.54%
CME Cabo Verde, S.A. Achada Santo António. Praia. Cabo Verde. 74.54%
CME Chile, SPA. Puerto Madero 9710, Of 35-36A. Pudahuel. Chile. 74.54%
CME Construction Mecano Electric, S.A. 332 Bd. Brahim Roudani 12 Ma rif. Casablanca 01. Morocco 74.54%
Cme Madeira, S.A. Rua Alegria N.º 31-3º. Madeira. Portugal 37.79%
CME Peru, S.A. Av. Víctor Andrés Belaunde 395. San Isidro. Lima. Peru. 74.54%
Cobra Bahía Instalaçoes e Serviços Cuadra 4, 10 Estrada do Coco/Bahia Brazil 47680 100.00%
Cobra Bolivia, S.A. Rosendo Gutierrez, 686 Sopocachi. Bolivia 100.00%
Cobra Concesiones Brazil, S.L. Cardenal Marcelo Spínola, 10. 28016 Madrid. Spain 100.00%
Cobra Concesiones, S.L. Cardenal Marcelo Spínola, 10. 28016 Madrid. Spain 100.00%
Cobra CSP United States of America, Inc. 2711 Centerville Road, Suite 400, Wilmington. County of Newcastle. Delaware 19808. United States of America
100.00%
Cobra Energy Investment, LLC. 7380 West Sahara, Suite 160. Las Vegas NV 89117. United States of America. 100.00%
Cobra Energy, Ltd 60 Solonos street, Athens. Greece 100.00%
Cobra Gestión de Infraestructuras, S.L.U Cardenal Marcelo Spínola, 10. 28016 Madrid. Spain 100.00%
Cobra Gibraltar Limited Suites 21&22 Victoria House, 26 Main Street. Gibraltar 100.00%
Cobra Great Island Limited 160 Shelbourne Road Ballbridge. Dublin. Ireland 100.00%
Cobra Industrial Services, Inc. 3511Silverside road suite 105. Wilmington Delaware 19810 County of New Castle. United States of America
100.00%
Cobra Infraestructuras Hidráulicas, S.A. Cardenal Marcelo Spínola, 10. 28016 Madrid. Spain 100.00%
Cobra Infraestructuras Internacional, S.A. Cardenal Marcelo Spínola, 10. 28016 Madrid. Spain 100.00%
Cobra Ingeniería de Montajes, S.A. Fernando Villalon,3. 41004 Sevilla. Spain. 100.00%
Cobra Instalaciones Mexico, S.A. de C.V. C/ Melchor Ocampo, 193 Colonia Verónica Anzures. Mexico 100.00%
Cobra Instalaciones y Serv. India PVT B-324 New Friends Colony New Delhi-110 025. India 100.00%
Cobra Instalaciones y Servicios Internacional, S.L. Cardenal Marcelo Spínola, 10. 28016 Madrid. Spain 100.00%
Cobra Instalaciones y Servicios Dominican Republic Av. Anacanoa Hotel Dominican Fiesta Santo Domingo, DN. Santo Domingo. Dominican Republic 100.00%
Cobra Instalaciones y Servicios, S.A. Cardenal Marcelo Spínola, 10. 28016 Madrid. Spain 100.00%
Cobra Instalaçoes y Servicios, Ltda. Rua Uruguai, 35, Porto Alegre, Rio Grande do Sul. Brazil 100.00%
Cobra Inversiones y Gestión, S.L. Cardenal Marcelo Spínola, 10. 28016 Madrid. Spain 100.00%
Cobra La Rioja Sur Concepción Arenal 2630 CP 1426 Capital Federal Buenos Aires. Argentina 100.00%
Cobra Peru II, S.A. Avda. Víctor Andrés Belaúnde 887 Distrito: Carmen de Le Legua Reinoso. Peru 100.00%
Cobra Peru, S.A. Avda. Víctor Andrés Belaúnde 887 Distrito: Carmen de Le Legua Reinoso. Peru 100.00%
Cobra Servicios Auxiliares, S.A. Cardenal Marcelo Spínola, 10. 28016 Madrid. Spain 100.00%
Cobra Sistemas de Seguridad, S.A. Cardenal Marcelo Spínola, 10. 28016 Madrid. Spain 100.00%
Cobra Sistemas y Redes, S.A. Cardenal Marcelo Spínola, 10. 28016 Madrid. Spain 100.00%
Cobra Solar del Sur, S.L. Cardenal Marcelo Spínola, 10. 28016 Madrid. Spain 100.00%
Cobra Sun Power United States of America, Inc. 2711 Centerville Road Suite 400. Wilmington Country of New Castle Delaware 19808. United States of America
100.00%
Cobra Termosolar United States of America, S.L. Cardenal Marcelo Spínola, 10. 28016 Madrid. Spain 100.00%
Cobra Thermosolar Plants, Inc. 3773 Howard Hughes. Las Vegas, Nevada. United States of America 100.00%
Cobra-Udisport Conde de Guadalhorce, S.L. Paseo Cerrado de Calderón, 18. Edif. Mercurio 1ª Plta. 29018 Málaga. Spain 51.00%
COICISA Industrial, S.A. de C.V. Melchor Ocampo, 193 Verónica Anzures 11300. Mexico 60.00%
Coinsal Instalaciones y Servicios, S.A. de C.V. Residencial Palermo, Pasaje 3, polígono G Casa #4 San Salvador, El Salvador 100.00%
Coinsmar Instalaciones y Servicios, SARLAU 210 Boulevard Serketouni Angle Boulevard Roudani nº 13, Maarif 2100. Casablanca. Morocco 100.00%
Concesionaria Angostura Siguas, S.A. Avda. Victor Andrés Belaunde, 887. Lima. Peru 60.00%
Consorcio Especializado Medio Ambiente, S.A.de C.V Melchor Ocampo,193 piso 14. Mexico D.F. Mexico 60.00%
Consorcio Sice-Comasca TLP S.A. Av. Vitacura 2670. Ofi cina 702 – piso 7. Las Condes Santiago de Chile. Chile 50.00%
Construçao e Manutençao Electromecánica S.A. (CME) Rua Rui Teles Palhinha 4 Leião 2740-278 Porto Salvo. Portugal 74.54%
Construcciones Dorsa, S.A. Cristóbal Bordiú, 35-5º ofi cina 515-517. Madrid. Spain 99.73%
Control y Montajes Industriales Cymi Chile, Ltda. C/ Apoquindo 3001 Piso 9.206-744 Las Condes. Santiago de Chile. Chile. 100.00%
Control y Montajes Industriales CYMI, S.A. C/ Teide 4, 2ª Planta. 28709 San Sebastián de los Reyes. Madrid. Spain 100.00%
Control y Montajes Industriales de Méjico, S.A. de C.V. C/ Juan Racine, 116- 6º. 11510 Mexico D.F 100.00%
Corporación Ygnus Air, S.A. C/ Anabel Segura 11, edifi cio 2 C. Madrid 28108. Spain. 73.00%
Cosersa, S.A. Avda. de Manoteras, 26. 28050 Madrid. Spain 100.00%
Cotefy S.A. de C.V. Calzada de las Águilas, 1948. Ensenada. Mexico 80.00%
Cymi do Brazil, Ltda. Av. Presidente Wilson 231, sala 1701 20030-020 Rio de Janeiro. Brazil 100.00%
Cymi Holding, S.A. Av. Presid Wilson 231 Sala 1701 Parte Centro. Rio de Janeiro. Brazil 100.00%
Cymi Investment United States of America, S.L. C/ Teide, 4-2ª Plta. 28709 San Sebastián de los Reyes. Madrid. Spain 100.00%
Cymi Seguridad, S.A. C/ Teide, 4-2ª Plta. 28709 San Sebastián de los Reyes. Madrid. Spain 100.00%
Cymimasa Serviços Industriais Ltda. Avda. Presidente Wilson nº 231, Sala 1701 Parte cero. Río de Janeiro. Brazil 100.00%
Delta P I, LLC. 400-A Georgia Av. Deer Park Texas 77536. United States of America 85.00%
Depuradoras del Bajo Aragón S.A. Paraíso 3- 50410 Cuarte de Huerva. Zaragoza. Spain 55.00%
Desarrollo Informático, S.A. Avda. de Santa Eugenia, 6. 28031 Madrid. Spain 100.00%
Desarrollos Energéticos Riojanos, S.L. Pol. Industrial Las Merindades, calle B s/n, Villarcayo. 09550 Burgos. Spain 80.00%
Dimática, S.A. C/ Saturnino Calleja, 20. 28002 Madrid. Spain 100.00%
Dinsa Eléctricas y Cymi, S.A. de CV C/ Juan Racine, 116-6º. 11510 Mexico D.F 100.00%
Dragados Construc. Netherlands, S.A. Claude Debussylaan 24, 1082 MD Amsterdam. Netherlands 100.00%

ConsolidatedFinancial Statements
188 ANNUAL REPORT 2011 OF ACS GROUP ECONOMIC AND FINANCIAL REPORT
Company Registered Offi ce% Effective Ownership
Dragados Gulf Construction, Ltda. P. O Box 3140 Al Khobar 31952 Kingdom of Saudi Arabia 100.00%
Dragados Industrial, S.A. Cardenal Marcelo Spínola, 10. 28016 Madrid. Spain 100.00%
Dragados Industrial Algerie S.P.A. Lot nº7 - Ville Coopérative El Feteh - El Bihar. Alger. Algérie 100.00%
Dragados Industrial Canada, Inc. 620 Rene Levesque West Suite 1000 H3B 1 N7 Montreal. Quebec. Canada 100.00%
Dragados Offshore de Méjico KU-A2, S.A. de C.V. Juan Racine n 112, piso 8, Col. Los Morales 11510 Mexico D.F. 100.00%
Dragados Offshore de Méjico, S.A. de C.V. Juan Racine n 112, piso 8, Col. Los Morales 11510 Mexico D.F. 100.00%
Dragados Offshore United States of America, Inc. One Riwerway, Suite 1700.77056 Texas. Houston. United States of America 100.00%
Dragados Offshore, S.A. Bajo de la Cabezuela, s/n. 11510 Puerto Real. Cádiz. Spain 100.00%
Dragados Proyectos Industriales de Méjico, S.A. de C.V. Juan Racine 112 8 piso Colonia Los Morales Mexico (DF) Delegacion Miguel Hidalgo 11510 100.00%
Dyctel infraestructura de Telecomunicaçoes, Ltda. C/ Rua Riachuelo, 268. 90010 Porto Alegre. Brazil 100.00%
Dyctel Infraestructuras de Telecomunicaciones, S.A. C/ La Granja, 29. 28108 Alcobendas. Madrid. Spain 100.00%
Ecocivil Electromur G.E., S.L. C/ Paraguay, Parcela 13/3. 30169 San Ginés. Murcia. Spain 94.50%
El Otero Wind Power, S.L. Cardenal Marcelo Spínola 10. Madrid 28016. Spain 100.00%
El Recuenco Eólica, S.L. Cardenal Marcelo Spínola 10. Madrid 28016. Spain 100.00%
Electren United States of America Inc. 500 Fifth Avenue, 38th fl oor. Nueva York 10110. United States of America 100.00%
Electrén, S.A. Avda. del Brazil, 6. 28020 Madrid. Spain 100.00%
Electromur, S.A. C/ Cuatro Vientos, 1. San Ginés. Murcia. Spain 100.00%
Electronic Traffi c, S.A. C/ Tres Forques, 147. 46014 Valencia. Spain 100.00%
Emplogest, S.A. Rua Alfredo Trinidade, 4 Lisboa. 01649 Portugal 98.21%
Emurtel, S.A. C/ Carlos Egea, parc. 13-18. P.I. Oeste. Alcantarilla. Murcia. Spain 50.10%
Enclavamientos y Señalización Ferroviaria, S.A. C/ La Granja, 29. 28108 Alcobendas. Madrid. Spain 100.00%
Enelec, S.A. Av. Marechal Gomes da Costa 27. 1800-255 Lisboa. Portugal 100.00%
Energía Sierrezuela, S.L. Cardenal Marcelo Spínola, 10. Madrid 28016. Spain 100.00%
Energía y Recursos Ambientales Internacional, S.L. Cardenal Marcelo Spínola, 10. Madrid 28016. Spain 100.00%
Energías Ambientales de Guadalajara, S.L. Cardenal Marcelo Spínola, 10. Madrid 28016. Spain 100.00%
Energías Ambientales de Oaxaca, S.A. de C.V. Juan Racine, 112 piso 6 Mexico D.F. 100.00%
Energías Ambientales de Soria, S.L. Cardenal Marcelo Spínola, 10. Madrid 28016. Spain 100.00%
Energías Renovables Andorranas, S.L. Cardenal Marcelo Spínola, 10. Madrid 28016. Spain 75.00%
Energías y Recursos Ambientales, S.A. Avda. de Pío XII, 102. 28036 Madrid. Spain 100.00%
Enipro, S.A. Rua Rui Teles Palhinha, 4. Leião. 2740-278 Porto Salvo. Portugal 74.54%
Enq, S.L. C/ F, nº 13. P.I. Mutilva Baja. Navarra. Spain 100.00%
Eólica del Guadiana, S.L. C/ Manuel Siurot, 27. 21004 Huelva. Spain 90.00%
Eólica Majadillas, S.L. Cardenal Marcelo Spínola 10. Madrid 28016. Spain 100.00%
Eólica Torrellana, S.L. Cardenal Marcelo Spínola 10. Madrid 28016. Spain 100.00%
EPC Ciclo Combinado Norte, S.A. de C.V. Melchor Ocampo, 193, Torre C piso 14D. 11300 Mexico D.F. Mexico 75.00%
Equipos de Señalización y Control, S.A. C/ Severino Covas, 100. Vigo. Pontevedra. Spain 100.00%
Etra Cataluña, S.A. C/ Mercuri, 10-12. Cornellá de Llobregat. Barcelona. Spain 100.00%
Etra Interandina, S.A. C/ 100, nº 8A-51, Of. 610 Torre B. Santafe de Bogota. Colombia 100.00%
Etra Investigación y Desarrollo, S.A. C/ Tres Forques, 147. 46014 Valencia. Spain 100.00%
Etracontrol, S.L. Av. Manoteras, 28.28050 Madrid. Spain. 100.00%
Etralux, S.A. C/ Tres Forques, 147. 46014 Valencia. Spain 100.00%
Etranorte, S.A. C/ Errerruena, pab. G. P.I. Zabalondo. Munguia. Vizcaya. Spain 100.00%
Extresol 2, S.L. Torre de Miguel Sesmero. Badajoz Carretera N-432 Badajoz-Granada km 32,700. Spain 100.00%
Extresol 3, S.L. Cardenal Marcelo Spínola, 10. 28016 Madrid. Spain 100.00%
Extresol-1, S.L. Cardenal Marcelo Spínola, 10. 28016 Madrid. Spain 100.00%
Extresol-4 S.L. Cardenal Marcelo Spínola, 10.28016 Madrid. Spain 100.00%
Eyra Energías y Recursos Ambientais, Lda. Avda Sidonio Pais, 28 Lisboa. Portugal 98.00%
Eyra Instalaciones y Servicios, S.L. Cardenal Marcelo Spínola,10.28016 Madrid. Spain 100.00%
Eyra Wind Power United States of America Inc 2711 Centerville Road Suite 400. Wilmington county of New Castle delaware 19808. United States of America
100.00%
France Semi, S.A. 20/22 Rue Louis Armand rdc. 75015 Paris. France 99.73%
Fuengirola Fotovoltaica, S.L. CL Sepulveda, 6 28108 Alcobendas. Madrid. Spain 100.00%
Garby Aprovechamientos Energéticos, S.L. José Luis Bugallal Marchesi, 20. 15008 La Coruña. Spain 100.00%
Geida Beni Saf, S.L. Cardenal Marcelo Spínola, 10. 28016 Madrid. Spain 100.00%
Gerovitae La Guancha, S.A. Ctra. del Rosario Km 5,2. La Laguna. 38108 Santa Cruz Tenerife. Islas Canarias. Spain 100.00%
Gestâo de Negocios Internacionais SGPS, S.A. Rua Rui Teles Palhinha 4 - 3º Lei o 2740-278. Porto Salvo. Portugal. 74.54%
Global Spa, S.L. Camino Vell de Bunyola, 37. 07009 Palma de Mallorca. Islas Baleares. Spain 100.00%
Golden State Environmental Tedagua Corporation, S.A. Cardenal Marcelo Spínola, 10. 28016 Madrid. Spain 100.00%
Grafi c Planet Digital, S.A.U. C/ Anabel Segura,10 2º. 28109 Madrid. Spain 100.00%
Guatemala de Tráfi co y Sistemas, S.A. C/ Edifi cio Murano Center, 14. Ofi cina 803 3-51. Zona 10. Guatemala 100.00%
H.E.A Instalaçoes Ltda. Rua das Patativas, 61 Salvador de Bahía. Brazil 55.00%
Hidra de Telecomunicaciones y Multimedia, S.A. C/ Severo Ochoa, 10. 29590 Campanillas. Málaga. Spain 100.00%
Hidraulica de Cochea, S.A. Dr Ernesto Perez Balladares, s/n. Chiriqui. Panama 100.00%
Hidráulica de Mendre, S.A. Dr. Ernesto Pérez Balladares. Provincia de Chiriqui. Panama 100.00%
Hidráulica de Pedregalito S.A. Urbanización Doleguita Calle D Norte, Edifi cio Plaza Real, Apto/Local 1. Chiriqui. Panama 100.00%
Hidraúlica del Alto, S.A. Dr. Ernesto Pérez Balladares. Provincia de Chiriqui. Panama 75.00%
Hidráulica del Chiriqui, S.A. Dr. Ernesto Pérez Balladares. Provincia de Chiriqui. Panama 100.00%
Hidráulica Río Piedra, S.A. Dr. Ernesto Pérez Balladares David. Chiriqui. Panama 100.00%
Hidraúlica San José, S.A. Dr. Ernesto Perez Balladares, s/n. Chiriqui. Panama 100.00%
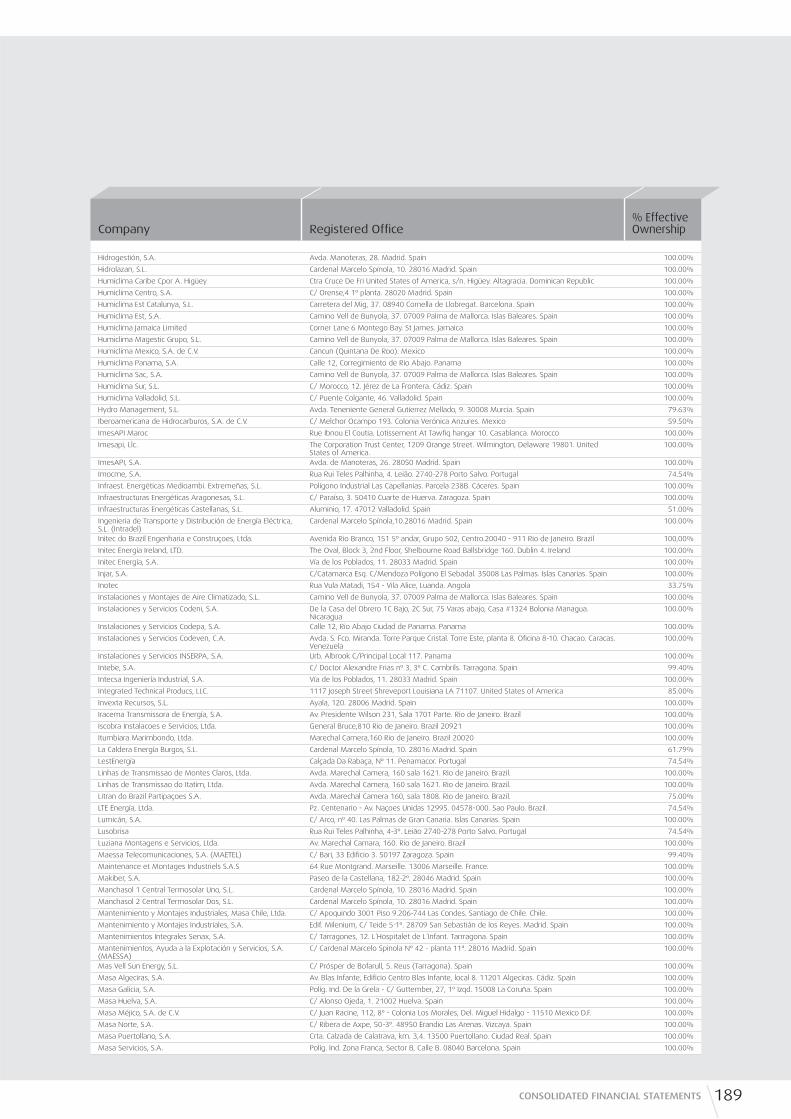
189CONSOLIDATED FINANCIAL STATEMENTS
Company Registered Offi ce% Effective Ownership
Hidrogestión, S.A. Avda. Manoteras, 28. Madrid. Spain 100.00%
Hidrolazan, S.L. Cardenal Marcelo Spínola, 10. 28016 Madrid. Spain 100.00%
Humiclima Caribe Cpor A. Higüey Ctra Cruce De Fri United States of America, s/n. Higüey. Altagracia. Dominican Republic 100.00%
Humiclima Centro, S.A. C/ Orense,4 1º planta. 28020 Madrid. Spain 100.00%
Humiclima Est Catalunya, S.L. Carretera del Mig, 37. 08940 Cornella de Llobregat. Barcelona. Spain 100.00%
Humiclima Est, S.A. Camino Vell de Bunyola, 37. 07009 Palma de Mallorca. Islas Baleares. Spain 100.00%
Humiclima Jamaica Limited Corner Lane 6 Montego Bay. St James. Jamaica 100.00%
Humiclima Magestic Grupo, S.L. Camino Vell de Bunyola, 37. 07009 Palma de Mallorca. Islas Baleares. Spain 100.00%
Humiclima Mexico, S.A. de C.V. Cancun (Quintana De Roo). Mexico 100.00%
Humiclima Panama, S.A. Calle 12, Corregimiento de Rio Abajo. Panama 100.00%
Humiclima Sac, S.A. Camino Vell de Bunyola, 37. 07009 Palma de Mallorca. Islas Baleares. Spain 100.00%
Humiclima Sur, S.L. C/ Morocco, 12. Jérez de La Frontera. Cádiz. Spain 100.00%
Humiclima Valladolid, S.L. C/ Puente Colgante, 46. Valladolid. Spain 100.00%
Hydro Management, S.L. Avda. Teneniente General Gutierrez Mellado, 9. 30008 Murcia. Spain 79.63%
Iberoamericana de Hidrocarburos, S.A. de C.V. C/ Melchor Ocampo 193. Colonia Verónica Anzures. Mexico 59.50%
ImesAPI Maroc Rue Ibnou El Coutia. Lotissement At Tawfi q hangar 10. Casablanca. Morocco 100.00%
Imesapi, Llc. The Corporation Trust Center, 1209 Orange Street. Wilmington, Delaware 19801. United States of America.
100.00%
ImesAPI, S.A. Avda. de Manoteras, 26. 28050 Madrid. Spain 100.00%
Imocme, S.A. Rua Rui Teles Palhinha, 4. Leião. 2740-278 Porto Salvo. Portugal 74.54%
Infraest. Energéticas Medioambi. Extremeñas, S.L. Polígono Industrial Las Capellanías. Parcela 238B. Cáceres. Spain 100.00%
Infraestructuras Energéticas Aragonesas, S.L. C/ Paraíso, 3. 50410 Cuarte de Huerva. Zaragoza. Spain 100.00%
Infraestructuras Energéticas Castellanas, S.L. Aluminio, 17. 47012 Valladolid. Spain 51.00%
Ingenieria de Transporte y Distribución de Energía Eléctrica, S.L. (Intradel)
Cardenal Marcelo Spínola,10.28016 Madrid. Spain 100.00%
Initec do Brazil Engenharia e Construçoes, Ltda. Avenida Rio Branco, 151 5º andar, Grupo 502, Centro.20040 - 911 Rio de Janeiro. Brazil 100,00%
Initec Energía Ireland, LTD. The Oval, Block 3, 2nd Floor, Shelbourne Road Ballsbridge 160. Dublin 4. Ireland 100.00%
Initec Energía, S.A. Vía de los Poblados, 11. 28033 Madrid. Spain 100.00%
Injar, S.A. C/Catamarca Esq. C/Mendoza Polígono El Sebadal. 35008 Las Palmas. Islas Canarias. Spain 100.00%
Inotec Rua Vula Matadi, 154 - Vila Alice, Luanda. Angola 33.75%
Instalaciones y Montajes de Aire Climatizado, S.L. Camino Vell de Bunyola, 37. 07009 Palma de Mallorca. Islas Baleares. Spain 100.00%
Instalaciones y Servicios Codeni, S.A. De la Casa del Obrero 1C Bajo, 2C Sur, 75 Varas abajo, Casa #1324 Bolonia Managua. Nicaragua
100.00%
Instalaciones y Servicios Codepa, S.A. Calle 12, Rio Abajo Ciudad de Panama. Panama 100.00%
Instalaciones y Servicios Codeven, C.A. Avda. S. Fco. Miranda. Torre Parque Cristal. Torre Este, planta 8. Ofi cina 8-10. Chacao. Caracas. Venezuela
100.00%
Instalaciones y Servicios INSERPA, S.A. Urb. Albrook C/Principal Local 117. Panama 100.00%
Intebe, S.A. C/ Doctor Alexandre Frias nº 3, 3º C. Cambrils. Tarragona. Spain 99.40%
Intecsa Ingeniería Industrial, S.A. Vía de los Poblados, 11. 28033 Madrid. Spain 100.00%
Integrated Technical Producs, LLC. 1117 Joseph Street Shreveport Louisiana LA 71107. United States of America 85.00%
Invexta Recursos, S.L. Ayala, 120. 28006 Madrid. Spain 100.00%
Iracema Transmissora de Energía, S.A. Av. Presidente Wilson 231, Sala 1701 Parte. Rio de Janeiro. Brazil 100.00%
Iscobra Instalacoes e Servicios, Ltda. General Bruce,810 Rio de Janeiro. Brazil 20921 100.00%
Itumbiara Marimbondo, Ltda. Marechal Camera,160 Rio de Janeiro. Brazil 20020 100.00%
La Caldera Energía Burgos, S.L. Cardenal Marcelo Spínola, 10. 28016 Madrid. Spain 61.79%
LestEnergía Calçada Da Rabaça, Nº 11. Penamacor. Portugal 74.54%
Linhas de Transmissao de Montes Claros, Ltda. Avda. Marechal Camera, 160 sala 1621. Rio de Janeiro. Brazil. 100.00%
Linhas de Transmissao do Itatim, Ltda. Avda. Marechal Camera, 160 sala 1621. Rio de Janeiro. Brazil. 100.00%
Litran do Brazil Partipaçoes S.A. Avda. Marechal Camera 160, sala 1808. Rio de Janeiro. Brazil. 75.00%
LTE Energía, Ltda. Pz. Centenario - Av. Naçoes Unidas 12995. 04578-000. Sao Paulo. Brazil. 74.54%
Lumicán, S.A. C/ Arco, nº 40. Las Palmas de Gran Canaria. Islas Canarias. Spain 100.00%
Lusobrisa Rua Rui Teles Palhinha, 4-3º. Leião 2740-278 Porto Salvo. Portugal 74.54%
Luziana Montagens e Servicios, Ltda. Av. Marechal Camara, 160. Rio de Janeiro. Brazil 100.00%
Maessa Telecomunicaciones, S.A. (MAETEL) C/ Bari, 33 Edifi cio 3. 50197 Zaragoza. Spain 99.40%
Maintenance et Montages Industriels S.A.S 64 Rue Montgrand. Marseille. 13006 Marseille. France. 100.00%
Makiber, S.A. Paseo de la Castellana, 182-2º. 28046 Madrid. Spain 100.00%
Manchasol 1 Central Termosolar Uno, S.L. Cardenal Marcelo Spínola, 10. 28016 Madrid. Spain 100.00%
Manchasol 2 Central Termosolar Dos, S.L. Cardenal Marcelo Spínola, 10. 28016 Madrid. Spain 100.00%
Mantenimiento y Montajes Industriales, Masa Chile, Ltda. C/ Apoquindo 3001 Piso 9.206-744 Las Condes. Santiago de Chile. Chile. 100.00%
Mantenimiento y Montajes Industriales, S.A. Edif. Milenium, C/ Teide 5-1º. 28709 San Sebastián de los Reyes. Madrid. Spain 100.00%
Mantenimientos Integrales Senax, S.A. C/ Tarragones, 12. L´Hospitalet de L´Infant. Tarrragona. Spain 100.00%
Mantenimientos, Ayuda a la Explotación y Servicios, S.A. (MAESSA)
C/ Cardenal Marcelo Spinola Nº 42 - planta 11ª. 28016 Madrid. Spain 100.00%
Mas Vell Sun Energy, S.L. C/ Prósper de Bofarull, 5. Reus (Tarragona). Spain 100.00%
Masa Algeciras, S.A. Av. Blas Infante, Edifi cio Centro Blas Infante, local 8. 11201 Algeciras. Cádiz. Spain 100.00%
Masa Galicia, S.A. Políg. Ind. De la Grela - C/ Guttember, 27, 1º Izqd. 15008 La Coruña. Spain 100.00%
Masa Huelva, S.A. C/ Alonso Ojeda, 1. 21002 Huelva. Spain 100.00%
Masa Méjico, S.A. de C.V. C/ Juan Racine, 112, 8º - Colonia Los Morales, Del. Miguel Hidalgo - 11510 Mexico D.F. 100.00%
Masa Norte, S.A. C/ Ribera de Axpe, 50-3º. 48950 Erandio Las Arenas. Vizcaya. Spain 100.00%
Masa Puertollano, S.A. Crta. Calzada de Calatrava, km. 3,4. 13500 Puertollano. Ciudad Real. Spain 100.00%
Masa Servicios, S.A. Políg. Ind. Zona Franca, Sector B, Calle B. 08040 Barcelona. Spain 100.00%

ConsolidatedFinancial Statements
190 ANNUAL REPORT 2011 OF ACS GROUP ECONOMIC AND FINANCIAL REPORT
Company Registered Offi ce% Effective Ownership
Masa Tenerife, S.A. Pº Milicias de Garachico, 1, 4º, Ofi c. 51 - Edif. Hamilton. 38002 Sta. Cruz de Tenerife. Islas Canarias. Spain 100.00%
MASE Internacional, CRL PO Box 364966. San Juan. Puerto Rico. 100.00%
Mencli, S.L. C/ Biniarroca s/n, Local 16. 07710 Sant Lluis. Menorca. Islas Baleares. Spain. 100.00%
Mexicana de Servicios Auxiliares, S.A. de C.V. Av. Paseo de la Reforma, 404. Piso 15.1502. Colonia Juarez. Delegación Cuauhtemoc. 06600 Mexico D.F. Mexico
100.00%
Mexicobra, S.A. Colonia Polanco C/Alejandro Dumas,160. Mexico D.F. 11500 100.00%
Mexsemi, S.A. de C.V. Avda. Dolores Hidalgo 817 CD Industrial Irapuato Gto. 36541. Mexico 99.73%
Midasco, Llc. 7121 Dorsey Run Road Elkrige. Maryland 21075-6884. United States of America 100.00%
Mimeca, C.A. Pz Venezuela, Torre Phelps s/n. 1050 Caracas. Venezuela 82.80%
Minuano Montangens e Servicios, Ltda. Avda. Marechal Camera, 160 Sala 1626. Rio de Janeiro. Brazil 100.00%
Moncobra Canarias Instalaciones, S.A. León y Castillo, 238. 35005 Las Palmas de Gran Canaria. Islas Canarias. Spain 100.00%
Moncobra Peru Avda Víctor Andrés Belaúnde 887 Distrito: Carmen de le Legua Reinoso. Peru 100.00%
Moncobra, S.A. Cardenal Marcelo Spínola, 10. 28016 Madrid. Spain 100.00%
Monelec, S.L. C/ Ceramistas, 14. Málaga. Spain 100.00%
Montrasa Maessa Asturias, S.L. C/ Camara, nº 54-1º dchra. 33402 Avilés. Asturias. Spain 50.00%
Moyano Maroc SRALU 269 8D Zertouni Etg 5 Appt 1. Casablanca. Morocco 100.00%
Murciana de Tráfi co, S.A. Carril Molino Nerva, s/n. Murcia. Spain 100.00%
NGS - New Generation Services, Ltda. Pz. Centenario - Av. Naçoes Unidas 12995. 04578-000Sao Paulo. Brazil 74.54%
NGS - New Generation Supplier, Unipessoal Lda Rua Rui Teles Palhinha, Nº 4, 3º Andar 2740-278 Porto Salvo Lisboa. Portugal 74.54%
North Africa Infraestructures, S.L. Cardenal Marcelo Spínola, 10.28016 Madrid. Spain 51.00%
OCP Peru Avda Víctor Andrés Belaúnde 887 Distrito: Carmen de le Legua Reinoso 100.00%
Ofi cina Técnica de Estudios y Control de Obras, S.A C/ Guzmán el Bueno, 133-1º. Edifi cio Britania. 28003 Madrid. Spain 100.00%
Opade Organizac. y Promoc de Actividades Deportivas, S.A. Avda. de América, 10. Madrid. Spain 100.00%
P.E. Sierra de las Carbas, S.L. Cardenal Marcelo Spínola, 10. 28016 Madrid. Spain 61.79%
P.E. Marcona, S.R.L. Alfredo Salazar, 409 Mirafl ores. Lima. Peru 99.99%
P.E. Monte das Aguas, S.L. Cardenal Marcelo Spínola, 10. 28016 Madrid. Spain 60.00%
P.E. Monte dos Nenos, S.L. José Luis Bugallal Marchesi, 20. 15008 La Coruña. Spain 100.00%
P.E. Donado, S.L. Cardenal Marcelo Spínola, 10. 28016 Madrid. Spain 100.00%
P.E. Tesosanto, S.L. Cardenal Marcelo Spínola, 10. 28016 Madrid. Spain 61.79%
Parque Eólico Buseco, S.L. Comandante Caballero, 8. 33005 Oviedo. Asturias. Spain 80.00%
Parque Eólico de Valdecarro, S.L. Cardenal Marcelo Spínola, 10. 28016 Madrid. Spain 100.00%
Parque Eólico La Boga, S.L. Cardenal Marcelo Spínola, 10. 28016 Madrid. Spain 75.00%
Parque Eólico Marmellar, S.L. Cardenal Marcelo Spínola, 10. 28016 Madrid. Spain 70.10%
Parque Eólico Santa Catalina, S.L. La Paz, 23-2ºB. Valencia. Spain 100.00%
Parque Eólico Tadeas, S.L. Cardenal Marcelo Spínola, 10. 28016 Madrid. Spain 51.48%
Parque Eólico Tres Hermanas, S.A.C Avda. Alfredo Salazar,409. Lima. Peru 100.00%
Parque Eólico Valcaire, S.L. Ayuntamiento, 7 Padul. 18640 Granada. Spain 100.00%
Parque Eólico Valdehierro, S.L. Cardenal Marcelo Spínola, 10. 28016 Madrid. Spain 51.48%
Percomex, S.A. Melchor Ocampo, 193 Torre C-Colonia Verónica Anzures. Mexico 100.00%
Pilatequia, S.L. C/ Velazquez 61 Planta 1, Puerta IZQ.28001 Madrid. Spain 52.18%
Planta de Tratamiento de Aguas Residuales, S.A. Avda Argentina, 2415 Lima. Peru 100.00%
Porto Primavera, Ltda. Rua Marechal Camara,160. Rio de Janeiro. Brazil 100.00%
Procme, S.A. Rua Rui Teles Palhinha, 4. Leião 2740-278 Porto Salvo. Portugal 74.54%
Promservi, S.A. Avda. de Manoteras, 26. 28050 Madrid. Spain 100.00%
Recursos Ambientales de Guadalajara, S.L. Cardenal Marcelo Spínola 10. Madrid 28016. Spain 100.00%
Recursos Eólicos de Mexico, S.A. de C.V. Juan Racine, 112 piso 6. Mexico D.F. Mexico 100.00%
Red Top Wind power, LLC. 2711 Centerville Road Suite 400. Wilmington County of New Castle Delaware 19808. United States of America
100.00%
Remodelación el Sauz, S.A. de C.V. José Luis Lagrande, 103 P-8. Los Morales Polanco. Mexico 95.00%
Repotenciación C.T. Manzanillo, S.A. de C.V. Juan Racine,112 piso 8. Mexico D.F. Mexico. 100.00%
Riansares Eólica, S.L. Cardenal Marcelo Spínola, 10. 28016 Madrid. Spain 70.00%
Ribagrande Energía, S.L. Cardenal Marcelo Spínola 10. Madrid 28016. Spain 100.00%
Rioparque, Lda. Tagus Sapce - Rua Rui Teles Palhinha, N 4 2740-278. Porto Salvo. Portugal 74.54%
Robledo Eólica, S.L. Cardenal Marcelo Spínola 10. Madrid 28016. Spain 100.00%
Roura Cevasa, S.A. Caracas, 5. Barcelona. Spain 100.00%
Salmantina de Seguridad Vial, S.A. Cascalajes, 65-69. 37184 Villares de la Reina. Salamanca. Spain 100.00%
Sao-Simao Montagens e Servicos de Electricidade, Ltda. Rua Marechal Camara, 160. Rio de Janeiro. Brazil 100.00%
Sedmiruma, S.R.L. Bucarest, sector 3, Str Ion Nistor 4. Romania 100.00%
Sedmive, C.A. (Soc. Españ. Montajes Indus Venezuela) Av. Rómulo Gallegos con 4ta. Av. Palos Grandes, 1ra. Av. Santa Eduvigis, edifi cio KLM, piso 2 ofi cina 2-D Urb. Los Palos Grandes, zona postal 1060 Caracas, Venezuela
100.00%
Seguridad Integral Metropolitana, S.A. C/ La Granja, 29. 28108 Alcobendas. Madrid. Spain 90.00%
SEMI Bulgaria, S.L.U. Calle Stara Planina, 5. Sofi a. Bulgaria 100.00%
Semi Germany, S.A. Schlüter Str. 17 10625. Berlin. Germany 100.00%
Semi Italy, S.R.L. Via Uberto Visconti Di Modrone 3. Milan. Italy 100.00%
Semi Maroc, S.A. 5 Rue Fakir Mohamed. Casablanca Sidi Belyout. Morocco 99.73%
SEMI Panama, S.A. Edifi cio El Peñón, calle 40, Bellavista. Panama 100.00%
Semi Polska Ul. Flory 9. Warsaw. Poland 100.00%
Semi Dominican Republic, S.R.L. Av John Kennedy, Esq Lope de Vega, Edif. Scotiabank. Santo Domingo. Dominican Republic 100.00%
Semicosta Inc Sociedad Anónima Diagonal al parque del Centro Comercial el Pueblo. San José. Costa Rica 100.00%

191CONSOLIDATED FINANCIAL STATEMENTS
Company Registered Offi ce% Effective Ownership
Sermacon Joel, C.A. Pz Venezuela, Torre Phelps s/n. 1050 Caracas. Venezuela 82.80%
Sermicro, S.A. C/ Pradillo, 46. 28002 Madrid. Spain 100.00%
Serpimex, S.A. de C.V. Juan Racine 112 8. Colonia Los Morales Polanco. Delegación Miguel Hidalgo. Mexico DF 11510
100.00%
Serpista, S.A. Cardenal Marcelo Spínola, 10. 28016 Madrid. Spain 51.00%
Serrezuela Solar II, S.L. Rafael Calvo, 42 Bj Dcha.28010 Madrid. Spain 100.00%
Serveis Catalans, Serveica, S.A. Avda. de Manoteras, 26. 28050 Madrid. Spain 100.00%
Servicios Administrativos Offshore, S.A. de C.V. Juan Racine 112 8º piso Colonia Los Morales 11510. Mexico D.F. Mexico 100.00%
Servicios Cymimex, S.A. de C.V. Juan Racine 112 6º piso Colonia Los Morales 11510. Mexico D.F. Mexico 100.00%
Servicios Dinsa, S.A. de C.V. Juan Racine 112 3º piso Colonia Los Morales Mexico (DF) Delegación Miguel Hidalgo 11510 100.00%
Servicios Logísticos y Auxiliares de Occidente, S.A. Avda. Ofi bodegas Los Almendros, 3 13-35 Guatemala 100.00%
Servicios Operativos Offshore, S.A. de C.V. Juan Racine Nº 112 Piso 8 Col. Los Morales C.P. 11510 Mexico D.F. 100.00%
Servicios Proyectos Industriales de Méjico, S.A. de C.V. Juan Racine 112 8 piso Colonia Los Morales Mexico (DF) Delegación Miguel Hidalgo 11510 100.00%
Sete Lagoas Transmissora de Energia, Ltda. Avda. Marechal Camera, 160. Río de Janeiro. Brazil. 100.00%
Setec Soluçoes Energeticas de Transmissao e Controle, Ltda.
Av. Presidente Wilson 231, sala 1701 20030-020 Rio de Janeiro. Brazil 100.00%
Sice do Brazil, S.A. C/ Joaquim Eugenio de Lima, 680. Sao Paulo. Brazil 100.00%
Sice Energía, S.L. C/ Sepúlveda, 6. 28108 Alcobendas. Madrid. Spain 100.00%
Sice Hellas Sistemas Tecnológicos Sociedad Unipersonal de Responsabilidad Limitada
C/ Omirou. 14562 Kifi ssia. Greece 100.00%
Sice NZ Limited Level 4, Corner Kent & Crowhurst Streets, New Market. Auckland, 1149. Australia 100.00%
SICE PTY, Ltd. Level 5, Mayne Building. 390 St. Kilda Road, Melbourne, Vicotira 3004. Australia 100.00%
Sice Puerto Rico, Inc. C/ Fordham 275 San Juan PR 00927. University Gardens. Puerto Rico 100.00%
Sice South Africa Pty, Ltd. C/ PO Box 179. 009 Pretoria, Sudáfrica 100.00%
Sice Tecnología en Minería, S.A. Av. Vitacura 2670. Ofi cina 702 – piso 7. Las Condes Santiago de Chile. Chile 100.00%
Sice Tecnología y Sistemas, S.A. C/ Sepúlveda, 6. 28108 Alcobendas. Madrid. Spain 100.00%
SICE, Inc. Two Alhambra Plaza,suite 1106. Coral Gables. Fl 33134. Miami. United States of America 100.00%
SICE, LLC. Rublesvkoye Shosse 83/1 121467 Moscu. Russia 100.00%
Sidetel, S.A. Avda. Manoteras, 28. Madrid. Spain 100.00%
Sistemas Integrales de Mantenimiento, S.A. C/ Teide, 5-1º. 28709 San Sebastián de los Reyes. Madrid. Spain 100.00%
Sistemas Radiantes F. Moyano, S.A. C/ De La Cañada, 53. 28850 Torrejón de Ardoz. Madrid. Spain 100.00%
Sistemas Sec, S.A. C/ Mirafl ores 383. Santiago de Chile. Chile 51.00%
Small Medium Enterprises Consulting, B.V. Claude Debussylaan, 44, 1082 MD. Amsterdam. Netherlands 74.54%
Soc Iberica de Construcciones Electricas de Seguridad, S.L. C/ La Granja 29. 28108 Alcobendas. Madrid. Spain 100.00%
Soc. Española de Montajes Industriales, S.A. (SEMI) C/ Manzanares, 4. 28005 Madrid. Spain 99.73%
Sociedad Ibérica de Construcciones Eléctricas, S.A. C/ Sepúlveda, 6. 28108 Alcobendas. Madrid. Spain 100.00%
Sociedad Industrial de Construccion Eléctricas, S.A C/ Aquilino de la Guardia. Edifi cio IGRA Local 2. Urbanización Bella Vista Panama 100.00%
Sociedad Industrial de Construcciones Eléctricas de Costa Rica, S.A.
C/ San Jose Barrio Los Yoses - Final Avenida Diez.25 m. norte y 100 este. San Jose. Costa Rica 100.00%
Sociedad Industrial de Construcciones Eléctricas Siceandina, S.A.
C/ Chinchinal, 350. Barrio El Inca. Pichincha - Quito (Ecuador) 100.00%
Sociedad Industrial de Construcciones Eléctricas, S.A. de C.V. Paseo de la Reforma, 404. Despacho 1502, Piso 15 Col. Juarez 06600 Delegación Cuauhtemoc Mexico D.F.
100.00%
Sociedad Industrial de Construcciones Eléctricas, S.L., Ltda. CL 94 NO. 15 32 P 8. Bogota D.C. Colombia 100.00%
Société Industrielle de Construction Electrique, S.A.R.L. Espace Porte D Anfa 3 Rue Bab Mansour Imm C 20000 Casa Blanca. Morocco 100.00%
Soluciones Auxiliares de Guatemala, S.A. 2 Avda. 13-35 Zona 17, Ofi bodegas los Almendros Nº 3. 01017 Ciudad de Guatemala. Guatemala
100.00%
Soluciones Eléctricas Integrales de Guatemala, S.A. 2 Avda. 13-35 Zona 17, Ofi bodegas los Almendros Nº 3. 01017 Ciudad de Guatemala. Guatemala
100.00%
Spcobra Instalaçoes e Serviços, Ltda. Joao Ventura Batista,986 Sao Paulo. Brazil 02054 56.00%
Sti Telecom Spa Av. Vitacura 2670. Ofi cina 702 – piso 7. Las Condes Santiago de Chile. Chile 100.00%
Sumipar, S.A. C/ B Sector B Zona Franca 4. 08040 Barcelona. Spain 100.00%
Tecneira Acarau Geraçao e Comercialiçao de Energia Eletrica S.A.
Rua Marcos Macedo 1333 Sala 416 CEP 60.150-190 Aldeota. Fortaleza. Brazil 74.54%
Tecneira do Paracuru, Ltda. Sitio Freixeiras, S/N. 62.680-000. Paracuru, Estado do Cear. Brazil 74.54%
Tecneira Novas Enerias SGPS, S.A. Rua Rui Teles Palhinha, 4. Leiao 2740 Oeiras. Portugal 74.54%
Tecneira, S.A. Rua Rui Teles Palhinha, 4. Leião 2740-278 Porto Salvo. Portugal 74.54%
Técnicas de Desalinización de Aguas, S.A. Procesador, 19. Telde 35200 Las Palmas. Islas Canarias. Spain 100.00%
Tecnicas de Sistemas Electrónicos, S.A. (Eyssa-Tesis) Rua General Pimenta do Castro 11-1. Lisboa. Portugal 100.00%
Tecnotel Clima, S.L. Pg Ind. Valle Guimar Manz, 6. Arafo. Santa Cruz de Tenerife. Islas Canarias. Spain 100.00%
Tecnotel de Canarias, S.A. Misiones, 13. Las Palmas de Gran Canaria. Spain 100.00%
Tedagua Internacional, S.L. Cardenal Marcelo Spínola, 10.28016 Madrid. Spain 100.00%
Tedagua Renovables, S.L. Procesador, 19. Telde 35200 Las Palmas. Islas Canarias. Spain 100.00%
Telcarrier, S.A. C/ La Granja, 29. 28108 Alcobendas. Madrid. Spain 100.00%
Telsa Instalaciones de Telecomunicaciones y Electricidad, S.A. C/ La Granja, 29. 28108 Alcobendas. Madrid. Spain 100.00%
Tesca Ingenieria del Ecuador, S.A. Avda. 6 de diciembre N37-153 Quito. Ecuador 100.00%
TNG Brazil, Ltda. Av. Dom Luis Paracuru 1200, Bairro de Meireles. 60.160-230. Fortaleza, Estado do Cear. Brazil 74.54%
Tonopah Solar Energy Holdings I, LLC. 7380 West Sahara, Suite 160. Las Vegas NV 89117. United States of America 36.60%
Tonopah Solar Energy Holdings II, LLC. 2425 Olympic Blvd, suite 500E. Santa Monica, CA 90404. United States of America 36.60%
Tonopah Solar Energy, LLC 2425 Olympic Blvd, suite 500E. Santa Monica, CA 90404. United States of America 36.60%
Trafi urbe, S.A. Estrada Oct vio Pato C Empresar-Sao Domingo de Rana. Portugal 76.20%
Triana do Brazil Projetos e Serviços, Ltda. Av. Presidente Wilson 231, Sala 1701 Parte. Rio de Janeiro. Brazil 50.00%
Trigeneración Extremeña, S.L. Cardenal Marcelo Spínola, 10.28016 Madrid. Spain. 100.00%

ConsolidatedFinancial Statements
192 ANNUAL REPORT 2011 OF ACS GROUP ECONOMIC AND FINANCIAL REPORT
Company Registered Offi ce% Effective Ownership
Tucurui Dourados Montagens e Serviços, Ltda. Avd. Marechal Camera, 160 sala 1621. Rio de Janeiro. Brazil 99.00%
Tulifox, S.A. Colinia Apartamento 305. Montevideo. Uruguay 100.00%
UrbaEnergía Instalaciones y Servicios, S.L. Cardenal Marcelo Spínola, 10. 28016 Madrid. Spain 100.00%
Urbaenergía, S.L. Cardenal Marcelo Spínola, 10. 28016 Madrid. Spain 100.00%
Valdelagua Wind Power, S.L. Cardenal Marcelo Spínola, 10. Madrid 28016. Spain 100.00%
Venezolana de Limpiezas Industriales, C.A. (VENELIN) Pz Venezuela, Torre Phelps, s/n. 1050 Caracas. Venezuela 82.80%
Ventos da Serra Produção de Energía, Ltda. Monte do Poço Branco, Estrada de Sines EN121. 7900-681. Ferreira do Alentejo. Portugal 74.54%
Viabal Manteniment i Conservacio, S.A. Roders, 12. 07141 Marratxi. Islas Baleares. Spain 100.00%
Vieyra Energía Galega, S.A. José Luis de Bugallal Marchesi, 20-1 izq. 15008 La Coruña. Spain 50.00%
Villanueva Cosolar, S.L. Guadalajara,14. 19193 Guadalajara. Spain 59.63%
ENVIRONMENT ACS Servicios y Concesiones, S.L. Avda. Camino de Santiago, 50. 28050 Madrid. Spain 100.00%
Aureca Aceites United States of Americad y Recuper Energét de Madrid, S.L.
Avda. Logroño km 9.800. 28042 Madrid. Spain 100.00%
AXIL 3 Ingenieros, S.L.U. Plazoleta Arq. Marrero Regalado, 4. bajo dcha.38001 Santa Cruz de Tenerife. Spain 100.00%
Blas Moreno, S.L. Avda. Diagonal, nº 611 - 2º. Barcelona. Spain 60.00%
Centro de Transferencias, S.A. Polígono Los Barriales, s/n. Valladolid. Spain 70.00%
Cytrar, S.A. de C.V. Calle Lázaro Cardenas, Km 6 en Hermosillo, Sonora. Mexico 100.00%
Dramar Andalucía Tratamiento de Marpoles, S.L. Muelle Isla Verde, s/n. 11207 Algeciras. Cadiz. Spain 100.00%
Ecoentorno Ambiente, S.A. Camino de la Muñoza, s/n. Ctra. Madrid-Barcelona, km. 15,200. 28042 Madrid 51.00%
Ecoparc de Barcelona S.A. C/ A. Políg. Industrial Zona Franca. Barcelona. Spain 66.40%
Edafología y Restauración del Entorno Gallego, S.L. C/ Copérnico, s/n 1º-1 dcha Pol. Ind. A Grenla. Coruña. Spain 100.00%
Empordanesa de Neteja, S.A. Avda. Diagonal, nº 611 - 2º. Barcelona. Spain 60.00%
Evar, S.A.S. 1140, Avenue Albert Einstein. 34000 Montpellier Cedex 09. France 96.75%
Evere, S.A.S. Av. Albert Einstein. 34000 Montpellier. France 99.35%
France Auto Service Transport, E.U.R.L. Place de la Madeleine, 6. 75008 Paris. France 100.00%
Gestión Ambiental Canaria, S.L. Alejandro del Castillo, s/n. San Bartolomé de Tirajana. Las Palmas Gran Canaria. Spain 100.00%
Gestión Medioambiental de Torrelavega, S.A. Boulevard Demetrio Herrero, 6. 39300 Torrelavega. Santander. Spain 60.00%
Gestión y Protección Ambiental, S.L. Condado de Treviño, 19. Burgos. Spain 70.00%
Interenvases, S.A. Vial Secundario, s/n. Polígono Industrial de Araia. Bilbao. Spain 100.00%
Jingtang International Container Terminal Co. Ltd. Haigang Development Zone of Tangshan of Hebei Province of R.P. ChinaHebei Province R.P. China
54.28%
Laboratorio de Gestión Ambiental, S.L. Avda. de Tenerife 4-6. 28703 San Sebastián de los Reyes. Madrid. Spain 100.00%
Monegros Depura, S.A. Pza. Antonio Beltrán Martínez, nº 1 - Edifi cio Trovador, ofi cina 6 C. 50002 Zaragoza. Spain 55.00%
Mora la Nova Energía, S. L. c/ Lincoln, 11. 08006 Barcelona. Spain 71.00%
Octeva, S.A.S. ZA Marcel Doret rue Jacques Monod. 62100 Calais. France 68.69%
Olimpia, S.A. de C.V. C/ 6 Oriente - Colonia Francisco Sarabia - Tehuacan, Puebla. Mexico 100.00%
Orto Parques y Jardines, S.L. Luçar Dòcean s/n. Parroquía de Orto. A Coruña. Spain 100.00%
Pruvalsa, S.A. Calle Independencia, Sector centro, Edifi cio Ariza, piso 2, ofi c. 2-2, Valencia, Edo. Carabobo. Venezuela
82.00%
Puerto Seco Santander-Ebro, S.A. C/ Ramón y Cajal, 17. Luceni. Zaragoza. Spain 62.50%
Recogida de Aceites EE.UU.dos, S.A. Pol. Ind. Torrelarragoiti, s/n. 48170 Zamudio. Vizcaya. Spain 100.00%
Recuperación Crom Industrial, S.A. (RECRISA) Passeig Verdaguer 118 Igualada. Barcelona. Spain 75.00%
Recuperación de Rodas e Madeira, S.L. Camiño das Plantas, s/n. 36313 Xestoso. Bembibre. León. Spain 100.00%
Recuperación Int. Residuos de Castilla y León, S.A. Polígono Industrial Ntra. Sra. de Los Angeles. Parcela 10, nave 8 y 9. Palencia. Spain 100.00%
Residuos de la Janda, S.A. C/ La Barca de Vejer s/n. Vejer de La Frontera. Cádiz. Spain 60.00%
Residuos Industriales de Teruel, S.A. Ctra. de Madrid, km. 315,800 Edif. Expo Zaragoza, 3 Ofi c. 14 - 50012 Zaragoza. Spain 63.70%
Residuos Industriales de Zaragoza, S.A Crta de Madrid Edif. Expozaragoza Km. 315.8 3 of 14. 50012 Zaragoza. Spain 63.70%
Residuos Sólidos Urbanos de Jaén, S.A. Palacio de la Excma. Diputación de Jaén. Jaén. Spain 60.00%
RetraOil, S.L. Pol. Ind. Tambarría parcela 20. 26540 Alfaro. La Rioja. Spain 100.00%
Salins Residuos Automoción, S.L. C/ 31 c/v calle 27 - Nave 715-701, P.I. Catarroja. Valencia. Spain 80.00%
SCI Sintax Route de Phaffans. 90380 Roppe. France 100.00%
Servicios de Aguas de Misiones, S.A. Avda. López y Planes, 2577. Misiones. Argentina 90.00%
Servicios Generales de Jaén, S.A. Avda. de Tenerife, 4-6. 28703 San Sebastián de los Reyes. Madrid. Spain 75.00%
Servicios Selun, S.A. Avda. de Tenerife, 4-6. 28703 San Sebastián de los Reyes. Madrid. Spain 100.00%
Sevicios Corporativos TWC, S.A. de C.V. Calle Lázaro Cardenas, Km 6 en Hermosillo, Sonora. Mexico 100.00%
Sintax Est EURL Place de la Madeleine, 6. 75008 Paris. France 100.00%
Sintax Ile de France EURL 7 Rue du Docteur Fourniols, 95420 Magny en Vexin. France 100.00%
Sintax Logística Transportes, S.A. Vale Ana Gomez, Ed. Síntax Estrada de Algeruz. Setubal. Portugal 100.00%
Sintax Logística, S.A. C/ Diputación, 279, Atico 6ª. Barcelona. Spain 100.00%
Sintax Logístics Zeebrugge, S.A.R.L. 283 Avenue Louise, Bruxelles. Bélgica. 100.00%
Sintax Logistique France, S.A.S. Place de la Madeleine, 6. 75008 Paris. France 100.00%
Sintax Logistique Maroc, S.A.R.L. 332 Boulevard Brahim Roudani - Maarif. Casablanca. Morocco 100.00%
Sintax Logístique Mediterraneé, E.U.R.L. Place de la Madeleine, 6. 75008 Paris. France 100.00%
Sintax Logístique Region Parisienne, E.U.R.L. Place de la Madeleine, 6. 75008 Paris. France 100.00%
Sintax Logistique Valenciennes, S.A.R.L. Place de la Madeleine, 6. 75008 Paris. France 100.00%
Sintax Navigomes, Ltda. Av. Luisa Todi, 73. 2900 Setúbal. Portugal 51.00%
Sintlogistica, Ltda. Vale Ana Gomez, Ed. Síntax Estrada de Algeruz. Setubal. Portugal 100.00%
Socamex, S.A. C/ Cobalto s/n Par. 213. Pol. San Cristóbal. Valladolid. Spain 100.00%
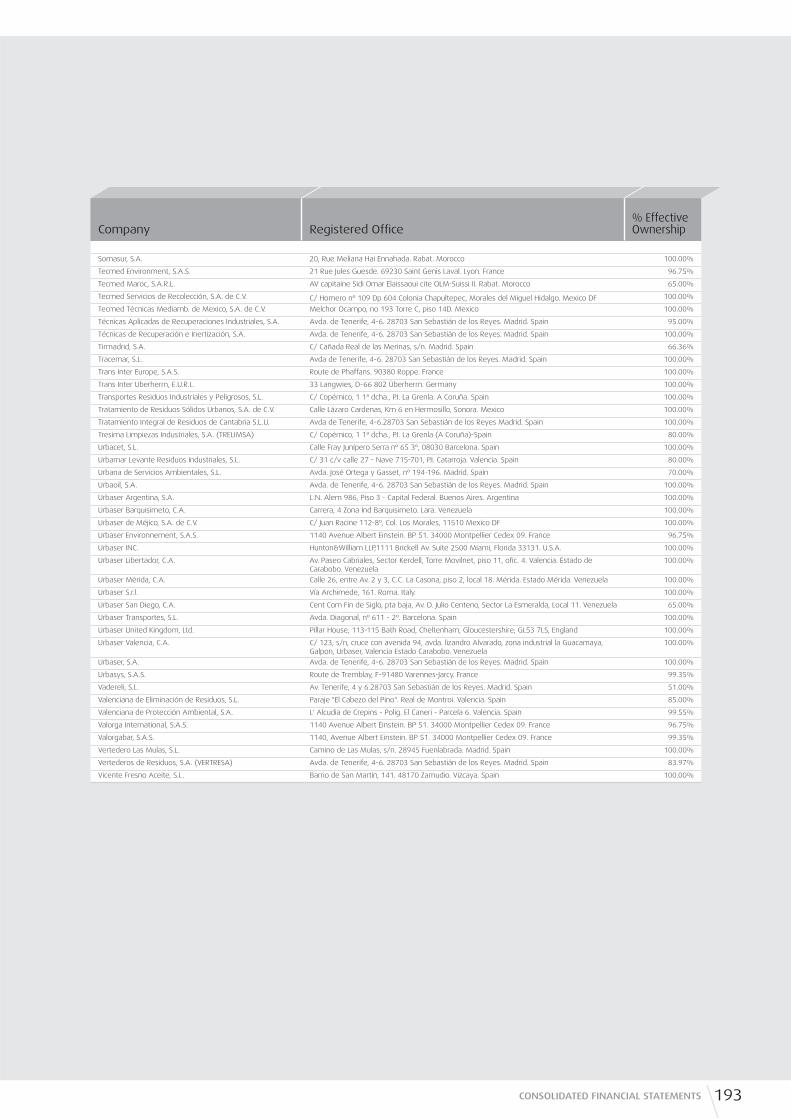
193CONSOLIDATED FINANCIAL STATEMENTS
Company Registered Offi ce% Effective Ownership
Somasur, S.A. 20, Rue Meliana Hai Ennahada. Rabat. Morocco 100.00%
Tecmed Environment, S.A.S. 21 Rue Jules Guesde. 69230 Saint Genis Laval. Lyon. France 96.75%
Tecmed Maroc, S.A.R.L. AV capitaine Sidi Omar Elaissaoui cite OLM-Suissi II. Rabat. Morocco 65.00%
Tecmed Servicios de Recolección, S.A. de C.V. C/ Homero nº 109 Dp 604 Colonia Chapultepec, Morales del Miguel Hidalgo. Mexico DF 100.00%
Tecmed Técnicas Mediamb. de Mexico, S.A. de C.V. Melchor Ocampo, no 193 Torre C, piso 14D. Mexico 100.00%
Técnicas Aplicadas de Recuperaciones Industriales, S.A. Avda. de Tenerife, 4-6. 28703 San Sebastián de los Reyes. Madrid. Spain 95.00%
Técnicas de Recuperación e Inertización, S.A. Avda. de Tenerife, 4-6. 28703 San Sebastián de los Reyes. Madrid. Spain 100.00%
Tirmadrid, S.A. C/ Cañada Real de las Merinas, s/n. Madrid. Spain 66.36%
Tracemar, S.L. Avda de Tenerife, 4-6. 28703 San Sebastián de los Reyes. Madrid. Spain 100.00%
Trans Inter Europe, S.A.S. Route de Phaffans. 90380 Roppe. France 100.00%
Trans Inter Uberherrn, E.U.R.L. 33 Langwies, D-66 802 Überherrn. Germany 100.00%
Transportes Residuos Industriales y Peligrosos, S.L. C/ Copérnico, 1 1ª dcha., P.I. La Grenla. A Coruña. Spain 100.00%
Tratamiento de Residuos Sólidos Urbanos, S.A. de C.V. Calle Lázaro Cardenas, Km 6 en Hermosillo, Sonora. Mexico 100.00%
Tratamiento Integral de Residuos de Cantabria S.L.U. Avda de Tenerife, 4-6.28703 San Sebastián de los Reyes Madrid. Spain 100.00%
Tresima Limpiezas Industriales, S.A. (TRELIMSA) C/ Copérnico, 1 1ª dcha., P.I. La Grenla (A Coruña)-Spain 80.00%
Urbacet, S.L. Calle Fray Junípero Serra nº 65 3º, 08030 Barcelona. Spain 100.00%
Urbamar Levante Residuos Industriales, S.L. C/ 31 c/v calle 27 - Nave 715-701, P.I. Catarroja. Valencia. Spain 80.00%
Urbana de Servicios Ambientales, S.L. Avda. José Ortega y Gasset, nº 194-196. Madrid. Spain 70.00%
Urbaoil, S.A. Avda. de Tenerife, 4-6. 28703 San Sebastián de los Reyes. Madrid. Spain 100.00%
Urbaser Argentina, S.A. L.N. Alem 986, Piso 3 - Capital Federal. Buenos Aires. Argentina 100.00%
Urbaser Barquisimeto, C.A. Carrera, 4 Zona Ind Barquisimeto. Lara. Venezuela 100.00%
Urbaser de Méjico, S.A. de C.V. C/ Juan Racine 112-8º, Col. Los Morales, 11510 Mexico DF 100.00%
Urbaser Environnement, S.A.S. 1140 Avenue Albert Einstein. BP 51. 34000 Montpellier Cedex 09. France 96.75%
Urbaser INC. Hunton&William LLP,1111 Brickell Av. Suite 2500 Miami, Florida 33131. U.S.A. 100.00%
Urbaser Libertador, C.A. Av. Paseo Cabriales, Sector Kerdell, Torre Movilnet, piso 11, ofi c. 4. Valencia. Estado de Carabobo. Venezuela
100.00%
Urbaser Mérida, C.A. Calle 26, entre Av. 2 y 3, C.C. La Casona, piso 2, local 18. Mérida. Estado Mérida. Venezuela 100.00%
Urbaser S.r.l. Vía Archimede, 161. Roma. Italy. 100.00%
Urbaser San Diego, C.A. Cent Com Fin de Siglo, pta baja, Av. D. Julio Centeno, Sector La Esmeralda, Local 11. Venezuela 65.00%
Urbaser Transportes, S.L. Avda. Diagonal, nº 611 - 2º. Barcelona. Spain 100.00%
Urbaser United Kingdom, Ltd. Pillar House, 113-115 Bath Road, Cheltenham, Gloucestershire; GL53 7LS, England 100.00%
Urbaser Valencia, C.A. C/ 123, s/n, cruce con avenida 94, avda. lizandro Alvarado, zona industrial la Guacamaya, Galpon, Urbaser, Valencia Estado Carabobo. Venezuela
100.00%
Urbaser, S.A. Avda. de Tenerife, 4-6. 28703 San Sebastián de los Reyes. Madrid. Spain 100.00%
Urbasys, S.A.S. Route de Tremblay, F-91480 Varennes-Jarcy. France 99.35%
Vadereli, S.L. Av. Tenerife, 4 y 6.28703 San Sebastián de los Reyes. Madrid. Spain 51.00%
Valenciana de Eliminación de Residuos, S.L. Paraje "El Cabezo del Pino". Real de Montroi. Valencia. Spain 85.00%
Valenciana de Protección Ambiental, S.A. L' Alcudia de Crepins - Polig. El Caneri - Parcela 6. Valencia. Spain 99.55%
Valorga International, S.A.S. 1140 Avenue Albert Einstein. BP 51. 34000 Montpellier Cedex 09. France 96.75%
Valorgabar, S.A.S. 1140, Avenue Albert Einstein. BP 51. 34000 Montpellier Cedex 09. France 99.35%
Vertedero Las Mulas, S.L. Camino de Las Mulas, s/n. 28945 Fuenlabrada. Madrid. Spain 100.00%
Vertederos de Residuos, S.A. (VERTRESA) Avda. de Tenerife, 4-6. 28703 San Sebastián de los Reyes. Madrid. Spain 83.97%
Vicente Fresno Aceite, S.L. Barrio de San Martín, 141. 48170 Zamudio. Vizcaya. Spain 100.00%

ConsolidatedFinancial Statements
Appendix II. UTE’s/EIG’s
194 ANNUAL REPORT 2011 OF ACS GROUP ECONOMIC AND FINANCIAL REPORT
UTE / EIG Address % EffectiveOwnwership Revenue
CONSTRUCTION - DRAGADOS
Ave Ulla Avda. Finisterre, 25. A Coruña. Spain 100.00% 27,440
Gorg. Linea 9 C/ Via Laietana, 33. Barcelona. Spain 43.50% 37,376
Túneles de Pajares 2 Avda. Camino de Santiago, 50. Madrid. Spain 84.00% 34,551
Nuevo Hospital La Fe C/ Álvaro de Bazán, 10. Valencia. Spain 70.00% 32,622
Tunel Guadarrama Sur Avda. Europa, 18. Alcobendas. Spain 34.46% 20,804
Langosteira Avda. Finisterre, 25. A Coruña. Spain 55.00% 87,292
Tunel Archidona Ps. Pablo Ruiz Picasso, 1. Málaga 100.00% 22,270
Estacion Mercado Central C/ Álvaro de Bázan, 10. Valencia. Spain 100.00% 16,498
Ave Girona C/ Acanto, 22 - 5ª Planta - Madrid. Spain 40.00% 108,946
Ronda Bahía C/ Castelar, 13 - Santander. Spain 60.00% 20,550
Complejo Administrativo 9 De Octubre Pz. Legión Española, 12 - Valencia. Spain 54.00% 20,664
Zaratamo Pz. Venezuela, 1 - Bilbao. Spain 90.00% 15,187
Quejigares Carretera Villanueva De Tapia, 2 - Archidona - Málaga. Spain 100.00% 29,345
Obras Abrigo Puerto Valencia C/ Álvaro de Bazán, 10. Valencia. Spain 29.00% 33,035
Serrano C/ Cardenal Marcelo Spinola, 52 - Madrid. Spain 50.00% 25,486
Muelle AZ-2 Pz. Venezuela, 1 - Bilbao. Spain 95.00% 31,480
Ave Tunel De Serrano C/ Cardenal Marcelo Spínola, 52. Madrid. Spain 42.00% 59,719
Boetticher Avda. Tenerife, 4 y 6. San Sebastián de los Reyes. Spain 50.00% 17,536
Baixo Alentejo Avda. Visconde de Valmor, 66. Lisboa. Portugal 44.00% 108,251
Estacions L9-Besos C/ Via Laietana, 33. Barcelona. Spain 50.00% 41,876
Via Litoral C/ Candelaria, 28 - 3ª Planta - Ed. Olympo - Santa Cruz de Tenerife. Spain 80.00% 17,985
Algarve Litoral Avda. Visconde De Valmor, 66. Lisboa. Portugal 40.00% 15,613
Ampliacion Complejo Atocha Fase I Avda. Camino de Santiago, 50. Madrid. Spain 100.00% 30,976
Viaducto De Archidona Avda. Camino de Santiago, 50. Madrid. Spain 50.00% 65,318
Shanganagh Wilton Works, Naas Road, Clondalkin, Dublin 22. Ireland 50.00% 17,935
Autovia Del Pirineo Avda. Roncesvalles, 6. Pamplona - Iruña. Spain 72.00% 118,007
Terminal Aeropuerto De Ibiza Pz. Es Forti, 4. Palma de Mallorca. Spain 70.00% 19,059
Beasain Este Barrio Loinatz. Beasain. Spain 47.00% 20,603
Tolosa C/ Gran Vía, 53. Bilbao. Spain 40.00% 32,458
Tunel Mandri C/ Via Laietana, 33. Barcelona. Spain 43.50% 16,510
Fornells - Vilademuls C/ Arago, 390. Barcelona. Spain 67.50% 30,956
Ave San Isidro-Orihuela C/ Álvaro de Bazán, 10. Valencia. Spain 70.00% 18,558
CPDS Santander Barrio La Venta, s/n. Igollo de Camargo. Spain 50.00% 15,087
Estacions L9 Llobregat Cl. Via Laietana, 33 - Barcelona. Spain 50.00% 34,584
Dragados-Sisk Crosrail Eastern R. Tunnels 25 Canal Sq. 33 fl . Canary Wharf - London 90.00% 62,191
Forth Crossing Bridge Constractors Grange House West Main Road, Grange Mouth - Scotland 28.00% 57,216
Ave Trinidad, Tramo Montcada C/ Caballero Andante, 8. Madrid. Spain 33.33% 34,483
Nudo Venta de Baños C/ Orense, 11. Madrid. Spain 50.00% 55,492
VIa l - Aeropuerto C/ Orense, 11. Madrid. Spain 40.00% 17,529
Hospital Ibiza C/ Antigua Senda de Senet, 5º, 11. Valencia. Spain 50.00% 33,530
Pulice-Granite 2033 W Mountain View Road, 85021. Phoenix. U.S.A. 75.00% 56,653
Dragados / Judlau (009) 26-15 Ulmer Street, College Point. New York 11354. U.S.A. 70.00% 17,771
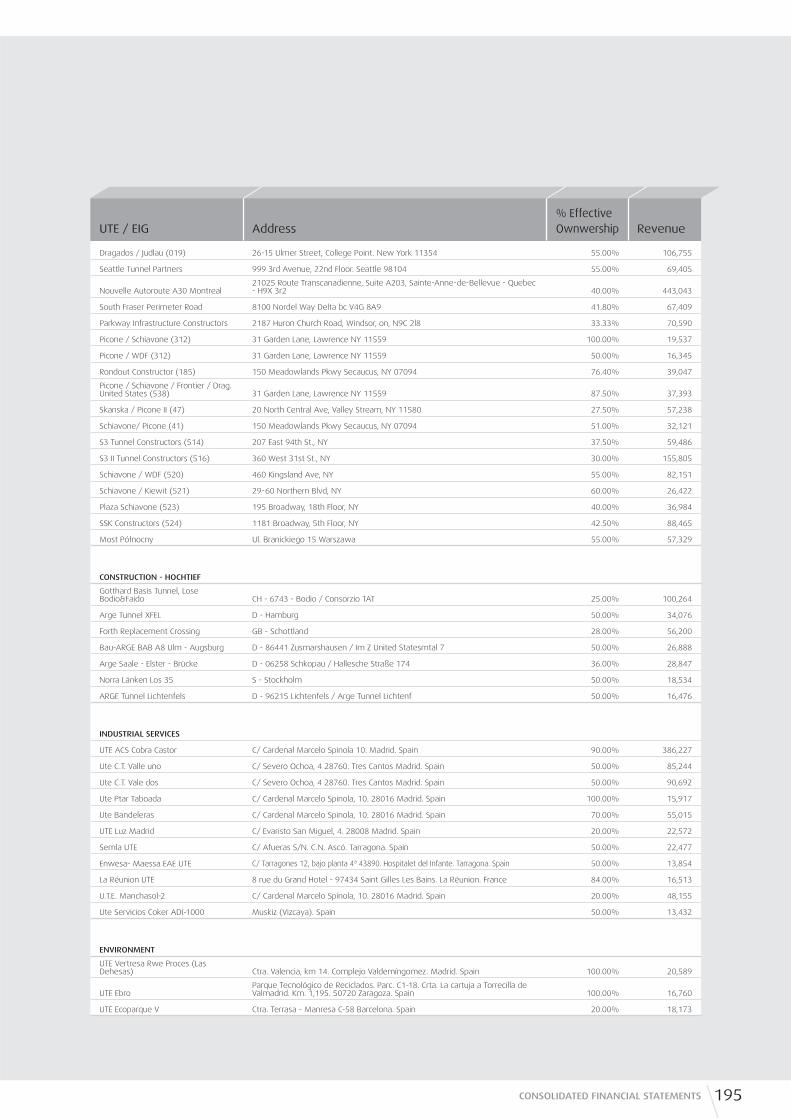
195CONSOLIDATED FINANCIAL STATEMENTS
Dragados / Judlau (019) 26-15 Ulmer Street, College Point. New York 11354 55.00% 106,755
Seattle Tunnel Partners 999 3rd Avenue, 22nd Floor. Seattle 98104 55.00% 69,405
Nouvelle Autoroute A30 Montreal21025 Route Transcanadienne, Suite A203, Sainte-Anne-de-Bellevue - Quebec - H9X 3r2 40.00% 443,043
South Fraser Perimeter Road 8100 Nordel Way Delta bc V4G 8A9 41.80% 67,409
Parkway Infrastructure Constructors 2187 Huron Church Road, Windsor, on, N9C 2l8 33.33% 70,590
Picone / Schiavone (312) 31 Garden Lane, Lawrence NY 11559 100.00% 19,537
Picone / WDF (312) 31 Garden Lane, Lawrence NY 11559 50.00% 16,345
Rondout Constructor (185) 150 Meadowlands Pkwy Secaucus, NY 07094 76.40% 39,047
Picone / Schiavone / Frontier / Drag.United States (538) 31 Garden Lane, Lawrence NY 11559 87.50% 37,393
Skanska / Picone II (47) 20 North Central Ave, Valley Stream, NY 11580 27.50% 57,238
Schiavone/ Picone (41) 150 Meadowlands Pkwy Secaucus, NY 07094 51.00% 32,121
S3 Tunnel Constructors (514) 207 East 94th St., NY 37.50% 59,486
S3 II Tunnel Constructors (516) 360 West 31st St., NY 30.00% 155,805
Schiavone / WDF (520) 460 Kingsland Ave, NY 55.00% 82,151
Schiavone / Kiewit (521) 29-60 Northern Blvd, NY 60.00% 26,422
Plaza Schiavone (523) 195 Broadway, 18th Floor, NY 40.00% 36,984
SSK Constructors (524) 1181 Broadway, 5th Floor, NY 42.50% 88,465
Most Północny Ul. Branickiego 15 Warszawa 55.00% 57,329
CONSTRUCTION - HOCHTIEF
Gotthard Basis Tunnel, Lose Bodio&Faido CH - 6743 - Bodio / Consorzio TAT 25.00% 100,264
Arge Tunnel XFEL D - Hamburg 50.00% 34,076
Forth Replacement Crossing GB - Schottland 28.00% 56,200
Bau-ARGE BAB A8 Ulm - Augsburg D - 86441 Zusmarshausen / Im Z United Statesmtal 7 50.00% 26,888
Arge Saale - Elster - Brücke D - 06258 Schkopau / Hallesche Straße 174 36.00% 28,847
Norra Länken Los 35 S - Stockholm 50.00% 18,534
ARGE Tunnel Lichtenfels D - 96215 Lichtenfels / Arge Tunnel Lichtenf 50.00% 16,476
INDUSTRIAL SERVICES
UTE ACS Cobra Castor C/ Cardenal Marcelo Spinola 10. Madrid. Spain 90.00% 386,227
Ute C.T. Valle uno C/ Severo Ochoa, 4 28760. Tres Cantos Madrid. Spain 50.00% 85,244
Ute C.T. Vale dos C/ Severo Ochoa, 4 28760. Tres Cantos Madrid. Spain 50.00% 90,692
Ute Ptar Taboada C/ Cardenal Marcelo Spinola, 10. 28016 Madrid. Spain 100.00% 15,917
Ute Bandeleras C/ Cardenal Marcelo Spinola, 10. 28016 Madrid. Spain 70.00% 55,015
UTE Luz Madrid C/ Evaristo San Miguel, 4. 28008 Madrid. Spain 20.00% 22,572
Semla UTE C/ Afueras S/N. C.N. Ascó. Tarragona. Spain 50.00% 22,477
Enwesa- Maessa EAE UTE C/ Tarragones 12, bajo planta 4ª 43890. Hospitalet del Infante. Tarragona. Spain 50.00% 13,854
La Réunion UTE 8 rue du Grand Hotel - 97434 Saint Gilles Les Bains. La Réunion. France 84.00% 16,513
U.T.E. Manchasol-2 C/ Cardenal Marcelo Spínola, 10. 28016 Madrid. Spain 20.00% 48,155
Ute Servicios Coker ADI-1000 Muskiz (Vizcaya). Spain 50.00% 13,432
ENVIRONMENT
UTE Vertresa Rwe Proces (Las Dehesas) Ctra. Valencia, km 14. Complejo Valdemíngomez. Madrid. Spain 100.00% 20,589
UTE EbroParque Tecnológico de Reciclados. Parc. C1-18. Crta. La cartuja a Torrecilla de Valmadrid. Km. 1,195. 50720 Zaragoza. Spain 100.00% 16,760
UTE Ecoparque V Ctra. Terrasa - Manresa C-58 Barcelona. Spain 20.00% 18,173
UTE / EIG Address% EffectiveOwnwership Revenue

ConsolidatedFinancial Statements
196 ANNUAL REPORT 2011 OF ACS GROUP ECONOMIC AND FINANCIAL REPORT
Appendix III. Associates
% EffectiveOwnership
Data on the investee (100%)
Company Address Assets Liabilities Equity* RevenueProfi t forthe year
PARENTS
Admirabilia, S.L. Avda. de Pio XII, 102. 28036 Madrid. Spain 99.00% 1,170,334 499,646 670,688 - 74,909
Trebol International, B.V. Avda. de Pio XII, 102. 28036 Madrid. Spain 1.00% 1,738,581 749,268 989,313 - 71,818
CONSTRUCTION - DRAGADOS
ACS Sacyr Chile, S.A. Avda. Vitacura, 2939, ofi c. 1102. Las Condes. Santiago de Chile. Chile. 50.00% 1,436 1,321 115 - (10)
Blue Clean Water, Llc. 150 Meadownlans PKWY, Secaucus. New Jersey 07094. United States of America. 76.40% 3,934 5 3,929 424 286
Central Greece Motorway Concession, S.A.
Municipality of Athens, 87 Themistokleous, 10683 Athens. Greece 33.33% 668,754 850,756 (182,002) 9,358 -
Citic Construction Xinlong Contracting Co., Ltd.
Xidaqiao Lu,69. Distrito Miyun.Beijing. China. 50.00% 1,954 50 1,904 - 36
Cleon, S.A. Avda. General Perón, 36 1º-28020 Madrid. Spain 25.00% 131,323 30,718 100,605 - 61
Constructora Comsa Dragados, S.A.
Avda. Vitacura, 2939, ofi c. 2201. Las Condes. Santiago de Chile. Chile. 50.00% 5,802 13,185 (7,383) 13,584 (7,856)
Constructora DCB, S.A. Avda. Tajamar nº 183 piso 5º. Las Condes. Santiago de Chile. Chile. 33.33% 34,726 34,487 239 7,201 223
Corfi ca 1, S.L. C/ Los Vergos, 26-5º. 08017 Barcelona. Spain 50.00% 65 1 64 - -
Draga, S.A. Crta. de la Comella, 11, Edif.Cierco AD500. Andorra 50.00% 5,038 4,313 725 8,420 (6)
Dragados Besalco, S.A. Avda. Vitacura, 2939, ofi c. 1102. Las Condes. Santiago de Chile. Chile. 50.00% 10,740 10,173 567 31,186 5,616
Dragados Fomento Canada, S.A.L.
Queen Street, 570 Fredericton NB. Canada 50.00% 9,660 12,045 (2,385) 4,587
Dravo, S.A Plaza de Castilla, 3 Piso 21-A. 28046 Madrid. Spain 50.00% 33,423 21,813 11,610 36,555 4,093
Elaboración de Cajones Pretensados, S.L.
Avda. general Peron, 36. 28020 Madrid. Spain 50,00% 100 98 2 - (2)
Empresa Mantenimiento y Explotación M-30, S.A.
C/ Méndez Alvaro, 95. 28053 Madrid. Spain 50.00% 240,685 234,085 6,600 26,890 8,614
Gaviel, S.A. Avda. Diagonal, 407 bis planta 21. 08008 Barcelona. Spain 50.00% 1,294 3 1,291 - (4)
Juluna, S.A. C/ Sorni, 3 bajo. 46004 Valencia. Spain 24.45% 685 9 676 - (6)
Logitren Ferroviaria, S.A. Avda. del Puerto, 332. 46026 Valencia. Spain 33.33% 1,641 1.260 381 1,480 (395)
PKO BP Inwestycje-Sarnia Dolina, Limited Liability Company
00-073 Warszawa ul. Pilsudskiego 3 29.04% 3,741 5,423 (1,682) - (421)
SDD Shanganagh (Water Treatment) Limited
Wilton Works, Naas Road, Clondalkin. Dublin 22. Ireland 50.00% 5,752 5,747 5 - 1
Superco Orense, S.A. C/ Benito Blanco Rajoy, 9. 15006 La Coruña. Spain 35.00% 4 - 4 - -
* Non-controlling interests not included.

197CONSOLIDATED FINANCIAL STATEMENTS
Intercambiador de transportes Plaza de Castilla, S.A.
Avda. de América 2-17B. Madrid. Spain 50.00% 200,981 167,007 33,975 25,572 10,296
Línea Nou Manteniment, S.L. Avda. Josep Tarradellas, 34-36 4º Dcha.08029 Barcelona. Spain. 50.00% - - - - -
Línia Nou Tram Dos, S.A. Avda. Josep Tarradellas, 34-36 4º Dcha.08029 Barcelona. Spain. 50.00% 534,619 595,080 (60,462) 40,545 731
Línia Nou Tram Quatre, S.A. Avda. Josep Tarradellas, 34-36 4º Dcha.08029 Barcelona. Spain. 50.00% 558,517 584,202 (25,686) 44,480 5,939
Metro de Sevilla Sdad Conce Junta Andalucia, S.A.
C/ Carmen Vendrell, s/n (Prolongación de Avda. de Hytasa) 41006 Sevilla. Spain 34.01% 443,164 312,032 131,132 48,375 5,746
Nea Odos Concession Societe Anonyme
Municipality of Athens; 87 Themistokleous; 10683 Athens. Greece 33.33% 400,893 351,003 49,890 65,947 -
Nouvelle Autoroute 30, S.E.N.C. 1 Place Ville-Marie 37e étage. Montreal. Quebec) H3B 3P. Canada 50.00% 933,386 1,094,648 (161,262) 58,641 5,459
Operadora Can Misses, S.L. C/ Corona, s/n.07800 Ibiza. Spain. 40.00% - - - - -
Road Management (A13), Plc. 24 Birch Street, Wolverhampton, WV1 4HY 25.00% 169,317 306,531 (137,215) 28,985 (5,297)
CONSTRUCTION - IRIDIUM (CONCESSIONS)
Autovía de la Sierra de Arana, S.A.
C/ Acera del Darro, 72.18005 Granada. Spain. 40.00% 6,060 1,087 4,973 2,117 1
Autovía de los Pinares, S.A. Km 20.200 A-601. 47160 Portillo. Valladolid. Spain 53.33% 103,817 107,129 (3,312) 5,293 (2,319)
Bidelan Guipuzkoako Autobideak, S.A.
Asti Auzoa, 631 B. 20800 Zarauz. San Sebastián. Spain 50.00% 25,476 13,816 11,659 42,124 2,375
Celtic Roads Group (PortLaoise) Limited
Toll Plaza Balgeen Co. Meath Ireland 33.33% 306,187 363,642 (57,455) 17,583 (6,159)
Celtic Roads Group (Waterford), Ltd.
Toll Plaza, Balgeen, Co. Meath Ireland 33.33% 232,262 268,969 (36,707) 11,815 (2,200)
Circunvalación Alicante, S.A.C.E.
Autopista AP 7. pk 703. Area Monforte del Cid. 03670 Monforte del Cid. Alicante. Spain 50.00% 457,818 487,167 (29,350) 12,612 (12,904)
Concesionaria Aparcamiento La Fe, S.A.
Tres Forques, 149 Accesorio.46014 Valencia. Spain. 50.00% 10,326 9,411 915 1,012 (22)
Concesionaria Atención Primaria, S.A.
Plaza Es Fortí, 4, 1º A. 07011 Palma de Mallorca. Islas Baleares. Spain 49.50% 24,498 20,179 4,319 3,093 922
Concesionaria Hospital Son Dureta, S.A.
Plaza Es Forti 4, 1º A. 07011 Palma de Mallorca. Islas Baleares. Spain 49.50% 401,420 406,632 (5,212) 36,605 113
Estacionamientos El Pilar, S.A. C/ Madre Rafols 2 ofi cina 1-A. 5004. Zaragoza. Spain 50.00% 16,223 7,584 8,639 2,984 1,077
Gran Hospital Can Misses, S.A. C/ Corona, S/N, (Casetas de Obra). 07800 Ibiza. Islas Baleares 40.00% 59,700 51,984 7,716 4,922 (118)
Hospital de Majadahonda, S.A. C/ Joaquín Rodrigo, 2. 28220 Majadahonda. Madrid. Spain. 55.00% 271,703 254,774 16,928 41,790 5,369
I 595 Express, LLC Corporation Trust Company, Corporation Trust Center, 1209 Orange Street. Wilmington New Castle. Delaware 19801. United States 50.00% 746,495 736,234 10,261 36,948 4,800
Infraestructuras y Radiales, S.A. Ctra. M-100 Alcalá de Henares a Daganzo Km 6.300. 28806 Alcalá de Henares. Madrid. Spain 35.00% 840,775 927,759 (86,984) 35,366 (8,610)
% EffectiveOwnership
Data on the investee (100%)
Company Address Assets Liabilities Equity* RevenueProfi t forthe year
* Non-controlling interests not included.

ConsolidatedFinancial Statements
198 ANNUAL REPORT 2011 OF ACS GROUP ECONOMIC AND FINANCIAL REPORT
% EffectiveOwnership
Data on the investee (100%)
Company Address Assets Liabilities Equity* RevenueProfi t forthe year
Rotas Do Algarve Litoral, S.A. Rua Julieta Ferrão, nº 10 – 6º andar 1600-131 Lisboa. Portugal 45.00% 97,301 117,406 (20,106) - -
Ruta de los Pantanos, S.A. Carretera M-501; p.k. 10,200. 28670 Villaviciosa de Odon. Madrid 33.33% 81,294 79,271 2,023 12,622 2,645
Serranopark, S.A. Pza. Manuel Gomez Moreno, 2. 28020 Madrid. Spain 50.00% 104,222 92,238 11,983 3,137 (3,446)
Sociedad Hospital de Majadahonda Explotaciones, S.L
C/ Joaquín Rodrigo, 2. 28220 Majadahonda. Madrid. Spain 55.00% 20,855 16,947 3,908 24,319 982
SPER - Sociedade Portuguesa para la Construçäo e Exploraçäo Rodoviária, S.A.
Rua Julieta Ferrão, nº 10 – 6º andar 1600-131 Lisboa. Portugal 49.50% 231,952 273,252 (41,299) - -
Systelec Quebec, Inc. 3700-1 place Ville-Marie.Montréal (Quebec) H3B3P4. Canada. 50.00% - - - - -
Systelec S.E.C 3700-1 place Ville-Marie.Montréal (Quebec) H3B3P4. Canada. 50.00% - - - - -
Tag Red, S.A. Avda. Vitacura nº 2939 piso 8. Las Condes. Santiago de Chile. Chile. 25.00% 6 2,243 (2,237) - -
TP Ferro Concesionaria, S.A. Ctra. de Llers a Hostalets GIP-5107 p.k. 1, s/n 17730 Llers (Girona) Spain 50.00% 1,191,982 1,155,656 36,326 3,239 -
Windsor Essex Mobility Group
150 King Street West, Suite 805, P.O.Box 48, M5H 1J9 ON. Canada. 33.33% 171,911 211,952 (40,041) 9,481 844
Zachry American/ACS 69 Partners, Llc.
Corporation Trust Company, Corporation Trust Center, 1209 Orange Street. Wilmington New Castle. Delaware 19801. United States 50.00% - - - - -
CONSTRUCTION - HOCHTIEF
Hochtief Americas
E.E. Cruz/Tully Construction, LLC Holmdel, United States 25.73% 28,182 19,963 8,219
Kiewit/Flatiron Richmond, United States 14.15% 92,709 31,522 61,187
Perini/Tompkins District of Columbia, United States 20.58% 4,504 763 3,741
Turner - PCL - Flatiron New York, United States 26.24% 18,211 14,296 3,915
Turner jointly controlled entities in total 0.00% 20,912
Flatiron jointly controlled entities in total 0.00% 14,053
Hochtief Asia Pacifi c
Al Habtoor Engineering Enterprises Co. LLC Dubai, United Arab Emirates 12.37% 1,218,223 920,057 298,66
City West Property Investment (No.6) Trust Australia 13.75% 43,866 5 43,861
Hassall Street Trust Australia 13.75% 28,465 10,633 17,832
Leighton Welspun Contractors Private Ltd. Kala Ghoda Fort, India 17.87% 241,056 61,157 179,899
MacMahon Holding Ltd. Australia 5.22% 127,870 55,412 72,458
SA Health Partnership Nominees Pty. Ltd. Australia 5.50% 95,301 66,113 29,188
Sedgman Pty. Ltd. Australia 8.80% 89,855 44,243 45,612
Hochtief Concessions
Airport Holding Tanácsadó Kft. Zalaegerszeg, Ungarn 25.56% 12,461
Athens International Airport S.A. Athen, Greece 13.72% 15,652
Bonaventura Straßenerhaltungs-GmbH Wien, Austria 12.87% 1,192 916 276 173
Flughafen Düsseldorf GmbH Düsseldorf, Germany 10.29% 6,213
* Non-controlling interests not included.
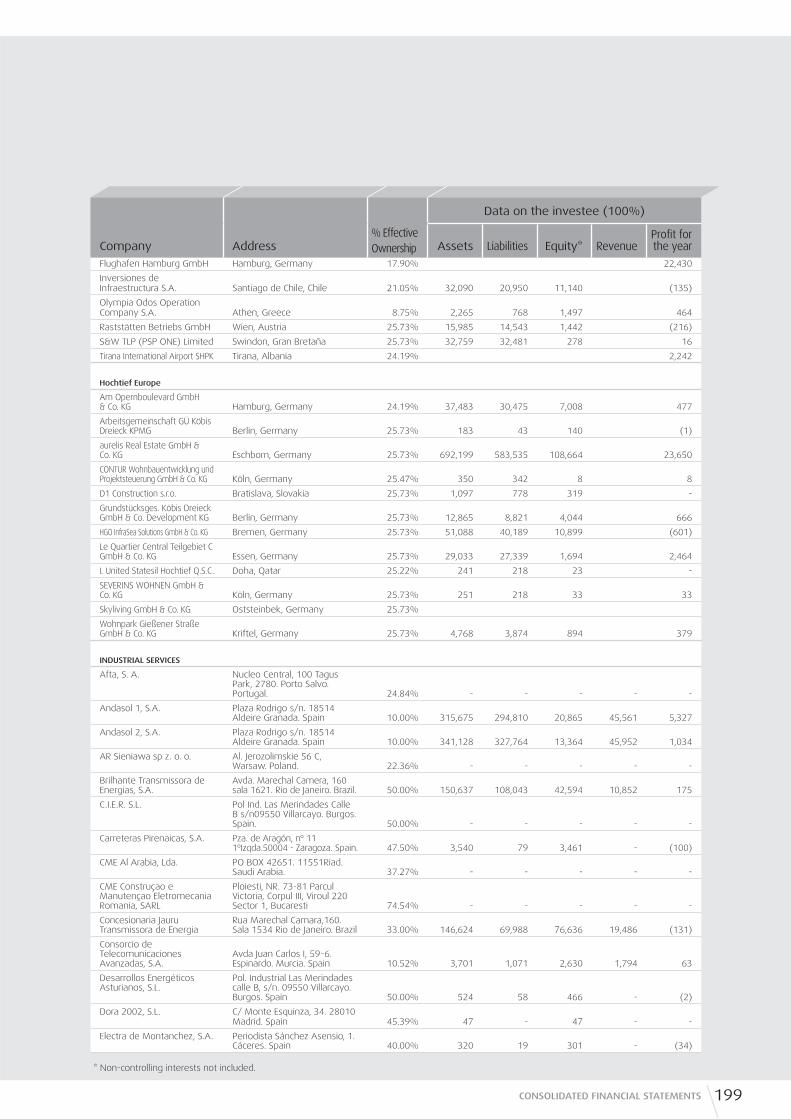
199CONSOLIDATED FINANCIAL STATEMENTS
Flughafen Hamburg GmbH Hamburg, Germany 17.90% 22,430
Inversiones de Infraestructura S.A. Santiago de Chile, Chile 21.05% 32,090 20,950 11,140 (135)
Olympia Odos Operation Company S.A. Athen, Greece 8.75% 2,265 768 1,497 464
Raststätten Betriebs GmbH Wien, Austria 25.73% 15,985 14,543 1,442 (216)
S&W TLP (PSP ONE) Limited Swindon, Gran Bretaña 25.73% 32,759 32,481 278 16
Tirana International Airport SHPK Tirana, Albania 24.19% 2,242
Hochtief Europe
Am Opernboulevard GmbH & Co. KG Hamburg, Germany 24.19% 37,483 30,475 7,008 477
Arbeitsgemeinschaft GÜ Köbis Dreieck KPMG Berlin, Germany 25.73% 183 43 140 (1)
aurelis Real Estate GmbH & Co. KG Eschborn, Germany 25.73% 692,199 583,535 108,664 23,650
CONTUR Wohnbauentwicklung und Projektsteuerung GmbH & Co. KG Köln, Germany 25.47% 350 342 8 8
D1 Construction s.r.o. Bratislava, Slovakia 25.73% 1,097 778 319 -
Grundstücksges. Köbis Dreieck GmbH & Co. Development KG Berlin, Germany 25.73% 12,865 8,821 4,044 666
HGO InfraSea Solutions GmbH & Co. KG Bremen, Germany 25.73% 51,088 40,189 10,899 (601)
Le Quartier Central Teilgebiet C GmbH & Co. KG Essen, Germany 25.73% 29,033 27,339 1,694 2,464
L United Statesil Hochtief Q.S.C. Doha, Qatar 25.22% 241 218 23 -
SEVERINS WOHNEN GmbH & Co. KG Köln, Germany 25.73% 251 218 33 33
Skyliving GmbH & Co. KG Oststeinbek, Germany 25.73%
Wohnpark Gießener Straße GmbH & Co. KG Kriftel, Germany 25.73% 4,768 3,874 894 379
INDUSTRIAL SERVICES
Afta, S. A. Nucleo Central, 100 Tagus Park, 2780. Porto Salvo. Portugal. 24.84% - - - - -
Andasol 1, S.A. Plaza Rodrigo s/n. 18514 Aldeire Granada. Spain 10.00% 315,675 294,810 20,865 45,561 5,327
Andasol 2, S.A. Plaza Rodrigo s/n. 18514 Aldeire Granada. Spain 10.00% 341,128 327,764 13,364 45,952 1,034
AR Sieniawa sp z. o. o. Al. Jerozolimskie 56 C, Warsaw. Poland. 22.36% - - - - -
Brilhante Transmissora de Energias, S.A.
Avda. Marechal Camera, 160 sala 1621. Rio de Janeiro. Brazil. 50.00% 150,637 108,043 42,594 10,852 175
C.I.E.R. S.L. Pol Ind. Las Merindades Calle B s/n09550 Villarcayo. Burgos. Spain. 50.00% - - - - -
Carreteras Pirenaicas, S.A. Pza. de Aragón, nº 11 1ºIzqda.50004 - Zaragoza. Spain. 47.50% 3,540 79 3,461 - (100)
CME Al Arabia, Lda. PO BOX 42651. 11551Riad. Saudi Arabia. 37.27% - - - - -
CME Construçao e Manutençao Eletromecania Romania, SARL
Ploiesti, NR. 73-81 Parcul Victoria, Corpul III, Viroul 220 Sector 1, Bucaresti 74.54% - - - - -
Concesionaria Jauru Transmissora de Energia
Rua Marechal Camara,160. Sala 1534 Rio de Janeiro. Brazil 33.00% 146,624 69,988 76,636 19,486 (131)
Consorcio de Telecomunicaciones Avanzadas, S.A.
Avda Juan Carlos I, 59-6. Espinardo. Murcia. Spain 10.52% 3,701 1,071 2,630 1,794 63
Desarrollos Energéticos Asturianos, S.L.
Pol. Industrial Las Merindades calle B, s/n. 09550 Villarcayo. Burgos. Spain 50.00% 524 58 466 - (2)
Dora 2002, S.L. C/ Monte Esquinza, 34. 28010 Madrid. Spain 45.39% 47 - 47 - -
Electra de Montanchez, S.A. Periodista Sánchez Asensio, 1. Cáceres. Spain 40.00% 320 19 301 - (34)
% EffectiveOwnership
Data on the investee (100%)
Company Address Assets Liabilities Equity* RevenueProfi t forthe year
* Non-controlling interests not included.

ConsolidatedFinancial Statements
200 ANNUAL REPORT 2011 OF ACS GROUP ECONOMIC AND FINANCIAL REPORT
Energía de la Loma S.A. C/ Las Fuentecillas, s/n. Villanueva del Arzobispo. 23330 Jaén. Spain. 20.00% 14,899 6,015 8,884 8,879 1,140
Energías Alternativas Eólicas, S.L.
Gran Vía Juan Carlos I, 9. 26002 Logroño. Spain 37.50% 23,732 16,292 7,440 8,305 2,932
Energías Renovables de Ricobayo, S.A.
Avda. Europa,6 Parque Empresarial La Moraleja. 28108 Alcobendas. Madrid. Spain 50.00% 1,091 730 361 1,475 (29)
Enervouga - Energias do Vouga, Lda.
Tagus Sapce. Rua Rui Teles Palhinha, N 4 2740-278. Porto Salvo. Portugal. 37.50% 1,065 1,062 3 - -
Equipamentos Informaticos, Audio e Imagem, S.A.
Rua Helder Neto, 87. Malanga.Luanda. Angola. 16.88% - - - - -
Escal UGS, S.L. C/ San Francisco de Sales, Nº 38-1ª Plta. Madrid. Spain 66.67% 1,204,296 1,216,416 (12,120) - (31)
Evacuación Valdecaballeros, S.L.
C/ María de Molina, 4 5ª planta. Madrid. Spain 9.99% - - - - -
Hospec, S.A. Tamer Bldg., Sin El Deirut. Lebano 50.00% 31 59 (28) - -
Hydrotua - Hidroelectricas do Tua, Lda.
Tagus Sapce - Rua Rui Teles Palhinha, N 4 2740-278. Porto Salvo. Portugal. 37.50% 2,306 2,303 3 - -
Incro, S.A. C/ Serrano, 27. 28016 Madrid. Spain 50.00% 14,503 12,444 2,059 6,559 1,882
Interligaçao Elétrica Norte e Nordeste, S.A.
Avda. Marechal Camara 160 sala 1833 y 1834. 20030-020 Rio de Janeiro. Brazil 25.00% 272,076 159,552 112,524 35,080 (19,673)
Interligação Elétrica Sul, S.A. Rua Casa do Ator, 1115, 8º andar Vila Olímplia. São Paulo. Brazil. 49.90% 68,397 24,084 44,313 18,822 (5,966)
JC Deaux Cevasa Avda. de Aragón 328 28022 Madrid 50.00% 304 87 217 244 57
Parqa, S. A. Rua Dr. António Loureiro Borges 9. Portugal 37.27% - - - - -
Parque Eólico Bandelera, S.L. Cardenal Marcelo Spínola, 10. 28016 Madrid. Spain 75.08% 50,709 49,866 843 - -
Parque Eólico Región de Murcia, S.A.
Central, 12. 30007 Murcia. Spain 20.00% 101 - 101 - (4)
Parque Eólico Rodera Alta, S.L. C/ Cardenal Marcelo Spínola, 10. 28016 Madrid. Spain 75.08% 47,775 46,812 963
Planta de Reserva Fría Eten, S.A.
Avda. Argentina 2415. Lima. Peru. 50.00% - - - - -
Portwind sp z. o. o. Warszawa, UL. Aleje, Jerozolimskie, 56 C 00-803. Poland. 37.50% - - - -
Red Eléctrica del Sur, S.A. Juan de la Fuente, 453 mirafl ores Lima. Peru 23.75% 41,260 31,729 9,531 7,922 3,040
Serrezuela Solar II, S.L. C/ Cardenal Marcelo Spínola, 10. 28016 Madrid. Spain 50.00% 48,456 48,739 (283) - -
Sistema Eléctrico de Conexión Hueneja, S.L.
C/ Loja nº 8 - Local 26. Albolote. Granada. Spain 24.35% 26,510 28,037 (1,527) - (1,169)
Sistema Eléctrico de Conexión Valcaire, S.L.
C/ Loja nº 8 Local 26. Albolote. Granada. Spain 29.79% - - - - -
Sociedad Aragonesa de Estaciones Depuradoras, S.A.
Doctor Aznar Molina, 15-17. 50002 Zaragoza. Spain 40.00% 23,370 19,293 4,077 2,317 (524)
Sociedad de Aguas Residuales Pirineos, S.A.
Doctor Aznar molina, 15-17. 50002 Zaragoza. Spain. 37.50% 5,364 39 5,325 - (15)
Sociedad de Generación Eólica Manchega, S.L.
C/ Cardenal Marcelo Spínola 10. Madrid 28016. Spain. 75.08% 24,659 22,417 2,242
Somozas Energías Renovables, S.A.
Lg Iglesia,1. 15565 La Coruña. Spain 25.00% 8,607 7,667 940 2,583 431
Tonopah Solar Investments, LLC.
7380 West Sahara, Suite 160.Las Vegas NV 89117. United States of America 50.00% - - - - -
Torre de Miguel Solar, S.L. C/ Cardenal Marcelo Spínola, 10. 28016 Madrid. Spain 50.00% 64,094 64,185 (91) - -
% EffectiveOwnership
Data on the investee (100%)
Company Address Assets Liabilities Equity* RevenueProfi t forthe year
* Non-controlling interests not included.

201CONSOLIDATED FINANCIAL STATEMENTS
ENVIRONMENT
Aguas del Gran Buenos Aires, S.A.
C/ 48 Nº 877, piso 4 ofi cina 408. La Plata Provincia de Buenos Aires. Argentina 26.34% 2,652 3,298 (646) - (93)
Betearte, S.A. C/ Colón de Larrategui, 26. Bilbao. Spain 33.33% 18,423 16,164 2,259 2,591 1,503
CITIC Construction Investment Co., Ltd.
Xidaqiao Lu, 69 Distrito Miyun - Beijing - China 50.00% 5,487 443 5,044 - (400)
Demarco, S.A. Alcalde Guzmán,18. Quilicura. Chile 50.00% 23,482 20,463 3,019 18,096 (254)
Desarrollo y Gestión De Residuos, S.A. (Degersa)
Avda. Barón de Carcer, 37. Valencia. Spain 40.00% 22 (0) 22 - -
Desorción Térmica, S.A. C/ Velázquez, 105-5ª Plta. 28006 Madrid. Spain 45.00% 2,810 300 2,510 15 (810)
Ecoparc del Mediterrani, S.A. Avda. Eduard Maristany, s/n. 08930 Sant Adrìa de Besós. Barcelona. Spain 32.00% 19,631 9,581 10,050 12,389 4,116
Electrorecycling, S.A. Ctra. BV 1224, Km. 6,750 El Pont de Villomara i Rocafort - Barcelona - Spain 33.33% 6,496 1,533 4,963 6,435 1,235
Empresa Mixta de Limpieza, S.A.
Av. Logroño II, 10. 24001 León. Spain 49.00% 5,366 2,951 2,415 5,964 382
Empresa Municipal de Aguas del Ferrol, S.A.
C/ Praza da Ilustracion, 5-6 Baixo. Ferrol. La Coruña. Spain 49.00% 14,864 9,722 5,142 5,534 (282)
Energías y Tierras Fértiles, S.A. Pascual y Genís, 19. 46002 Valencia. Spain 33.36% 63 - 63 - -
Entaban Biocombustibles del Pirineo, S.A.
Paseo Independencia, 28. Zaragoza. Spain 37.50% 9,837 15,325 (5,488) - (1,724)
Esteritex, S.A. Avda. de Tenerife, 4-6. 28703 San Sebastián de los Reyes. Madrid. Spain 50.00% 3,532 3,189 343 1,193 (62)
Gestión Medioambiental de L'Anoia, S.L.
C/ Viriato, 47. 08000 Barcelona. Spain 50.00% 333 435 (102) - 0
Huesca Oriental Depura, S.A. Ctra. de Madrid, km. 315,800 Edif. Expo Zaragoza, 3 Ofi c. 14 - 50012 Zaragoza. Spain 60.00% 5,934 1,612 4,322 - -
Indira Container Terminal Private Limited
Indira Dock, Green Gate, Mumbai PortMumbai 400038. India 50.00% 50,125 39,528 10,597 860 (1,459)
International City Cleaning Company
Bordi Masser Lel-Siaha, Maydan. Al-Abbasia Aawan. Egypt 30.00% - - - - -
KDM, S.A. Alcalde Guzmán,18. Quilicura. Chile 50.00% 122,152 72,755 49,397 50,418 6,043
Mac Insular, S.L. Calle Julián Álvarez, nº 12-A-1º. Palma de Mallorca. Spain 8.00% 56,759 47,428 9,331 14,871 (3,163)
Marpolgal, S.L. C/ Canovas del Castillo, 10, 1º, ofi cina 8. Vigo. Spain. 50.00% 3 - 3 - -
Pilagest, S.L. Ctra. BV 1224, Km. 6,750 El Pont de Villomara i Rocafort - Barcelona-Spain 50.00% 2,236 (0) 2,236 49 1,013
Salmedina Tratamiento de Residuos Inertes, S.L.
Cañada Real de las Merinas, s/n. Cº de los Aceiteros, 101. Madrid. Spain 41.98% 12,463 8,462 4,000 7,157 242
Servicios Urbanos e Medio Ambiente, S.A.
Avda. Julio Dinis, 2. Lisboa. Portugal 38.50% 273,839 206,994 66,844 110,488 8.425
Starco, S.A. Alcalde Guzmán,18. Quilicura. Chile 50.00% 15,596 15,572 24 14,426 165
Técnicas Medioambientales del Golfo, S.A. de C.V.
Mier y Teran No. 260 4to piso en Cd Victoria Tamaulipas. Mexico 50.00% 7,240 3,716 3,524 1,961 339
Tirme, S.A. Ctra. de Soller, Km 8,2. 07120 Son Reus. Palma de Mallorca. Spain 20.00% 585,975 536,925 49,050 90,288 7,651
Tractaments Ecologics, S.A. P.I. La Valldan C/ Serra Farriols, 137 Berga - Barcelona - Spain 50.00% 2,953 1,742 1,211 3,028 480
Tratamiento Industrial de Residuos Sólidos, S.A.
Rambla Cataluña, 91. 08008 Barcelona. Spain 33.33% 9,014 2,800 6,214 9,272 759
Valdemingomez 2000, S.A. Avda. de Tenerife, 4-6. 28703 San Sebastián de los Reyes. Madrid. Spain 33.59% 10,352 6,649 3,703 5,898 115
Waste Syclo, S.A. Katehaki 75 & kifi sias Avenue, 115-25. Athens. Greece. 51.00% 62 2 60 - (40)
Zoreda Internacional, S.A. C/ Rodriguez San Pedro, 5. Gijón. Asturias. Spain 40.00% 50 - 50 - (0)
% EffectiveOwnership
Data on the investee (100%)
Company Address Assets Liabilities Equity* RevenueProfi t forthe year
* Non-controlling interests not included.

ConsolidatedFinancial Statements
202 ANNUAL REPORT 2011 OF ACS GROUP ECONOMIC AND FINANCIAL REPORT
Appendix IV. Changes in the scope of consolidation
The main companies included in the scope of consolidation are as follows:
Línea Nou Manteniment, S.L. Actividades y Servicios, S.A.
Parking Nou Hospital del Camp, S.L. Minuano Montangens e Servicios, Ltda.
Centre D'Integracio Social Balear Ceo, S.L. Armando Cunha, ACE
Waste Syclo, S.A. AR Sieniawa Sp z. o. o.
Cymimasa Serviços Industriais, Ltda. Enervouga - Energias do Vouga, Lda.
Zenit Air Traffi c Control, S.A. Hydrotua - Hidroelectricas do Tua, Lda.
Hidráulica Río Piedra, S.A. Portwind Sp z. o. o.
Cotefy, S.A. de C.V. NGS - New Generation Supplier, Unipessoal Lda.
Sete Lagoas Transmissora de Energia, Ltda. Marpolgal, S.L.
Atlántica I Parque Eólico, S.A. AXIL 3 Ingenieros, S.L.U.
Atlántica II Parque Eólico, S.A. Urbaser, S.r.l.
Atlántica IV Parque Eólico, S.A. Parque Eólico Tres Hermanas, S.A.C
Remodelación el Sauz, S.A. de C.V. Energías Renovables Andorranas, S.L.
Cobra Thermosolar Plants, Inc. Etracontrol, S.L.
ImesAPI Maroc Initec do Brasil Engenharia e Construçoes, Ltda.
Carreteras Pirenaicas, S.A. Sice NZ, Limited
Vias U.S.A., Inc. Semi Germany, S.A.
Parking Palau de Fires, S.L. Sedmiruma, S.R.L.
Imesapi, Llc. Semi República Dominicana, S.R.L.
Corporate Statement, S.L. Trigeneración Extremeña, S.L.
Sice Tecnología en Minería, S.A. Central Solar Termoeléctrica Cáceres, S.A.U.
Sti Telecom, Spa Planta de Reserva Fría Eten, S.A.
Constructora Dragados Comsa, S.A. Control y Montajes Industriales Cymi Chile, Ltda.
Serrezuela Solar II, S.L. Mantenimiento y Montajes Industriales, Masa Chile, Ltda.
Extresol-4, S.L. Moyano Maroc, SRALU
Midasco, Llc. Vias Canada, Inc.
Autovía de la Sierra de Arana, S.A. Electren U.S.A., Inc.
Maintenance et Montages Industriels, S.A.S MASE Internacional, CRL
Semicosta Inc. Sociedad Anónima Initec Energía Ireland, Ltd.
SEMI Bulgaria, S.L.U. Tecneira Acarau Geraçao e Comercialiçao de Energia Eletrica, S.A.
SEMI Panamá, S.A. Pilatequia, S.L.
Operadora Can Misses, S.L. Cobra Energy Investment, LLC.
North Africa Infraestructures, S.L. Tonopah Solar Investments, LLC.
Evacuación Valdecaballeros, S.L. Tonopah Solar Energy Holdings I, LLC.
Geocisa UK, Ltd. Tonopah Solar Energy Holdings II, LLC.
Systelec Quebec, Inc. Tonopah Solar Energy, LLC
Systelec, S.E.C Cobra Great Island, Limited
Tulifox, S.A. Equity Share, S.L.

203CONSOLIDATED FINANCIAL STATEMENTS
The main companies no longer included in the scope of consolidation are as follows:
Urbaser Santo Domingo, S.A. Energías Ambientales, S.A.
Nordeste Transmisora de Energia, Ltda. Energías Ambientales de Novo, S.A.
STE - Sul Transmissora de Energia, Ltda. Societat Eólica de l' Enderrocada, S.A.
Interligaçao Elétrica de Minas Gerais, S.A. Energías Ambientales de Vimianzo, S.A.
Iquique Terminal Internacional, S.A. Explotaciones Eólicas Sierra de Utrera, S.L.
Pt Operational Services Pty, Ltd. Vila do Conde, Ltda.
Recurba Medio Ambiente, S.A. Cachoeira Paulista Transmisora de Energía, S.A.
Cabeço das Pedras Gpme, S.A.
Benq Yetech
Tecneira Moçambique SA-Tecnologias Energéticas, S.A. ABL CME Advanced Communications
Vectra, S.A. Vortal, S.A.
Albares Renovables, S.L. Cme Business
Remolcadores de Barcelona, S.A. Sociedad Concesionaria Túnel San Cristóbal, S.A.
Servicio Puerto Rada y Antipolución, S.A. Taurus Holdings Chile, S.A.
Hércules International Towage Services, S.A. Sociedad Concesionaria Vespucio Norte Express, S.A.
Urbalia Panama, S.A. Senderol, S.A.
Aseo Urbano, S.A. E.S.P. Reciclados del Mediterraneo, S.L.
Urbaser S.A. E.S.P. Eco Actrins, S.L.U.
Consenur, S.A. DPI Terminals Dominicana, Ltda.
Claerh, S.A. Eolicaman, S.A.
Ecología y Técnicas Sanitarias, S.L. Loma del Capón, S.L.
Sanypick Plastic, S.A. Colonial Leasing Corporation
Sermed, S.A. Agrupación Offshore 60, S.A. de C.V.
Artemis Transmissora de Energia, Ltda. Serra do Moncoso Cambas, S.L.
Uirapuru Transmissora de Energia, Ltda. Ecoven Parc Eólic, S.A.
Energías Ambientales de Somozas, S.A. Energías Ambientales de Outes, S.A.
Companies considered as Discontinued operations:Group Clece
Clece, S.A. GPL Limpiezas, S.L.
Limpiezas Lafuente, S.L. Soluciones para el medioambiente, S.L.
Lireba Serveis Integrats, S.L. Integra Mantenimiento, Gestión y Servicios Integrados Centro Especial de Empleo Valencia, S.L.
Talher, S.A. Integra Mantenimiento, Gestión y Servicios Integrados Centro Especial de Empleo Andalucia, S.L.
Zenit Servicios Integrales, S.A. Integra Manteniment, Gestio i Serveis Integrats, Centre Especial de Treball, Catalunya, S.L.
Multiservicios Aeroportuarios, S.A. Integra Mantenimiento, Gestión y Servicios Integrados Centro Especial de Empleo Galicia S.L.
Publimedia Sistemas Publicitarios, S.L. Integra Logística, Mantenimiento, Gestión y Servicios Integrados Centro Especial de Empleo, S.L.
Trenmedia, S.A. Sociedad Peninsular de Limpiezas Mecanizadas, Lda.
Limpieza Guía, Ltd. Clece, Inc.
Mapide,S.A. Montaje de Aparatos Elevadores y Mantenimiento, S.L.
Net Brill, S.L. Centre D'Integracio Social Balear Ceo, S.L.
Integra Mantenimiento, Gestión y Servicios Integrados Centro Especial de Empleo, S.L.
Zenit Air Traffi c Control, S.A.Limpiezas Deyse, S.L.
Auditors’ Report on Consolidated Financial Statements
ACS, Actividades de Construcción y Servicios, S.A.and Subsidiaries
Consolidated Financial Statements tor the year ended 31 December 2011 and Directors’ Report,together with Independent Auditors’ Report.
204 ANNUAL REPORT 2011 OF ACS GROUP ECONOMIC AND FINANCIAL REPORT

205AUDITORS’ REPORT ON CONSOLIDATED FINANCIAL STATEMENTS

Historical performance
206 ANNUAL REPORT 2011 OF ACS GROUP ECONOMIC AND FINANCIAL REPORT
Consolidated income statement evolution
Million of euros
2006 2007 2008 2009(1) 2010(2) 2011TACC(3) 11/06
Revenues 13,868.7 15,344.9 15,275.6 15,387.4 14,328.5 28,471.9 15.5%
Dragados 6,750.3 7,352.9 6,625.4 6,077.7 5,593.1 4,800.4 -6.6%
Concessions 26.1 35.8 66.1 73.5 110.2 119.3 35.5%
Hochtief - - - - - 14,881.8 n.a.
Construction 6,776.4 7,388.7 6,691.5 6,151.2 5,703.3 19,801.5 23.9%
Environment 2,458.6 2,834.9 2,413.8 2,469.8 1,510.7 1,685.7 -7.3%
Industrial Services 4,747.7 5,488.7 6,476.7 6,849.6 7,157.8 7,045.0 8.2%
Holding / Adjustments (114.0) (368.4) (306.4) (83.2) (43.3) (60.4) -11.9%
EBITDA 1,218.9 1,379.8 1,382.5 1,429.3 1,431.7 2,317.7 13.7%
Dragados 504.0 548.9 494.3 456.4 393.0 374.7 -5.8%
Concessions 6.9 381.5 23.2 18.0 33.8 46.3 46.3%
Hochtief - - - - - 788,7 n.a.
Construction 510.9 930.3 517.5 474.5 426.8 1,209.7 18.8%
Environment 324.7 381.5 314.8 304.1 237.3 253.3 -4.8%
Industrial Services 419.6 488.4 591.2 686.9 821.4 907.3 16.7%
Holding / Adjustments (36.3) (39.4) (41.0) (36.2) (53.9) (52.6) 7.7%
EBIT 942.5 1,056.7 1,042.7 1,073.9 1,020.5 1,374.2 7.8%
Dragados 422.7 460.3 410.9 378.6 297.2 282.5 -7.7%
Concessions (2.7) (5.2) 7.8 5.9 20.8 30.5 n.a.
Hochtief - - - - - 188.0 n.a.
Construction 420.0 455.1 418.7 384.4 318.0 501.0 3.6%
Environment 195.5 232.8 195.3 180.3 128.5 112.0 -10.5%
Industrial Services 364.7 412.5 471.9 547.8 618.7 795.4 16.9%
Holding / Adjustments (37.7) (43.7) (43.2) (38.5) (44.8) (34.3) -1.8%
Net Profi t 1,250.1 1,551.1 1,805.0 1,946.2 1,312.6 961.9 -5.1%
Dragados 282.1 310.3 275.0 241.4 220.4 180.4 -8.6%
Concessions (17.3) 3.7 20.2 (21.9) (21.9) 117.2 n.a.
Hochtief - - - - (11.0) 72.7 n.a.
Construction 264.8 314.0 295.3 219.5 187.5 370.3 6.9%
Environment 109.1 131.7 144.6 146.2 152.3 128.2 3.3%
Industrial Services 222.6 264.9 316.7 346.7 399.5 491.6 17.2%
Listed Associates 81.1 57.7 17.4 117.2 144.2 35.6 -15.2%
Holding / Adjustments 402.4 782.4 1,031.1 1,116.6 429.1 (63.7) n.a.
(1) 2009 are presented applying IAS 31 and IFRIC 12 in comparable terms using the same criteria that it has been used in 2010.
(2) 2010 data proforma, Clece has been reclassifi ed as”Discontinued Operation”, using the same criteria that it has been used in 2011 and Hochtief results has been included in Construction area.
(3) CAGR: Compound Annual Growth Rate.
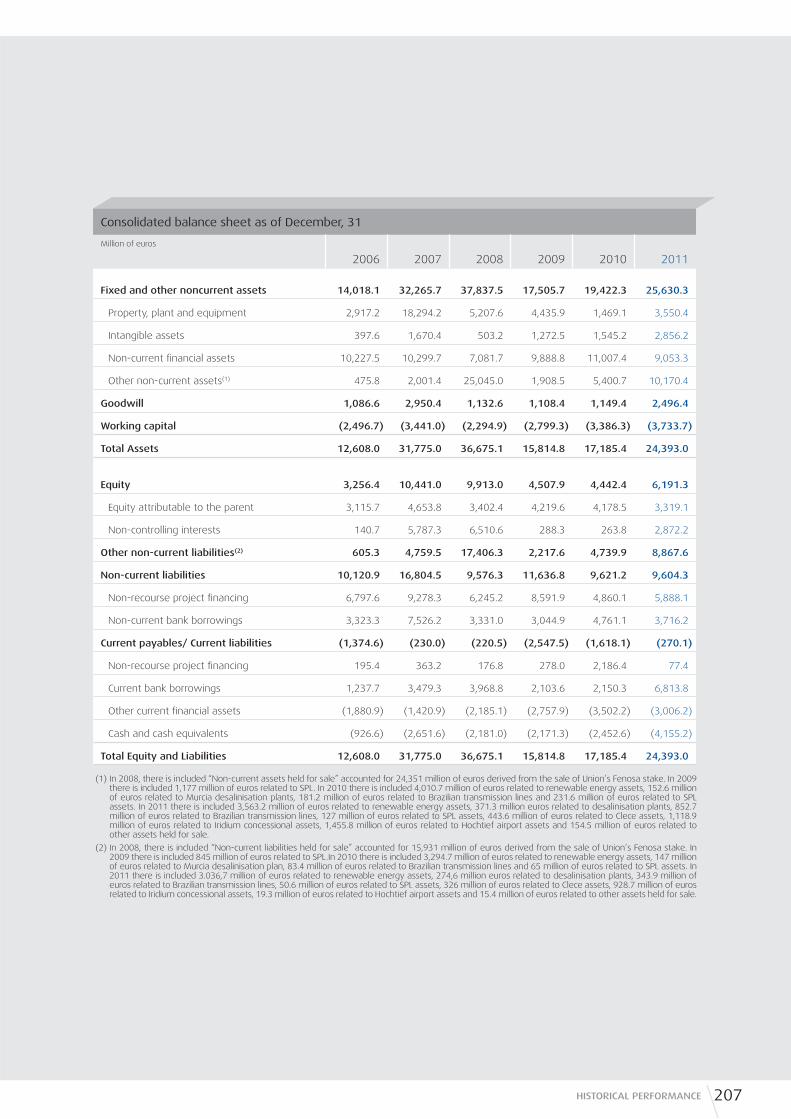
207HISTORICAL PERFORMANCE
Consolidated balance sheet as of December, 31
Million of euros
2006 2007 2008 2009 2010 2011
Fixed and other noncurrent assets 14,018.1 32,265.7 37,837.5 17,505.7 19,422.3 25,630.3
Property, plant and equipment 2,917.2 18,294.2 5,207.6 4,435.9 1,469.1 3,550.4
Intangible assets 397.6 1,670.4 503.2 1,272.5 1,545.2 2,856.2
Non-current fi nancial assets 10,227.5 10,299.7 7,081.7 9,888.8 11,007.4 9,053.3
Other non-current assets(1) 475.8 2,001.4 25,045.0 1,908.5 5,400.7 10,170.4
Goodwill 1,086.6 2,950.4 1,132.6 1,108.4 1,149.4 2,496.4
Working capital (2,496.7) (3,441.0) (2,294.9) (2,799.3) (3,386.3) (3,733.7)
Total Assets 12,608.0 31,775.0 36,675.1 15,814.8 17,185.4 24,393.0
Equity 3,256.4 10,441.0 9,913.0 4,507.9 4,442.4 6,191.3
Equity attributable to the parent 3,115.7 4,653.8 3,402.4 4,219.6 4,178.5 3,319.1
Non-controlling interests 140.7 5,787.3 6,510.6 288.3 263.8 2,872.2
Other non-current liabilities(2) 605.3 4,759.5 17,406.3 2,217.6 4,739.9 8,867.6
Non-current liabilities 10,120.9 16,804.5 9,576.3 11,636.8 9,621.2 9,604.3
Non-recourse project fi nancing 6,797.6 9,278.3 6,245.2 8,591.9 4,860.1 5,888.1
Non-current bank borrowings 3,323.3 7,526.2 3,331.0 3,044.9 4,761.1 3,716.2
Current payables/ Current liabilities (1,374.6) (230.0) (220.5) (2,547.5) (1,618.1) (270.1)
Non-recourse project fi nancing 195.4 363.2 176.8 278.0 2,186.4 77.4
Current bank borrowings 1,237.7 3,479.3 3,968.8 2,103.6 2,150.3 6,813.8
Other current fi nancial assets (1,880.9) (1,420.9) (2,185.1) (2,757.9) (3,502.2) (3,006.2)
Cash and cash equivalents (926.6) (2,651.6) (2,181.0) (2,171.3) (2,452.6) (4,155.2)
Total Equity and Liabilities 12,608.0 31,775.0 36,675.1 15,814.8 17,185.4 24,393.0
(1) In 2008, there is included “Non-current assets held for sale” accounted for 24,351 million of euros derived from the sale of Union’s Fenosa stake. In 2009 there is included 1,177 million of euros related to SPL. In 2010 there is included 4,010.7 million of euros related to renewable energy assets, 152.6 million of euros related to Murcia desalinisation plants, 181.2 million of euros related to Brazilian transmission lines and 231.6 million of euros related to SPL assets. In 2011 there is included 3,563.2 million of euros related to renewable energy assets, 371.3 million euros related to desalinisation plants, 852.7 million of euros related to Brazilian transmission lines, 127 million of euros related to SPL assets, 443.6 million of euros related to Clece assets, 1,118.9 million of euros related to Iridium concessional assets, 1,455.8 million of euros related to Hochtief airport assets and 154.5 million of euros related to other assets held for sale.
(2) In 2008, there is included “Non-current liabilities held for sale” accounted for 15,931 million of euros derived from the sale of Union’s Fenosa stake. In 2009 there is included 845 million of euros related to SPL.In 2010 there is included 3,294.7 million of euros related to renewable energy assets, 147 million of euros related to Murcia desalinisation plan, 83.4 million of euros related to Brazilian transmission lines and 65 million of euros related to SPL assets. In 2011 there is included 3.036,7 million of euros related to renewable energy assets, 274,6 million euros related to desalinisation plants, 343.9 million of euros related to Brazilian transmission lines, 50.6 million of euros related to SPL assets, 326 million of euros related to Clece assets, 928.7 million of euros related to Iridium concessional assets, 19.3 million of euros related to Hochtief airport assets and 15.4 million of euros related to other assets held for sale.

Project Director and EditorACS Group
Creation and DesingIMAGIAoffi cina.es
PhotosACS Group Archives