acsi american customer satisfaction...
TRANSCRIPT
ACSI RESTAURANT REPORT 2017
ACSI
INDUSTRY RESULTS FOR:Full-Service Restaurants
Limited-Service Restaurants
June 20, 2017
ABOUT ACSIThe American Customer
Satisfaction Index (ACSI) is a
national economic indicator
of customer evaluations of the
quality of products and services
available to household consumers
in the United States.
The ACSI uses data from
interviews with roughly 180,000
customers annually as inputs
to an econometric model for
analyzing customer satisfaction
with more than 300 companies
in 43 industries and 10 economic
sectors, including various
services of federal and local
government agencies.
ACSI results are released
throughout the year, with all
measures reported on a scale of
0 to 100. ACSI data have proven
to be strongly related to several
essential indicators of micro and
macroeconomic performance. For
example, firms with higher levels of
customer satisfaction tend to have
higher earnings and stock returns
relative to competitors. Stock
portfolios based on companies
that show strong performance in
ACSI deliver excess returns in up
markets as well as down markets.
At the macro level, customer
satisfaction has been shown to
be predictive of both consumer
spending and GDP growth.
American CustomerSatisfaction Index®
©2017 ACSI LLC. ALL RIGHTS RESERVED.
Limited-Service Restaurants
79 0.0%
Full-ServiceRestaurants78 -3.7%

Customer satisfaction with the Accommodation and Food Services sector is down 0.9% to 78.0 on the American Customer Satisfaction Index’s 100-point scale. The decline is due to a sharp drop in customer satisfaction with full-service restaurants. For the first time ever, fast food restaurants do better than full-service restaurants. Just a year ago, full-service restaurants were rated among the top four industries tracked by the ACSI, but they now register below many other industries, including banks, life insurance, and fast food.
FULL-SERVICE RESTAURANTSCustomer satisfaction with full-service restaurants falls 3.7% to an ACSI score of 78. For the category overall, menu prices are on the rise, same-store sales are down, and foot traffic is shrinking at a rate not seen since 2009. Lower grocery prices may encourage more Americans to dine at home, and younger consumers look for quicker service, convenience, and healthier choices. This is the first time in over a decade that full-service restaurants have dropped below an ACSI score of 80. Smaller chains and independent restaurants, which make up the majority of the industry, fall 4% to 78.
Restaurant-retail hybrid Cracker Barrel takes the top spot for the second year in a row, edging up 1% to an ACSI score of 84. The family dining chain—which is part restaurant and part Americana gift shop—has recently added an online wait list for tables.
Next in line, Texas Roadhouse—the top-scoring steakhouse—is unchanged at 82. The casual-dining chain continues to gain customers, and same-store sales grew 3.1% in the first quarter, outpacing many of its competitors. Among steakhouses, Outback Steakhouse takes second place with a 4% gain to 80 and a same-store sales increase of 1.4% during the first quarter. A year ago, LongHorn Steakhouse tied Texas Roadhouse near the top, but the Darden chain now tumbles 6% to 77.
Darden’s largest chain, Olive Garden, is unchanged in third place among sit-down restaurants with an ACSI score of 81. Olive Garden continues to generate sales, aided by strong increases in to-go orders, and the chain has moved from average to above-average in the ACSI rankings. Red Lobster rises 3% for a second straight year of improvement, reaching a four-year company high of 81 after investing in menu enhancements and better-quality ingredients.
Applebee’s and Ruby Tuesday are unmoved at 79 and 78, respectively. Chili’s posts a 3% gain to 77, overtaking TGI Fridays, which slips 3% to 76. Like Chili’s, Denny’s improves 3%, but ends up deadlocked with Fridays, and all three score below the industry average. As sales slump, many chains are looking for ways to redefine themselves—from Fridays’ plan to focus on urban markets to Applebee’s introduction of wood-fired grills, which has yet to pay off in better sales or higher satisfaction. Ruby Tuesday, flat at the industry average, put itself up for sale in March amid falling revenue and store closings.
Bad News for Full-Service Restaurants as Fast Food Pulls Ahead
ACSI Restaurant Report 2017
ACSI
1 WWW.THEACSI.ORG | [email protected] ©2017 ACSI LLC. ALL RIGHTS RESERVED.

ACSI Restaurant Report 2017
ACSI
2 WWW.THEACSI.ORG | [email protected] ©2017 ACSI LLC. ALL RIGHTS RESERVED.
Meanwhile, Red Robin sinks to the bottom of the category, down a whopping 9% to 73 as first quarter same-store sales drop 1.2%. Like major brick-and-mortar retailers, casual dining has not been immune to the trend of declining foot traffic, as consumers stay away from malls in greater numbers. Recognizing this changed landscape, Red Robin is testing delivery and catering options, as well as rethinking its mall locations—moves that may be all the more important given the company’s sharp ACSI decline.
According to diners, full-service waitstaff do a great job, but have slipped when it comes to getting orders right (87) and restaurants are not as clean or well laid out (85). Food quality is down (84), but waitstaff courtesy and helpfulness remains high (85).
The variety of food options is not as good as last year, and beverage quality has deteriorated (both down 3% to 83). Slower service (81) and limited beverage variety (80) are low points for the industry. On the other hand, full-service restaurant websites have improved to an ACSI benchmark of 84, beating the fast food category (down 1% to 82). With casual-dining foot traffic on the decline, easy-to-use websites for ordering carryout may become more critical for boosting sales in the full-service segment.

ACSI Restaurant Report 2017
ACSI
3 WWW.THEACSI.ORG | [email protected] ©2017 ACSI LLC. ALL RIGHTS RESERVED.
LIMITED-SERVICE RESTAURANTSCustomer satisfaction with fast food restaurants is stable at an ACSI score of 79. Quality ingredients combined with fast service and low prices are helping limited-service restaurants outperform full-service restaurants.
Chick-fil-A remains the leader, unchanged at an ACSI score of 87. Panera Bread’s investments in technology have improved efficiency and bumped its ACSI score up 1% to second place at 82. Panera ties with Papa John’s (unchanged) and the combined score of all other smaller chains and individual fast food restaurants (+1%).
Papa John’s is head-and-shoulders above the other pizza chains. Little Caesars takes the biggest hit in customer satisfaction, dropping 4% to tie Domino’s at 78 (unchanged). Pizza Hut follows at 76 after

ACSI Restaurant Report 2017
ACSI
4 WWW.THEACSI.ORG | [email protected] ©2017 ACSI LLC. ALL RIGHTS RESERVED.
slipping 1%. Among sandwich makers, Subway nudges up 1% to 81, just below Panera Bread, but ahead of Arby’s (unchanged at 80).
Chipotle Mexican Grill turns around after its steep tumble a year ago, stabilizing with a 1% gain to 79. Chipotle’s stock has been slow to rebound following its 2015 food safety crisis, unlike United Airlines’ stock, which took a hit after a high-profile passenger incident but bounced back immediately. Following a five-quarter drought, same-store sales for Chipotle rose in the first quarter, prompting the stock uptick, but the company is just beginning its recovery—matched by the small upturn in ACSI.
KFC is unchanged at 78, far behind chicken rival and industry leader Chick-fil-A. Taco Bell gains 1%, but comes in well below the average at 76. Dunkin’ Donuts dips 1% to 79, but stays ahead of coffee rival Starbucks. However, the Seattle-born coffee company is closing the gap this year with a 3% boost to 77.
ACSI Restaurant Report 2017
ACSI
5 WWW.THEACSI.ORG | [email protected] ©2017 ACSI LLC. ALL RIGHTS RESERVED.
Hamburger chains all score below the industry average. After lagging Wendy’s for more than two decades, Burger King grabs the crown among burger chains with a 1% uptick to 77. Wendy’s (unchanged at 76) and Jack in the Box (+1% to 75) follow closely behind. McDonald’s continues its run at the bottom of the industry, flat at 69.
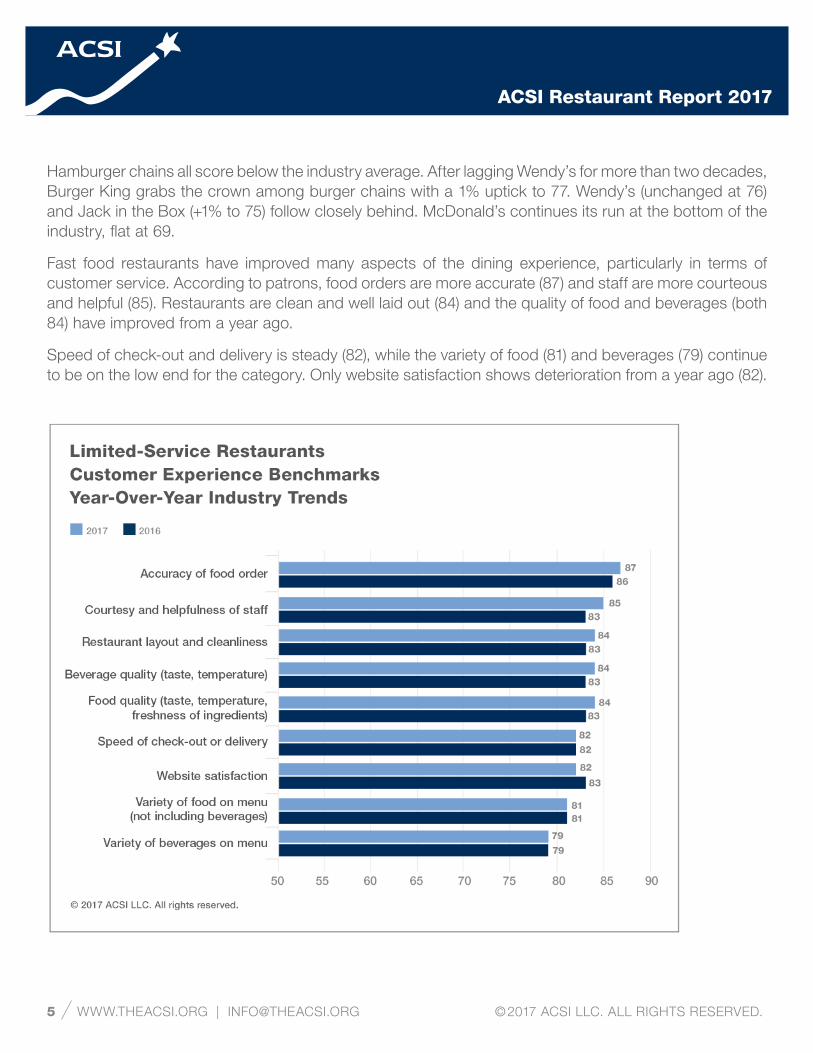
Fast food restaurants have improved many aspects of the dining experience, particularly in terms of customer service. According to patrons, food orders are more accurate (87) and staff are more courteous and helpful (85). Restaurants are clean and well laid out (84) and the quality of food and beverages (both 84) have improved from a year ago.
Speed of check-out and delivery is steady (82), while the variety of food (81) and beverages (79) continue to be on the low end for the category. Only website satisfaction shows deterioration from a year ago (82).

ACSI Restaurant Report 2017
ACSI
6 WWW.THEACSI.ORG | [email protected] ©2017 ACSI LLC. ALL RIGHTS RESERVED.
ABOUT THIS REPORT
The ACSI Restaurant Report 2017 on full-service and limited-service (fast food) dining chains is based on interviews with 5,557 customers, chosen at random and contacted via email between June 8, 2016, and May 12, 2017. Customers are asked to evaluate their recent experiences with the largest sit-down and fast food restaurants in terms of market share, plus an aggregate category consisting of “all other”—and thus smaller—restaurants in those industries.
The survey data are used as inputs to ACSI’s cause-and-effect econometric model, which estimates customer satisfaction as the result of the survey-measured inputs of customer expectations, perceptions of quality, and perceptions of value. The ACSI model, in turn, links customer satisfaction with the survey-measured outcomes of customer complaints and customer loyalty. ACSI clients receive confidential industry-competitive and best-in-class data on all modeled variables and customer experience benchmarks.
ACSI and its logo are Registered Marks of the University of Michigan, licensed worldwide exclusively to American Customer Satisfaction Index LLC with the right to sublicense.
No advertising or other promotional use can be made of the data and information in this report without the express prior written consent of ACSI LLC.

ACSI Restaurant Report 2017
ACSI
7 WWW.THEACSI.ORG | [email protected] ©2017 ACSI LLC. ALL RIGHTS RESERVED.