acta technica corviniensisacta.fih.upt.ro/pdf/2017-2/acta-2017-2-11.pdf · acta technica...
TRANSCRIPT
© copyright Faculty of Engineering – Hunedoara, University POLITEHNICA Timisoara
ACTA TECHNICA CORVINIENSIS – Bulletin of Engineering Tome X [2017] Fascicule 2 [April – June] ISSN: 2067 – 3809
1.Hugo ZUPAN, 2.Mihael DEBEVEC, 3.Niko HERAKOVIC
INVENTORIES IN THE WAREHOUSE - MONITORING, ANALYSES AND OPTIMIZATION WITH SIMULATION 1-3.Laboratory for Handling, Assembly and Pneumatics, Faculty of Mechanical Engineering, University of Ljubljana, Askerceva 6, SI-1000 Ljubljana, SLOVENIA Abstract: This paper presents a simulation model through which the inventories in the warehouse can easily be followed and the appropriate value of the minimum stocks determined. The simulation model of the warehouse is based on the discrete events and built in the software package Tecnomatix Plant Simulation. A reasonable approach how to treat inventories of the existing situation as well as the inventories movement in the warehouse through its analysis is presented. In the article the analyses are carried out on the basis of the results of simulation suggestions and a new methodology is proposed together with guidelines for improving the material flow in the production and warehouse process. Keywords: discrete event simulation, stock optimization, inventory tracking, minimum stocks, digital warehouse INTRODUCTION At a time of rising costs, time pressures in production and globalization in general, logistics is one of the key factors for the success of the company [1]. If the company wants to stay competitive it must continuously increase its efficiency on all fields of manufacturing – also in a warehouse [2]. Achieving optimal inventories is one of the fundamental problems of storage. All inventory optimization approaches are not effective. For this reason, it is necessary to choose proven optimization approach, such as upfront simulation of storage [3]. Today the simulation is becoming an increasingly useful tool in production. Its key advantage is that it does not consume materials, energy and resources, but only the data. Thus, variants production and storage processes tested in advance and we are looking for the optimum solution [4, 5, 6, 7, 8, 9]. A computer simulation can provide us with a comprehensive selection of analyses tools, such as bottleneck analysis, statistics and graphs through which different scenarios in warehouses are evaluated. STARTING POINTS AND RESEARCH OBJECTIVES In the initial stage we set some guidelines for the development of the model of a warehouse for cases where the company does not have a comprehensive
database of stored pieces. The ultimate goal of the research is to establish the correct minimum values of stock and to reduce inventories in the warehouse. The essential parts of the research are: a computer model development of a virtual
warehouse, monitoring of the pieces’ movement in a warehouse, analyses of the flow and optimization by using new methodologies. Analyses of the obtained results from the simulation allow us to better understand the unwinding of transactions of stored pieces in the production process. When developing a computer model, the characteristics and limitations of the actual warehouse are considered and once the model is made, the simulation is used as a tool to monitor the status for each stored piece / end product / tool in the warehouse using tables and graphs. The model is designed specifically to subscriber, since proposals may be implemented in the optimization of a real warehouse. The procedure is the following: after completing the analyses the optimization of the inventories in the warehouse is made by means of indicators (discussed in the chapter 4.1) and in particular with the reduction of current stock using the new proposed methodology (discussed in chapter 4.3).
ACTA TECHNICA CORVINIENSIS – Bulletin of Engineering
74 | F a s c i c u l e 2
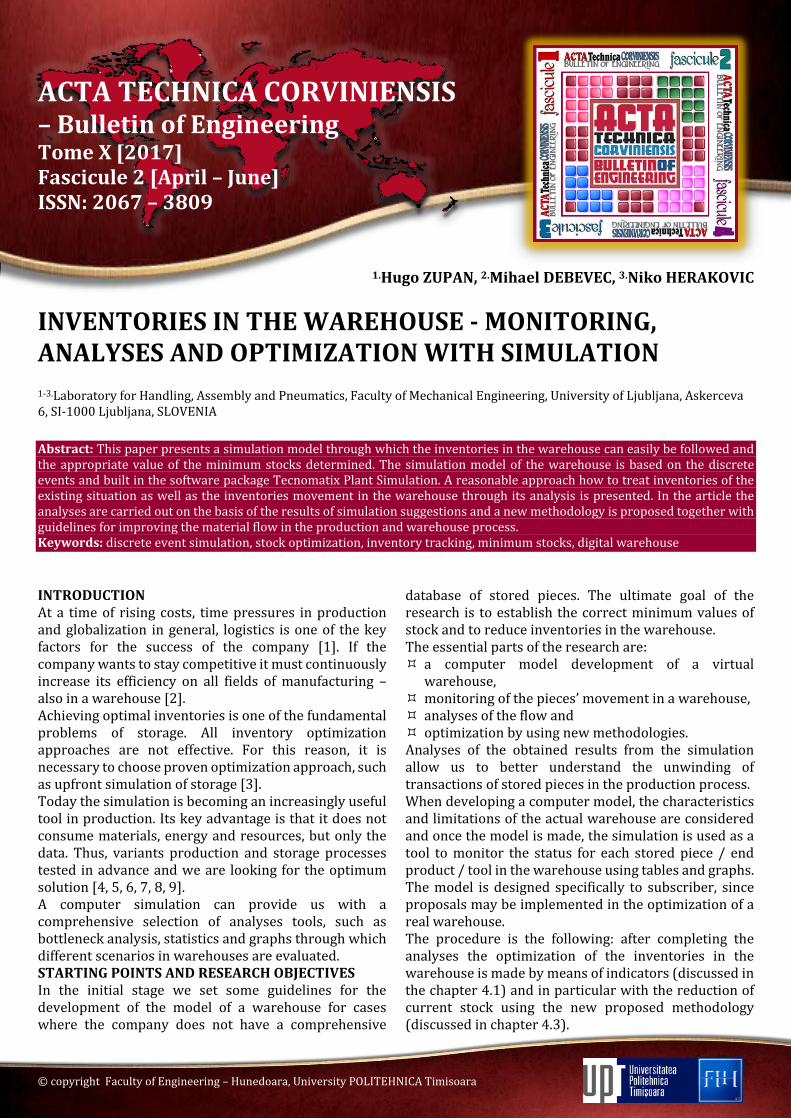
The model has also been tested in the real company and in the initial stage the guidelines for making a macro system and roughly enumerated characteristics of storage have been set. Together with the company we have decided that we would observe only the movement of component parts of different product codes (CP), which are permanently in stock and are located in the warehouse of parts. Company CP movements for all product codes in the warehouse is defined as 6 different transactions between the individual locations (Figure 1), which are identified by the following codes: 01: the receipt of CP in acquiring warehouse, which
then go to the warehouse, 02: complaints go directly to the CP storage, 10: The return of CP from the production back to the
warehouse, 12: CP sales from the warehouse through retail, 13: CP emitting from the warehouse into production 14: CP that come in acquiring warehouse in the
review and then goes directly into production.
Figure 1 – Transactions between the individual locations
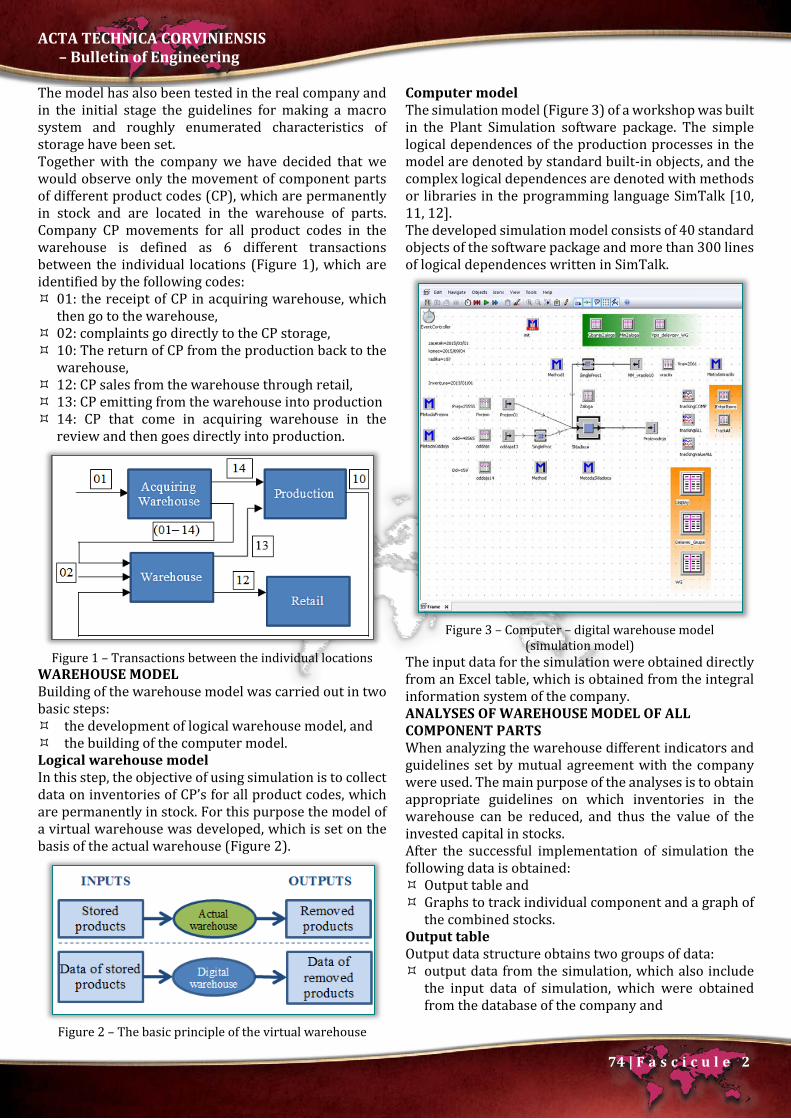
WAREHOUSE MODEL Building of the warehouse model was carried out in two basic steps: the development of logical warehouse model, and the building of the computer model. Logical warehouse model In this step, the objective of using simulation is to collect data on inventories of CP’s for all product codes, which are permanently in stock. For this purpose the model of a virtual warehouse was developed, which is set on the basis of the actual warehouse (Figure 2).
Figure 2 – The basic principle of the virtual warehouse
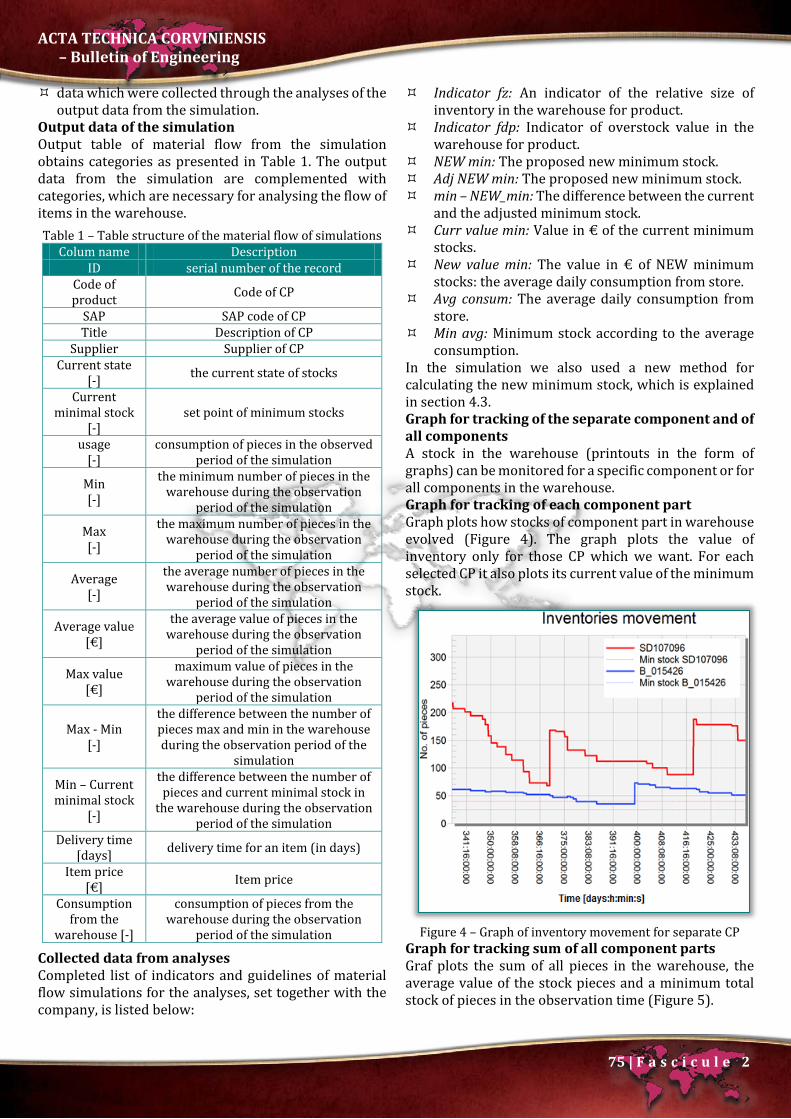
Computer model The simulation model (Figure 3) of a workshop was built in the Plant Simulation software package. The simple logical dependences of the production processes in the model are denoted by standard built-in objects, and the complex logical dependences are denoted with methods or libraries in the programming language SimTalk [10, 11, 12]. The developed simulation model consists of 40 standard objects of the software package and more than 300 lines of logical dependences written in SimTalk.
Figure 3 – Computer – digital warehouse model
(simulation model) The input data for the simulation were obtained directly from an Excel table, which is obtained from the integral information system of the company. ANALYSES OF WAREHOUSE MODEL OF ALL COMPONENT PARTS When analyzing the warehouse different indicators and guidelines set by mutual agreement with the company were used. The main purpose of the analyses is to obtain appropriate guidelines on which inventories in the warehouse can be reduced, and thus the value of the invested capital in stocks. After the successful implementation of simulation the following data is obtained: Output table and Graphs to track individual component and a graph of
the combined stocks. Output table Output data structure obtains two groups of data: output data from the simulation, which also include
the input data of simulation, which were obtained from the database of the company and
ACTA TECHNICA CORVINIENSIS – Bulletin of Engineering
75 | F a s c i c u l e 2
data which were collected through the analyses of the output data from the simulation.
Output data of the simulation Output table of material flow from the simulation obtains categories as presented in Table 1. The output data from the simulation are complemented with categories, which are necessary for analysing the flow of items in the warehouse.
Table 1 – Table structure of the material flow of simulations Colum name Description
ID serial number of the record Code of product Code of CP
SAP SAP code of CP Title Description of CP
Supplier Supplier of CP Current state
[-] the current state of stocks
Current minimal stock
[-] set point of minimum stocks
usage [-]
consumption of pieces in the observed period of the simulation
Min [-]
the minimum number of pieces in the warehouse during the observation
period of the simulation
Max [-]
the maximum number of pieces in the warehouse during the observation
period of the simulation
Average [-]
the average number of pieces in the warehouse during the observation
period of the simulation
Average value [€]
the average value of pieces in the warehouse during the observation
period of the simulation
Max value [€]
maximum value of pieces in the warehouse during the observation
period of the simulation
Max - Min [-]
the difference between the number of pieces max and min in the warehouse during the observation period of the
simulation
Min – Current minimal stock
[-]
the difference between the number of pieces and current minimal stock in
the warehouse during the observation period of the simulation
Delivery time [days] delivery time for an item (in days)
Item price [€] Item price
Consumption from the
warehouse [-]
consumption of pieces from the warehouse during the observation
period of the simulation
Collected data from analyses Completed list of indicators and guidelines of material flow simulations for the analyses, set together with the company, is listed below:
Indicator fz: An indicator of the relative size of inventory in the warehouse for product.
Indicator fdp: Indicator of overstock value in the warehouse for product.
NEW min: The proposed new minimum stock. Adj NEW min: The proposed new minimum stock. min – NEW_min: The difference between the current
and the adjusted minimum stock. Curr value min: Value in € of the current minimum
stocks. New value min: The value in € of NEW minimum
stocks: the average daily consumption from store. Avg consum: The average daily consumption from
store. Min avg: Minimum stock according to the average
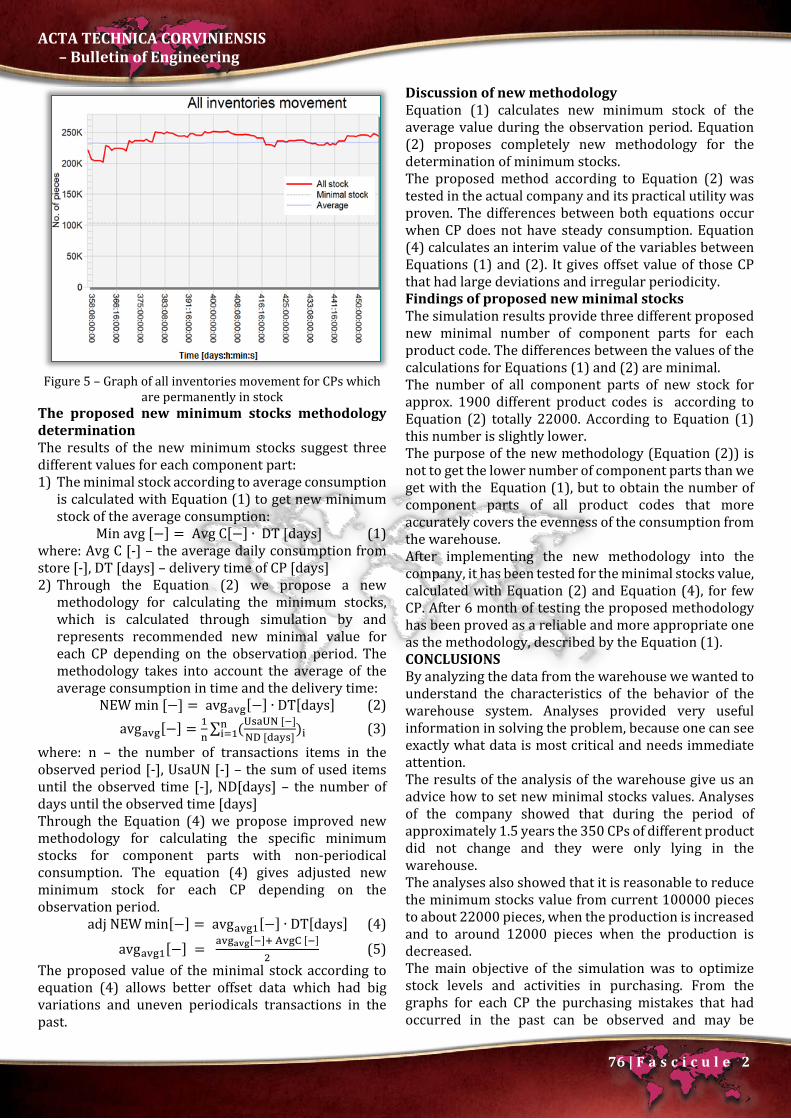
consumption. In the simulation we also used a new method for calculating the new minimum stock, which is explained in section 4.3. Graph for tracking of the separate component and of all components A stock in the warehouse (printouts in the form of graphs) can be monitored for a specific component or for all components in the warehouse. Graph for tracking of each component part Graph plots how stocks of component part in warehouse evolved (Figure 4). The graph plots the value of inventory only for those CP which we want. For each selected CP it also plots its current value of the minimum stock.
Figure 4 – Graph of inventory movement for separate CP
Graph for tracking sum of all component parts Graf plots the sum of all pieces in the warehouse, the average value of the stock pieces and a minimum total stock of pieces in the observation time (Figure 5).
ACTA TECHNICA CORVINIENSIS – Bulletin of Engineering
76 | F a s c i c u l e 2
Figure 5 – Graph of all inventories movement for CPs which
are permanently in stock The proposed new minimum stocks methodology determination The results of the new minimum stocks suggest three different values for each component part: 1) The minimal stock according to average consumption
is calculated with Equation (1) to get new minimum stock of the average consumption:
Min avg [−] = Avg C[−] ∙ DT [days] (1) where: Avg C [-] – the average daily consumption from store [-], DT [days] – delivery time of CP [days] 2) Through the Equation (2) we propose a new
methodology for calculating the minimum stocks, which is calculated through simulation by and represents recommended new minimal value for each CP depending on the observation period. The methodology takes into account the average of the average consumption in time and the delivery time:
NEW min [−] = avgavg[−] ∙ DT[days] (2) avgavg[−] = 1
n∑ (UsaUN [−]
ND [days])in
i=1 (3) where: n – the number of transactions items in the observed period [-], UsaUN [-] – the sum of used items until the observed time [-], ND[days] – the number of days until the observed time [days] Through the Equation (4) we propose improved new methodology for calculating the specific minimum stocks for component parts with non-periodical consumption. The equation (4) gives adjusted new minimum stock for each CP depending on the observation period.
adj NEW min[−] = avgavg1[−] ∙ DT[days] (4)
avgavg1[−] = avgavg[−]+ AvgC [−]
2 (5)
The proposed value of the minimal stock according to equation (4) allows better offset data which had big variations and uneven periodicals transactions in the past.
Discussion of new methodology Equation (1) calculates new minimum stock of the average value during the observation period. Equation (2) proposes completely new methodology for the determination of minimum stocks. The proposed method according to Equation (2) was tested in the actual company and its practical utility was proven. The differences between both equations occur when CP does not have steady consumption. Equation (4) calculates an interim value of the variables between Equations (1) and (2). It gives offset value of those CP that had large deviations and irregular periodicity. Findings of proposed new minimal stocks The simulation results provide three different proposed new minimal number of component parts for each product code. The differences between the values of the calculations for Equations (1) and (2) are minimal. The number of all component parts of new stock for approx. 1900 different product codes is according to Equation (2) totally 22000. According to Equation (1) this number is slightly lower. The purpose of the new methodology (Equation (2)) is not to get the lower number of component parts than we get with the Equation (1), but to obtain the number of component parts of all product codes that more accurately covers the evenness of the consumption from the warehouse. After implementing the new methodology into the company, it has been tested for the minimal stocks value, calculated with Equation (2) and Equation (4), for few CP. After 6 month of testing the proposed methodology has been proved as a reliable and more appropriate one as the methodology, described by the Equation (1). CONCLUSIONS By analyzing the data from the warehouse we wanted to understand the characteristics of the behavior of the warehouse system. Analyses provided very useful information in solving the problem, because one can see exactly what data is most critical and needs immediate attention. The results of the analysis of the warehouse give us an advice how to set new minimal stocks values. Analyses of the company showed that during the period of approximately 1.5 years the 350 CPs of different product did not change and they were only lying in the warehouse. The analyses also showed that it is reasonable to reduce the minimum stocks value from current 100000 pieces to about 22000 pieces, when the production is increased and to around 12000 pieces when the production is decreased. The main objective of the simulation was to optimize stock levels and activities in purchasing. From the graphs for each CP the purchasing mistakes that had occurred in the past can be observed and may be
ACTA TECHNICA CORVINIENSIS – Bulletin of Engineering
77 | F a s c i c u l e 2
avoided in the future. Also graph of total stocks value is a good indication of general warehouse state. The value in this graph should be as low as possible, because it means less capital tied up in the warehouse and consequently less costs. Because the minimal stocks values depend on the production volume, the company is running the simulation every few months and always adjusting the minimal stock values for each CP. By doing this, they are keeping the individual optimal values for each CP. In the future work we will focus to implement this idea into place buffers in production processes. Note This paper is based on the paper presented at The International Conference Management of Technology – Step to Sustainable Production (MOTSP 2016), organized by the Faculty of Mechanical Engineering and Naval Architecture, Croatian Association for PLM and the University of North, in Porec/Parenzo, Istria, CROATIA, June 01–03, 2016. References [1] AUTOMATICA Accompanying Program: Smart
factory, 6th international Trade Fair for Automation and Mechatronics, Munich, 3 – 6 June 2014.
[2] Hicks, B. J.: Lean information management: understanding and eliminating waste, International Journal Of Information Management, 27(2007)4, 233-249.
[3] Debevec, M., Simic, M., Herakovic, N.: Virtual factory as an advanced approach for production process optimization, International journal of simulation modelling, 13(2014)1, 66-78.
[4] Ayadi, M., Costa Affonso, R., Cheutet, V., Masmoudi, F., Riviere, A., Haddar, M.: Conceptual Model for Management of Digital Factory Simulation Information, International Journal of Simulation Modelling, 12(2013)2, 107-119.
[5] Cigolini, R., Pero, M., Rossi, T., Sianesi, A.: Linking supply chain configuration to supply chain performance, Simulation Modelling Practice and Theory, Department of Management, Economics and Industrial Engineering (DIG), Politecnico di Milano, Italy, 2013.
[6] Herakovic, N., Metlikovic, P, Debevec, M.: Motivational Lean Game to Support Decision between Push and Pull Production Strategy, International Journal of Simulation Modelling, 13(2014)4, 391-526.
[7] Kocisko, M., Novak-Marcincin, J., Baron, P., Dobransky, J.: Utilization of progressive simulation software for optimization of production systems in the area of small and medium companies, Technical Gazette, 19(2012)4, 983-986.
[8] Wenzel, S., Jessen, U., Bernhard, J.: Classification and conventions structure the handling of models within
the Digital Factory, Computers in Industry, 56(2005)4, 334-346.
[9] Eskandari, H., Rahaee, M.A., Memarpour, M., Hasannayebi E. and Malek, S.A.: Evaluation of different berthing scenarios in Shahid Rajaee container terminal using discrete-event simulation, in Winter Simulation Conference (WSC), 2013.
[10] eM-Plant Objects Manual, Tecnomatix Technologies GmbH & Co. KG., 1998.
[11] eM-Plant Reference Manual,Tecnomatix Technologies GmbH & Co. KG., 1998.
[12] Bangsow, S. Tecnomatix Plant Simulation, Modeling and Programming by Means of Examples, Springer, 2015.
copyright ©
University POLITEHNICA Timisoara, Faculty of Engineering Hunedoara,
5, Revolutiei, 331128, Hunedoara, ROMANIA http://acta.fih.upt.ro