c 611 acta - university of oulujultika.oulu.fi/files/isbn9789526215334.pdf · acta universitatis...
TRANSCRIPT
UNIVERSITY OF OULU P .O. Box 8000 F I -90014 UNIVERSITY OF OULU FINLAND
A C T A U N I V E R S I T A T I S O U L U E N S I S
University Lecturer Tuomo Glumoff
University Lecturer Santeri Palviainen
Postdoctoral research fellow Sanna Taskila
Professor Olli Vuolteenaho
University Lecturer Veli-Matti Ulvinen
Planning Director Pertti Tikkanen
Professor Jari Juga
University Lecturer Anu Soikkeli
Professor Olli Vuolteenaho
Publications Editor Kirsti Nurkkala
ISBN 978-952-62-1532-7 (Paperback)ISBN 978-952-62-1533-4 (PDF)ISSN 0355-3213 (Print)ISSN 1796-2226 (Online)
U N I V E R S I TAT I S O U L U E N S I SACTAC
TECHNICA
U N I V E R S I TAT I S O U L U E N S I SACTAC
TECHNICA
OULU 2017
C 611
Pekka Ylitalo
VALUE CREATION METRICS IN SYSTEMATIC IDEA GENERATION
UNIVERSITY OF OULU GRADUATE SCHOOL;UNIVERSITY OF OULU,FACULTY OF TECHNOLOGY
C 611
ACTA
Pekka Ylitalo
C611etukansi.kesken.fm Page 1 Thursday, March 23, 2017 10:43 AM

A C T A U N I V E R S I T A T I S O U L U E N S I SC Te c h n i c a 6 1 1
PEKKA YLITALO
VALUE CREATION METRICSIN SYSTEMATIC IDEA GENERATION
Academic dissertation to be presented with the assent ofthe Doctoral Training Committee of Technology andNatural Sciences of the University of Oulu for publicdefence in Auditorium TS101, Linnanmaa, on 3 May 2017,at 12 noon
UNIVERSITY OF OULU, OULU 2017
Copyright © 2017Acta Univ. Oul. C 611, 2017
Supervised byProfessor Pekka Kess
Reviewed byProfessor Marko SeppänenDoctor Satu Parjanen
ISBN 978-952-62-1532-7 (Paperback)ISBN 978-952-62-1533-4 (PDF)
ISSN 0355-3213 (Printed)ISSN 1796-2226 (Online)
Cover DesignRaimo Ahonen
JUVENES PRINTTAMPERE 2017
OpponentsDocent Harri KulmalaProfessor Marko Seppänen
Ylitalo, Pekka, Value creation metrics in systematic idea generation. University of Oulu Graduate School; University of Oulu, Faculty of TechnologyActa Univ. Oul. C 611, 2017University of Oulu, P.O. Box 8000, FI-90014 University of Oulu, Finland
Abstract
The ability to generate creative new ideas to develop innovative products and optimize processeshas become crucially important for organizations’ survival in the competitive and turbulent marketenvironment. The objective of this dissertation was to examine the value creation of systematicidea generation in a quantitative fashion by defining a new evaluation methodology. This calledfor designing a set of quantitative value creation metrics for creative idea generation. This studyaims to enhance current knowledge of idea generation measurement that has so far mainly focusedon human judgment-based methods.
The goals of this exploratory study were formulated into two research questions. The firstaddressed the subject from a conceptual viewpoint, while the second involved a single-case studyin the automotive industry. Documentation-based approaches were used as the primary means ofdata collection to maximize the quantitative accuracy of the measurement. Single-case study wasselected as the research method because of the deep-level data access required to thoroughly assessan idea generation process.
Patent information-based measures were adopted in the case organization to gain insights intothe effectiveness of its idea generation process. The research data was collected from the caseorganization’s management information systems. Data analysis allowed for a fact-basedevaluation of the idea generation process, which would not have been possible with traditionalqualitative measures. The results demonstrate that idea generation can be measured rigorously likemost other processes when proper metrics are in place. Nevertheless, several limitations wereidentified that must be considered when discussing further applications of the proposed measuresin other organizations.
This thesis proposes a new analysis method for the creative phase of the product creationprocess. Future studies could build on this model, for example, by experimenting with theindicators proposed by this study in other contexts or designing a set of “rival” value creationmetrics for idea generation.
Keywords: automotive, case study, creativity, idea generation, management,measurement, product development, value creation

Ylitalo, Pekka, Arvonluontimittarit systemaattisessa ideoiden luonnissa. Oulun yliopiston tutkijakoulu; Oulun yliopisto, Teknillinen tiedekuntaActa Univ. Oul. C 611, 2017Oulun yliopisto, PL 8000, 90014 Oulun yliopisto
Tiivistelmä
Kyky luoda uusia ideoita innovatiivisten tuotteiden kehitystä ja prosessien optimointia varten onelintärkeää organisaatioiden selviytymisen kannalta vahvasti kilpailluilla markkinoilla. Tämäntutkimuksen tavoitteena oli tutkia arvonluontia systemaattisessa ideoiden luonnissa määrällisinmenetelmin kehittämällä uusi arviointimenetelmä. Tässä yhteydessä oli määritettävä joukkomäärällisiä arvonluontimittareita luovalle ideoiden luonnille. Tutkimus pyrkii täydentämään ole-massa olevaa tietämystä ideoiden luonnin mittaamisesta, joka on tähän asti pääasiassa keskitty-nyt laadullisiin menetelmiin.
Tutkimuksen tavoitteista johdettiin kaksi tutkimuskysymystä. Ensimmäinen kysymys käsitte-li aihepiiriä teoreettisesta näkökulmasta, ja toinen liittyi autoteollisuudessa tehtävään tapaustut-kimukseen. Empiirisen aineiston keruussa hyödynnettiin ensisijaisesti asiakirjapohjaisia lähesty-mistapoja määrällisen mittauksen tarkkuuden maksimoimiseksi. Tutkimusmenetelmäksi valit-tiin yhden tapauksen tutkimus, koska ideoidenluontiprosessin syvällinen analyysi vaatii pääsyäyksityiskohtaiseen yritysaineistoon, mikä ei monitapaustutkimuksessa olisi ollut mahdollista.
Ideoiden luontiprosessin tehokkuuden arviointia varten tapausorganisaatiossa otettiin käyt-töön patenttitietoon pohjautuvia indikaattoreita. Aineisto kerättiin organisaation tietojärjestel-missä. Aineiston tarkastelu mahdollisti ideoiden luonti-prosessissa tapahtuvan arvonluonninkonkreettisen havainnollistamisen, mikä ei olisi ollut mahdollista perinteisten laadullisten mitta-rien avulla. Tutkimuksen tulokset osoittavat, että luovaa ideoiden luontia pystytään mittaamaanuseimpien muiden yritysprosessien tapaan täsmällisesti, mikäli sovelletaan asianmukaisia indi-kaattoreita. Tutkimus nosti kuitenkin esiin tiettyjä tekijöitä, jotka rajoittavat tässä työssä esitelty-jen tehokkuuden mittarien käyttöä muissa organisaatioissa.
Tämä työ esittää uuden arviointimenetelmän, jota voidaan soveltaa tuotekehitysprosessinluovassa vaiheessa. Aihetta käsittelevät jatkotutkimukset voisivat laajentaa tässä työssä kehitet-tyä mallia esimerkiksi kokeilemalla esiteltyjen indikaattorien käyttöönottoa muissa konteksteissatai määrittelemällä vaihtoehtoiset arvonluontimittarit, jotka eivät jaa samoja rajoitteita.
Asiasanat: arvonluonti, autoteollisuus, hallinta, ideoiden luonti, luovuus, mittaaminen,tapaustutkimus, tuotekehitys

7
Acknowledgements
My interest in the measurement of value creation was already triggered during my
Master’s thesis in 2013. Its aim was to define key performance indicators for an
organizational entity operating in the information technology field by means of a
case study. In that project, I was able to implement the research principles I had
learned and adopted when studying at the Department of Industrial Engineering
and Management of the University of Oulu in a practical context. Simultaneously,
I gained deep insight into the processes of one of the leading corporations in the
automotive industry. In the end, the opportunity was there to test my knowledge in
a new environment and devise value creation metrics for the early stages of the
product development process. Shortly afterwards, in November 2013, the work
described in this dissertation was started.
Although this dissertation was written by me, the research was conducted in
close cooperation with a network of people, colleagues, and supervisors. I feel truly
grateful to everyone involved in this project.
My supervisor, Professor Pekka Kess, gave invaluable support through his
guidance, facilitation and academic network from the beginning to the end of the
research process. His extensive experience in both academic and industrial areas,
as well as his knowledge of the practical matters of writing a dissertation
accelerated my learning process significantly. I wish to thank him for his flexibility
when it came to arranging face-to-face meetings within a limited time frame,
reviewing work in progress and giving feedback in the short term, as well as being
open to the usage of different communication channels due to the great distance
between the research site and the University of Oulu. I am indebted to Professor
Kess for not only his constructive criticism and decisive suggestions, which
contributed to the results presented in this dissertation, but also his words of
encouragement that ultimately made it possible for me to accomplish this work.
I am forever indebted to my supervisor in the case organization, Mr. Peter
Gödecke, who was the real reason why this study was initiated in the first place.
Peter’s experience, motivation and passion for systematic idea generation allowed
me to have both a vital company-internal sponsor for my dissertation and a
discussion partner with whom to tackle issues and overcome barriers together. His
vision of transparent and quantitative means to measure idea generation is what
fueled this thesis, the completion of which would not have been possible without
Peter’s practical knowledge and fresh suggestions. I also wish to extend my thanks
to the whole team of colleagues in the case organization, who for their part
8
contributed to my work in various stages and ensured that I would always have the
resources I need to advance my thesis. The case organization also acted as the
primary financial supporter of this project, for which I am most grateful.
I would also like to thank Professor Harri Haapasalo and Dr. Kai Hänninen for
their valuable support and feedback. Professor Haapasalo and Dr. Hänninen
together formed the follow-up group for my dissertation, which provided me with
an ideal forum to present and discuss the methodology, findings, and results of my
work. Without their contribution, finishing the study within the planned schedule
would have been difficult.
I wish to thank the Emil Aaltonen Foundation and the Jenny and Antti Wihuri
Foundation who gave me financial support during my doctoral studies. The grants
offered by these foundations allowed me to commute between the University of
Oulu and the research site more regularly.
I am very grateful to the pre-examiners of my dissertation, Professor Marko
Seppänen and Dr. Satu Parjanen. Their valuable comments and recommendations
greatly benefited this research and increased its contribution and academic value.
It has been an honor to cooperate with Professor Marko Seppänen and Dr. Satu
Parjanen, and I wish to express my gratitude for their time and effort in evaluating
and enhancing this work.
Finally, I want to thank my parents Nina and Juha for their encouragement and
whole-hearted support before and during the years of this doctoral research. Their
great ability to look on the bright side has provided a solid foundation for me to
conduct this research, and I am grateful to have had them by my side.
Oulu, Finland, May 2017 Pekka Ylitalo
9
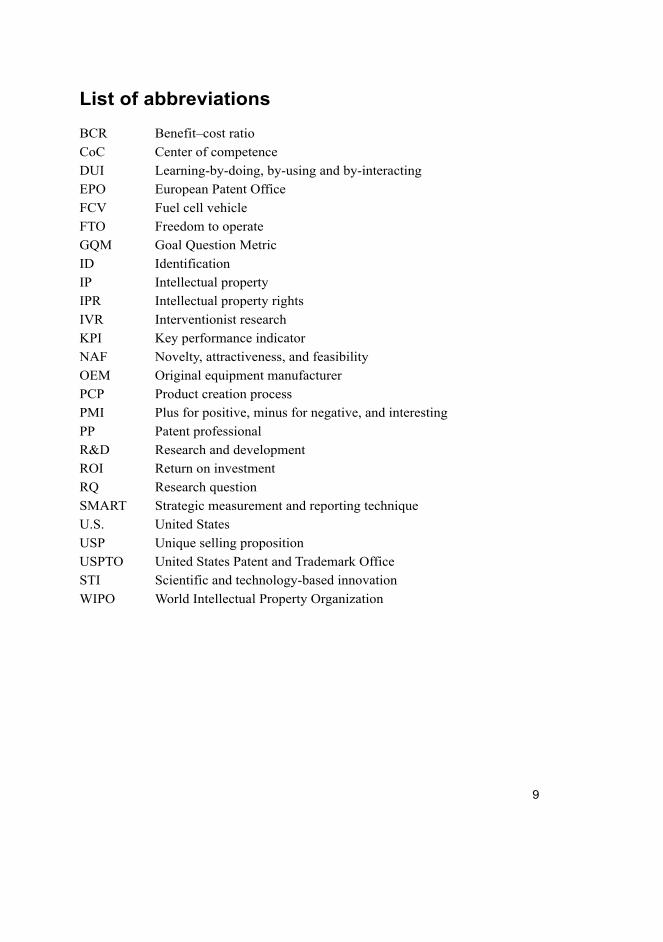
List of abbreviations
BCR Benefit–cost ratio
CoC Center of competence
DUI Learning-by-doing, by-using and by-interacting
EPO European Patent Office
FCV Fuel cell vehicle
FTO Freedom to operate
GQM Goal Question Metric
ID Identification
IP Intellectual property
IPR Intellectual property rights
IVR Interventionist research
KPI Key performance indicator
NAF Novelty, attractiveness, and feasibility
OEM Original equipment manufacturer
PCP Product creation process
PMI Plus for positive, minus for negative, and interesting
PP Patent professional
R&D Research and development
ROI Return on investment
RQ Research question
SMART Strategic measurement and reporting technique
U.S. United States
USP Unique selling proposition
USPTO United States Patent and Trademark Office
STI Scientific and technology-based innovation
WIPO World Intellectual Property Organization

10
11
Table of contents
Abstract
Tiivistelmä
Acknowledgements 7
List of abbreviations 9
Table of contents 11
1 Introduction 13
1.1 Motivation for the study .......................................................................... 14
1.1.1 Research background.................................................................... 14
1.1.2 Gap in the current idea generation literature ................................ 17
1.2 Scope of the study ................................................................................... 18
1.2.1 Research problem and research questions .................................... 19
1.2.2 Limitations and assumptions of the research ................................ 20
1.3 Outline of the dissertation ....................................................................... 21
2 Research methodology 23
2.1 Presentation of the case organization ...................................................... 24
2.2 Research design....................................................................................... 27
2.2.1 Key research choices .................................................................... 28
2.2.2 Case study as a research method .................................................. 31
2.3 Data collection and analysis .................................................................... 36
3 Theoretical framework for evaluating systematic idea generation 43
3.1 Creative idea generation in practice ........................................................ 44
3.1.1 Defining creativity and innovation ............................................... 45
3.1.2 Systematic idea generation ........................................................... 52
3.2 Theory of measurement .......................................................................... 60
3.2.1 Performance measurement ........................................................... 64
3.2.2 Building a measurement model .................................................... 66
3.3 Effectiveness metrics for idea generation ............................................... 69
3.3.1 Financial metrics .......................................................................... 71
3.3.2 Evaluation of creativity techniques .............................................. 74
3.3.3 Evaluation of ideas ....................................................................... 76
3.4 Patenting and the innovation process ...................................................... 83
3.4.1 Defensive patenting ...................................................................... 86
3.4.2 Patenting in the automotive industry ............................................ 89
3.4.3 Patents as metrics for R&D .......................................................... 91
3.5 Answer to the first research question .................................................... 101
12
4 Defining a model for measuring idea generation effectiveness 105
4.1 Value creation metrics in the case organization .................................... 107
4.1.1 The systematic idea generation process ...................................... 108
4.1.2 The patent harnessing process .................................................... 114
4.1.3 GQM-based definition of value creation metrics ....................... 119
4.1.4 Summary of the measurement model ......................................... 124
4.2 Case analysis of idea generation performance ...................................... 125
4.2.1 Quantitative properties of the idea generation process ............... 126
4.2.2 Determining value creation based on patent analysis ................. 129
4.3 Answer to the second research question................................................ 146
5 Discussion 149
5.1 Limitations of proposed idea generation metrics .................................. 149
5.1.1 Theoretical aspect: insights from the literature ........................... 150
5.1.2 Empirical aspect: workshops in the case organization ............... 153
5.2 Possibilities for the evaluation of idea generation outcomes ................ 157
5.2.1 An ideal workshop process for patent harnessing ...................... 158
5.2.2 Future value creation metrics in idea generation ........................ 162
5.2.3 The new role of innovation workshops ...................................... 165
5.3 Summary of the discussion part ............................................................ 168
6 Conclusions 171
6.1 Theoretical implications ........................................................................ 171
6.2 Methodological implications ................................................................. 174
6.3 Managerial implications ........................................................................ 175
6.4 Critical assessment ................................................................................ 177
6.4.1 Limitations of the research ......................................................... 177
6.4.2 Assessment of the research ......................................................... 181
6.5 Topics for further research .................................................................... 184
7 Summary 189
References 191
Appendices 207
13
1 Introduction
In recent decades, innovation has become an integral element of not only each
organization’s adaptation to constantly changing market situations but also their
survival, as companies that do not innovate usually fall behind competition and die
off in the long run (e.g. Chesbrough 2003, Zolotová et al. 2012). In contrast, many
best-in-class enterprises generate over three-quarters of their total revenue from
offerings which did not exist a couple of years prior (Milton 2003). Thus, it is clear
that the development of innovative products and services is perhaps the single most
important way to maintain the competitive advantage of a company (e.g. Verhaegen
et al. 2013).
Innovative offerings cannot emerge without searching for creative new product
ideas, and harnessing organizational creativity is crucial in the current economic
and technological environment to provide input for the innovation that is so vital
for the survival of companies (Oldham & Da Silva 2015). Hence, scientific research
on the development of new innovative products is centered on the notion of
creativity and idea generation and, in particular, on how to generate new and useful
ideas for new offerings and creative solutions to problems (Chou 2014).
Determining how efficiently ideas and solution suggestions are discovered within
the design space—preferably in a quantitative manner—continues to puzzle both
design scholars and practitioners (Shah et al. 2003).
Yet, the field of idea generation concerns a great deal of uncertainty, above all
regarding the decisive elements behind the emergence of great ideas, the criteria
with which the quality of ideas should be evaluated, and the process to best “harness”
the creative capability of a product development organization. It has been observed
that high-quality ideas often come from seemingly random sources and are highly
reliant on talented, creative, perseverant, or intelligent individuals who manage to
pick up external impulses (Holmquist 2012: 57). No guaranteed way to generate
high-quality ideas in a consistent fashion has been discovered.
This doctoral dissertation has a broad objective of exploring systematic idea
generation from the perspective of value creation in order to bridge some of the
knowledge gaps related to creative idea generation. The present chapter discusses
the motivation for the study in terms of background research and the knowledge
gap in the scientific literature, defines the scope of the study and the research
questions, and outlines the structure of the dissertation.
14
1.1 Motivation for the study
Desouza et al. (2009: 8) point out that innovation too often occurs by accidental,
coincidental, or chance discovery rather than by goal-oriented work and deliberate
management towards innovating and “thinking outside the box”. Furthermore,
companies often fail to employ a straightforward process to understand, stimulate,
and analyze innovation, which is required to reflect on the organization’s known
strengths and weaknesses and to devise an innovation strategy. Yet, it can prove
difficult, even for organizations that have implemented a structured innovation
process, to measure the performance and value creation of product development
activities (Kerssen-van Drongelen & Bilderbeek 1999). This has become a major
concern for innovation managers and executives in recent times (Lazzarotti et al.
2011).
Modern technological developments, such as the rise of big data and data
mining techniques, has enabled corporations to dissect and evaluate their core
processes in a fact-based manner, to detect future changes before they take place,
and to collect external impulses instantly from around the world (Wenning 2015).
While such a transformation has been possible for most mechanisms and operations
within a company, creativity measurement remains a white spot. It is conceived that
danger lies in trying to measure a process with many intangibles such as idea
generation with quantitative metrics producing numerical data (Dossi & Patelli
2010). Yet, organizations especially in the private sector seek ways to quantitatively
evaluate the effectiveness of their creative innovation processes as they are able to
do with other processes, such as manufacturing, sales, or procurement.
The central motivation behind this research relates to companies’ desire to
measure the performance of their idea generation processes in a transparent and
quantifiable manner. There are currently no means to achieve this in practice, and
the subject, relevant and intriguing as it may be, has attracted little scientific interest
in terms of case studies attempting to assess creative processes. The research
background and the gap in the scientific literature are discussed in more detail in
subsections 1.1.1 and 1.1.2, respectively.
1.1.1 Research background
Beginning in the 1990s, the design and adoption of specific methodologies and
techniques for assessing the performance of research and development (R&D)

15
activities in general has become increasingly important for companies due to
significant phenomena that have shaped the technological and competitive
environment of today’s companies (Lazzarotti et al. 2011). The drastically higher
frequency of changes in business models, customer needs and competitors has
resulted in dynamic and turbulent market arenas where new knowledge needs to be
developed and applied to products and services faster and faster (e.g. Bayus 1998,
Mohr 2001, Wolf 2006). Consequently, modern organizations seek to shorten their
product life-cycles, continuously expand their offering by means of new product
introductions, and come in terms with the raised complexity, costs, and a variety of
technical and scientific knowledge that characterize today’s products and services
(Tidd et al. 2005). It is also believed that, as the number of products increases, the
effectiveness of R&D is diluted and the returns to product creation investments
diminish (Madsen 2006).
For all these reasons, the importance of R&D to companies’ competitiveness
especially in high-technology industries is greatly amplified (Germeraad 2001),
and recent years have witnessed the rise of several new approaches and trends in
the field of innovation that, each in their own way, seek to improve the efficiency
with which an organization utilizes its employees to generate creative new ideas to
then turn into commercially successful products. The philosophies of design
thinking, agile innovation, customer co-creation and open innovation, to name a
few, all focus on enhancing the value creation that takes place during the product
development process by speeding up the innovation process with the help of
iterative development methods (Brown 2008, Morris et al. 2014), addressing the
customer requirements better by involving the end-user directly in the creative
process (Gustafsson et al. 2012), or building communities where stakeholders from
around the world can voice their demands, improvement suggestions, and ideas for
the product under development (Chesbrough 2003). Nevertheless, the adoption of
these new approaches to R&D has failed to bring transparency into the product
creation process (PCP) and, if anything, has merely contributed to the general
confusion over the concrete quantifiable output of a company’s creative activities
(Kimbell 2009). Clearly, there is a need for a methodology to assess the
performance of the PCP in a quantitative fashion, to enable an organization to
improve the quality of its overall R&D chain, and to manage the PCP as a core
process similar to finances and product quality (Dervitsiotis 2011).
Regardless of the company’s innovation model or philosophy, fact-based
measurement of innovation activities has proven a challenging task in the past:
effort levels are not easily observable, success is not guaranteed but instead
16
influenced by uncontrollable factors, and in most cases, the evaluation of the value
of the outcomes can only be performed after a relatively long period of time
(Lazzarotti et al. 2011). In a 2007 senior management survey, while most
executives believed that innovation should be measured rigorously in the same way
as other core processes, only a third of them were satisfied with their company’s
innovation measurement practices (Boston Consulting Group 2008). Numerous
studies and authors have attempted to describe the relationship between R&D and
creative performance in high-technology industries in quantitative terms, like
Chusilp & Jin (2006), who studied the effects of different types of idea generation
iteration loops on the resulting design concept, but have generally only achieved
limited success (Wang et al. 2011: 136).
Undoubtedly, the development of good innovation metrics is an essential way
for an organization to estimate and enhance the value creation of its new product
development process (Dervitsiotis 2011: 555). Many different methods and tools
have been developed to support progress in the latter stages of the PCP. In contrast,
the early phases of innovation generation, such as the idea generation phase, lack
systematic methodologies, even though these initial stages bear the highest cost-
saving potential and, in the end, determine the overall innovativeness of the end
product (Munro 1995, Verhaegen et al. 2011).
Therefore, more focus should be placed on the implementation of idea
generation to identify promising and novel solutions to endow the end product with
optimal performance (Chou 2014: 452). Within this framework, idea generation
refers to the interactive cooperation of people, i.e. scientists, managers, and
engineers, to together solve complex issues, improve organizational behaviors,
design new products, and so forth (e.g. Dunbar 1995, Sutton & Hargadon 1996,
Michinov et al. 2015). Furthermore, to generate innovative solutions, it is necessary
for these actors not only to understand the presented issues but also to use creative
thinking, which refers to the ability to provide new perspectives to the given
problem, and apply persistence to exploring undiscovered pathways to arrive at a
new solution (Taggar 2002). In short, creativity is commonly defined as the
production of original and useful ideas, products, and solutions to known problems
(e.g. Mayer 1999, Oman et al. 2013), whereas idea generation, or ideation, refers
to the process of finding inventive solutions to a problem, encompassing the entire
thought cycle from creative formulation to the generation of solution concepts
(Chou 2014). These key topics of the early phase of the innovation process are
examined more closely in Chapter 3.
17
1.1.2 Gap in the current idea generation literature
The previous section pointed out that quantitative and fact-based measurement of
innovation performance, especially during the early phases of the PCP, offers a
great deal of potential for scientific research. Given the increasingly competitive
business environment of today, firms must take full advantage of their
organizational knowledge and creativity to obtain competitive advantage over rival
companies (e.g. Grant 1996, Szulanski 1996). Thus, measuring how efficiently a
company is trying to achieve this is important, but the current metrics seeking to
describe the concrete value creation of the process are unsatisfactory (Wen 2009).
Zolotová et al. (2012: 568) support this view by stating that the lack of a systematic
methodology to create new innovations and the neglect of the measurement and
analysis of the benefits of inventive processes, such as idea generation, represent
two of the most significant barriers to innovative projects.
Puccio & Cabra (2012: 210) manage to encapsulate the key issue in the
research on early stage innovation performance: the usefulness of creativity
techniques and idea generation in general have received much greater attention
compared to the evaluation of the idea generation outcomes. For instance, a wide
palette of creativity techniques, such as brainstorming, lateral thinking, and
morphological analysis, has been developed and employed in the field of creativity
to assist the generative process and enhance the idea productivity of actors; yet,
relatively little thought has been given to the structuring and evaluation of the
outcomes of these techniques (Childs 2014: 56, Chou 2014). One reason for this
may be that it is difficult to gather theoretical and empirical evidence to highlight
the concrete benefits of utilizing creativity techniques to generate ideas (Smith
1998, Shah et al. 2000). Thus, the research on ideation performance evaluation
needs to catch up with the body of literature dedicated to creativity to allow
organizations to determine in a transparent and easy-to-communicate manner
which ideas have the biggest potential for value creation, what is the probability of
discovering a “good” idea, what is the quantifiable output of the creative process,
and so forth.
There is a clear need for effective evaluation metrics for ideation that are not
only straightforward to employ but also deliver objective results of the creative
process. Although several techniques and tools have been designed to perform this
task, including the NAF (Novelty, Attractiveness, and Feasibility) study, PMI (Plus
for positive, Minus for negative, and Interesting) analysis, and impact analysis,
these approaches are plagued by the fact that they rely on the subjective opinions
18
of a group of experts, judges, or evaluators (Chou 2014). As it stands, practitioners
need fast and reliable ways of measuring the effectiveness of an idea generation
process, but no widespread agreement on such metrics has yet been reached among
creativity researchers, mainly due to the different definitions regarding the unit of
creativity (Saunders & Gero 2002, Fuge et al. 2013). Idea quality and quantity have
typically been the focus of creativity performance analyses, wherein idea quantity
simply refers to the number of non-redundant ideas generated and quality, for
example, to the originality of an idea. Hence, idea quality is both more complex to
determine in a quantifiable manner, and more significant from the value creation
perspective (Michinov et al. 2015: 61).
Furthermore, scholars typically take one of the two approaches to approximate
the idea quality when evaluating the outcomes of systematic idea generation:
human judgment-based measures, as discussed previously, are founded on the
experience of a group of independent adjudicators but do not produce data that is
easily used by computational systems, whereas model-based indicators generate
quantifiable information rapidly and inexpensively but often have difficulties
evaluating the quality of an idea in a systematic manner (Fuge et al. 2013).
Moreover, there are no established indicators for measuring idea generation
effectiveness during R&D activities that span across industries; instead, innovation
managers from different organizations must select the metrics according to the
strategies of their respective companies (Glassman 2009, Kerzner 2014).
That is where this study seeks to contribute to scientific research. On the one
hand, it aims to design value creation metrics for idea generation to provide a solid
platform for organizations to evaluate their creative processes on the basis of
quantitative data and, on the other hand, it seeks to construct a measurement model
that is embraced by companies wanting to move away from human judgment-based
approaches, and thus to help establish the future standard for idea generation
performance assessment.
1.2 Scope of the study
The field of idea generation effectiveness measurement has attracted far less
attention from the scientific literature compared to many other topics related to
creativity, even though several researchers and practitioners have voiced a demand
for a systematic method to evaluate the early stages of R&D similarly to other core
processes (Dervitsiotis 2011, Chou 2014). At the same time, a great deal of the idea
19
generation metrics established in the literature are of qualitative nature and founded
on human judgment, such as the evaluation criteria presented by Shah et al. (2003),
and scholars have faced challenges when employing analytical approaches to the
evaluation of creative outcomes (Fuge et al. 2013). Within this framework, the
focus of this study is firmly set on expanding the knowledge of the model-based
evaluation of creativity through designing quantifiable value creation metrics for
an idea generation process. It is important to stress at this point that this research
does not strive to debate which is the best method to generate ideas, or to evaluate
and compare different idea generation philosophies.
A further aim of this research is to apply the defined idea generation
performance measures to practice by means of a case study. More specifically, a
single-case study is selected as the research method for experimenting with value
creation metrics in practice. This is primarily due to the immense effort needed to
analyze an idea generation process over a period of time to gain insight into the
value creation taking place in creative idea generation and to gather enough
quantitative information to be able to determine the effectiveness of the process, as
well as to validate the metrics used to measure it. As this research represents one
of the first studies to focus on developing and experimenting with quantitative
value creation indicators for creativity, the possibility of evaluating multiple
processes in different companies and industries at the same time is effectively
eliminated due to issues of scale. Admittedly, a multiple-case study would provide
more data and arguably deliver more reliable results; however, the selection of
single-case study as the research approach is justified by a number of points
presented by Yin (2009), for instance, when the individual chosen case embodies a
“typical”, “revelatory”, or “longitudinal” case. The case selected for this research
meets the above conditions, among others, which are discussed in detail in
subsection 2.2.2. An additional purpose of the case study is to recognize the
strengths and shortcomings of the proposed quantitative value creation metrics for
idea generation and to draw conclusions on the likely development path of creative
performance measurement in general.
1.2.1 Research problem and research questions
The problem with creative processes is that they are often unstructured in nature,
difficult to steer due to unforeseeable results, and produce outcomes that vary in
quantity, form, and quality (Puccio & Cabra 2012). The great obstacle, and thus the
research problem, is then how to design metrics that can measure a creative idea
20
generation process in a transparent and quantitative manner while retaining the
validity of established measures and producing reliable and easy-to-interpret results?
This is a significant issue in the field of innovation and creativity management, as
quantitative metrics would bring benefits both for the academic field of product
creation research and for companies operating in high-technology fields. Without
proper metrics in place, such companies cannot be held accountable for results, and
learning and continuous improvement efforts become next to impossible to achieve
(Cooper & Edgett 2008).
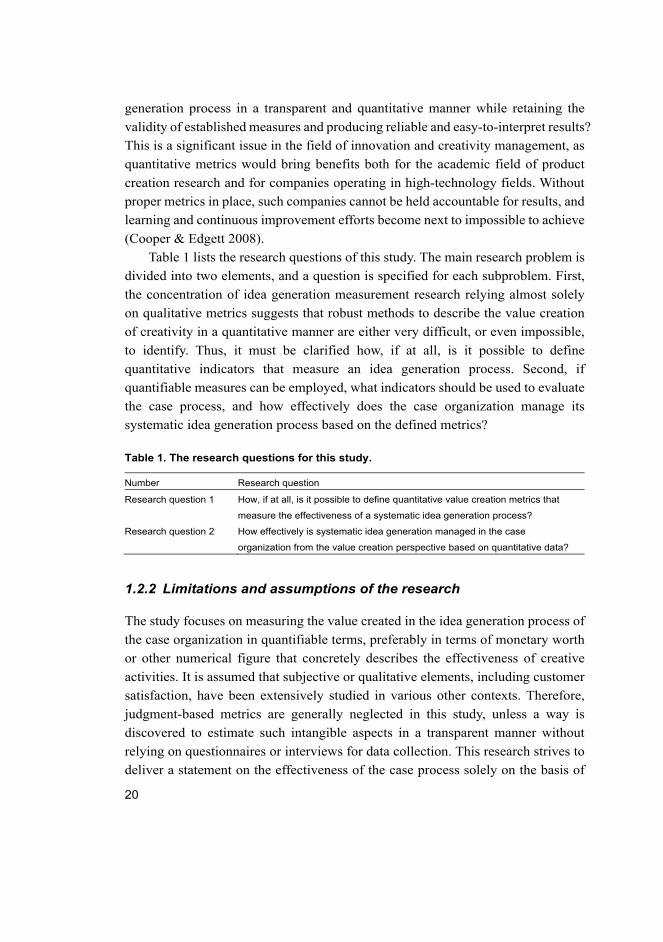
Table 1 lists the research questions of this study. The main research problem is
divided into two elements, and a question is specified for each subproblem. First,
the concentration of idea generation measurement research relying almost solely
on qualitative metrics suggests that robust methods to describe the value creation
of creativity in a quantitative manner are either very difficult, or even impossible,
to identify. Thus, it must be clarified how, if at all, is it possible to define
quantitative indicators that measure an idea generation process. Second, if
quantifiable measures can be employed, what indicators should be used to evaluate
the case process, and how effectively does the case organization manage its
systematic idea generation process based on the defined metrics?
Table 1. The research questions for this study.
Number Research question
Research question 1 How, if at all, is it possible to define quantitative value creation metrics that
measure the effectiveness of a systematic idea generation process?
Research question 2 How effectively is systematic idea generation managed in the case
organization from the value creation perspective based on quantitative data?
1.2.2 Limitations and assumptions of the research
The study focuses on measuring the value created in the idea generation process of
the case organization in quantifiable terms, preferably in terms of monetary worth
or other numerical figure that concretely describes the effectiveness of creative
activities. It is assumed that subjective or qualitative elements, including customer
satisfaction, have been extensively studied in various other contexts. Therefore,
judgment-based metrics are generally neglected in this study, unless a way is
discovered to estimate such intangible aspects in a transparent manner without
relying on questionnaires or interviews for data collection. This research strives to
deliver a statement on the effectiveness of the case process solely on the basis of
21
fact-based information retrieved with the help of quantitative methods, leaving as
little room as possible for individual interpretations and subjective opinions.
Another point of emphasis of this research is the examination of a systematic
idea generation process exclusively as a closed model of innovation. Alternative
models of creative product development, such as open innovation as presented by
Chesbrough (2003), are becoming prominent in various industries and companies,
not to mention the case organization’s parent company, where a separate center of
competence (CoC) has been established to look after and steer the company’s idea
management and open innovation process. Yet, different types of innovation
processes require different value creation metrics, and open innovation—while
undoubtedly important—is not examined in this study in depth. Instead, the focus
is on analyzing the case organization’s closed-form idea generation process and
constructing a quantitative measurement model that best evaluates the value
creation of exactly such a process. Chapter 2 provides a more detailed description
of the roles, responsibilities, and attributes of the case organization of this study, as
well as of other research choices.
1.3 Outline of the dissertation
This research is constructed according to the linear-analytic structure model
presented by Yin (1994), and can be divided into four main elements. First, the
introduction and research methodology of the study are presented in Chapters 1 and
2, which together comprise the preparation stage of the study and present the
decisions concerning the research strategies. Second, the literature review and
theoretical foundation of the research presented in Chapter 3 make up the
theoretical analysis stage of the study and answer to the first research question:
“How, if at all, is it possible to define quantitative value creation metrics that
measure the effectiveness of a systematic idea generation process?” Third, the main
part of the practical research takes place in the form of an empirical case study,
which is discussed in Chapter 4, along with the design and implementation of value
creation metrics for idea generation. Chapter 4 also answers to the second research
question: “How effectively is systematic idea generation managed in the case
organization from the value creation perspective based on quantitative data?”
Fourth, the discussion and conclusion parts of this study examine the future
perspectives on the systematic idea generation effectiveness research and analyze
the validity of the results of this study in Chapters 5 and 6, respectively. Finally,
Chapter 7 delivers a summary of the goals, methods, and results of the research.
22
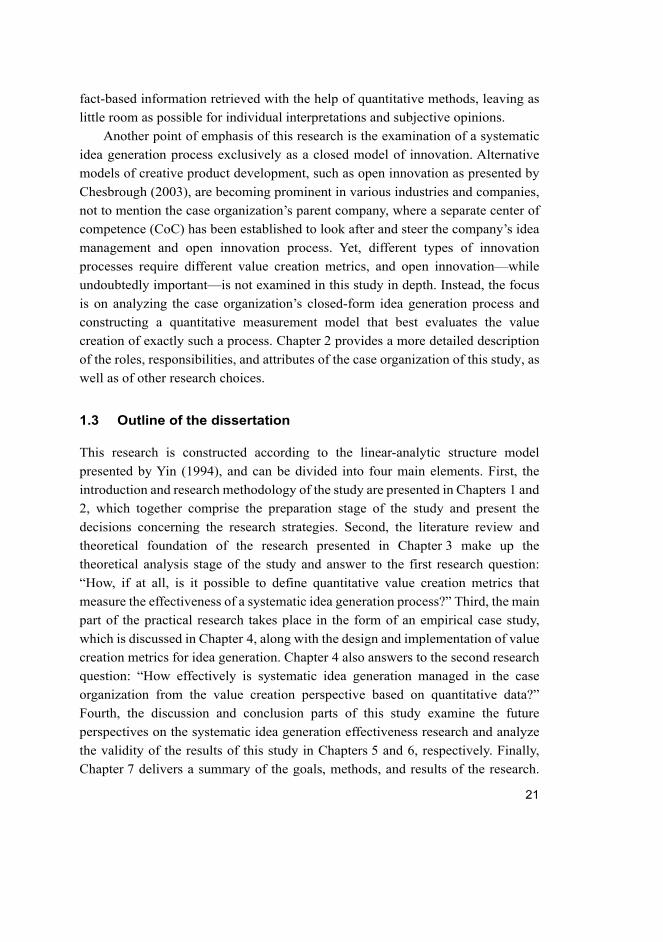
The broad research path of this study is visualized in Fig. 1, highlighting the
individual key building blocks of the dissertation.
Fig. 1. The overall research design.
23
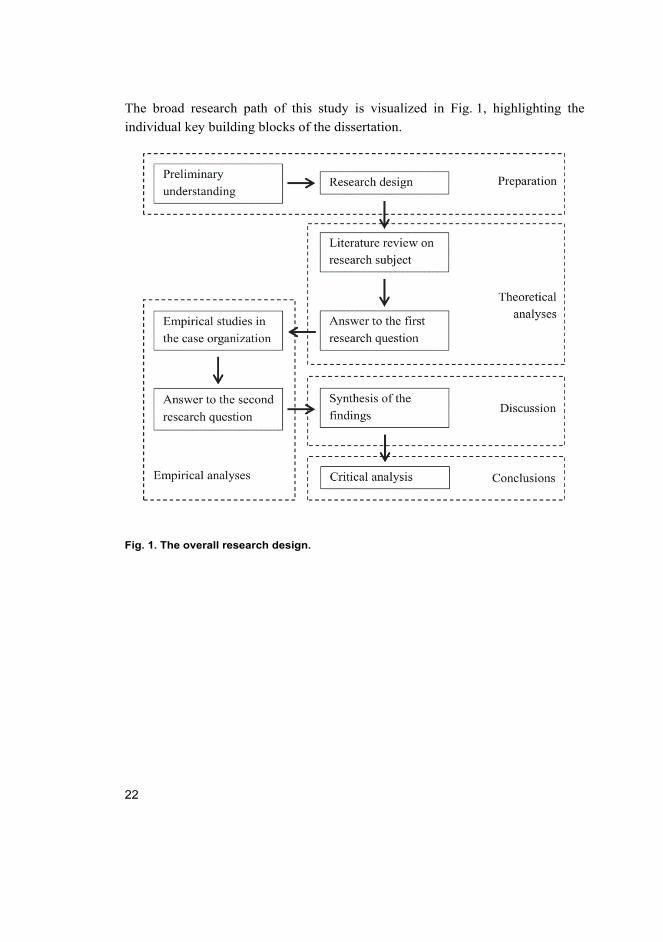
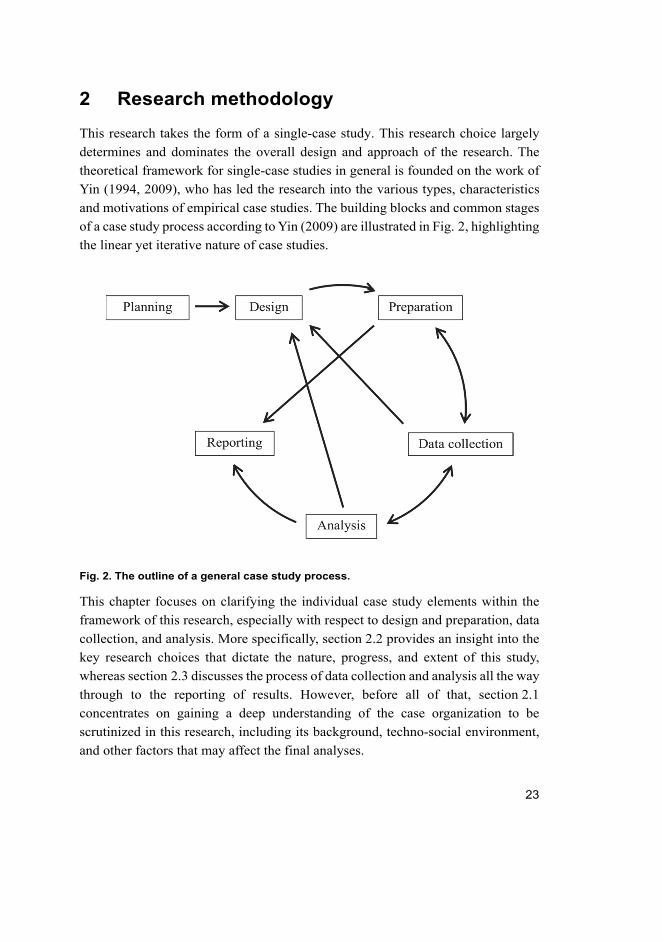
2 Research methodology
This research takes the form of a single-case study. This research choice largely
determines and dominates the overall design and approach of the research. The
theoretical framework for single-case studies in general is founded on the work of
Yin (1994, 2009), who has led the research into the various types, characteristics
and motivations of empirical case studies. The building blocks and common stages
of a case study process according to Yin (2009) are illustrated in Fig. 2, highlighting
the linear yet iterative nature of case studies.
Fig. 2. The outline of a general case study process.
This chapter focuses on clarifying the individual case study elements within the
framework of this research, especially with respect to design and preparation, data
collection, and analysis. More specifically, section 2.2 provides an insight into the
key research choices that dictate the nature, progress, and extent of this study,
whereas section 2.3 discusses the process of data collection and analysis all the way
through to the reporting of results. However, before all of that, section 2.1
concentrates on gaining a deep understanding of the case organization to be
scrutinized in this research, including its background, techno-social environment,
and other factors that may affect the final analyses.
24
2.1 Presentation of the case organization
There are in effect two organizations relevant to this case study, and need to be
defined accordingly. First, the case organization is a methodologically specialized
organization which operates as a part of a much larger parent company. The second
organization is the parent company, which is not directly evaluated during the case
study but, nevertheless, has great influence on the smaller case organization it
carries and funds. Therefore, the suborganization that comprises the studied case is
referred to as the “case organization”, while the larger entity is referred to as the
“parent company”.
The case organization’s parent company is founded and based in Germany, and
is one of the key original equipment manufacturers (OEMs) in the automotive
industry. The company has numerous R&D offices, production plants, and retail
hubs around the world, and its product offering ranges from small, medium-sized
and luxury personal vehicles to commercial vehicles, such as trucks, buses, and
vans, as well as to financial services and mobility solutions. Due to the immense
size of the corporation, the challenge of complex technology, and the fierce
competition that characterizes the automotive industry, the parent company seeks
to continuously enhance its own knowledge creation competence, eliminate or
outsource non-core activities, and enter into new fields of business not on its own
but rather through cooperation. The cooperation approach is regularly employed
amongst automobile manufacturers and their suppliers (Kash & Rycoft 2000).
At this point, it is important to gain a comprehensive view to the strategies,
backgrounds, and characteristics of the automotive industry and of automobile
manufacturers to reflect on them when designing idea generation metrics for the
case organization. Even though the automotive industry is very much a high-
technology business, the large enterprises in the marketplace have managed to
develop extremely efficient processes over the years and have learned to take
advantage of mutually beneficial collaborations and specialized knowledge
networks (Teichert & Ernst 1999). In contrast to small, financially constrained
companies, innovation in these large automotive players is by nature procyclical,
and cash flow constraints are over-shadowed by the significance of the “strategic
timing effect”. This means that the benefits from an original innovation are highly
dependent on the timing of its introduction in the market, and will go to the
innovating firm for only a brief period of time before rival organizations are able
to adapt and improve the innovation (Giedeman et al. 2006).
25
Furthermore, the examined corporation being based in Germany indicates a
geo-social factor that must not be neglected when investigating innovation within
the automotive framework. Germany is commonly regarded as a lead market in the
global vehicle industry and prone to an early adoption of new innovations and
technologies emerging in the field, making it easier particularly for German
manufacturers to test and refine new product features in practice in their home
market before allowing them to spill over to other countries and regions (Porter
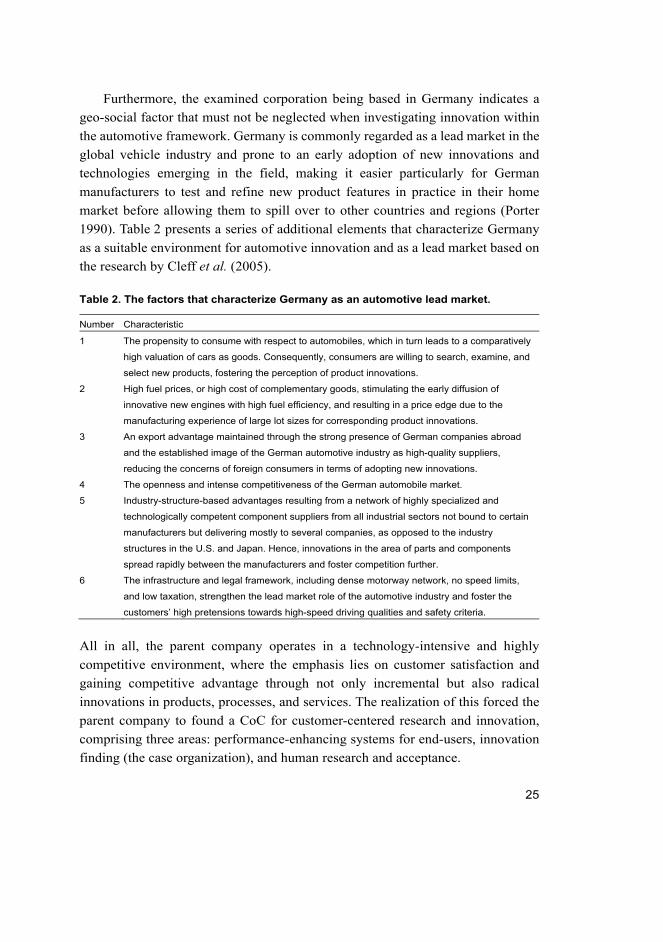
1990). Table 2 presents a series of additional elements that characterize Germany
as a suitable environment for automotive innovation and as a lead market based on
the research by Cleff et al. (2005).
Table 2. The factors that characterize Germany as an automotive lead market.
Number Characteristic
1 The propensity to consume with respect to automobiles, which in turn leads to a comparatively
high valuation of cars as goods. Consequently, consumers are willing to search, examine, and
select new products, fostering the perception of product innovations.
2 High fuel prices, or high cost of complementary goods, stimulating the early diffusion of
innovative new engines with high fuel efficiency, and resulting in a price edge due to the
manufacturing experience of large lot sizes for corresponding product innovations.
3 An export advantage maintained through the strong presence of German companies abroad
and the established image of the German automotive industry as high-quality suppliers,
reducing the concerns of foreign consumers in terms of adopting new innovations.
4 The openness and intense competitiveness of the German automobile market.
5 Industry-structure-based advantages resulting from a network of highly specialized and
technologically competent component suppliers from all industrial sectors not bound to certain
manufacturers but delivering mostly to several companies, as opposed to the industry
structures in the U.S. and Japan. Hence, innovations in the area of parts and components
spread rapidly between the manufacturers and foster competition further.
6 The infrastructure and legal framework, including dense motorway network, no speed limits,
and low taxation, strengthen the lead market role of the automotive industry and foster the
customers’ high pretensions towards high-speed driving qualities and safety criteria.
All in all, the parent company operates in a technology-intensive and highly
competitive environment, where the emphasis lies on customer satisfaction and
gaining competitive advantage through not only incremental but also radical
innovations in products, processes, and services. The realization of this forced the
parent company to found a CoC for customer-centered research and innovation,
comprising three areas: performance-enhancing systems for end-users, innovation
finding (the case organization), and human research and acceptance.
26
Against this background, it is the purpose of the case organization to facilitate
the creative activities needed to discover new innovations, cover white spots with
inventive new ideas, and support the early phase of the parent company’s
procyclical innovation process. In practice, this calls for adopting straightforward
creativity techniques and building up the required facilitation skills in the employee
team to have the tools to “harvest” the most creative ideas of the company’s R&D
personnel. For this reason, the case organization employs five to ten experienced
workshop facilitators from different fields—such as design, engineering, and social
sciences—and operates in a purpose-built facility offering the latest opportunities
for interactive, creative, and digitalized working and a dynamic working space
covering around 500 square meters. All these tools work to bring the innovation
workshops participants away from the ordinary office setting, which fosters idea
generation and the innovation of future products that would not have been
discovered otherwise.
However, it is not only the creative work in the context of the systematic
customer-centered innovation process that is assisted by the expertise of the case
organization’s employees: there is a myriad of other parties in the parent company
that need the case organization’s services and premises, ranging from the human
resources and information technology departments to strategy functions and
internal marketing agencies. This is because the case organization has the role of a
corporate-internal service provider for innovation workshop facilitation and
creativity techniques. Whenever its capacity allows, the organization can be
accessed by every department and suborganization in the parent company,
regardless of whether they are part of the innovation process, have anything to do
with product innovation, or represent a non-core support function. In the middle of
it, the greatest challenge of the case organization is to be flexible enough to suit the
needs of the various internal clients but also efficient enough to handle and process
a high number of workshop topics simultaneously to optimize its capacity
utilization. On average, the case organization facilitates between sixty and eighty
innovation workshops in a year, about half of which are directly involved in
outlining the concrete features of future products in the various business units.
Chapter 1 referred to the case organization’s idea generation model as a “closed”
process, but this rather primitive classification could be elaborated by other sets of
comparatives. Besides open vs. closed, several authors mention analytical vs.
interpretative and STI vs. DUI (scientific and technology-based innovation vs.
learning-by-doing, by-using and by-interacting) as alternative ways of describing
27
the origins and focus of innovation processes (e.g. Lester & Piore 2004: 5–7, Jensen
et al. 2007).
In accordance with these two parallel approaches, the case organization’s
systematic idea generation process can also be recognized as an analytical or a
scientific and technology-based innovation process, as the goal of the process is to
solve predefined problems in a linear manner with the support of scientifically
proven methodology and corporate-internal technical experts. This type of clearly
defined and linear project-like work, based on rational decision-making, as well as
the reliance on knowledge models are some of the main attributes of analytical STI-
based processes (Lester & Piore 2004, Jensen et al. 2007). Furthermore, scientific
research has confirmed that analytical science-based innovation processes are more
likely to have a positive impact on technological innovations, whereas
interpretative DUI-based innovation processes tend to produce non-technological
innovations (Parrilli & Heras 2016). This represents a logical conclusion for the
case organization, as it is operating in a high-technology industry, and systematic
idea generation workshops usually lead to the emergence of technology-relevant
innovations.
A detailed description of the case organization’s systematic idea generation
process is provided in section 4.1 in connection with the debate on potential
quantitative value creation metrics for the case organization. Now that the
background, environment, and core terminology regarding the case organization
and its parent company have been clarified, the discussion on the methodology of
this study continues to the overall research design.
2.2 Research design
Any research, but especially empirical research, has an implicit, if not explicit,
research design, which refers to the logical sequence connecting the gathered
empirical data to the initial research questions, and to the ultimate conclusions of
the study (Yin 1994: 19). In other words, a research design is an action plan for
getting from the starting point of the research project to its preferred destination—
in most cases represented by the identified research questions and the answers to
these questions—incorporating all the steps required, such as the analysis and
collection of relevant data. Another perspective to the matter is provided by
Philliber et al. (1980), according to whom a research design is a “blueprint” of the
study to be conducted and deals with at least the problems of which questions to
study, what data is relevant, what data to collect, and how to analyze the results.
28
Summing up, a research design is much more than a work plan: its main purpose is
not to ensure efficiency when conducting the study but, instead, to ensure
effectiveness in terms of the overall successfulness of the research, as well as the
validity and usefulness of its results (Yin 1994).
The general design of this study is, to a great extent, built around the concept
of a case study. The following research design components important for case study
research must therefore be given special attention: (1) the research questions, (2)
the propositions of the research, (3) the units of analysis, (4) the logic linking the
data to the propositions, and (5) the criteria for interpreting the findings (Yin 1994:
20). The first component, i.e. the research questions, is already addressed in
Chapter 1. The remaining elements are discussed below in subsection 2.2.1 “Key
research choices”.
It is imperative to keep in mind that not all case studies share a similar purpose
when it comes to the motivation behind the research and the role of the case. For
example, Stake (2000) proposes that case study research takes one
of three forms: intrinsic, where the case is studied for its own sake; instrumental,
where the case is studied to understand related issues or phenomena of interest; or
collective, where the single case is extended to include many cases. The present
research can be considered instrumental in nature, since it involves a single case
studied to understand the value creation of creative activities in quantitative terms,
and to design and test quantitative effectiveness metrics for idea generation in
practice. A more detailed description of the various forms and building blocks of
empirical case studies, and their relation to this research, is provided in
subsection 2.2.2.
2.2.1 Key research choices
According to Yin (1994), a research may not require any research propositions, in
which case the particular study becomes exploratory in nature. However, every
scientific undertaking should still have some purpose, for example, in the form of
criteria by which the study’s success can be judged. In addition to exploratory
research, studies can also be descriptive, to portray an accurate profile of persons,
events, or situations, or explanatory, to map out a phenomenon or explain causal
relationships between variables (e.g. Robson 2002, Saunders et al. 2007).
Furthermore, different parts of one study can also have different purposes. As to
the present research, it is clear that the first research question presented in Table 1
29
is exploratory by nature, as it seeks to view the value creation of idea generation
from a new perspective and to try out the possibilities of the novel approach. In
contrast, the second research question is descriptive, as it aims to describe the
effectiveness of the measured process on a quantifiable basis, even though the
metrics required to achieve that must be discovered first. As this study is, for the
most part, exploratory, it is not compulsory for it to, and indeed it does not, have
hypotheses that need to be validated or invalidated. This research does nonetheless
have a clearly defined purpose in the form of finding answers to the defined
research questions.
The third component of an empirical research design according to Yin (1994)
are the units of analysis, which commonly refers to the individual, group, or team
to be analyzed during the case study (Chell 2004: 50). In this study, the one and
only unit of analysis is the case organization that specializes in idea generation and
facilitating the harnessing of creative potential, as presented in the previous section.
The analysis aims to evaluate the effectiveness with which the case organization
runs its systematic idea generation process on the basis of quantitative data directly
gathered in the case organization, while partly utilizing the parent company’s
databases. The evaluation is strictly restricted to the smaller entity that the case
organization represents, and any assessment of another organization, such as the
parent company, is done merely to provide a solid benchmark for comparisons of
the case organization’s effectiveness.
The fourth point reflects on the quantitative measurement model used to select,
gather, and analyze numerical information and to come to conclusions regarding
the value creation that takes place in the case organization. The design of such a
measurement model represents not only one of the greatest challenges of this
research project but also perhaps the single most vital contribution to be made by
this study to the field of creativity research. The difficulty here lies in selecting the
metrics and data that can objectively, reliably, and truthfully evaluate the case
process. To assist in tackling this problem, the Goal Question Metric (GQM)
approach is employed to determine the value creation metrics with the help of
organizational goals and key questions derived from these goals.
The GQM approach is selected because of its strong focus on the relationship
between organizational goals and the data used to define those goals. It is geared to
produce a highly targeted and easy-to-interpret statement on the success with which
the organization achieves its objectives. Furthermore, other studies similar to this
one have successfully exploited the GQM method in other environments to define
performance indicators for a given process or organization in a transparent and
30
systematic manner. For instance, Jethani (2013) applied GQM to the software
development process in a case study. As a result, he (Jethani 2013) was able to not
only define useful new metrics but also discover hidden problem areas and identify
the roots of these issues. Oliinyk et al. (2015) used GQM in a case study in the
automotive field to evaluate the success with which a large organization adopts
feature modeling for the first time. Consequently, a high number (27) of quality
metrics were determined, and a sizeable research gap was addressed. The proven
track record of the GQM method in empirical settings is one of the primary reasons
why it is preferred in this research.
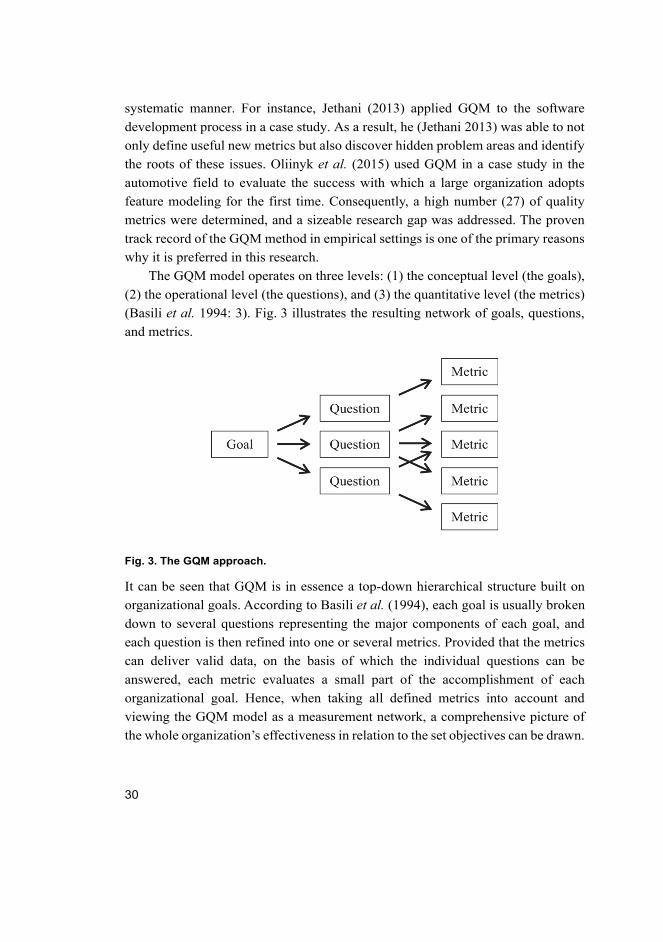
The GQM model operates on three levels: (1) the conceptual level (the goals),
(2) the operational level (the questions), and (3) the quantitative level (the metrics)
(Basili et al. 1994: 3). Fig. 3 illustrates the resulting network of goals, questions,
and metrics.
Fig. 3. The GQM approach.
It can be seen that GQM is in essence a top-down hierarchical structure built on
organizational goals. According to Basili et al. (1994), each goal is usually broken
down to several questions representing the major components of each goal, and
each question is then refined into one or several metrics. Provided that the metrics
can deliver valid data, on the basis of which the individual questions can be
answered, each metric evaluates a small part of the accomplishment of each
organizational goal. Hence, when taking all defined metrics into account and
viewing the GQM model as a measurement network, a comprehensive picture of
the whole organization’s effectiveness in relation to the set objectives can be drawn.
31
The GQM method is put to practice in Chapter 4 when designing value creation
metrics for the case organization.
The fifth and final component of a research design for empirical studies
incorporates the criteria for interpreting the findings from practical research. This
study takes several steps towards the establishment of such a framework for
analysis: for instance, measurement results from the case organization are
compared against data from the parent company in order to both validate the
applicability of the defined metrics in practice and understand how effectively the
case organization creates value in its creative process. Additionally, practical
considerations and findings are weighed against the conclusions and
recommendations made by other authors in the scientific literature so that the
strengths and limitations of the proposed measurement model—another important
result of this study—are discovered. At the same time, rival explanations for the
findings are considered throughout the empirical part of the research, especially in
the analysis phase, in order to cover all possible angles to the examined topic.
Special attention should be paid to the question of quantitative versus
qualitative information. It is the rational choice of this research to concentrate
virtually solely on the quantitative aspects of the value creation of idea generation,
the motivation behind which is presented in Chapter 1. It must be stressed that,
even though empirical case studies on creative performance have traditionally
preferred qualitative approaches, measures founded on such considerations are for
the most part neglected in this study. There might be metrics that involve qualitative
features yet still fulfilling the criteria for quantitative measures, and if such are
discovered, they will be taken into account. However, typical qualitative measures
such as human judgment-based evaluations are not discussed; a point that is
decisive in shaping the design and results of this study. Another point that
dominates the outline of this research is the effect of selecting single-case study as
the empirical research method, which is examined more closely in the subsequent
section.
2.2.2 Case study as a research method
Yin (2009: 13) defines a case study as an empirical inquiry that investigates a
contemporary phenomenon within a given real-life context, where the boundaries
between the studied phenomenon and its context are often not evident. Case studies
involve four basic types of designs, according to the two-by-two matrix illustrated
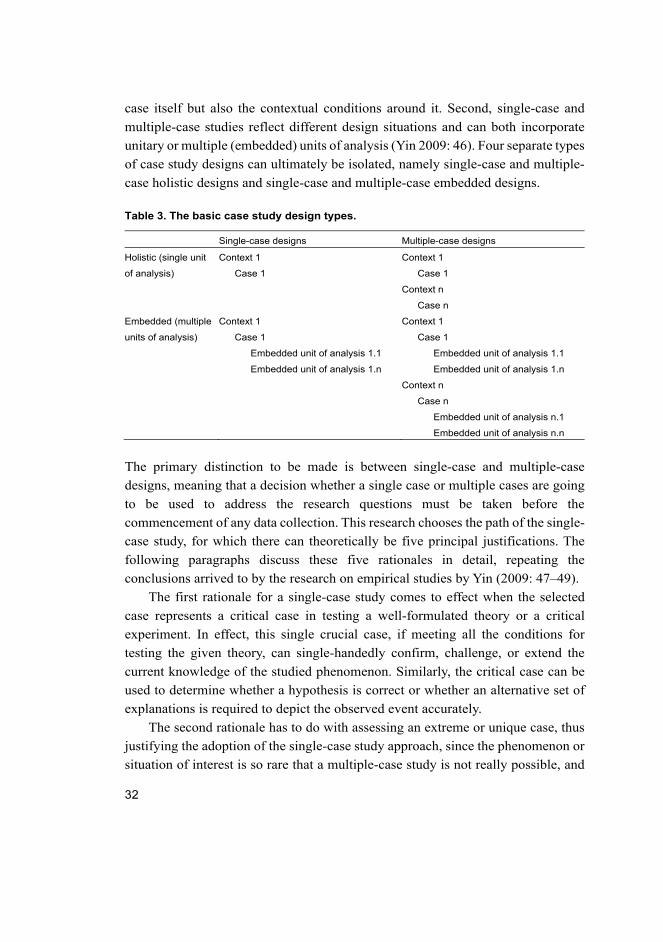
in Table 3. First, it can be seen that case studies are prone to analyze not only the
32
case itself but also the contextual conditions around it. Second, single-case and
multiple-case studies reflect different design situations and can both incorporate
unitary or multiple (embedded) units of analysis (Yin 2009: 46). Four separate types
of case study designs can ultimately be isolated, namely single-case and multiple-
case holistic designs and single-case and multiple-case embedded designs.
Table 3. The basic case study design types.
Single-case designs Multiple-case designs
Holistic (single unit
of analysis)
Context 1
Case 1
Context 1
Case 1
Context n
Case n
Embedded (multiple
units of analysis)
Context 1
Case 1
Embedded unit of analysis 1.1
Embedded unit of analysis 1.n
Context 1
Case 1
Embedded unit of analysis 1.1
Embedded unit of analysis 1.n
Context n
Case n
Embedded unit of analysis n.1
Embedded unit of analysis n.n
The primary distinction to be made is between single-case and multiple-case
designs, meaning that a decision whether a single case or multiple cases are going
to be used to address the research questions must be taken before the
commencement of any data collection. This research chooses the path of the single-
case study, for which there can theoretically be five principal justifications. The
following paragraphs discuss these five rationales in detail, repeating the
conclusions arrived to by the research on empirical studies by Yin (2009: 47–49).
The first rationale for a single-case study comes to effect when the selected
case represents a critical case in testing a well-formulated theory or a critical
experiment. In effect, this single crucial case, if meeting all the conditions for
testing the given theory, can single-handedly confirm, challenge, or extend the
current knowledge of the studied phenomenon. Similarly, the critical case can be
used to determine whether a hypothesis is correct or whether an alternative set of
explanations is required to depict the observed event accurately.
The second rationale has to do with assessing an extreme or unique case, thus
justifying the adoption of the single-case study approach, since the phenomenon or
situation of interest is so rare that a multiple-case study is not really possible, and
33
because the single case by itself is worth analyzing. In contrast, the third rationale
for single-case studies involves having a typical or representative case. In such
studies, the aim is usually to capture the circumstances and conditions of an
everyday or commonplace situation and then to utilize the findings to describe the
experiences of an average person or institution. Hence, further studies or cases are
not actually required because it can be assumed that the witnessed everyday
behavior can be stretched to cover a number of other cases.
The fourth rationale constitutes the revelatory case that exists when the
researcher has an opportunity to observe, measure, and analyze a phenomenon
previously inaccessible to academia. Again, the underlying assumption is that
producing multiple cases of the same unforeseen event is extremely difficult, or
even impossible, meaning that investigating only the single case by itself creates
new knowledge that is worth pursuing.
Finally, the fifth rational for a single-case study is the longitudinal case, which
refers to the analysis of the same case at two or more points in time that could give
insights into chronological changes and major developments over time within the
scope of the case. The researchers can then predict future advances and transitions
based on the longitudinal case study.
The five rationales presented by Yin (2009) represent classic reasons for
conducting a single-case study. The only other prominent instance where a single-
case study might be preferred is when a pilot case of a series of upcoming cases is
examined. Nevertheless, even here the single-case study could not be regarded as
a complete research on its own, but rather as one part of a multiple-case study.
As for this research, the motivation for the selection of single-case study as a
case study research design consists of a combination of Yin’s (2009) rationales. The
main reasoning behind the study is associated with the opportunity to study creative
performance in practice based on quantitative data and to gain access to a real-life
systematic idea generation process that allows the application of this new
evaluation approach, thereby embodying a revelatory case. Due to the delicate
nature of the future product-related information that results from idea generation,
it is highly improbable that a researcher could obtain access to the creative
processes of more than one organization on a level deep enough to be able to
thoroughly assess their effectiveness. On the other hand, the academic research on
the quantifiable evaluation of idea generation outcomes is still in its relative infancy,
and examining this one case alone already creates value for the scientific
community in the field of creativity research. Besides revelatory, the present study
case displays characteristics of being longitudinal, as the case is evaluated over
34
time in great depth; although the chronological developments are not the main
focus of the research. The case can also be viewed as being representative, as the
results of this case study can, to some extent, be generalized and applied to other
organizations of similar size and industry.
Table 3 introduced the concepts of a holistic and embedded study. A single-
case study may indeed include one or more units of analysis, the latter occurring
when attention is also paid to one or more subunits of the case (Yin 2009: 50). For
example, if the case study examines a public program that involves a large number
of funded projects and these projects are for their part evaluated as well, they would
comprise the embedded units of analysis. Hence, the research design of the overall
evaluation here could be called an embedded case study design, as shown in the
lower-left corner of the matrix presented in Table 3. Nevertheless, if the research
only examines the global nature of a case entity, it would constitute a holistic design.
Yin (2009) acknowledges that both these subtypes of single-case study have their
own strengths and weaknesses: for instance, a holistic design can be advantageous
when no logical subunits can be identified or problematic if the researcher fails to
examine any specific phenomenon in operational detail and conducts the whole
case study at an unduly abstract level.
This research employs a holistic case study design, as the case organization
does not incorporate any clearly separable units of analysis that could or should be
evaluated in isolation. On the contrary, the case organization is small enough so
that a holistic approach can succeed in depicting the performance of the entire case
with adequate accuracy and is able to scrutinize the causal relations on a low
enough level.
Regardless of whether the case study has a holistic or embedded design, or if
the decision on adopting a single-case study approach is based on the right
rationales and mirrors a logical course of action, great care must be taken when
conducting a single-case study to arrive at desirable conclusions. Perhaps the
greatest vulnerability of the single-case study, as Yin (2009) points out, is that the
studied case may in time not turn out to be the one it was thought to be at the outset.
This may lead to the research project producing unexpected results or not
investigating the phenomenon it was meant to study. To tackle this issue, a
profound investigation of the potential case is required beforehand so that the
chances of misrepresentation are minimized and the access needed to collect
relevant data is maximized. In this study, the researcher studied the idea generation
process from within the case organization, which also meant that he was able to
35
observe the examined process in its natural state and conclude that the selected case
corresponds to the primary goals and the research questions of this dissertation.
Section 2.3 discusses the role and position of the researcher more closely.
So how can one overcome the characteristic problems associated with single-
case studies? Meyer (2001) suggests including more cases to address this, while
also admitting that the desire for depth and tracking the cases over time implies the
need to retain a low number of cases. Still, even choosing two cases instead of one,
while not really supporting generalizability any more, ensures that there is a
prospect for comparison and contrast between the cases, enhancing the probability
that at least one of the cases produces meaningful results. This research applies a
similar philosophy, exploiting the case organization’s parent company not as an
embedded unit of analysis but as a benchmark for the primary case, thus enabling
the relativization of the gathered data and, ultimately, the validation of the research
results.
Gibbert et al. (2008) highlight two additional issues regarding methodological
rigor in terms of the reliability of case studies. First, case studies are considered as
the most appropriate exploratory tools in the early phases of a new management
theory, but their variability and lack of accuracy mean that the foundation of new
knowledge is laid hastily. This often leads to ripple effects throughout later stages
when the studied phenomenon is elaborated and thorough experiments are
conducted. Second, case studies are typically carried out in close interaction with
practitioners who deal with real management situations, causing case studies to
mainly become geared towards creating managerially relevant knowledge. This
second concern is underlined by the considerations of Guba & Lincoln (1981),
according to whom case study research involves unusual problems of ethics, as the
researcher is often in a position to select from among available data and make case
for virtually anything he or she wished. This is particularly apparent in case studies
that are financed by people who are, directly or indirectly, involved in the process
that is portrayed and studied, which is often the case when the study is conducted
in cooperation with practitioners (MacDonald & Walker 1977: 187). If the results
of the research are likely to have negative personal or political consequences, an
unethical case writer could be thus tempted to alter data collection and analysis
procedures to produce a biased result that creates less dissonance (Merriam 1998).
In summary, case study research permits a detailed, extensive examination of
a particular contextual and bounded phenomenon that is undertaken in real-life
situations (Luck et al. 2006: 104). Nonetheless, without a clear understanding and
application of the principles and key elements of the case study methodology, there
36
is a risk that the inherent variability of the case study research approach will result
in erratic reporting and difficult-to-interpret results, and damage its reputation as a
valuable cross-disciplinary methodology (Hyett et al. 2014).
2.3 Data collection and analysis
The case organization’s systematic idea generation process is examined in this
study by collecting both real-time and retrospective data in the organization’s
management information systems. The real-time data collection commenced with
the start of this research project and the researcher entering the studied organization,
and was implemented as workshops were facilitated over time. The real-time data
collection only concerned the information that lies within the case organization.
However, especially higher-level data is typically stored in the databases of the
parent company instead, to which the case organization does not have direct access.
This information was reached by means of having two scheduled data collection
periods when the researcher could temporarily access the parent company’s
database to retrieve information relevant to evaluate the case organization.
Collecting on two occasions allowed for a longitudinal analysis of the case (Meyer
2001, Yin 2009). Yet, the actual reason behind opting for two data collection
periods was not to be able to recognize hidden developments, but rather to ensure
the validity of the findings and the accuracy of the results of data measurement:
should an issue be identified during the first data collection, there would still be
time for corrective maneuvers.
Determining the exact data collection procedure or procedures should be
guided by the research questions and the choice of research design, while at the
same time not ignoring the classic constraints of time, financial resources, and
access to the examined process or organizational entity (Meyer 2001: 336). The
data collection methods that are usually used in case studies include questionnaires,
interviews, observations, and archives (Yin 1994). In this study, quantitative data
collection methods were favored for the obvious reason that the goal of this
research is to design and test quantifiable value creation metrics for idea generation.
More specifically, the information required to make a fact-based statement on the
effectiveness of the case organization’s process was mainly gathered from archival
records and other documents, which are mostly stored in electronic form in the
databases of the case organization and its parent company. According to Yin (2009),
a documentation-based approach to data collection ensures the highest degree of
37
precision that can possibly be achieved in an empirical case study and thus best
conforms to the criterion of quantifiability.
However, observation was also utilized as a minor data collection method, as
designing and implementing a new set of value creation metrics for the company
was bound to have aftereffects that cannot be sensed purely by means of statistical
analysis. Observation did not produce data relevant to the results of this research
as such, but the observed issues are touched upon in the data analysis and discussion
phases to increase awareness of the backgrounds, attributes, and consequences of
the studied phenomena. Furthermore, Meyer (2001) argues that such triangulated
methodology, i.e. collecting data with three different techniques or supporting the
two main data collection methods with a third scheme, greatly contributes to the
substantiation of research propositions. All in all, general documentation, archival
records, and direct observations together formed the backbone of the data collection
in this research, with the main emphasis on the first two.
The drawbacks of documentation-based approaches listed by Yin (2009: 102)
are primarily concerned with the retrievability and accessibility of data because of
the exact and often confidential nature of the information stored in the documents.
Still, as the researcher was allowed to enter the case organization of this research,
the complete records were available, which effectively eliminates the usual
anxieties associated with documented information. In practice, data on the ideas
generated during innovation workshops facilitated by the case organization and on
the systematic idea generation process can be found in documents that are updated
in real time in the case organization. As for archival records, they contain higher-
level data on the further development of those generated ideas after they leave the
case organization. This information cannot be accessed from within the case
organization, but can be retrieved from the parent company’s database. As both
aspects of idea generation outcomes are relevant for this study, both data sources
are exploited.
As for direct observations, Waddington (1994) has defined four ways which
describe observation research in practice: (1) the observer is a fully involved
participant that observes covertly, (2) the observer participates in the proceedings
but does not hide his or her intention to observe, (3) the observer maintains only
superficial contact with the people under scrutiny, and (4) the observer stands back
and follows the proceedings from a distance. This study utilized the second type of
observation presented: the researcher was a normal participant in the studied
process and a member of the organization, who at the same took notes of events
relevant to the research, and was recognized as the person who conducts the case
38
study. The observation in this research, being in a supportive role, did not take place
at a specific point in time to gather data but it was performed continuously in the
background to identify issues, recognize potentials, and evaluate the success of and
reaction to the research, thus adding insights to the critical discussions taking place
at the end of the study.
It is worth noting that the position of the researcher inside the studied case
organization means this study takes the form of interventionist research (IVR).
Suomala et al. (2014) underline the great difficulty in balancing the theoretical
(research-oriented) and practical (case organization-oriented) aspects in
interventionist studies, as well as the importance of the researcher remaining
neutral and objective despite these, often contradictory, forces. The present study
acknowledges the potential biases of the researcher caused by his participation in
the examined process, along with other issues associated with IVR, and proceeds
to discuss them in length in connection with the critical assessment of the research
in Chapter 6.
In essence, data collection methods provide the material that is needed for the
research to fulfill its purpose. Yet, without proper data analysis procedures, it is
difficult for the study to make the leap from raw data to revelatory findings and
ultimate research results (e.g. Miles & Huberman 1994). In this research, data
analysis involved several phases: categorization of the data according to
organizational entities and individual workshop topics, illustration of the findings
from the gathered information, comparisons between the case organization and its
parent company, formulation of a statement on the effectiveness of the case process,
and debate on the broader applicability of the defined value creation metrics based
on empirical observations and comments from the scientific literature.
First, the gathered data is reduced to only cover the information related to the
measured entities. For instance, after extracting data from the management systems
of the parent company, it is only the data regarding the case organization that is
interesting from the study’s point of view. Similarly, the information retrieved from
the case organization’s documentation is sorted by attaching the generated ideas to
their respective workshops to allow for a cross-session analysis, and modified by
removing pieces of data not required for the analysis, i.e. the workshop topic, the
names of the facilitator and the ordering client, the date of the event, and so forth.
The metrics defined with the help of the GQM approach at the beginning of the
empirical research process will finally dictate which information is required for the
value creation assessment.
39
Second, the filtered data is further processed by means of producing visual
illustrations that make patterns, deltas, and realizations more easily recognizable.
Clearly, as the fact-based information retrieved from documents and archives is
mostly in numerical form, it is inexpedient to provide the data in its raw form.
Instead, similar results should be added together to illustrate common sequences on
a higher level. Comparing individual innovation workshops against each other, for
example, is only marginally interesting; far more advantageous is to build a
complete picture that depicts the performance of the idea generation process of the
case organization as a whole.
Third, building on the aspect of visualization, data from the parent company
can be utilized here to provide an ideal benchmark for an effectiveness evaluation.
The challenge is to find and isolate data from both organizations that not only
accurately portray their performances but are comparable with each other so that a
meaningful comparison can be made. Great care must be taken especially when
matching the information gathered from the case organization’s documents with
the data retrieved from the parent company’s information systems so that a
misleading interpretation can be avoided.
Fourth, after the relevant data has been isolated according to the defined
metrics, illustrated by means of visual displays, and reflected against comparable
data from the parent company, a clear statement on the effectiveness with which
ideas are produced in the case organization’s systematic process can be formulated.
This stage of data analysis has two fundamental goals: to describe the actual value
creation taking place in the case organization, producing important managerial
information for the case, and to assess whether the designed metrics function as
intended in the real world. Measurement results and the benchmarking exercise
prove instrumental in delivering and validating the answers to both these points,
while observations by the researcher uncover any problems regarding the adoption
of the proposed metrics in the organization.
Lastly, it is discussed whether the constructed model for measuring the value
creation of idea generation could be successfully employed in organizations other
than the case organization. Again, the analysis is two-pronged. On the one hand,
practical findings and experiences from the case study assist in determining the
potential future usage of the suggested measures in other organizations, or,
alternatively, the lack of such use cases if the value creation metrics are strongly
tailored for the case organization of this study. A deep understanding of the case is
beneficiary here, since it allows the unique patterns of the studied case to emerge
before attempting to generalize the discovered patterns (Eisenhardt 1989: 540).
40
On the other hand, theoretical considerations from the literature may prove
valuable in either validating or invalidating the claims based on the case study. For
example, if there are cases well known in the academic community where the value
creation metrics designed in this research could be applied to solve a problem or
produce better results, it can be argued that the measures of this study are
potentially widely applicable. This latter approach is commonly known as
analytical generalization, in which the empirical results of the case study are
compared with previously developed theories to gain insights into the
generalizability of the results and to contribute to the internal validity of the
research (Yin 1994, Meyer 2001).
In this connection, conflicting literature and alternative explanations are also
considered to reduce the chance of neglecting relevant findings and rival theories,
and, as Eisenhardt (1989: 544) puts it, to force the researcher “into a more creative,
frame-breaking mode of thinking” than what he or she might otherwise be able to
achieve. Notably, knowledge created by others about how to measure creative
processes’ performance is regarded and the limitations of the emerging metrics
listed. Eisenhardt (1989) adds that the literature discussing merely similar findings
is, on its own, important because it ties together underlying similarities in
phenomena not normally associated with each other.
Apart from data analysis, the critical evaluation of analysis results represents a
vital building block of every scientific study. Key issues, such as validity and
reliability, are just as important for case studies as they are for more deductive
research designs, notwithstanding the differences in fundamental approaches to
these debates (Meyer 2001). This is because case studies examine phenomena in
their natural contexts rather than independent of context (e.g. Pettigrew 1973). The
model to assess the rigor of the case study used in this research utilizes four
common criteria: internal validity, construct validity, external validity, and
reliability (Cook & Campbell 1979).
First, internal validity refers to the causal relationships between variables and
results, the issue being whether the researcher provides a plausible argument and
logical reasoning that is both compelling and powerful enough to defend the
research conclusions (Gibbert et al. 2008). Hence, internal validity needs to be
considered mainly in the data analysis phase of the research.
Second, construct validity concerns the quality of the conceptualization or
operationalization of the relevant concept, or, in other words, the extent to which
the research investigates what it claims to investigate, and whether the observation
41
of reality is accurate (Denzin & Lincoln 1994, Gibbert et al. 2008). Therefore,
construct validity is of utmost relevance during the data collection phase.
Third, external validity, or generalizability, is founded on the belief that all
theories must apply to phenomena not only in the context in which they are studied
but also in other contexts (e.g. Calder et al. 1982). Even though neither single-case
nor multiple-case studies examine samples that are large enough for statistical
generalizations, the results of case studies can be generalized by means of analytical
generalization (Yin 1994, Gibbert et al. 2008), as pointed out before. Case studies
thus rely on generalization from empirical observations to theory rather than a
population.
Fourth, reliability has to do with the absence of random error, enabling
subsequent researchers to theoretically arrive at the same result if the study is
repeated following the exact same steps (Denzin & Lincoln 1994). Gibbert et al.
(2008) highlight the keywords of replication and transparency, both of which can
be greatly enhanced through careful documentation and clarification of the research
procedures, among others.
These four perspectives and instruments of critical evaluation are discussed
more thoroughly in Chapter 6, which discusses the overall reliability and validity
of this research. Additional criteria of validity native to measurement theory, i.e.
objectivity and inter-subjectivity, are introduced and exhaustively considered in
section 3.2.

42
43
3 Theoretical framework for evaluating systematic idea generation
This chapter provides an introduction to the key topics relevant to this research, i.e.
creativity, idea generation and innovation metrics, as well as a theoretical
foundation for the practical research, the analysis of the empirical data, and
answering the research questions presented in Table 1. The first part of the chapter
discusses creative idea generation in practice, including definitions of the core
terminology, the general innovation and idea generation processes, and the essential
methods and events leading to the generation of new ideas. The second part
examines measurement theory, setting the guidelines and standards for the
quantitative measurement model this doctoral research aims to construct, while the
third part presents the metrics used in the current literature for evaluating the
effectiveness and value creation of idea generation. The fourth part of this chapter
reviews patent theory, and considers the potential offered by patent information for
effectiveness measurement, before section 3.5 concludes the chapter by providing
the answer to the first research question.
The main focus of the literature study is on finding and developing key
performance indicators focusing on the value creation and effectiveness of idea
generation activities to support the building of a measurement model for the case
organization. This outcome-based approach to measuring systematic idea
generation has been identified as most fruitful in several studies, among others in
Wang et al. (2011) and Brown & Svenson (1998), in which the system for
measuring innovation effectiveness is characterized by focusing on outcomes rather
than behavior and by measuring outputs by using the dimensions of cost, quality,
and quantity.
The study by Shah et al. (2003) is groundbreaking in the field of idea
generation measurement. There are also a great number of other authors, including
Reinig & Briggs (2006), Nelson et al. 2009, Vargas-Hernandez et al. (2010),
Janssen et al. 2011, Puccio & Cabra (2012), and Verhaegen et al. 2013, who have
made contributions in this specific area of research, but their works rather extend
the knowledge generated by Shah et al. (2003) than revolutionize it. Thus, the
theoretical part of this research closely examines the findings of select key authors,
with support from various other researchers who have studied the topic in question.
44
3.1 Creative idea generation in practice
Creativity has recently attracted major attention from researchers and managers in
both private and public sectors due to the increased concern for ideas and
innovation among organizations (Puccio & Cabra 2012: 210). Idea generation, or
ideation, is a known and essential component of creativity. However, elements
other than evaluating the outcomes of idea generation, such as the selection of
suitable creativity techniques, have gained the most focus in previous academic
considerations (Reinig & Briggs 2006). According to Puccio & Cabra (2010), field
studies in particular should be conducted in greater quantity to better understand
how group idea generation and evaluation skills contribute to the outcomes of
innovation workshops.
Kromer (2008: 130) divides the process of idea generation into two main
activities: the active search for ideas and the passive idea-finding. In passive idea-
finding, the organization does not systematically seek new ideas, but instead hopes
that ideas coming from its operating environment or from within the organization
itself are communicated to management. This form of idea generation is conducted
with minimal financial effort, but it will not guarantee a high number of truly novel
ideas and relies heavily on the self-orientation of the members of the organization
(Kromer 2008: 130). As this research concentrates on the systematic generation of
ideas, the passive perspective to idea generation is less considered in this study in
favor of the active search for ideas.
Regarding active idea generation, two factors enable a group to generate a high
number of promising ideas in an innovation workshop: (1) the required creative
human talent from different parts of the innovation value chain must be properly
deployed by the management, and (2) the available creative individuals have to be
made productive through sufficient investments in infrastructure (Dervitsiotis
2011). Furthermore, a wide spectrum of techniques and methods have been
developed and used to support creativity and improve idea generation. A great deal
of research has focused on “methods for increasing the quantity of ideas generated
during ideation” (Reinig & Briggs 2006: 1). Subsection 3.1.2 provides a detailed
perspective to the most commonly used and effective creativity and systematic
creativity techniques.
Even if the two conditions for active search for ideas are fulfilled, an
organization can still encounter problems in generating ideas of high quantity and
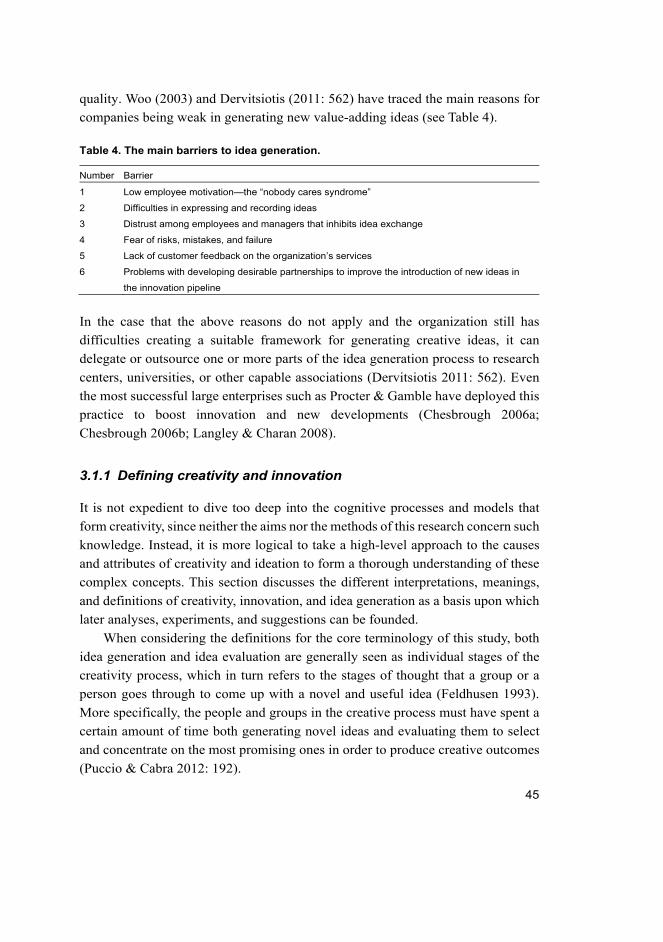
45
quality. Woo (2003) and Dervitsiotis (2011: 562) have traced the main reasons for
companies being weak in generating new value-adding ideas (see Table 4).
Table 4. The main barriers to idea generation.
Number Barrier
1 Low employee motivation—the “nobody cares syndrome”
2 Difficulties in expressing and recording ideas
3 Distrust among employees and managers that inhibits idea exchange
4 Fear of risks, mistakes, and failure
5 Lack of customer feedback on the organization’s services
6 Problems with developing desirable partnerships to improve the introduction of new ideas in
the innovation pipeline
In the case that the above reasons do not apply and the organization still has
difficulties creating a suitable framework for generating creative ideas, it can
delegate or outsource one or more parts of the idea generation process to research
centers, universities, or other capable associations (Dervitsiotis 2011: 562). Even
the most successful large enterprises such as Procter & Gamble have deployed this
practice to boost innovation and new developments (Chesbrough 2006a;
Chesbrough 2006b; Langley & Charan 2008).
3.1.1 Defining creativity and innovation
It is not expedient to dive too deep into the cognitive processes and models that
form creativity, since neither the aims nor the methods of this research concern such
knowledge. Instead, it is more logical to take a high-level approach to the causes
and attributes of creativity and ideation to form a thorough understanding of these
complex concepts. This section discusses the different interpretations, meanings,
and definitions of creativity, innovation, and idea generation as a basis upon which
later analyses, experiments, and suggestions can be founded.
When considering the definitions for the core terminology of this study, both
idea generation and idea evaluation are generally seen as individual stages of the
creativity process, which in turn refers to the stages of thought that a group or a
person goes through to come up with a novel and useful idea (Feldhusen 1993).
More specifically, the people and groups in the creative process must have spent a
certain amount of time both generating novel ideas and evaluating them to select
and concentrate on the most promising ones in order to produce creative outcomes
(Puccio & Cabra 2012: 192).
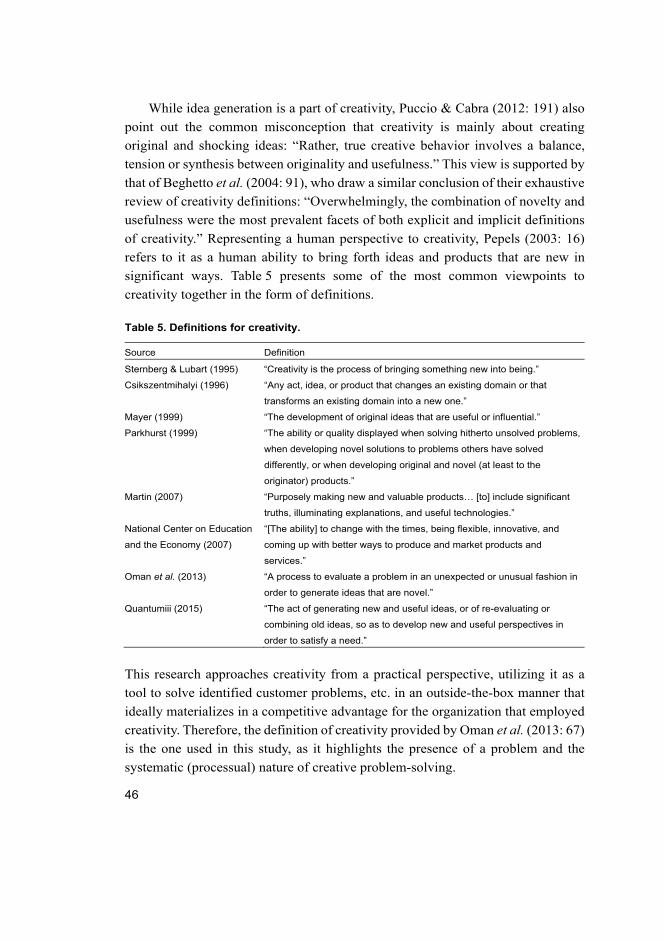
46
While idea generation is a part of creativity, Puccio & Cabra (2012: 191) also
point out the common misconception that creativity is mainly about creating
original and shocking ideas: “Rather, true creative behavior involves a balance,
tension or synthesis between originality and usefulness.” This view is supported by
that of Beghetto et al. (2004: 91), who draw a similar conclusion of their exhaustive
review of creativity definitions: “Overwhelmingly, the combination of novelty and
usefulness were the most prevalent facets of both explicit and implicit definitions
of creativity.” Representing a human perspective to creativity, Pepels (2003: 16)
refers to it as a human ability to bring forth ideas and products that are new in
significant ways. Table 5 presents some of the most common viewpoints to
creativity together in the form of definitions.
Table 5. Definitions for creativity.
Source Definition
Sternberg & Lubart (1995) “Creativity is the process of bringing something new into being.”
Csikszentmihalyi (1996) “Any act, idea, or product that changes an existing domain or that
transforms an existing domain into a new one.”
Mayer (1999) “The development of original ideas that are useful or influential.”
Parkhurst (1999) “The ability or quality displayed when solving hitherto unsolved problems,
when developing novel solutions to problems others have solved
differently, or when developing original and novel (at least to the
originator) products.”
Martin (2007) “Purposely making new and valuable products… [to] include significant
truths, illuminating explanations, and useful technologies.”
National Center on Education
and the Economy (2007)
“[The ability] to change with the times, being flexible, innovative, and
coming up with better ways to produce and market products and
services.”
Oman et al. (2013) “A process to evaluate a problem in an unexpected or unusual fashion in
order to generate ideas that are novel.”
Quantumiii (2015) “The act of generating new and useful ideas, or of re-evaluating or
combining old ideas, so as to develop new and useful perspectives in
order to satisfy a need.”
This research approaches creativity from a practical perspective, utilizing it as a
tool to solve identified customer problems, etc. in an outside-the-box manner that
ideally materializes in a competitive advantage for the organization that employed
creativity. Therefore, the definition of creativity provided by Oman et al. (2013: 67)
is the one used in this study, as it highlights the presence of a problem and the
systematic (processual) nature of creative problem-solving.
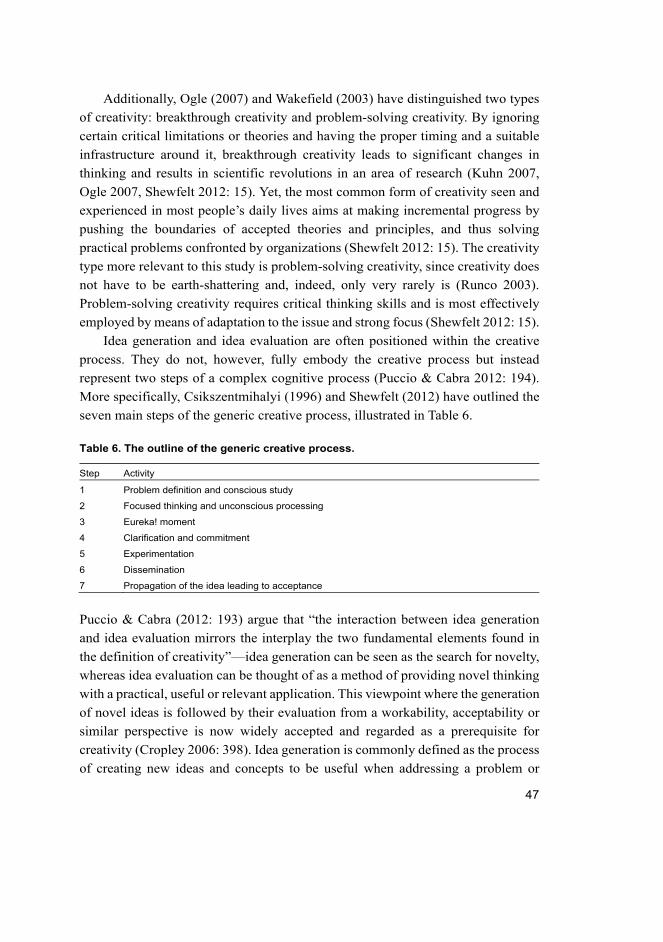
47
Additionally, Ogle (2007) and Wakefield (2003) have distinguished two types
of creativity: breakthrough creativity and problem-solving creativity. By ignoring
certain critical limitations or theories and having the proper timing and a suitable
infrastructure around it, breakthrough creativity leads to significant changes in
thinking and results in scientific revolutions in an area of research (Kuhn 2007,
Ogle 2007, Shewfelt 2012: 15). Yet, the most common form of creativity seen and
experienced in most people’s daily lives aims at making incremental progress by
pushing the boundaries of accepted theories and principles, and thus solving
practical problems confronted by organizations (Shewfelt 2012: 15). The creativity
type more relevant to this study is problem-solving creativity, since creativity does
not have to be earth-shattering and, indeed, only very rarely is (Runco 2003).
Problem-solving creativity requires critical thinking skills and is most effectively
employed by means of adaptation to the issue and strong focus (Shewfelt 2012: 15).
Idea generation and idea evaluation are often positioned within the creative
process. They do not, however, fully embody the creative process but instead
represent two steps of a complex cognitive process (Puccio & Cabra 2012: 194).
More specifically, Csikszentmihalyi (1996) and Shewfelt (2012) have outlined the
seven main steps of the generic creative process, illustrated in Table 6.
Table 6. The outline of the generic creative process.
Step Activity
1 Problem definition and conscious study
2 Focused thinking and unconscious processing
3 Eureka! moment
4 Clarification and commitment
5 Experimentation
6 Dissemination
7 Propagation of the idea leading to acceptance
Puccio & Cabra (2012: 193) argue that “the interaction between idea generation
and idea evaluation mirrors the interplay the two fundamental elements found in
the definition of creativity”—idea generation can be seen as the search for novelty,
whereas idea evaluation can be thought of as a method of providing novel thinking
with a practical, useful or relevant application. This viewpoint where the generation
of novel ideas is followed by their evaluation from a workability, acceptability or
similar perspective is now widely accepted and regarded as a prerequisite for
creativity (Cropley 2006: 398). Idea generation is commonly defined as the process
of creating new ideas and concepts to be useful when addressing a problem or
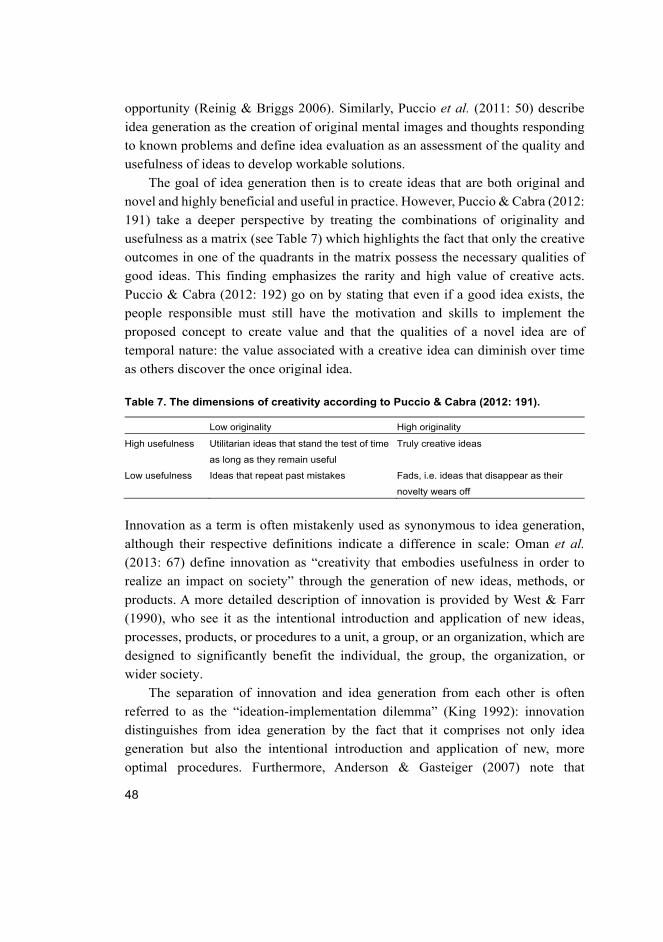
48
opportunity (Reinig & Briggs 2006). Similarly, Puccio et al. (2011: 50) describe
idea generation as the creation of original mental images and thoughts responding
to known problems and define idea evaluation as an assessment of the quality and
usefulness of ideas to develop workable solutions.
The goal of idea generation then is to create ideas that are both original and
novel and highly beneficial and useful in practice. However, Puccio & Cabra (2012:
191) take a deeper perspective by treating the combinations of originality and
usefulness as a matrix (see Table 7) which highlights the fact that only the creative
outcomes in one of the quadrants in the matrix possess the necessary qualities of
good ideas. This finding emphasizes the rarity and high value of creative acts.
Puccio & Cabra (2012: 192) go on by stating that even if a good idea exists, the
people responsible must still have the motivation and skills to implement the
proposed concept to create value and that the qualities of a novel idea are of
temporal nature: the value associated with a creative idea can diminish over time
as others discover the once original idea.
Table 7. The dimensions of creativity according to Puccio & Cabra (2012: 191).
Low originality High originality
High usefulness Utilitarian ideas that stand the test of time
as long as they remain useful
Truly creative ideas
Low usefulness Ideas that repeat past mistakes Fads, i.e. ideas that disappear as their
novelty wears off
Innovation as a term is often mistakenly used as synonymous to idea generation,
although their respective definitions indicate a difference in scale: Oman et al.
(2013: 67) define innovation as “creativity that embodies usefulness in order to
realize an impact on society” through the generation of new ideas, methods, or
products. A more detailed description of innovation is provided by West & Farr
(1990), who see it as the intentional introduction and application of new ideas,
processes, products, or procedures to a unit, a group, or an organization, which are
designed to significantly benefit the individual, the group, the organization, or
wider society.
The separation of innovation and idea generation from each other is often
referred to as the “ideation-implementation dilemma” (King 1992): innovation
distinguishes from idea generation by the fact that it comprises not only idea
generation but also the intentional introduction and application of new, more
optimal procedures. Furthermore, Anderson & Gasteiger (2007) note that
49
innovation delivers quantifiable benefits to at least one of the internal and external
stakeholders of the organization, in contrast to idea generation or creativity. This
particular attribute restricts innovations by definition to those that have solely
positive effects and arguably renders it a purely academic definition that is
impossible to fully achieve in practice (MacKay & McKiernan 2010: 272).
Nevertheless, since this research concentrates on idea generation, the combined
definition of innovation provided by King (1992), Anderson & Gasteiger (2007)
and Oman et al. (2013) is fitting for the purposes of this research.
Distinguishing between innovations and inventions is another vital separation
to be made. First considerations on the subject, for example, by Kallen (1930) and
Brinkman (1932), identified invention as a precursor to innovation but failed to
draw a clear line between the two concepts. More modern discussions, this study
included, take the viewpoint that invention is merely an idea or a prototype the
economic effect of which has not been tested in practice, whereas innovation takes
an existing invention and improves on it and, ultimately, commercializes it (e.g.
Rogers 1998, Fry 2002, Grasty 2012). For this reason, the empirical part of this
research primarily discusses inventions rather than innovations, as freshly created
concepts coming out of the idea generation process have not yet been put to the
ultimate test that is public adoption and broader change of habit patterns. The
concept of invention from an intellectual property perspective is discussed
thoroughly in section 3.4.
The question of how to categorize innovations has become a central topic of
discussion in the scientific community. A great number of studies have identified
two primary types of innovation: radical and incremental. Radical—also known as
discontinuous, breakthrough, or disruptive—innovations constitute the results of
deliberate R&D activities and refer to a new technology or a mix of technologies
that is commercially exploited in order to meet a user or a market need (Freeman
& Perez 1988, Utterback & Abernathy 1990, Veryzer 1998: 306). Incremental, or
continuous, innovations represent smaller enhancements, usually taking the form
of design improvement, learning-by-doing and learning-by-using (Rosenberg 1982,
De Propris 2002). This type of innovation, though often greatly underestimated, is
both compulsory and crucial for firms’ R&D and productivity growth (Dosi 1988,
Freeman & Perez 1988).
In recent times, several authors have attempted to provide more sophisticated
categorization logics for different types of innovation. De Propris (2002) made the
distinction between product and process innovations as an expansion of the radical-
incremental model. Another approach that has attracted more attention is the ten-
50
type model provided by Keeley et al. (2013), which includes the following
innovation types: profit model, network, structure, process, product performance,
product system, service, channel, brand, and customer engagement. It is evident
that innovation does not automatically refer to product innovation anymore but
instead there are many other types of innovation, which has consequences, among
others, for the implementation, appearance, and IP protection of the innovation, as
well as for the innovation process.
Innovation activities in organizations are commonly facilitated as a part of a
larger process aimed at keeping the organization competitive by means of
improving current products and introducing new, innovative products. An
organization requires a systematic innovation process to maintain the balance
between developing future opportunities and enhancing the efficiency of current
operations, which is a major challenge especially for large and established
companies (Tushman & O’Reilly 1996, Schreyögg & Kliesch-Eberl 2007). The
automotive industry is a prime example of a field where managing innovation plays
a key role due to manufacturers coming under pressure from price competition and
the need for short-term profits (Börjesson et al. 2014: 120–121).
Boly et al. (2014: 609) adopt a high-level system approach to innovation and
identify three major components associated with the innovation process: (1) the
resources or the input used in the process, (2) the practices or tasks employed, and
(3) the results or the output of the innovation process. As this study is concerned
with the creative part of innovation, focus is put on the second component, namely
the activities implemented in the innovation process, including also the generation
of ideas. Kromer (2008) has provided an in-depth description of this aspect of
innovation, which is now examined more closely.
The innovation process begins with a review of the current situation with the
help of various organization- and market-oriented activities to identify search fields
and areas of focus for the later idea generation phase (Witt 1996, Kromer 2008:
125–126). As opposed to other phases of the innovation process, the review in
question should be conducted continuously or at least at regular intervals. The core
competences of the organization and the familiar fields of business together form
the starting point for the active idea search. The identified search field is further
restricted and narrowed down by the criteria identified by Kromer (2008: 126–127),
presented in Table 8.
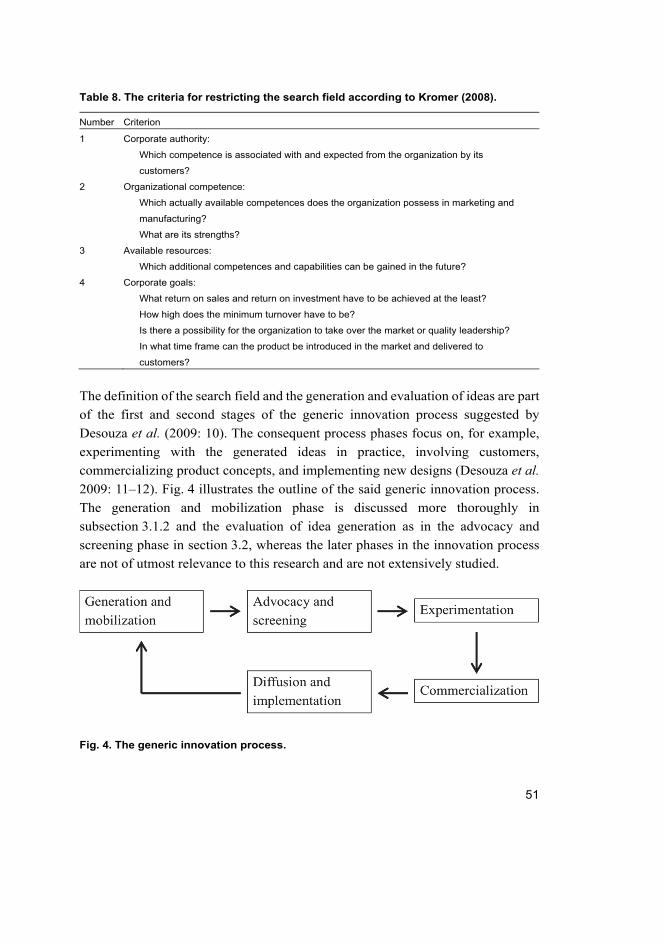
51
Table 8. The criteria for restricting the search field according to Kromer (2008).
Number Criterion
1 Corporate authority:
Which competence is associated with and expected from the organization by its
customers?
2 Organizational competence:
Which actually available competences does the organization possess in marketing and
manufacturing?
What are its strengths?
3 Available resources:
Which additional competences and capabilities can be gained in the future?
4 Corporate goals:
What return on sales and return on investment have to be achieved at the least?
How high does the minimum turnover have to be?
Is there a possibility for the organization to take over the market or quality leadership?
In what time frame can the product be introduced in the market and delivered to
customers?
The definition of the search field and the generation and evaluation of ideas are part
of the first and second stages of the generic innovation process suggested by
Desouza et al. (2009: 10). The consequent process phases focus on, for example,
experimenting with the generated ideas in practice, involving customers,
commercializing product concepts, and implementing new designs (Desouza et al.
2009: 11–12). Fig. 4 illustrates the outline of the said generic innovation process.
The generation and mobilization phase is discussed more thoroughly in
subsection 3.1.2 and the evaluation of idea generation as in the advocacy and
screening phase in section 3.2, whereas the later phases in the innovation process
are not of utmost relevance to this research and are not extensively studied.
Fig. 4. The generic innovation process.
52
3.1.2 Systematic idea generation
The origin of ideas is a topic that has puzzled creativity researchers especially in
the field of creative idea generation. Shewfelt (2012: 19) has conducted thorough
research on the birth process of ideas and has reached a number of conclusions. A
summary of his findings both from the literature and from practice is presented in
Table 9.
Table 9. The origins of novel ideas according to Shewfelt (2012: 19).
Number Root
1 Previous research (a good researcher generates fewer answers than new questions)
2 Observation (in daily life, from the news media, from conversations)
3 Frustration (things that irritate people both consciously and unconsciously, demanding a
solution)
4 Funding agencies (using funding as a carrot to study areas they have determined to be
important)
5 Questions (from people who cannot ignore the obvious)
6 Dreams and serendipity (strange ideas that just pop into one’s mind; for example, Roberts
1989)
As Witt (1996), Desouza et al. (2009: 10) and Kromer (2008: 125–126) stated in
subsection 3.1.1, the search field for the idea generation and creativity stage of the
innovation process represents the crucial first step in systematic idea generation.
The facilitators of the creative meeting—that typically takes the form of an
innovation workshop—define the focus area, on the basis of which the people with
knowledge of and relevance to that particular search field are selected. The
importance of participant selection to the outcome of the innovation workshop
should not be underestimated: people coming from various interrelated fields can
provide valuable insights into the idea generation and, for example, highlight
problems not known to others (Franco et al. 2013).
Consequently, the ultimate goal of ideation from a practical point of view is to
generate many new ideas as possible to provide a solution to thus far unresolved or
inadequately resolved customer problems or other issues (Kromer 2008: 129–130,
Salminen 2015), as illustrated in Table 10. Creativity techniques are typically
employed to support idea generation, enable the exploration of a larger solution
space, and encourage every member of the participant group to take active part in
problem-solving (Ulrich & Eppinger 2000, Shah et al. 2003, Oman et al. 2013: 67).
For example, the facilitators may combine the initial issue with challenge themes
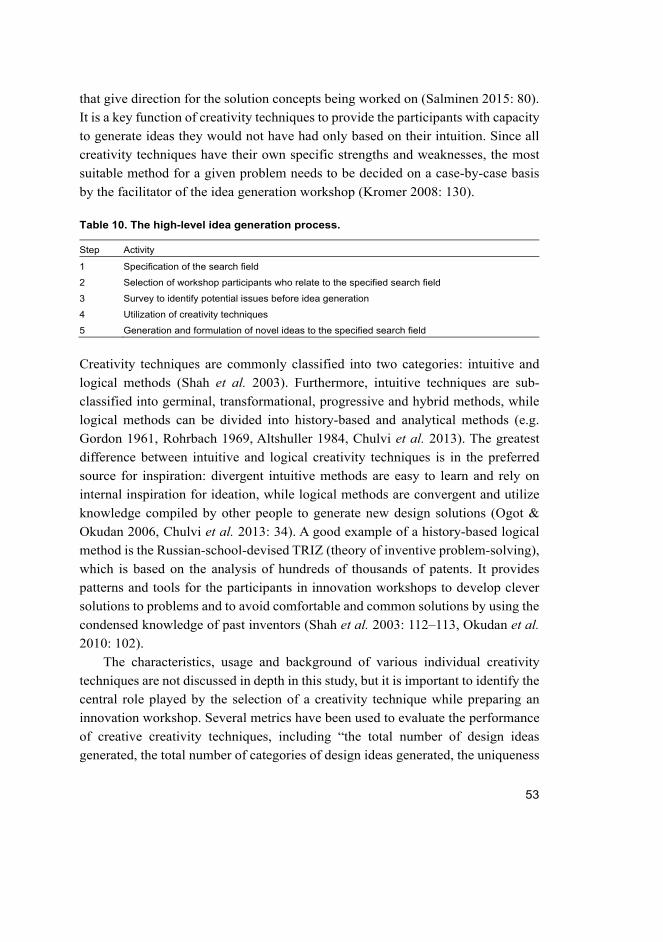
53
that give direction for the solution concepts being worked on (Salminen 2015: 80).
It is a key function of creativity techniques to provide the participants with capacity
to generate ideas they would not have had only based on their intuition. Since all
creativity techniques have their own specific strengths and weaknesses, the most
suitable method for a given problem needs to be decided on a case-by-case basis
by the facilitator of the idea generation workshop (Kromer 2008: 130).
Table 10. The high-level idea generation process.
Step Activity
1 Specification of the search field
2 Selection of workshop participants who relate to the specified search field
3 Survey to identify potential issues before idea generation
4 Utilization of creativity techniques
5 Generation and formulation of novel ideas to the specified search field
Creativity techniques are commonly classified into two categories: intuitive and
logical methods (Shah et al. 2003). Furthermore, intuitive techniques are sub-
classified into germinal, transformational, progressive and hybrid methods, while
logical methods can be divided into history-based and analytical methods (e.g.
Gordon 1961, Rohrbach 1969, Altshuller 1984, Chulvi et al. 2013). The greatest
difference between intuitive and logical creativity techniques is in the preferred
source for inspiration: divergent intuitive methods are easy to learn and rely on
internal inspiration for ideation, while logical methods are convergent and utilize
knowledge compiled by other people to generate new design solutions (Ogot &
Okudan 2006, Chulvi et al. 2013: 34). A good example of a history-based logical
method is the Russian-school-devised TRIZ (theory of inventive problem-solving),
which is based on the analysis of hundreds of thousands of patents. It provides
patterns and tools for the participants in innovation workshops to develop clever
solutions to problems and to avoid comfortable and common solutions by using the
condensed knowledge of past inventors (Shah et al. 2003: 112–113, Okudan et al.
2010: 102).
The characteristics, usage and background of various individual creativity
techniques are not discussed in depth in this study, but it is important to identify the
central role played by the selection of a creativity technique while preparing an
innovation workshop. Several metrics have been used to evaluate the performance
of creative creativity techniques, including “the total number of design ideas
generated, the total number of categories of design ideas generated, the uniqueness
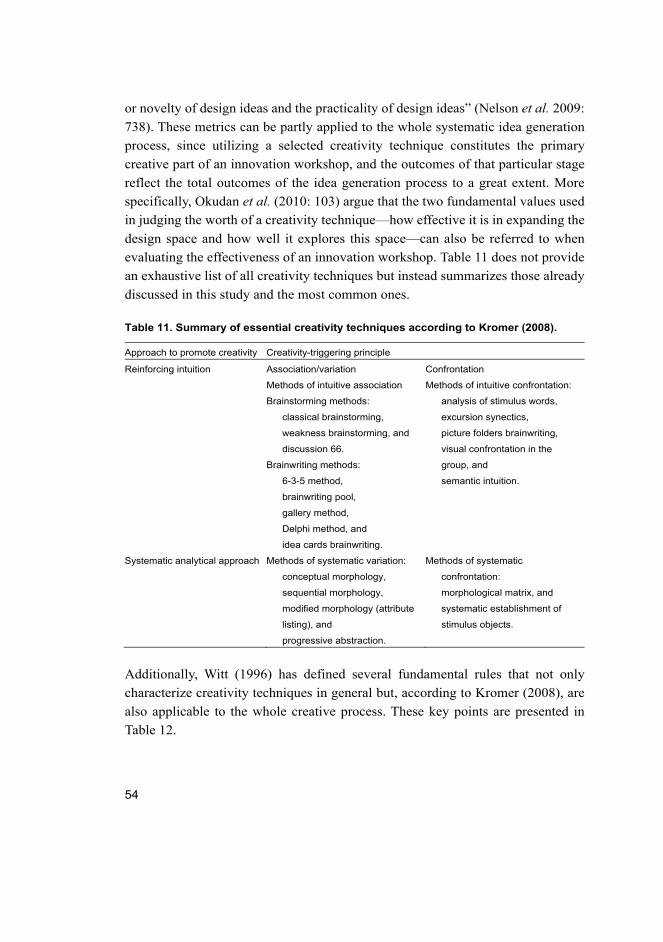
54
or novelty of design ideas and the practicality of design ideas” (Nelson et al. 2009:
738). These metrics can be partly applied to the whole systematic idea generation
process, since utilizing a selected creativity technique constitutes the primary
creative part of an innovation workshop, and the outcomes of that particular stage
reflect the total outcomes of the idea generation process to a great extent. More
specifically, Okudan et al. (2010: 103) argue that the two fundamental values used
in judging the worth of a creativity technique—how effective it is in expanding the
design space and how well it explores this space—can also be referred to when
evaluating the effectiveness of an innovation workshop. Table 11 does not provide
an exhaustive list of all creativity techniques but instead summarizes those already
discussed in this study and the most common ones.
Table 11. Summary of essential creativity techniques according to Kromer (2008).
Approach to promote creativity Creativity-triggering principle
Reinforcing intuition Association/variation Confrontation
Methods of intuitive association Methods of intuitive confrontation:
Brainstorming methods:
classical brainstorming,
weakness brainstorming, and
discussion 66.
Brainwriting methods:
6-3-5 method,
brainwriting pool,
gallery method,
Delphi method, and
idea cards brainwriting.
analysis of stimulus words,
excursion synectics,
picture folders brainwriting,
visual confrontation in the
group, and
semantic intuition.
Systematic analytical approach Methods of systematic variation:
conceptual morphology,
sequential morphology,
modified morphology (attribute
listing), and
progressive abstraction.
Methods of systematic
confrontation:
morphological matrix, and
systematic establishment of
stimulus objects.
Additionally, Witt (1996) has defined several fundamental rules that not only
characterize creativity techniques in general but, according to Kromer (2008), are
also applicable to the whole creative process. These key points are presented in
Table 12.
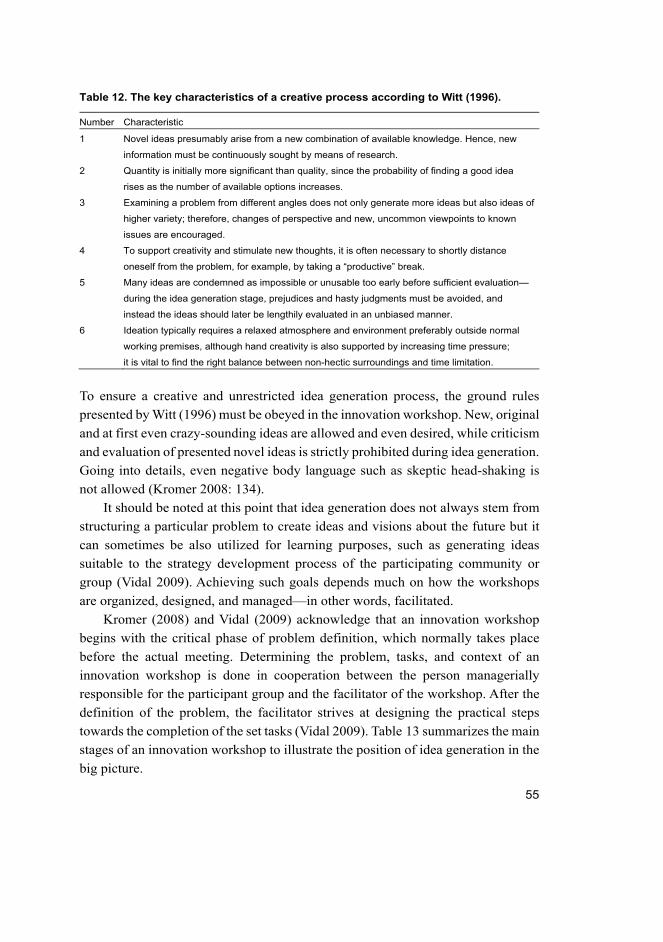
55
Table 12. The key characteristics of a creative process according to Witt (1996).
Number Characteristic
1 Novel ideas presumably arise from a new combination of available knowledge. Hence, new
information must be continuously sought by means of research.
2 Quantity is initially more significant than quality, since the probability of finding a good idea
rises as the number of available options increases.
3 Examining a problem from different angles does not only generate more ideas but also ideas of
higher variety; therefore, changes of perspective and new, uncommon viewpoints to known
issues are encouraged.
4 To support creativity and stimulate new thoughts, it is often necessary to shortly distance
oneself from the problem, for example, by taking a “productive” break.
5 Many ideas are condemned as impossible or unusable too early before sufficient evaluation—
during the idea generation stage, prejudices and hasty judgments must be avoided, and
instead the ideas should later be lengthily evaluated in an unbiased manner.
6 Ideation typically requires a relaxed atmosphere and environment preferably outside normal
working premises, although hand creativity is also supported by increasing time pressure;
it is vital to find the right balance between non-hectic surroundings and time limitation.
To ensure a creative and unrestricted idea generation process, the ground rules
presented by Witt (1996) must be obeyed in the innovation workshop. New, original
and at first even crazy-sounding ideas are allowed and even desired, while criticism
and evaluation of presented novel ideas is strictly prohibited during idea generation.
Going into details, even negative body language such as skeptic head-shaking is
not allowed (Kromer 2008: 134).
It should be noted at this point that idea generation does not always stem from
structuring a particular problem to create ideas and visions about the future but it
can sometimes be also utilized for learning purposes, such as generating ideas
suitable to the strategy development process of the participating community or
group (Vidal 2009). Achieving such goals depends much on how the workshops
are organized, designed, and managed—in other words, facilitated.
Kromer (2008) and Vidal (2009) acknowledge that an innovation workshop
begins with the critical phase of problem definition, which normally takes place
before the actual meeting. Determining the problem, tasks, and context of an
innovation workshop is done in cooperation between the person managerially
responsible for the participant group and the facilitator of the workshop. After the
definition of the problem, the facilitator strives at designing the practical steps
towards the completion of the set tasks (Vidal 2009). Table 13 summarizes the main
stages of an innovation workshop to illustrate the position of idea generation in the
big picture.
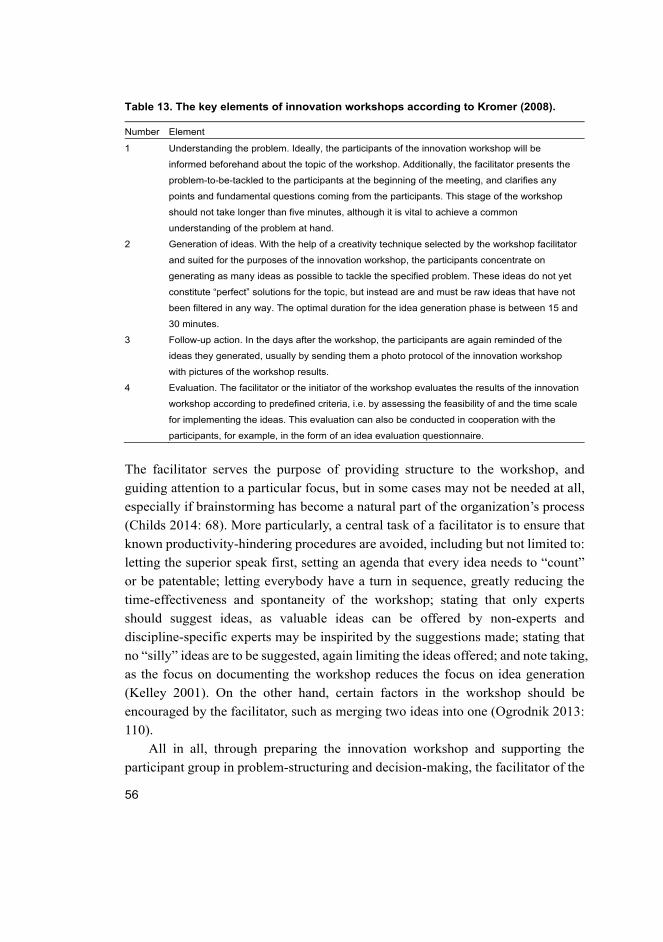
56
Table 13. The key elements of innovation workshops according to Kromer (2008).
Number Element
1 Understanding the problem. Ideally, the participants of the innovation workshop will be
informed beforehand about the topic of the workshop. Additionally, the facilitator presents the
problem-to-be-tackled to the participants at the beginning of the meeting, and clarifies any
points and fundamental questions coming from the participants. This stage of the workshop
should not take longer than five minutes, although it is vital to achieve a common
understanding of the problem at hand.
2 Generation of ideas. With the help of a creativity technique selected by the workshop facilitator
and suited for the purposes of the innovation workshop, the participants concentrate on
generating as many ideas as possible to tackle the specified problem. These ideas do not yet
constitute “perfect” solutions for the topic, but instead are and must be raw ideas that have not
been filtered in any way. The optimal duration for the idea generation phase is between 15 and
30 minutes.
3 Follow-up action. In the days after the workshop, the participants are again reminded of the
ideas they generated, usually by sending them a photo protocol of the innovation workshop
with pictures of the workshop results.
4 Evaluation. The facilitator or the initiator of the workshop evaluates the results of the innovation
workshop according to predefined criteria, i.e. by assessing the feasibility of and the time scale
for implementing the ideas. This evaluation can also be conducted in cooperation with the
participants, for example, in the form of an idea evaluation questionnaire.
The facilitator serves the purpose of providing structure to the workshop, and
guiding attention to a particular focus, but in some cases may not be needed at all,
especially if brainstorming has become a natural part of the organization’s process
(Childs 2014: 68). More particularly, a central task of a facilitator is to ensure that
known productivity-hindering procedures are avoided, including but not limited to:
letting the superior speak first, setting an agenda that every idea needs to “count”
or be patentable; letting everybody have a turn in sequence, greatly reducing the
time-effectiveness and spontaneity of the workshop; stating that only experts
should suggest ideas, as valuable ideas can be offered by non-experts and
discipline-specific experts may be inspirited by the suggestions made; stating that
no “silly” ideas are to be suggested, again limiting the ideas offered; and note taking,
as the focus on documenting the workshop reduces the focus on idea generation
(Kelley 2001). On the other hand, certain factors in the workshop should be
encouraged by the facilitator, such as merging two ideas into one (Ogrodnik 2013:
110).
All in all, through preparing the innovation workshop and supporting the
participant group in problem-structuring and decision-making, the facilitator of the
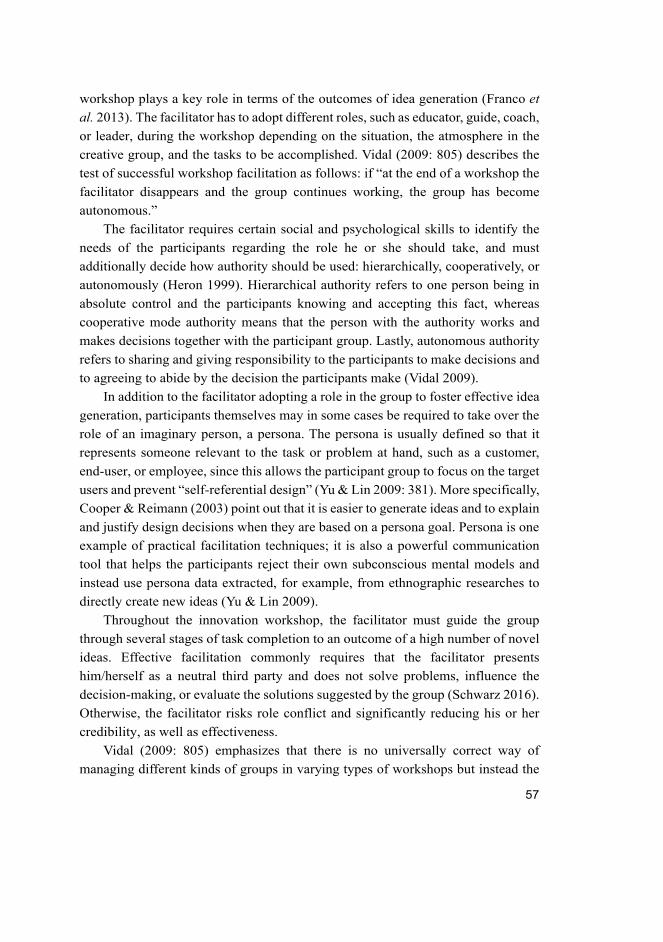
57
workshop plays a key role in terms of the outcomes of idea generation (Franco et
al. 2013). The facilitator has to adopt different roles, such as educator, guide, coach,
or leader, during the workshop depending on the situation, the atmosphere in the
creative group, and the tasks to be accomplished. Vidal (2009: 805) describes the
test of successful workshop facilitation as follows: if “at the end of a workshop the
facilitator disappears and the group continues working, the group has become
autonomous.”
The facilitator requires certain social and psychological skills to identify the
needs of the participants regarding the role he or she should take, and must
additionally decide how authority should be used: hierarchically, cooperatively, or
autonomously (Heron 1999). Hierarchical authority refers to one person being in
absolute control and the participants knowing and accepting this fact, whereas
cooperative mode authority means that the person with the authority works and
makes decisions together with the participant group. Lastly, autonomous authority
refers to sharing and giving responsibility to the participants to make decisions and
to agreeing to abide by the decision the participants make (Vidal 2009).
In addition to the facilitator adopting a role in the group to foster effective idea
generation, participants themselves may in some cases be required to take over the
role of an imaginary person, a persona. The persona is usually defined so that it
represents someone relevant to the task or problem at hand, such as a customer,
end-user, or employee, since this allows the participant group to focus on the target
users and prevent “self-referential design” (Yu & Lin 2009: 381). More specifically,
Cooper & Reimann (2003) point out that it is easier to generate ideas and to explain
and justify design decisions when they are based on a persona goal. Persona is one
example of practical facilitation techniques; it is also a powerful communication
tool that helps the participants reject their own subconscious mental models and
instead use persona data extracted, for example, from ethnographic researches to
directly create new ideas (Yu & Lin 2009).
Throughout the innovation workshop, the facilitator must guide the group
through several stages of task completion to an outcome of a high number of novel
ideas. Effective facilitation commonly requires that the facilitator presents
him/herself as a neutral third party and does not solve problems, influence the
decision-making, or evaluate the solutions suggested by the group (Schwarz 2016).
Otherwise, the facilitator risks role conflict and significantly reducing his or her
credibility, as well as effectiveness.
Vidal (2009: 805) emphasizes that there is no universally correct way of
managing different kinds of groups in varying types of workshops but instead the
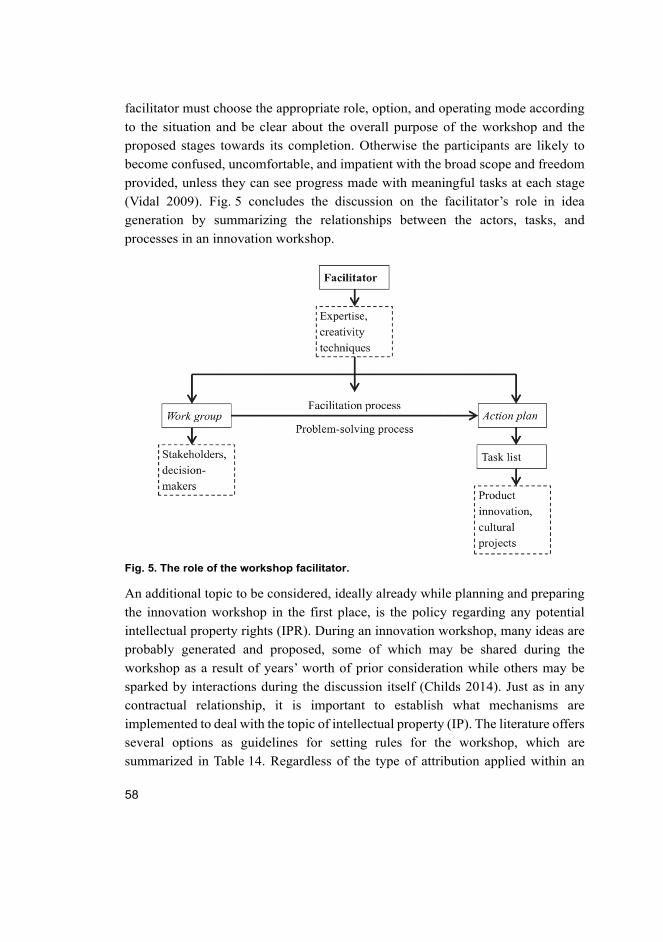
58
facilitator must choose the appropriate role, option, and operating mode according
to the situation and be clear about the overall purpose of the workshop and the
proposed stages towards its completion. Otherwise the participants are likely to
become confused, uncomfortable, and impatient with the broad scope and freedom
provided, unless they can see progress made with meaningful tasks at each stage
(Vidal 2009). Fig. 5 concludes the discussion on the facilitator’s role in idea
generation by summarizing the relationships between the actors, tasks, and
processes in an innovation workshop.
Fig. 5. The role of the workshop facilitator.
An additional topic to be considered, ideally already while planning and preparing
the innovation workshop in the first place, is the policy regarding any potential
intellectual property rights (IPR). During an innovation workshop, many ideas are
probably generated and proposed, some of which may be shared during the
workshop as a result of years’ worth of prior consideration while others may be
sparked by interactions during the discussion itself (Childs 2014). Just as in any
contractual relationship, it is important to establish what mechanisms are
implemented to deal with the topic of intellectual property (IP). The literature offers
several options as guidelines for setting rules for the workshop, which are
summarized in Table 14. Regardless of the type of attribution applied within an
59
innovation workshop, care needs to be taken regarding the assertion or claim of a
company or organization to the generated ideas, and the IPR rules need to be stated
clearly at the start of the workshop.
Table 14. Childs’s (2014) mechanisms for handling IPRs in an innovation workshop.
Number Mechanism
1 “Chatham house rules”: There is no attribution to a particular individual for anything that is said
or shared within a discussion.
2 Direct attribution: Each participant’s initials or moniker are associated with each idea, and
documented by means of scanning the ideas after the innovation workshop and embedding
them within a database.
3 Equal attribution: Any IPR reward is divided equally between all participants.
4 IPR is retained solely by the organization or client. Such a system may be compatible with the
terms of employment.
Even though Chapter 1 stated that this research refrains from comparing different
idea generation and innovation philosophies in depth, it is important to understand
the underlying differences between closed and open innovation, since they are
relevant in the discussion part of this study. This research has so far regarded
innovation and idea generation as straightforward and systematic processes, the
latter in the form of a planned workshop organized and managed by the facilitator.
In this case, the need to generate new ideas and the requirement for such an
innovation workshop has been communicated by the representative of the
participant group to the workshop facilitator, who then goes on to design the
creative tasks to be completed (Vidal 2009).
This is what Chesbrough (2003) refers to as a “closed model of innovation”,
which is based on a seller-designed system incorporating internally developed
services, technology, and interfaces. In closed innovation, the facilitator of the idea
generation is responsible for identifying ways to create value for the participants
and end-users by fostering creative thinking, managing the time pressure, and
improving the social and operational performance of the peer group (Chesbrough
& Davies 2010: 590).
Open innovation, however, takes a different approach to creating value. In an
open model, the organization does not only utilize internal knowledge but also
external contacts and capabilities to gather ideas of products and services that can
have internal and external routes to market (Chesbrough & Davies 2010: 593). As
a practical example of open innovation, a broadcasting company responded to the
emergence of new digital media technologies and markets by founding an open
60
source community to engage with a high number of external individuals and
institutions through innovation experiments, i.e. creating innovative new
applications (Bessant & Davies 2007).
Salminen’s (2015) research thoroughly examines the practical aspects of idea
generation on a commercial open innovation platform. He (Salminen 2015) notes
that even though communities like OpenIDEO and Quirky seem similar, there are
great differences in their emphases and in the way how the solution generation is
facilitated. Additionally, the community often has little influence on the selection
of the winning concepts due to the presence of client organizations or sponsors that
dictate the criteria to be used. Nevertheless, “community challenges” allow for the
generation of a high number of solution suggestions by the community, and active
discussion on behalf of the community members provides feedback which greatly
aids the enhancement of initial concepts. The final concepts are detailed on specific
forms to ensure that all relevant aspects of the solution have been considered and
that the requirements for the concept are clear to the people working on them
(Salminen 2015: 80).
Open innovation effectively concerns a systematic alignment of internal and
external competencies by integrating external knowledge to either organization-
internal (outside-in) or cross-disciplinary creative idea generation and innovation
processes (Klauss 2014). Typical cooperative organizations or clients contributing
external knowhow to innovation partnerships include universities, research
facilities, supplier companies, product end-users, and even competitors. Still, it
should be noted that even closed circles of innovation such as innovation
workshops may partially take advantage of activities that normally concern open
innovation, for example, by means of inviting external researchers or professionals
as participants who then can bring new knowledge from sources not known to the
host organization (Kromer 2008: 129).
3.2 Theory of measurement
The concepts of measurement and measurement theory represent a cornerstone in
all empirical research, both single disciplinary and interdisciplinary, with the basic
paradigm for measurement stemming from the experimental sciences (Tobi 2014).
Measurement and metrics as information types are often used interchangeably, yet
they are not the same. A measurement is a value generated by counting that is
determined at a specific time, whereas metrics result from the analysis of
61
measurements, involving a comparison of two or more measurements taken over a
certain period of time to a predetermined baseline (Payne 2006: 2, Berglund et al.
2012). The usability of metrics is thus dependent on the accuracy of the related
measurements (Thomas 2014). The bar should not be set too high, however, as
Hubbard (2010: 3) states: “No matter how ‘fuzzy’ the measurement is, it’s still a
measurement if it tells you more than you knew before.”
Consequently, the field of measurement has experienced a shift of emphasis
from attempting to know how reality is to using measurement merely to
approximate and consistently express information about reality (Micheli & Mari
2014). According to this view, measurement only claims to be a representational
tool, a “bridge between reality, to which the measured object belongs, and the
linguistic/symbolic realm, to which the measurement result belongs” (Mari 2007:
42), since measurement relates to the available knowledge of an object’s state.
Finkelstein (2005: 268) has defined measurement as “a process of empirical,
objective assignment of symbols to attributes of objects and events of the real world,
in such a way as to represent them, or to describe them”, aimed to bridge the gap
between measurement in experimental sciences and in those social sciences that
assume the existence of measurable attributes. Yet, measurement is not only a
process within interdisciplinary research but also an interdisciplinary subject of
thought. Measurement theory must facilitate discussion of the theoretical concept,
the phenomenon under study, the substance, and the form of the studied entity
before researchers can move on to defining a measurement model and assigning
numerical values (MINET Glossary 2015, Tobi 2014).
An increasingly important topic in the field of measurement science is the
analysis of measurability conditions and applicability of the knowledge that has
been gathered over many centuries of scientific and technological measurement to
measuring non-physical, intangible properties (Rossi 2007, Mari 2007, Mari et al.
2009). In the literature, this borderline field of measurement theory is referred to as
“measurement in soft systems”, “measurement of soft quantities”, or even simply
“soft measurement” (Lazzarotti et al. 2011). Accordingly, the central issue here
concerns implementing some general principles of measurement theory to
measuring a soft system, to construct a model able to evaluate its effectiveness as
robustly and reliably as possible. In the context of intangibles, Hubbard (2010: 23)
argues that measurement should not be viewed as an accurate representation of
reality but merely as “a quantitatively expressed reduction of uncertainty based on
one or more observations”. This is also the definition of measurement that this
study embraces.
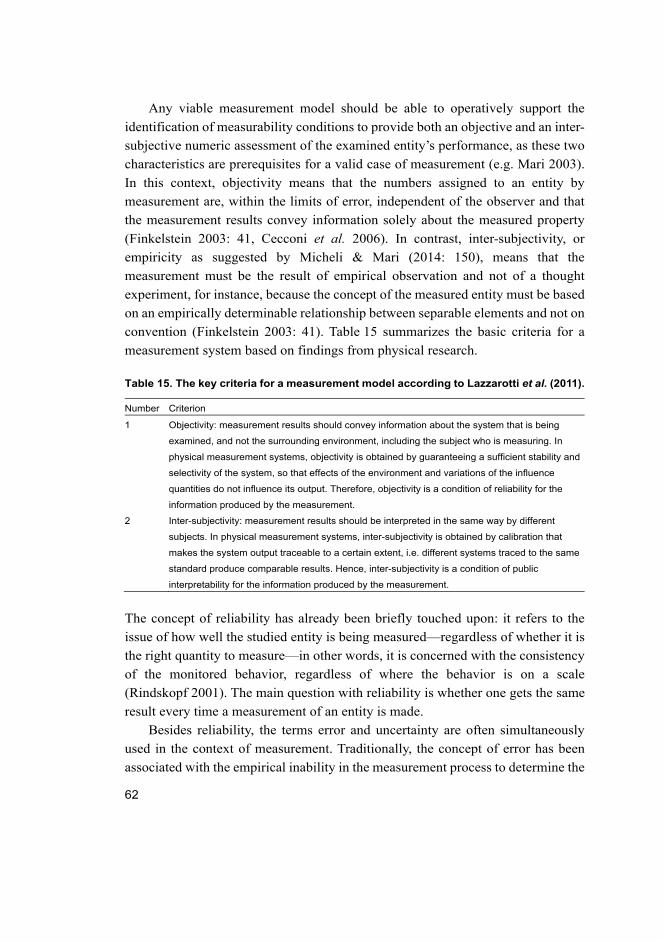
62
Any viable measurement model should be able to operatively support the
identification of measurability conditions to provide both an objective and an inter-
subjective numeric assessment of the examined entity’s performance, as these two
characteristics are prerequisites for a valid case of measurement (e.g. Mari 2003).
In this context, objectivity means that the numbers assigned to an entity by
measurement are, within the limits of error, independent of the observer and that
the measurement results convey information solely about the measured property
(Finkelstein 2003: 41, Cecconi et al. 2006). In contrast, inter-subjectivity, or
empiricity as suggested by Micheli & Mari (2014: 150), means that the
measurement must be the result of empirical observation and not of a thought
experiment, for instance, because the concept of the measured entity must be based
on an empirically determinable relationship between separable elements and not on
convention (Finkelstein 2003: 41). Table 15 summarizes the basic criteria for a
measurement system based on findings from physical research.
Table 15. The key criteria for a measurement model according to Lazzarotti et al. (2011).
Number Criterion
1 Objectivity: measurement results should convey information about the system that is being
examined, and not the surrounding environment, including the subject who is measuring. In
physical measurement systems, objectivity is obtained by guaranteeing a sufficient stability and
selectivity of the system, so that effects of the environment and variations of the influence
quantities do not influence its output. Therefore, objectivity is a condition of reliability for the
information produced by the measurement.
2 Inter-subjectivity: measurement results should be interpreted in the same way by different
subjects. In physical measurement systems, inter-subjectivity is obtained by calibration that
makes the system output traceable to a certain extent, i.e. different systems traced to the same
standard produce comparable results. Hence, inter-subjectivity is a condition of public
interpretability for the information produced by the measurement.
The concept of reliability has already been briefly touched upon: it refers to the
issue of how well the studied entity is being measured—regardless of whether it is
the right quantity to measure—in other words, it is concerned with the consistency
of the monitored behavior, regardless of where the behavior is on a scale
(Rindskopf 2001). The main question with reliability is whether one gets the same
result every time a measurement of an entity is made.
Besides reliability, the terms error and uncertainty are often simultaneously
used in the context of measurement. Traditionally, the concept of error has been
associated with the empirical inability in the measurement process to determine the
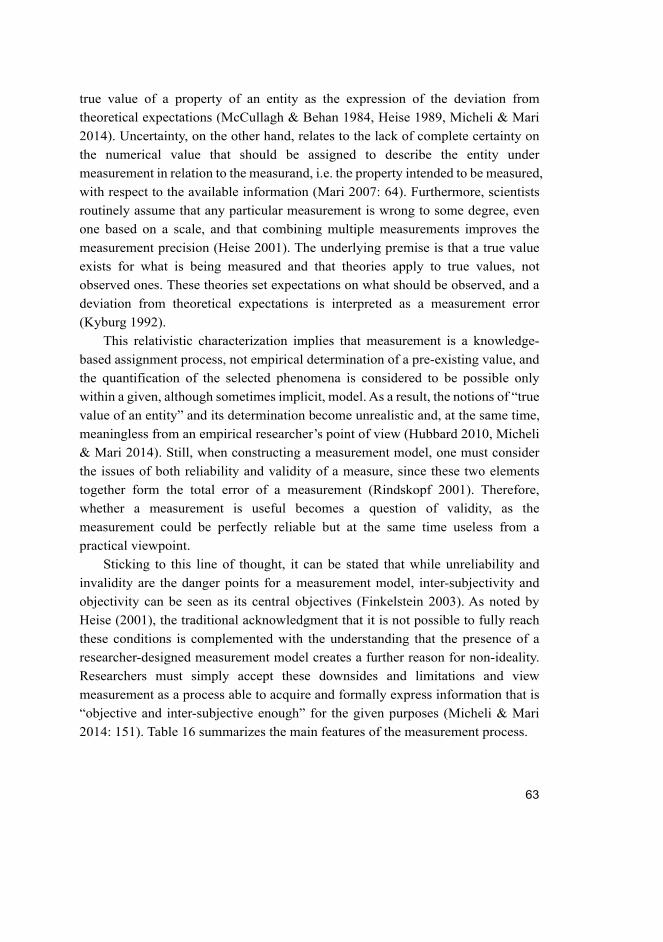
63
true value of a property of an entity as the expression of the deviation from
theoretical expectations (McCullagh & Behan 1984, Heise 1989, Micheli & Mari
2014). Uncertainty, on the other hand, relates to the lack of complete certainty on
the numerical value that should be assigned to describe the entity under
measurement in relation to the measurand, i.e. the property intended to be measured,
with respect to the available information (Mari 2007: 64). Furthermore, scientists
routinely assume that any particular measurement is wrong to some degree, even
one based on a scale, and that combining multiple measurements improves the
measurement precision (Heise 2001). The underlying premise is that a true value
exists for what is being measured and that theories apply to true values, not
observed ones. These theories set expectations on what should be observed, and a
deviation from theoretical expectations is interpreted as a measurement error
(Kyburg 1992).
This relativistic characterization implies that measurement is a knowledge-
based assignment process, not empirical determination of a pre-existing value, and
the quantification of the selected phenomena is considered to be possible only
within a given, although sometimes implicit, model. As a result, the notions of “true
value of an entity” and its determination become unrealistic and, at the same time,
meaningless from an empirical researcher’s point of view (Hubbard 2010, Micheli
& Mari 2014). Still, when constructing a measurement model, one must consider
the issues of both reliability and validity of a measure, since these two elements
together form the total error of a measurement (Rindskopf 2001). Therefore,
whether a measurement is useful becomes a question of validity, as the
measurement could be perfectly reliable but at the same time useless from a
practical viewpoint.
Sticking to this line of thought, it can be stated that while unreliability and
invalidity are the danger points for a measurement model, inter-subjectivity and
objectivity can be seen as its central objectives (Finkelstein 2003). As noted by
Heise (2001), the traditional acknowledgment that it is not possible to fully reach
these conditions is complemented with the understanding that the presence of a
researcher-designed measurement model creates a further reason for non-ideality.
Researchers must simply accept these downsides and limitations and view
measurement as a process able to acquire and formally express information that is
“objective and inter-subjective enough” for the given purposes (Micheli & Mari
2014: 151). Table 16 summarizes the main features of the measurement process.
64
Table 16. The central characteristics of the measurement process.
Number Characteristic
1 Measurement is not a determination but an assignment, and measurement results only
generate information that is meaningful in the context of the model within which measurement
is undertaken
2 Measurement results are informational, not empirical, entities
3 The measurability of an entity conceptually depends on the current state of knowledge of the
property; therefore, it is not an “intrinsic characteristic” of the property itself
4 The measurability of a property depends on the availability of experimental conditions and
cannot be derived from formal requirements
5 The qualitative trade-off between specificity and trust, i.e. precision and accuracy, depends on
the available experimental knowledge of the studied entity
6 Objectivity, inter-subjectivity, and repeatability are desirable but not necessary features of
measurement
3.2.1 Performance measurement
The last three decades have witnessed a revolution in performance measurement
and management, where the term performance refers to the measurement of the
extent to which an organization reaches a given objective (Wen 2009, Bourne et al.
2014). Practitioners must learn to observe performance more carefully, and they
will find out that performance measurement very rarely culminates in one or two
metrics about the studied process; instead, there are usually many intangible aspects
that conceal vital information about the entity’s true performance (Hubbard 2010).
Accordingly, traditional accounting-based measures have been largely replaced by
quantifiable key performance indicators (KPIs), focusing on both financial and
non-financial aspects of the process, and by multi-dimensional frameworks such as
the SMART Pyramid, Balanced Scorecard, and the Performance Prism (Bourne et
al. 2014).
Throughout this period, significant research on the development and
implementation of measurement systems has been conducted, with current efforts
concentrating on examining how performance measurement is and should be used
to manage the performance of an entity within a company and to improve the
efficiency and the effectiveness of the complete organization (Kaplan & Norton
1992, Franco-Santos et al. 2007, Bourne et al. 2014). Previous research shows that
organizations can benefit from appropriate measurement and management of
performance in many areas, which have been summarized and listed in Table 17.
65
Table 17. Operational benefits of performance measurement.
Number Operational benefit
1 The formulation, implementation, review, and adjustment of the organizational strategy (e.g.
Chenhall 2005)
2 The motivation of employees at all levels, the creation of a performance improvement culture,
and fostering of organizational learning (e.g. Henri 2006)
3 The communication of the achieved results to stakeholders, and strengthening the company
brand and reputation (e.g. McKevitt & Lawton 1996, Neely et al. 2002)
4 The isolation and resolution of problems associated with the increasing turbulence of modern
market arenas, constantly changing customer needs, radical new rival business models
as well as the management of issues related to the higher quantity, complexity, cost, and
variety of product portfolios (e.g. Lazzarotti et al. 2011)
It is important to keep in mind that the process of measurement can principally
relate to three types of objects: physical objects, which exist in space and time,
ideal objects, which exist outside space and time, and social objects, which have a
beginning in time and are socially constructed (Husserl 1964). In physics and
engineering, measurement science has traditionally focused on physical entities, i.e.
phenomena, bodies, and substances, whereas performance measurement is usually
concerned with social objects that are often complex, and difficult to define and
measure in terms of their properties (Micheli & Mari 2014). The satisfaction of
stakeholders, brand management, intellectual capital, and customer experience are
classic examples of performance measurement metrics. Therefore, Micheli & Mari
(2014: 152) point out that while complete inter-subjectivity and objectivity are
considered as preliminary or necessary conditions for measuring an entity
appropriately in physical sciences, in performance measurement they should rather
be seen as process goals which are not always sufficiently achieved.
The customary use of adages such as “if you cannot measure it, you cannot
manage it” and “what gets measured gets done” (e.g. Kaplan & Norton 1992)
reflects a common way of thinking in technology organizations, which indicates
that measurement directly relates to and creates knowledge and constitutes a vital
factor in motivating employees. While these praising sentences on the one hand
merely acknowledge the importance of performance measurement in organizations,
on the other hand, they have two major implications: first, it is suggested that
behaviors and action follow measurement, which is not necessarily the case in
organizations, and, second, it is assumed that all core properties of measurement,
i.e. objectivity, accuracy, and precision, are unproblematic and can be taken for
granted (Micheli & Mari 2014). Practitioners, and researchers alike, should not
66
forget that using KPIs to manage an organization requires great subtlety, and
driving performance through measurement is not feasible in the current world
where the operating environment is changing rapidly, solutions are uncertain, and
precise measurement is infeasible. These factors, amongst other things, need to be
considered when a firm starts building a measurement model, a process that is
discussed more thoroughly in the next subsection.
When reflecting on the developments in performance measurement over the
years, both in the literature and in practice, there is a general trend of moving away
from simple frameworks and processes towards a more nuanced view of the field
(Bourne et al. 2014). The current state of research on performance measurement is
beginning to recognize the limitations and flaws of quantifiable measuring in
difficult social environments, as well as the effect of rapidly altering situations in
the global environment. Bourne et al. (2014) stress that in these complex situations,
managers need to engage with the intent of the KPIs and take them for what they
are—merely indicators of performance and not real performance.
3.2.2 Building a measurement model
As discussed before, measurement refers to an evaluation performed by means of
a measurement system, and it is only such a system along with its proper setup and
usage that can guarantee the objectivity and the inter-subjectivity of measurement
results, up to a degree adequate for the given purposes (Micheli & Mari 2014).
Hence, it is rather the adequacy of the measurement system, not the assignment of
numbers, that makes an evaluation a measurement.
Several studies have examined the process of defining a measurement model
and recognized a set of steps and requirements that need to be gone through and
fulfilled in order for the measurement to be valid. Thomas (2014: 119–121)
presents five simple questions to be answered to this end: what is measured, what
is the metric, how it is measured, when it is measured, and who measures. Hubbard
(2010) emphasizes the importance of the first question—one of the most common
reasons why certain intangibles are regarded as “immeasurable” is that people
forget to clarify the nature of the intangible in question.
However, when taking a deep dive into the practicalities and prerequisites of
measurement, it can be seen that there are actually a great number of other questions
to answer and issues to consider. First, the entity whose property is measured is
assumed to exist in the empirical world, but it is acknowledged that the data
67
collected about that entity results from an interpretation process, or an explicit or
implicit model (Micheli & Mari 2014). Here, “empirical world” refers to a system
specified as an empirically identifiable set of objects or attributes together with a
finite number of empirical relations between its elements (Michell 2001). Therefore,
the measurement procedure must be defined and the measurement model designed
and set up by considering the context and the goals for which the measurement
model itself is being built. Furthermore, particular care has to be exerted when
analyzing any data or information outside the context where it was gathered, as this
has substantial implications on the drivers, purposes, and uses of measurement,
above all in benchmarking exercises (Ammons 1999, Hatry 1999, Behn 2003).
Equally, from a model-based viewpoint, it is not conducive to state that a metric is
either “good” or “bad” in absolute terms; an indicator should rather be deemed to
be adequate or inadequate-to-purpose on the basis of its targets and other relevant
factors, such as cost and quality (Micheli & Mari 2014: 153).
Second, the previously discussed factors of accuracy, inter-subjectivity, and
objectivity emphasize the requirement to clearly define the entities and properties
being measured and to empirically test the set of truisms that has been stated for
the studied empirical system (Michell 2001). Consequently, the researcher must
question and consider his or her own influence on the measurement results, along
with the reasons behind the commencement of the measurement process, and adopt
operational definitions in order to enhance consistency and trust in the introduced
indicators (Deming 1986, Goldratt & Cox 2004). The relevance and unavoidability
of interpretive models in the measurement process highlight the importance of
surfacing mental models in the design and use of such performance evaluation
models.
Third, as touched upon at the end of the previous section, a strong belief of the
unwavering position of the measurer as the describer of pure truths will have
significant consequences for the review of measurement models and organizational
learning (Bourne et al. 2014). According to Bohm (1980: 23), “the attempt to
suppose that measures exist prior to man and independently of him” leads to the
“objectification” of man’s insight, becoming rigidified, unable to change, and
eventually bringing about fragmentation and general confusion. In practice, this
occurs when organizations do not want to modify existing measurement systems
because they are perceived as “perfect representations” of performance and their
establishment in the organization involved a great amount of effort and a significant
financial investment. Argyris (1992: 11) emphasizes that double-loop
organizational learning and long-term performance improvement can only occur
68
when the models of organizational structures and processes, including those that
are regarded as high-performing, are “unfrozen”, which calls for analyzing the data
gathered through the measurement process and reformulating the evaluation model
itself from time to time. Micheli & Mari (2014) suggest that the review of a
measurement model must happen through an in-depth comparison between what is
measured of the performed activities and which activities really occur, because
measurement is related to the knowledge about the state of an entity rather than the
knowledge about the entity in itself. Accordingly, reviews could be used to
challenge not only the current model for performance measurement but also the
organization’s strategy and its implementation (e.g. Chenhall 2005, Gimbert et al.
2010).
Fourth, the utilization of given adequacy instead of truth as a criterion for
performance measurement implies that cost and quality of measurement should be
seen as relevant components of the measurement process and assessed both before
and after the measurement takes place (Micheli & Mari 2014). Thereupon, the
introduction of a measurement model must be considered as an investment for
which certain return can be expected and not an inherently fruitful use of resources
(Kaplan & Norton 1992). Error and reliability must be taken into account when
assessing the appropriateness of information about the entity under scrutiny—the
significance of specificity and trust as essential features of a measurement model
are underlined by the fact that while performance can be measured with great
accuracy, precision can also be misleading and indicators can be precisely wrong
(Mari 2007).
Fifth, building on from the recent developments in measurement research
presented by Bourne et al. (2014), the focus of measurement must shift from what
is measurable, which has its roots in philosophy and discussion on the meaning of
knowledge, to the nature of the entities that organizations want to measure,
referring to the actual organizational processes and activities being actually
performed. Indicators should not be considered as exact pictures of reality, or as
presumed truths; on the contrary, metrics should be used as a means to gather
information about organizational performance that is as adequate as possible
(Micheli & Mari 2014: 154).
Finally, Micheli & Mari (2014) argue that, based on the etymology of
measurement, a measurement model should be proportionate and consist of a
reasonable number of performance metrics that can inform decision-making
processes instead of attempting to provide true representations of an entity’s
69
effectiveness. Furthermore, while several areas in the theory and practice of
measurement models have been identified as having potential for advancement, the
evaluation systems of tomorrow will surely have to go beyond to more and more
precise measurement methods.
In summary, successful evaluation metrics programs include well-defined
measurements, the necessary steps to obtain them, and critical factors to consider,
while detailed documentation of the required measurements and responsible
individuals are also vitally important (Thomas 2014). Metrics are best suited for
providing viewers with the information they need to make decisions. Should
metrics be used or presented incorrectly, thus delivering either outright false
information or proper information in a form that is difficult to understand, they
reflect poorly on the effectiveness evaluation process and will be considered
ineffective (Thomas 2014).
Michell (2001) points out that much of the power of measurement models lies
in their ability to transfer information gathered from empirical systems into
numerical values by means of identifying structures within those systems which
possess numerical correlates. However, the presumed objectivity of numbers often
leads to organizations favoring quantitative measures of performance over
supposedly subjective qualitative indicators, even though numerical metrics may
easily be equally problematic and even less informative (Dossi & Patelli 2010). It
would seem logical, then, to construct and utilize a measurement model that
combines both quantitative and qualitative performance indicators.
3.3 Effectiveness metrics for idea generation
In his research, Dervitsiotis (2011) found that the companies most satisfied with
the use of their innovation metrics are the ones that assess the performance of the
whole innovation process, and that an organization’s preference for the selection
and use of suitable innovation metrics usually evolves as it acquires more relevant
experience in measuring innovation. More specifically, those companies new in
innovation activities prefer metrics more closely related to the operating aspects for
innovation activities, while more experienced enterprises choose to focus on more
strategic aspects of innovation (Dervitsiotis 2011: 558). However, besides
measuring the effectiveness of the whole innovation process, there is a need for
companies to be able to estimate the performance of their subprocesses to track and
identify problem areas, for instance. As for systematic idea generation,
organizations must have metrics in place for evaluating creative performance.
70
Numerous contributions have been made in the field of metrics for creativity
evaluation, some of which focus on the creativity of individuals while others relate
to the creativity in the design process and the rest examine creativity in products
(Chulvi et al. 2013). The most used parameters for measuring the creativity of a
solution have been commonly identified as the novelty of the product and its level
of utility, although a variety of synonymous terms have been used in the literature:
Moss (1966) refers to “unusualness and usefulness”, Besemer & O’Quin (1989) to
“novelty and resolution”, Sarkar & Chakrabarti (2008) to “novelty and usefulness”,
and Shah et al. (2003) to “novelty and quality”.
Several studies have applied evaluation criteria to assess creative outcomes.
These studies can be broadly divided into two categories based on their focus:
studies that developed or applied criteria to evaluate the ideas generated as the
output of creative activities and studies that applied evaluation criteria to creative
products, designs, and concepts embodied into a tangible form or communicated
through images and other intangible forms (Puccio & Cabra 2012: 203). In both
cases, the ideas or the products are examined by selected judges provided with the
criteria to compare and evaluate the level of creativity associated with the items or
the quality of novel ideas. Cognitive psychologists share this view, as they consider
fluency and novelty as the primary measures of the ability to generate ideas—yet,
these measures are not quite adequate for evaluating the creativity of new
engineering designs (Torrance 1964, Shah et al. 2003).
If the innovation pipeline is relatively long and the industry in which a firm
operates is associated with long lead times, ideas and concepts will probably change
significantly in form between the idea phase and the prototype phase. In this case,
one should concentrate on empirically studying idea generation and on answering
the question: how can the effectiveness of systematic idea generation be measured?
More specifically, the organization must decide whether to assess the idea
generation process itself or if it is better to simply evaluate the outcome of idea
generation, i.e. the ideas generated: these are referred to as process-based and
outcome-based approaches, respectively (Shah et al. 2003: 115). The process-based
approaches seek to analyze idea generation based on the occurrence of cognitive
processes inherent to creative thought, while outcome-based approaches attempt to
evaluate the idea generation process based on the designs, or outcomes, produced
during ideation exercises (Nelson et al. 2009).
Due to the inherent complexity and difficulties in using process-based
approaches, outcome-based evaluation approaches have become more prevalent,
71
displayed by the fact that most organizations today focus on measuring innovation
outputs, while fewer, especially high-performers, address the creative process itself
(Shah et al. 2003, Dervitsiotis 2011). Boston Consulting Group (2008) have found
that most companies (60%) rely on five or fewer metrics to measure innovation and
creative performance, preferring to track those that relate closely to profitability,
time to market, and idea generation and selection.
Zolotová et al. (2012) highlight the immense interrelatedness of measuring an
innovative process by pointing out that different settings for metrics lead to
drastically different results, even from the same data. For example, if one uses
traditional metrics, such as the ratio of the number of generated new ideas to the
number of ideas implemented, one might end up with indicators that are difficult
to read and to interpret from the value creation point of view; is it better if the ratio
is close to zero or to one?
For many of the reasons presented above, this study also focuses on outcome-
based quantitative metrics that relate closely to profitability when evaluating the
systematic idea generation process in the case organization. The metrics for idea
generation presented in the literature can be roughly categorized into financial,
creativity technique quality, and idea quality metrics, which are discussed in
subsections 3.3.1, 3.3.2, and 3.3.3, respectively. Several other metrics have also
been suggested by researchers, a special case of which is the use of patents as
indicators for measuring idea generation effectiveness, which is extensively
examined in section 3.4.
3.3.1 Financial metrics
In their research, Edison et al. (2013) found that the currently most widely used
quantifiable metrics for research and development effectiveness comprise the
number of improvements in existing products, the number of ideas converted
successfully to products, and improvement in product quality as a result of
innovation, while factors such as existence of a creative environment are also
regarded. On the other hand, Dervitsiotis (2011) argues that the overall indicator
for innovation effectiveness must clearly be the economic value added by the
stream of innovations generated in the innovation pipeline. This reflects a general
emphasis on measuring inputs and outputs of innovation in terms of resources spent
on innovation, and results in the form of improvements in processes and products.
Hence, it is conducive to scrutinize the inputs, process metrics, and outputs of
innovation activities separately to determine the effectiveness of the process.
72
Input metrics measure the resources provided for the innovative activities, for
example, personnel, funds, and equipment, the largest cost drivers in new-product
development often being the personnel and equipment costs (Janssen et al. 2011:
111). Hagedoorn & Cloodt (2003) point out that the research and development
intensity—defined as R&D expenditure and workforce—is typically used as an
evaluation criterion for the input of the innovation process. Four major input
variables that measure R&D and innovation have been identified: (1) total assets,
which are typical inputs in R&D activities (Serrano-Cinca et al. 2005), (2) R&D
expenditures, which indicate input or the firm’s innovativeness (Morbey &
Reithner 1990), (3) the total number of employees dedicated to R&D (Sterlacchini
1999, Edison et al. 2013) and firm size (Scherer 1980), and (4) the total number of
R&D researchers who are directly involved in productivity and value-enhancing
activities (Koschatzky et al. 2001).
Process metrics evaluate the achievement of time, cost, and quality objectives,
as well as the progress of innovation projects (Griffin & Page 1993, Driva et al.
2000, Kerssens-van Drongelen & Cook 1997). Edison et al. (2013) point out that
although it is important to measure the output and performance, it is also equally
important to assess the environment for innovation and capability of an
organization to innovate, which is more often than not ignored when talking about
innovation measurement.
Output metrics measure the direct results of R&D activities, such as new
products or generated knowledge, and help identifying trends and developments
over time. Output metrics, such as the number of new product ideas generated per
dollar spent on R&D, can deliver valuable insights for improving the efficiency of
the innovative process (Janssen et al. 2011: 112). These kinds of output metrics
have proven popular in today’s organizations since they investigate innovation
success in the market and thus focus on topics that are essential to high-technology
companies, such as revenue, profit, market share, and customer satisfaction.
Absolute outcome metrics would then be revenue or market share growth due to
new products, or the total percentage of sale volume represented by new products,
for example (Boly et al. 2014).
In their research, Wang et al. (2011) use four output variables to measure high-
technology companies’ innovation activities. First, export volume indicates that
export rates are higher for firms with high R&D innovation inputs (Ito & Pucik
1993). Second, return on investment (ROI) serves as the single most vital indicator
of an organization’s innovation performance and is recognized as a powerful
73
instrument to justify the investments of high-technology companies on the basis of
profits (Walwyn 2007). Third, sales revenue represents the profitability associated
with innovation activities, resulting in new products and services, and constitutes a
KPI of the realization of product innovations, along with the ratio of new product
sales to total sales revenue (Koschatzky et al. 2001). This provides a
straightforward measure of the market success of a particular innovation, and
organizations often tend to use it. Nevertheless, relying solely on generated sales
as a metric can have negative effects on innovation if organizations consequently
end up developing a risk-averse culture and start preferring incremental innovations
over radical and breakthrough innovations (Edison et al. 2013).
Fourth, the number of patents has been recognized as an important and
financially robust index of firms’ innovativeness and an indicator of innovation
outcomes, as well as a measure of the volume of an organization’s research
activities and its impact on subsequent innovations (Graves & Langowitz 1996,
Thomas & McMillan 2001). Many primary studies use intellectual property-based
metrics for measuring innovation output, especially patent counts and citations-
based data. Still, there are several limitations in using patent-based measures for
innovation measurement, for example, as patents only cover a certain type of
innovation, strategic patenting may not represent innovation at all, and the
inclination to patent innovations varies across firms and industry (Evangelista et al.
1998, Kleinknecht et al. 2002, Edison et al. 2013, Dewangan & Godse 2014). The
next section, section 3.4, discusses the characteristics of patents as metrics for
creative activities in detail.
For the idea generation process, Zolotová et al. (2012: 574) suggest a number
of metrics, such as: the number of outputs of the innovative project, the usefulness
of the implementation project, the number of identified outcomes as a business
opportunity, and the number of signed contracts transformed from the business
opportunities created by innovative outputs. Similar counts-based measures—such
as the number of new ideas generated or financed, the number of new products
introduced in the market, the net present value, return on investment, and internal
rate of return on the current idea portfolio (Edison et al. 2013, Dewangan & Godse
2014: 542)—have been employed by other researchers. The central issue with using
these metrics is that they do not say much about the quality of the attribute
measured.
These metrics and most of the other financial metrics for innovation activities
suggested by several researchers represent high-level performance indicators
across the whole innovation process from idea generation to product prototyping
74
and market introduction. The question thus is to what extent these metrics actually
evaluate the effectiveness of the idea generation part of the process, and how visible
would a high-performing idea generation process be in the big picture in case other
parts of the innovation process did not function as efficiently? Consequently, one
must examine the metrics issue significantly closer to the actual idea generation
process to discover metrics that are directly linked to the effectiveness of systematic
idea generation. Subsections 3.3.2 and 3.3.3 investigate value creation metrics
within the scope of idea generation, discussing both the evaluation of creativity
techniques used to generate ideas and the evaluation of the ideas generated during
the innovation workshop, respectively.
3.3.2 Evaluation of creativity techniques
The findings presented in the previous section establish a foundation for assessing
the effectiveness of systematic idea generation. Clearly, the premise of outcome-
based approaches states that an innovation workshop is considered effective if it
produces a high number of “good” ideas, with certain metrics being used to dictate
whether an idea is “good” or “bad” (Nelson et al. 2009). However, there is also
another viewpoint: Shah et al. (2003) argue that one should consider the
effectiveness of certain creativity techniques and methods when examining the
quality of ideas created, as the performance of a creativity technique has a
fundamental effect on the output of an innovation workshop. The question here is
how to relate the measures of goodness for design ideas to measures of goodness
for creativity techniques. Moreover, measuring the effectiveness of creativity
techniques and innovation tools requires replicable evaluation methods, and
suitable metrics (Verhaegen et al. 2011). The following paragraphs discuss several
recently proposed metrics to establish guidelines for evaluating the effectiveness of
a creativity technique and enabling designers to make better founded decisions on
which creativity technique to choose.
Shah et al. (2003: 116) have identified two basic criteria for this purpose;
namely, the extent to which the creativity technique expands the design space and
to which it explores the design space. “Design space” is defined as the count of all
possible options for a given problem, and is thus not fully known (Ullman 1997).
A creativity technique should generally be targeted towards pushing the limits of
design space, because—in the conceptual phase of design—divergent thinking is
called for, and exploring the design space thoroughly implies a greater number,
75
variety, and coverage of design alternatives that have been discovered. This can be
typically achieved by starting out with a tentative set of possibilities, removing
assumed constraints, and discovering a novel way of doing something, before
dropping some of the recognized possibilities that do not meet predefined quality
requirements and thus again restricting the design space at the end (Shah et al.
2003).
Additionally, Kulkarni (2000) and Kulkarni & Shah (1999) observe that many
intuitive creativity techniques have common elements, which they refer to as idea
generation components, defined as cognitive mechanisms that are believed to
intrinsically promote idea generation or to help designers overcome mental
obstacles. Furthermore, evaluating creativity techniques in their entirety, known as
the “direct method”, is difficult because many components are often simultaneously
at play when generating ideas. The alternative is to identify the components of
creativity techniques and test them individually, known as the “component-based
method”, to then predict the effectiveness of the studied creativity techniques by
determining and counting the components present in the technique (Vargas-
Hernandez et al. 2010). The advantage here is that idea generation components are
commonly accepted and understood in cognitive psychology and engineering
design research, allowing one to connect the engineering design and cognitive
psychology theories on idea generation. Some of the idea generation components
identified by Shah et al. (2003) are provocative stimuli, suspended judgment,
flexible representation, example exposure, and incubation.
In order to carry out empirical studies of design ideation at any level, it must
first be specified how the effectiveness of idea generation is to be measured, since
one can either focus on the creative idea generation process, as in a protocol study,
or on the output based on the characteristics of ideas that have been generated.
Hence, existing measures to evaluate idea generation tools can be broadly grouped
into two separate categories: process-based and outcome-based evaluation metrics
(Shah et al. 2000).
In a process-based approach, the occurrence of creative cognitive processes is
observed, for instance, by videotaping brainstorming sessions; however, these
approaches are time-consuming and subjective as there are no commonly agreed
upon techniques to conduct process-based studies (Verhaegen et al. 2011). In
addition, it is extremely difficult to relate the occurrence of a cognitive process to
the effectiveness of an idea generation tool (Shah et al. 2003).
Vargas-Hernandez et al. (2010) note that process-based metrics, i.e. the
quantity and variety of ideas generated, are easier to influence and improve than
76
outcome-based evaluation measures. They go on by stating that in past studies, the
authors treated process-based and outcome-based metrics as equal but they now
recognize that having generated a high number of ideas or a great variety of ideas
is in itself not the end goal of a systematic idea generation process. It has long been
widely believed that generating more ideas or exploring many types of alternatives,
as in quantity or variety, leads to new, higher-quality ideas (Parnes 1961, Osborn
1979). Therefore, quantity and variety can be seen as a means to the end, while high
quality and novelty are the end goals, on the basis of which Vargas-Hernandez et
al. (2010: 405) decide to label quantity and variety as process metrics and novelty
and quality metrics as the primary outcomes.
For the reasons presented above, outcome-based evaluation approaches to
determine the value creation of idea generation have become more prevalent. In an
outcome-based approach, the ideas generated by the designer are evaluated rather
than the occurrence of specific cognitive processes, and a creativity technique can
then be considered to be effective if its use leads to “good” ideas and metrics relate
aspects of the generated design ideas to the effectiveness of the applied creativity
technique (Verhaegen et al. 2011). The following section discusses the metrics for
evaluating the various characteristics of ideas.
3.3.3 Evaluation of ideas
Vargas-Hernandez et al. (2010) argue that one of the most prominent methods of
evaluating the effectiveness of a systematic idea generation process is to examine
and assess the quality, or the value of the ideas produced as a result of the process.
This is often regarded as too complex a task, as an innovation can be constructed
from a number of different ideas and it is difficult to directly convert the quality of
an idea into a numerically presented financial benefit (Zolotová et al. 2012: 570).
Therefore, the measurement of idea quality must be approached in a way that takes
the specific conditions of a business as well as the social and market values of an
idea separately into account, keeping in mind that using the same rating scale for
the same idea may lead to different results in different businesses.
When engaging in idea evaluation, individuals and teams turn their attention
away from the production of novel ideas to the analysis of an idea’s potential to
provide new insight and to develop a workable solution out of it. The central
requirement here is novelty, as novelty is necessary for creativity to occur and
without it, it is not possible to have a creative outcome. However, novelty alone is
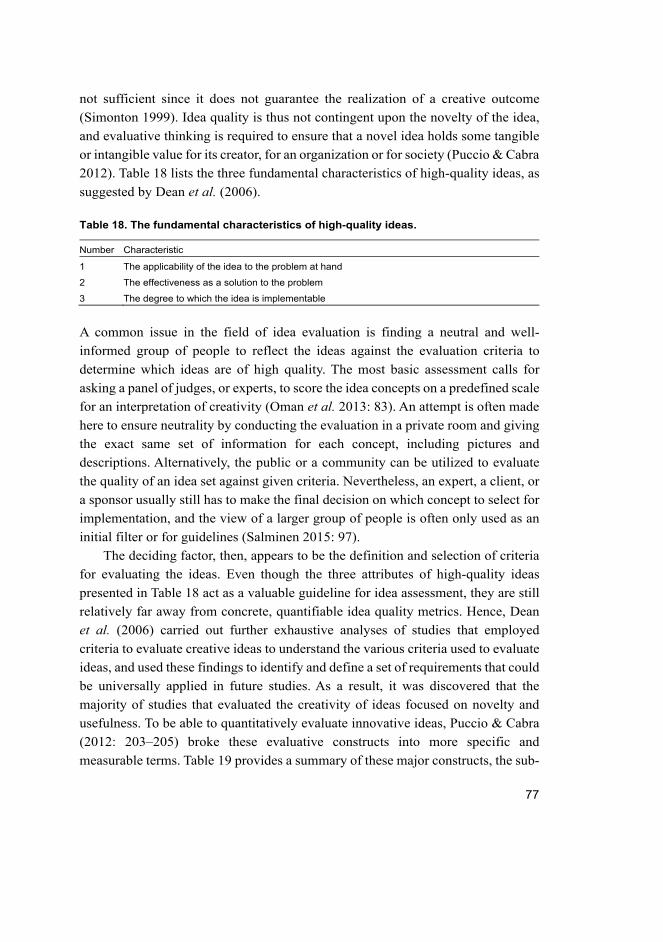
77
not sufficient since it does not guarantee the realization of a creative outcome
(Simonton 1999). Idea quality is thus not contingent upon the novelty of the idea,
and evaluative thinking is required to ensure that a novel idea holds some tangible
or intangible value for its creator, for an organization or for society (Puccio & Cabra
2012). Table 18 lists the three fundamental characteristics of high-quality ideas, as
suggested by Dean et al. (2006).
Table 18. The fundamental characteristics of high-quality ideas.
Number Characteristic
1 The applicability of the idea to the problem at hand
2 The effectiveness as a solution to the problem
3 The degree to which the idea is implementable
A common issue in the field of idea evaluation is finding a neutral and well-
informed group of people to reflect the ideas against the evaluation criteria to
determine which ideas are of high quality. The most basic assessment calls for
asking a panel of judges, or experts, to score the idea concepts on a predefined scale
for an interpretation of creativity (Oman et al. 2013: 83). An attempt is often made
here to ensure neutrality by conducting the evaluation in a private room and giving
the exact same set of information for each concept, including pictures and
descriptions. Alternatively, the public or a community can be utilized to evaluate
the quality of an idea set against given criteria. Nevertheless, an expert, a client, or
a sponsor usually still has to make the final decision on which concept to select for
implementation, and the view of a larger group of people is often only used as an
initial filter or for guidelines (Salminen 2015: 97).
The deciding factor, then, appears to be the definition and selection of criteria
for evaluating the ideas. Even though the three attributes of high-quality ideas
presented in Table 18 act as a valuable guideline for idea assessment, they are still
relatively far away from concrete, quantifiable idea quality metrics. Hence, Dean
et al. (2006) carried out further exhaustive analyses of studies that employed
criteria to evaluate creative ideas to understand the various criteria used to evaluate
ideas, and used these findings to identify and define a set of requirements that could
be universally applied in future studies. As a result, it was discovered that the
majority of studies that evaluated the creativity of ideas focused on novelty and
usefulness. To be able to quantitatively evaluate innovative ideas, Puccio & Cabra
(2012: 203–205) broke these evaluative constructs into more specific and
measurable terms. Table 19 provides a summary of these major constructs, the sub-
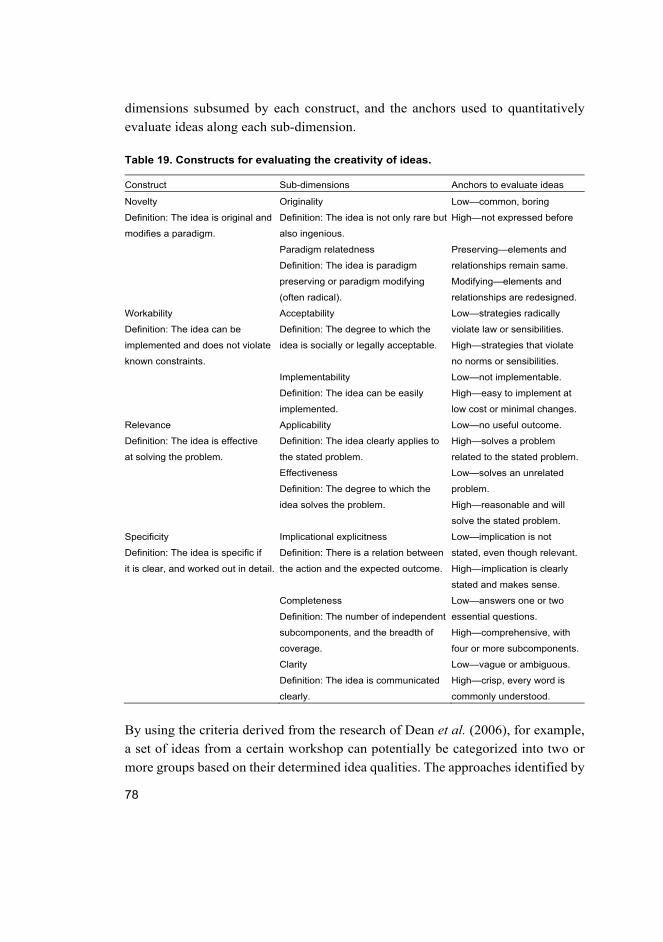
78
dimensions subsumed by each construct, and the anchors used to quantitatively
evaluate ideas along each sub-dimension.
Table 19. Constructs for evaluating the creativity of ideas.
Construct Sub-dimensions Anchors to evaluate ideas
Novelty
Definition: The idea is original and
modifies a paradigm.
Originality
Definition: The idea is not only rare but
also ingenious.
Low—common, boring
High—not expressed before
Paradigm relatedness
Definition: The idea is paradigm
preserving or paradigm modifying
(often radical).
Preserving—elements and
relationships remain same.
Modifying—elements and
relationships are redesigned.
Workability
Definition: The idea can be
implemented and does not violate
known constraints.
Acceptability
Definition: The degree to which the
idea is socially or legally acceptable.
Low—strategies radically
violate law or sensibilities.
High—strategies that violate
no norms or sensibilities.
Implementability
Definition: The idea can be easily
implemented.
Low—not implementable.
High—easy to implement at
low cost or minimal changes.
Relevance
Definition: The idea is effective
at solving the problem.
Applicability
Definition: The idea clearly applies to
the stated problem.
Low—no useful outcome.
High—solves a problem
related to the stated problem.
Effectiveness
Definition: The degree to which the
idea solves the problem.
Low—solves an unrelated
problem.
High—reasonable and will
solve the stated problem.
Specificity
Definition: The idea is specific if
it is clear, and worked out in detail.
Implicational explicitness
Definition: There is a relation between
the action and the expected outcome.
Low—implication is not
stated, even though relevant.
High—implication is clearly
stated and makes sense.
Completeness
Definition: The number of independent
subcomponents, and the breadth of
coverage.
Low—answers one or two
essential questions.
High—comprehensive, with
four or more subcomponents.
Clarity
Definition: The idea is communicated
clearly.
Low—vague or ambiguous.
High—crisp, every word is
commonly understood.
By using the criteria derived from the research of Dean et al. (2006), for example,
a set of ideas from a certain workshop can potentially be categorized into two or
more groups based on their determined idea qualities. The approaches identified by
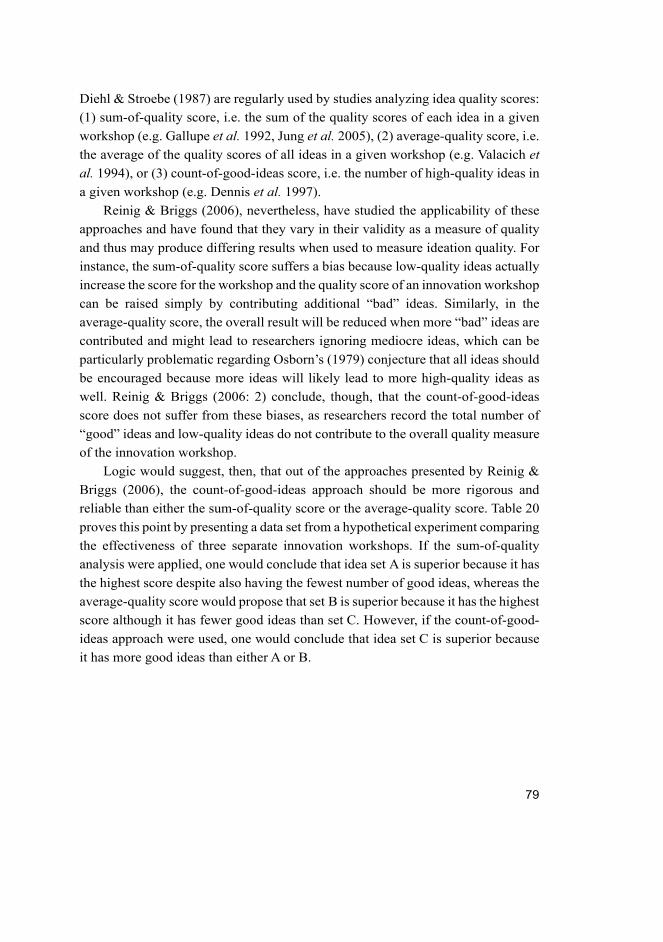
79
Diehl & Stroebe (1987) are regularly used by studies analyzing idea quality scores:
(1) sum-of-quality score, i.e. the sum of the quality scores of each idea in a given
workshop (e.g. Gallupe et al. 1992, Jung et al. 2005), (2) average-quality score, i.e.
the average of the quality scores of all ideas in a given workshop (e.g. Valacich et
al. 1994), or (3) count-of-good-ideas score, i.e. the number of high-quality ideas in
a given workshop (e.g. Dennis et al. 1997).
Reinig & Briggs (2006), nevertheless, have studied the applicability of these
approaches and have found that they vary in their validity as a measure of quality
and thus may produce differing results when used to measure ideation quality. For
instance, the sum-of-quality score suffers a bias because low-quality ideas actually
increase the score for the workshop and the quality score of an innovation workshop
can be raised simply by contributing additional “bad” ideas. Similarly, in the
average-quality score, the overall result will be reduced when more “bad” ideas are
contributed and might lead to researchers ignoring mediocre ideas, which can be
particularly problematic regarding Osborn’s (1979) conjecture that all ideas should
be encouraged because more ideas will likely lead to more high-quality ideas as
well. Reinig & Briggs (2006: 2) conclude, though, that the count-of-good-ideas
score does not suffer from these biases, as researchers record the total number of
“good” ideas and low-quality ideas do not contribute to the overall quality measure
of the innovation workshop.
Logic would suggest, then, that out of the approaches presented by Reinig &
Briggs (2006), the count-of-good-ideas approach should be more rigorous and
reliable than either the sum-of-quality score or the average-quality score. Table 20
proves this point by presenting a data set from a hypothetical experiment comparing
the effectiveness of three separate innovation workshops. If the sum-of-quality
analysis were applied, one would conclude that idea set A is superior because it has
the highest score despite also having the fewest number of good ideas, whereas the
average-quality score would propose that set B is superior because it has the highest
score although it has fewer good ideas than set C. However, if the count-of-good-
ideas approach were used, one would conclude that idea set C is superior because
it has more good ideas than either A or B.
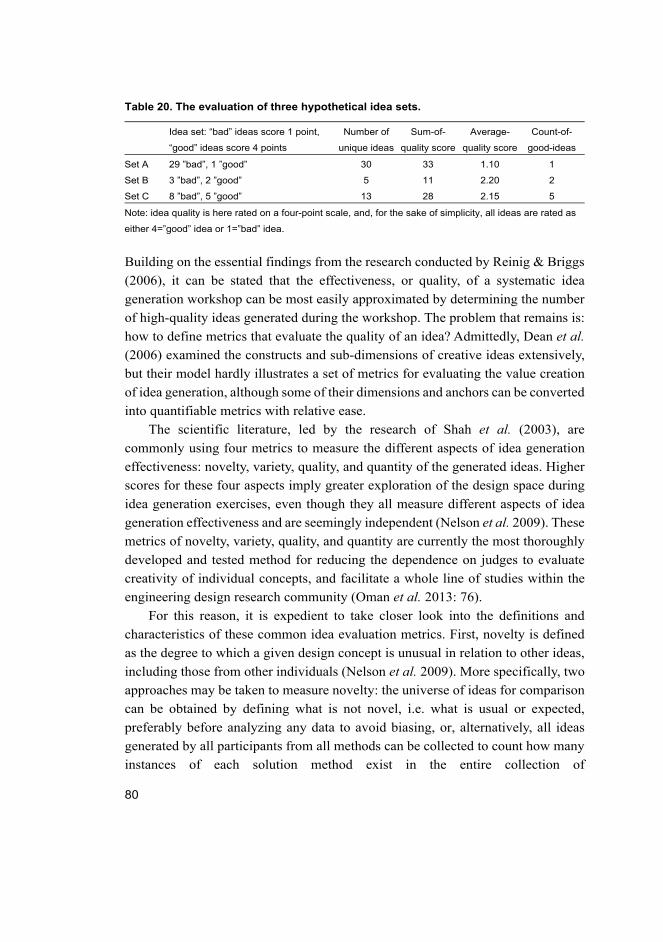
80
Table 20. The evaluation of three hypothetical idea sets.
Idea set: “bad” ideas score 1 point,
“good” ideas score 4 points
Number of
unique ideas
Sum-of-
quality score
Average-
quality score
Count-of-
good-ideas
Set A 29 ”bad”, 1 ”good” 30 33 1.10 1
Set B 3 ”bad”, 2 ”good” 5 11 2.20 2
Set C 8 ”bad”, 5 ”good” 13 28 2.15 5
Note: idea quality is here rated on a four-point scale, and, for the sake of simplicity, all ideas are rated as
either 4=”good” idea or 1=”bad” idea.
Building on the essential findings from the research conducted by Reinig & Briggs
(2006), it can be stated that the effectiveness, or quality, of a systematic idea
generation workshop can be most easily approximated by determining the number
of high-quality ideas generated during the workshop. The problem that remains is:
how to define metrics that evaluate the quality of an idea? Admittedly, Dean et al.
(2006) examined the constructs and sub-dimensions of creative ideas extensively,
but their model hardly illustrates a set of metrics for evaluating the value creation
of idea generation, although some of their dimensions and anchors can be converted
into quantifiable metrics with relative ease.
The scientific literature, led by the research of Shah et al. (2003), are
commonly using four metrics to measure the different aspects of idea generation
effectiveness: novelty, variety, quality, and quantity of the generated ideas. Higher
scores for these four aspects imply greater exploration of the design space during
idea generation exercises, even though they all measure different aspects of idea
generation effectiveness and are seemingly independent (Nelson et al. 2009). These
metrics of novelty, variety, quality, and quantity are currently the most thoroughly
developed and tested method for reducing the dependence on judges to evaluate
creativity of individual concepts, and facilitate a whole line of studies within the
engineering design research community (Oman et al. 2013: 76).
For this reason, it is expedient to take closer look into the definitions and
characteristics of these common idea evaluation metrics. First, novelty is defined
as the degree to which a given design concept is unusual in relation to other ideas,
including those from other individuals (Nelson et al. 2009). More specifically, two
approaches may be taken to measure novelty: the universe of ideas for comparison
can be obtained by defining what is not novel, i.e. what is usual or expected,
preferably before analyzing any data to avoid biasing, or, alternatively, all ideas
generated by all participants from all methods can be collected to count how many
instances of each solution method exist in the entire collection of
81
ideas (Shah et al. 2003: 117). Here a low count indicates that the characteristic
associated with the concept is rare, and so the idea is highly novel. Especially
regarding creativity taking place in organizations that seek competitive advantage,
the term of novelty can be further broken down to different levels: the concept is
(1) new to the organization but already exists in the national market, (2) new to the
national market but already exists in the global market, (3) new to the global market,
or (4) new to the industry (Neto et al. 2010: 458, Edison et al. 2013). The use of
the measure of novelty in idea generation is of fundamental importance, since novel
designs occupy points that are initially not perceived to be within the design space,
and expanding the design space offers the opportunity to find better designs that
are so far not known to exist (Shah et al. 2003: 118).
Second, variety is defined as the degree to which the concepts from a single
designer are dissimilar from other concepts from that designer and the extent to
which each function is satisfied (Nelson et al. 2009). As Shah et al. (2003: 125)
point out, the variety rating applies to an entire group of ideas, not an individual
idea, and ideas are grouped based on how different two ideas are from each other.
At the highest level, ideas are differentiated by the different physical principles
used by each to satisfy the same function, which is the most significant extent of
finding differences between ideas. At the second level, ideas are differentiated by
different working principles despite sharing the same physical principle, and at the
third and fourth levels, ideas have different embodiment and different details,
respectively. In conclusion, variety is an indication of how well the design space
was explored during the innovation workshop and acts as a necessary
counterbalance to the quantity measure (Shah et al. 2003: 127). Producing a large
number of ideas that differ from each other in minor ways does not constitute
effective idea generation; instead, the ability to generate a wide variety of ideas is
directly related to the ability to restructure problems, and is therefore an important
measure of success in systematic idea generation.
Third, quality concerns the degree to which a concept is considered feasible
and meets design specifications, and is arguably the most vital measure from the
perspective of a company’s goals, which often concern developing a better,
marketable, and profitable product (Nelson et al. 2009). Barki & Pinsonneault
(2001) support this view by arguing that idea quality is an important outcome
metric because the practical purpose of idea generation is typically to create a few
high-quality ideas with the intention of implementing at least one of them. Even
though previous studies have taken a variety of approaches to assessing idea
generation quality, most employ a three-stage process that includes (1) identifying
82
the set of unique ideas from an innovation workshop, (2) assigning a quality score
to each idea, and (3) performing statistical analysis on the quality scores to interpret
the effects of various interventions on the quality of the ideas and to determine an
aggregate quality measure for the examined innovation workshop (Reinig & Briggs
2006). Furthermore, ideation quality typically involves identifying unique ideas.
Fourth, quantity is the number of different concepts generated during a given
amount of time or over the course of running through all the steps in a creativity
technique (Nelson et al. 2009). The basis for using quantity as a measure for idea
generation effectiveness lies in the research of Parnes (1961) and Osborn (1979),
who argue that generating a high number of ideas increases the chances of the
occurrence of high-quality ideas. Psychometric psychology uses fluency, i.e. how
prolific one is in generating ideas, as an additional estimate of an individual’s
creativity (Torrance 1964). The quantity metric shares some discussion points with
the variety measure, especially regarding the decision when one should consider
two ideas as different enough to count separately. Nonetheless, since the extent of
differences between ideas is already accounted for by measuring variety, all ideas
that a participant submits are counted separately (Shah et al. 2003: 133).
Verhaegen et al. (2013) contribute to the field of idea generation evaluation by
drawing the key findings and models of Dean et al. (2006) and Shah et al. (2003)
together, and attempting to construct a wholesome model for measuring creativity
and idea generation effectiveness. This overview, illustrated in Fig. 6, is meant as
a high-level guideline to map and compare metrics between different studies on the
subject, and depicts multiple names for the metrics, since the terminology used for
the different metrics is inconsistently applied among researchers.
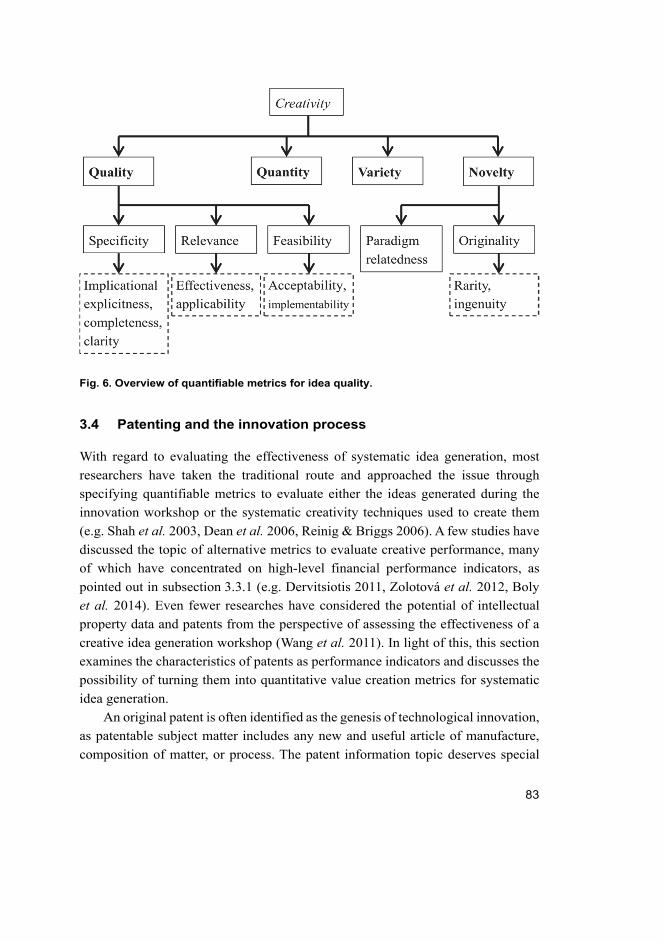
83
Fig. 6. Overview of quantifiable metrics for idea quality.
3.4 Patenting and the innovation process
With regard to evaluating the effectiveness of systematic idea generation, most
researchers have taken the traditional route and approached the issue through
specifying quantifiable metrics to evaluate either the ideas generated during the
innovation workshop or the systematic creativity techniques used to create them
(e.g. Shah et al. 2003, Dean et al. 2006, Reinig & Briggs 2006). A few studies have
discussed the topic of alternative metrics to evaluate creative performance, many
of which have concentrated on high-level financial performance indicators, as
pointed out in subsection 3.3.1 (e.g. Dervitsiotis 2011, Zolotová et al. 2012, Boly
et al. 2014). Even fewer researches have considered the potential of intellectual
property data and patents from the perspective of assessing the effectiveness of a
creative idea generation workshop (Wang et al. 2011). In light of this, this section
examines the characteristics of patents as performance indicators and discusses the
possibility of turning them into quantitative value creation metrics for systematic
idea generation.
An original patent is often identified as the genesis of technological innovation,
as patentable subject matter includes any new and useful article of manufacture,
composition of matter, or process. The patent information topic deserves special

84
emphasis, as roughly 80 percent of all documented technological knowhow is
recorded exclusively in patents which also contain 90 percent of the available
information on application-related developments (Ehrat 1997, Gerken et al. 2010).
On a general level, an invention is patentable if it meets all three of the
following requirements: the invention is useful, novel, and presents a nonobvious
solution (Mohr 2001). Consequently, a patent confers to the owner the right to
exclude others from making, using, or selling the product or process described and
claimed in the patent for a specific time period (Trajtenberg 1990, Hughes-Hallett
et al. 2014). There are two types of patent applications: a provisional application
remains in the patent office unexamined by a patent examiner and has a lifetime of
only one year, whereas a utility patent application will be assigned to an examiner
who will render an initial decision on patentability (Mohr 2001: 202–204).
The availability of patent documents is granted by publicly accessible Internet
portals of related patent offices that are responsible for the patents’ completeness
and assure their objectivity (Daim et al. 2006). The patent examination procedure
and the classification of patents are standardized by the patent office and involve
several significant time limits—the most important being the publication of a patent
application after 18 months at most. Since patents, as opposed to publications in
scientific periodicals, are market relevant and present an industrial application, the
goal is that subsequent to a patent’s publication, there is enough time left for the
applicant organization to act and capitalize on its innovation (Gassmann & Bader
2007, Granstrand 2000). The main difference between a scientific publication and
a patent is that the former contains information about emerging technologies in a
very early stage of development, while the application of the latter indicates that
the applicant expects to be able to exploit the patented technology in the market to
create profit (Porter & Cunningham 2005).
A further characteristic of patents is their standardized structure marked by the
division of a patent into two sections: the first section contains bibliographical
information, while the second consists of information in full text (Knight 2004).
The content of these two parts is more accurately defined by patent offices’ rules
and regulations. This standardization accounts for much of the analyzability of
patents; patents contain more information about rival companies’ technological
interests and activities than could be otherwise obtained (Gerken et al. 2010).
Hence, patent data clearly provides a promising alternative with a set of generic
advantages. Patents contain information on the entire population of all
collaborative projects with patented outcomes, are both easily accessible and
85
carefully catalogued, as well as transparent and highly standardized, and are stored
over a long period, and are permanently updated, enabling the assessment of short-
term and long-term impacts and comparisons across companies and across time
within subsets of technological areas (Teichert & Ernst 1999). Patent information
then represents a relevant, reliable, and readily accessible potential tool for
quantitative measurement of technology development (Hughes-Hallett et al. 2014).
On the other hand, the main disadvantage of patent data lies in one of its advantages,
namely the overwhelming size of information on a very detailed level of
measurement (Teichert & Ernst 1999: 421).
From an inventor’s perspective, the greatest advantage of the “patent system”
can either consist of acquiring a monopoly position in the respective field of
products or of profiting from allowing others to use the invention in exchange for
royalties or license fees. A patent-licensing agreement is simply a contract between
two or more parties that allows each party to use the patented technology of the
other for their own R&D, not only providing all parties with more freedom in
design but also creating a cumulative increase in innovation (Totten & Zhai 2014).
Furthermore, although the technology covered by a patent is public information,
the knowhow essential to implementing the technology is often kept secret, and
licensing agreements allow companies to share this important knowhow behind the
technology.
Nevertheless, the attitudes towards the patent system, licensing agreements,
and the grant of a monopoly position are mixed. For more than 150 years, there has
been debate among scholars and policymakers regarding whether the usage of
patents and the patent system actually increase welfare and innovation (Jell 2011:
4). Hall (2007) argues that the patent system has traditionally created benefits
related to innovation but also simultaneously social costs related to competition.
Fundamentally, the system built around patents is thought to motivate and provide
incentives for investing in R&D and to promote the diffusion of novel ideas. On
the downside, however, society must bear the cost of short-term monopolies created
by granting exclusionary rights (Jell 2011).
Interestingly, the patent system can also be seen from another perspective. In
addition to innovation-related benefits and competition-related costs, the patent
system entails innovation-related costs and competition-related benefits. In some
cases, patents may impede the combination of new ideas and inventions into value-
creating innovations—if the new invention depends on a patented prior invention,
for instance—and thus hamper sequential innovation, or innovation may be limited
by the transaction costs created by the patents, as organizations are forced to direct
86
resources to patent clearance instead of inventive activities (Jell 2011: 5). On the
other hand, patents can help realize competition-related benefits by enabling the
trading of inventive knowledge, which theoretically should contribute to the
success of technology markets, and, under such circumstances, by facilitating the
entry of new small firms with limited assets into an industry (Hall 2007).
The importance of the patent system and the consequent patent data analysis
has become more emphasized in high-technology management as the process of
innovation is becoming increasingly complex and the cycle of innovation becomes
shorter (Yoon & Park 2004). However, according to Yoon & Lee (2008), many
practitioners are dubious of the applicability of patent information because not all
technological innovations are filed to get patent rights and, instead, companies in
some sectors often choose to protect their innovations in the form of secrecy.
Basically, such a passive intellectual property strategy results from a conclusion
that the exposure of the organization’s inventions might allow its competitors to
easily reproduce the patented and publicized innovations.
3.4.1 Defensive patenting
The effects of the disclosure of technical information in patent documents is a
popular topic among scholars. Most theoretical papers focus on the negative effects
which stem from the facilitation of imitation and invent-around through the
publication of valuable information to the public, including competitors (e.g.
Horstmann et al. 1985, Anton & Yao 2004). Empirical studies have ended up with
similar conclusions: for instance, Duguet & Kabla (1998) found in their analysis of
French manufacturing firms that patent disclosure is the main reason why most
firms choose not to patent all of their innovations. Similarly, Cohen et al. (2000)
surveyed 1,165 R&D managers from U.S. manufacturing firms and found that
patent documents disclose too much information from applicants’ perspectives,
constituting an important limitation of the effectiveness of patents.
Nevertheless, several authors have highlighted the positive aspects of
publishing an innovation. Johnson (2004) argues that the disclosure of patent
documents can be seen as a response to the fear of someone else being granted an
essential and damaging patent in a key area, and that this practice has become
increasingly common in high-technology industries since the late 1990s. Further,
Parchomovsky (2000) finds patent publishing useful to slow the advancement of a
competitor in a “patent race”—a situation where two rival organizations race to be
87
granted a patent on an invention that is not yet sufficiently developed to make a
patent grant likely. The phenomenon of filing and publishing a patent with the main
intent of slowing competitors down or preventing others from using or patenting
the invention in question is commonly called defensive publishing, or defensive
patenting (Jell 2011: 26).
A patent is generally described as a defensive patent if its core purpose is
something other than being utilized by the filing organization itself or if it prevents
other enterprises from taking advantage of the technology protected by the patent
in terms of royalties or license fees (Okuda & Tanaka 2011). More specifically,
Gibbs & DeMatteis (2002) define a defensive patent as an alternative technology
that conflicts the existing line of products and technology development in a given
organization. Iida (2006) has discovered that defensive patents do not form a patent
portfolio relevant to an organization’s core business, but instead are located around
it. Ludlow (2014) even argues that only one in twenty patents are valuable deal
drivers for licensing, litigation, and patent sales, whereas the great majority of
patents merely add to the size of the patent portfolio as a means to increase its
impressiveness in the eyes of others.
Building on this line of thought, a significant problem for companies
attempting to circumvent a specific patented invention is posed by “patent thickets”,
which occur when an innovative product involves many patents, in contrast with
the classical one-to-one correspondence between innovations and patents that is
often assumed in the literature (Bessen 2003). Research on the topic suggests that
patent thickets create difficulties for innovators. For example, when they must
negotiate simultaneously with large numbers of patent holders, innovators may face
excessive transaction costs, timely delays, and problems of monopoly (Heller &
Eisenberg 1998, Shapiro 2001). Therefore, patent thickets constitute one of the
most effective defensive patenting strategies.
Okuda & Tanaka (2011) conducted intensive research on the motives behind
and practical benefits associated with defensive patenting in Japanese high-
technology industries. Consequently, four reasons why defensive patenting has
become more attractive as a patenting strategy across various high-technology
companies have been recognized, and are presented in Table 21.
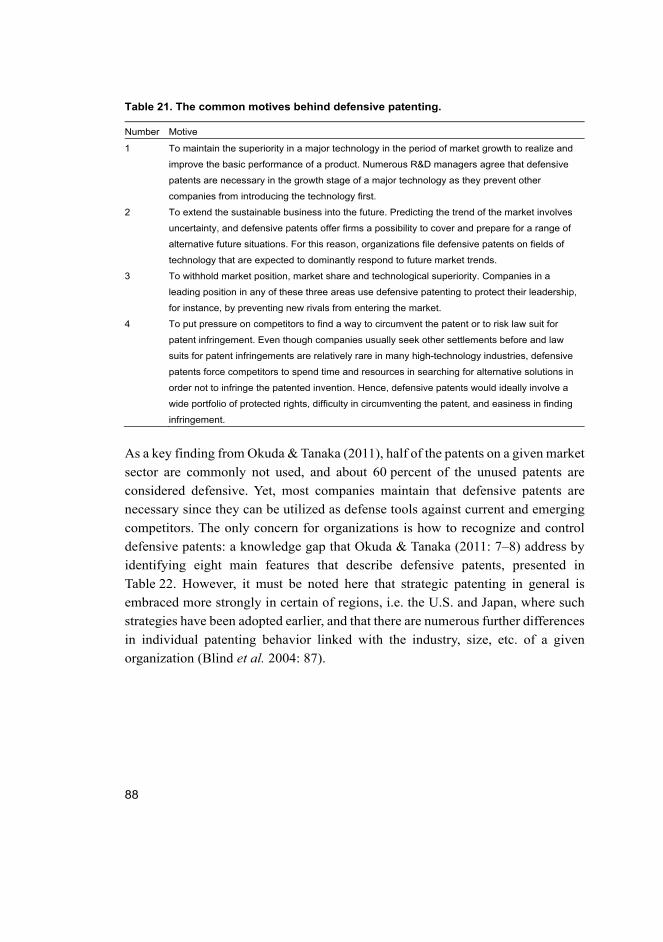
88
Table 21. The common motives behind defensive patenting.
Number Motive
1 To maintain the superiority in a major technology in the period of market growth to realize and
improve the basic performance of a product. Numerous R&D managers agree that defensive
patents are necessary in the growth stage of a major technology as they prevent other
companies from introducing the technology first.
2 To extend the sustainable business into the future. Predicting the trend of the market involves
uncertainty, and defensive patents offer firms a possibility to cover and prepare for a range of
alternative future situations. For this reason, organizations file defensive patents on fields of
technology that are expected to dominantly respond to future market trends.
3 To withhold market position, market share and technological superiority. Companies in a
leading position in any of these three areas use defensive patenting to protect their leadership,
for instance, by preventing new rivals from entering the market.
4 To put pressure on competitors to find a way to circumvent the patent or to risk law suit for
patent infringement. Even though companies usually seek other settlements before and law
suits for patent infringements are relatively rare in many high-technology industries, defensive
patents force competitors to spend time and resources in searching for alternative solutions in
order not to infringe the patented invention. Hence, defensive patents would ideally involve a
wide portfolio of protected rights, difficulty in circumventing the patent, and easiness in finding
infringement.
As a key finding from Okuda & Tanaka (2011), half of the patents on a given market
sector are commonly not used, and about 60 percent of the unused patents are
considered defensive. Yet, most companies maintain that defensive patents are
necessary since they can be utilized as defense tools against current and emerging
competitors. The only concern for organizations is how to recognize and control
defensive patents: a knowledge gap that Okuda & Tanaka (2011: 7–8) address by
identifying eight main features that describe defensive patents, presented in
Table 22. However, it must be noted here that strategic patenting in general is
embraced more strongly in certain of regions, i.e. the U.S. and Japan, where such
strategies have been adopted earlier, and that there are numerous further differences
in individual patenting behavior linked with the industry, size, etc. of a given
organization (Blind et al. 2004: 87).
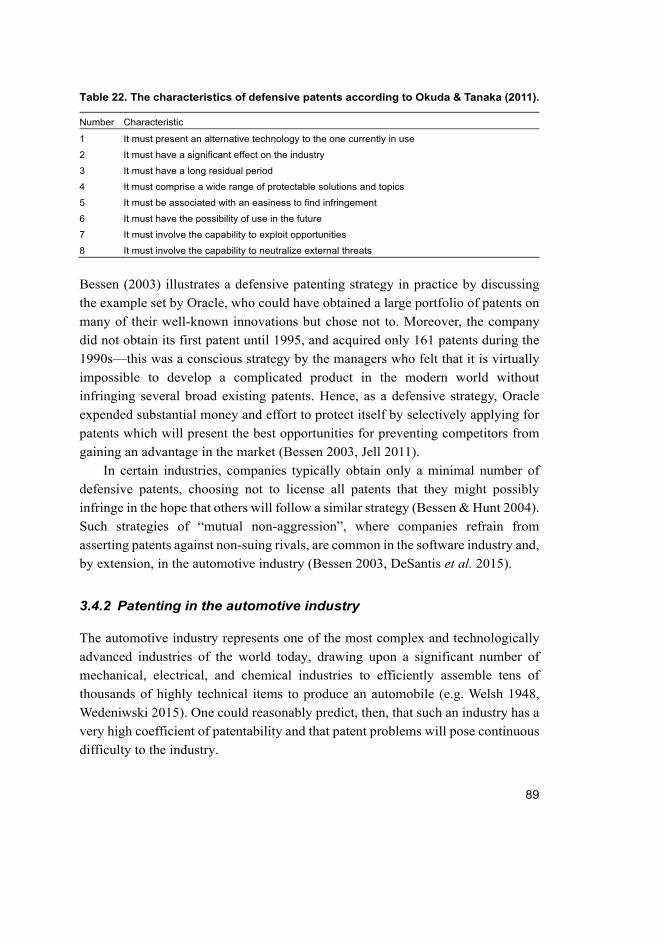
89
Table 22. The characteristics of defensive patents according to Okuda & Tanaka (2011).
Number Characteristic
1 It must present an alternative technology to the one currently in use
2 It must have a significant effect on the industry
3 It must have a long residual period
4 It must comprise a wide range of protectable solutions and topics
5 It must be associated with an easiness to find infringement
6 It must have the possibility of use in the future
7 It must involve the capability to exploit opportunities
8 It must involve the capability to neutralize external threats
Bessen (2003) illustrates a defensive patenting strategy in practice by discussing
the example set by Oracle, who could have obtained a large portfolio of patents on
many of their well-known innovations but chose not to. Moreover, the company
did not obtain its first patent until 1995, and acquired only 161 patents during the
1990s—this was a conscious strategy by the managers who felt that it is virtually
impossible to develop a complicated product in the modern world without
infringing several broad existing patents. Hence, as a defensive strategy, Oracle
expended substantial money and effort to protect itself by selectively applying for
patents which will present the best opportunities for preventing competitors from
gaining an advantage in the market (Bessen 2003, Jell 2011).
In certain industries, companies typically obtain only a minimal number of
defensive patents, choosing not to license all patents that they might possibly
infringe in the hope that others will follow a similar strategy (Bessen & Hunt 2004).
Such strategies of “mutual non-aggression”, where companies refrain from
asserting patents against non-suing rivals, are common in the software industry and,
by extension, in the automotive industry (Bessen 2003, DeSantis et al. 2015).
3.4.2 Patenting in the automotive industry
The automotive industry represents one of the most complex and technologically
advanced industries of the world today, drawing upon a significant number of
mechanical, electrical, and chemical industries to efficiently assemble tens of
thousands of highly technical items to produce an automobile (e.g. Welsh 1948,
Wedeniwski 2015). One could reasonably predict, then, that such an industry has a
very high coefficient of patentability and that patent problems will pose continuous
difficulty to the industry.
90
The lead time in the automotive industry amounts to approximately five years
in general, 43 months for Japanese manufacturers, or about three years for a
German automobile manufacturer, and under certain circumstances, this lead time
can be further reduced to approximately one year (Gerken et al. 2014). Clearly,
then, the lead time in the automotive industry has decreased dramatically over time,
and car manufacturers nowadays must be able to react to a competitor’s move
within one year.
Notably, Asian car manufacturers often have product life cycles that are
roughly two years shorter than those of European and U.S.-based competitors,
which can generally be translated into earlier market entry, representing a vital
advantage over later entrants (Lin & Lu 2006: 146). The speed at which automotive
companies innovate and develop new cars has clearly become increasingly
important in the automobile industry, and Asian manufacturers of today strive at
outperforming their competitors by employing more innovation activities and filing
higher-level patents.
Leading automotive companies file their patents in a very early stage in the
innovation process—as early as 13 months after the start of product development,
taking into account that as much as 18 months may elapse between filing and the
disclosure of a patent, while the time lag between a patent disclosure and market
launch is 12 months on average and the lead time is 43 months (Gerken et al. 2014:
299). The timing of patent filings discernibly differs from technology to technology,
indicating that it is subject to additional strategic aspects and might be influenced
by strategic factors such as the maturity level.
The intensity of patenting in connection with new product development in the
automotive industry has increased significantly in the last two decades, mainly
driven by leading vehicle manufacturers, which also constitute the leading patent
applicants in the automobile branch. The patenting of solutions is embraced in the
high-technology environment of the automotive industry, with the employees’
obligation to file new inventions in written form adding to this incentive in the case
of Germany (Reimer et al. 2007). However, automobile manufacturers are not the
only ones who actively file inventions for protection: the significance of third party
suppliers is underlined by the fact that the leading German automotive supplier
Bosch is among the leading patent applicants (Cleff et al. 2005: 131). Regarding
the number of patent applications, Europe is the leading region in automotive R&D
with a share of around 60 percent in all European Patent Office (EPO) automotive
patent applications (Cleff et al. 2005).
91
The automotive industry is generally characterized by a strong horizontal and
vertical collaboration among different manufacturers: these specialized networks
and collaborative activities have proven an important source of competitive
advantage in the automobile industry (Teichert & Ernst 1999: 426). This has been
reflected in the patenting strategies of most automotive companies, which can be
commonly described as defensive, as between 2008 and 2013 only ten percent of
patent infringement cases in the automotive industry were initiated by OEMs or
automotive suppliers (DeSantis et al. 2015). It can be interpreted from this behavior
that car manufacturers do not seek financial gains from patenting in the form of
royalties or patent fees; instead, they file patents primarily to protect their own
“freedom to operate”, FTO.
The strong collaborative activities in the automotive industry are expected to
intensify due to the emergence of certain technological areas in personal vehicles,
such as entertainment, networking systems, and telematics (e.g. Egeland &
Matshede 2015). The diversification of the technology field leads to a strong
encouragement of outsourcing strategy within automotive industry and creates a
need for increased high-frequency collaborative activities when in-house R&D is
substituted by cooperative R&D in non-core areas (Teichert & Ernst 1999). In this
situation, OEMs will try to cover their inventions more carefully with patents, as
the greatest part of patent rows tend to be played out against organizations whose
main business does not involve the automotive industry (DeSantis et al. 2015).
Yoon & Lee (2008: 5) conclude that patent analysis and patent-based efficiency
evaluation can help OEMs unravel significant findings and enable performance
improvements in the scale-intensive field that is automotive industry.
3.4.3 Patents as metrics for R&D
In order to stay competitive and survive, automotive organizations today find
themselves confronted with the challenge of having to react to technological change
and to develop the ability to discern evolution paths and road maps well before the
technological environment changes (Gerken et al. 2010). Clearly, then, it is a very
important task for companies to identify and analyze technological change, since
several key decisions—the prioritization of R&D efforts or the investigation of
technology opportunities, for instance—depend on the ability of judging it (Yoon
& Park 2005). Even though it is not perfectly clear whether innovation or imitation
leads to greater business success, organizations still need to create a solid basis for
92
their decision-making by finding a way to quantifiably evaluate innovation efforts
and technological change (Schaeffer & Stoll 2007).
Although many central aspects such as continuous improvement can be
directly measured through productivity, quality, etc. over time, these metrics do not
necessarily measure the actual efforts put into improvements or innovation
activities (Henriksen & Onsøyen 2010: 389). Especially indicators describing
knowledge creation would be vital for understanding automotive companies’ long-
term potential. These could involve the number of projects, technical employees,
improvement suggestions, cross-functional team meetings, as well as the amount
of R&D investments, and, most importantly, the number of filed patents (Mohr
2001: 5).
As a large part of contemporary technological knowhow is contained in patents,
these appear to be a particularly promising origin of information with some clear
advantages over other sources, namely the objectivity, classification, recentness,
scope, completeness, standardization, analyzability, availability, and market
relevance of patents (Sternitzke 2008). Patents represent intermediary results of the
PCP and are consequently indicative of the invention’s activity and of research
efforts (Jolly & Philpott 2004). In this respect, the use of patent information is
gaining increasing attention in the fields of innovation and technology management,
as IP data represents a valuable source of information that can be used to plot the
evolution of technologies over time (Pilkington et al. 2002). The number of patents
is an important index of company innovativeness and can be considered as an
indicator of innovation outcomes (Graves & Langowitz 1996), as well as to
measure the volume of a firm’s research activities and the impact of a firm’s
research on subsequent innovations (Thomas & McMillan 2001). In addition, the
increasing number of patent applications renders manual evaluation of the
knowhow contained in the organization practically impossible (Gerken et al. 2010).
Nevertheless, there is evidence that particular care is required when
establishing a data set for a patent-based analysis, since patents, because of their
nature, represent technological advances and include speculation about how that
technology may or may not be used in the future (Pilkington et al. 2002: 11). As a
result, researchers must respect that patents do not necessarily make clear
statements about how they will be implemented for specific products, and patent
authors are typically trying to cover as many future possible uses for the innovation
as they can. Additional danger lies in selecting the appropriate patent metrics. The
simplest metric, patent counts, is most widely used but also central to the debate on
93
whether it actually measures knowledge creation or merely transaction costs
resulting from innovation (Adelman & DeAngelis 2007). In addition, the patent
metric gives a reduced evaluation of innovation because only technological
inventions are patented (Artz et al. 2010). As a result, researchers particularly in
the economic field are increasingly using patent citations and journal-based
innovation counts as indicators of the inventive performance of companies
(Hagedoorn & Cloodt 2003, Jensen & Webster 2004).
Evaluating and analyzing patent information has proven a demanding task,
largely due to the ever-increasing number of patent applications: while in 1997 the
European and U.S. patent offices received approximately 300,000 patent
applications in all, the rate amounted to 600,000 in 2007, having doubled over the
course of only ten years (European Patent Office 2008, United States Patent and
Trademark Office 2008). China, in particular, has made great advances in patenting
activity, with Chinese inventors filing over one million applications in 2015 (World
Intellectual Property Organization 2016). Disregarding the fact that over 90 percent
of these filings are for China’s domestic office only, this increase in IP activities
has significant implications on patenting universally: it can redefine the framework
for the utilization of patents in global competition in the coming years (McElwain
2016).
Due to the remarkable amount of patent applications, the extraction of
knowhow from patents can be extremely difficult, and certain aspects of patenting
are hence associated with the phenomenon of “information overflow”, leading to a
high degree of uncertainty (Bergmann et al. 2008). Existing approaches to the
analysis of patent information have mainly focused on the evaluation of patent
quantity, notwithstanding the fact that most of the valuable technical information
in patents is stored in unstructured data sources, such as text, according to the
standardized structure of patents (Gerken et al. 2010). However, if one manages to
analyze the unstructured technology-related knowledge contained in the vast
amount of patent documents, they are without doubt a valuable source of
information in an automotive context.
Patent quality is one field that has sparked several studies in recent times, by
authors including Grimaldi et al. (2015), Odasso et al. (2015), and Wang & Hsieh
(2015). The focus of studies regarding patent evaluation has traditionally centered
on forward citations—i.e. the number of times a patent is cited—the length of the
patent’s renewal, or the number of countries where it has been filed (Guellec & van
Pottelsberghe de la Potterie 2000, Kasravi & Risov 2007). Nevertheless, as the
principal content of IP is typically contained in problematic formats such as written
94
text (Gerken et al. 2010), the aforementioned indicators can be deemed to describe
the meaningfulness of patents vaguely at most without an unambiguous statement
on the actual quality of an invention. Numerous studies have attempted to formulate
a strategy for patent assessment, utilizing procedural methods such as text mining,
survival analysis, logistic regression analysis, and comprehensive patent citation
network (Han & Sohn 2015, Wu et al. 2015, Yang et al. 2015). Yet, none of the
proposed practices have risen to establish a standard for structured evaluation of
patent value.
The term “inventive value” is regularly mentioned in connection with patent
value, even though there are differences in its definition and interpretation across
different studies. Kasravi & Risov (2007) understand inventive value as the
originality of a patent, with large numbers of forward citations and only a few
backward citations. Emma (2005) sees “invention value” not as the value of a
patent but as the quality of an idea and the subjective value it creates for its inventor
and users. Guellec and van Pottelsberghe de la Potterie (2000) emphasize the
relationship between an organization’s patenting strategy and the values of its
inventions, and note that the inventions with the highest value attract interest in a
number of other organizations, potentially leading to the patented invention
generating financial value. Schüll (2003) shares this line of thought, defining
inventive value as the added value resulting from the monopoly position reinforced
by a given patent, and goes on stating that inventive values can thus be used to
determine the value of immaterial assets, to control patent licensing expenditures,
and to regulate monetary compensations to the inventors of high-quality patents. In
this respect, the inventive value of a patent is calculated from the added revenue
generated by the improved solution and the license income received by the
company, if other organizations have decided to acquire the invention for their use.
The definition of inventive value provided by Schüll (2003) is utilized within
the framework of this research, its wide implementation across high-technology
companies in the case organization’s industry being a great advantage. Section 4.2
examines inventive values further during the empirical studies, and discusses their
attributes from the perspective of quantitative idea evaluation.
The effectiveness of innovation activities
Using patents as measures of innovation has become increasingly popular among
scientists studying the innovative behavior of organizations, industries, and
95
countries (Archibugi & Pianta 1996). Patents assist companies in getting more
objective information about R&D activities and form a realistic indicator for
ongoing knowledge creation within an organization; it can also be argued that the
benefits of obtaining patents outweigh the costs and time required to obtain them
(van den Hoed 2005). A practical advantage of patent research is its public
availability.
As Lin & Cao (2012) point out, patents enjoy superiority in measuring
knowledge creation activities for four main reasons: first, patent data records the
information of each invention, and the information is compiled together according
to a uniform format to facilitate reference. Second, patent data is public information
and patent offices provide free network query service, making the data
straightforwardly accessible and making it easier for researchers to inquire about
the patent data needed. Third, patent data has been collected and compiled by
certain scholars, most notably Jaffe & Trajtenberg (2002), to build an easily
operable patent database and provide convenience for other researchers. Lastly,
patent data is commonly the only accessible instrument for externally measuring
knowledge creation activities. The meaning of public availability should not be
underestimated: other data, such as R&D output or speed, new product output or
speed, etc. are usually confidential business information, a large sample of which
cannot be obtained for research purposes from the outside over a long period. One
of the biggest advantages of using patent data is that patents offer an abundant
quantity of available data with organizational and technical details and allow the
construction of a time series database (Lanjouw et al. 1998, Popp 2003, Lee et al.
2011).
Yet, patent analysis has its disadvantages and weaknesses. The propensity to
patent inventions varies across time, organizations, technologies, and countries; for
example, Japanese companies tend to file more patents than their European and
American competitors (van den Hoed 2005). Furthermore, not all inventions are
patentable, and even many able inventions are not patented for secrecy reasons;
hence, patents tend to differ in quality and monetary worth, and patent analysis is
more suited for historical reconstruction of R&D activities rather than for assessing
the relative strength of the R&D activities of individual organizations (Grilliches
1990, Mogee & Kolar 1994, Lee et al. 2011). This viewpoint is supported by
Adelman & DeAngelis (2007) who argue that although patents are acknowledged
as a unique source of information on innovative output, patent metrics must be
analyzed with great care due to their difficult-to-interpret characteristics. Most
patents, for example, have very low economic value, whereas a small number of
96
patents accounts for a disproportionate share of the wealth generated by innovation.
As a result of all these limitations, Popp (2005: 214) argues that results of studies
based on patent information should be interpreted “as the effect on an ‘average’
patent, rather than considering them as specific inventions.”
Despite the limitations, patent statistics have been extensively used by studies
researching technological changes (Lee et al. 2011). In an automotive context,
patent data can be utilized to form an indicator of commitment to alternative
technologies, such as electric or fuel cell vehicles, since high patent percentages
indicate that OEMs are spending large amounts of resources on these technologies,
thereby displaying a relatively strong commitment (van den Hoed 2005). Similarly,
low patent percentages reflect the skeptical view that OEMs have low commitment
to alternative technologies, and use their development and monetary investment as
window dressing. Yet, companies in the automobile industry patent actively,
especially given the increasing strength of intellectual property protection globally,
and patents are typically considered as an objective measurement of product
innovation in the automotive industry (Sørensen & Stuard 2000, Benner &
Tushman 2002, Lin & Lu 2006). Lin & Lu (2006: 143) additionally note that the
three patent offices closest to automotive companies are the United States Patent
and Trademark Office (USPTO), the EPO, and the World Intellectual Property
Organization (WIPO).
The patent count is the number of patents that an organization successfully
applies for within a specific time period, being one of the most basic measuring
approaches and having been used by the earliest researches on patent data
management (Trajtenberg 1990). Early research has found out that there is quite a
close correlation between patent count and input to knowledge creation activities,
i.e. R&D input, and using patent counts as a metric offers important insights when
used in conjunction with other information (Lin & Cao 2012). Adelman &
DeAngelis (2007) show that patenting in general, continuous growth in patent
applications, or the infusion of new patent owners do not affect innovation
adversely; these findings are consistent with existing social science survey data
indicating that patents are not interfering with scientists’ research work. Hence,
managers, policymakers, and researchers regularly use the number of patent filings
as an indicator of innovative activity in the organization (Jell 2011: 15).
As already suggested by other researchers, patent analysis can only be of
assistance when data is examined from various angles. Undoubtedly, reliance on
patent counts as the sole metric would eventually lead into trouble, since a
97
company’s number of patent applications is a noisy measure which is at least
equally dependent on the company’s patent filing strategy as it is on the actual scale
of inventive activity within the organization (Jell 2011). Consequently, scientists
are forced to develop new and more accurate strategies for assessing the impacts of
patents on knowledge creation and innovation, which could entail, for instance,
conducting detailed case studies using random samples of patents taken from
carefully specified research domains (Adelman & DeAngelis 2007). One approach
to mining more robust information from patent data is to incorporate the number of
citations into the analysis.
After the disclosure of a patent, its true relevance and importance can only be
seen after other scientists and organizational entities have had time to react to the
new invention. Most interestingly, as the patent grows older, it will probably attract
a certain amount of patent citations, from which indexes like the relative citation
ratio can be constructed (Lin & Cao 2012). The identification numbers of the
previous patents on which the invention builds are clearly listed in each new patent
document.
A high number of citations and referrals to a patent document by consecutive
patents demonstrates its significance to the industry. Furthermore, according to
Ernst (1998), a high patent citation ratio indicates a vital economic importance for
the particular knowledge creation activities that resulted in the patented invention.
Besides patent data, the bibliometric analysis of peer-reviewed publications has
been proposed as alternative metrics to measure research output and technological
advancement in a given industry (Hughes-Hallett et al. 2014).
The third commonly used index for patent analysis combines the two formerly
presented measures together, namely by weighing the patent count based on the
relative citation ratio (Lin & Cao 2012). The research of Hall et al. (2000) finds
that the performance of knowledge creation activities in an organization may be
better explained and evaluated with the help of weighed patent counts, and
empirical research in the automotive industry finds that the index of citation
weighed patents demonstrates the value of an invention and the effectiveness of
innovation activities relatively accurately.
In order to evaluate whether an index, a ratio, or a count accurately describes
value creation and inventive activities, one needs to develop criteria for evaluating
the robustness of selected metrics. According to Lin & Cao (2012), two key aspects
need to be examined: first, the correlation between the index and the input of
knowledge creation activities, and second, the correlation between the index and
the output of knowledge creation activities. In this respect, the output of knowledge
98
creation activity commonly refers to the performance of the R&D organization, as
the aim of innovation generally is clearly to enhance the performance or the
profitability of the company.
Patent data has been applied as a means for measuring and comparing R&D
activities across nations, industries, and companies, and patent information has an
increasing value for companies during the whole technology management process
starting from idea generation and technology creation up to technology usage
(Teichert & Ernst 1999, Ernst 2003). The difficulty in all types of patent data
analyses lies in the fact that hundreds or even thousands of patents must be read
and analyzed to extract meaningful information for decision-making and for
facilitating the development of technologies and product ideas (Siwczyk &
Warschat 2011). Suominen et al. (2017) show that unsupervised machine learning
can be a powerful tool in reducing the amount of work and the complexity
associated with patent data analysis. Illustrating the results of the patent data
analysis process is also a challenging task in itself, but can be assisted by employing
similarly systematic visualization tools (Kim et al. 2008).
Short-term product technology monitoring
Several methods of technology monitoring are also based on patent information,
although the important time lag between patent disclosure and market launch, as
touched upon before, is volatile due to various factors. Gerken et al. (2014) have
analyzed this time lag in the field of automotive engineering and have concluded
that it has a major influence on manufacturers as they have to identify technological
change early enough to allow for a corresponding reaction. Hence, patents are a
valuable source of information in short-term product technology monitoring; a
view that has been shared by a number of researchers (Ernst 1997, Yoon & Park
2004, Tseng et al. 2007). However, as Gerken et al. (2014: 287) put it, “analyzing
patents in the context of product technologies and reacting to emerging products is
a race against time”. Several patent-based methods for technology-oriented
monitoring have already been introduced: the analysis of patent counts and their
dynamics (Fendt 1988, Haupt et al. 2007), different types of co-occurrence analysis
(Engelsman & van Raan 1994), citation analysis (Dahlin & Behrens 2005), and the
analysis of textual elements of patents (Kim et al. 2008, Choi et al. 2011), for
instance.
99
Besides technology monitoring, patents are often considered to be a good
information source for forecasting and anticipating prospective products,
reinforced by the fact that a positive correlation between patents and product
announcements has been found (Artz et al. 2010). Here, the usefulness of patent
information for anticipating new products depends on the precondition that
technologies occur in the patent literature before the technology is successfully
introduced in the market, as patents would not otherwise represent an adequate
source of information for the purpose of product anticipating. This point applies to
the relationship between patent filing and market launch (Gerken et al. 2014).
According to patent law, a patent has to be filed before an invention is used in order
to conform to the criteria of novelty (Mohr 2001).
Because of the significance of the timing of patents, several studies focus on
investigating the time lags associated with patents (Gerken et al. 2014). The time
line of introducing a technology to the market commonly used by these studies was
originally suggested by Granstrand (2000), who identified several significant points
in time within a broadly defined product life cycle, differentiating among technical,
commercial, and economic success. Technical success is achieved when technical
specifications have been met or an invention has been made, and is indicated by
the filing of a patent, whereas a commercial success is signified by the initial
commercial application of the technology, and an economic success by an
acceptable return on the total investment, requiring the attainment of a breakeven
at the least.
Gerken et al. (2014) have built upon this time line model by recognizing two
further important points in time concerning patents and technology: the market
launch date and the patent disclosure date. The market launch can be measured
sooner than commercial success, and represents a significant point in time, as the
inventing organization has the opportunity to capitalize on first-mover profits and
establish first-mover advantages in its wake. On the other hand, from a competitor’s
point of view, the contained technological knowledge changes from tacit to explicit
knowledge on the date of a patent’s disclosure, and, hence, the earliest date on
which a technology can be identified in the patent literature is the day of its
disclosure. Based on an extensive analysis of selected patents, Gerken et al. (2014:
297–298) conclude that patents are a useful information source for anticipating
perspective technologies and products. Furthermore, they (Gerken et al. 2014: 298)
highlight several important findings concerning patents as a source for information,
which are presented in Table 23.
100
Table 23. Findings on patents as an information source.
Number Finding
1 Patent data is extensive enough to identify patents that strongly resemble product innovations.
2 Patents provide information about new technologies before market launch takes place.
3 The time lag between patent disclosure and market launch differs across technologies and is
also affected by
4 the type of technology,
5 the maturity level, and
6 the complexity and companies’ strategic patenting behavior
7 in view of patent scope and in view of the PCP.
An automotive case to the research conducted by Gerken et al. (2014) is provided
by van den Hoed (2005), who studied the filing dates and quantities of fuel cell
technology-related patents and attempted to project the commercialization of fuel
cell vehicles (FCVs) and evaluate automobile manufacturers’ commitment to
bringing them to market. In this respect, the great amount of fuel cell patents filed
by the automotive industry reflects the manufacturers’ efforts to develop the
necessary competences for developing FCVs. However, an active rate of patent
filing does not by itself directly reflect commitment to start selling fuel cell cars to
customers in the near future. Furthermore, according to van den Hoed (2005: 269–
270), building up manufacturing capabilities for FCVs requires massive amounts
of resources; automotive organizations have not yet been forced to make decisions
concerning FCVs, as the prototypes and limited amount of sold FCVs are made in
small series without large investments. The real commitment to commercialize
FCVs can be assessed only when the hard decisions for manufacturing must be
made.
It must be noted that, especially in the fuel cell example, a great deal of efforts
by OEMs are explained by risk reduction and a copying behavior, which is typical
in the automotive industry and leads to companies choosing to develop
technologies proposed by automotive opinion leaders or rival manufacturers (van
den Hoed 2005). Hence, the current strategies—including patent strategies—of
most automobile manufacturers can be characterized as risk-reducing and
defensive rather than offensive, which becomes increasingly obvious when market-
focused decisions will have to be made.
The automotive industry employs a similar dual strategy towards regulators.
On the one hand, OEMs are actively developing technological alternatives to the
internal combustion engine, and on the other hand, the zero-emission vehicle

101
regulation is scrutinized as being unattainable and economically unviable, leading
to higher costs for the consumer (van den Hoed 2005: 270). Furthermore,
automotive companies’ accelerated research to improve the environmental
performance of internal combustion engines indicates an effort of manufacturers to
preempt stringent regulation, thereby preventing a shift from traditional engines to
more environmentally friendly or zero emission technologies.
As a manufacturing sector, the automotive industry enjoys a high probability
of being able to conduct patent analysis successfully due to various factors: first,
the forecasting accuracy of the sector is relatively high, offering an advantage of
using patent analysis; second, the information of issued patents here is more
suitable to project their implications on the whole industry; third, the time gap
between R&D investment and patent application makes patent-based forecasting
more accurate; and fourth, the time lag distribution helps evaluate patent value
more realistically, adjusting the count of citation (Yoon & Lee 2008: 5).
This section, along with previous sections 3.1, 3.2, and 3.3, has thoroughly
discussed potential metrics relevant to measuring the effectiveness of systematic
idea generation. Extensive studies conducted by various researchers, especially
Shah et al. (2003), Vargas-Hernandez et al. (2010), and Puccio & Cabra (2012),
form the common viewpoint that although creative idea generation is seen as a
process with many intangibles, it can be measured with certain carefully selected
quantitative value creation metrics. Consequently, it can be stated that this chapter
covers the central branch of research on the measurement of systematic idea
generation processes, and enough information has been gathered from the scientific
literature for the purposes of this dissertation. The following section draws the
theoretical part of this dissertation to a conclusion and answers to the first research
question.
3.5 Answer to the first research question
Based on the contributions and findings made in previous sections, this section
provides an answer to the first research question: “How, if at all, is it possible to
define quantitative value creation metrics that measure the effectiveness of a
systematic idea generation process?” First, creativity was conceptualized as the act
of purposely making new and valuable ideas and products while combining the
elements of novelty and usefulness in order to address a problem in an original and
outside-the-box manner (Pepels 2003, Martin 2007, Oman et al. 2013). Idea
generation is usually positioned within this frame, although it merely represents
102
two of the seven steps of a complex cognitive process known as creative process
(Puccio & Cabra 2012, Shewfelt 2012). It is important to distinct idea generation
from the broader concept of innovation that comprises not only idea generation but
also the intentional introduction and application of new, more optimal procedures
(King 1992). Furthermore, the ultimate goal of systematic idea generation is to
produce as many ideas as possible to provide an optimal solution to unresolved or
inadequately resolved customer problems (Kromer 2008). This notion has
significant implications on this study when discussing the value creation of an idea
generation process and how to measure it.
Second, Hubbard (2010) encouraged the measurement of processes that are
seemingly immeasurable, pointing out that, first, if the examined intangible’s
characteristics are well-known, it can be measured, and, second, a mere reduction
of uncertainty by quantitative means qualifies as a measurement. Consequently, it
was discovered that the key criteria for any quantitative measurement model consist
of objectivity and inter-subjectivity, where objectivity refers to a sufficient stability
of the measured process and to limiting the effects of the environment, and inter-
subjectivity to the public interpretability for the measurement results.
Third, Shah et al. (2003) argue that there are in essence two ways to measure
the value creation that takes place in systematic idea generation: process-based
metrics assess the creative process, whereas outcome-based metrics evaluate the
output of idea generation, i.e. the ideas created. Due to the complexity in using
process-based approaches (Shah et al. 2003), this study focuses on outcome-based
metrics. Such measures include, for example, the number of new product ideas per
dollar (Janssen et al. 2011), the quality and novelty of generated ideas (Vargas-
Hernandez et al. 2010), the count of patents (Thomas & McMillan 2001), and so
forth.
Fourth, specifically with regard to patents, one must exercise great care when
analyzing the effectiveness of idea generation, as many quantitative metrics are
difficult to interpret and may not necessarily fulfill the criteria of objectivity and
inter-subjectivity (Adelman & DeAngelis 2007). Building on findings from the
literature research, a range of requirements, criteria, and guidelines have been set
for the measurement model to be designed and constructed within the frame of this
doctoral research.
It was discovered that the most successful models for measuring creativity
focus on outcome-based value creation metrics, consider the definitions and
characteristics of creativity and idea generation, and utilize measures that meet the
103
criteria of objectivity and inter-subjectivity. Thus, as creativity culminates in new
and useful ideas designed to satisfy a need, and the goal of systematic idea
generation is to produce a great number of such ideas in the shortest time possible,
it becomes obvious that value creation metrics for idea generation should produce
knowledge that reflects how well the given idea generation process fulfills the
requirements and responds to the specified need. Additionally, authors such as
Shah et al. (2003), Nelson et al. (2009), and Vargas-Hernandez et al. (2010) have
managed to design solid and robust value creation metrics for creative idea
generation, which have been adopted by subsequent studies.
It can be concluded, then, that systematic idea generation effectiveness can be
measured with quantitative metrics, provided that the defined metrics fulfill the pre-
set requirements that ensure the validity of the measurement and increase the
acceptance of the proposed measures in the scientific community. Nevertheless,
previous studies have failed to combine the monetary factor of evaluation to their
measurement models, instead providing metrics that rely for the large part on
information that includes rich subjective input. To address this, the remaining part
of this thesis focuses mainly on designing, implementing, and experimenting with
a measurement model that expands the knowledge of creativity measurement by
allowing organizations to approximate the effectiveness of their idea generation
processes with widely used and easy-to-understand financial quantitative metrics.

104
105
4 Defining a model for measuring idea generation effectiveness
This chapter concentrates on applying the Goal Question Metric (GQM) approach
to identify measures that fulfill the theoretical requirements set in Chapter 3 and,
consequently, constructing a model for measuring the effectiveness of idea
generation. The defined metrics are then examined during the empirical research
not only to provide a factually proven statement on the effectiveness of the case
organization’s systematic idea generation process but also to validate the utility of
the proposed value creation metrics.
The chapter is divided to two major parts, the first of which is concerned with
description and summary of a quantitative measurement model that allows for the
quantitative evaluation of the case organization’s process. The objectives of this
process are presented and broken down into several key questions, for the
answering of which a series of performance indicators are proposed. As a result,
the GQM-based measurement model for empirical research is constructed and
summarized. The model is extensively utilized in the second part of the chapter
when the data dictated by the indicators is collected in practice and the current
status of the case organization is analyzed. This exercise does not only give a
statement of the case organization’s state of affairs in terms of effectiveness but
also draws conclusions on the applicability of the proposed value creation metrics:
giving hints on what measures could be used in the future and making a
contribution to scientific knowledge in the field of innovation and creativity
research. Finally, section 4.3 considers all findings that have emerged during
empirical studies and based on them formulates an answer to the second research
question.
Fig. 7 summarizes the main contents of Chapter 4 and presents the general
outline of the empirical part of the research structure. It must be noted, that although
the discussion on future value creation metrics for systematic idea generation is
included in the figure, it is actually native to Chapter 5, which discusses the
probable development trajectories of idea generation effectiveness measurement
based on the findings of this case study.
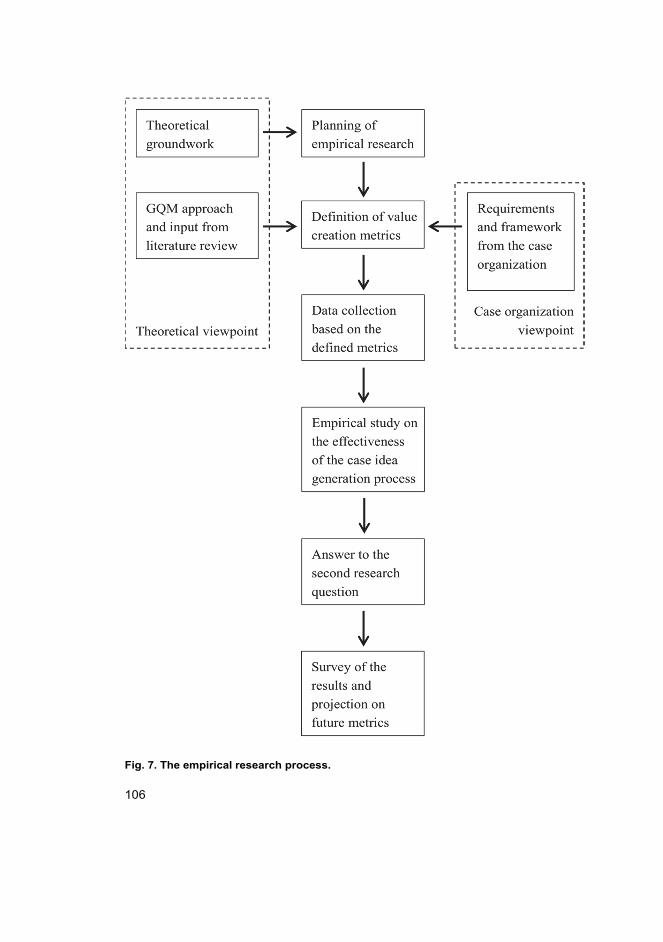
106
Fig. 7. The empirical research process.
107
4.1 Value creation metrics in the case organization
The case organization sees innovation and creativity commonly as intangible and
unforeseeable processes, during which it is difficult to retrieve interim results and
approximate progress and development. Correspondingly, the case organization
struggles with measuring the efficiency and effectiveness of its systematic idea
generation process and with demonstrating the value creation and contribution of
the process to other suborganizations in the parent company. More specifically,
quantitative performance indicators that would describe the value creation of the
case organization’s process in monetary terms are not in place. Yet, such metrics
represent the most understandable and convincing means of communicating results
to external parties, as they leave little to no room for personal interpretation.
Consequently, for the sake of objectivity and accuracy, human judgment-based and
other qualitative metrics are mostly neglected when conducting empirical research.
As the case organization has recently initiated a patent harnessing process to
enhance value creation and monitoring, it makes sense to take advantage of it when
measuring the performance of systematic ideation. Patents not only fittingly match
the framework for high-quality ideas—as discussed in section 3.4—but also in
effect constitute the ultimate output of creative activities. Additionally, as pointed
out in section 2.1, the case organization employs an analytical and scientific and
technology-based idea generation process, which by definition is geared towards
producing technological innovations (Parrilli & Heras 2016). Hence, this study
concentrates on patent information when determining the effectiveness of the case
organization’s process, even though not all types of creative ideas are patentable,
not even if they are otherwise of high quality.
The foundation for an empirical study of the case organization’s performance
is established through a detailed scrutiny of the structure and phases of the case
organization’s idea generation process, which in turn enables the identification of
data sources that provide quantifiable findings for numerical study. The following
two sections examine the systematic idea generation process and the patent
harnessing process, paving the way towards a well-founded estimation of the case
organization’s value creation based on quantitative and transparent performance
indicators.
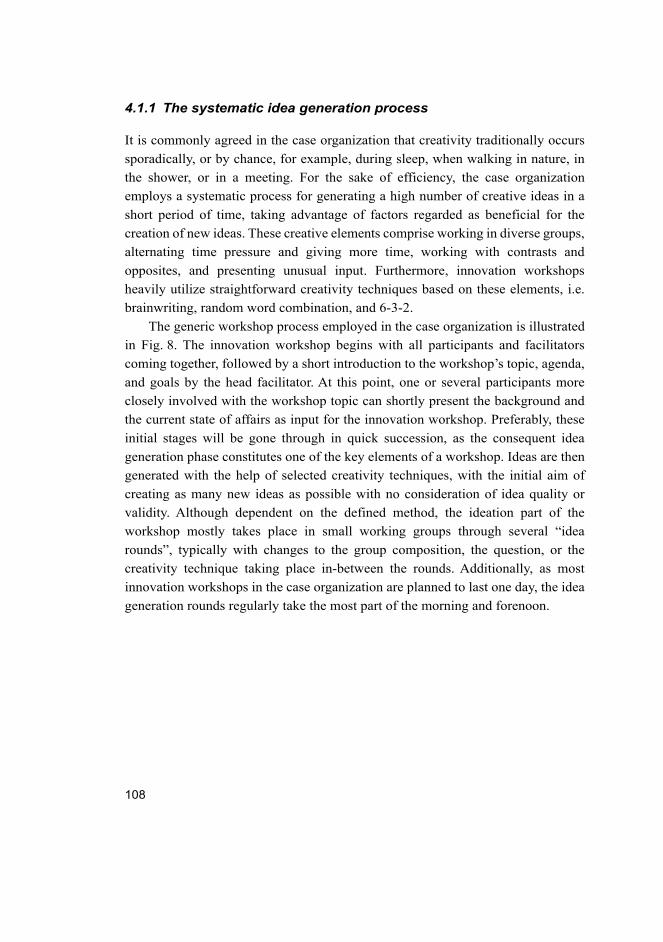
108
4.1.1 The systematic idea generation process
It is commonly agreed in the case organization that creativity traditionally occurs
sporadically, or by chance, for example, during sleep, when walking in nature, in
the shower, or in a meeting. For the sake of efficiency, the case organization
employs a systematic process for generating a high number of creative ideas in a
short period of time, taking advantage of factors regarded as beneficial for the
creation of new ideas. These creative elements comprise working in diverse groups,
alternating time pressure and giving more time, working with contrasts and
opposites, and presenting unusual input. Furthermore, innovation workshops
heavily utilize straightforward creativity techniques based on these elements, i.e.
brainwriting, random word combination, and 6-3-2.
The generic workshop process employed in the case organization is illustrated
in Fig. 8. The innovation workshop begins with all participants and facilitators
coming together, followed by a short introduction to the workshop’s topic, agenda,
and goals by the head facilitator. At this point, one or several participants more
closely involved with the workshop topic can shortly present the background and
the current state of affairs as input for the innovation workshop. Preferably, these
initial stages will be gone through in quick succession, as the consequent idea
generation phase constitutes one of the key elements of a workshop. Ideas are then
generated with the help of selected creativity techniques, with the initial aim of
creating as many new ideas as possible with no consideration of idea quality or
validity. Although dependent on the defined method, the ideation part of the
workshop mostly takes place in small working groups through several “idea
rounds”, typically with changes to the group composition, the question, or the
creativity technique taking place in-between the rounds. Additionally, as most
innovation workshops in the case organization are planned to last one day, the idea
generation rounds regularly take the most part of the morning and forenoon.
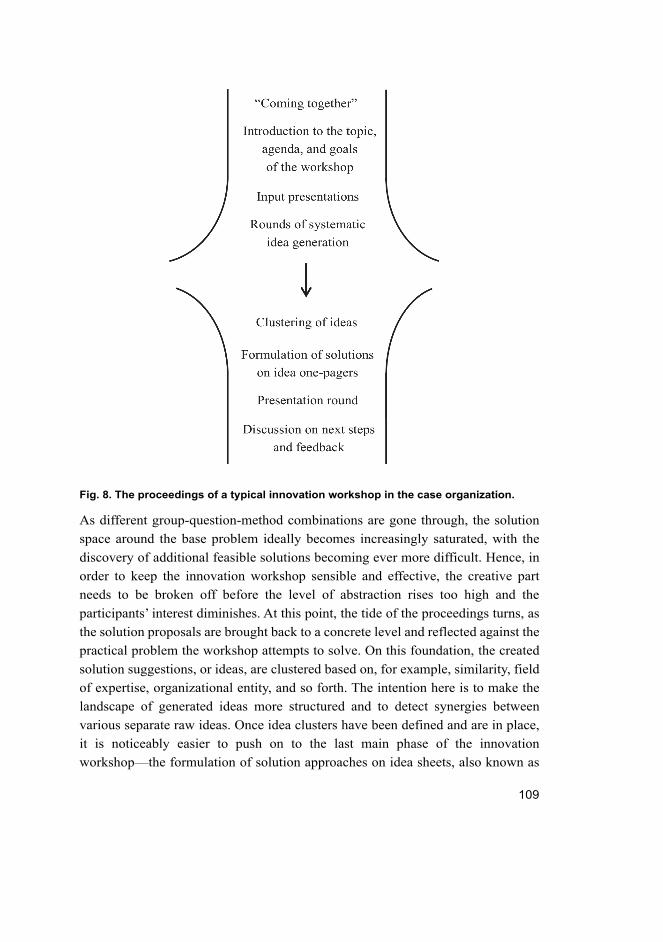
109
Fig. 8. The proceedings of a typical innovation workshop in the case organization.
As different group-question-method combinations are gone through, the solution
space around the base problem ideally becomes increasingly saturated, with the
discovery of additional feasible solutions becoming ever more difficult. Hence, in
order to keep the innovation workshop sensible and effective, the creative part
needs to be broken off before the level of abstraction rises too high and the
participants’ interest diminishes. At this point, the tide of the proceedings turns, as
the solution proposals are brought back to a concrete level and reflected against the
practical problem the workshop attempts to solve. On this foundation, the created
solution suggestions, or ideas, are clustered based on, for example, similarity, field
of expertise, organizational entity, and so forth. The intention here is to make the
landscape of generated ideas more structured and to detect synergies between
various separate raw ideas. Once idea clusters have been defined and are in place,
it is noticeably easier to push on to the last main phase of the innovation
workshop—the formulation of solution approaches on idea sheets, also known as
110
one-pagers, combining elements of one or several raw ideas that were generated
earlier.
The formulation of one-pagers embodies no creative effort as such but is still
a vital step, since the idea sheets represent the final outcome of the innovation
workshop and are the outputs that third parties, such as senior managers, will most
probably review and evaluate. Moreover, even if a raw idea is only directly
translated into a one-pager, it still must be thought through and examined more
closely in order to produce a detailed description of the suggested solution. This
method of working is not completely alien to state-of-the-art knowledge of idea
generation processes: Salminen (2015) found out in his research that innovation
communities employ a similar kind of “concept form” to give hints on what is
expected from the concept and which factors must be considered.
Once the idea one-pagers have been filled by small working groups, all ideas
are shortly presented to the entire participant group so that everyone is aware of
what each small group or team worked on during the workshop. The workshop is
concluded with a presentation round, a swift feedback survey, and a discussion
about the next steps or the actions to be taken after the workshop by each party.
Aside from the central and integral components of an innovation workshop, a
great deal of the case organization’s work takes place outside the workshops. One
could even argue that the most critical stages of the systematic idea generation
process take place after or, more significantly, before the innovation workshop.
The preparation for an innovation workshop is a continuous process
comprising background research, input preparation, participant and expert selection,
ordering material, and booking facilities, to name a few activities. Correspondingly,
the workshop plan, or “manuscript”, is laid out, describing the core components
and time blocks of the workshop, i.e. input presentations, group works, lunch and
coffee breaks, presentation rounds, and clustering blocks. The manuscript also
offers assistance and a common guideline for the team organizing the event, for
most innovation workshops employ several facilitators at the same time. These co-
facilitators bring structure to the topical discussions taking place in each working
group in the workshop, thus providing an effort that is critical for the success of the
workshop. Yet, the co-facilitators are seldom deeply involved in the designing the
flow of the workshop, as the workshops are mostly planned only by the main
facilitator or facilitators together with the ordering client.
The actions taken after the event are equally fundamental from the parent
company’s perspective. While the case organization is not actively involved in
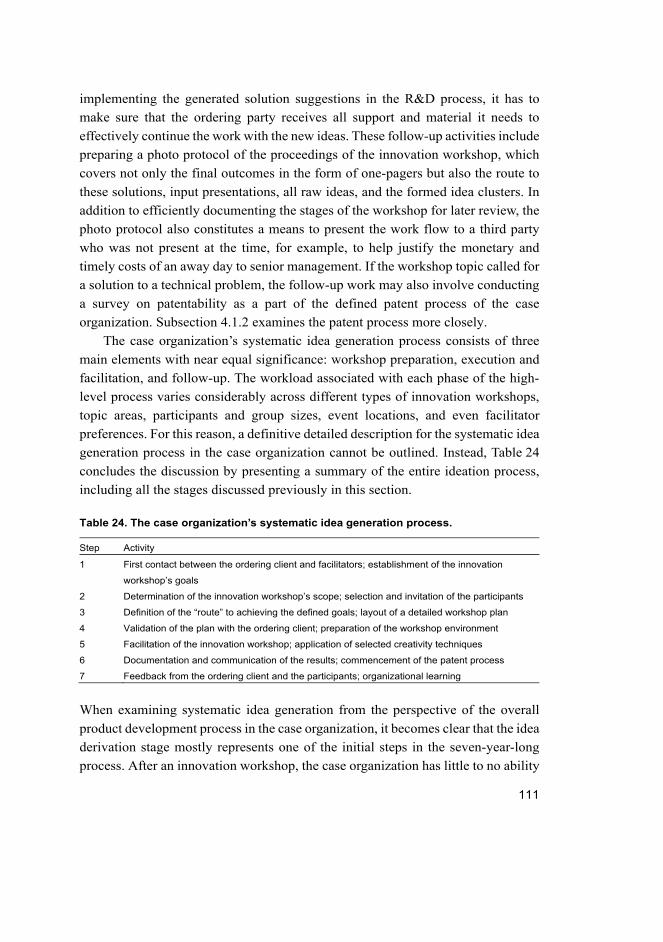
111
implementing the generated solution suggestions in the R&D process, it has to
make sure that the ordering party receives all support and material it needs to
effectively continue the work with the new ideas. These follow-up activities include
preparing a photo protocol of the proceedings of the innovation workshop, which
covers not only the final outcomes in the form of one-pagers but also the route to
these solutions, input presentations, all raw ideas, and the formed idea clusters. In
addition to efficiently documenting the stages of the workshop for later review, the
photo protocol also constitutes a means to present the work flow to a third party
who was not present at the time, for example, to help justify the monetary and
timely costs of an away day to senior management. If the workshop topic called for
a solution to a technical problem, the follow-up work may also involve conducting
a survey on patentability as a part of the defined patent process of the case
organization. Subsection 4.1.2 examines the patent process more closely.
The case organization’s systematic idea generation process consists of three
main elements with near equal significance: workshop preparation, execution and
facilitation, and follow-up. The workload associated with each phase of the high-
level process varies considerably across different types of innovation workshops,
topic areas, participants and group sizes, event locations, and even facilitator
preferences. For this reason, a definitive detailed description for the systematic idea
generation process in the case organization cannot be outlined. Instead, Table 24
concludes the discussion by presenting a summary of the entire ideation process,
including all the stages discussed previously in this section.
Table 24. The case organization’s systematic idea generation process.
Step Activity
1 First contact between the ordering client and facilitators; establishment of the innovation
workshop’s goals
2 Determination of the innovation workshop’s scope; selection and invitation of the participants
3 Definition of the “route” to achieving the defined goals; layout of a detailed workshop plan
4 Validation of the plan with the ordering client; preparation of the workshop environment
5 Facilitation of the innovation workshop; application of selected creativity techniques
6 Documentation and communication of the results; commencement of the patent process
7 Feedback from the ordering client and the participants; organizational learning
When examining systematic idea generation from the perspective of the overall
product development process in the case organization, it becomes clear that the idea
derivation stage mostly represents one of the initial steps in the seven-year-long
process. After an innovation workshop, the case organization has little to no ability
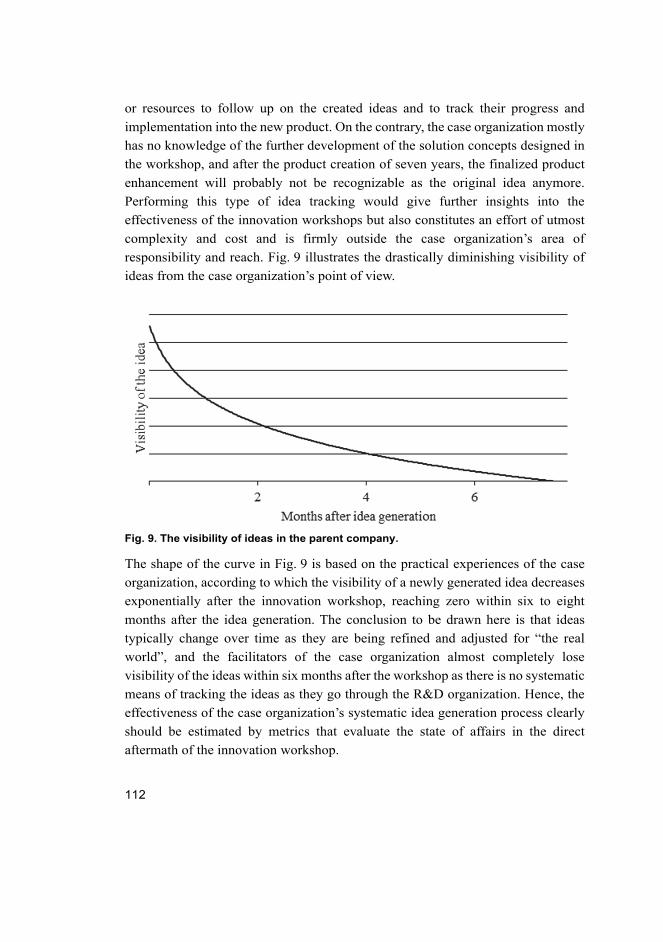
112
or resources to follow up on the created ideas and to track their progress and
implementation into the new product. On the contrary, the case organization mostly
has no knowledge of the further development of the solution concepts designed in
the workshop, and after the product creation of seven years, the finalized product
enhancement will probably not be recognizable as the original idea anymore.
Performing this type of idea tracking would give further insights into the
effectiveness of the innovation workshops but also constitutes an effort of utmost
complexity and cost and is firmly outside the case organization’s area of
responsibility and reach. Fig. 9 illustrates the drastically diminishing visibility of
ideas from the case organization’s point of view.
Fig. 9. The visibility of ideas in the parent company.
The shape of the curve in Fig. 9 is based on the practical experiences of the case
organization, according to which the visibility of a newly generated idea decreases
exponentially after the innovation workshop, reaching zero within six to eight
months after the idea generation. The conclusion to be drawn here is that ideas
typically change over time as they are being refined and adjusted for “the real
world”, and the facilitators of the case organization almost completely lose
visibility of the ideas within six months after the workshop as there is no systematic
means of tracking the ideas as they go through the R&D organization. Hence, the
effectiveness of the case organization’s systematic idea generation process clearly
should be estimated by metrics that evaluate the state of affairs in the direct
aftermath of the innovation workshop.
113
As a large industry-leading corporation, the parent company’s product creation
process is one of high complexity and consists of multiple levels. This has the side
effect of the case organization having to cooperate with various parts of the parent
company to fulfill its purpose as a CoC for creativity techniques and innovation
workshop facilitation. The organizational entities closest to the case organization
are, on the one hand, predevelopment, the strategy department and management,
and, on the other hand, manufacturing and marketing. This is because even though
idea generation and creativity are mostly required in the early stages of product
development in an ideal process flow, inefficiencies usually related to production
and costs are often discovered downstream, which necessitates the prompt
determination of an action plan to eliminate these issues. Respectively, the first
scenario is concerned with looking for and generating product innovations in
predefined areas, whereas the second typically refers to remodeling and
reorganization of processes, components, and people to pursue efficiency and
reduce costs.
To illustrate the value creation driven by the case organization within the parent
company, it could be intriguing to look at the product creation process with and
without the input provided by systematic idea generation. This would assist in
identifying the exact contribution of the case organization to the wider process.
Nevertheless, as multiple PCPs are running simultaneously in various cycle phases
across the parent company separately for every product range, describing the
influence of the case organization’s ideation process on the entire range of
processes represents an extremely difficult and complex task. Additionally, one
would not be able to draw conclusions on quantitative data based on this process
view, as it would probably be mostly qualitative in nature. Therefore, this study
concentrates on other quantifiable metrics for idea generation, and this viewpoint
remains a topic to be clarified by future research.
A number of measures fundamental to evaluating the performance of a creative
process stem directly from the case organization’s systematic idea generation
process. The number of ideas produced, innovation workshops facilitated, and
people who participated in them are some examples of these. Such basic metrics
add no significant dimension to measurement theory considering inventive
outcomes but instead lay the groundwork for more deep-level analyses on value
creation. Accordingly, the case organization’s patent harnessing process and its
potential regarding value creation metrics are discussed in the following section.
114
4.1.2 The patent harnessing process
For several years, the case organization has considered the question: how does one
know whether the idea generation process is working effectively or not? As the case
organization’s parent company implements a structured intellectual property
strategy and properties such as trademarks and patents play an important role in the
industry, it was decided that the case organization should establish a “patent
harnessing process” to realize the commercial potential of innovation workshops.
Other than leading to a higher number of invention disclosures for the company,
this process also provides a quantifiable and robust means to assess the quality of
the ideas coming out of the idea generation process. As pointed out in section 3.4,
an invention can be accepted as a patent if it meets the criteria of utility, novelty,
and nonobviousness (Mohr 2001). These criteria are regarded as common
characteristics of universally good ideas—with the possible exception of
nonobviousness, as industrial companies are indifferent to ideas being obvious as
long as they are new and useful. More specifically, patent criteria can be utilized as
a fact-based quantitative measure of an idea’s quality, and patent data could thus be
used as a metric for measuring systematic idea generation effectiveness. The case
organization additionally received complaints from workshop participants on the
difficulty involved with submitting invention disclosures on the ideas generated in
an innovation workshop.
For the above reasons, the case organization initiated a patent harnessing
process (see its initial outline in Fig. 10) to be conducted in conjunction with
topically suitable innovation workshops, often concerned with technical problem-
solving and new product features. The goal of the process is to reflect the ideas that
have been freshly generated in innovation workshops against patent criteria and
discover how many of the solution suggestions fulfill those requirements. The idea
evaluation is conducted through an online questionnaire administered to workshop
participants, consisting of three main questions: how much emphasis should be
placed on pursuing the idea, is the idea patentable, and who were involved in
creating the idea? As an outcome of the survey, the case organization does not only
gather data on the perceived quality of the ideas but is also able to produce a
preliminary ranking of the suggested solutions and approximate the productivity of
the innovation workshop by considering the total number of inventions seen as
patentable by the participants. Table 25 provides empirical data from a selection of
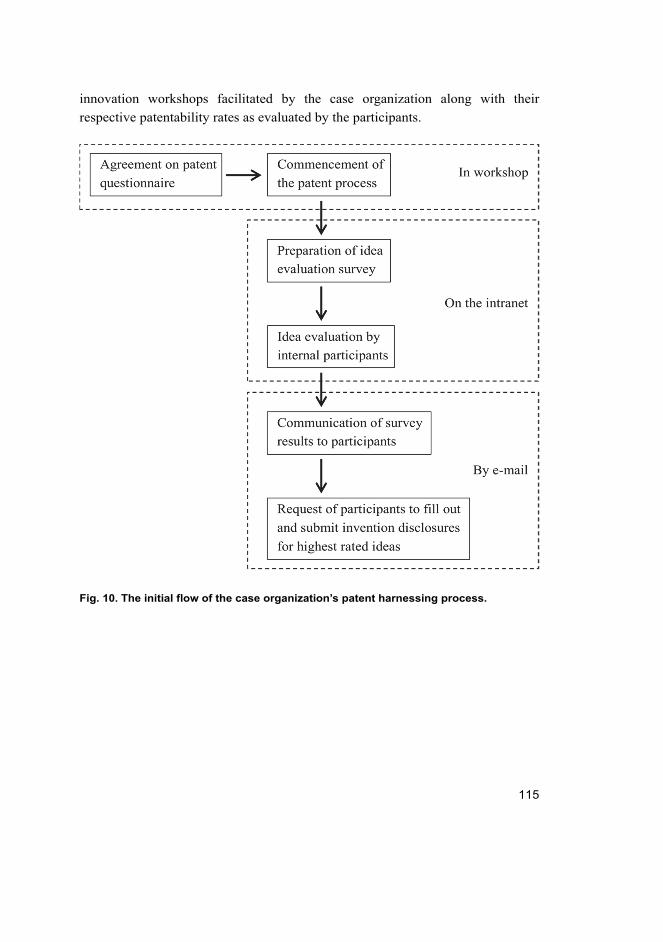
115
innovation workshops facilitated by the case organization along with their
respective patentability rates as evaluated by the participants.
Fig. 10. The initial flow of the case organization’s patent harnessing process.
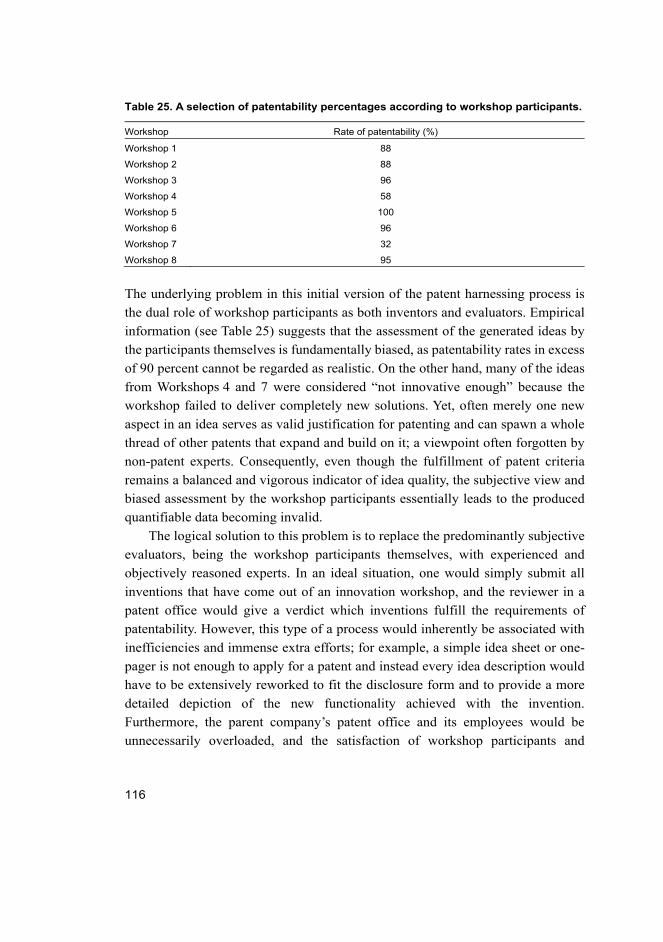
116
Table 25. A selection of patentability percentages according to workshop participants.
Workshop Rate of patentability (%)
Workshop 1 88
Workshop 2 88
Workshop 3 96
Workshop 4 58
Workshop 5 100
Workshop 6 96
Workshop 7 32
Workshop 8 95
The underlying problem in this initial version of the patent harnessing process is
the dual role of workshop participants as both inventors and evaluators. Empirical
information (see Table 25) suggests that the assessment of the generated ideas by
the participants themselves is fundamentally biased, as patentability rates in excess
of 90 percent cannot be regarded as realistic. On the other hand, many of the ideas
from Workshops 4 and 7 were considered “not innovative enough” because the
workshop failed to deliver completely new solutions. Yet, often merely one new
aspect in an idea serves as valid justification for patenting and can spawn a whole
thread of other patents that expand and build on it; a viewpoint often forgotten by
non-patent experts. Consequently, even though the fulfillment of patent criteria
remains a balanced and vigorous indicator of idea quality, the subjective view and
biased assessment by the workshop participants essentially leads to the produced
quantifiable data becoming invalid.
The logical solution to this problem is to replace the predominantly subjective
evaluators, being the workshop participants themselves, with experienced and
objectively reasoned experts. In an ideal situation, one would simply submit all
inventions that have come out of an innovation workshop, and the reviewer in a
patent office would give a verdict which inventions fulfill the requirements of
patentability. However, this type of a process would inherently be associated with
inefficiencies and immense extra efforts; for example, a simple idea sheet or one-
pager is not enough to apply for a patent and instead every idea description would
have to be extensively reworked to fit the disclosure form and to provide a more
detailed depiction of the new functionality achieved with the invention.
Furthermore, the parent company’s patent office and its employees would be
unnecessarily overloaded, and the satisfaction of workshop participants and
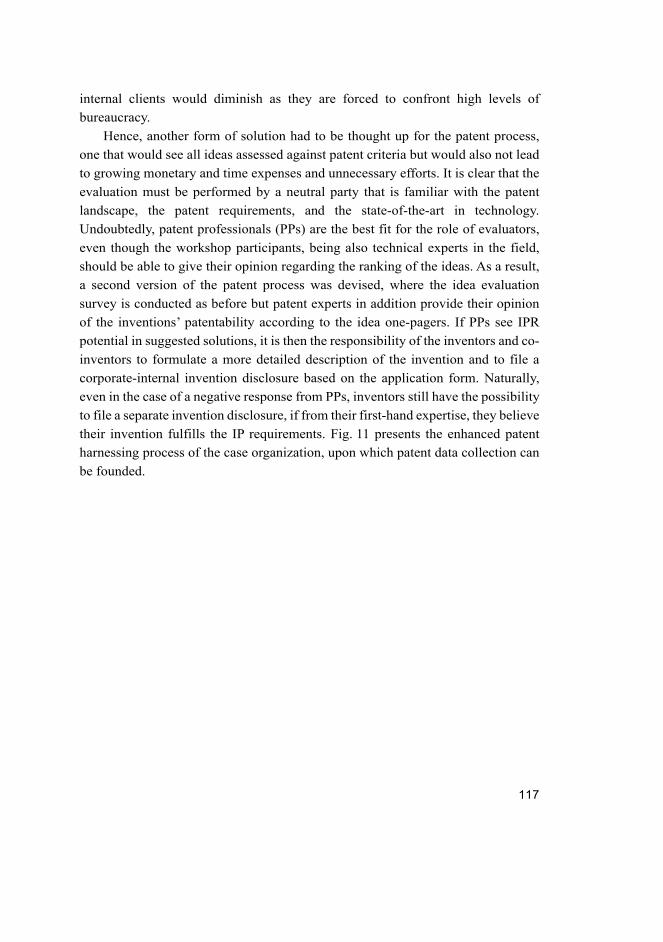
117
internal clients would diminish as they are forced to confront high levels of
bureaucracy.
Hence, another form of solution had to be thought up for the patent process,
one that would see all ideas assessed against patent criteria but would also not lead
to growing monetary and time expenses and unnecessary efforts. It is clear that the
evaluation must be performed by a neutral party that is familiar with the patent
landscape, the patent requirements, and the state-of-the-art in technology.
Undoubtedly, patent professionals (PPs) are the best fit for the role of evaluators,
even though the workshop participants, being also technical experts in the field,
should be able to give their opinion regarding the ranking of the ideas. As a result,
a second version of the patent process was devised, where the idea evaluation
survey is conducted as before but patent experts in addition provide their opinion
of the inventions’ patentability according to the idea one-pagers. If PPs see IPR
potential in suggested solutions, it is then the responsibility of the inventors and co-
inventors to formulate a more detailed description of the invention and to file a
corporate-internal invention disclosure based on the application form. Naturally,
even in the case of a negative response from PPs, inventors still have the possibility
to file a separate invention disclosure, if from their first-hand expertise, they believe
their invention fulfills the IP requirements. Fig. 11 presents the enhanced patent
harnessing process of the case organization, upon which patent data collection can
be founded.
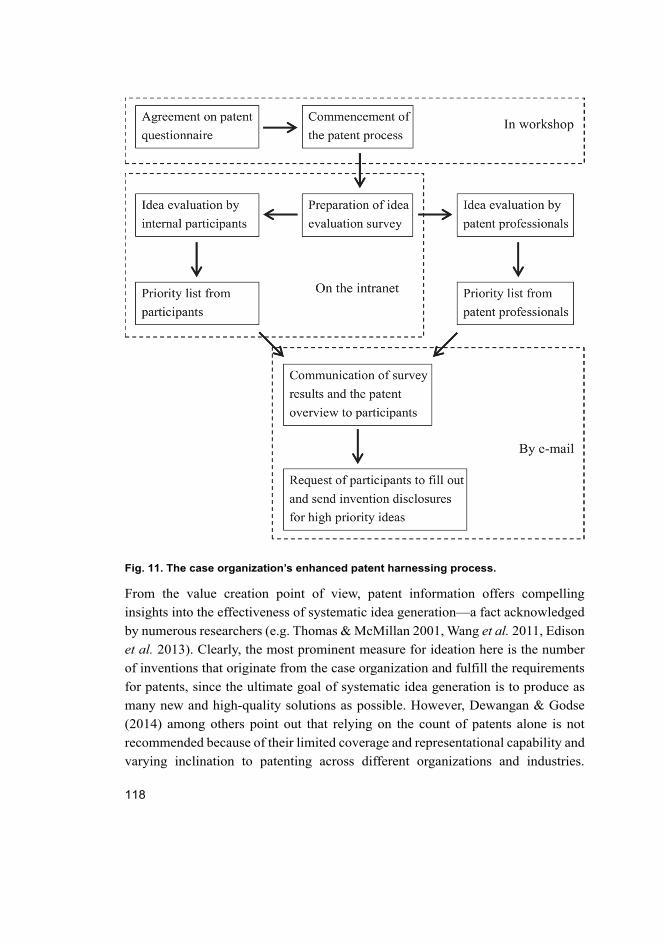
118
Fig. 11. The case organization’s enhanced patent harnessing process.
From the value creation point of view, patent information offers compelling
insights into the effectiveness of systematic idea generation—a fact acknowledged
by numerous researchers (e.g. Thomas & McMillan 2001, Wang et al. 2011, Edison
et al. 2013). Clearly, the most prominent measure for ideation here is the number
of inventions that originate from the case organization and fulfill the requirements
for patents, since the ultimate goal of systematic idea generation is to produce as
many new and high-quality solutions as possible. However, Dewangan & Godse
(2014) among others point out that relying on the count of patents alone is not
recommended because of their limited coverage and representational capability and
varying inclination to patenting across different organizations and industries.
119
Therefore, one should not consider patent data as a means to evaluate the
effectiveness of a company’s innovation activities but instead take advantage of the
universal nature of patent criteria to quantifiably assess the quality of ideas coming
out of a systematic idea generation process. In this case, as long as the patent
harnessing process is consistently performed across suited technical problem-
solving workshops, patent information provides an intriguing metric for
transparently evaluating the quality of generated ideas.
4.1.3 GQM-based definition of value creation metrics
The value creation metrics to be used for analyzing the effectiveness of the idea
generation and, by extension, patent harnessing processes of the case organization
are defined based on the GQM methodology, as presented by Basili et al. (1994)
and extensively discussed in Chapter 2. The case organization, as a corporate-
internal service provider for the systematic provocation for creativity, has the
ultimate aim of producing the largest amount of high-quality ideas possible at
minimum cost and timely expenses. This notion corresponds with the general
objective of idea generation according to the scientific literature, which is to
generate as many new ideas as possible to provide a solution (e.g. Kromer 2008,
Salminen 2015). This central goal can be further refined to a series of questions to
identify lower-level goals within the case process, as shown in Table 26.
Table 26. The goal and key questions to be used in defining value creation metrics.
Item Attribute Content
Goal Purpose
Issue
Object
Resource
Produce
the highest possible number of
high-quality ideas
at minimum cost and timely expenses.
Question 1 How can high-quality ideas be separated from ones of lesser quality in a
quantifiable fashion?
Question 2 How many high-quality ideas does the case organization produce?
Question 3 How do the financial and timely costs of producing high-quality ideas
relate to those of a comparable organization?
Question 4 What is the overall value contribution of the case organization?
The goal of the case organization has here been divided into four main elements,
and respective key questions have been formulated. First, as a baseline, it has to be
specified which ideas count as high-quality ideas. Second, the number of high-
120
quality ideas must be discovered. Third, the costs of producing those ideas are put
into perspective by comparing them against a comparable organization, namely the
parent company, to gain insights into the relative effectiveness of the case
organization. Finally, the overall production capability of the case organization is
examined by addressing both the direct and indirect outcomes of the systematic
idea generation process.
The questions will be discussed one after another to construct a measurement
model for the purposes of this research. With regard to the first question, it is clear
that ideas leading to invention notices and patents are in the overwhelming majority
of cases “better” than ideas without such aftereffects. Additionally, it was stated in
section 2.1 that the analytical science-based innovation process employed by the
case organization is mainly geared towards producing technological innovations
(Parrilli & Heras 2016). As technological innovations are generally patented, the
fulfillment of patent criteria is a fitting differentiator between high-quality ideas
and other ideas. Expert evaluations could also be used to evaluate the quality of
ideas—an approach preferred by numerous researchers—but this research focuses
on metrics of quantitative nature and thus avoids indicators with high subjective
input.
The above reasoning immediately leads to the emergence of two performance
metrics as an answer to the second question: the number of invention disclosures
and the number of patents coming out of the case organization. It must be noted
that the patent count-based evaluation is not based on the final acceptance of an
invention in a regional patent office but instead on the assessment and action of the
corporate-internal patent department that receives the invention notices for the
parent company. This is due to the immensely long lead times native to regional
patent offices across the globe and the respective timely inefficiencies associated
with using actual patents as a basis for quantitative evaluation.
The third key question has to do with cost-effectiveness and time-effectiveness.
To this effect, the above scrutiny on invention notices and patents opens interesting
possibilities for measurement. For instance, studying the amount of invested capital
and man-years in relation to the invention disclosures that have come out of the
idea generation process and comparing it to the respective numbers of the parent
company enables drawing conclusions on the relative idea generation process
performances of the two organizations. Similarly, instead of invention notices, the
number of patents, i.e. invention disclosures that have been accepted by the internal
patent office, can be considered to illustrate creative outcomes on a higher level.
121
These two value creation metrics provide an answer to the third key question
presented in Table 26 and deliver a further quantitative assessment of a creative
process’ effectiveness.
There are various ways to approach answering the fourth key question. An
obvious solution would be to take the indicators defined for previous questions and
handle the number of invention disclosures and patents as the definitive idea
generation output and the contribution of the case organization. However, it is not
at all certain that the ideas having gone through the patent harnessing process
represent all creative outcomes of an innovation workshop that fulfill patent criteria.
It is believed in the case organization that systematic idea generation workshops
are poised to have long-term effects on participants that only come into play after
the facilitated event. Correspondingly, one should take the indirect outcomes of
ideation into account. For example, it is foreseeable that innovation workshops
serve to activate and inspire participants, meaning that they continue to think about
possible solutions to the defined problem long after the workshop and may come
up with new ideas later on. For this reason, the high-quality outcomes of idea
generation, i.e. the number of invention disclosures, could be put on a time scale,
starting at the point of time when the workshop was held. Ideally, one would then
be able to identify not only the direct output of the systematic ideation process but
also the indirect advantages in the form of extra ideas by individual workshop
participants filed within a given period of time after the workshop. Additionally,
empirical data in the case organization suggests that certain workshop participants
are less willing to actively participate in discussing and refining the raw ideas
generated in a group work and instead make a habit of writing down topics and
inventive aspects for themselves so that they alone reap the benefits of those
particular ideas. By chronologically “tracking” innovative outputs, this sort of
behavior could be recognized more easily. In this manner, the researcher is able to
produce a graph illustrating the effect of a systematic innovation workshop on the
quantity of invention disclosures in the organization. Furthermore, this can be
examined on two separate levels: on the one hand, considering only the people that
participated in the workshop, and on the other, viewing the total chronological
curve of patent submissions to draw conclusions on the broader effects of an
innovation workshop.
In practice, as the patent harnessing process already takes all ideas that have
been documented as workshop conclusions into account, the focus of a time-based
analysis really must lie on inventions dealing with the topic of the respective
workshop but having not come out of the workshop in the same form as in the
122
invention disclosure. Yet, it is too costly to search for inventions in the company’s
IP pool based on topical keywords, as similar keywords may return inventions that
have little in common in terms of solution, and the person conducting the search
would require technical expertise in the respective technical field. On the contrary,
inventions should be looked for based on inventors’ names, as one can safely
assume that invention disclosures motivated by a certain workshop can only be
submitted by participants of that specific workshop.
Identifying the extent of the indirect outcomes of idea generation certainly
assists in evaluating the overall process outcome of the case organization. Still, one
could look towards answering the fourth key question from a financial point of
view, where the idea generation process simply receives capital and turns it into
another type of capital, which high-quality ideas are. Here the inventive values
discussed in Chapter 3 can be utilized to approximate the financial worth of the
output of the case process and average inventive values to estimate the monetary
worth of “good” ideas. In essence, a higher inventive value translates into a higher
usability of the invention and characterizes the scale and scope of the inventive step.
Accordingly, as per the definition by Schüll (2003), the nominal inventive value
must be multiplied by the added value provided by the invention, i.e. the number
of instances where the invention has actually been used to create value. In the case
organization, inventive values are calculated and determined for each invention
disclosure internally accepted by the parent company’s patent department. Thus, in
order to pinpoint the actual monetary worth of an invention, one has to discover the
quantity of installed units that incorporate the considered invention. For example,
a process improvement for the production line may be implemented only once in
the company but could still result in cost savings in excess of tens of thousands of
euros. In contrast, a product-related innovation probably only creates a value worth
of a few cents on its own but if integrated into a product portfolio offered in
different markets across the globe, the accumulated value provided by the invention
can easily reach that of a large process innovation.
Without doubt, the applicability of a creative idea across different product
groups and geological areas plays a key role in realizing the benefit of an invention.
At the same time, however, it is far too time-consuming and costly to find out and
document the potential use cases for every single invention from an organization’s
point of view. Rather, it is sufficient to consider average inventive values to gain
an understanding of the monetary worth of high-quality ideas and the concrete
value created by the idea generation process. This stance is supported by Popp
123
(2005), who argues that the analysis of patent data should be targeted to the average
patent and not individual inventions. In this instance, this outcome can be achieved
by multiplying the average inventive value per installation, or based on an
approximated unit quantity, by the number of invention disclosures and patents
resulted from systematic idea generation.
The monetary worth of the case organization’s creative produce can also be
determined by examining license fees and royalties paid to the parent company for
accessing the patented inventions. In this instance, the total amount of income
generated in the patent market through licensing acts can be divided by the overall
number of patents held by the parent company to approximate the tangible
monetary worth of patents. Of course, it must be kept in mind that usually only a
small portion of the parent company’s patent portfolio actually generates income in
the form of royalties and makes up most of the aggregate cash flow (Ludlow 2014).
In this respect, most disclosed inventions are de facto worth less than the average
value, whereas a small fraction of patents generate licensing income that is
significantly higher than the mathematical mean. Still, the average licensing
income created per patent can be used to estimate the monetary worth of the
company’s patent pool and the output of the systematic idea generation process.
This value creation metric along with the measures discussed in the previous
paragraphs constitutes an answer to the fourth key question.
Table 27 summarizes the proposed quantitative value creation metrics for idea
generation based on GQM with their respective key questions. The answer to the
first question lays down the foundation for the rest of the quantitative measurement
model, as all metrics utilize IP data to deliver a statement on the effectiveness of
the case organization’s process. The metrics defined for the second question, too,
provide the groundwork for the measures of questions three and four, which form
the backbone of the measurement model proposed by this study. The next section
closes the discussion on the definition of performance indicators for systematic idea
generation by presenting the final value creation metrics to be used in the empirical
analyses in this research.
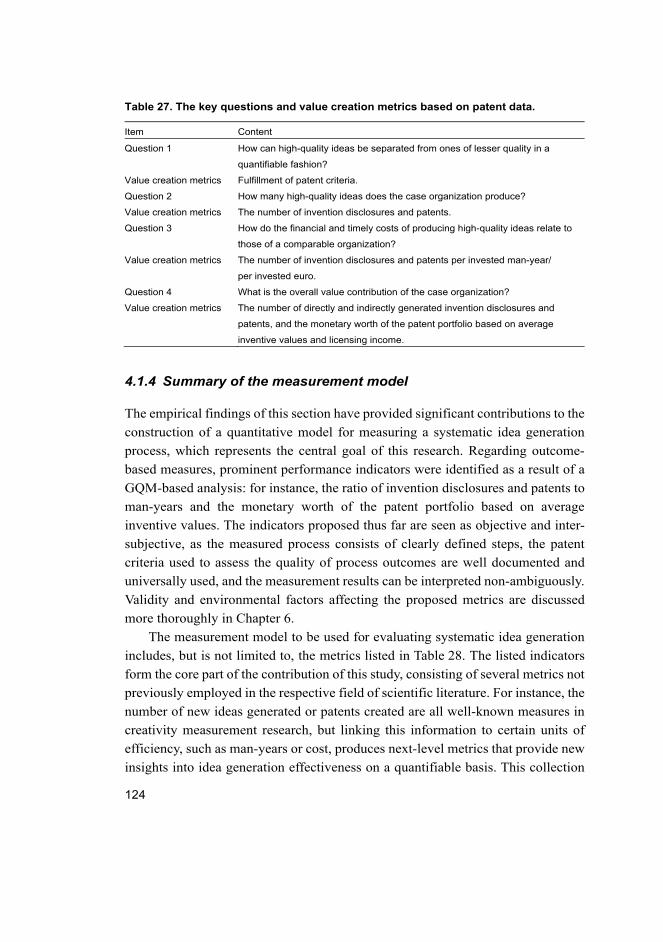
124
Table 27. The key questions and value creation metrics based on patent data.
Item Content
Question 1 How can high-quality ideas be separated from ones of lesser quality in a
quantifiable fashion?
Value creation metrics Fulfillment of patent criteria.
Question 2 How many high-quality ideas does the case organization produce?
Value creation metrics The number of invention disclosures and patents.
Question 3 How do the financial and timely costs of producing high-quality ideas relate to
those of a comparable organization?
Value creation metrics The number of invention disclosures and patents per invested man-year/
per invested euro.
Question 4 What is the overall value contribution of the case organization?
Value creation metrics The number of directly and indirectly generated invention disclosures and
patents, and the monetary worth of the patent portfolio based on average
inventive values and licensing income.
4.1.4 Summary of the measurement model
The empirical findings of this section have provided significant contributions to the
construction of a quantitative model for measuring a systematic idea generation
process, which represents the central goal of this research. Regarding outcome-
based measures, prominent performance indicators were identified as a result of a
GQM-based analysis: for instance, the ratio of invention disclosures and patents to
man-years and the monetary worth of the patent portfolio based on average
inventive values. The indicators proposed thus far are seen as objective and inter-
subjective, as the measured process consists of clearly defined steps, the patent
criteria used to assess the quality of process outcomes are well documented and
universally used, and the measurement results can be interpreted non-ambiguously.
Validity and environmental factors affecting the proposed metrics are discussed
more thoroughly in Chapter 6.
The measurement model to be used for evaluating systematic idea generation
includes, but is not limited to, the metrics listed in Table 28. The listed indicators
form the core part of the contribution of this study, consisting of several metrics not
previously employed in the respective field of scientific literature. For instance, the
number of new ideas generated or patents created are all well-known measures in
creativity measurement research, but linking this information to certain units of
efficiency, such as man-years or cost, produces next-level metrics that provide new
insights into idea generation effectiveness on a quantifiable basis. This collection
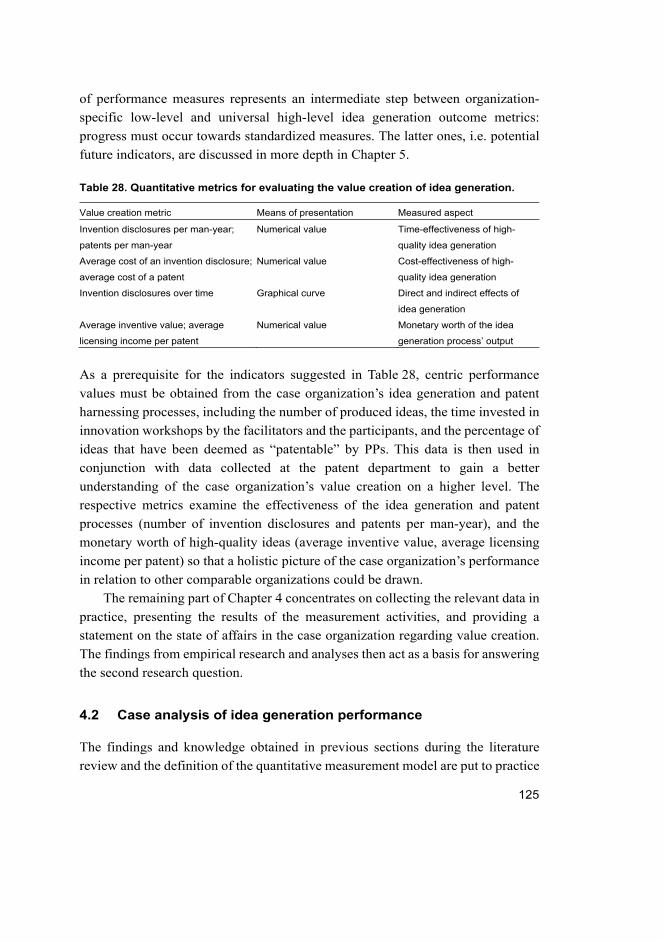
125
of performance measures represents an intermediate step between organization-
specific low-level and universal high-level idea generation outcome metrics:
progress must occur towards standardized measures. The latter ones, i.e. potential
future indicators, are discussed in more depth in Chapter 5.
Table 28. Quantitative metrics for evaluating the value creation of idea generation.
Value creation metric Means of presentation Measured aspect
Invention disclosures per man-year;
patents per man-year
Numerical value Time-effectiveness of high-
quality idea generation
Average cost of an invention disclosure;
average cost of a patent
Numerical value Cost-effectiveness of high-
quality idea generation
Invention disclosures over time Graphical curve Direct and indirect effects of
idea generation
Average inventive value; average
licensing income per patent
Numerical value Monetary worth of the idea
generation process’ output
As a prerequisite for the indicators suggested in Table 28, centric performance
values must be obtained from the case organization’s idea generation and patent
harnessing processes, including the number of produced ideas, the time invested in
innovation workshops by the facilitators and the participants, and the percentage of
ideas that have been deemed as “patentable” by PPs. This data is then used in
conjunction with data collected at the patent department to gain a better
understanding of the case organization’s value creation on a higher level. The
respective metrics examine the effectiveness of the idea generation and patent
processes (number of invention disclosures and patents per man-year), and the
monetary worth of high-quality ideas (average inventive value, average licensing
income per patent) so that a holistic picture of the case organization’s performance
in relation to other comparable organizations could be drawn.
The remaining part of Chapter 4 concentrates on collecting the relevant data in
practice, presenting the results of the measurement activities, and providing a
statement on the state of affairs in the case organization regarding value creation.
The findings from empirical research and analyses then act as a basis for answering
the second research question.
4.2 Case analysis of idea generation performance
The findings and knowledge obtained in previous sections during the literature
review and the definition of the quantitative measurement model are put to practice
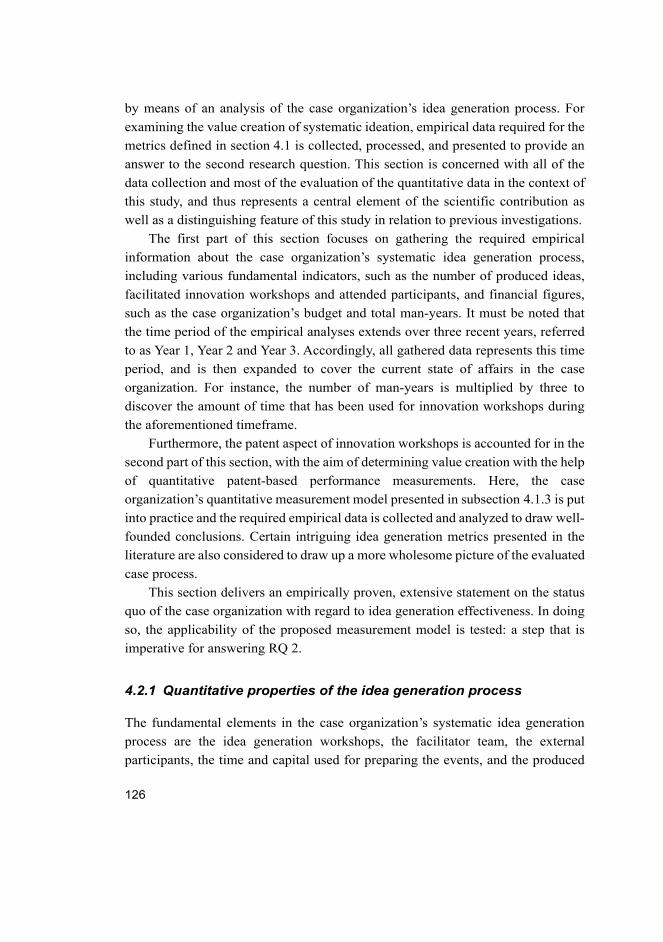
126
by means of an analysis of the case organization’s idea generation process. For
examining the value creation of systematic ideation, empirical data required for the
metrics defined in section 4.1 is collected, processed, and presented to provide an
answer to the second research question. This section is concerned with all of the
data collection and most of the evaluation of the quantitative data in the context of
this study, and thus represents a central element of the scientific contribution as
well as a distinguishing feature of this study in relation to previous investigations.
The first part of this section focuses on gathering the required empirical
information about the case organization’s systematic idea generation process,
including various fundamental indicators, such as the number of produced ideas,
facilitated innovation workshops and attended participants, and financial figures,
such as the case organization’s budget and total man-years. It must be noted that
the time period of the empirical analyses extends over three recent years, referred
to as Year 1, Year 2 and Year 3. Accordingly, all gathered data represents this time
period, and is then expanded to cover the current state of affairs in the case
organization. For instance, the number of man-years is multiplied by three to
discover the amount of time that has been used for innovation workshops during
the aforementioned timeframe.
Furthermore, the patent aspect of innovation workshops is accounted for in the
second part of this section, with the aim of determining value creation with the help
of quantitative patent-based performance measurements. Here, the case
organization’s quantitative measurement model presented in subsection 4.1.3 is put
into practice and the required empirical data is collected and analyzed to draw well-
founded conclusions. Certain intriguing idea generation metrics presented in the
literature are also considered to draw up a more wholesome picture of the evaluated
case process.
This section delivers an empirically proven, extensive statement on the status
quo of the case organization with regard to idea generation effectiveness. In doing
so, the applicability of the proposed measurement model is tested: a step that is
imperative for answering RQ 2.
4.2.1 Quantitative properties of the idea generation process
The fundamental elements in the case organization’s systematic idea generation
process are the idea generation workshops, the facilitator team, the external
participants, the time and capital used for preparing the events, and the produced
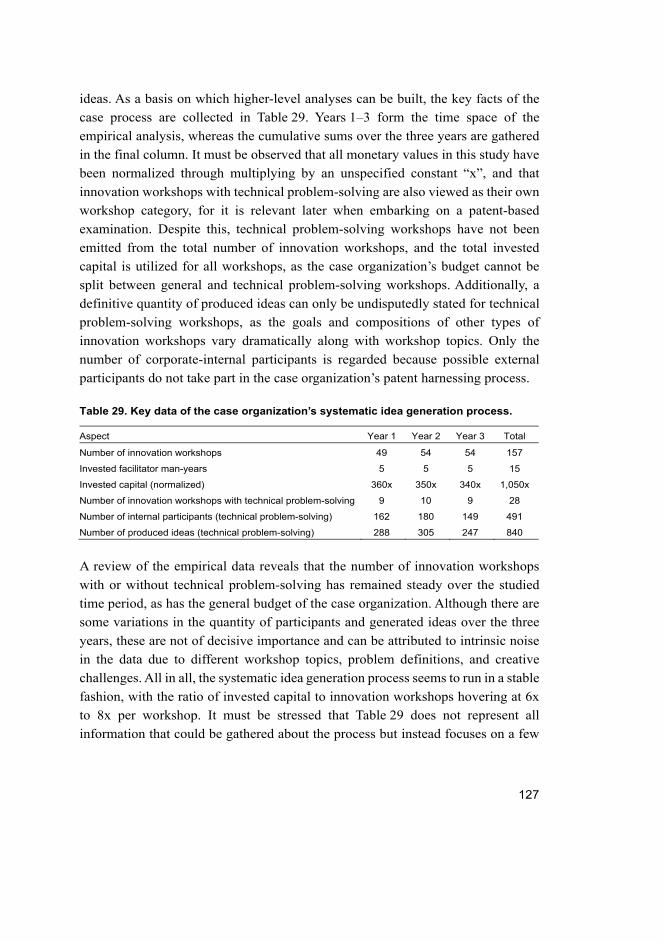
127
ideas. As a basis on which higher-level analyses can be built, the key facts of the
case process are collected in Table 29. Years 1–3 form the time space of the
empirical analysis, whereas the cumulative sums over the three years are gathered
in the final column. It must be observed that all monetary values in this study have
been normalized through multiplying by an unspecified constant “x”, and that
innovation workshops with technical problem-solving are also viewed as their own
workshop category, for it is relevant later when embarking on a patent-based
examination. Despite this, technical problem-solving workshops have not been
emitted from the total number of innovation workshops, and the total invested
capital is utilized for all workshops, as the case organization’s budget cannot be
split between general and technical problem-solving workshops. Additionally, a
definitive quantity of produced ideas can only be undisputedly stated for technical
problem-solving workshops, as the goals and compositions of other types of
innovation workshops vary dramatically along with workshop topics. Only the
number of corporate-internal participants is regarded because possible external
participants do not take part in the case organization’s patent harnessing process.
Table 29. Key data of the case organization’s systematic idea generation process.
Aspect Year 1 Year 2 Year 3 Total
Number of innovation workshops 49 54 54 157
Invested facilitator man-years 5 5 5 15
Invested capital (normalized) 360x 350x 340x 1,050x
Number of innovation workshops with technical problem-solving 9 10 9 28
Number of internal participants (technical problem-solving) 162 180 149 491
Number of produced ideas (technical problem-solving) 288 305 247 840
A review of the empirical data reveals that the number of innovation workshops
with or without technical problem-solving has remained steady over the studied
time period, as has the general budget of the case organization. Although there are
some variations in the quantity of participants and generated ideas over the three
years, these are not of decisive importance and can be attributed to intrinsic noise
in the data due to different workshop topics, problem definitions, and creative
challenges. All in all, the systematic idea generation process seems to run in a stable
fashion, with the ratio of invested capital to innovation workshops hovering at 6x
to 8x per workshop. It must be stressed that Table 29 does not represent all
information that could be gathered about the process but instead focuses on a few
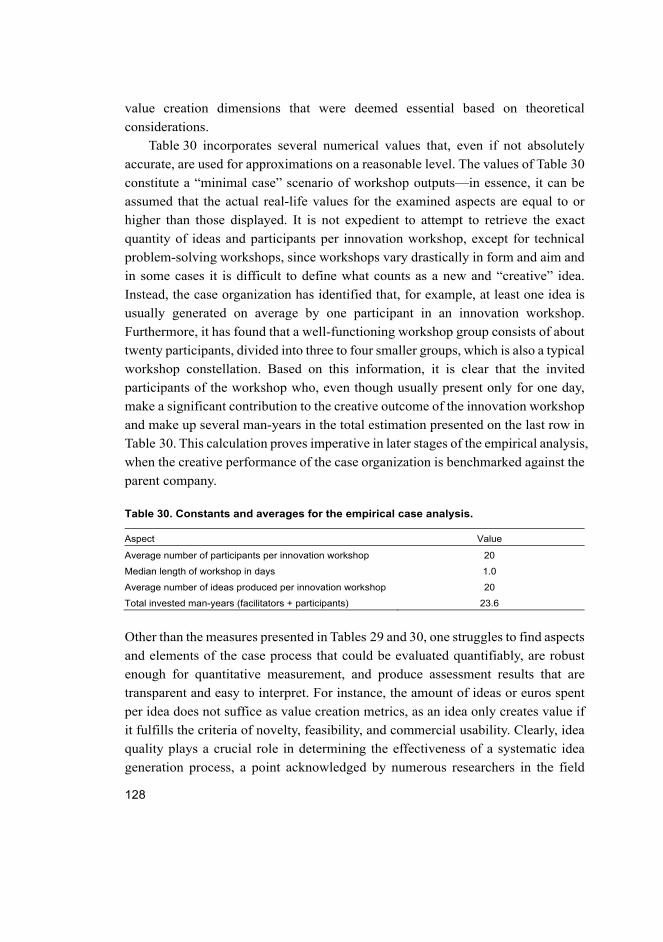
128
value creation dimensions that were deemed essential based on theoretical
considerations.
Table 30 incorporates several numerical values that, even if not absolutely
accurate, are used for approximations on a reasonable level. The values of Table 30
constitute a “minimal case” scenario of workshop outputs—in essence, it can be
assumed that the actual real-life values for the examined aspects are equal to or
higher than those displayed. It is not expedient to attempt to retrieve the exact
quantity of ideas and participants per innovation workshop, except for technical
problem-solving workshops, since workshops vary drastically in form and aim and
in some cases it is difficult to define what counts as a new and “creative” idea.
Instead, the case organization has identified that, for example, at least one idea is
usually generated on average by one participant in an innovation workshop.
Furthermore, it has found that a well-functioning workshop group consists of about
twenty participants, divided into three to four smaller groups, which is also a typical
workshop constellation. Based on this information, it is clear that the invited
participants of the workshop who, even though usually present only for one day,
make a significant contribution to the creative outcome of the innovation workshop
and make up several man-years in the total estimation presented on the last row in
Table 30. This calculation proves imperative in later stages of the empirical analysis,
when the creative performance of the case organization is benchmarked against the
parent company.
Table 30. Constants and averages for the empirical case analysis.
Aspect Value
Average number of participants per innovation workshop 20
Median length of workshop in days 1.0
Average number of ideas produced per innovation workshop 20
Total invested man-years (facilitators + participants) 23.6
Other than the measures presented in Tables 29 and 30, one struggles to find aspects
and elements of the case process that could be evaluated quantifiably, are robust
enough for quantitative measurement, and produce assessment results that are
transparent and easy to interpret. For instance, the amount of ideas or euros spent
per idea does not suffice as value creation metrics, as an idea only creates value if
it fulfills the criteria of novelty, feasibility, and commercial usability. Clearly, idea
quality plays a crucial role in determining the effectiveness of a systematic idea
generation process, a point acknowledged by numerous researchers in the field
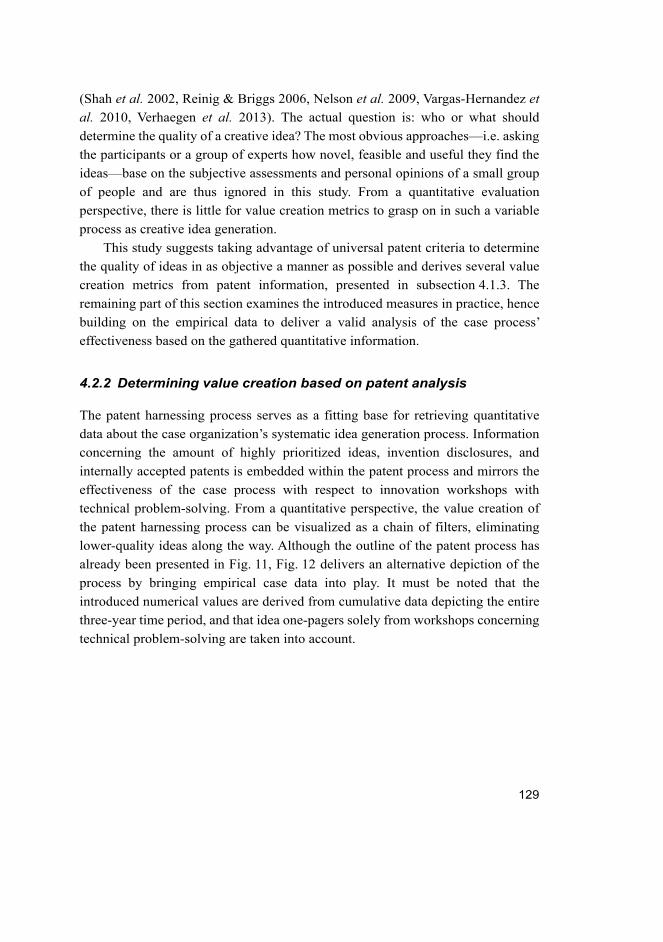
129
(Shah et al. 2002, Reinig & Briggs 2006, Nelson et al. 2009, Vargas-Hernandez et
al. 2010, Verhaegen et al. 2013). The actual question is: who or what should
determine the quality of a creative idea? The most obvious approaches—i.e. asking
the participants or a group of experts how novel, feasible and useful they find the
ideas—base on the subjective assessments and personal opinions of a small group
of people and are thus ignored in this study. From a quantitative evaluation
perspective, there is little for value creation metrics to grasp on in such a variable
process as creative idea generation.
This study suggests taking advantage of universal patent criteria to determine
the quality of ideas in as objective a manner as possible and derives several value
creation metrics from patent information, presented in subsection 4.1.3. The
remaining part of this section examines the introduced measures in practice, hence
building on the empirical data to deliver a valid analysis of the case process’
effectiveness based on the gathered quantitative information.
4.2.2 Determining value creation based on patent analysis
The patent harnessing process serves as a fitting base for retrieving quantitative
data about the case organization’s systematic idea generation process. Information
concerning the amount of highly prioritized ideas, invention disclosures, and
internally accepted patents is embedded within the patent process and mirrors the
effectiveness of the case process with respect to innovation workshops with
technical problem-solving. From a quantitative perspective, the value creation of
the patent harnessing process can be visualized as a chain of filters, eliminating
lower-quality ideas along the way. Although the outline of the patent process has
already been presented in Fig. 11, Fig. 12 delivers an alternative depiction of the
process by bringing empirical case data into play. It must be noted that the
introduced numerical values are derived from cumulative data depicting the entire
three-year time period, and that idea one-pagers solely from workshops concerning
technical problem-solving are taken into account.
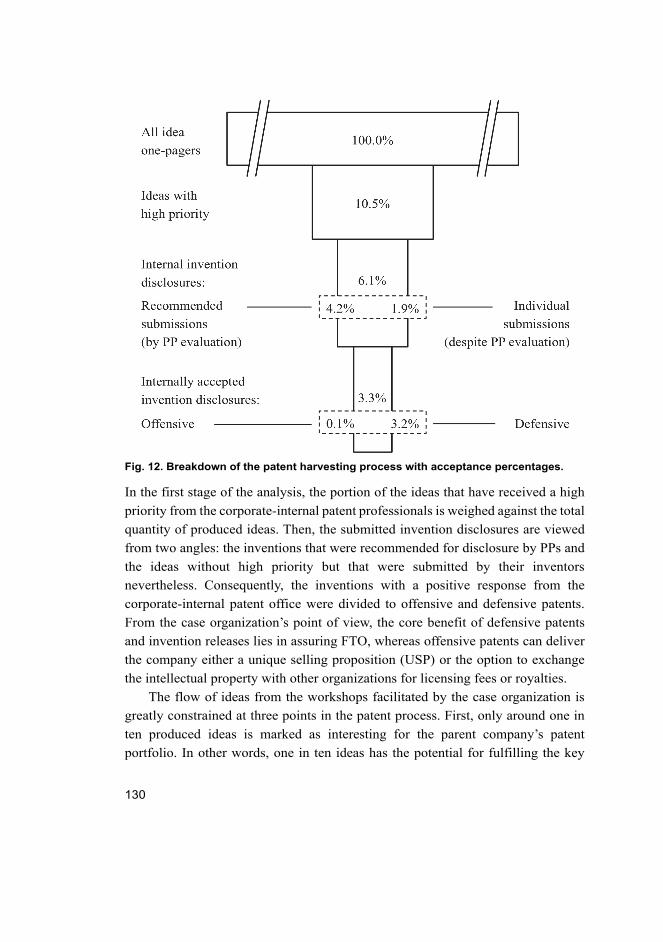
130
Fig. 12. Breakdown of the patent harvesting process with acceptance percentages.
In the first stage of the analysis, the portion of the ideas that have received a high
priority from the corporate-internal patent professionals is weighed against the total
quantity of produced ideas. Then, the submitted invention disclosures are viewed
from two angles: the inventions that were recommended for disclosure by PPs and
the ideas without high priority but that were submitted by their inventors
nevertheless. Consequently, the inventions with a positive response from the
corporate-internal patent office were divided to offensive and defensive patents.
From the case organization’s point of view, the core benefit of defensive patents
and invention releases lies in assuring FTO, whereas offensive patents can deliver
the company either a unique selling proposition (USP) or the option to exchange
the intellectual property with other organizations for licensing fees or royalties.
The flow of ideas from the workshops facilitated by the case organization is
greatly constrained at three points in the patent process. First, only around one in
ten produced ideas is marked as interesting for the parent company’s patent
portfolio. In other words, one in ten ideas has the potential for fulfilling the key
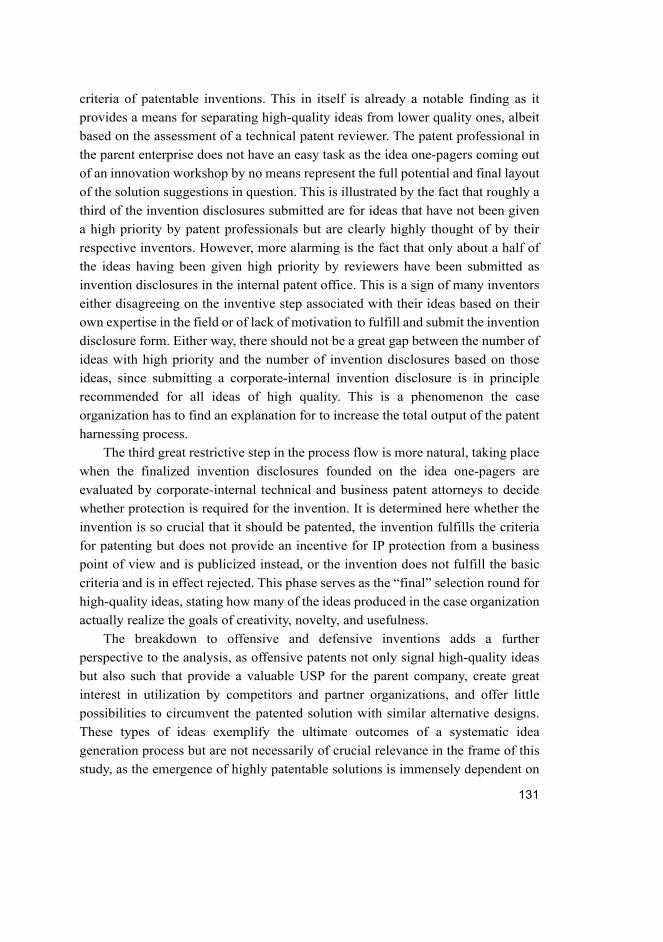
131
criteria of patentable inventions. This in itself is already a notable finding as it
provides a means for separating high-quality ideas from lower quality ones, albeit
based on the assessment of a technical patent reviewer. The patent professional in
the parent enterprise does not have an easy task as the idea one-pagers coming out
of an innovation workshop by no means represent the full potential and final layout
of the solution suggestions in question. This is illustrated by the fact that roughly a
third of the invention disclosures submitted are for ideas that have not been given
a high priority by patent professionals but are clearly highly thought of by their
respective inventors. However, more alarming is the fact that only about a half of
the ideas having been given high priority by reviewers have been submitted as
invention disclosures in the internal patent office. This is a sign of many inventors
either disagreeing on the inventive step associated with their ideas based on their
own expertise in the field or of lack of motivation to fulfill and submit the invention
disclosure form. Either way, there should not be a great gap between the number of
ideas with high priority and the number of invention disclosures based on those
ideas, since submitting a corporate-internal invention disclosure is in principle
recommended for all ideas of high quality. This is a phenomenon the case
organization has to find an explanation for to increase the total output of the patent
harnessing process.
The third great restrictive step in the process flow is more natural, taking place
when the finalized invention disclosures founded on the idea one-pagers are
evaluated by corporate-internal technical and business patent attorneys to decide
whether protection is required for the invention. It is determined here whether the
invention is so crucial that it should be patented, the invention fulfills the criteria
for patenting but does not provide an incentive for IP protection from a business
point of view and is publicized instead, or the invention does not fulfill the basic
criteria and is in effect rejected. This phase serves as the “final” selection round for
high-quality ideas, stating how many of the ideas produced in the case organization
actually realize the goals of creativity, novelty, and usefulness.
The breakdown to offensive and defensive inventions adds a further
perspective to the analysis, as offensive patents not only signal high-quality ideas
but also such that provide a valuable USP for the parent company, create great
interest in utilization by competitors and partner organizations, and offer little
possibilities to circumvent the patented solution with similar alternative designs.
These types of ideas exemplify the ultimate outcomes of a systematic idea
generation process but are not necessarily of crucial relevance in the frame of this
study, as the emergence of highly patentable solutions is immensely dependent on
132
the selected topic and problem definition of an innovation workshop; something
the case organization has very limited influence on. For this reason, the division of
solid inventions to offensive and defensive patents is for the most part neglected in
this research, since the case organization can only impact the total number of
submitted invention disclosures that have been accepted in any form. The interplay
of offensive and defensive patents and its effect on the empirical analysis is
explored more thoroughly in Chapter 6.
When examining the relative values put forth in Fig. 12, it becomes clear that
the first prioritization by PPs and the submission of invention disclosures by the
workshop participants establish the two most restrictive bottlenecks of the patent
harnessing process. Approximately every tenth idea is categorized as having
potential for patent disclosure, whereas the inventors fulfill and submit invention
reports for about a half of these. Consequently, about 60 percent of those ideas are
accepted in the corporate-internal patent office, or about three percent of the total
number of produced ideas. One could argue that the middle step in the patent flow
is too big, because—ideally—every idea with a high priority from PPs should be
submitted in the form of an invention disclosure to secure as many patentable ideas
as possible. Nevertheless, the inventors are of course given the opportunity to
refrain from disclosing their respective ideas if, based on their technical expertise,
they see fit to do so.
Yet, a critical problem was identified in the patent harnessing process during
initial empirical studies that may partially explain the chasm between the number
of prioritized ideas and the number of submitted invention disclosures. Due to a
misunderstanding regarding the division of roles between the case organization and
the patent department, inventors were occasionally not informed of the high priority
their idea had received and of the need to file an invention disclosure for that idea.
For this reason, the patent process functioned inefficiently for a certain time period
and resulted in a lower amount of invention submissions than it would have without
the communication issue. The presented amount of accepted invention disclosures
(3.3%) can thus be taken as a number that is at the lower limit of the range where
the actual number of high-quality ideas generated in the case process lies.
Initial vs. current outline of the patent process
The contribution of the patent harnessing process and the effectiveness of idea
generation activities are probably best visualized when making comparisons with
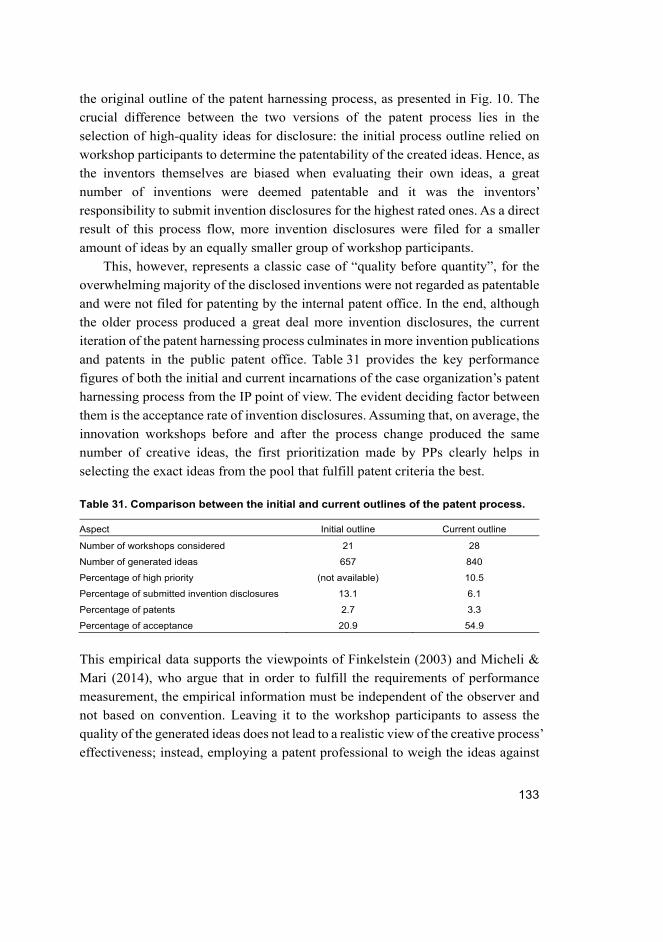
133
the original outline of the patent harnessing process, as presented in Fig. 10. The
crucial difference between the two versions of the patent process lies in the
selection of high-quality ideas for disclosure: the initial process outline relied on
workshop participants to determine the patentability of the created ideas. Hence, as
the inventors themselves are biased when evaluating their own ideas, a great
number of inventions were deemed patentable and it was the inventors’
responsibility to submit invention disclosures for the highest rated ones. As a direct
result of this process flow, more invention disclosures were filed for a smaller
amount of ideas by an equally smaller group of workshop participants.
This, however, represents a classic case of “quality before quantity”, for the
overwhelming majority of the disclosed inventions were not regarded as patentable
and were not filed for patenting by the internal patent office. In the end, although
the older process produced a great deal more invention disclosures, the current
iteration of the patent harnessing process culminates in more invention publications
and patents in the public patent office. Table 31 provides the key performance
figures of both the initial and current incarnations of the case organization’s patent
harnessing process from the IP point of view. The evident deciding factor between
them is the acceptance rate of invention disclosures. Assuming that, on average, the
innovation workshops before and after the process change produced the same
number of creative ideas, the first prioritization made by PPs clearly helps in
selecting the exact ideas from the pool that fulfill patent criteria the best.
Table 31. Comparison between the initial and current outlines of the patent process.
Aspect Initial outline Current outline
Number of workshops considered 21 28
Number of generated ideas 657 840
Percentage of high priority (not available) 10.5
Percentage of submitted invention disclosures 13.1 6.1
Percentage of patents 2.7 3.3
Percentage of acceptance 20.9 54.9
This empirical data supports the viewpoints of Finkelstein (2003) and Micheli &
Mari (2014), who argue that in order to fulfill the requirements of performance
measurement, the empirical information must be independent of the observer and
not based on convention. Leaving it to the workshop participants to assess the
quality of the generated ideas does not lead to a realistic view of the creative process’
effectiveness; instead, employing a patent professional to weigh the ideas against
134
universal patent criteria provides a significantly better-founded understanding of
the amount of “good” ideas coming out of the case process. One could naturally
argue that the ideas are still not evaluated in an entirely objective manner, but at
least the utilization of common patent criteria introduces a certain degree of
objectivity and quantitativeness into the evaluating process—a prospect that is
neglected by other studies in the field, e.g. Vargas-Hernandez et al. (2010), Reinig
et al. (2007), and Shah et al. (2003). Another great advantage of this type of idea
quality analysis is the extensive comparability of patent-based information across
organizations of various sizes, which allows for elaborating on the relative idea
generation efficiencies of two or more given entities.
Time- and cost-effectiveness of high-quality idea generation
Fig. 13 delivers an insight into the relative inventive performances of the case
organization and its parent company in terms of quantitative outputs and invested
human capital on a logarithmic scale. The parent company, as referred to in
Chapter 2, is a high-technology performer and a leading innovator in the
automotive industry, providing an excellent benchmark for the case organization.
From this empirical data, it can be deduced that the creative performance of
researchers is considerably enhanced when engaging in systematic ideation
activities in the case organization—resulting in about ten times more invention
disclosures and patents per man-year than the parent company. Even though the
parent company produces a great deal more invention disclosures and patents, the
equally higher invested man-years across the R&D establishment mean that its total
creative efficiency is lower than its subsidiary entity, the case organization. This
finding is logical, since the case organization greatly specializes in the time-
efficient generation of creative ideas, thus having a key advantage over the parent
company. It must be noted that all values for the case organization in Fig. 13 are
derived over a period of three years, the overall time frame of the empirical data
collection in this study, while the values for the parent company represent the
inventive outcomes of only one year. However, this has no effect on the validity of
the quantitative analysis at this stage, as solely the ratio of results to invested man-
years is considered.
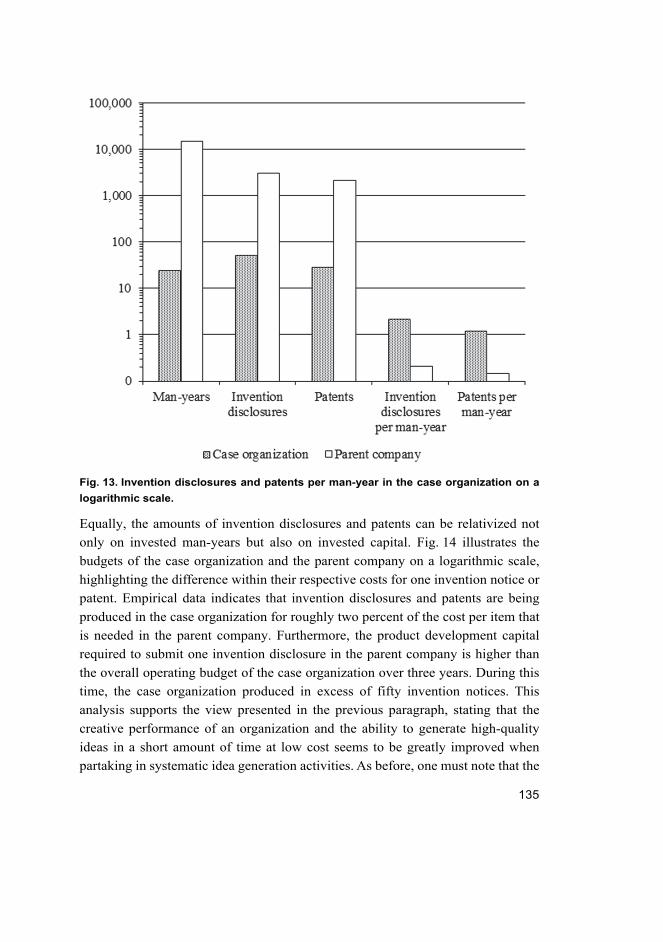
135
Fig. 13. Invention disclosures and patents per man-year in the case organization on a
logarithmic scale.
Equally, the amounts of invention disclosures and patents can be relativized not
only on invested man-years but also on invested capital. Fig. 14 illustrates the
budgets of the case organization and the parent company on a logarithmic scale,
highlighting the difference within their respective costs for one invention notice or
patent. Empirical data indicates that invention disclosures and patents are being
produced in the case organization for roughly two percent of the cost per item that
is needed in the parent company. Furthermore, the product development capital
required to submit one invention disclosure in the parent company is higher than
the overall operating budget of the case organization over three years. During this
time, the case organization produced in excess of fifty invention notices. This
analysis supports the view presented in the previous paragraph, stating that the
creative performance of an organization and the ability to generate high-quality
ideas in a short amount of time at low cost seems to be greatly improved when
partaking in systematic idea generation activities. As before, one must note that the
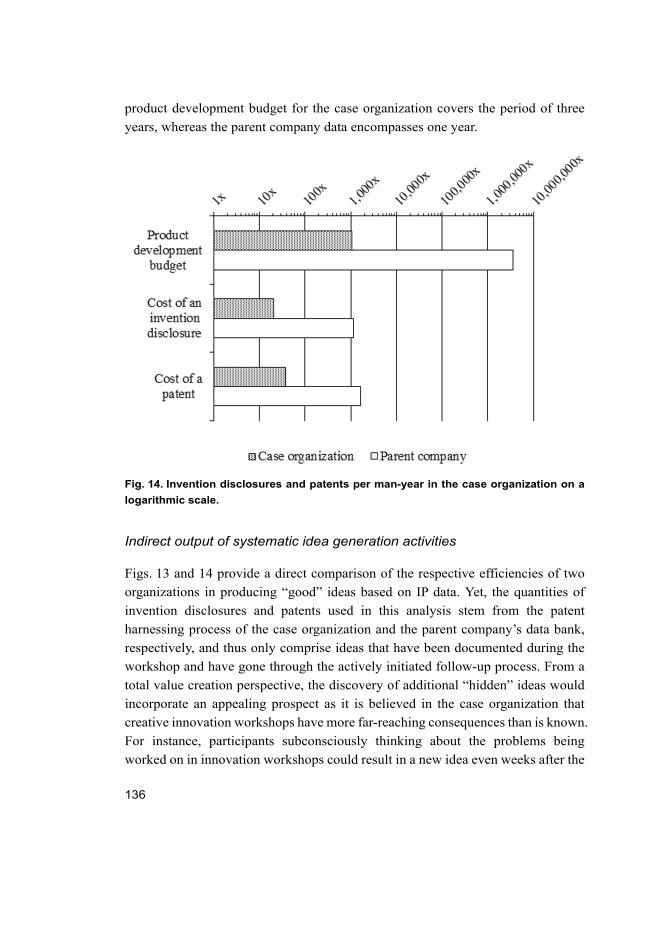
136
product development budget for the case organization covers the period of three
years, whereas the parent company data encompasses one year.
Fig. 14. Invention disclosures and patents per man-year in the case organization on a
logarithmic scale.
Indirect output of systematic idea generation activities
Figs. 13 and 14 provide a direct comparison of the respective efficiencies of two
organizations in producing “good” ideas based on IP data. Yet, the quantities of
invention disclosures and patents used in this analysis stem from the patent
harnessing process of the case organization and the parent company’s data bank,
respectively, and thus only comprise ideas that have been documented during the
workshop and have gone through the actively initiated follow-up process. From a
total value creation perspective, the discovery of additional “hidden” ideas would
incorporate an appealing prospect as it is believed in the case organization that
creative innovation workshops have more far-reaching consequences than is known.
For instance, participants subconsciously thinking about the problems being
worked on in innovation workshops could result in a new idea even weeks after the
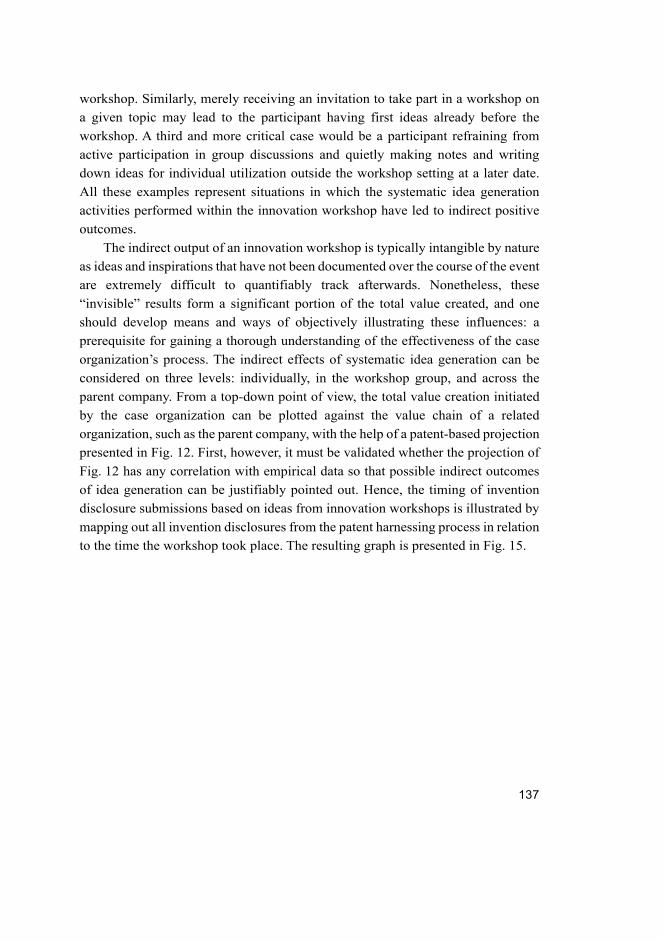
137
workshop. Similarly, merely receiving an invitation to take part in a workshop on
a given topic may lead to the participant having first ideas already before the
workshop. A third and more critical case would be a participant refraining from
active participation in group discussions and quietly making notes and writing
down ideas for individual utilization outside the workshop setting at a later date.
All these examples represent situations in which the systematic idea generation
activities performed within the innovation workshop have led to indirect positive
outcomes.
The indirect output of an innovation workshop is typically intangible by nature
as ideas and inspirations that have not been documented over the course of the event
are extremely difficult to quantifiably track afterwards. Nonetheless, these
“invisible” results form a significant portion of the total value created, and one
should develop means and ways of objectively illustrating these influences: a
prerequisite for gaining a thorough understanding of the effectiveness of the case
organization’s process. The indirect effects of systematic idea generation can be
considered on three levels: individually, in the workshop group, and across the
parent company. From a top-down point of view, the total value creation initiated
by the case organization can be plotted against the value chain of a related
organization, such as the parent company, with the help of a patent-based projection
presented in Fig. 12. First, however, it must be validated whether the projection of
Fig. 12 has any correlation with empirical data so that possible indirect outcomes
of idea generation can be justifiably pointed out. Hence, the timing of invention
disclosure submissions based on ideas from innovation workshops is illustrated by
mapping out all invention disclosures from the patent harnessing process in relation
to the time the workshop took place. The resulting graph is presented in Fig. 15.
138
Fig. 15. Timing of invention disclosures on ideas generated in the case organization’s
workshops.
Not surprisingly, most active invention disclosures, i.e. ones initiated and motivated
by the patent office’s prioritization, were submitted within three months of the
workshop, which is also the time it usually takes the PPs to review and pre-evaluate
the ideas. After that, another wave of invention disclosures is submitted
approximately six months after the innovation workshop, with the remaining
submissions spread out over a relatively lengthy period of 16 months. This may be
due to the fact that certain inventors forget to submit or postpone submitting the
invention disclosure for their idea for various reasons and only do so when being
reminded of that either by the case organization or the patent office. All in all, the
projection of Fig. 15, according to which a dramatic increase in invention
disclosures shows immediately after an innovation workshop when a high amount
of “good” ideas is produced, seems accurate.
The passive invention disclosures without high priority or support from PPs
yet submitted by workshop participants represent another interesting point that
indeed lies closer to the indirect effects of systematic idea generation than active
disclosures discussed before. It is worth noting that passive disclosures expand over
a period that is on average longer than that of active disclosures from the same
workshop and that first such invention disclosures are submitted even before or at
the same time as the workshop. It can be deduced, then, that the mere act of inviting
people to an innovation workshop on a given topic may lead to high-quality ideas
139
before the workshop and that systematic creativity techniques inspire employees to
submit a reasonably high amount of invention disclosures despite an initially
negative response from PPs during pre-prioritization. Yet, the general timing of
passive disclosures does not conflict with that of active ones, so the aftereffects of
an idea generation process should be visible within six months of the workshop
when observing the total amount of invention disclosures.
Theoretically, one should then be able to approximate the total value creation
of an idea generation process by means of identifying such upwards “bumps” in
the number of submitted invention disclosures in the parent organization. This
concerns examining whether, first, the effects of the case organization’s process are
visible in the “big picture”, and, second, whether previously unknown side effects
emerge. To that end, this study examined the amount of invention disclosures
submitted by all employees who have participated in a workshop with technical
problem-solving facilitated by the case organization within the studied time frame
of three years and compared that to the invention disclosures submitted by all
employees of the parent company. A brief review of the data (see Appendix 1)
reveals that while innovation workshops are typically followed by a momentary
surge in invention disclosures, the natural fluctuations associated with the amount
of invention disclosures in the parent company, as well as the sheer difference in
size and in the amount of submissions between the two entities, make it virtually
impossible to draw conclusions on the direct and indirect effects of the systematic
idea generation process on a large scale.
A lower-level approach is thus required to illustrate the intangible elements of
the case organization’s total value creation. Correspondingly, Fig. 16 limits the
analysis by concentrating on the participants of one given workshop rather than all
participants and presents all invention disclosures by two separate workshop groups
in relation to the date of the workshop.
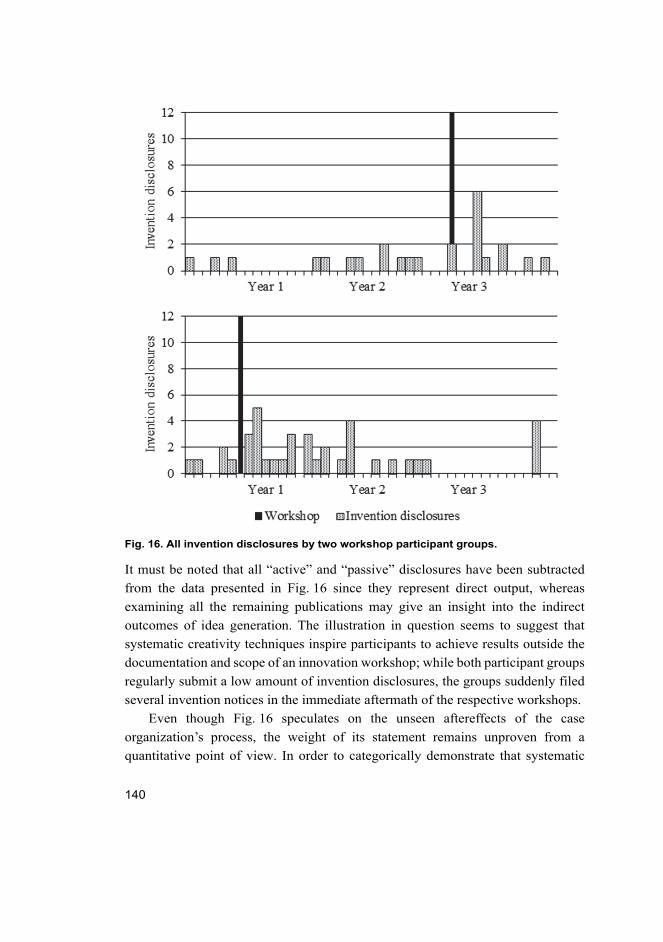
140
Fig. 16. All invention disclosures by two workshop participant groups.
It must be noted that all “active” and “passive” disclosures have been subtracted
from the data presented in Fig. 16 since they represent direct output, whereas
examining all the remaining publications may give an insight into the indirect
outcomes of idea generation. The illustration in question seems to suggest that
systematic creativity techniques inspire participants to achieve results outside the
documentation and scope of an innovation workshop; while both participant groups
regularly submit a low amount of invention disclosures, the groups suddenly filed
several invention notices in the immediate aftermath of the respective workshops.
Even though Fig. 16 speculates on the unseen aftereffects of the case
organization’s process, the weight of its statement remains unproven from a
quantitative point of view. In order to categorically demonstrate that systematic
141
idea generation inspires high-quality ideas on a wider scale, it should be determined
which ideas were actually contributed to by the workshop and which were
coincidentally disclosed at the time of the workshop but have nothing to do with it.
Having someone go through all invention disclosures to assess whether they
originally stem from an innovation workshop or not is not only greatly time-
consuming but also does not fulfill the requirement of objectivity in terms of
quantitative measurement. If the participants themselves would mark the ideas that
would not have occurred without the workshop, the evaluation would be highly
biased, and if a neutral third party were to step in, it would have great difficulty in
drawing a line between inventions coming from daily working efforts and those
standing out, as the working tasks of workshops and their respective participants
are often very similar. For these reasons, it can be concluded that considering all
invention disclosures by a workshop group can provide hints as to whether an
innovation workshop actually led to more “good” ideas than officially documented
but also involves studies of qualitative nature and, therefore, cannot be utilized to
produce a definitive number for added value creation.
For an even more isolated analysis, one should take the lowest-level approach
to the patent process by considering all invention notices submitted by individual
participants and observing how they correlate with the timing of workshop.
Accordingly, Fig. 17 presents the invention disclosures submitted by two selected
workshop participants. Even though, as in the previous case, it is not possible to
explicitly pinpoint the ideas that were initiated by idea generation activities, it
becomes clear from the data that innovation workshops have a dependency with
invention notice submissions. The two participants examined in Fig. 17 display
significant changes in invention filing behavior directly after a workshop, which
supports the suggestion that innovation workshops lead to advantages on a wider
scale than previously known, also on a personal level.
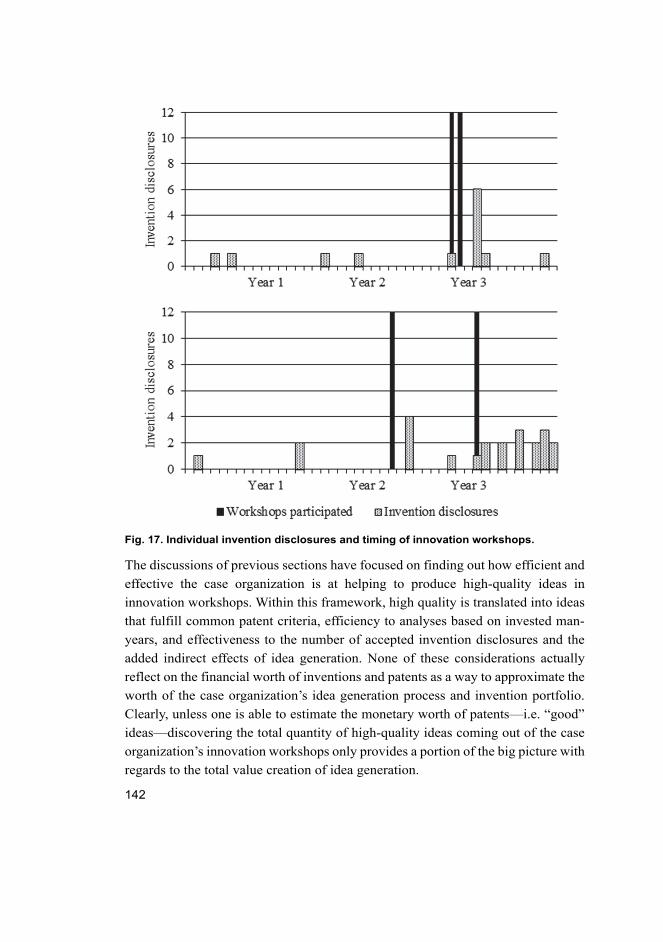
142
Fig. 17. Individual invention disclosures and timing of innovation workshops.
The discussions of previous sections have focused on finding out how efficient and
effective the case organization is at helping to produce high-quality ideas in
innovation workshops. Within this framework, high quality is translated into ideas
that fulfill common patent criteria, efficiency to analyses based on invested man-
years, and effectiveness to the number of accepted invention disclosures and the
added indirect effects of idea generation. None of these considerations actually
reflect on the financial worth of inventions and patents as a way to approximate the
worth of the case organization’s idea generation process and invention portfolio.
Clearly, unless one is able to estimate the monetary worth of patents—i.e. “good”
ideas—discovering the total quantity of high-quality ideas coming out of the case
organization’s innovation workshops only provides a portion of the big picture with
regards to the total value creation of idea generation.
143
Financial approximation of the value creation of idea generation
Inventive values, the fundamentals of which were studied in Chapter 3, provide a
basis for quantitative analyses on the value of inventions. The case organization’s
parent company calculates and keeps track of inventive values of inventions that
have been granted IP protection by the external patent office. As the debates of this
study do not concern the evaluation of inventions in the external patent office due
to proportionally very long lead times, the estimations performed at this stage of
the study rely on inventive value averages derived from previously accepted patent
disclosures not directly related to the case organization. Nevertheless, average
inventive values bring significant advantages for estimating the value of a good
idea, where ideas are divided into high-quality and low-quality ones based on patent
criteria fulfillment. For this approximation, a provisional number of times a given
invention is actually introduced, implemented, or built is needed, as the inventive
value only delivers the worth of an invention for every product or item it is being
applied on.
Royalties and licensing incomes serve as another means for depicting the
concrete financial value of inventions. When the income generated by a patent
portfolio is divided by the number of patents that the portfolio consists of, one can
draw conclusions on the approximate value contribution of an individual patented
invention. Naturally, that is not how patent portfolios and licensing fees function in
reality, as the greatest portion of the income generated by patents is usually covered
by a few select groundbreaking patents that are difficult for competitors to
circumvent. However, when viewing ideation activities as one process that leads to
the emergence of patents, each of which initially having the same probability for
generating licensing income, it can be stated that the average value of inventions
based on this calculation provides a significant guideline for this research.
Table 32 presents the case organization’s empirical data regarding inventive
values and the financial worth of patents. The average inventive values as real
numbers seem very low, but it must be kept in mind that in order to find out the real
value of an invention, the inventive values need to be multiplied by the quantity in
which the inventions are being implemented. In contrast, the annual licensing
income received by the parent company constitutes a very high value, but after
being divided by the equally high number of new patents generated yearly, the
calculated monetary worth of a patent lies reasonably close to the corresponding
worth based on inventive values. The financial worth of a patent seems to lie
between 2.5x and 5x, which comes to about one percent of the case organization’s
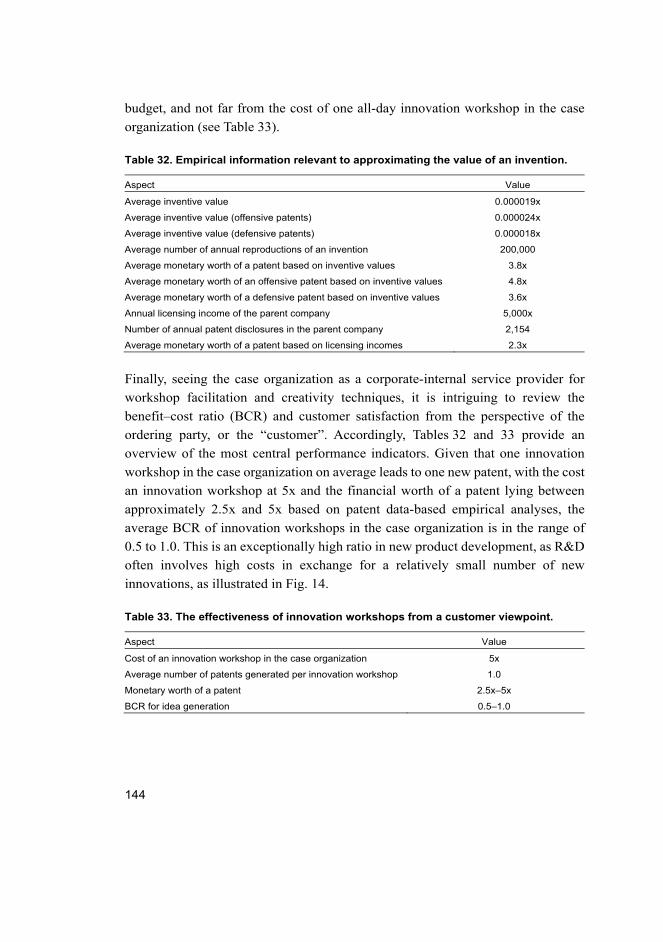
144
budget, and not far from the cost of one all-day innovation workshop in the case
organization (see Table 33).
Table 32. Empirical information relevant to approximating the value of an invention.
Aspect Value
Average inventive value 0.000019x
Average inventive value (offensive patents) 0.000024x
Average inventive value (defensive patents) 0.000018x
Average number of annual reproductions of an invention 200,000
Average monetary worth of a patent based on inventive values 3.8x
Average monetary worth of an offensive patent based on inventive values 4.8x
Average monetary worth of a defensive patent based on inventive values 3.6x
Annual licensing income of the parent company 5,000x
Number of annual patent disclosures in the parent company 2,154
Average monetary worth of a patent based on licensing incomes 2.3x
Finally, seeing the case organization as a corporate-internal service provider for
workshop facilitation and creativity techniques, it is intriguing to review the
benefit–cost ratio (BCR) and customer satisfaction from the perspective of the
ordering party, or the “customer”. Accordingly, Tables 32 and 33 provide an
overview of the most central performance indicators. Given that one innovation
workshop in the case organization on average leads to one new patent, with the cost
an innovation workshop at 5x and the financial worth of a patent lying between
approximately 2.5x and 5x based on patent data-based empirical analyses, the
average BCR of innovation workshops in the case organization is in the range of
0.5 to 1.0. This is an exceptionally high ratio in new product development, as R&D
often involves high costs in exchange for a relatively small number of new
innovations, as illustrated in Fig. 14.
Table 33. The effectiveness of innovation workshops from a customer viewpoint.
Aspect Value
Cost of an innovation workshop in the case organization 5x
Average number of patents generated per innovation workshop 1.0
Monetary worth of a patent 2.5x–5x
BCR for idea generation 0.5–1.0
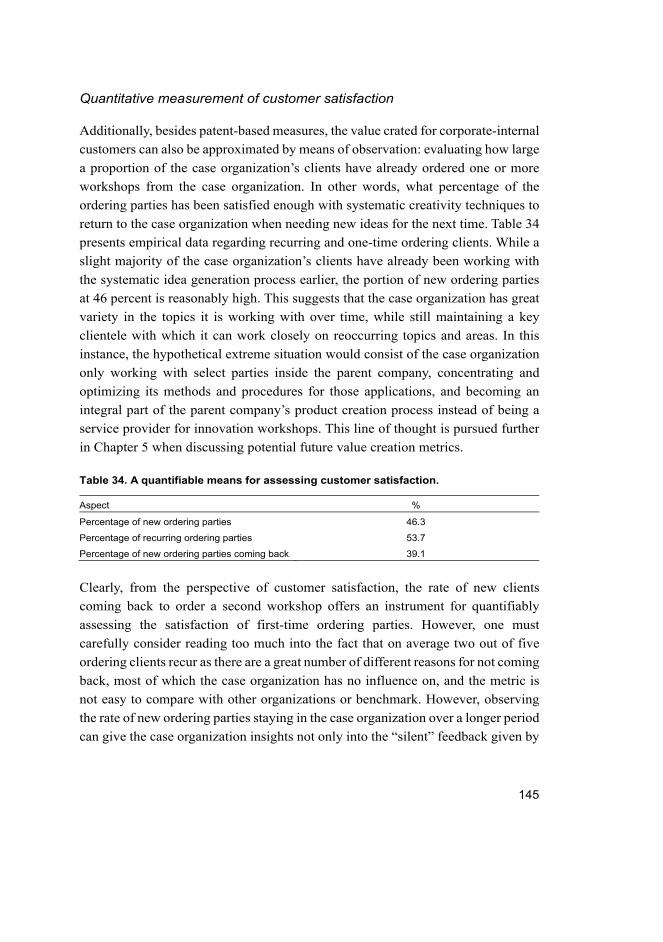
145
Quantitative measurement of customer satisfaction
Additionally, besides patent-based measures, the value crated for corporate-internal
customers can also be approximated by means of observation: evaluating how large
a proportion of the case organization’s clients have already ordered one or more
workshops from the case organization. In other words, what percentage of the
ordering parties has been satisfied enough with systematic creativity techniques to
return to the case organization when needing new ideas for the next time. Table 34
presents empirical data regarding recurring and one-time ordering clients. While a
slight majority of the case organization’s clients have already been working with
the systematic idea generation process earlier, the portion of new ordering parties
at 46 percent is reasonably high. This suggests that the case organization has great
variety in the topics it is working with over time, while still maintaining a key
clientele with which it can work closely on reoccurring topics and areas. In this
instance, the hypothetical extreme situation would consist of the case organization
only working with select parties inside the parent company, concentrating and
optimizing its methods and procedures for those applications, and becoming an
integral part of the parent company’s product creation process instead of being a
service provider for innovation workshops. This line of thought is pursued further
in Chapter 5 when discussing potential future value creation metrics.
Table 34. A quantifiable means for assessing customer satisfaction.
Aspect %
Percentage of new ordering parties 46.3
Percentage of recurring ordering parties 53.7
Percentage of new ordering parties coming back 39.1
Clearly, from the perspective of customer satisfaction, the rate of new clients
coming back to order a second workshop offers an instrument for quantifiably
assessing the satisfaction of first-time ordering parties. However, one must
carefully consider reading too much into the fact that on average two out of five
ordering clients recur as there are a great number of different reasons for not coming
back, most of which the case organization has no influence on, and the metric is
not easy to compare with other organizations or benchmark. However, observing
the rate of new ordering parties staying in the case organization over a longer period
can give the case organization insights not only into the “silent” feedback given by
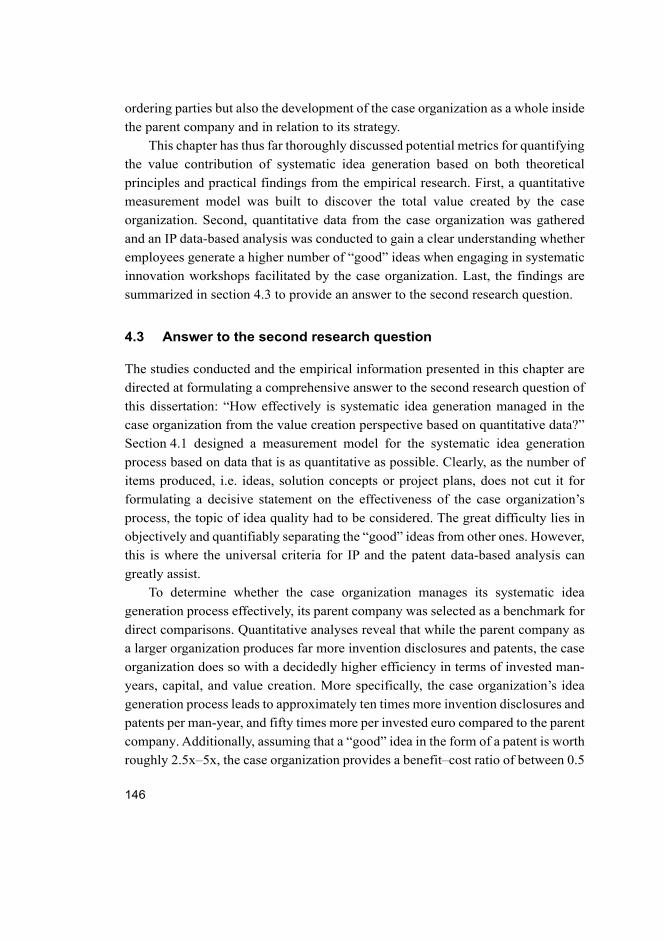
146
ordering parties but also the development of the case organization as a whole inside
the parent company and in relation to its strategy.
This chapter has thus far thoroughly discussed potential metrics for quantifying
the value contribution of systematic idea generation based on both theoretical
principles and practical findings from the empirical research. First, a quantitative
measurement model was built to discover the total value created by the case
organization. Second, quantitative data from the case organization was gathered
and an IP data-based analysis was conducted to gain a clear understanding whether
employees generate a higher number of “good” ideas when engaging in systematic
innovation workshops facilitated by the case organization. Last, the findings are
summarized in section 4.3 to provide an answer to the second research question.
4.3 Answer to the second research question
The studies conducted and the empirical information presented in this chapter are
directed at formulating a comprehensive answer to the second research question of
this dissertation: “How effectively is systematic idea generation managed in the
case organization from the value creation perspective based on quantitative data?”
Section 4.1 designed a measurement model for the systematic idea generation
process based on data that is as quantitative as possible. Clearly, as the number of
items produced, i.e. ideas, solution concepts or project plans, does not cut it for
formulating a decisive statement on the effectiveness of the case organization’s
process, the topic of idea quality had to be considered. The great difficulty lies in
objectively and quantifiably separating the “good” ideas from other ones. However,
this is where the universal criteria for IP and the patent data-based analysis can
greatly assist.
To determine whether the case organization manages its systematic idea
generation process effectively, its parent company was selected as a benchmark for
direct comparisons. Quantitative analyses reveal that while the parent company as
a larger organization produces far more invention disclosures and patents, the case
organization does so with a decidedly higher efficiency in terms of invested man-
years, capital, and value creation. More specifically, the case organization’s idea
generation process leads to approximately ten times more invention disclosures and
patents per man-year, and fifty times more per invested euro compared to the parent
company. Additionally, assuming that a “good” idea in the form of a patent is worth
roughly 2.5x–5x, the case organization provides a benefit–cost ratio of between 0.5
147
and 1.0 to its corporate-internal clients: an exceptionally high number in the field
of product development, which is often considered as a prime example of high
investments and diminishing returns (Madsen 2006). Finally, it was discovered that
the case organization’s innovation workshops have resulted in momentary upwards
surges in the amounts of invention disclosures on a low scale shortly after the
workshop, suggesting that there are indirect effects of systematic idea generation,
including the inspiration of high-quality ideas directly after, a long while after, or
even before the actual workshop. Nevertheless, it is problematic to unambiguously
illustrate the indirect outcomes with quantifiable performance measures as it would
call for separating the invention disclosures that stem from case organization
workshops from the vast pool of all invention disclosures in the parent company.
The immense effectiveness and value creation of systematic idea generation
that the case organization demonstrates is contributed to by the fact that the case
organization acts as a corporate-internal service provider that specializes in
facilitating idea generation in innovation workshops. Highly qualified facilitators,
analytical and STI-based methodology, and well-suited premises all assist the case
organization in achieving significantly higher efficiency in the production of high-
quality ideas when compared to the parent company. Moreover, the case
organization’s patent harnessing process has evolved over the years to provide a
framework for selecting the most prominent ideas and solution concepts for
patenting, further adding to the effectiveness of the overall process. Yet, many
workshop participants file invention notices separately from the active process with
almost an equally high rate of acceptance in the internal patent office. The
acceptance rate of invention disclosures is one of the few areas where the case
organization is outperformed by the parent company, implying that the case
organization could do more to ensure that the invention notices resulting from a
workshop are better thought out and more carefully formulated.
The quantitative measurement model presented in section 4.1 was utilized to
gather empirical data and deliver a statement on the performance of the studied
organization. The proposed quantifiable value creation metrics for systematic idea
generation upheld the criteria of objectivity and inter-subjectivity on a level not
experienced before in the field of creativity measurement. The validity of the
measurement model is essentially based on utilizing universal patent requirements
as listed by Mohr (2001) as a differentiator for high-quality ideas, replacing the
highly qualitative method of using experts to evaluate or categorize ideas, which is
favored by various other researchers, for example, Verhaegen et al. (2011) and
Dean et al. (2006). All in all, this value creation measurement model pioneers a

148
new way of evaluating the quality and monetary worth of idea generation outcomes
and, for its part, begins filling the gap in the scientific literature that is the
quantitative measurement of the effectiveness of idea generation.
Moreover, the outcome of this chapter represents one of the initial steps
towards a concrete evaluation model for creative outcomes, the need for which has
also been acknowledged by other researchers, such as Oman et al. (2013), who
attempt to reduce the influence of judges in approximating the quality of an idea.
The next chapter will take this analysis a step further by discussing not only the
applicability and limitations of the suggested measurement model but also the next
level of idea generation metrics for the future.
149
5 Discussion
This chapter takes a step back from the deep-level quantitative evaluation of the
case process’ effectiveness and instead investigates whether the value creation
metrics defined over the course of the single-case study are applicable at other
organizations in other industries in the future. This calls for addressing both the
perspective of state-of-the-art literature and the conclusions from the empirical
study, as well as direct output data from the case organization’s process to discuss
the potential limitations of the newly-defined—or “current”—metrics. Similarly,
the potential of the defined model for additional use cases and its contribution to
the next generation of metrics for idea generation is discussed by looking upon
known problems, restrictions, and gaps in the literature where the proposed value
creation metrics could be exploited. This reflection on the pros and cons of the
designed measurement model is necessary for the formulation of a statement on the
development of quantitative creativity measurement, including the likely future
characteristics of value creation metrics in systematic idea generation.
In this context, it is also significant to determine the criteria for employing the
suggested quantitative value creation metrics as the objectivity and inter-
subjectivity of the measurement results are dependent on the operating environment
and clean running of the studied process. Therefore, the state of the case
organization’s patent harnessing process is crucial for the metrics’ capability to
produce valid performance data and must be scrutinized with this in mind.
Included in these considerations, to some extent, is the question whether the
role of idea generation will shift from being one stage in the structured innovation
process towards becoming an iterative element, such as a design thinking process
as presented by Brown (2008), either in the case organization or universally. Such
change in the practices and goals of idea generation would automatically lead to
the emergence, or elimination, of certain requirements for value creation metrics,
like the ones defined in this research.
5.1 Limitations of proposed idea generation metrics
The central aim of the measurement model constructed in this study is not to single-
handedly deliver the next generation of value creation indicators for idea generation
but to take the first step on the long journey towards transparent quantitative
measurement of creative processes in product development. The path taken by this
research involves known issues and has attracted criticism amongst researchers in
150
the field, including but not limited to Teichert & Ernst (1999), Adelman &
DeAngelis (2007), Yoon & Lee (2008), Artz et al. (2010), and Edison et al. (2013).
More specifically, it is argued that patent-based information does not adequately
cover all fields of innovation, relates too much with an organization’s selected
intellectual property strategy, and does not implicate whether the innovations in
question end up in the product received by the end-user or not. These criticisms
from the literature and their impact on future measures for idea generation are
discussed in detail in the next section.
Besides limitations pointed out by other researchers, the empirical analyses in
the case organization unearthed factors of their own that restrict the applicability,
usage, and accuracy of the proposed value creation metrics. For instance, when
producing comparisons between the idea generation performances of two separate
organizations, one must exert great care to select the right data for both entities to
ensure the validity and interpretability of measurement results. Similarly, if the
metrics based on the patent process are utilized to evaluate other creative societies
in various fields, with different PCPs, lead times, and documentation practices, they
may not generate reliable data on the effectiveness of idea generation. Additionally,
within the framework of a corporate-internal study, many workshop clients stated
that patent-based information should not and cannot be used for evaluating
creativity. These issues need attending to if the metrics defined in this study are to
be firmly established in the case organization.
This section seeks to provide a breakdown of the downsides and restrictions to
employing the value creation metrics for idea generation defined in Chapter 4. Such
an examination is necessary at this point of the research to answer the question: are
the proposed measures viable as common idea generation indicators of the future
for other organizations? Subsections 5.1.1 and 5.1.2 consider the limitations
imposed on the currently defined metrics based on the scientific literature and the
findings from practical research conducted in the single-case study, respectively.
5.1.1 Theoretical aspect: insights from the literature
The central argument put forth by numerous authors states that patent-based data
should not be used to evaluate product development activities because firms
typically apply strategy to patenting in the form of deliberate non-patenting or
defensive patenting, which distorts the picture drawn of the organization’s idea
generation output (e.g. Kleinknecht et al. 2002, Iida 2006, Yoon & Lee 2008). This
151
is a justified comment, even though its description of the patent landscape is in all
probability more evident in certain industries rather than others. For one, German
employee invention legislation requires all innovative new ideas that fulfill patent
criteria to be submitted as invention disclosures, in effect eliminating the juristic
possibility of not patenting inventions (Reimer et al. 2007). In addition, the
systematic generation of defensive patents to create patent thickets around core
innovations with the sole purpose of hindering competitors in a given strategic field
is an approach discussed in many contexts but with little evidence of widespread
usage. On the contrary, the automotive case presented by Teichert & Ernst (1999)
suggests that the strong collaboration in the car industry does not motivate one
player to apply an offensive patenting strategy due to the risk of being “left out” of
the group or to rely on secrecy to protect key innovations in an industry
characterized by high employee movement and back channel information exchange.
Although the automotive industry is unique in the collaboration aspect, there is no
evidence to show that other high-technology industries would be any different, or
that companies in these industries systematically employ defensive or non-
patenting strategies.
A second problem with using patent data as a base for measuring the value
creation of idea generation concerns the fact that IPR protection can only be sought
for technological inventions, which includes only a part of all idea generation
taking place in an organization (Artz et al. 2010). For instance, one would find it
very difficult to apply for a patent with a software innovation or a business model.
This restricts the utilization of the measurement model defined in Chapter 4 to
organizations in technological industries, software industry being a borderline case.
Nevertheless, as the proposed indicators assume that the organization applies a
defined PCP, has a sizeable portion of its budget allocated into the development of
new offering, and pursues continuous improvement to tackle competitors—all of
which are representative attributes of organizations operating in a technology
field—the proposed metrics only produce meaningful results when examining a
high-technology firm anyway.
Thirdly, it is pointed out that the procedures of and motivations for patenting
vary across firms of different fields, cultures, and sizes (Evangelista et al. 1998).
Applying for IP protection also costs money, which may prove a factor for many
small- and medium-sized companies. Clearly, a startup company in all probability
does not have a major patent portfolio from which one could draw conclusions on
the innovative capability of the organization. This constitutes a potential limitation
for the use of patent-based idea generation metrics, as the enterprise has to have not
152
only a process to generate inventive output but also a procedure to turn it into
intellectual property, the depth of which could then be assessed against the
resources required for its achievement. However, according to Teichert & Ernst
(1999), the actual problem could be the exact opposite: the size of a firm’s patent
collection could be so vast that it is troublesome to isolate the patent-based analysis
on solely the relevant inventions. For this reason, the documentation practices of a
given company are clearly crucial to determine the value creation of idea generation
as the researcher needs to be able to find and isolate specifically the patents that
have resulted from a particular workshop.
As a fourth point, it is stated that patenting criteria, culture, and customs are
not absolutely equal in different countries and regions. Firms in the U.S. and Japan
have commonly adopted the concept of strategic patenting in terms of blocking off
competitors earlier and on a much bigger scale than their European counterparts;
defensive patenting has thus become an integral part of these regions’ innovation
culture (Blind et al. 2004). The practical consequence of this phenomenon is that
firms based in these areas tend to file a greater amount of invention disclosures in
their urge to systematically close any gaps around core innovations that could
potentially be taken advantage of by rival companies. Naturally, applying metrics
founded on patent counts to such organizations would produce a false statement on
the idea generation performance and innovation effectiveness, especially in
comparison to companies that refrain from strategic patenting. The measurement
model of this study is designed to focus on real idea generation output. In other
words, patents created with the purpose of filling up a segment in a given patent
landscape without any extensive creative effort should be subtracted from the
analysis. In the end, the studied company must either not engage in strategic
patenting activities, which often distort the organization’s patent portfolio, or
exploit clear and comprehensive documentation procedures so that core patents can
be tracked and isolated for quantitative analysis.
The last theoretical issue concerning the use of IP-based measures for idea
generation is suggested by Adelman & DeAngelis (2007), who debate whether the
number of patents actually measure knowledge creation or merely transaction costs
resulting from product development work. The fundamental argument here is
founded upon the viewpoint that patenting is merely a tool for companies to seek
protection for the select few inventions that happen to fit into the framework for
patentability. Yet, this study takes another perspective to the matter; one that
expects, first, that all new inventions are filed for patenting, second, that all new
153
inventions filed for patenting are the result of creativity taking place somewhere in
the organization, and, third, that the organization operates in a technological field
where practically all product inventions are suitable for patent protection. If one
were to follow this line of thought, clearly patent counts do not represent solely the
financial costs associated with seeking protection for the company’s innovation
without any connection to the value creation contributed to by idea generation but
instead represent a primary indicator of the effectiveness of the entity’s creative
processes that should be measured to support decision-making efforts.
It can be concluded that the theoretical considerations by other authors raise a
number of points and topics that should be discussed in connection with the broader
applicability of the proposed measurement model. Patent-based value creation
metrics can be optimally implemented in a high-technology environment where
creative working results have a higher probability of fulfilling patent criteria.
Additionally, the evaluated organization needs systematic procedures for
documentation to allow for the tracking, selection, and isolation of particular
patents to represent the quantitative outcome of a given innovation workshop. The
role of strategic patenting and non-patenting in the organization must also not be
neglected as it has a decisive effect on the parent company’s patent portfolio and
would distort the results of an IP-based value creation analysis. For these reasons,
this study argues that the measurement model defined in Chapter 4 is generally
better suited for evaluating organizations with highly structured innovation, idea
generation, and intellectual property processes—meaning in most cases large and
medium-sized enterprises—which adds to the limitations of the currently defined
metrics.
The scientific literature is not the only source of limitations and restrictions
that apply to the defined measurement model. Practical research in the case
organization highlighted several other issues that are significant in terms of limiting
the applicability of patent information-based metrics. The following section
examines these more carefully.
5.1.2 Empirical aspect: workshops in the case organization
Practical studies in the case organization reveal that the constructed measurement
model faces many challenges both technically and with regards to the support and
acceptance received from the parent company. Determining the monetary worth of
new ideas and innovations as the output of idea generation and quantifiably
evaluating the effectiveness of innovation workshops is a demanding task. Patent
154
information provides an initial means for approximating this value creation while,
nevertheless, still being far from perfect. For instance, if one wants to discover the
actual amount of high-quality ideas based on this framework, every single idea
from an innovation workshop should be submitted as an invention to the internal
or external patent office. This would be a daunting task, and not particularly time-
or cost-efficient. The way the invention disclosure forms are filled out even has an
impact of its own as carefully and explicitly prepared invention disclosures more
often than not have a better chance of withstanding corporate-internal scrutiny by
the PPs. Similarly, when investigating the relation of patents to invested man-years
or budget, one comes across the problem of defining the exact resources that have
been poured into the process that led to the emergence of the specific ideas being
considered. If looking upon the whole innovation process from a higher level, it
may be difficult to isolate the people, time, and capital used to generate a set of
ideas.
This point in question applies particularly to the analysis of inventive values as
a way of discovering the monetary worth of a given idea. Since real inventive
values are only available for inventions that have been submitted more than a
couple of years prior, average inventive values must be utilized to calculate the
monetary worth of inventions in the present. Furthermore, the total inventive value
requires the number of units where the respective invention is implemented—
constituting in most cases a rough prediction—to be determined, adding to the
complexity and uncertainty regarding the accuracy of the overall measurement
result.
Equally, the overall licensing income received from other corporations is split
across all patents of the organization to approximate the financial value of high-
quality ideas. It is evident that such estimations do not reflect reality on absolute
terms, especially as most of the monetary value as well as generated licensing
income is concentrated on a very small number of inventions, and by no means
divided evenly across the patent portfolio. Another issue associated with inventive
values is in their nature of being computed against the innovations’ relative value
to the organization: they are highly dependent of the company’s patenting strategy.
The patenting strategy has to do with the internal decision regarding which
inventions are, on the one hand, seen as vital for the organization’s mission and
filed for offensive patents to pursue licensing fees or exclusivity, and which are, on
the other hand, classified as defensive patents or published as working results to
ensure FTO for the parent company.
155
The case organization’s parent company currently employs a predominantly
defensive patenting strategy with the motive of allowing the R&D team to focus on
new product development by providing FTO. As it stands, if the company would
decide to pursue more income from the patent market by filing more offensive
patents, it is going to have the side effect of all inventions’ inventive values going
up. Hence, a third party could rapidly arrive at the conclusion that the ideas
generated by the case organization have become better, even though the only thing
that has changed is the enterprise’s IP strategy. One must not read too much into
measurement results that are based on non-exact values. Nonetheless, these efforts
constitute the difficult first step towards being able to monetarily quantify the value
of high-quality ideas and innovations in the future as methods to precisely calculate
the value of a given invention have not been discovered yet.
One of the most frequent complaints in the case organization about utilizing
patent-based metrics for idea generation has to do with the long process the idea
has to go through before becoming a patent, as well as with the dispute whether the
real value creation takes place at the beginning—when generating the raw idea—
or in the subsequent processing of the idea to turn it into an invention. In this
context, evaluating the number of patents does not so much translate into evaluating
the effectiveness of the idea generation process but into assessing the motivation of
the inventor to continue working with the raw concept. Quite a working effort is
required to transform a problem solution concept into an inventive result, and in
many cases, it could be argued that this is the stage where the real value creation
takes place. However, without the creative impulse in the form of an innovation
workshop, the inventor may not have arrived at the same solution at the end. It is
the primary goal of systematic idea generation to provide a momentary “distraction”
for the employee so that a new, creative path leading to an inventive solution is
found. The journey on the path itself is for the employee to experience, and often
takes several years, at least in the case of automotive industry. Against that
background, IP-based measures deliver a proportionally swift evaluation of idea
generation outcomes.
A further criticism of the proposed measurement model relates to the match
between patent-based metrics and the goal of the studied corporation. It is argued
that—since the main goal of the parent company is to develop and produce road
vehicles, not to submit invention disclosures or build up the patent portfolio—it is
not expedient to measure its idea generation performance with the help of patent
information. This statement has common points with the ones of Adelman &
DeAngelis (2007) who argue that patents and IP in general represent merely the
156
side product of innovation and development and should not be viewed as the main
output. The skeptics of the case organization in the parent company extend this line
of thought by pointing out that in order to really draw conclusions on the
performance with which the internal employees create new ideas for products, one
should be able to find out precisely how much of the employees’ time is spent on
generating patents by subtracting any “excess”, often administrative, work from the
overall amount. Yet, this is not possible in practice as the working hours of any
employee typically consist of a dynamic mix of organizational, technical, and
creative tasks.
This study acknowledges the fact that producing patents and other IP results is
hardly the key aim of any organization operating in a high-technology industry,
such as the case organization, and that invention disclosures are not the most
important output of creative idea generation activities. Yet, the core purpose of this
research is to find and determine quantitative value creation metrics for systematic
idea generation, and patent information provides a logical means for separating
high-quality concepts from the idea mass, and for approximating the monetary
worth of these ideas in terms of concrete data. The decisive advantage here is the
possibility to probe the outcomes of idea generation relatively close to the point in
time at which the innovation workshop originally took place, whereas evaluating
the ideas based on whether they end up in the final product or not, for example,
would take years due to the immense product creation effort associated with high-
technology industries. At the end, it might not even be possible to connect product
features to raw ideas that came out of a given workshop as after years of
development it probably does not look the same and is not recognizable anymore.
This is because single ideas and the workflow around ideas are often not
documented in a centralized fashion, meaning that there is not a database from
which one could see the development path and origin of ideas that have found their
way into the end product. In most companies, that is not the case with submitted
invention disclosures and patents, which are—or even must be—clearly
documented in the company’s management information systems. Consequently,
patent-based information can be retrieved from the database with relative ease and
relevant inventions can be isolated by virtue of a keyword search for inventors’
names, filing date, or project designation. Hence, although IP assets are by no
means the main product of employees’ work, patent data and especially a
systematic patent harnessing process, as in the case organization, deliver unique
157
insights into the generation of innovations and should be exploited when
quantifiably assessing the performance of idea generation processes.
As for the matter of the employees’ time or the organization’s budget being
divided between creative and uncreative activities, the quantifiable assessment of
idea generation effectiveness can pick one of two philosophies. First, it could be
noted that a great deal of the product developer’s time and budget is eaten up by
borderline duties with regards to project planning and documentation, reporting,
and other administrative tasks. Therefore, only the resources spent in product
development should be considered when evaluating creative performance and all
other responsibilities neglected if, for example, determining the ratio of invention
disclosures per man-year, or the cost of patents. It is known in the case organization
that some corporations track the time spent by their employees at a given accuracy,
such as quarter-hourly, but other organizations like the case organization do not
engage in that art of tracking. Additionally, the manner with which the budget is
being divided between product development projects is in many companies not
transparent, leading to complications when attempting to connect creative
outcomes to a given portion of the budget. Discovering the actual time and money
spent on innovating is thus difficult and prompts selecting the second philosophy
of evaluation: examining the organization as a whole and considering the overall
budget and time capacity. This approach is employed in Chapter 4 to compare the
efficiencies with which the case organization and the parent company produce
patents and is generally applicable to analyzing organizational entities on a higher
level. The presence of tasks, projects, and suborganizations with little to no input
in product development or creative activities cannot be excluded from the equation,
but an analysis of the creative performance of the total organization is possible.
This chapter has so far focused on the possible restrictions on the usage of the
defined value creation metrics imposed by other authors as well as empirical
considerations. The following section takes an opposite view by discussing the key
potential and various application possibilities of the proposed measurement model
to draw a better picture of common ideation metrics of the future.
5.2 Possibilities for the evaluation of idea generation outcomes
Notwithstanding the fact that the suggested value creation metrics for systematic
idea generation have their limitations and are not fully refined, one can identify a
number of opportunities and use cases for the measurement model not only to fulfill
its potential but also to assist in other organizations and scenarios. In terms of the
158
case organization, and comparable entities, the essential building block comprises
the patent harnessing process that is run in conjunction with the idea generation
process. Empirical researched showed that even a seemingly minor communication
problem within the process could have considerable negative effects on the overall
performance of the case organization, which again distorts the results provided by
the measurement model. A smoothly running patent process is both a requirement
for the reliable measuring of the value creation of creativity and a great possibility
for the organization to enhance the effectiveness of its systematic idea generation
scheme.
Additionally, numerous authors, e.g. Chusilp & Jin (2006), and Fuge et al.
(2013), have come across with problems and situations in their respective studies,
where the quantitative measures defined in this study could be of assistance by
providing different or, in some cases, better results than conventional creativity
metrics. The provisional implementation of patent-based value creation metrics in
these known scenarios gives insights into the broader use cases of the defined
measurement model and into answering the question whether the findings from this
single-case study are applicable in other cases as well. These findings are then
considered to discuss what kind of performance measures other corporations in
high-technology environments should be using to evaluate their idea generation
processes.
Another element that plays a significant role for the future of idea generation
measurement is the progress and integration of creative tools in the firms’ product
creation processes. As touched upon in Chapter 1, recent trends and new methods
in the field of idea generation, i.e. design thinking and agile innovation, call for
spontaneous ideation becoming an integral part of the innovation process that is
being constantly iterated over an intensive time period. What if such an approach
becomes the norm of any high-technology company in the future, and what kind of
implications does it have for the defined measurement model and the quantitative
evaluation of the value creation of creative activities in general? This section
elaborates on all above specified points to come up with a projection for future
value creation metrics in idea generation.
5.2.1 An ideal workshop process for patent harnessing
Figs. 10 and 11 in Chapter 4 described the initial and final outlines of the case
organization’s systematic patent harnessing process. Over the course of the study
159
in the case organization, a communication problem was discovered concerning the
notification of the inventor groups of their respective inventions being given a high
priority and being required to be submitted as a formal invention disclosure. As a
direct aftereffect, a sizeable gap formed between the number of new ideas that were
given high priority and the amount of actual invention disclosures that were
submitted to the corporate-internal patent department. Only after the process
outline and the roles of various stakeholders within the patent process were clarified
did the inventors receive timely feedback on their ideas and eventual
recommendations to produce invention disclosures.
This example highlights a key issue: measuring the performance of a creative
process such as idea generation based on patent information incorporates several
subprocesses, stakeholders, and processing methods, building up a web of
interrelated factors and elements. An issue or a change in one part of this chain
could have significant effects in other parts, leading to a demand for high levels of
transparency across all elements, be it the documentation of workshop results, the
communication of patent department’s feedback, or backtracking on patents to
learn which innovation workshop they came from. In this respect, the case
organization, like presumably many other organizations, has a lot of room for
improvement.
First, there is a requirement for an idea documentation and storage database in
the case organization to assist in tracking the value creation as the outcomes of
innovation workshops move through the parent company. With the help of such a
database, it would be possible to find out how many ideas were generated in which
workshops by which participants, how many ideas were processed into internal
invention disclosures, how many of those were accepted, and which workshops,
participants, or topics have resulted in most new ideas. Additionally, one could
naturally also combine that knowledge with the cost factor by including the internal
costs of facilitating each workshop, to discover exactly how much capital was
required to generate a given amount of high-quality ideas. Currently, the case
organization is only able to approximate such numbers. An idea database would
further support the preparation and execution of workshops as old ideas could be
put into use as a source of inspiration for new solutions in a similar or relevant field
in the form of “idea recycling”.
Second, it can be deduced from Table 31 and Fig. 13 that even though the case
organization produces more invention disclosures and patent applications per man-
year and per euro than its parent company, the acceptance rate of invention
disclosures for all inventions in the parent company is roughly 70 percent while in
160
the case organization it is about 55 percent. Bearing in mind that most of the raw
ideas, for which invention disclosures were drawn up, had already been reviewed
and flagged by patent professionals, and assuming that the ones from the parent
company consisted of an unfiltered mass of invention disclosures, the case
organization’s quota remains surprisingly low. It may have to do with the fact that
the inventors and co-inventors were “forced” by an external body to fill out the
forms and thus perhaps did not do so as thoroughly as they could have with their
highest motivation and inspiration. One way of addressing this consists of giving
the workshop participants the possibility to utilize the premises of the case
organization after workshop hours to calmly sit down with the original inventor
group to refine and discuss the idea further while formulating the invention
disclosure at the same time. It remains to be seen whether this has a positive effect
or any impact at all on the overall percentage of accepted invention disclosures in
practice.
Third, the case organization often has worries about the fate of the solution
concepts that were created within the framework of its innovation workshops
because, in its role as an internal service provider for creativity facilitation, it is
incapable of following up on the results of a particular workshop and seeing if the
high-quality suggestions are implemented (see Fig. 9). While it is acknowledged
that one workshop often leads to the emergence of several ideas that, if realized,
would be highly beneficial for the parent company, it is not known for sure which
ideas if any are put into practice, unless the case organization and the ordering party
happen to come in contact again.
For this reason, the case organization should extend the reach of its systematic
idea generation process by including a “debriefing” with the client party in the
weeks after the innovation workshop, as well as a follow-up meeting from three to
six months after the event. The purpose of the debriefing would then be not only
going through possible learning points and feedback to improve the long-term
workshop process but also discussing the progress on implementing the ideas and
the completion of the to dos and next steps listed at the end of the workshop or
whether the case organization could provide assistance with its creativity
techniques over the course of the remaining project. In contrast, in the follow-up
meeting taking place several months after the workshop, the focus would shift into
the direction of tracking the development of individual ideas that were generated.
More specifically, the patent situation concerning these inventions should be
clarified and any remaining invention disclosures submitted, the status of
161
corporate-internal realization of the solutions would be examined, and the overall
significance and benefit of the workshop reviewed to draw further learning
experience that could improve innovation workshops in the future. Introducing
these two meetings to the case workshop process can aid the preparation of
upcoming idea generation workshops, and act as a reminder of sorts to ensure that
already existing ideas are both legally secured in patents and implemented in
relevant parts of the parent company to bring about practical advantages. An
extension of this philosophy would be the adoption of a digital idea tracking system
where each idea is given an identification number with which it would be possible
to follow its movements as well as the actions taken towards the idea’s realization.
This kind of a solution is costlier and more difficult to implement for the parent
company but has a great deal of transparency and benefits that are not limited to
just the case organization and its idea generation process.
Fourth, within the framework of the patent process, it is being discussed in the
case organization whether the key innovations of the parent company should be
more carefully secured in the patent landscape by means of submitting invention
disclosures for secondary and adjacent solutions not targeted in first hand by the
corporation but what could potentially be exploited by competitors once the
original solution is brought to the market by the case organization’s patent
enterprise. This bears similarities with the strategic patenting principles, including
defensive patenting, as presented by, for example, Okuda & Tanaka (2011). Yet, it
is not in the case organization’s hands, nor is it its intention, to alter the patenting
strategy of the larger parent company. Instead, the aim here is to ensure that the
parent company’s product development department has FTO, and that the
company’s customers are offered USPs, which are the direct combined result of
creative idea generation and efficient protection of the company’s key innovations.
Achieving such a feat calls for an expansion of the systematic patent harnessing
process to cover “patent workshops” where inventor groups are tasked with
producing alternative solutions specifically to the core innovations identified as
strategically valuable. None of the above is currently being put into practice in the
case organization, but clearly the potential of the patent process is still far from
becoming fulfilled, which translates into intriguing possibilities for improvement
in the future.
In summary, the prospect of utilizing patent-based metrics for idea generation
offers a range of opportunities for improving the processes behind creative ideation.
Systematic idea generation requires itself to be measured in a systematic manner,
which can be assisted through building an idea database, improving the
162
communication in the workshop process, or debating over the role of new ideas and
innovations in the corporate culture, to name a few building blocks. The next
section extends this viewpoint by investigating the effects of using the proposed
measurement model in known use cases in other fields.
5.2.2 Future value creation metrics in idea generation
The high-level goal of this research is, on the one hand, to extend the scientific
knowledge of idea generation by defining quantitative value creation metrics that
offer an alternative to the thus far primarily utilized qualitative indicators. On the
other hand, this study seeks to provide a model as a solid foundation upon which
common future idea generation metrics can be founded. The requirement for a
standardized measurement model is strongly present in the literature, as Glassman
(2009) puts it: “For idea generation there are no general metrics which span across
industries. Instead, an innovation manager must select idea generation metrics
based on the strategy of their company and their current idea needs.” Kerzner (2014)
shares this line of thought by stating that there are no established metrics that
measure ideation effectiveness during R&D activities.
A part of the reason for the lack of common idea generation indicators must
relate to the appearance and characteristics of metrics that have been defined by
previous authors. The research conducted by Shah et al. (2000, 2003) opened the
field of idea generation outcome evaluation and since then, many studies have
followed the original path: developing criteria by which a selection of ideas can be
graded and classified, usually by a group of experts or judges. This approach may
seem logical as a starting point for further scientific research but has little use in
the private sector with fierce competition and little time or other resources to be
spent in evaluating ideas in a qualitative and intangible fashion. The metrics for
idea generation that have been presented in the literature are typically too
qualitative in nature for precise analysis, on too high a level to pinpoint
inefficiencies in the process (e.g. ratio of new products to invested capital, or
market share growth due to new products), or too complex to determine with
adequate accuracy in practice (e.g. the number of new ideas that have been financed,
or the number of ideas converted successfully to products). Another issue is that
none of the indicators from the current literature answer the questions set by the
objectives of idea generation according to the GQM method. The measurement
model constructed in this research manages, at least in the case organization, to
163
overcome these issues and deliver quantifiable results on the effectiveness of
creative processes.
It remains to be seen, however, how the proposed metrics fare when given other
situations, other sets of ideas in different forms, and other requirements. As an
example, Chusilp & Jin (2006) utilized the idea generation metrics defined by Shah
et al. (2003) in their study to evaluate the impact of the amount of mental iterations
on design performance and the quality of design concepts. In this case, patent-based
metrics could also have been used to evaluate and quantify the creativity of
produced solutions as concept design has the ultimate purpose of solving known
problems with solutions that are new, beneficial to the user, and non-obvious, which
are incidentally the common criteria for patents. Therefore, a patentability analysis
on the designed concepts would provide an initial categorization of the product
ideas into innovative and not innovative, and combining the classification with the
time and monetary effort required to create the evaluated concepts could give
insights into design performance founded on quantitative metrics as opposed to the
qualitative assessments used originally. Additionally, one is then able to bring the
mental iteration process into play and observe, which design concepts continue to
deliver new patent propositions as they are being further developed. In the end, the
most creative concept could spawn a family, or a tree, of patentable inventions,
which would then act as concrete evidence of higher design quality. Naturally, the
design concepts that are being evaluated should not be purely esthetic depictions,
rather the functioning of the concept should play a central role as it is usually the
features and not looks that make an innovative product—and a successful patent.
In their study, Fuge et al. (2013) understand the problematic that surrounds
utilizing purely qualitative measures to approximate the value creation of idea
generation, and acknowledge that such metrics rely heavily on the opinions of
individual human beings, which are expensive to gather. To counter this, they (Fuge
et al. 2013) attempt to construct a complex probabilistic calculation model that can
automatically compute the creativity of a given set of ideas based on set criteria.
While the upside of such model is that it can be trained to look for certain attributes
in the ideas to determine their novelty and variety, its major limitation is not being
able to assess quality or feasibility. Judging idea quality in an objective manner is
the common dilemma of many model-based creativity metrics, and various studies
resort to qualitative metrics either as a replacement until universal quantitative
metrics for creativity emerge or as a way of validating the results delivered by
rudimentary evaluation models. In the case of Fuge et al. (2013), the metrics
founded on patent information suggested by this study could be adopted to
164
complement the mathematical calculation models so that there is no need to rely on
external experts to produce a statement on the ideas’ quality and usefulness. Instead,
the probabilistic model can be used to determine the variety of ideas, for example,
whereas knowledge of the quality and novelty of the ideas in the pool is provided
by reflecting them against patent criteria.
It can be deduced from the literature research in Chapter 3, and from the brief
analysis of cases highlighting the known problems regarding idea generation
measurement, that the measurement model constructed in this study does indeed
have use cases outside the case organization, as long as known requirements are
met and limitations acknowledged. From a literature perspective, the main issue
solved by the defined value creation metrics is the near-complete lack of defined
quantitative and transparent metrics for idea quality and the performance of an idea
generation process. Designing metrics to fill that gap is not straightforward nor can
be achieved overnight—Kerzner (2014) even goes on stating that metrics to
identify progress toward creativity are the hardest ones to devise. Assuming that
the foremost goal of idea generation outcome measurement is to produce a method
for accurately detecting the monetary worth of an idea based on data that fulfills
the criteria of objectivity, the patent-based model delivers first insights into
approximating the monetary worth of “good” ideas. Evidently, it is the proximity
to financial factors and the high standard of documentation characterizing patent
information that makes this feat possible. However, these traits of patents also open
a range of future possibilities for analysis to combine with that of idea generation.
Building on patent-based metrics, many of the recent developments and trends
in the fields of R&D, innovation management, and data processing offer intriguing
options to expand on idea generation measurement. For a start, one can take
advantage of data mining techniques when examining companies’ patent portfolios
in conjunction with knowledge from idea generation to draw conclusions on the
collective attributes, elements, and backgrounds of high-quality ideas. Eventually,
it might be possible to discover from patent information which workshop types and
elements, creativity techniques, group constellations, facilitation approaches,
design philosophies, etc. produce the highest amount of high-quality solution
suggestions to given problems, which in turn would greatly benefit the facilitation
and preparation of future workshops and thus contribute to the knowledge of
creativity and systematic idea generation effectiveness in general. The capability to
found statements on correlations and patterns supported by facts rather than
assumptions to detect upcoming changes before they are visible to the person and
165
to collect external impulses from around the world as inspiration for product
innovation (Wenning 2015) are one of the key reasons why this type of big data
should and most likely will be taken advantage of in creativity evaluation and
innovation management in general in the future.
Besides a systematic idea generation process, patent information-based idea
metrics can find their use in the fields of idea management and open innovation.
As in innovation workshops, a closed model of innovation, the ideas posted by
individual employees from around the organization can be evaluated similarly to
quantitatively estimate the value creation performance of an idea management or
open innovation system. In practice, though, this would require filing invention
disclosures either for all submitted ideas or for the ones that have passed some sort
of a prescreening performed by PPs, comparable to the procedure of the case
organization’s patent harnessing process. In this manner, a researcher could draw
conclusions on the relative efficiencies of closed and open innovation systems by
presenting a quantifiable comparison of the respective processes’ outcomes. Such
a study would provide further clarity to the scientific field of innovation research,
as today’s organizations, especially in the private sector, are divided on the matter
of closed vs. open innovation and most big players in high-technology industries
incorporate elements from both approaches to create their customized idea
generation model, or have built separate processes for both types of creativity
encouragement, such as the case organization’s parent company.
Realizing many of the possibilities for the suggested measurement model for
idea generation discussed in previous paragraphs demands substantial research
efforts in terms of mapping out the various blank areas of patent-based creativity
measurement. As such, the topics gone through in this section bear many common
attributes with potential areas for future research that stem from the platform
constructed by this study, which are outlined more carefully in Chapter 6. In any
case, it is noted that the measurement model proposed by this research could find
far broader applications both in science and industry and expand the state-of-the-
art collection of value creation indicators for idea generation.
5.2.3 The new role of innovation workshops
The currently suggested value creation metrics are designed for a system where
idea generation acts as one, early phase in an organization’s product development
process, with its main task being the conception of new products, components, and
features, which are then realized afterwards over the course of technical
166
groundwork. The central assumption here is that the acute need for creative idea
generation is only very high for a short amount of time and it makes sense to
organize several innovation workshops at this exact point so that employees have
creative ideas to go on with and that a common target picture is formed for the
organization. However, the most actual trends in the field of innovation, i.e. open
innovation, agile innovation, gamification, and especially design thinking,
necessitate the transformation of product creation from a long, closed process into
an iterative procedure to benefit from customer co-creation, motivational game
elements, and rapid prototyping, to name a few. It is, therefore, expedient to debate
whether systematic idea generation processes, or innovation workshops in general
remain the same amidst these changes over the coming years.
For instance, the parent company of the case organization is evaluating the
prospect of reorganizing its idea generation platforms to better support rapid
development cycles, cross-organizational and cross-industry innovation exchange,
and to encourage employee involvement in streamlining processes. In practice, this
would mean the case organization withdrawing from its role as an internal service
provider for creativity techniques, which are offered for everyone, and in turn
convert itself into a CoC for creativity that works closely with select parties inside
the parent company and takes part in the product conception process in a time scale
that is considerably longer than the duration of one or two workshops per topic, as
it was previously. The case organization could then focus on a range of reoccurring
topics and specialize in facilitating a range of “mini-workshops” in rapid succession
instead of individual longer ones, using creativity tools that are best suited for
iterative loops of idea generation—a usual characteristic of modern innovation
processes. In the end, the case organization would become an integral part in the
parent company’s product development process in all of its phases, and be longer
accessible for any internal third party client wanting to organize an innovation
workshop.
The immediate consequence of such a shift in R&D philosophy would in all
probability be the destructuration of the case organization’s idea generation and
patent harnessing processes since they are then not conducted in a linear fashion
anymore. This would, furthermore, put the usefulness of the defined patent data-
based metrics in doubt because the dynamic way of working causes the barriers
between single ideas and inventions to become blurred and ideas are most likely
not documented separately. Hence, although strategically important innovations are
without doubt still be filed as invention disclosures, it would be virtually impossible
167
to calculate the percentage of high-quality ideas, the ratio of patents to invested
capital and man-years, or the overall value creation attributable to idea generation
with the measurement model suggested by this study. The case in question would
require a set of own metrics to quantitatively estimate the value creation and
effectiveness of idea generation in an iterative process.
Another important question that arises from a review of the current trends in
innovation is whether the emphasis of practitioners in the field of idea generation
moves strongly towards more newly discovered approaches to innovation, such as
open innovation. Innovation workshops are, after all, a typical example of closed
innovation as the workshop is often only involves corporate-internal experts of the
respective topic and involves little external input; rather, it is mostly senior
management or product developers themselves that initiate the workshops.
Although making sure of having heterogeneous groups as workshop participants
certainly helps to broaden the view of the examined problem, more is needed to
fully exploit the advantages of open innovation principles, discover better ideas,
and create value (Chesbrough 2003, Chesbrough & Davies 2010). Perhaps the
workshop of the future takes the form of an idea generation platform that brings
together creative communities from inside the organization, from other
organizations, and from around the world to discover, work on, and improve
generated ideas. The innovation workshops might then not be initiated by
management or R&D specialists anymore but instead by normal end-users, third
party component suppliers, or even rival companies, for example.
In this kind of an environment, the innovation process as it is known today will
most probably change shape, along with the classic workshop constellation, which
would simply no longer fulfill the requirements of creativity: a single group of
people working together in a room to generate ideas to solve a problem is too
isolated, not connected enough, and not aware of the various demands of people
and institutions that are not participating. Companies that stick solely with closed
innovation principles would then take the risk of “being left out” when creative
communities and innovation alliances are being formed. However, since the current
scientific literature cannot provide evidence showing that closed innovation is
being “killed off” in organizations on a large scale, the discussion above remains
pure speculation. Therefore, from today’s perspective, the findings of this study
remain intriguing for practitioners and researchers alike.
The future offers indefinite possibilities for innovation management, idea
generation, and the quantitative measurement of creative performance. The real
challenge involves predicting which way and when does the scientific and industry
168
norm for the product creation process evolve. The measurement model defined in
this research aims at evaluating the performance of a straightforward idea
generation process in a high-technology field, and, although it shows a certain
amount of flexibility to be implemented in a variety of use cases, it is not suitable
for estimating the performance of a radically different process, such as an open
innovation or a design thinking process. The question regarding the future of closed
innovation workshops remains an intriguing one, not just from the viewpoint of the
designed metrics, and will dictate the manner in which organizations seek to
quantify the output quality of their idea generation processes.
5.3 Summary of the discussion part
The discussions on the implementability of quantitative value creation metrics, the
development of creative processes, and the future of idea generation metrics aimed
to examine whether the quantitative value creation metrics of this research could
be applied in other organizations to become the future norm for idea generation
effectiveness measurement. To this end, five points are identified based on the
findings from both the literature research and empirical studies in the case
organization.
First, theoretical and empirical considerations pinpointed certain restrictions
and limitations regarding the proper utilization of the proposed patent-based
metrics. It is established that the indicators in question only deliver valid results on
the effectiveness of an idea generation process when applied in a high-technology
environment, these measurement results are affected both by the organization’s
patenting strategy and geographical or cultural background, the estimations
provided by the suggested metrics are ultimately not accurate, some organizations
choose to rely on other methods than patents for the protection of innovations, and
the quality of produced ideas cannot be determined right after the innovation
workshop due to the lead times associated with invention disclosures and
acceptance of patent applications. The issue of accuracy is underlined by the fact
that it is extremely difficult, and in some cases impossible, to separate the time and
budget spent exclusively on idea generation as it is often curtailed amidst a number
of technical and administrative tasks within the PCP. Therefore, the constructed
measurement model is more suited to assessing the performance of an
organization’s idea generation process as a whole, including potential non-creative
activities.
169
Second, patent information-based value creation metrics do, nonetheless,
provide organizations with quantitative information about the quality of ideas that
come out of an idea generation process. The importance of this aspect should not
be underestimated as businesses particularly in the private sector more often than
not prefer transparent data with financial touch points in order to evaluate the
effectiveness of their processes. The case organization, for instance, has also long
sought to move away from established qualitative measures that are expensive to
use and difficult to interpret. As such, the suggested value creation indicators
generate information, on which management can traceably found their decisions,
and offer appealing benefits comparing to traditional idea generation metrics.
Third, the quality of the results delivered by patent-based measures is greatly
dependent on a network of stakeholders, subprocesses, and procedures, including
the workshop and patent harnessing processes, the patent department, and the
motivation of company employees to take part in IP protection. Empirical studies
in the case organization show that streamlining and improving the communication
in the critical elements in the chain leading up to idea generation can improve the
performance of the overall process, as indicated by the metrics defined in this study.
For this reason, the proposed measures can also be utilized to discover
inefficiencies in, and draw learning points from the systematic idea generation
process.
Fourth, the literature review reveals that there is a broader need for a common
measurement model for idea generation and for model-based metrics that would
complement the shortcomings of previous qualitative indicators. Even though
various authors have presented financial measures for the evaluation of creativity,
these approaches usually viewed the idea generation process from too high a level
to pinpoint inefficiencies, or were too complex to be produce robust measurement
results in practice. Further theoretical analyses demonstrated that patent
information-based metrics could have been utilized in other studies as a
replacement for qualitative ones to produce alternative results for the examined
cases.
Fifth, the field of idea generation and innovation is undergoing changes with
the emergence of intriguing new philosophies and trends, i.e. design thinking and
open innovation, which potentially have a profound effect on the measurement of
the value creation of idea generation. The indicators suggested by this research are
designed to evaluate a systematic idea generation process with a clearly defined
beginning and end: a closed model of innovation. Should high-technology
organizations progress into the direction of rapid innovation and iterative idea

170
generation, it is probable that other metrics are better suited to judge the
performance of such a process. This represents an interesting topic for future
research and is elaborated in section 6.5.
The quantitative metrics for idea generation designed in this study can be
applied in other organizations given that specific conditions are met. The need for
patent-based creativity metrics is recognized as they are able to assess creative
performance in a way that is not possible with established measures, and companies
will likely seek to evaluate their systematic idea generation processes in a more
quantifiable fashion in the future. However, due to the unpredictable development
of innovation and idea generation practices, it is extremely complex to predict
whether the patent-based metrics will become the norm in creativity measurement.
171
6 Conclusions
The primary aim of this study was to examine idea generation effectiveness from a
quantitative standpoint by defining a set of transparent value creation metrics. The
research findings would then contribute to scientific knowledge of creativity
measurement, which is mostly associated with qualitative methods and indicators.
Now, it is essential to consider these findings from a critical perspective, not only
to confirm the contribution of this study to academia but also to debate on its
reliability, for instance. Hence, this chapter delves into the critical assessment of
this study by, first, exploring its potential larger implications, second, determining
its scientific quality by means of a critical evaluation, and, third, reviewing the
learning points to be taken from the research with regards to future research on the
subject.
Sections 6.1, 6.2 and 6.3 take a closer look at this study’s major implications,
respectively categorized into three groups according to their nature: theoretical,
methodological, and managerial. Hereby, theoretical implications refer to the
capability of the findings to extend the academic literature relevant to the
investigated field, methodological implications to the suitability of the selected
research method and the optimization proposals regarding research design with
particular emphasis on potential follow-up research, and managerial to the effects
this study has on the case organization as well as the industry in general.
Subsequently, the key limitations and reliability of this research are covered in
section 6.4, elaborating on the considerations about the limitations of defined value
creation metrics in section 5.1, along the guidelines presented in Chapters 2 and 3.
The central aspects of internal validity, construct validity, external validity, and
reliability (Cook & Campbell 1979) represent the specific elements here that are
utilized to rate the success and meaning of the overall study.
Finally, section 6.5 addresses the requirements for further research that have
been recognized, listing potential topics which, when examined, could build on the
findings of this study and thus deliver an additional contribution. In addition, the
position of this study in the research roadmap dedicated to ideation is discussed.
6.1 Theoretical implications
It must be noted that the findings of this research, albeit being based on a single-
case study, have significant theoretical implications. Both previous and present
studies in the field of ideation outcome evaluation concentrate in their individual
172
approaches heavily on metrics founded on human judgment. Even the supposedly
more quantitative models presented in the literature (such as the sum-of-quality
score presented in Table 20) are used only after a preliminary categorization of the
idea generation outcomes has been performed by expert evaluation. Similarly, the
only broadly used criteria to estimate the effectiveness of systematic idea
generation—novelty, variety, quality, and quantity (Shah et al. 2003)—come with
the assumption that ideas are graded qualitatively as no quantifiable means is
provided, nor has such been developed by other authors, to approximate aspects
like quality.
This study has, for its part, overturned the ever more popular assumption in the
scientific community, which states that the quality of the output of a creative
process cannot be measured rigorously. This notion represents most significant
theoretical implication of this study. Notwithstanding the fact that the theoretical
framework for idea generation does not explicitly suggest that a quantitative way
to assess creativity could not be discovered, there are only a few studies to have
tried to accomplish that and even fewer that have presented concrete metrics that
can be used to quantify some elements in idea generation effectiveness. Most of the
latter kinds of studies have had their discoveries mainly limited to measuring
novelty and variety, not quality. Yet, this research shows that a mechanism can be
realized to judge idea generation effectiveness on quantifiable terms, even with
regard to idea quality, while producing fact-based information about the examined
creative process. Now that this barrier, which has restricted both the breadth and
scope of the research on the evaluation of the value creation of idea generation, has
been removed, hopefully researchers acknowledge the potential in the field and set
out to fulfill the remaining knowledge gaps and build on the platform of
quantitative creativity research. Concrete topics conceivable for such research are
covered in section 6.5.
Another significant implication for the theoretical literature is concerned with
the measurement model defined by this study to estimate the value creation taking
place in the case organization’s idea generation process on a quantifiable basis. This
collection of metrics illustrates the first robust process for evaluating the case
organization’s effectiveness and one of the first practical approaches to
approximating the financial worth of creative outcomes in a high-technology
industry. As such, this research adds to the understanding of the early phases of a
product creation process and extends the scientific knowledge of creativity
measurement—within the limitations of the suggested metrics that are specified in
173
section 5.1. As a direct result of applying the GQM approach, patent data was
selected as the base for value creation metrics, and the findings of this research
support, among others, the viewpoints of van den Hoed (2005) and Lin & Cao
(2012), arguing that patents enjoy superiority in measuring ongoing knowledge
creation activities. Still, this research also underlines the remarks by Popp (2005)
and Adelman & DeAngelis (2007), emphasizing that patent information should be
interpreted as the effect on an average patent rather than specific innovations, and
that patent-based metrics must be analyzed with great care from different angles in
order to accurately depict the studied phenomenon due to their often difficult-to-
read and misleading nature when viewed from only one perspective. Such
deliberate attitude to patent data has been displayed by this study, yet it is admitted
that the designed quantitative metrics are in effect tailored for the case organization
and that extending the scientific theory on quantitative value creation measurement
in idea generation even further would require additional studies in other institutions,
environments, and situations.
A third implication for theory has to do with the new opportunities offered to
scientific research through the emergence of technologies and with the way that
studies can be conducted today. Patents are a prime example of knowledge that has
become universally available in masses and in real time thanks to electronic
archives and databases. As per the statements and predictions of Wenning (2015)
regarding big data, there are numerous possibilities to be discovered within the
large quantities of data that is consistently gathered by information systems today,
which can help researchers and institutions to found statements on correlations and
patterns supported by facts rather than assumptions and to detect upcoming changes
before they are visible to the person, for example. This research is one of the first
in line to exploit fact-based data within the framework of idea generation evaluation,
and one is bound to ask the question: what other uses can be found for data mining
approaches in the scientific research on creativity, new product development, and
other fields? If a single-case study, such as this dissertation, can contribute to
common idea generation theory based on the analysis of data from two main
sources (as clarified in section 2.3), a multiple-case study should have similarly
revelatory results when using large volumes of quantitative data to its advantage.
This final point is discussed in more detail at the end of this chapter, in the context
of potential topics for future research.
174
6.2 Methodological implications
Besides theoretical ones, the findings of this research have also methodological
implications. The study was conducted according to a holistic single-case study
design, which allowed for a detailed, longitudinal examination of the selected case
and the design and testing of a model for measuring ideation in the context of the
case organization. The applicability of such an empirical approach to defining value
creation metrics for idea generation was tested by means of experimenting with the
resulting measures in practice and assessing their strengths and limitations based
on both empirical discoveries and theoretical considerations from the scientific
literature. This research delivered carefully formulated answers to the two research
questions defined in Chapter 1, which contribute towards filling identified gaps in
academic knowledge. It can be stated then that the case study approach is applicable
when exploring the idea generation process of a particular institution, with some
restrictions and recommendations. More specifically, the empirical method is found
suited to dive into and generate new knowledge in a relatively unknown field, as a
way to overcome the first barriers in forming new theory. Yet, the core strengths of
case studies also reflect their weaknesses; flexibility, empiricism, and case-
specificity often convert themselves to problems regarding accuracy, theoretical
validity, and generalizability (Gibbert et al. 2008).
Although the selected single-case study research design delivered purposeful
results, it does not mean to say that other research approaches do not achieve that,
or even turn out to be more suited for the studied topic. Opting for an embedded or
a multiple-case design has its advantages over this study, namely the increased
generalizability, reliability, and, one can argue, accuracy of the results. However,
on the other hand, it is the key benefit of a single-case research design to take the
uniqueness of the studied entity into account, which is something very difficult for
more structured or higher-level studies to achieve. Perhaps a compromise of the
two could be realized, for example, through managing the systematic ideation
process and the patent harnessing process of the case organization as separate units
of analysis and developing value creation metrics individually for both. In that
manner, identified problems in one entity can be isolated and false interpretations
as to the effectiveness of the overall process avoided: the discovered problem in the
patent process presented in subsection 4.2.2 acts here as a prime example.
Nonetheless, a decisive remark regarding the relative suitability of alternate
175
empirical research designs can only be made after a study exhibiting an alternative
design has been conducted.
Another point with regard to the methodological implications of the research
concerns the deliberate restriction of the study on solely quantitative methods and
measures. This is because from a managerial point of view, fact-based numerical
information often provides organizations, like the case organization, with a more
reliable basis on which to base their decisions. However, it is still debatable whether
these quantitative metrics should be supported by a number of qualitative factors
for the sake of producing a more comprehensive picture of the examined case. This
study shows that the value creation of idea generation can be measured in
quantitative terms but the direction of future research and the development of
practitioners’ expectations with regards to creativity measurement activities remain
troublesome to predict. Expanding the scope of research to cover qualitative
approaches to measuring effectiveness as a way to support quantitative metrics may
provide new insights and help to remove certain limitations of the research that
result from the desire to focus solely on numerical data.
Therefore, upcoming studies in the field of creativity measurement should take
up on the remaining potentials and restrictions of this study in terms of research
design and methodology. Clearly, at the beginning, case studies must be utilized to
generate initial knowledge by revealing undiscovered patterns. Later, empirical
research with a higher amount of cases as well as other more structured research
methods should be preferred to convert the practical findings into general theory
more accurately. The emphasis should then lie on viewing the value creation of
idea generation from multiple viewpoints at the same time so that no intriguing
aspects of the process are missed and the drawn big picture becomes as reliable a
depiction of reality as possible. Section 6.5 discusses the angles and forms these
future studies should take in more detail.
6.3 Managerial implications
This research has additional managerial implications, in particular three that are
worth considering here more carefully. First, the findings of this research imply that
idea generation as a process can be measured rigorously like most other business
processes in a technology company. This research thus supports the common
viewpoint among executives that managers should seek to measure innovation and
creativity, although they are regarded as processes with many intangibles, in the
same way as other core processes of the organization, relying on fact-based metrics
176
and robust measurement practices (Boston Consulting Group 2008). Actions must
be taken to that end to determine the value creation of the earlier phases of the
innovation process and the metrics to approximate it in quantitative terms. This
dissertation demonstrates merely one design for exploring that area and achieving
that goal.
Second, the results of this research are found to be extremely useful for the
managers both in the case organization and its parent company. More specifically,
this study delivers a ready-to-use framework for a transparent assessment of the
case idea generation process’ effectiveness, which has up to now already been
implemented in practice to help the facilitators in the case organization manage the
process in the future. This framework enables employees not only to learn more
about their process based on factually proven data, which was not possible before,
but also to obtain an overview of the performance of single workshops, creativity
techniques, facilitators, etc. in real time, any time. Gaining access to this data in
turn allows for further analyses on a deeper level, which assists the case
organization in continuous improvement, learning, and process optimization
activities. To add into that, the framework provided by this study can also act as a
benchmarking platform on which to base future studies that reflect on the relative
effectiveness of the case organization’s process with the help of comparable
quantitative data from other organizations. The combined effect of revealing valid
new information about the studied process on which to base decisions and opening
unforeseen possibilities for further investigations and data breakdowns to generate
even more knowledge constitutes the main contribution of this research, from the
managerial viewpoint of the case organization.
Third, the findings of this study suggest that the quantitative approach to the
evaluation of creative outcomes and the value creation metrics utilized for that
purpose in this study could be adopted by other organizations in a related field to
pursue similar knowledge benefits in their processes. The contribution of this case
study would, then, take one of two forms: it would either act as a sign of the
quantitative assessment of ideation processes being possible, and so motivate the
organization to seek the exact measures that are best suited to its characteristic
needs, or directly provide the measures that the other company would then adopt
into its own evaluation procedures. It should be noted here that each case is by
definition unique and must be treated accordingly—a notion with ripple-effects
throughout not only the question of applicability in other companies but also the
matter of study validity in general. For this reason, practitioners must exercise great
177
care when drawing learning points from the findings of this study, above all with
regards to directly implementing philosophies and practices. Preferably, it is the
open-minded research approach and the systematic, fact-based design that other
entities take along to their contexts and work their way towards defining a
measurement model that is tailored for their individual needs. As for the matter of
research validity, it is thoroughly discussed in the next section.
6.4 Critical assessment
The critical evaluation part of this study can be broadly divided into two halves:
the limitations of the research and its results and the debate on general reliability
and validity of the findings. When it comes to the limitations of the study,
section 5.1 provided a preliminary analysis of the applicability and restrictions of
the value creation metrics suggested for the case organization. The underlying
skepticism here stems from the multi-role position of patents in today’s companies:
they are used as a political and strategic tool to manipulate rival organizations, are
dependent upon regional differences in patent practices and patenting cultures, and
only cover technological inventions, to name a few issues. For this reason,
exploiting patent information when determining the value creation of the early
phases of a product creation process has serious limitations as researchers need to
be careful not to rely solely on IP data in contexts where they provide little insight
or cannot reliably indicate anything about the studied process.
This research takes note of these known issues regarding patent data and is sure
to draw conclusions based on it exclusively in high-technology contexts, while
considering the effects posed by patenting strategies, regional variations, and so
forth. However, besides the applicability of the constructed measurement model,
the limitations of this study with regard to the research approach and design, data
collection procedures, empirical framework, and so forth must be acknowledged.
6.4.1 Limitations of the research
The first limitation of the study is related to its purpose and scope: Chapter 2
discussed that the core aim of this dissertation is displayed by two key research
questions, the first one being by nature explorative and the second descriptive.
More specifically, the theoretical parts of the study are explorative, whereas the
empirical phase is descriptive. The essential aftereffect of this attitude is that this
analysis does not, or even attempt to, explain the causal relations underneath the
178
studied phenomena and between variables, which is what an explanatory study
would excel at. Instead, it is the first and foremost goal of this research to seek new
insights into the quantitative estimation of idea generation effectiveness by means
of theoretical background research, deep examination of a real-life case
organization, and reflection of the data analysis results against presiding theories.
Thereby, an unforeseen set of measures would be defined that act as the central
output of the dissertation to the case organization and as one significant
contribution of this study. Discovering why the variables embedded in the process
function as they do and produce certain results falls outside the scope of the present
study.
A second limitation is caused by the longitudinal nature of the case study.
As such, the single-case study is only able to represent the studied events over a
given period of time, thus limiting the depth and detail of the analysis to specific
moments within this study’s examination period of three years. Nevertheless, it was
not the ultimate aim of the analysis to examine the case organization over a time
period in order to identify chronological patterns or predict upcoming change in
some variable. Rather, data was gathered over a relatively long period of time due
to the simple fact that for the sake of solid empirical conclusions, it was important
to consider as much data as possible since a larger sample would directly translate
into more accurate measurement results, at least in the case of this research.
Additionally, as touched upon in subsection 4.1.2, due to the alterations in the case
organization’s patent harnessing process, some of the data that is relevant for
analysis has only been gathered for a couple of years, meaning that a longer period
of examination would not actually be possible as this research already considers all
the information that is currently available. Hence, the limitation emerging from the
longitudinal analysis of the case does not play a major role from the perspective of
this study.
However, the time factor of considerations gives rise to another limitation in
terms of the nature of the data that is analyzed. As stated in Chapter 2, this study
utilizes both real-time and retrospective data as there are two data main sources,
one of which is directly accessible to the researcher while the other is only available
at specified times. Consequently, the relation between retrospective and real-time
data has to be contemplated since both are utilized in a mixed fashion during the
analysis stage to arrive at conclusions regarding the whole picture. The result is that
this study has a crossover point for data analysis when information from the case
organization is supplemented by that from the parent company, for example, in the
179
case of submitted invention disclosures and patents where the case organization
does not have access. The crossover point involves a potential mismatch of data, if
the documentation of the case organization cannot efficiently be combined with
higher-level information from the parent company. Ideally, only either retrospective
or real-time data would be utilized to minimize these risks, but in the case of this
study, unique organizational characteristics rendered such an approach impossible.
Nonetheless, this study recognized these potential issues and applied measures to
ensure the objectivity, comparability, and accuracy of the analyzed data—not an
insurmountable obstacle, considering that all data is ultimately gathered within the
same enterprise. Still, the simultaneous use of real-time and retrospective data
remains a limitation of this research.
The fourth main limitation of the study concerns the decision to opt for a single-
case as opposed to a multiple-case study, the rationales for which are presented in
Chapter 2. Unquestionably, multiple-case studies have restrictions of their own, for
example, regarding the lack of detail or depth in the analysis. Yet, criticisms about
single-case studies seem even stronger: earlier sections have already noted the most
significant ones, including the shortcomings with reference to research breadth, the
generalizability of the findings, and the scope of the study’s overall contribution to
theoretical knowledge. The strengths and weaknesses of single-case and multiple-
case designs are widely known, have been commented on by various sections, and
will not be repeated here in detail. This research chose a single-case design due to
the individual objectives, context, and background of the study. It is a choice
profoundly discussed and justified in subsection 2.2.2, and comes with limitations.
These limitations were, however, considered carefully throughout the course of the
research, especially during data analysis and the review on potential use cases for
the measurement model.
The problematic associated with examining only one case is also contributed
to by the fifth limitation discovered. The context of the study is formed of a major
corporation in the automotive industry based in Germany, leading to at least two
central concerns. First, the applicability of the research and its outcomes is
primarily limited to large, established enterprises acting in a highly competitive
global marketplace and a high-technology environment, such as the automotive
industry. This background by itself draws a picture regarding relationships with
rival organizations, the power balance with suppliers, governmental agencies, and
other institutions, and the significance of the new product development process.
Second, the company coming from a geographically limited area in Germany, albeit
conducting operations worldwide, puts a question mark over the possibility to
180
transfer the knowledge generated in this region to other contexts—the unique
characteristics of Germany concerning the automotive market have been clarified
by Cleff et al. (2005) in detail, a summary of which is illustrated in Table 2. In
addition, the German interpretation of patent law was utilized in defining the value
creation metrics for the case organization. These highly specified indicators may
not work in other regions due to contrasting definitions for IP and the different role
of patents. As discussed in the next section, the applicability of the research results
can only be extended to other companies of various sizes, geographical areas and
fields by means of carrying out additional research on the quantitative measurement
of effectiveness in idea generation in other contexts.
Finally, there are several limitations related to the theoretical analysis of this
research; for one, theoretical research requires, by its fundamental definition,
interpretation on behalf of the researcher. It is inevitable that the viewpoint of the
researcher is biased to some extent due to his personal experiences, background,
and education. Additionally, as this study bears the hallmarks of interventionist
research as presented by Suomala et al. (2014), the opinions and expectations of
the case organization itself will undoubtedly have, for their part, worked to draw
the researcher and the dissertation in a particular direction. Nevertheless, it was
possible for the researcher to detach himself from the rest of the organization at
regular intervals to analyze the measurement results and document the findings. It
can be thus stated that the researcher—while part of the studied organization—had
been operating independently over the course of the case study and was in a
position to resist being steered by individuals in the case organization or by the
research topic itself. Nevertheless, some subjectivity must be accepted during the
analysis, particularly during the literature research and the debate on potential
future metrics for idea generation, for neither primary nor secondary data is
available in either of these instances.
Furthermore, although the aforementioned literature review was conducted in
a lengthy and thorough fashion, it should not be claimed that the final selection of
samples that constitutes the citation framework used for this research covers all
previous studies that have contributed to the field of quantifiable idea generation
effectiveness measurement. This collection of literature includes various types of
scientific work—journal articles, books, sections of books, conference articles,
working papers, etc.—meaning that there are cited studies and work among the
samples that have not been reviewed by a relevant authority. Both of these factors,
the quality and quantity of previous research that has been considered, mirror the
181
resources allocated to conducting this research, and thus represent a further
limitation of the study.
6.4.2 Assessment of the research
The discussion on critical analysis now moves away from the limitations of the
conducted study and onto the assessment of the research itself. According to the
guidelines presented by Yin (1994), introduced in section 2.3, the general quality
of a study can be judged with the help of four criteria, each of which is considered
individually in the following paragraphs.
First, internal validity deals with the extent to which the researcher manages to
establish a causal relationship between variables, show how certain conditions lead
to other conditions, and demonstrate the logical reasoning that is powerful enough
to defend the study’s conclusions (Yin 1994, Gibbert et al. 2008). Yet, it is argued
by Yin (1994) that internal validity as a criterion for quality in case studies is not
applicable to descriptive and exploratory studies which do not attempt to explain a
given phenomenon or situation or to either prove or disprove a specific hypothesis.
Therefore, within the framework of this study that is both exploratory and
descriptive, internal validity cannot be applied as a measure for validity and is not
further discussed in this section.
Second, construct validity refers to the extent to which the study investigates
what it claims to investigate and whether its observations of reality and findings
are accurate (Denzin & Lincoln 1994, Gibbert et al. 2008). More specifically, Yin
(1994) divides the question of construct validity into two parts: (1) what changes
must be specifically studied with reference to research objectives, and (2) do the
chosen measures reflect the specified changes? Furthermore, he (Yin 1994)
introduces the most common tactics to employ to meet these requirements, which
include utilizing multiple sources of evidence, establishing a chain of evidence, and
having main informants review a draft of the case study report. With respect to the
first tactic, this research is restricted in terms of the variety of information sources,
as it is one of the key aims of the analysis to find clues on the effectiveness of the
studied process based on solely quantitative data. Still, although qualitative data
collection methods are out of the picture, this study gathers data from two separate
sources, adding significantly to construct validity in comparison to quantitative
case studies that only have one source of evidence. Furthermore, direct observation
was employed as a means for confirming patterns and phenomena that have been
identified during the quantitative research and makes up the overall triangulated
182
methodology, emphasized by Meyer (2001) as an important step towards higher
research validity.
The second tactic within construct validity calls for establishing a chain of
evidence. This represents an approach largely utilized in this study: the ultimate
findings of the research were not reached by analyzing one sample of information
but by going through a process of data evaluation. In essence, the initial analysis
was founded on evidence gathered in real time directly in the case organization,
preparing the groundwork for higher-level analyses. Then, data collected in the
parent company’s information systems was applied to extend the analysis and draw
up a comprehensive picture of the case process’ effectiveness. As a combined effect
of the two layers of analysis, a chain of evidence is formed, as illustrated in Fig. 12.
Additionally, even when the numerical data shown in this research report is in a
visualized form, all information was studied in its raw form during the analysis to
minimize errors and avoid false interpretations due to the modification of data.
Finally, the third tactic for achieving construct validity is concerned with
informants reviewing the case study report draft in its final form to reinforce its
statement. As no interviews were conducted in this research, the tactic in question
is not directly applicable; however, it must be pointed out that experienced
facilitators in the case organization were, for their part, involved in conducting the
research and, aware of its efforts and progress, in reviewing the gathered
information and findings as the study moved forward.
Third, external validity is chiefly associated with the question: can the study
results be generalized? Thus, external validity represents perhaps the single most
challenging barrier in empirical case studies but especially in single-case study
designs (Yin 1994). Because of these concerns, external validity in the context of
case studies is usually addressed to by analytical generalization—touched upon in
section 2.3—where the research findings are generalized to theory instead of to
other cases. In practice, the findings would here be mirrored against a collection of
existing theories to discover which theory or theories do the results of the study
support and which are contradictory to the findings. To this end, the literature was
reviewed in Chapter 5 to identify potential use cases for the measurement model.
Based on this, predictions regarding generalizability could then be made.
Consequently, it was discovered that that there is a wider need for quantitative
measures for effectiveness in idea generation that fit the profile of the metrics
designed in this study and that these metrics could theoretically have been used in
other studies as a replacement for qualitative ones. Due to the limited amount of
183
available literature on the quantifiable measurement of the value creation of idea
generation, a specific mapping of existing theories to determine which are
contradicted and which supported is not expedient for this analysis.
Generalizability also has to do with the possibility of replicating the study and
arriving at the same conclusions, which is exceptionally important within the
framework of the fourth criterion for research quality, reliability. The greatest
advantage of this study comes into play here: Yin (2009) praises the utilization of
quantitative data as research evidence by pointing out that a documentation-based
approach to data collection ensures the highest degree of precision possible in an
empirical case study. As the information relevant to this study was collected in
databases, the probability of fluctuations and biases in data quality, type, or content
is effectively minimized; therefore, the main area that remains open for variety is
the interpretation of the data by the researcher. However, data from the case
organization is presented in this report in its original, albeit visualized, form in such
a way that readers and other researchers can draw their own conclusions. In terms
of data collection, there is little doubt that the study is directly repeatable with the
same results, thanks to the quantitative nature of the collected data.
Yet, concentrating on quantitative data has further benefits—particularly in
reference to the two common tactics that are meant to improve the reliability of
case studies that are presented by Yin (1994). The first tactic calls for maintaining
a “case study protocol”, including detailed documented information about the steps
and measures taken by the researcher during the study to arrive at given conclusions
at the end. The documentation-based approach this research takes to data collection
and analysis automatically translates into the establishment of such protocol as
calculation formulas and intermediate results must be written down and portrayed
in the report to justify the presented findings and conclusions. The most serious
issue here is the documentation of research activities that take place before data
collection, namely during theoretical background studies, but especially when
designing the metrics and setting the direction for data collection and analysis. In
the context of this research, the goals of the study, just as those of the case
organization, were converted into concrete measures for value creation by
employing the GQM method. The method in question leaves the researcher a lot of
room for personal preference and interpretations with regards to finding the metrics
that best answer the questions that are defined in a similarly unstructured fashion.
It is, then, possible here that another researcher might opt for a different route,
which in turn would result in contrasting data requirements and probably other
conclusions at the end.
184
The second tactic for improving reliability according to Yin (1994) involves
creating a case database which incorporates all information gathered during the
case study and contributes not only to the ease of producing an overview of the data
but also to further benefits in neat and comprehensive documentation. Even though
the information gathered in this study was in databases to begin with, a separate
bank was indeed established for the case study to assist in storing, combining, and
evaluating the data retrieved from two separate databases. Additionally, having a
separate bank for case data enhanced the efficiency of data analysis as only relevant
information would be stored; in other words, information not directly associated
with the case organization could be filtered out. This point is especially important
regarding the information systems of the parent company that contain huge
amounts of data, most of which has nothing to do with the case study. As such, the
database created for the case further added to the reliability of the empirical
research.
6.5 Topics for further research
A strong need for quantifiable ways of measuring the effectiveness of creative
activities in an organization is easily recognizable and present in the literature. An
obvious approach would be to take the patent-based metrics defined by this study
and examine their applications and characteristics further by implementing them in
comparable or, alternatively, diverse companies and institutions. Such research
would give insights into answering the question whether the individual PCPs,
documentation practices, and lead times of the studied case organization render it
impossible to successfully use its metrics in other contexts and situations to
generate reliable data that accurately depicts the effectiveness of idea generation. It
must be kept in mind, though, that the patent-based framework used in this study
remains a relatively crude method of estimating overall performance in creativity
and can surely be optimized. Therefore, if this measurement model is treated as the
first step, further research should be conducted to take the next steps by improving
the quality, precision, and reliability of the proposed metrics. Alternatively, this
framework founded on patent information can be exploited as a platform upon
which new models of evaluation could be built. These models could then, for
example, help to learn more about the characteristics, backgrounds, and creation
contexts of high-quality ideas by digging deeper into the ideation process from a
185
quantitative value creation point of view and isolating the elements that influence
idea quality the most, as discussed in subsection 5.2.2.
However, future studies in the field should not be limited to ones that revolve
around the value creation metrics specifically created for this research. Other types
of measures for effectiveness in creativity facilitation must be considered: such
could be designed during case studies similar to this research conducted in diverse
environments and organizations, for example. One prospect would be taking on the
process-based approaches presented by, among others, Shah et al. (2003) and
Nelson et al. (2009), and examining whether a correlation could be discovered
between the emergence of high-quality ideas and certain cognitive patterns during
innovation workshops. Could idea generation effectiveness then be quantitatively
measured through, for example, the amount of interaction in the workshop group,
monitoring the activity in certain parts of the human brain, or even by tracking the
number of “productive breaks” made by the participants? These are only a few
exemplary aspects to consider. Despite its complexity, the process-based approach
to idea generation effectiveness remains an intriguing field for future studies. These
studies would then be able to discover whether different metrics suit the
practitioners’ needs better than the ones proposed by this study, and thus start to
map out the roots and branches of quantitative value creation metrics for systematic
idea generation in general.
As mentioned before in this chapter, generating further knowledge about the
measurement of idea generation performance would also provide economies of
scale for relevant scientific research, if empirical data from different studies could
be reflected against each other and compared to reach new findings and draw
further conclusions. For instance, if parallel case studies can find ways to
approximate the monetary worth of an idea in numerical terms similar to this
research, an opportunity for benchmarking would emerge, leading to benefits for
both the scientific community and the studied case organizations. As a start, the
findings of this research regarding the value of “good” ideas as well as empirical
data on the case organization can be used as a reference point in upcoming and
related research projects on the subject.
Nevertheless, as section 5.3 also strongly emphasizes, idea generation and, by
extension, the measurement of creative performance is such a dynamic and fast-
paced field that it is very difficult to project in which direction is it going to develop.
One must, hence, also ask the question: what does idea generation in the future look
like in general, and what if it is going to be very different in comparison to today?
In case open innovation or design thinking become the norm for product creation,
186
idea generation performance indicators need to be adjusted as well, providing an
intriguing topic for studies.
Finally, topics for further consideration in the context of the case organization
were identified for the purpose of devising recommendations for action. For one,
subsection 4.1.1 discussed the role of the case organization in the parent company’s
PCP, while discussing whether the value creation of the case process could be
depicted by means of removing the case organization’s input from the overall
process and making predictions on the aftereffects. Within the framework of this
study, it was concluded that the data requirements for such an analysis and the
involvement needed from a great number of other entities inside the parent
company are unrealistic and not achievable with the resources allocated to this
research (for an illustration of the visibility of ideas from the case organization’s
viewpoint, see Fig. 9). Yet, taking on this approach as an alternative method for
evaluating the value creation taking place in the case organization’s process
represents an interesting prospect for the future as it not only supplements the
analysis by taking an extra viewpoint into account but also helps to put the
measurement results gained with patent-based metrics to scale.
A second point that is raised also concerns the limitations of the patent data-
based viewpoint. Patent information as a performance indicator only applies to idea
generation that produces technological solutions, and Table 29 indicated that such
workshops of technical nature make up less than 20 percent of all workshops
facilitated by the case organization. An attempt to extend the measurement model
of this study is inevitable as the effectiveness of other types of idea generation, such
as strategy workshops, process-centered cost reduction workshops, and other
workshops with no relation to technical problems, also needs to be measured
rigorously based on quantitative information. It is now the task of the case
organization and of the scientific community in general, to suggest and test
measures that are suited for these alternative forms of idea generation as patent
indicators clearly cannot assist here.
The quantitative evaluation of idea generation performance, as a relatively
young field in the context of scientific research, involves many white spots and
intriguing topics for future studies. It was not the aim of this section to list all of
them, rather to merely provide an overview of the main research areas where new
knowledge is most urgently needed. Still, as the available literature on fact-based
measures in creative idea generation remains limited, it is the central suggestion of
this study that more case studies in this field similar to this dissertation are carried

187
out to further clarify the characteristics of value creation during early-stage product
creation activities and the means for translating them into a tangible form that is
easy to interpret and communicate.

188
189
7 Summary
The background to this study was the notion that organizations need to discover
more rigorous means for evaluating the effectiveness of their processes, even the
ones that are traditionally regarded as non-measurable. At the same time, other
studies have presented evidence pointing out that the innovative ability and
creativity of companies plays an increasingly important role in today’s fast-paced
market environment where customers expect new captivating products at regular
intervals. Should a company be late in recognizing inefficiencies in the early phases
of its new product creation process, it could do severe and long-lasting damage to
the organization’s business and survival as a whole.
Correspondingly, the central objective of this research was to study the value
creation taking place within the systematic generation of ideas and define a fact-
based measurement model. This constituted designing a set of transparent value
creation metrics for creative idea generation, thus enhancing current knowledge of
idea generation measurement that has traditionally concentrated on qualitative
methods when discussing the evaluation of creative outcomes.
Two research questions were derived from the objectives of this exploratory
study. The first question approached the topic from a conceptual point of view,
highlighting the problem of finding quantitative metrics to evaluate creative idea
generation, given that most previous studies have focused on human judgment-
based methods. Yet, theoretical analyses showed that other studies have had success
in implementing robust value creation metrics within the framework of creative
idea generation. It was concluded that quantitative value creation metrics must exist
for systematic idea generation and can be found by focusing on outcome-based
approaches, considering the unique characteristics of idea generation and the
criteria of objectivity and inter-subjectivity and tailoring the indicators to match the
goals of the studied idea generation process.
The remaining part of the research had the aim of finding these indicators,
validating them in practice through an empirical case study, and providing an
answer to the second research question. Given the focus on quantitative metrics,
documentation-based approaches formed the backbone of data collection. This
decision had the side effect of creating a requirement for deep-level company data
so that the studied systematic idea generation process could be evaluated with
satisfactory accuracy.
The single-case study was selected as the research method because the
researcher would not have been able to simultaneously assess information from
190
multiple companies within the framework of a multiple-case study due to
confidentiality issues. In the case study, the Goal Question Metric (GQM) method
was utilized, which led to the definition of patent information-based performance
measures for the case organization. Data was collected in the case organization’s
management information systems and assessed utilizing the designed metrics. The
proposed indicators confirmed the case organization’s effectiveness in generating
high-quality ideas with the help of a benchmark. The evaluation was carried out in
a transparent and fact-based manner that would not have been possible with
traditional measures used in previous studies. This demonstrates that creative idea
generation can be measured rigorously like most other business processes in a
company as long as proper metrics are in place.
The discussion on the research findings focused on the limitations and the
potential use cases of the patent data-based metrics used in this research. Several
limitations mostly concerned with the technological nature of patents were
identified, restricting the usage of these metrics in other industries and
organizations. Nevertheless, further research is required to determine whether the
indicators designed for the case organization are applicable in other contexts.
Alternatively, future studies could define a “rival” set of metrics for idea generation,
and experiment with them in practice to challenge the results presented here and to
test the sustainability of the new fact-based approach adopted in this study.
It can be concluded that this study proposed a new method of evaluation for
the creative early phases of a product creation process. It provided many fresh
viewpoints for the relatively young field of creativity measurement and delivered a
model for further considerations on the topic to build on.
191
References
Adelman DE & DeAngelis KL (2007) Patent Metrics: The Mismeasure of Innovation in the Biotech Patent Debate. Texas Law Review 85: 1677–1744.
Altshuller G (1984) Creativity as an exact science: the theory of the solution of inventive problems. Luxembourg, Gordon and Breach.
Ammons DN (1999) A proper mentality for benchmarking. Public Administration Review 59(2): 105–109.
Anderson N & Gasteiger RM (2007) Helping creativity and innovation thrive in organizations: functional and dysfunctional perspectives. In: Langan-Fox J, Cooper CL & Klimoski RJ (eds) Research Companion to the Dysfunctional Workplace: Management Challenges and Symptoms. Cheltenham, Edward Elgar: 422–440.
Anton JJ & Yao DA (2004) Little patents and big secrets: managing intellectual property. RAND Journal of Economics 35(1): 1–22.
Archibugi D & Pianta M (1996) Measuring technological change through patents and innovation surveys. Technology Analysis and Strategic Management 16(9): 451–468.
Argyris C (1992) On Organizational Learning. Cambridge, Blackwell. Artz KW, Norman PM, Hatfield DE & Cardinal LB (2010) A longitudinal study of the impact of
R&D, patents, and product innovation on firm performance. Journal of Product Innovation Management 27(5): 725–740.
Barki H & Pinsonneault A (2001) Small group brainstorming and idea quality: Is electronic brainstorming the most effective approach? Small Group Research 32(2): 158-205.
Basili VR, Caldiera G & Rombach HD (1994) The Goal Question Metric Approach. URI: http://www.cs.umd.edu/~mvz/handouts/gqm.pdf. Cited 2015/11/26.
Bayus BL (1998) An analysis of product life times in a technologically dynamic industry. Management Science 44: 763–775.
Beghetto RA, Dow GT & Plucker JA (2004) Why isn’t creativity more important to educational psycholo¬gists? Potentials, pitfalls, and future directions in creativity research. Educational Psychologist 39: 83–96.
Behn RD (2003) Why measure performance? Different purposes require different measures. Public Administration Review 63(5): 586–606.
Benner MJ & Tushman ML (2002) Process management and technological innovation: a longitudinal study of the photography and paint industries. Administrative Science Quarterly 47: 676–706.
Berglund B, Rossi GB & Wallard A (2012) Measurement across physical and behavioral sciences. In: Berglund B, Rossi GB, Townsend JT & Pendrill LR (eds) Measurement with Persons: Theory, Methods and Implementation Areas. New York, Taylor and Francis Group: 1–25.
Bergmann I, Butzke D, Walter L, Fuerste JP, Moehrle MG & Erdmann VA (2008) Evaluating the Risk of Patent Infringement by Means of Semantic Patent Analysis: The Case of DNA-Chips. R&D Management 38(5): 550–562.
Besemer SP & O’Quin K (1989) The development, reliability and validity of the revised creative product semantic scale. Creativity Research Journal 2: 268–279.
192
Bessant J & Davies A (2007) Managing Service Innovation. Innovation in Services DTI Occasional Paper 9: 65–94.
Bessen J (2003) Patent Thickets: Strategic Patenting of Complex Technologies. Working paper. URI: http://www.researchoninnovation.org/thicket.pdf. Cited 2015/04/03.
Bessen J & Hunt RH (2004) An Empirical Look at Software Patents. Working paper. Federal Reserve Bank of Philadelphia Working Paper No. 03-17.
Blind K, Edler J, Frietsch R & Schmoch U (2004) Scope and nature of the patent surge: a view from Germany. In: Barton JH (ed) Patents, innovation and economic performance: OECD conference proceedings. Paris, OECD: 83–87.
Bohm D (1980) Wholeness and the Implicate Order. London, Routledge and Kegan Paul. Boly V, Morela L, Assielou NG & Camargo M (2014) Evaluating innovative processes in French
firms: Methodological proposition for firm innovation capacity evaluation. Research Policy 43: 608–622.
Boston Consulting Group (2008) Senior Executive Annual Innovation Survey. Boston, Boston Consulting Group.
Bourne M, Melnyk SA, Bititci U, Platts K & Andersen B (2014) Emerging issues in performance measurement. Management Accounting Research 25: 117–118.
Brinkman C (1932) Invention. In: Seligman ERA & Johnson AS (eds) Encyclopedia of the Social Sciences. New York, Macmillan: 247–251.
Brown MG & Svenson RA (1998) Measuring R&D productivity. Research Technology Management 41(6): 30–35.
Brown T (2008) Design Thinking. Harvard Business Review 86(6): 84–92,141. Börjesson S, Elmquist M & Hooge S (2014) The challenges of innovation capability building:
Learning from longitudinal studies of innovation efforts at Renault and Volvo Cars. Journal of Engineering and Technology Management 31: 120–140.
Calder BJ, Phillips LW & Tybout AM (1982) The concept of external validity. Journal of Consumer Research 9: 240–244.
Cecconi P, Franceschini F & Galetto M (2006) Measurements, evaluations and preferences: a scheme of classification according to the representational theory. Measurement 39: 1–11.
Chell E (2004) Critical incident technique. In: Cassell C & Symon G (eds) Essential Guide to Qualitative Methods in Organisational Research. London, Sage: 45–60.
Chenhall R (2005) Integrative strategic performance measurement systems, strategic alignment of manufacturing, learning and strategic outcomes: an exploratory study. Accounting, Organizations and Society 30(5): 395–422.
Chesbrough H (2003) Open Innovation: The new imperative for creating and profiting from technology. Boston, Harvard Business School Press.
Chesbrough H (2006a) Open innovation. Boston, Harvard Business School Press. Chesbrough H (2006b) Open innovation models. Boston, Harvard Business School Press. Chesbrough H & Davies A (2010) Advancing Services Innovation: Five Key Concepts. In:
Maglio PP, Kieliszewski CA & Spohrer JC (eds) Handbook of Service Science. New York, Springer: 579–601.
193
Childs PRN (2014) Mechanical Design Engineering Handbook. Oxford, Butterworth-Heinemann.
Choi S, Yoon J, Kim K, Lee JY & Kim C (2011) SAO network analysis of patents for technology trends identification: a case study of polymer electrolyte membrane technology in proton exchange membrane fuel cells. Scientometrics 88(3): 863– 883.
Chou J-R (2014) An ideation method for generating new product ideas using TRIZ, concept mapping, and fuzzy linguistic evaluation techniques. Advanced Engineering Informatics 28: 441–454.
Chulvi V, Gonzalez-Cruz MC, Mulet E & Aguilar-Zambrano J (2013) Influence of the type of idea-generation method on the creativity of solutions. Research & Engineering Design 24: 33–41.
Chusilp P & Jin Y (2006) Impact of Mental Iteration on Concept Generation. Journal of Mechanical Design 128(1): 14–25.
Cleff T, Licht G, Spielkamp A & Urban W (2005) Innovation and Competitiveness. In: Heneric O, Licht G & Sofka W (eds) Europe’s automotive industry on the move: competitiveness in a changing world. Heidelberg, Physica: 103–155.
Cohen WM, Nelson RR & Walsh JP (2000) Protecting Their Intellectual Assets: Appropriability Conditions and Why U.S. Manufacturing Firms Patent (or Not). Working paper. National Bureau of Economic Research Working Paper No. 7552.
Cook TD & Campbell DT (1979) Quasi-experimental Design: Design and Analysis Issues for Field Settings. Skokie, Rand McNally.
Cooper A & Reimann R (2003) About Face 2. Indianapolis, Wiley. Cooper RG & Edgett SJ (2008) Maximizing productivity in product innovation. Research
Technology Management 51(2): 47–58. Cropley A (2006) In praise of convergent thinking. Creativity Research Journal 18: 391–404. Csikszentmihalyi M (1996) Creativity: flow and the psychology of discovery and invention. New
York, HarperCollins. Dahlin KB & Behrens DM (2005) When is an invention really radical? Defining and measuring
technological radicalness. Research Policy 34(5): 717–737. Daim TU, Rueda G, Martin H & Gerdsri P (2006) Forecasting emerging technologies: use of
bibliometrics and patent analysis. Technological Forecasting and Social Change 73(8): 981–1012.
De Propris L (2002) Types of innovation and inter-firm cooperation. Entrepreneurship and Regional Development 14: 337–353.
Dean DL, Hender JM, Rodgers TL & Santanen EL (2006) Identifying quality, novel, and creative ideas: Constructs and scales for idea evaluation. Journal of the Association of Information Systems 7: 647–695.
Deming WE (1986) Out of the Crisis. Cambridge, MIT Press. Dennis AR, Valacich JS, Carte TA, Garfield MJ, Haley BJ & Aronson JE (1997) Research report:
The effectiveness of multiple dialogues in electronic brainstorming. Information Systems Research 8(2): 203–211.
Denzin NK & Lincoln YS (1994) Handbook of Qualitative Research. Thousand Oaks, Sage.
194
Dervitsiotis KN (2011) The challenge of adaptation through innovation based on the quality of the innovation process. Total Quality Management 22(5): 553–566.
DeSantis M, Oberholtzer S & Shereda R (2015) Patent Related Trends in the Automotive Industry. Chicago, Brinks Gilson & Lione.
Desouza KC, Dombrowski C, Awazu Y, Baloh P, Papagari S, Jha S & Kim JY (2009) Crafting organizational innovation processes. Innovation: Management, Policy & Practice 11: 6–33.
Dewangan V & Godse M (2014) Towards a holistic enterprise innovation performance measurement system. Technovation 34: 536–545.
Diehl M & Stroebe W (1987) Productivity loss in brainstorming groups: Toward the solution of a riddle. Journal of Personality and Social Psychology 53: 497–509.
Dosi G (1988) Sources, procedures and microeconomic effects of innovation. Journal of Economic Literature 26: 1120–1171.
Dossi A & Patelli L (2010) The inclusion of non-financial indicators in performance measurement systems used in relationships between headquarters and subsidiaries. Long Range Planning 43(4): 498–526.
Driva H, Pawar KS & Menon U (2000) Measuring product development performance in manufacturing organisations. International Journal of Production Economics 63(2): 147–159.
Duguet E & Kabla I (1998) Appropriation Strategy and the Motivations to Use the Patent System: An Econometric Analysis at the Firm Level in French Manufacturing. Annales d'Économie et de Statistique 49/50: 289–327.
Dunbar K (1995) How scientists really reason: Scientific reasoning in real-world laboratories. In: Sternberg RJ & Davidson JE (eds) The nature of insight. Cambridge, MIT Press: 365–395.
Edison H, bin Ali N & Torkar R (2013) Towards innovation measurement in the software industry. The Journal of Systems and Software 86: 1390– 1407.
Egeland C & Matshede T (2015) Patent Valuation in the Automotive Industry: Creation of Patent Valuation Model. Master’s thesis. Gothenburg, Chalmers University of Technology.
Ehrat M (1997) Kompetenzorientierte, analysegestützte Technologiestrategie-erarbeitung: methodisches Konzept zur Unterstützung der Technologiestrategie-entwicklung mit externen Datenbanken. Doctoral dissertation. St. Gallen, University of St. Gallen.
Eisenhardt KM (1989) Building theories from case study research. Academy of Management Review 14(4): 532–550.
Emma P (2005) Patents: To file or not to file? IEEE Micro 25(5): 79–81. Engelsman EC & van Raan AFJ (1994) A patent-based cartography of technology. Research
Policy 23(1): 1–26. Ernst H (1997) The use of patent data for technological forecasting: the diffusion of CNC-
technology in the machine tool industry. Small Business Economics 9(4): 361–381. Ernst H (1998) Patent portfolios for strategic R&D planning. Journal of Engineering and
Technology Management 15: 279–308. European Patent Office (2008) Annual Report 2007. Munich, European Patent Office.
195
Evangelista R, Sandven T, Sirilli G & Smith K (1998) Measuring innovation in European industry. International Journal of the Economics of Business 5(3): 311–333.
Feldhusen JF (1993) Conceptions of creative thinking and creativity training. In: Isaksen SG, Murdock MC, Firestien RL & Treffinger DJ (eds) Nurturing and developing creativity. Norwood, Ablex: 31–50.
Fendt H (1988) Technische Trends rechtzeitig erkennen – Patentschriften gewähren Blicke hinter die Kulissen von F&E. Harvard Manager 10(4): 72–80.
Finkelstein L (2003) Widely, strongly and weakly defined measurement. Measurement 34: 39–48.
Finkelstein L (2005) Problems of measurement in soft systems. Measurement 38: 267–274. Franco LA, Meadows M & Armstrong SJ (2013) Exploring individual differences in scenario
planning workshops: A cognitive style framework. Technological Forecasting & Social Change 80: 723–734.
Franco-Santos M, Kennerley M, Micheli P, Martinez V, Mason S, Marr B, Gray D & Neely A (2007) Towards a definition of a business performance measurement system. International Journal of Operations and Production Management 27(8): 784–801.
Freeman C & Perez C (1988) Structural crises of adjustment: business cycles and investment behavior. In: Dosi G, Freeman C, Nelson R & Soete L (eds) Technical change and economic theory. London, Pinter: 38–66.
Fry A (2002) Creativity, Innovation and Invention: A Corporate Inventor’s Perspective. The Creative Problem Solving Group’s Communiqué 13: 1–5.
Fuge M, Stroud J & Agogino A (2013) Automatically inferring metrics for design creativity. Proceedings of the International Design Engineering Technical Conferences & Computers and Information in Engineering Conference (IDETC/CIE 2013), Aug 4–7, Portland.
Gallupe RB, Dennis AR, Cooper WH, Valacich JS, Bastianutti LM & Nunamaker JF (1992) Electronic brainstorming and group size. Academy of Management Journal 35: 350–369.
Gassmann O & Bader MA (2007) Patentmanagement: Innovationen erfolgreich nutzen und schützen. Berlin, Springer.
Gerken JM, Moehrle MG & Walter L (2010) Patents as an information source for product forecasting: Insights from a longitudinal study in the automotive industry. Proceedings of the R&D Management Conference 2010, Jun 30–Jul 2, Manchester.
Gerken JM, Moehrle MG & Walter L (2014) One year ahead! Investigating the time lag between patent publication and market launch: insights from a longitudinal study in the automotive industry. R&D Management 45(3): 287–303.
Germeraad P (2001) The changing role of R&D. Research-Technology Management 44: 15–20. Gibbert M, Ruigrok W & Wicki B (2008) What passes as a rigorous case study? Strategic
Management Journal 29(13): 1465–1474. Gibbs A & DeMatteis B (2002) Essentials of Patents. New York, Wiley. Giedeman DC, Isely PN & Simons GPW (2006) Innovation and the Business Cycle: A
Comparison of the U.S. Semiconductor and Automobile Industries. International Advances in Economic Research 12: 277–286.
Gimbert X, Bisbe J & Mendoza X (2010) The role of performance measurement systems in strategy formulation processes. Long Range Planning 43(4): 477–497.
196
Glassman B (2009) Metrics for Idea Generation. URI: http://anthemequity.com/img/Metrics-for-Idea-Generation2.pdf. Cited 2015/05/04.
Goldratt E & Cox J (2004) The Goal: A Process of Ongoing Improvement. Aldershot, Gower. Gordon WJJ (1961) Synectics: the development of creative capacity. New York, Harper and
Row. Granstrand O (2000) The economics and management of intellectual property: towards
intellectual capitalism. Cheltenham, Edward Elgar. Grant RM (1996) Toward a knowledge based theory of the firm. Strategic Management Journal
17: 109–122. Grasty T (2012) The Difference Between ‘Invention’ and ‘Innovation’. URI:
http://mediashift.org/2012/03/the-difference-between-invention-and-innovation086/. Cited 2015/11/26.
Graves SB & Langowitz NS (1996) R&D Productivity: A Global Multi-industry Comparison. Technology Forecasting and Social Change 53(2): 125–137.
Griffin A & Page AL (1993) An interim report on measuring product development success and failure. Journal of Product Innovation Management 10(4): 291–308.
Grilliches Z (1990) Patent statistics as economic indicators: a survey. Journal of Economic Literature 28: 1661–1707.
Grimaldi M, Cricelli L, di Giovanni M & Rogo F (2015) The patent portfolio value analysis: A new framework to leverage patent information for strategic technology planning. Technological Forecasting and Social Change 94(1): 286–302.
Guba EG & Lincoln YS (1981) Effective evaluation: Improving the usefulness of evaluation results through responsive and naturalistic approaches. San Francisco, Jossey-Bass.
Guellec D & van Pottelsberghe de la Potterie B (2000) Applications, grants and the value of patent. Economics Letters 69: 109–114.
Gustafsson A, Kristensson P & Witell L (2012) Customer co-creation in service innovation: a matter of communication? Journal of Service Management 23(3): 311–327.
Hagedoorn J & Cloodt M (2003) Measuring innovative performance: is there an advantage in using multiple indicators? Research Policy 32: 1365–1379.
Hall BH, Jaffe AB & Trajtenberg M (2000) Market value and patent citations: A first look. Working paper. National Bureau of Economic Research Working Paper No. 7741.
Hall BH (2007) Patents and patent policy. Oxford Review of Economic Policy 23(4): 568–587. Han EJ & Sohn SY (2015) Patent valuation based on text mining and survival analysis. Journal
of Technology Transfer 40: 821–839. Hatry H (1999) Performance Measurement: Getting Results. Washington DC, Urban Institute. Haupt R, Kloyer M & Lange M (2007) Patent indicators for the technology life cycle
development. Research Policy 36(3): 387–398. Heise DR (1989) Modeling event structures. Journal of Mathematical Sociology 14: 139–69. Heise DR (2001) Scaling and Classification in Social Measurement. In: Smelser NJ &Baltes PB
(eds) International Encyclopedia of the Social & Behavioral Sciences. Oxford, Pergamon: 13504–13508.
197
Heller MA & Eisenberg RS (1998) Can Patents Deter Innovation? The Anticommons in Biomedical Research. Science 280: 698–701.
Henri JF (2006) Management control systems and strategy: a resource-based perspective. Accounting, Organization and Society 31(6): 529–558.
Henriksen B & Onsøyen LE (2010) Measuring the Intangible Aspects of the Manufacturing Strategy – A Case Study from the Automotive Industry. Advances in Production Management Systems 338: 383–391.
Heron J (1999) The Complete Facilitator’s Handbook. London, Kogan. Holmquist LE (2012) Grounded Innovation: Strategies for Creating Digital Products.
Amsterdam, Morgan Kaufmann. Horstmann I, MacDonald GM & Slivinski A (1985) Patents as Information Transfer
Mechanisms: To Patent or (Maybe) Not to Patent. Journal of Political Economy 93(4): 837–858.
Hubbard DW (2010) How to Measure Anything: Finding the Value of “Intangibles” in Business. Hoboken, Wiley.
Hughes-Hallett A, Mayer EK, Marcus HJ, Cundy TP, Pratt PJ, Parston G, Vale JA & Darzi AW (2014) Quantifying Innovation in Surgery. Annals of Surgery 260(2): 205–211.
Husserl E (1964) Die idee der Phaenomenologie. The Hague, Nijhoff. Hyett N, Kenny A & Dickson-Swift V (2014) Methodology or method? A critical review of
qualitative case study reports. International Journal of Qualitative Studies in Health and Well-being 9: 23606.
Iida H (2006) The management of intellectual property in group businesses. Japan Intellectual Property Association Chizaikanri 56(1): 25–36.
Ito K & Pucik V (1993) R&D spending, domestic competition, and export performance of Japanese manufacturing firms. Strategic Management Journal 14(1): 61-75.
Jaffe AB & Trajtenberg M (2002) Patents, citations and innovations: A window on the knowledge economy. Cambridge, MIT Press.
Janssen S, Moeller K & Schlaefke M (2011) Using performance measures conceptually in innovation control. Journal of Management & Control 22: 107–128.
Jell F (2011) Patent Filing Strategies and Patent Management: An Empirical Study. Wiesbaden, Gabler.
Jensen MB, Johnson B, Lorenz E & Lundvall BA (2007) Forms of knowledge and modes of innovation. Research Policy 36: 680–693.
Jensen PH & Webster E (2004) Achieving the optimal power of patent rights Australian Economic Review 37(4): 419–426.
Jethani K (2013) Software metrics for effective project management. International Journal of System Assurance Engineering and Management 4(4): 335–340.
Johnson JP (2004) Defensive publishing by a leading firm. Working paper. Ithaca, Cornell University.
Jolly A & Philpott K (2004) A handbook of intellectual property management. London, Kogan Page.
198
Jung JJH, Schneider C & Valacich JS (2005) The influence of real-time indentifiability and evaluability performance feedback on group electronic brainstorming performance. Proceedings of the 38th Hawaii International Conference on System Sciences (HICSS 2005), Jan 3–6, Hawaii.
Kallen HM (1930) Innovation. In: Seligman ERA & Johnson AS (eds) Encyclopedia of the Social Sciences. New York, Macmillan: 58–61.
Kaplan RS & Norton DP (1992) The Balanced Scorecard – measures that drive performance. Harvard Business Review 70(1): 71–79.
Kash DE & Rycoft RW (2000) Patterns of innovating complex technologies: A framework for adaptive network strategies. Research Policy 29: 819–831.
Kasravi K & Risov M (2007) Patent Mining – Discovery of Business Value from Patent Repositories. Proceedings of the 40th Hawaii International Conference on System Sciences (HICSS 2007), Jan 3–6, Hawaii.
Keeley L, Pikkel R, Quinn B & Walters H (2013) Ten Types of Innovation: The Discipline of Building Breakthroughs. Hoboken, Wiley.
Kelley T (2001) The Art of Innovation. New York, Crown Publishing Group. Kerssen-van Drongelen IC & Bilderbeek J (1999) R&D performance measurement: more than
choosing a set of metrics. R&D Management 29(1): 35–46. Kerssens-van Drongelen IC & Cook A (1997) Design principles for the development of
measurement systems for research and development. R&D Management 27(4): 345–357. Kerzner HR (2014) Project Management 2.0. New York, Wiley. Kim YG, Suh JH & Park SC (2008) Visualization of patent analysis for emerging technology.
Expert Systems with Applications 34(3): 1804–1812. Kimbell L (2009) Beyond design thinking: Design-as-practice and designs-in-practice.
Proceedings of the 5th Annual Centre for Research on Socio-Cultural Change Conference (CRESC 2009), Sep 1–4, Manchester: 1–15.
King N (1992) Modeling the innovation process: an empirical comparison of approaches. Journal of Occupational and Organizational Psychology 65: 89–100.
Klauss T (2014) Ein gutes Team: Open Innovation & Smart Social Collaboration. Wissensmanagement 2014(1): 27–29.
Kleinknecht A, Van Montfort K & Brouwer E (2002) The non-trivial choice between innovation indicators. Economics of Innovation & New Technology 11(2): 109.
Knight HJ (2004) Patent strategy for researchers and research managers. Chichester, Wiley. Koschatzky K, Bross U & Stanovnik P (2001) Development and innovation potential in the
Slovene manufacturing industry: Analysis of an industrial innovation survey. Technovation 21(5): 311-324.
Kromer R (2008) Smart Clothes. Wiesbaden, GWV. Kuhn TS (2007) The structure of scientific revolutions. Chicago, University of Chicago Press. Kulkarni SV (2000) A framework for the experimental evaluation of idea generation techniques.
Master’s thesis. Tempe, Arizona State University. Kulkarni SV & Shah JJ (1999) Survey for evidence of components of creativity. Technical Report
ASU/DAL/IG/99-7. Tempe, Arizona State University.
199
Kyburg HE (1992) Measuring errors of measurement. In: Savage CW & Ehrlich P (eds) Philosophical and Foundational Issues in Measurement. Hillsdale, Lawrence Erlbaum Associates: 75–91.
Langley AG & Charan R (2008) The game-changer. New York, Crown Business. Lanjouw JO, Pakes A & Putnam J (1998) How to count patents and value intellectual property:
the uses of patent renewal and application data. Journal of Industrial Economics 46: 405–432.
Lazzarotti V, Manzini R & Mari L (2011) A model for R&D performance measurement. International Journal of Production Economics 134: 212–223.
Lee J, Veloso FM & Hounshell DA (2011) Linking induced technological change, and environmental regulation: Evidence from patenting in the U.S. auto industry. Research Policy 40: 1240–1252.
Lester R & Piore M (2004) Innovation: the Missing Dimension. London, Harvard University Press.
Lin L-H & Lu I-Y (2006) Product Quality as a Determinant of Product Innovation: an Empirical Analysis of the Global Automotive Industry. Total Quality Management 17(2): 141–147.
Lin Y & Cao R (2012) Employing Patent Data to Measure Automobile Components Suppliers’ Knowledge Creation. Proceedings of the 19th International Conference on Management Science & Engineering (ICMSE 2012), Sep 20–22, Dallas: 1187–1192.
Luck L, Jackson D & Usher K (2006) Case study: A bridge across the paradigms. Nursing Inquiry 13(2): 103–109.
Ludlow T (2014) Trends In Technology IP Licensing. URI: http://www.ipo.org/wp-content/uploads/2014/12/IPLicensingTrends_TerryLudlow1.pdf. Cited 2015/11/26.
MacDonald B & Walker R (1977) Case study and the social philosophy of educational research. In: Hamilton D (ed) Beyond the numbers game: A reader in educational evaluation. Basingstoke, MacMillan: 181–189.
MacKay B & McKiernan P (2010) Creativity and dysfunction in strategic processes: The case of scenario planning. Futures 42: 271–281.
Madsen JB (2006) Are there Diminishing Returns to R&D? Working paper. Economic Policy Research Unit Working Paper 2006-05.
Mari L (2003) Epistemology of measurement. Measurement 34: 17–30. Mari L (2007) Measurability. In: Boumans M (ed) Measurement in Economics. London,
Elsevier: 41–77. Mari L, Lazzarotti V & Manzini R (2009) Measurement in soft systems: epistemological
framework and a case study. Measurement 42: 241–253. Martin MW (2007) Creativity: ethics and excellence in science. Landham, Lexington Books. Mayer RE (1999) Fifty years of Creativity Research. In: Sternberg RJ (ed) Handbook of
Creativity. London, Cambridge University Press: 449–460. McCullagh BC & Behan C (1984) Justifying Historical Descriptions. New York, Cambridge
University Press. McElwain C (2016) The World's Laboratory: China's Patent Boom, IT Standards and the
Implications for the Global Knowledge Economy. Santa Clara Journal of International Law 14(2): 441–460.
200
McKevitt D & Lawton A (1996) The manager, the citizen, the politician and performance measures. Public Money & Management 16(3): 49–54.
Merriam SB (1998) Qualitative research and case study applications in education. San Francisco, Jossey-Bass.
Meyer CB (2001) A Case in Case Study Methodology. Field Methods 13(4): 329–352. Micheli P & Mari L (2014) The theory and practice of performance measurement. Management
Accounting Research 25: 147–156. Michell J (2001) Measurement Theory: History and Philosophy. In: Smelser NJ & Baltes PB
(eds) International Encyclopedia of the Social & Behavioral Sciences. Oxford, Pergamon: 9451–9454.
Michinov N, Jamet E, Métayer N & Le Hénaff B (2015) The eyes of creativity: Impact of social comparison and individual creativity on performance and attention to others' ideas during electronic brainstorming. Computers in Human Behavior 42: 57–67.
Miles MB & Huberman AM (1994) Qualitative data analysis. London, Sage. Milton F (2003) Innovation Survey 52. London, Price WaterHouse. MINET Glossary (2015) Glossary of Perceptive Metrology. URI:
https://minet3repository.wordpress.com/measurement-domains/measurement-concepts-terminology/minet-glossary-of-perceptive-metrology/minet-glossary-of-perceptive-metrology-1-entities-quantities-units/. Cited 2015/05/04.
Mogee ME & Kolar RG (1994) International patent analysis as a tool for corporate technology analysis. Technology Analysis and Strategic Management 6(4): 485– 503.
Mohr J (2001) Marketing of high-technology products and innovations. Upper Saddle River, Prentice Hall.
Morbey G & Reithner R (1990) How R&D affects sales growth, productivity and profitability. Research Technology Management 33(3): 11-14.
Morris L, Ma M & Wu PC (2014) Agile Innovation: The Revolutionary Approach to Accelerate Success, Inspire Engagement, and Ignite Creativity. New York, Wiley.
Moss J (1966) Measuring creative abilities in junior high school industrial arts. Washington DC, American Council on Industrial Arts Teacher Education.
Munro SA (1995) Is your design a life sentence? Machine Design 67(2): 156–160. National Center on Education and the Economy (2007) Tough Choices or Tough Times. San
Francisco, Jossey-Bass. Neely A, Adams C & Kennerley M (2002) The Performance Prism: The Scorecard for Measuring
and Managing Business Success. London, Financial Times Prentice Hall. Nelson BA, Yen J, Wilson JO & Rosen D (2009) Refined metrics for measuring ideation
effectiveness. Design Studies 30: 737–743. Neto BH, de Souza JM & Oliveira J (2010) Collaboration in Innovation Networks: Competitors
Can Become Partners. Proceedings of the International Conference on Information Society (i-Society 2010), Jun 28–30, London: 455–461.
Odasso C, Scellato G & Ughetto E (2015) Selling patents at auction: An empirical analysis of patent value. Industrial and Corporate Change 24(2): 417–438.
201
Ogle R (2007) Smart world: breakthrough creativity and the new science of ideas. Boston, Harvard Business School Press.
Ogot M & Okudan G (2006) Systematic creativity methods in engineering education: a learning styles perspective. International Journal of Engineering Education 22(3): 566–576.
Ogrodnik PJ (2013) Medical Device Design: Innovation from concept to market. Amsterdam, Academic Press.
Okuda Y & Tanaka Y (2011) How are Defensive Patents Defined and Utilized as Business Strategic Tools?: Questionnaire Survey to Japanese Enterprises Having Many Defensive Patents. Proceedings of the PICMET Conference on Technology Management in the Energy Smart World (PICMET 2011), Jul 31–Aug 4, Portland.
Okudan GE, Chiu M-C, Lin C, Schmidt LC, Vargas-Hernandez N & Linsey J (2010) A Pilot Exploration of Systematic Ideation Methods and Tools on Design Learning. Proceedings of the 9th International Conference on Information Technology Based Higher Education and Training (ITHET 2010), Apr 29–May 1, Cappadocia: 102–107.
Oldham GR & Da Silva N (2015) The impact of digital technology on the generation and implementation of creative ideas in the workplace. Computers in Human Behavior 42: 5–11.
Oliinyk O, Petersen K, Schoelzke M, Becker M & Schneickert S (2015) Metrics for the Evaluation of Feature Models in an Industrial Context: A Case Study at Opel. Proceedings of the 21st International Working Conference (REFSQ 2015), Mar 23–26, Essen: 33–48.
Oman SK, Tumer IY, Wood K & Seepersad C (2013) A comparison of creativity and innovation metrics and sample validation through in-class design projects. Research in Engineering Design 24: 65–92.
Osborn A (1979) Applied Imagination. New York, Scribners. Parchomovsky G (2000) Publish or perish. Michigan Law Review 98: 926–951. Parkhurst HB (1999) Confusion, lack of consensus, and the definition of creativity as a construct.
Journal of Creative Behavior 33(1): 1–21. Parnes SJ (1961) Effects of extended effort in creative problem solving. Journal of Educational
Psychology 52(3): 117–122. Parrilli MD & Heras HA (2016) STI and DUI innovation modes: Scientific-technological and
context-specific nuances. Research Policy 45(4): 747–756. Payne SC (2006) Guide to Security Metrics. URI:
http://www.docstoc.com/docs/7264928/Guide-to-Security-Metrics-SHIRLEY-C-PAYNE-DIRECTOR-IT/. Cited 2015/06/03.
Pepels W (2003) Produktmanagement. Munich/Vienna, Oldenbourg. Pettigrew A (1973) The Politics of Organizational Decision Making. London, Tavistock. Philliber SG, Schwab MR & Samsloss G (1980) Social research: guides to a decision making
process. Itasca, Peacock. Pilkington A, Dyerson R & Tissier O (2002) Patent Data as Indicators of Technological
Development: Investigating the Electric Vehicle. World Patent Information 24: 5–12. Popp D (2003) Pollution control innovations and the Clean Air Act of 1990. Journal of Policy
Analysis and Management 22: 641–660.
202
Popp D (2005) Lessons from patents: using patents to measure technological change in environmental models. Ecological Economics 54: 209–226.
Porter AL & Cunningham SW (2005) Tech mining: exploiting new technologies for competitive advantage. New York, Wiley.
Porter M (1990) The Competitive Advantage of Nations. New York, Free Press. Puccio GJ & Cabra JF (2012) Idea Generation and Idea Evaluation: Cognitive Skills and
Deliberate Practices. In: Mumford MD (ed) Handbook of Organizational Creativity. New York, Elsevier: 189–215.
Puccio GJ, Mance M & Murdock MC (2011) Creative leadership: Skills that drive change. Thousand Oaks, Sage.
Quantumiii (2015) In Intelligence glossary. URI: www.quantum3.co.za/Intelligence-Glossary/. Cited 2015/05/26.
Reimer E, Schade H & Schippel H (2007) ArbEG: Gesetz über Arbeitnehmererfindungen und deren Vergütungsrichtlinien. Berlin, Erich Schmidt.
Reinig BA & Briggs RO (2006) Measuring the Quality of Ideation Technology and Techniques. Proceedings of the 39th Hawaii International Conference on System Sciences (HICSS 2006), Jan 4–7, Hawaii: 1–10.
Reinig BA, Briggs RO & Nunamaker JF (2007) On the Measurement of Ideation Quality. Journal of Management Information Systems 23(4): 143–161.
Rindskopf D (2001) Reliability: Measurement. In: Smelser NJ & Baltes PB (eds) International Encyclopedia of the Social & Behavioral Sciences. Oxford, Pergamon: 13023–13028.
Roberts RM (1989) Serendipity: accidental discoveries in science. New York, Wiley. Robson C (2002) Real world research: A resource for social scientists and practitioner-
researchers. Oxford, Blackwell. Rogers M (1998) The Definition and Measurement of Innovation. Working paper. Melbourne
Institute of Applied Economic and Social Research Working Paper No. 10/98. Rohrbach B (1969) Creative by rules—method 635, a new technique for solving problems.
Absatzwirtschaft 12: 73–75. Rosenberg N (1982) Inside the Black Box: Technology and Economics. Cambridge, Cambridge
University Press. Rossi GB (2007) Measurability. Measurement 40: 545–562. Runco MA (2003) Critical creative processes. Cresskill, Hampton Press. Salminen J (2015) The role of collective intelligence in crowdsourcing innovations. Doctoral
dissertation. Lappeenranta, Lappeenranta University of Technology. Sarkar P & Chakrabarti A (2008) Studying engineering design creativity. In: Gero JS (ed)
Studying Design Creativity. Berlin, Springer. Saunders M, Lewis P & Thornhill A (2007) Research methods for business students. London,
Financial Times Prentice Hall. Saunders R & Gero JS (2002) How to Study Artificial Creativity. Proceedings of the 4th
Conference on Creativity and Cognition (C&C 2002), Oct 14–16, Loughborough: 80–87. Schaeffer U & Stoll M (2007) Imitieren statt innovieren. Harvard Business Manager 29(5): 8–
11.
203
Scherer FM (1980) Industrial Market Structure and Economic Performance. Chicago, Rand-McNally.
Schreyögg G & Kliesch-Eberl M (2007) How dynamic can organizational capabilities be? Towards a dual-process model of capability dynamization. Strategic Management Journal 28(9): 913–933.
Schüll G (2003) Fragen der Bewertung von Erfindungen oder Patenten. In: Nicklisch F (ed) Forschungs- und Entwicklungsverträge in Wissenschaft und Technik. Munich, CH Beck.
Schwarz RM (2016) The Skilled Facilitator: A Comprehensive Resource for Consultants, Facilitators, Coaches, and Trainers. San Francisco, Jossey-Bass.
Serrano-Cinca C, Fuertes-Callen Y & Mar-Molinero C (2005) Measuring DEA Efficiency in Internet Companies. Decision Support Systems 38(4): 557-573.
Shah JJ, Kulkarni SV & Vargas-Hernandez N (2000) Guidelines for experimental evaluation of idea generation methods in conceptual design. Journal of Mechanical Design 122(4): 377–384.
Shah JJ, Vargas-Hernandez N & Smith SM (2003) Metrics for measuring ideation effectiveness. Design Studies 24: 111–134.
Shapiro C (2001) Navigating the Patent Thicket: Cross Licenses, Patent Pools, and Standard-Setting. In: Jaffe A, Lerner J & Stern S (eds) Innovation Policy and the Economy. Cambridge, MIT Press.
Shewfelt RL (2012) Becoming a Food Scientist: To Graduate School and Beyond. New York, Springer.
Simonton DK (1999) Creativity as blind variation and selective retention: Is the creative process Darwinian? Psychological Inquiry 10: 309–328.
Siwczyk Y & Warschat J (2011) White Spot Analysis: The Potential of Patent Information for Research and Development. Proceedings of the PICMET Conference on Technology Management in the Energy Smart World (PICMET 2011), Jul 31–Aug 4, Portland.
Smith GF (1998) Idea-generation techniques: a formulary of active ingredients. Journal of Creative Behavior 32(2): 107–133.
Sørensen JB & Stuard TE (2000) Aging, obsolescence, and organizational innovation. Administrative Science Quarterly 45: 81–112.
Stake RE (2000) Case studies. In: Denzin NK & Lincoln YS (eds) Handbook of Qualitative Research. Thousand Oaks, Sage: 435–453.
Sterlacchini A (1999) Do innovative activities matter to small firms in non-R&D-intensive industries? An application to export performance. Research Policy 28(8): 819-832.
Sternberg RJ & Lubart TI (1995) Defying the Crowd: Cultivating Creativity in a Culture of Conformity. New York, Free Press.
Sternitzke C (2008) Betriebswirtschaftliche Patentportfoliobewertung: eine informationswis-senschaftliche Perspektive. Doctoral dissertation. Bremen, University of Bremen.
Suomala P, Lyly-Yrjänäinen J & Lukka K (2014) Battlefield around interventions: A reflective analysis of conducting interventionist research in management accounting. Management Accounting Research 25: 304–314.
Suominen A, Toivanen H & Seppänen M (2017) Firms' knowledge profiles: Mapping patent data with unsupervised learning. Technological Forecasting and Social Change 115: 131–142.
204
Sutton RI & Hargadon A (1996) Brainstorming groups in context: Effectiveness in a product design firm. Administrative Science Quarterly 41(6): 85–718.
Szulanski G (1996) Exploring internal stickiness: impediments to the transfer of best practices within the firm. Strategic Management Journal 17: 27–43.
Taggar S (2002) Individual creativity and group ability to utilize individual creative resources: a multilevel model. Academy of Management Journal 45(2): 315–330.
Teichert T & Ernst H (1999) Assessment of R&D Collaboration by Patent Data. In: Kocaoglu D & Anderson T (eds) Technology and Innovation Management. Portland, Portland State University: 420–428.
Thomas P & McMillan GS (2001) Using science and technology indicators to manage R&D as a business. Engineering Management Journal 13(3): 9-14.
Thomas V (2014) Measuring Effectiveness. In: Gardner B & Thomas V (eds) Building an Information Security Awareness Program. Waltham, Syngress: 119–124.
Tidd J, Bessant J & Pavitt K (2005) Managing Innovation—Integrating Technological, Market and Organisational Change. Chichester, Wiley.
Tobi H (2014) Measurement in interdisciplinary research: The contributions of widely-defined measurement and portfolio representations. Measurement 48: 228–231.
Torrance EP (1964) Role of Evaluation in Creative Thinking Bureau of Educational Research. Minneapolis, University of Minnesota.
Totten J & Zhai M (2014) Recent Developments in the Interplay Between Patents and Standards Setting: Lessons for Smart Grid, Metering, and Electric Vehicle Manufacturers. Proceedings of the PES Transmission & Distribution Conference & Exposition (T&D 2014), Apr 14–17, Chicago: 1–2.
Trajtenberg M (1990) A penny for your quotes: patent citations and the value of innovations. RAND Journal of Economics 21: 172–187.
Tseng Y, Lin C & Lin Y (2007) Text mining techniques for patent analysis. Information Processing & Management 43(5): 1216–1247.
Tushman M & O’Reilly C (1996) Evolution and revolution: mastering the dynamics of innovation and change. California Management Review 38(4): 8–30.
Ullman D (1997) The Mechanical Design Process. Boston, McGraw-Hill. Ulrich K & Eppinger S (2000) Product design and development. Boston, McGraw-Hill. United States Patent and Trademark Office (2008) Performance and Accountability Report Fiscal
Year 2007. Washington DC. Utterback JM & Abernathy WJ (1990) A dynamic model of process and product innovation. In:
Freeman C (ed) The Economics of Innovation. Aldershot, Edward Elgar. Valacich JS, Dennis AR & Connolly T (1994) Idea generation in computer-based groups: A new
ending to an old story. Organizational Behavior and Human Decision Processes 57: 448–467.
van den Hoed R (2005) Commitment to fuel cell technology? How to interpret carmakers’ efforts in this radical technology. Journal of Power Sources 141: 265–271.
Vargas-Hernandez N, Shah JJ & Smith SM (2010) Understanding design ideation mechanisms through multilevel aligned empirical studies. Design Studies 31: 382–410.
205
Verhaegen P-A, Peeters J, Vandevenne D, Dewulf S & Duflou JR (2011) Effectiveness of the PAnDA ideation tool. Procedia Engineering 9: 63–76.
Verhaegen P-A, Vandevenne D, Peeters J & Duflou JR (2013) Refinements to the variety metric for idea evaluation. Design Studies 34: 243–263.
Veryzer RW (1998) Discontinuous Innovation and the New Product Development Process. Journal of Product Innovation Management 15: 304–321.
Vidal RVV (2009) Community facilitation of problem structuring and decision making processes: Experiences from the EU LEADER+ programme. European Journal of Operational Research 199: 803–810.
Waddington D (1994) Participant observation. In: Cassell C & Symon G (eds) Qualitative methods in organizational research. London, Sage: 107–122.
Wakefield JF (2003) The development of creative thinking and critical reflection: lessons from everyday problem finding. In: Runco MA (ed) Critical Creative Processes. Cresskill, Hampton Press: 253–272.
Walwyn D (2007) Finland and the mobile phone industry: A case study of the return on investment from government-funded research and development. Technovation 27(6–7): 335–341.
Wang B & Hsieh C-H (2015) Measuring the value of patents with fuzzy multiple criteria decision making: Insight into the practices of the Industrial Technology Research Institute. Technological Forecasting and Social Change 92: 263–275.
Wang C-H, Ting C-T & Huang C-W (2011) An Efficiency Comparison of High Tech Firm R&D Innovation in Different Environmental Conditions. Asia Pacific Management Review 16(2): 133–164.
Wedeniwski S (2015) Mobilitätsrevolution in der Automobilindustrie: Letzte Ausfahrt digital! Berlin/Heidelberg, Springer.
Welsh CA (1948) Patents and competition in the automobile industry. Law and Contemporary Problems 13(2): 260–277.
Wen Y-F (2009) An effectiveness measurement model for knowledge management. Knowledge-Based Systems 22: 363–367.
Wenning M (2015) Why Big Data Matters in Innovation Management. URI: http://blog.hypeinnovation.com/why-big-data-matters-in-innovation-management. Cited 2016/02/10.
West MA & Farr JL (1990) Innovation at work. In: West MA & Farr JL (eds) Innovation and Creativity at Work. Chichester, Wiley: 1–13.
Witt J (1996) Grundlagen für die Entwicklung und Vermarktung neuer Produkte. In: Witt J (ed) Produktinnovation: Entwicklung und Vermarktung neuer Produkte. Munich, Vahlen: 1–110.
Wolf M (2006) The world must get to grips with seismic economic shifts. URI: http://www.ft.com/cms/s/0/6fadd41e-92c7-11da-a8ff-0000779e2340.html. Cited 2016/02/10.
Woo HR (2003) Barriers to Idea Generation for Collaborative Problem Solving. Proceedings of the 6th Asia Design Conference, Oct 14–17, Tsukuba.
206
United States Patent and Trademark Office (2008) Performance and Accountability Report Fiscal Year 2007. Washington DC.
World Intellectual Property Organization (2016) World Intellectual Property Indicators. Geneva. Wu M-F, Chang K-W, Zhou W, Hao J, Yuan C-C & Chang K-C (2015) Patent Deployment
Strategies and Patent Value in LED Industry. PLoS ONE 10(6): e0129911. Yang G-C, Li G, Li C-Y, Zhao Y-H, Zhang J, Liu T, Chen D-Z & Huang M-H (2015) Using the
comprehensive patent citation network (CPC) to evaluate patent value. Scientometrics 105: 1319–1346.
Yin RK (1994) Case Study Research: Design and Methods. Thousand Oaks, Sage. Yin RK (2009) Case Study Research: Design and Methods. Thousand Oaks, Sage. Yoon B & Lee S (2008) Patent Analysis for Technology Forecasting: Sector-specific
Applications. Proceedings of the International Engineering Management Conference (IEMC 2008), Jun 28–30, Estoril.
Yoon B & Park Y (2004) A text-mining-based patent network: analytical tool for high-technology trend. The Journal of High Technology Management Research 15(1): 37–50.
Yoon B & Park Y (2005) A systematic approach for identifying technology opportunities: Keyword-based morphology analysis. Technological Forecasting and Social Change 72(2): 145–160.
Yu D-J & Lin W-C (2009) Facilitating Idea Generation Using Personas. In: Kurosu M (ed) Human Centered Design. Proceedings of the First International Conference on Human Centered Design (HCD 2009), Jul 19–24, San Diego. Berlin/Heidelberg, Springer: 381–388.
Zolotová I, Kubičko P, Landryová L & Hošák R (2012) Innovation Processes – Reference Model, Collaboration via Innovative Zone and Integration into Enterprise Environment. In: Frick J & Laugen B (eds) Proceedings of the International Conference on Advances in Production Management Systems (APMS 2011), Sep 26–28, Stavanger. Berlin/Heidelberg, Springer: 567–577.
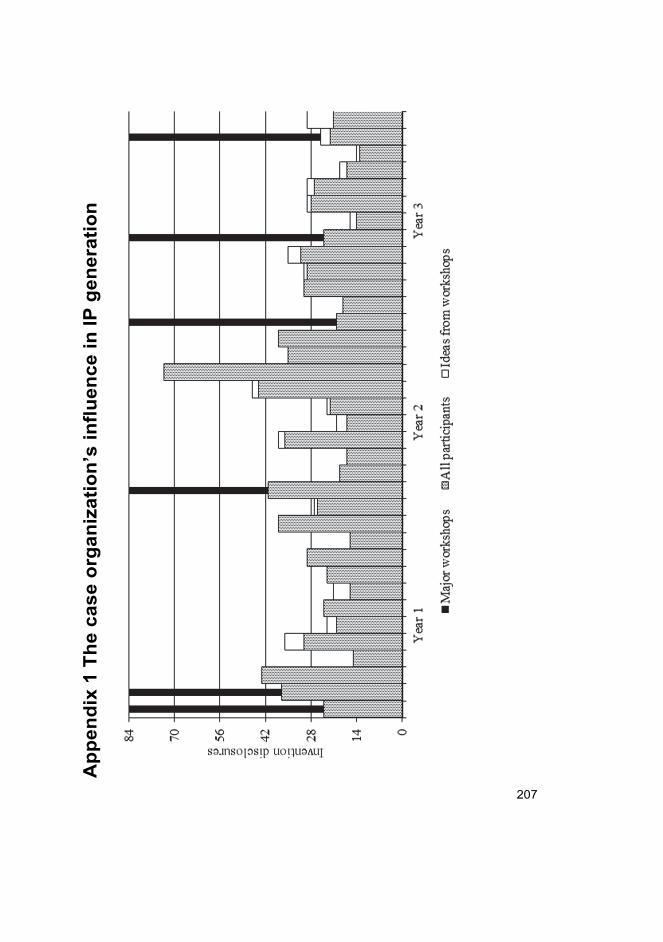
207
Ap
pe
nd
ix 1
Th
e c
as
e o
rga
niz
ati
on
’s i
nfl
ue
nc
e i
n I
P g
en
era
tio
n

208

A C T A U N I V E R S I T A T I S O U L U E N S I S
Book orders:Granum: Virtual book storehttp://granum.uta.fi/granum/
S E R I E S C T E C H N I C A
595. Juholin, Piia (2016) Hybrid membrane processes in industrial water treatment :separation and recovery of inorganic compounds
596. Augustine, Bobins (2016) Efficiency and stability studies for organic bulkheterojunction solar cells
597. Ylioinas, Juha (2016) Towards optimal local binary patterns in texture and facedescription
598. Mohammadighavam, Shahram (2017) Hydrological and hydraulic design ofpeatland drainage and water treatment systems for optimal control of diffusepollution
599. Louis, Jean-Nicolas (2016) Dynamic environmental indicators for smart homes :assessing the role of home energy management systems in achieving decarboni-sation goals in the residential sector
600. Mustamo, Pirkko (2017) Greenhouse gas fluxes from drained peat soils :a comparison of different land use types and hydrological site characteristics
601. Upola, Heikki (2017) Disintegration of packaging material : an experimental studyof approaches to lower energy consumption
602. Eskelinen, Riku (2017) Runoff generation and load estimation in drained peatlandareas
603. Kokkoniemi, Joonas (2017) Nanoscale sensor networks : the THz band as acommunication channel
604. Luoto, Petri (2017) Co-primary multi-operator resource sharing for small cellnetworks
605. Yrjölä, Seppo (2017) Analysis of technology and business antecedents forspectrum sharing in mobile broadband networks
606. Suikkanen, Essi (2017) Detection algorithms and ASIC designs for MIMO–OFDMdownlink receivers
607. Niemelä, Ville (2017) Evaluations and analysis of IR-UWB receivers for personalmedical communications
608. Keränen, Anni (2017) Water treatment by quaternized lignocellulose
609. Jutila, Mirjami (2017) Adaptive traffic management in heterogeneouscommunication networks
C611etukansi.kesken.fm Page 2 Thursday, March 23, 2017 10:43 AM
UNIVERSITY OF OULU P .O. Box 8000 F I -90014 UNIVERSITY OF OULU FINLAND
A C T A U N I V E R S I T A T I S O U L U E N S I S
University Lecturer Tuomo Glumoff
University Lecturer Santeri Palviainen
Postdoctoral research fellow Sanna Taskila
Professor Olli Vuolteenaho
University Lecturer Veli-Matti Ulvinen
Planning Director Pertti Tikkanen
Professor Jari Juga
University Lecturer Anu Soikkeli
Professor Olli Vuolteenaho
Publications Editor Kirsti Nurkkala
ISBN 978-952-62-1532-7 (Paperback)ISBN 978-952-62-1533-4 (PDF)ISSN 0355-3213 (Print)ISSN 1796-2226 (Online)
U N I V E R S I TAT I S O U L U E N S I SACTAC
TECHNICA
U N I V E R S I TAT I S O U L U E N S I SACTAC
TECHNICA
OULU 2017
C 611
Pekka Ylitalo
VALUE CREATION METRICS IN SYSTEMATIC IDEA GENERATION
UNIVERSITY OF OULU GRADUATE SCHOOL;UNIVERSITY OF OULU,FACULTY OF TECHNOLOGY
C 611
ACTA
Pekka YlitaloC611etukansi.kesken.fm Page 1 Thursday, March 23, 2017 10:43 AM