action spectra - 4life medical line...
TRANSCRIPT

ACTION SPECTRA
Their Importance for Low Level Light Therapy
Tiina Karu
Laboratory of Laser Biom edicineInst itute of Laser and I nformat ion Technologies
Russian Academ y of SciencesTroitsk 142190, Moscow Region, Russian Federat ion
[email protected] roit sk.ruwww.isan.t roitsk.ru/ dls/ karu.htm l
1 . I NTRODUCTI ON
The radiat ion wavelengths effect ive for photobiology range between 300 and 900 nm , i.e., from UV (ult raviolet) to near I R ( infrared) . Pract ically all photobiological processes in plants and anim als, such as photosynthesis, phototropism , phototaxis, photoperiodism , and vision, ut ilize this range of radiat ion. The photoreceptor m olecules responsible for these photoresponses have been well studied for decades.
The regulat ion of cellular m etabolism by visible light is not a classical topic of photobiology. Only the finding of the existence of act ion spectra in the region from 330 to 860 nm for the increase of DNA and RNA synthesis rates in m am m alian cells, as well as for growth st im ulat ion of eukaryot ic and prokaryot ic m icroorganisms recorded in the 1980's ( reviewed in 1) , indicated that monochrom at ic light in the visible- to-near region can be a subt le inst rument to regulate cellular m etabolism . This finding m eans that the topic of low level laser phototherapy (or low level light therapy, or laser biost im ulat ion) belongs to photobiology.
An act ion spectrum is a plot of the relat ive effect iveness of different w avelengths of light in causing a part icular biological response, and under ideal condit ions, it should m im ic the absorpt ion spectrum of the m olecule that is absorbing the light , and w hose photochem ical a lterat ion causes t he effect ( 2 ) .
The first act ion spectra with the aim to prove or disapprove the existence of a so-called laser biost im ulat ion effect at the cellular level were recorded in the early 1980's (3-5) . Recall t hat laser biost im ulat ion (nowadays called low level laser therapy, low level light therapy, photobiom odulat ion or laser phototherapy) as a m edical t reatm ent goes back into the 1960's with the use of a He-Ne laser ( = 632.8 nm ) for the improvem ent of the healing of im paired wounds.
With the technical progress in the second half of the 20th century, and the advent of the laser, these new light sources found their applicat ion in m edicine and in therapy. The ruby laser ( = 694 nm ) , which was the first laser invented in 1960, was used in ophthalm ology and derm atology very soon after its appearance. Endre Mester, who is considered as the father of " laser biost im ulat ion", also used the ruby laser in 1964. But the real boom in the therapeut ic use of lasers started soon after the
Page 1 sur 24ACTION SPECTRA IMPORTANT TO LLLT
01/10/2012http://www.photobiology.info/Karu.html

invent ion of the He-Ne laser in 1961, because the He-Ne laser ( = 632.8 nm) was the first widely available com m ercial laser. The st im ulat ing effect of light , and red light in part icular, was rediscovered when this new light source was used. The observed effects were at t ributed to the unique, high coherence of the He-Ne laser radiat ion, although there are no physical grounds for such a conclusion (6) .
Prof. Mester also used the He-Ne laser in his pract ice, and perform ed a lot of pioneering studies at the cellular level. At the sam e t ime (end of the 60's - beginning of the 70's) , the large-scale use of He-Ne lasers in laborator ies and clinics started in the USSR (Harkov University, Kazahztan State Universit y in Alma-Ata, I nst it ute of Physics in Minsk, I nst it ute of Oncology Problem s in Kiev, I nst it ute of Radio Engineering and Elect ronics in Fryazino, Moscow Region) . The spreading of laser biost im ulat ion to var ious countr ies started at the end of the 70's, and got a wider interest ( I taly, Japan, United Kingdom , and China) after the appearance of sem iconductor m edical lasers in the 80's.
The act ion spect ra in the visible- to-near IR region for the biological responses of cultured cells showed that red light at 632.8 nm was not the only wavelength suitable for laser biost imulat ion (3- 5) . These spect ra together with the results of experiments using the dichrom at ic irradiat ion of cells, and the m odificat ion of light effects with chem icals (6-9) , showed that " laser biost im ulat ion" is a photobiological phenomenon. These data also allowed the suggest ion that the photoacceptor for the st im ulat ion of cell m etabolism is the term inal enzym e of the respiratory chain, i.e., cytochrom e c oxidase for eukaryot ic cells (9) , and the cytochrom e bd com plex for Escherichia coli ( 10) . I n the blue spectral region, flavoproteins like NADH-dehydrogenase can work as photoacceptors as well (8) . The suggest ion that cytochrom e c oxidase is the photoacceptor m olecule has been recent ly confirm ed in elegant experim ents with funct ionally inact ivated pr im ary neurons, proposing that light upregulates this enzym e (11) .
A surpr ising circum stance is that the photoacceptors for this phenom enon in eukaryot ic cells and in prokaryot ic cells (E. coli) appeared to be natural com ponents of the respiratory chain, and not specialized photoreceptor m olecules. This is different from the classical photobiological phenomena that ut ilize specific photoreceptors (chlorophylls, rhodopsins, etc.) . On the other hand, it is not surpr ising from the point of v iew of the absorbing centers in the photoacceptor ( for eukaryot ic cells these are Cu and quite probably Fe in cytochrom e c oxidase, see Sect ion 3) . Transit ion m etals (Cu and Fe) generate electronically excited states under very m oderate react ion condit ions. Bioorganic photochem istry, a rapidly developing new area of research, is concerned with the biological aspects of t ransit ion m etal chem istry, and physics under irradiat ion (12) . Last but not least , the act ivat ion of some enzym es by light , a closely similar phenom enon, is also known ( 13, 14) . Since life evolved in a world of light , t here m ust be m any interact ions between biological system s and light , including accom m odat ions for it s deleter ious effects (15) .
The init ial act ion spectra will be described in Sect ion 2. The analysis of how the photoacceptor was determ ined from these spectra, is the topic of Sect ion 3. Sect ion 4 descr ibes the com parison of act ion and absorpt ion spect ra. Sect ion 5 is devoted to a br ief analysis of how the signals generated by light quanta in m itochondria are t ransduced to the cellular organelles, where the init ial act ion spect ra were m easured ( the nucleus) .
Page 2 sur 24ACTION SPECTRA IMPORTANT TO LLLT
01/10/2012http://www.photobiology.info/Karu.html

1 . Any graph represent ing a photoresponse as a funct ion of wavelength , wave num ber - 1, or photon energy e, is called an ACTI ON SPECTRUM.2 . Act ion spect roscopy analyzes effects caused by irradiat ion in order to character ize the pigm ents involved (called photoacceptors or photoreceptors) .3 . After determ ining the photoacceptor m olecule, whos absorpt ion spectrum is mirrored in the init ial act ion spect rum , one can m ake suggest ions about cellular signaling pathways inside a cell between the tentat ive photoacceptor and the m olecule whos act iv it y was m easured by act ion spect roscopy.
2 . ACTI ON SPECTRA for an I NCREASE of DNA and RNA SYNTHESI S RATE in CULTURED MAMMALI AN CELLS
First at all, let us rem em ber that in eukaryot ic cells, DNA and RNA synthesis occur in the nucleus, which does not have chromophores absorbing in the spectral region used for laser phototherapy (600-900 nm ) . One can find the or iginal spectra ( including the UV- to blue spectral region) (3-5) , and in exact form analyzed by contem porary software, in (16) . Below, we will also analyze the act ion spectrum for the increase in cell at tachm ent to a glass m atr ix (17) .
Figure 1 presents five act ion spect ra in the red- to-near I R region for m am m alian cells, and Table 1 provides the data of their deconvolut ion. Original experim ental data (4, 5, 17) are presented here together with curve fit t ing and Lorentzian fit t ing (16) . The m ean-square deviat ion, R2, for every fit t ing is also shown in Table 1. At the best fit t ing, R2 = 1. Spect ra A and B present the st im ulat ion of DNA synthesis rate in log-phase and plateau-phase cultures, respect ively. Spect ra C and D are the dependencies of st im ulat ion of RNA synthesis rate in log- and plateau-phase cells. These four spect ra were recorded using a monochrom ator MDR-2, with a halogen lam p with the power of 150 W placed in a parabolic reflector (4) . The spectral full width at half m axim um (FWHM) of the produced light was 14 nm (Figures 1A-D) . Light intensit y was kept constant (10 W/ m 2) by varying the voltage across the halogen lam p. The irradiat ion t im e was 10 s, and the dose was 100 J/ m 2. Spect rum E shows an increase in cell at tachm ent to a glass m at r ix. I n this case, the m onochrom ator was a m ore advanced one, const ructed in Inst itute of Spect roscopy of Russian Academy Science (17) . Light param eters for recording of this spectrum were as follows:I = 1.3 W/ m 2, t = 40 sec, D = 52 J/ m 2, FWHM 10 nm .
Page 3 sur 24ACTION SPECTRA IMPORTANT TO LLLT
01/10/2012http://www.photobiology.info/Karu.html
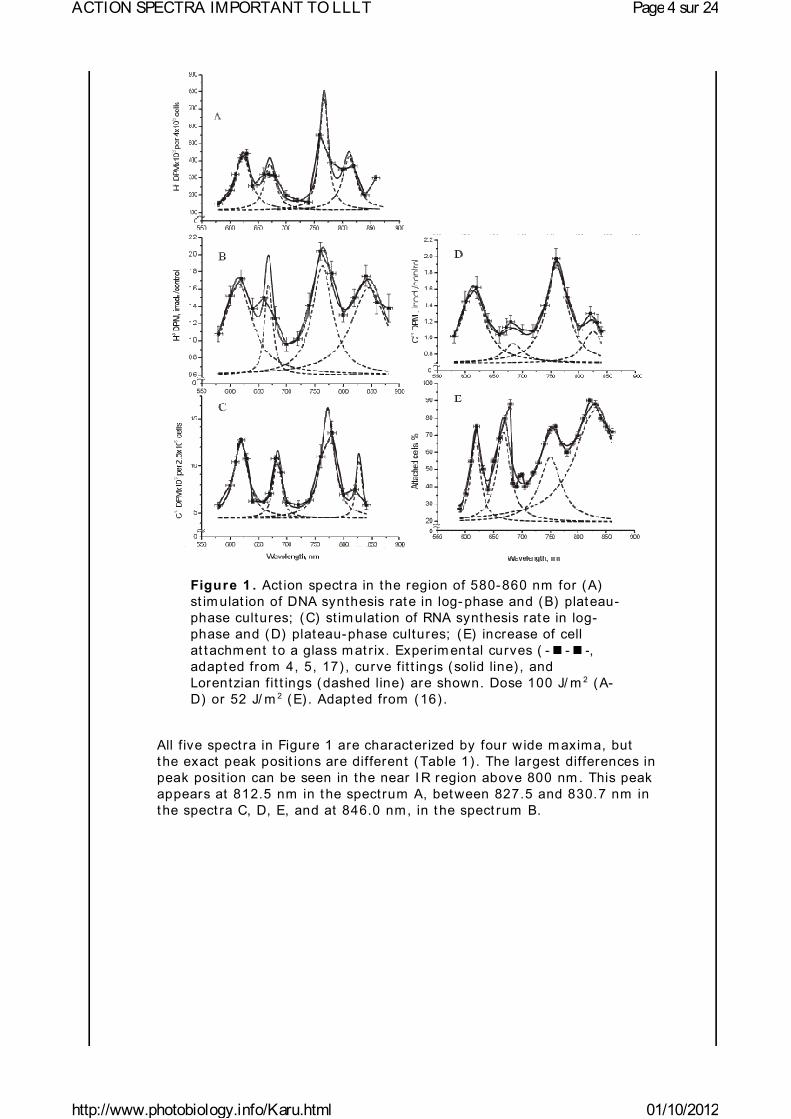
Figure 1 . Act ion spect ra in the region of 580-860 nm for (A) st im ulat ion of DNA synthesis rate in log- phase and (B) plateau-phase cultures; (C) st im ulat ion of RNA synthesis rate in log-phase and (D) plateau-phase cultures; (E) increase of cell at tachm ent to a glass m at r ix. Experim ental curves ( , adapted from 4, 5, 17) , curve fit t ings (solid line) , and Lorentzian fit t ings (dashed line) are shown. Dose 100 J/ m 2 (A-D) or 52 J/ m 2 (E) . Adapted from (16) .
All f ive spectra in Figure 1 are character ized by four wide m axima, but the exact peak posit ions are different (Table 1) . The largest differences in peak posit ion can be seen in the near I R region above 800 nm . This peak appears at 812.5 nm in the spectrum A, between 827.5 and 830.7 nm in the spect ra C, D, E, and at 846.0 nm, in the spect rum B.
Page 4 sur 24ACTION SPECTRA IMPORTANT TO LLLT
01/10/2012http://www.photobiology.info/Karu.html

The m axim um in spectra A-E in Figure 1 has peak posit ions from 750.7 to 772.3 nm (Table 1) . I n four spectra, this peak is between 761.1 and 772.3 nm, which could be one line in an absorpt ion spectrum . An appearance of this m axim um with a peak posit ion at 750.7 nm in spect rum E could probably m irror another line in an absorpt ion spectra.
The far- red m axim um in the act ion spect ra (Figure 1) has peak posit ions from 667.5 to 684.5 nm . These peak posit ions can be divided in to two groups: 667.5, 671.5, and 668.0 nm in one group, and 684.5 and 683.7 nm in the other ( Table 1) . The red m axim um in the act ion spect ra (Figure 1) has peak posit ions from 613.5 to 623.5 nm (Table 1) .
I t should be noted that in an early act ion spect rum (3) , a peak at 606 nm appeared together with a peak at 632.8 nm (Figure 2A, Table 2) . These first two spectra for the st im ulat ion of DNA and RNA synthesis rate were recorded from 570 to 650 nm , using filam ent lam ps with a power of 20 and 90 W, and interference filters (3) . With that setup we were not able to keep the intensit y of the light equal at all wavelengths. This m eans that for a constant dose one was forced to use var ious irradiat ion t im es. I n our case, the intensity was 1.5 and 0.3 W/ m 2, and the dose of 80 J/ m 2
was reached by irradiat ing the cells from 2 s to 4.5 m in.
Page 5 sur 24ACTION SPECTRA IMPORTANT TO LLLT
01/10/2012http://www.photobiology.info/Karu.html

Figure 2 . Act ion spect ra in the region of 570-650 nm for the st im ulat ion of (A) DNA and (B) RNA synthesis in log-phase cultures at D = 80 J/ m 2 under condit ions where irradiat ion t im es were not kept constant . Experim ental curves ( , adapted from 3) , curve fit t ings (solid lines) , and Lorentzian fit t ings (dashed lines) are shown. Adapted from (16) .
This was not a correct m easurem ent of an act ion spectrum, but this first experim ent showed several im portant features of the biost im ulat ion phenom enon. First , not only He-Ne laser light at 632.8 nm causes "biost imulat ion", a similar result was achieved using noncoherent light of the sam e wavelength. Recall that in year 1982, the m edical laser comm unity believed that He-Ne laser radiat ion had magical beneficial propert ies. Secondly, after im proving the equipm ent and com paring new act ion spect ra (Figure 1, A-D) to the first spect ra presented in Figure 2A, B, we understood that there should be a dependence on light intensit y in the far- red region 650-680 nm . Speaking in photobiological term s, the reciprocity rule does not hold. According to the reciprocit y (or Bunsen-Roscoe) rule, a photochem ical react ion is direct ly proport ional to the total energy dose, irrespect ive of the t im e over which this dose is delivered. However, the reason why in one spect rum (Figure 2A) two red bands appeared, is st ill obscure. One can only suppose that this is due to irradiat ion param eters, intensit y and irradiat ion t im e. Solving this quest ion requires new experim ents.
Page 6 sur 24ACTION SPECTRA IMPORTANT TO LLLT
01/10/2012http://www.photobiology.info/Karu.html

Finding the absence of reciprocit y lead us to perform a special experim ent , where the dose was kept constant , but the irradiat ion t im e and intensity were var ied. These data are presented here to draw at tent ion once m ore to the threshold- t ype of behavior of the intensity-dependence that is st ill not understood, and is often not taken into account in experiments. I t appeared that the red m axim um in the act ion spect ra is sensit ive to light intensity (Figure 3) , and that there exists a certain threshold to receive a st im ulat ion effect ( in our case, at 4-5 W/ m 2) (3) . The m axim um effect occurred near 8 W/ m 2 ( ir radiat ion t ime 10-12 s) (1, 3) . The existence of the intensit y threshold is especially im portant from a pract ical point of v iew (both in the laboratory and clinic) in deciding on the irradiat ion param eters. A sim ilar t ype of curve was recorded at 454 nm for E. coli (10) . Later, the invalidity of the reciprocity rule was shown for light at = 632.8 nm when irradiat ing hum an fibroblasts (18) and E. coli (19) . I t is clear that the sam e type of m easurem ents are needed for all bands in act ion spect ra.
I n the wavelength range used in our experim ents, and im portant for phototherapy (600-860 nm ) , there are four "act ive" regions, but the peak posit ions are not exact ly the sam e for all act ion spect ra. The red band has a peak posit ion between 613.5 and 623.5 nm ( in one spectrum , at 606 nm ) ; the far- red band has peak posit ions between 667.5 and 683.7 nm , and two near I R bands in the range of 750.7-772.3 nm and 812.5-846.0 nm.
3 . I NTERPRETATI ON of the ACTI ON SPECTRA: CYTOCHROME C OXI DASE is the PHOTOACCEPTOR MOLECULE
I n the beginning of the 90's, the earlier act ion spect ra (3-5, 17) were analyzed using all available spect roscopic literature data (9, 20) , which allowed form ing a suggest ion about the chrom ophores involved. Bear in m ind that the chromophores are the com ponents of m olecules that absorb the light .
The act ion spect ra for DNA and RNA synthesis rate (3- 5) , and changes in the adhesion of cells to a glass m at r ix (17) without Lorentzian curve fit t ing (which was not done at that t im e) were used for a sum mation, and
Page 7 sur 24ACTION SPECTRA IMPORTANT TO LLLT
01/10/2012http://www.photobiology.info/Karu.html
t his generalized act ion spect rum is shown in Figure 3.
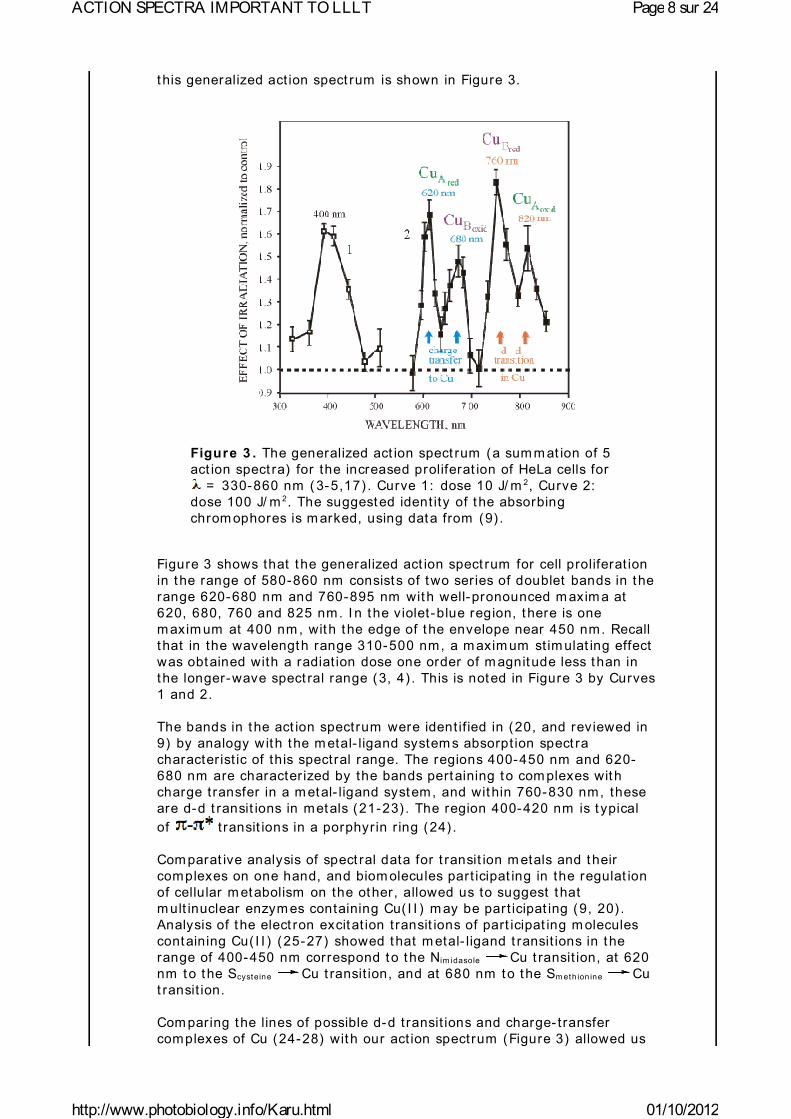
Figure 3 . The generalized act ion spect rum (a sum m at ion of 5 act ion spect ra) for the increased proliferat ion of HeLa cells for
= 330-860 nm ( 3-5,17) . Curve 1: dose 10 J/ m 2, Curve 2: dose 100 J/ m 2. The suggested ident ity of the absorbing chrom ophores is m arked, using data from (9) .
Figure 3 shows that the generalized act ion spect rum for cell proliferat ion in the range of 580-860 nm consists of two series of doublet bands in the range 620-680 nm and 760-895 nm with well-pronounced m axim a at 620, 680, 760 and 825 nm. I n the violet-blue region, there is one m axim um at 400 nm , with the edge of the envelope near 450 nm. Recall t hat in the wavelength range 310-500 nm, a m axim um st im ulat ing effect was obtained with a radiat ion dose one order of m agnitude less than in the longer-wave spect ral range (3, 4) . This is noted in Figure 3 by Curves 1 and 2.
The bands in the act ion spectrum were ident if ied in (20, and reviewed in 9) by analogy with the m etal- ligand system s absorpt ion spect ra character ist ic of this spectral range. The regions 400-450 nm and 620-680 nm are character ized by the bands pertaining to com plexes with charge t ransfer in a m etal- ligand system, and within 760-830 nm, these are d-d t ransit ions in metals (21-23) . The region 400-420 nm is t ypical of t ransit ions in a porphyrin r ing (24) .
Com parat ive analysis of spect ral data for t ransit ion m etals and their complexes on one hand, and biom olecules part icipat ing in the regulat ion of cellular m etabolism on the other, allowed us to suggest that m ult inuclear enzym es containing Cu( I I ) m ay be part icipat ing (9, 20) . Analysis of the elect ron excitat ion t ransit ions of part icipat ing m olecules containing Cu( I I ) (25-27) showed that m etal- ligand t ransit ions in the range of 400-450 nm correspond to the Nim idasole Cu t ransit ion, at 620 nm to the Scysteine Cu t ransit ion, and at 680 nm to the Sm eth ion ine Cu t ransit ion.
Com paring the lines of possible d-d t ransit ions and charge- t ransfer complexes of Cu (24-28) with our act ion spectrum (Figure 3) allowed us
Page 8 sur 24ACTION SPECTRA IMPORTANT TO LLLT
01/10/2012http://www.photobiology.info/Karu.html

t o assume that the photoacceptor m olecule has different t ypes of centers containing Cu( I I ) in the ranges of 420-450 nm and 760-830 nm . I n the range of 420-450 nm, this m ay be a combinat ion of centers of Types I and I I ( for the character ist ics of centers of Types I , I I , and I I I , see reference 23) though a center of Type I m ay be present . At 330 nm , a center of Type I I I m ay be present, and in the range 760-820 nm centers of Types I and I I I coexist . Within 620-680 nm, there is a center of Type I and a com binat ion of centers of different t ypes is unlikely.
The above analysis allowed us to conclude that all bands in the act ion spect rum in Figure 3 m ay be related to cytochrom e c oxidase (9, 20) . The data of experim ents of dichrom at ic irradiat ion and m odificat ion of light effects by adding var ious chem icals (1, 6-9) were taken into account as well in this analysis.
I n eukaryot ic cells, cytochrom e c oxidase is the term inal enzym e of the respiratory chain, which m ediates the t ransfer of electrons from cyt c to m olecular oxygen (29) . Ferrocytochrom e c is oxidized, oxygen is reduced, and protons are pum ped from the m itochondrial m atr ix to the cytosol. Free energy result ing from this redox chem ist ry is converted into an elect rochemical potent ial across the inner m em brane of the m itochondrion, which ult im ately dr ives the product ion of ATP. Accordingly, cytochrome c oxidase plays a central role in the bioenerget ics of the cell. The respiratory chains of eukaryot ic cells are located in m itochondria.
Cytochrom e c oxidase of m amm alian cells is a large m ult icom ponent m em brane protein of considerable structural com plexit y. The high-resolut ion three-dim ensional X- ray st ructure of cytochrome c oxidase of bovine heart (30-32) and Paracoccus denit r if icans (33) were reported in 1995. These studies indicated that CuA is a binuclear copper center with an unexpected st ructure sim ilar to a (2Fe-2S) t ype iron-sulfur center, in which the Fe ions and inorganic sulfur atoms are replaced with Cu ions and cysteine sulfur atom s, respect ively. The O2 binding site contains hem e a3 iron and CuB; t here is no detectable br idging ligand between iron and copper atoms. Hem e a is coordinated with two im idazoles of hist idine residues. The fift h ligand of hem e a3 is an im idazole, whereas CuB is coordinated by three im idazoles of hist idine. Residues of two cysteins, two hist idines, one m ethionine and one pept ide carbonyl of a glutam ate coordinate CuA (Cu- Cu) center (30) . These reports of the crystal st ructures have opened a new era in cytochrom e c oxidase research (34) .
Page 9 sur 24ACTION SPECTRA IMPORTANT TO LLLT
01/10/2012http://www.photobiology.info/Karu.html

Figure 4 . The schemat ic of int ram olecular elect ron t ransfer into the redox- act ive react ion center a3-CuB of cytochrom e c oxidase. Adapted from (31) .
Elect rons are t ransferred sequent ially from water-soluble cytochrome c to the CuA of cytochrom e c oxidase, then to hem e a, and to the binuclear center a3-CuB (catalyt ic center of cytochrom e c oxidase) , where oxygen is reduced to water (Figure 4) . Oxygen binds to the catalyt ic center, and is reduced to water through a ser ies of short- lived elusive interm ediates. Singular value decom posit ion analysis indicated the presence of at least seven interm ediates (35) . The best-characterized species are the ferrous-oxycom plex and peroxy species (36-38) .
Generally speaking, cytochrom e c oxidase can be fully oxidized ( four redox act ive m etal centers: CuA, CuB, irons in hem es a and a3, are in their com m on higher oxidat ion state; 3+ for iron and 2+ for copper) , or fully reduced ( four m etal centers are in their com m on lower oxidat ion state; 2+ for iron and 1+ for copper) . The part ially reduced enzyme, usually called m ixed-valence one, has som e m etal centers in their higher oxidat ion state, and the rem ainder in their lower oxidat ion state. There are also a num ber of form s of oxidized enzyme: fast enzym e ( reacts relat ively rapidly with cyanide) , slow enzym e ( reacts at about of 1% of the rate of the fast enzym e, also called rest ing enzym e) , pulsed enzym e (obtained by reducing slow enzyme and oxidizing it w ith oxygen under condit ions in which the product ion of H2O2 is avoided) , oxygenated enzym e (subjected to a cycle of reduct ion and reoxidat ion under condit ions in which H2O2 is produced) ( 38-40) . These details are given to illust rate how com plicated and cont roversial the overall picture of the funct ion of cytochrome c oxidase st ill is.
Com ing back to the com parat ive analysis of the act ion spect rum in Figure 2, and the spectroscopic data on cytochrom e c oxidase cited above, it was suggested (9, 20) that the 820 nm band belongs m ainly to oxidized CuA, t he 760 nm band to reduced CuB, t he 680 nm band to oxidized CuB, and the 620 band to reduced CuA (Figure 3) . The 400-450 nm band is m ore likely to be the envelope of a few absorpt ion bands in the range 350-500 nm ( i.e. , a superposit ion of several bands) . The band with a m axim um near 404-420 nm can be assigned to the oxidized hem e, whereas the longer-wave edge of the envelope at 450 nm (due to its asym m etry) , should evident ly be assigned to the reduced CuB. The part icipat ion of the hem e in the act ion spect ra is confirm ed by the opt im al dose rat io (10 and 100 J/ m 2, respect ively, for 404 and other visible region m axim a, ( 3-5) ) . I t should be noted that the Soret band of hem e com pounds ( i.e., t he band in the range of 400-420 nm ) is m ore intense by an order of m agnitude than the absorpt ion bands of these compounds in the visible region ( 24) . The weak band at 330 nm m ay belong to oxidized CuB. Thus, the bands at 330, 404-420, 680 and 825 nm can be at t r ibuted to a relat ively oxidized form of cytochrom e c oxidase; the edge of the blue-violet band at 450 nm and the dist inct bands at 620 and 760 nm belong to a relat ively reduced form of the enzym e. This analysis (9, 20) was perform ed before the three-dim ensional X- ray structure of cytochrom e c oxidase was reported (30-33) . The results of our analysis do not have pr incipal contradict ions with data on the structure of cytochrom e c oxidase by Tsukihara et al. (30, 31) . I t should be emphasized that every band in the absorpt ion spect ra is a result of the overlapping absorpt ion of different chrom ophores, but in an act ion spectra not all of them m ay appear.
An analysis of the band shapes in the act ion spectra (Figure 3) and the
Page 10 sur 24ACTION SPECTRA IMPORTANT TO LLLT
01/10/2012http://www.photobiology.info/Karu.html

line intensit y rat ios enabled us to conclude that cytochrom e c oxidase cannot be considered as a pr im ary photoreceptor when it is fully oxidized or fully reduced, but only when it is in one of the interm ediate form s ( i.e., part ially reduced, or mixed valence enzym e) (9, 20) .
Our suggest ion that cytochrom e c oxidase is the photoacceptor responsible for var ious cellular responses connected with light therapy in the red- to-near I R region (9) was later conform ed by the work of Pastore et al. (41) , Wong-Riley et al. (11, 42) , and Eells et al. (43, 44) , as well as by our own spectroscopic work described below in the next Sect ion (45, 46) .
A num ber of other kinds of experim ents (dose and intensity dependences for var ious wavelengths, dichrom at ic irradiat ion in var ious ways, m odificat ion of ir radiat ion experim ents by specific chem icals, and others) were perform ed ( reviews: 1, 6, 9, 47, 48) . The result s of all t hese experiments, together with act ion spect roscopy experiments, which were summ arized br iefly above, allowed the conclusion that cytochrom e c oxidase could be a universal photoacceptor for eukaryot ic cells.
4 . COMPARI SON of ACTI ON and ABSORPTI ON SPECTRA
I nsofar as an act ion spectrum mirrors the absorpt ion spect rum of the m olecule that absorbs the light and is responsible for the act ion spect rum recorded, an im portant step in ident ificat ion of this photoabsorbing m olecule is the com parison of act ion and absorpt ion spect ra.
Recording an absorpt ion spect rum of a cellular m onolayer or individual cell is not an easy task, due to weak absorpt ion and low concentrat ion of chrom ophores. The absorpt ion spect ra of individual cells were recorded years ago up to 700 nm with the aim of ident ify ing respiratory chain carr iers (49, 50) . The absorpt ion spect rum of 8 parallel m onolayers of hum an fibroblasts in the red- to-near I R region was recorded using a comm ercial double beam spectrophotom eter (51) . The absorpt ion spect rum of whole cells in the visible region was found to be qualitat ively similar to that of isolated m itochondria (49) . The extension of opt ical m easurem ents from the visible spect ral range to the far- red and near IR regions (650-1000 nm ) was undertaken late in the sevent ies for the purpose of m onitor ing the redox behavior of cytochrom e c oxidase in vivo. These studies led to the discovery of a "near IR window" into the body, and the developm ent of near I R spectroscopy for m onitor ing t issue oxygenat ion (52-54) .
For recording the absorpt ion of one cellular layer with the aim of studying the radiat ion- induced changes in the absorpt ion of cell chrom ophores, a m ult ichannel registrat ion m ethod was developed (55, 56) . Figure 5 presents the absorpt ion spectra (A-C) , and the sam e spectra after the irradiat ion at 830 nm (A1-C1) , as well as two act ion spectra (D, E) for comparison.
Page 11 sur 24ACTION SPECTRA IMPORTANT TO LLLT
01/10/2012http://www.photobiology.info/Karu.html

Figure 5 . Absorpt ion spect ra of HeLa cell m onolayer: (A-C) pr ior to and (A1-C1) after ir radiat ion at 830 nm . A, A1 (closed cuvet te) , B, B1 (open cuvet te) , C, C1 (air-dry m onolayer) . Original spect rum , curve fit t ing (solid lines) and Lorentzian fit t ing (dashed lines) are shown (adapted from ( 57) ) . Act ion spectra for: (D) st im ulat ion of DNA synthesis and (E) st im ulat ion of HeLa cell adhesion to a glass m at r ix, m easured respect ively 1.5 h after ir radiat ion of HeLa cell m onolayer (D =
Page 12 sur 24ACTION SPECTRA IMPORTANT TO LLLT
01/10/2012http://www.photobiology.info/Karu.html
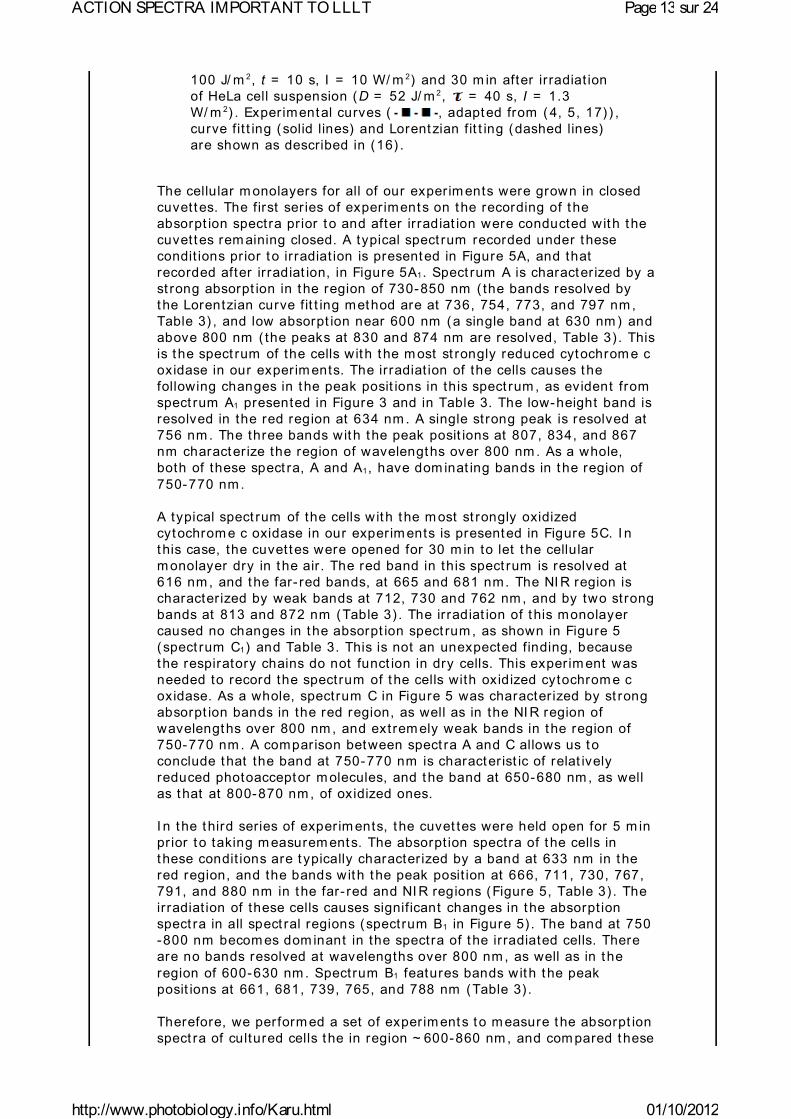
100 J/ m 2, t = 10 s, I = 10 W/ m 2) and 30 m in after ir radiat ion of HeLa cell suspension (D = 52 J/ m 2, = 40 s, I = 1.3 W/ m 2) . Experimental curves ( , adapted from ( 4, 5, 17) ) , curve fit t ing (solid lines) and Lorentzian fit t ing (dashed lines) are shown as described in (16) .
The cellular m onolayers for all of our experim ents were grown in closed cuvet tes. The first ser ies of experiments on the recording of the absorpt ion spectra pr ior to and after ir radiat ion were conducted with the cuvet tes rem aining closed. A typical spect rum recorded under these condit ions pr ior to irradiat ion is presented in Figure 5A, and that recorded after ir radiat ion, in Figure 5A1. Spect rum A is character ized by a st rong absorpt ion in the region of 730-850 nm ( the bands resolved by the Lorentzian curve fit t ing method are at 736, 754, 773, and 797 nm , Table 3) , and low absorpt ion near 600 nm (a single band at 630 nm ) and above 800 nm ( the peaks at 830 and 874 nm are resolved, Table 3) . This is the spect rum of the cells with the m ost st rongly reduced cytochrom e c oxidase in our experim ents. The irradiat ion of the cells causes the following changes in the peak posit ions in this spect rum , as evident from spect rum A1 presented in Figure 3 and in Table 3. The low-height band is resolved in the red region at 634 nm . A single strong peak is resolved at 756 nm . The three bands with the peak posit ions at 807, 834, and 867 nm character ize the region of wavelengths over 800 nm . As a whole, both of these spect ra, A and A1, have dom inat ing bands in the region of 750-770 nm .
A typical spect rum of the cells with the m ost st rongly oxidized cytochrom e c oxidase in our experim ents is presented in Figure 5C. I n this case, the cuvet tes were opened for 30 m in to let the cellular m onolayer dry in the air . The red band in this spect rum is resolved at 616 nm , and the far- red bands, at 665 and 681 nm. The NI R region is character ized by weak bands at 712, 730 and 762 nm , and by two strong bands at 813 and 872 nm (Table 3) . The irradiat ion of this monolayer caused no changes in the absorpt ion spect rum , as shown in Figure 5 (spect rum C1) and Table 3. This is not an unexpected finding, because the respiratory chains do not funct ion in dry cells. This experim ent was needed to record the spectrum of the cells with oxidized cytochrom e c oxidase. As a whole, spectrum C in Figure 5 was character ized by st rong absorpt ion bands in the red region, as well as in the NI R region of wavelengths over 800 nm , and extrem ely weak bands in the region of 750-770 nm . A comparison between spect ra A and C allows us to conclude that the band at 750-770 nm is character ist ic of relat ively reduced photoacceptor m olecules, and the band at 650-680 nm , as well as that at 800-870 nm , of oxidized ones.
I n the third series of experim ents, the cuvet tes were held open for 5 m in pr ior to taking m easurem ents. The absorpt ion spectra of the cells in these condit ions are t ypically character ized by a band at 633 nm in the red region, and the bands with the peak posit ion at 666, 711, 730, 767, 791, and 880 nm in the far- red and NI R regions (Figure 5, Table 3) . The irradiat ion of these cells causes significant changes in the absorpt ion spect ra in all spect ral regions (spectrum B1 in Figure 5) . The band at 750-800 nm becom es dom inant in the spectra of the irradiated cells. There are no bands resolved at wavelengths over 800 nm , as well as in the region of 600-630 nm . Spectrum B1 features bands with the peak posit ions at 661, 681, 739, 765, and 788 nm (Table 3) .
Therefore, we perform ed a set of experim ents to m easure the absorpt ion spect ra of cultured cells the in region ~ 600-860 nm , and com pared these
Page 13 sur 24ACTION SPECTRA IMPORTANT TO LLLT
01/10/2012http://www.photobiology.info/Karu.html

spect ra with act ion spect ra recorded already. Then, we had to check if t here were any changes in the absorpt ion spect ra due to the irradiat ion.
For quant itat ive character izat ion purposes, as well as for com parison between the recorded absorpt ion spectra, we decided to use intensity rat ios between certain absorpt ion bands. The use of spectral band intensity rat ios to analyze var ious spectra is not a new issue for spect roscopy in general (58) , but to our knowledge, it has not been used in the absorpt ion spectroscopy of isolated m itochondria or liv ing cells. The calculat ion of the intensity rat ios was shown to provide benefits for the exact com parison of spect ra in the I R region (58) . We used the band present in all absorpt ion spectra near 760 nm (exact ly at 754, 756, 767, 765, and 762 nm) (Table 3) as a character ist ic band for the relat ively reduced photoacceptor. The band used by us to character ize the relat ively oxidized photoacceptor was the one near 665 nm (exact ly at 666, 661, and 665 nm ) in spect ra B, B1, C, C1 (Table 3) . This band is so weak that it could not be resolved by the Lorentzian fit t ing m ethod in spect ra A and A1, belonging to the m ost st rongly reduced photoacceptor in our experim ents. For this reason, we used in our intensity calculat ions for spect ra A and A1 absorpt ion on the curve fit t ing level at 665 nm. The gray vert ical lines in Figure 5 m ark the bands chosen. The intensity rat io I 760/ I 665 was calculated to character ize every spect rum . I n these sim ple calculat ions, we used only the peak intensit ies (peak heights) , and not the integral intensit ies (peak areas) that are certainly needed for further developm ents. I n the case of equal concentrat ions of the reduced and oxidized form s of the photoacceptor m olecule, the rat io I 760/ I 665 should be equal to unit y. When the reduced form s prevail, t he rat io I 760/ I 665 is greater than unit y, and it is less than unity in cases where the oxidized form s dominate. Recall t hat the internal elect ron t ransfer within the cytochrom e c oxidase m olecule causes the reduct ion of m olecular oxygen via several t ransient interm ediates of var ious redox states (38, 59-61) .
Page 14 sur 24ACTION SPECTRA IMPORTANT TO LLLT
01/10/2012http://www.photobiology.info/Karu.html

The m agnitude of the I 760/ I 665 cr iter ion is 9.5 for spect rum A ( Figure 5) , 1.0 for spectrum B, and 0.36 for spectrum C. By this cr iter ion, ir radiat ion of the cells, whose spect rum is m arked by A ( I 760/ I 665 = 9.5) causes the reduct ion of the absorbing m olecule ( I 760/ I 665 for spectrum A1 is equal to 16) . I rradiat ion of the cells character ized by spect rum B also causes the reduct ion of the photoacceptor, as evidenced by the increase of the I 760/ I 665 rat io from 1.0 to 2.5 in spectrum B1. I n the spect rum of the cells with init ially more reduced photoacceptor (spect rum A) , ir radiat ion causes reduct ion to a lesser extent (16/ 9.5 = 1.7) than in that of the cells with init ially less reduced photoacceptor (spectrum B) . The intensit y rat io in this case is 2.5/ 1 = 2.5) .
Figure 5 also presents two act ion spect ra, one for the st im ulat ion of DNA synthesis in our HeLa cells (D) , and the other for the st im ulat ion of the at tachm ent of the HeLa cells to a glass matr ix (E) . A com parison of peak posit ions in the absorpt ion spect ra with these two act ion spectra (Table 3) shows a sim ilar it y between them .
The oxidized form of cytochrom e c oxidase has a broad absorpt ion band above 800 nm that is centered at 830 nm (62) . CuA, a dim eric copper complex with four ligands, is responsible for 77% of the absorbency at 810-820 nm , while the cont r ibut ion of heme a and hem e a3/ CuB is 18 and 5% , respect ively (59) . Due to the dom inat ion of the strong absorpt ion of CuA in this region, weak underlying lines are m asked in the absorpt ion spect rum of cytochrom e c oxidase (63) . A distance of 33.5 nm between the m inimal and m axim al peak posit ions in the spect ra (Table 1) is too long to be explained by m easurement error (e.g., FWHM of irradiat ing light 10 or 14 nm ) . Quite probably, different lines in the absorpt ion spect ra of interm ediates of cytochrom e c oxidase appear in the act ion spect ra. This suggest ion, however, requires further experim ental proof.
A study of the near- I R absorpt ion spect ra of m em brane-bound cytochrom e c oxidase at low tem perature shows that there are overlapping t races covering the full wavelength range from 680 to 870 nm (64-66) . Flash photolysis causes the format ion of a m ixed valence compound with a peak at 740-750 nm , which supposedly could belong to invisible copper (CuB) (67) . A band at ~ 785 nm is present in fully reduced, unliganded, five coordinated ferrous hem e a3
2+ (68) . The addit ion of carbon m onoxide to the reduced enzyme causes a blue shift from 785 nm to 760 nm in the difference spect rum , and the photodissociat ion of CO result s in a reversion of the band from 760 to 784 nm (63) .
I n the wavelength range 670-680 nm , there are no absorpt ion bands of cytochrom e c oxidase intermediates recorded so far. A sm all absorpt ion band belonging to an interm ediate (compound A) has been recorded at ~ 660 nm (59) . The appearance of the 655-nm absorpt ion band suggests that CuB is oxidized and part icipat ing in a spin-coupled state (69) . I t is suggested that the 655-nm feature m ay ar ise from a charge t ransfer band of ferr ic high-spin hem e a3, which is m odulated by the redox state of CuB. The 655-nm band disappears as the binuclear center is reduced (70) . Quite probably, this is one line in the absorpt ion spectra of cytochrom e c oxidase and/ or its interm ediates.
I t is well known that reduced cytochrom e c oxidase has a peak at 605 nm , and this peak has been recorded both in m itochondria and whole cells (71) . For m embrane-bound cytochrom e c oxidase, this peak can be red-shifted ~ 10 nm , as com pared to solubilized enzym e (69) . Som e isospect ral peroxy intermediates have a peak at ~ 607 nm in their
Page 15 sur 24ACTION SPECTRA IMPORTANT TO LLLT
01/10/2012http://www.photobiology.info/Karu.html

absorpt ion spectra (59) . The absorpt ion of this region is 75% due to low spin hem e a, and 25% by high spin heme a3. However, a definite cont r ibut ion of CuA at ~ 615 nm has been suggested as well (72) .
The same technique of absorpt ion measurem ents described in (57) was used to study oxidat ion or reduct ion of the photoacceptor under irradiat ion at = 632.8 nm as a funct ion of dose (46) .
The com parison of act ion spect ra connected with react ions in the cellular nucleus, and the absorpt ion spect ra of cellular m onolayers at (600-860 nm allow one to conclude that by peak posit ions, these two groups of spect ra m ay belong to the same m olecule.
5 . MI TOCHONDRI AL SI GNALI NG: HOW the LI GHT- GENERATED SI GNAL in MI TOCHONDRI A can I NFLUENCE CELLULAR METABOLI SM
We know from the act ion spect ra that the DNA and RNA synthesis rate is influenced by irradiat ion (Sect ion 2) , and we know that the photoacceptor ( tentat ively cytochrom e c oxidase) is located in m itochondria (Sect ion 3) . There is an im portant quest ion left : how the signal generated by the light quanta in cytochrome c oxidase is t ransduced to the nucleus. The answer is that m itochondrial ret rograde signaling quite probable is responsible for this. Interested readers are guided to a recent review (73) , however, below is a short sum mary.
Recent work has uncovered an im pressive num ber of extra m itochondrial factors that regulate the expression of nuclear genes for m itochondrial proteins. However, relat ively lit t le is known about how mitochondria send signals to the nucleus, and how the nucleus cont rols the expression of individual genes. One pathway of com municat ion in cells from m itochondria to the nucleus that influences m any cellular act iv it ies under both norm al and pathophysiological condit ions is m itochondrial ret rograde signaling (74, 75) . This recent ly discovered signaling is an opposite signaling pathway to a com m on and well defined pathway t ransforming inform at ion from the nucleus and cytoplasm to the m itochondria. Mitochondrial ret rograde signaling sends inform at ion back to the nucleus about changes in the funct ional state of the m itochondria.
The existence of a cellular signaling pathway: m itochondria cytoplasm(plasm a membrane cytoplasm) nucleus, was proposed in 1988
(8) . The reason to suggest the existence of such a cellular signaling pathway ( then nam ed photosignal t ransduct ion and amplificat ion chain) was sim ple. I t appeared that the act ion spectra for the increase of DNA and RNA synthesis rate could be recorded when cultured cells are irradiated in the region from 300 to 860 nm . The nucleus does not have chrom ophores absorbing in this region. Secondly, the data gathered to date showed that photoacceptors are located in the respiratory chain. So, it was then logical to suppose the existence of cellular signaling cascades between organelles. I n 2004, a novel m itochondrial-signaling pathway in m am m alian cells act ivated by red and near I R radiat ion was discovered (76) . I t was shown by Schroeder et al. (77) that I R-A radiat ion ( nm ) , in cont rast to UV radiat ion, elicits a retrograde signaling response in norm al hum an skin fibroblasts.
Page 16 sur 24ACTION SPECTRA IMPORTANT TO LLLT
01/10/2012http://www.photobiology.info/Karu.html

Figure 6 presents a putat ive schem at ic of m itochondrial retrograde signaling act ivated by radiat ion in the visible and I R-A regions. This schemat ic was first proposed in 1988 (8, review: 47) and later supplemented with new details according to new experim ental data (1, 9) . Som e new modificat ions are also included in the present schemat ic in Figure 6.
Mitochondrial retrograde signaling was init ially defined by an altered m itochondrial m em brane potent ial (74) . Later, other character ist ics like changes in the concent rat ion of m itochondrial ROS, Ca2+ , and nit r ic oxide, as well as changes in fission- fusion hom eostasis of m itochondria (75) were introduced. Changes in these character ist ics under the irradiat ion with light at different wavelengths follow a cyclic pat tern. First , a st im ulat ion characterized by a threshold and phase of increase occurs. After a st r ict maxim um and a phase of decrease, the cont rol level is reached. As an exam ple, at the level of a single cell and during real-t im e recording, a maxim al increase in m itochondrial m em brane potent ial
(30% of it s basal value) was observed at 2 min after a 15 s irradiat ion at 647 nm. Then decreased gradually to the basal level, which was reached 4 m in later (78) . Experim ental data about the m odulat ion of elem ents of m itochondrial ret rograde signaling by irradiat ion are reviewed in (73) .
I rradiat ion of m am m alian cells causes an upregulat ion of var ious genes (78) . The upregulat ion of genes, and the increase in DNA and RNA synthesis rate (Sect ions 1, 2) are m arked in Figure 6 in the nucleus of the cell. The cDNA m icroarray technique was used for hum an fibroblasts irradiated at 628 nm (79) . Of the 9982 gene expression profiles studied, 111 genes in 10 funct ion categories were upregulated. Note that am ong these 10 funct ion categories, 7 of them were direct ly or indirect ly involved in cell proliferat ion. The other 3 funct ion categories upregulated were genes related to t ranscr ipt ion factors, im m une/ inflam m at ion, and cytokines as well as som e genes not ident ified (79) .
I t should be noted that the responses of m am m alian cells to visible and near IR radiat ion, as well as the sensit iv ity of the m itochondrial respiratory chain com ponents to this radiat ion have never gained as m uch serious at tent ion by photobiologists, as have the funct ional photoacceptors, such as chlorophyll and rhodopsin. However, fragm entary knowledge gathered so far forces one to ask whether the photosensit iv ity of som e enzym es of the m itochondrial respiratory chain m ay have a physiological significance in spite of the com plete adaptat ion of liv ing system s to photons as a natural external factor.
Page 17 sur 24ACTION SPECTRA IMPORTANT TO LLLT
01/10/2012http://www.photobiology.info/Karu.html

There is every reason to believe, on the basis of experimental data gathered so far, that m itochondrial ret rograde signaling, a recent ly discovered cellular signaling pathway, funct ions also in irradiated cells. Modulat ion of ret rograde mitochondrial signaling elem ents like , (ROS) m , (Ca2+ ) m in ir radiated cells is rather well documented ( review: 73) . Also, the responses to irradiat ion occurr ing in the nucleus ( i.e., increase in DNA and RNA synthesis rate, and expression of genes of var ious funct ion categories) are definitely documented. However, the pathways of light signal t ransduct ion between these two ends needs further invest igat ion.
6 . CONCLUSI ONS
1. The similar it y of act ion spect ra for different cellular responses suggests that the photoacceptor is the sam e for these responses. For the responses reported here, the photoacceptor appears to be cytochrom e c oxidase. Recall that it was suggested in 1981 that photosensit iv it y m ight be a comm on m itochondrial property in higher animals, and could have physiological significance under certain condit ions, e.g., exposure to orange- red light , and high ADP levels (80) .
2. Based on these act ion spect ra, var ious wavelengths can be used for low level light therapy, i.e. , those around 404, 620, 680, 760, and 820 nm .
Page 18 sur 24ACTION SPECTRA IMPORTANT TO LLLT
01/10/2012http://www.photobiology.info/Karu.html
3. The existence of the act ion spect ra for biochem ical processes occurr ing in var ious cellular organelles (nucleus, plasm a m em brane) assum e the existence of cellular signaling pathways between a photoacceptor in the m itochondria and the nucleus, as well as between photoacceptor and the plasm a m em brane.
4. I t is believed that the "m itochondrial m echanism " of low level light therapy works in all t ypes of cells containing m itochondria (1) .
REFERENCES
1. T. Karu ( 2007) . "Ten Lectures on Basic Science of Laser Phototherapy" Prim a Books AB, Grngesberg (Sweden) .
2. Hartm ann, K.M. (1983) . Act ion spectroscopy, in W. Hoppe, W. Lohm ann, H. Marke, H. Ziegler (Eds.) . The Biophysics, Springier: Heidelberg, Ch. 3.2.7. pp.115-144.
3. Karu, T.I ., Kalendo, G.S., Letokhov, V.S. and Lobko V.V. ( 1982) . Biost im ulat ion of HeLa cells by low intensit y visible light . Nuovo Cim ento D, 1, 828- 840.
4. Karu, T.I ., Kalendo, G.S., Letokhov, V.S., and Lobko V.V. (1984) . Biost im ulat ion of HeLa cells by low- intensit y visible light . I I . St im ulat ion of DNA and RNA synthesis in a wide spect ral range. Nuovo Cimento D, 3, 308-318.
5. Karu, T.I ., Kalendo, G.S., Letokhov, V.S., and Lobko V.V. (1984) . Biost im ulat ion of HeLa cells by low intensit y visible light . I I I . St im ulat ion of nucleic acid synthesis in plateau phase cells. Nuovo Cim ento D, 3, 319-325.
6. Karu T. I . (1987) . Photobiological fundam entals of low-power laser therapy. IEEE J. Quantum Electronics, QE-23, 1703-1717.
7. Karu, T.I ., Letokhov, V.S., and Lobko V.V. (1985) . Biost im ulat ion of HeLa cells by low- intensity visible light . I V. Dichrom at ic irradiat ion. Nuovo Cimento D, 5, 483-496.
8. Karu T. I . (1988) . Molecular m echanism of the therapeut ic effect of low- intensity laser radiat ion. Lasers Life Sci., 2, 53-74.
9. Karu T. I . (1999) . Pr im ary and secondary m echanism s of act ion of visible- to-near I R radiat ion on cells. J. Photochem. Photobiol. B: Biology, 49, 1-17.
10. Tiphlova, O. and Karu, T.(1991) . Act ion of low- intensit y laser radiat ion on Escherichia coli. CRC Crit ical Rev. Biom ed. Eng., 18, 387-412.
11. Wong-Riley, M.T.T. , Liang, H.L. Eells, J.T. , Chance B., Henry, M.M., Buchm ann, E., Kane, M., and Whelan, H.T. (2005) . Photobiom odulat ion direct ly benefit s pr im ary neurons funct ionally inact ivated by toxins: Role of cytochrom e c oxidase. J. Biol. Chem ., 280, .
12. Szacilowski, K., Macyk, W. Drzewiecka-Matuszek, A. , Brindell, M., and Stochel, G. (2005) . Bioinorgranic photochem istry: front iers and m echanism s. Chem . Rev. 105, .
Page 19 sur 24ACTION SPECTRA IMPORTANT TO LLLT
01/10/2012http://www.photobiology.info/Karu.html

13. Hug, D.N. (1978) . The act ivat ion of enzym es with light . In: Photochem . Photobiol. Rev. Ed. by K. Smith, New York, London: Plenum Press, vol. 3, pp. 1-33.
14. Hug, D.N. and Hunter, Y.K. (1991) . Photom odulat ion of enzym es. J. Photochem . Photobiol. B: Biol. 10, 3-22.
15. Jagger, J. (2004) . Personal reflect ions on m onochrom ators and act ion spect ra for photoreact ivat ion. J. Photochem . Photobiol. B: Biol., 73, 109-114.
16. Karu, T. I . and Kolyakov, S.F. (2005) . Exact act ion spect ra for cellular responses relevant to phototherapy. Photom ed. Laser Surg. 23, 355-361.
17. Karu, T. I . , Pyat ibrat , L.V. , Kalendo, G.S., and Esenaliev, R.O. (1996) . Effects of m onochromat ic low- intensit y light and laser irradiat ion on adhesion of HeLa cells in vit ro. Lasers Surg. Med., 18, 171-177.
18. van Breugel, H.H.F.I . and Dop Bar, P.R. (1992) . Power densit y and exposure t im e of He-Ne laser irradiat ion are m ore important than total energy dose in photobiom odulat ion of hum an fibroblasts in vit ro. Laser Surg. Med., 12, 528-537.
19. Karu, T. , Tiphlova, O., Esenaliev, R., and Letokhov, V. (1994) . Two different m echanism s of low- intensit y laser photobiological effects on Escherichia coli. J. Photochem . Photobiol. B: Biology, 24, 155-161.
20. Karu, T. I . and Afanasyeva, N.I . (1995) . Chytochrom e oxidase as pr im ary photoacceptor for cultured cells in visible and near I R regions. Doklady Akad. Nauk (Moscow) 342, 693-695.
21. Wilkinson, G., Gillard, R.D. and McCleverty, J.A. , Eds. (1987) . Com prehensive Coordinat ion Chemistry. Oxford: Pergam on Press, vol. 1-7.
22. Siegel, H. Ed. (1971-1981) . Metal I ons in Biological System s. New York, Basel: M. Dekker, v. 1-13.
23. Hughes, M. (1987) . Coordinat ion Com pounds in Biology. I n: Com prehensive Coordinat ion Chemistry. Ed. by G. Wilkinson, R.D.Gilland and J.A. McCleverty, Oxford: Pergam on Press, vol. 6, pp. 541-753.
24. Gouterm an, M. (1978) . Opt ical spect ra and elect ronic st ructure of porphyrins and related r ings. I n: The Porphyrins. Ed. by D. Dolphin. New York: Acad. Press, v. 3, pp. 1-16.
25. Hathaway, B.J. ( 1987) . Copper. In: Com prehensive Coordinat ion Chem ist ry. Ed. by G. Wilkinson, R.D. Gillard and J.A. McCleverty. Oxford: Pergam on Press, vol. 5, pp.534-774.
26. Lont ie, R. , Ed. ( 1984) . Copper Proteins and Copper Enzym es. Boca Raton: CRC Press, v. 1-3.
27. Spiro, G., Ed. (1981) . Copper Proteins. New York: Wiley I ntersci.
28. Karlin, D. and Zubieta, J., Eds. (1983) . Copper Coordinat ion Chem ist ry. New York: Acad. Press.
Page 20 sur 24ACTION SPECTRA IMPORTANT TO LLLT
01/10/2012http://www.photobiology.info/Karu.html

29. Brunori, M. and Chance, B., Eds. (1988) . Cytochrom e Oxidase: Structure, Funct ion and Physiopathology. Ann. N.Y. Acad. Sci., v. 550.
30. Tsukihara, T. , Aoyma, H., Yamashita, E., Tom izaki, T., Yam aguchi, H., Shinzawa- I toh, K., Nakashim a, R., Yaono, R. , and Yoshikawa, S. (1995) . Structures of metal sites of oxidized bovine heart cytochrome c oxidase at 2.8 Å. Science 269, 1069-1074.
31. Tsukihara, T. , Aoyam a, H., Yam ashita, E., Tom izaki, T., Yam aguchi, H., Shinzawa- I toh, K., Nakashim a, R., Yaono, R. , and Yoshikawa, S. (1996) . The whole st ructure of the 13-subunit oxidized cytochrom e c oxidase at 2.8 Å. Science 272, 1136-1144.
32. Gennis, R. and Ferguson-Miller, S. (1995) . St ructure of cytochrom e c oxidase, energy generator of aerobic life. Science 269, 1063- 1064.
33. Iwata, S. , Osterm eier, C., Ludwig, B., and Michel, H. (1995) . Structure of 2.8 Å resolut ion of cytochrome c oxidase from Paracoccus denit r if icans. Nature 376, 660-669.
34. Yoshikawa, S. (1997) . Beef heart cytochrom e c oxidase. Curr. Opin. Struct . Biol. 7, 574-579.
35. Sucheta, A., Georgiadis, K.E., and Einarsdot t ir , O. (1997) . Mechanism of cytochrome c oxidase-catalyzed reduct ion of dioxygen to water: evidence for peroxy and ferryl interm ediates at room tem perature. Biochem istry 36, 554-565.
36. Babcock, G. T. and Wikst röm , M. (1992) . Oxygen act ivat ion and the conservat ion of energy in cell respirat ion. Nature 356, 301-309.
37. Verkhovsky, M.I ., Morgan, J.E. and Wikström, M. (1996) . Redox t ransit ions between oxygen interm ediates in cytochrom e c oxidase. Proc. Acad. Sci. USA 93, 12235-12339.
38. Brunori, M., Giuffre, A., and Sart i, P. (2005) . Cytochrom e c oxidase, ligands and elect rons. J. Inorg. Biochem . 99, 324-336.
39. Capaldi, R.A. (1990) . Structure and funct ion of cytochrome c oxidase. Annu. Rev. Biochem . 59, 569-596.
40. Palm er, G. (1993) . Current issues in the chem istry of cytochrom e c oxidase. J. Bioenerg. Biom em br. 25, 145-151.
41. Pastore, D. , Greco, M., and Passarella, S. (2000) . Specific helium -neon laser sensit iv it y of the purified cytochrom e c oxidase. Int . J. Rad. Biol. 76, 863-870.
42. Wong-Riley, M.T., Bai, X., Buchm an, E. and Whelan, H.T. (2001) . Light-emit t ing diode t reatm ent reverses the effect of TTX on cytochrom e c oxidase in neurons. Neuroreport 12, .
43. Eells, J.T. , Henry, M.M., Sum m erfelt , P., Wong-Riley, M.T., Buchm ann, E.V., Kane, M., Whelan, N.T., and Whelan, H.T. (2003) . Therapeut ic photobiom odulat ion for m ethanol- induced ret inal toxicity. Proc. Nat l. Acad. Sci. USA 100, .
44. Eells, J. , Wong-Riley, M.T., VerHoeve, J., Henry, M., Buchm an, E.V., Kane, M.P., Gould, L.J., Das, R., Jet t , M., Hodgson, B.D., Margolis, D. ,
Page 21 sur 24ACTION SPECTRA IMPORTANT TO LLLT
01/10/2012http://www.photobiology.info/Karu.html

and Whelan, H.T. (2004) . Mitochondrial signal int roduct ion in accelerated wound and ret inal healing by near- infrared light therapy. Mitochondrion 4, 559-567.
45. Karu, T. I . , Pyat ibrat , L.V. Kolyakov, S.F., and Afanasyeva, N.I . (2005) . Absorpt ion m easurem ents of a cell m onolayer relevant to phototherapy: reduct ion of cytochrom e c oxidase under near I R radiat ion. Photochem . Photobiol. B: Biol. 81, 98-106.
46. Karu, T. I . , Pyat ibrat , L.V. , Kolyakov, S., and Afanasyeva, N.I . (2008) . Absorpt ion m easurem ents of cell m onolayers relevant to m echanism s of laser phototherapy: reduct ion or oxidat ion of cytochrom e c oxidase under laser radiat ion at 632.8 nm . Photom edicine and Laser Surgery, 26 ( in the press) . 47. Karu, T. (1989) . Photobiology of low-power laser effects. Health Phys. 56, 691-704.
48. Karu, T. I . (1989) . Photobiology of Low-Power Laser Therapy. Chur, London: Harwood Acad. Publ.
49. Chance, B. and Hess, B. (1959) . Spectroscopic evidence of m etabolic cont rol. Science 129, 700-708.
50. Nicholls, P. and Elliot , W.B. (1974) . The cytochrom es. I n: I ron in Biochem istry and Medicine. Ed by A. Jacobs and M. Worwood, London, New York: Acad. Press, pp. 221-272.
51. van Breugel, H.H. and Dop Bär, P.R. (1992) . Power density and exposure t im e of He-Ne laser irradiat ion are m ore important than total energy dose in photo-biom odulat ion of hum an fibroblasts in vit ro. Lasers Surg. Med. 12, 528-537.
52. Jöbsis, F.F. (1977) . Noninvasive infra- red m onitor ing of cerebral and m yocardial oxygen sufficiency and circulat ing parameters. Science 198, 1264-1267.
53. Jöbsis-vander Vliet , F.F. (1999) . Discovery of the near- infrared window into the body and the early developm ent of near- infrared specroscopy. J. Biom ed. Opt . 4, 392- 396.
54. Cooper, C. and Springet t , I .R. (1997) . Measurement of cytochrom e c oxidase and m itochondrial energet ics by near infrared spect roscopy. Phil. Trans. R. Soc. Lond. B. 352, 669-676.
55. Karu, T. I . , Afanasyeva, N. I . , Kolyakov, S.F., and Pyat ibrat , L.V. (1998) . Change in absorpt ion spect rum of a m onolayer of live cells under low- intensit y laser irradiat ion. Dokl. Akad. Nauk. (Moscow) 360, 267-270.
56. Karu, T. I ., Afanasyeva, N.I ., Kolyakov, S.F., Pyat ibrat , L.V., and Welser, L. (2001) . Changes in absorbance of m onolayer of liv ing cells induced by laser radiat ion at 633, 670, and 820 nm . IEEE Select . Topics Quantum Elect r . 7, 982-988.
57. Karu, T. I . , Pyat ibrat , L.V. Kolyakov, S.F., and Afanasyeva, N.I . (2005) . Absorpt ion m easurem ents of a cell m onolayer relevant to phototherapy: reduct ion of cytochrom e c oxidase under near I R radiat ion. Photochem . Photobiol. B: Biol. 81, 98-106.
58. Sm ith, B. (1986) . Fundam entals of Fourier Transform I nfrared
Page 22 sur 24ACTION SPECTRA IMPORTANT TO LLLT
01/10/2012http://www.photobiology.info/Karu.html

Spect roscopy. New York: CRC Press.
59. Szundi, I ., Liao, G.-L. , and Einarsdot t ir , O. (2001) . Near- infrared t im e- resolved opt ical absorpt ion studies of the react ion of fully reduced cytochrom e c oxidase with dioxygen. Biochem istry 40, 2332-2339.
60. Szundi, I ., Cappuccio, J. and Einarsdot t ir , O. (2004) . Am plitude analysis of single-wavelength t im e-dependent absorpt ion data does not support the convent ional sequent ial m echanism for the reduct ion of dioxygen to water catalyzed by bovine heart cytochrom e c oxidase. Biochem istry 43, 15746-15758.
61. Richter, O.-M. and Ludwig, B. (2003) . Cytochrom e c oxidase -st ructure, funct ion, and physiology of a redox-dr iven m olecular m achine. Rev. Physiol. Biochem . Pharm acol. 147, 47-74.
62. Griff iths, D.E. and Wharton, D.C. (1961) . Studies of the elect ron t ransport system . XXXV. Purificat ion and propert ies of cytochrom e oxidase. J. Biol. Chem ., 236, 1850-1856.
63. Rich, P.R., Moody, A.J. , and I ngledew, W.J. (1992) . Detect ion of near infra- red absorpt ion band of ferrohaem a3 in cytochrome c oxidase. FEBS Let t . 305, 171-173.
64. Shaw, R.W., Hansen, R.E., and Beinert , H. (1979) . The oxygen react ions of reduced cytochrom e c oxidase. Posit ion of a form with an unusual EPR signal in the sequence of ear ly interm ediates. Biochim . Biophys. Acta 548, 386-396.
65. Beinert , H., Hansen, R.E., and Hartzell, C.R. (1976) . Kinet ic studies on cytochrom e c oxidase by com bined epr and reflectance spectroscopy after rapid freezing. Biochim . Biophys. Acta 423, 339-335.
66. Beinert , H., Shaw, R.W., Hansen, R.E., and Hartzell, C.R. (1980) . Studies on the or igin of the near- infrared (800-900) absorpt ion of cytochrom e c oxidase. Biochim . Biophys. Acta 591, 458-470.
67. Chance, B. and Leigh, J.S. (1977) . Oxygen interm ediates and m ixed valence states of cytochrome c oxidase: infrared absorpt ion difference spect ra of com pounds A, B, and C of cytochrom e oxidase and oxygen. Proc. Nat l. Acad. Sci. USA, 74, .
68. Einarsdot t ir , O., Georgiadis, K.E. , and Dawes, T.D. (1992) . Evidence for a band I I I analogue in the near- infrared absorpt ion spect ra of cytochrom e c oxidase. Biochem. Biophys. Res. Comm ., 184, 1035-1041.
69. Clore, M. (1980) . Character izat ion of the interm ediates in the react ion of m em brane-bound mixed-valence-state cytochrom e oxidase with oxygen at low tem peratures by opt ical spectroscopy in the visible region. Biochem . J. 187, 617- 622.
70. Mitchell, R., Mit chell, P. , and Rich, P. (1991) . The assignment of 655 nm spect ral band of cytochrom e c oxidase. FEBS Let t ., 280, 321-324.
71. Chance, B., and Hess, B. (1959) . Spect roscopic evidence of m etabolic cont rol. Science, 129, 700-708.
72. Brunori, M., Antonini, E. , and Wilson, M.T. ( 1981) . Cytochrome c oxidase: an overview of recent work. in: H. Siegel, (Ed.) . Metal I ons in
Page 23 sur 24ACTION SPECTRA IMPORTANT TO LLLT
01/10/2012http://www.photobiology.info/Karu.html

Biological System s M. Dekker: N.Y. , Basel, vol. 13, pp. 187-228.
73. Karu, T. ( 2008) . Mitochondrial signaling in m am m alian cells act ivated by red and near I R radiat ion. Photochem . Photobiol. 84, 1091-1099.
74. Butow, R.A. and N.G. Avadhani (2004) Mitochondrial signaling: the ret rograde response. Mol. Cell. 14, 1-15.
75. Ryan, M.T. and N.J. Hoogenraad (2007) Mitochondrial-nuclear comm unicat ions. Annu. Rev. Biochem . 76, 701-722.
76. Karu, T. , Pyat ibrat , L. and Afanasyeva, N. (2004) . A novel m itochondrial signaling pathway act ivated by visible- to-near infrared radiat ion. Photochem . Photobiol. 80, 366-372.
77. Schroeder, P., C. Pohl, C. Calles, C. Marks, S. Wild, and J. Krutm ann. (2007) . Cellular response to infrared radiat ion involves ret rograde m itochondrial signaling. Free Rad. Biol. Med. 43, 128-135.
78. Zhang, Y., Song, S., Fong, C.-C., Tsang, C.-H., Yang, Z., and Yang, M. (2003) . cDNA m icroarray analysis of gene expression profiles in hum an fibroblast cells ir radiated with red light . J. I nvest . Derm atol. 120, 849-857.
79. Alexandratou, E., D. Yova, P. Handris, D. Kletsas and S. Loukas (2002) Hum an fibroblast alterat ions induced by low power laser irradiat ion at the single cell level using confocal m icroscopy. Photochem . Photobiol. Sci. 1, 547-552.
80. Kato, M., K. Sinizawa, and S. Yoshikawa (1981) Cytochrom e c oxidase is a possible photoacceptor in mitochondria. Photochem . Photobiophys. 2, 263-269.
10/ 14/ 08
[ TOP ]
Page 24 sur 24ACTION SPECTRA IMPORTANT TO LLLT
01/10/2012http://www.photobiology.info/Karu.html