activités cytotoxiques et pro-oxydantes d'acides gras à très longue
TRANSCRIPT
HAL Id: tel-00597383https://tel.archives-ouvertes.fr/tel-00597383
Submitted on 31 May 2011
HAL is a multi-disciplinary open accessarchive for the deposit and dissemination of sci-entific research documents, whether they are pub-lished or not. The documents may come fromteaching and research institutions in France orabroad, or from public or private research centers.
L’archive ouverte pluridisciplinaire HAL, estdestinée au dépôt et à la diffusion de documentsscientifiques de niveau recherche, publiés ou non,émanant des établissements d’enseignement et derecherche français ou étrangers, des laboratoirespublics ou privés.
Activités cytotoxiques et pro-oxydantes d’acides gras àtrès longue chaîne sur des oligodendrocytes murins
sauvages et déficients en Abcd1 et Acox1 : application àla physiopathologie de l’X-ALD et de la P-NALD
Mauhamad Baarine
To cite this version:Mauhamad Baarine. Activités cytotoxiques et pro-oxydantes d’acides gras à très longue chaîne sur desoligodendrocytes murins sauvages et déficients en Abcd1 et Acox1 : application à la physiopathologiede l’X-ALD et de la P-NALD. Sciences agricoles. Université de Bourgogne, 2010. Français. <NNT :2010DIJOS047>. <tel-00597383>

UNIVERSITE DE BOURGOGNE
ECOLE DOCTORALE ENVIRONNEMENT – SANTE/STIC
THÈSE
Pour obtenir le grade de
Docteur de l’Université de Bourgogne
Discipline : Biochimie, Biologie Cellulaire et Moléculaire
Présentation et soutenance publiques par :
Mauhamad Baarine
15 Décembre 2010
Activités cytotoxiques et pro-oxydantes d'acides gras à très longue chaîne sur des oligodendrocytes murins sauvages et déficients en Abcd1 et Acox1 : application à la
physiopathologie de l'X-ALD et de la P-NALD.
Directeur de thèse : Gérard Lizard
Membres du Jury : Mme Nathalie Cartier, DR Inserm U745 - Université Paris Descartes (Paris 5) Rapporteur M. Saïd Ghandour, DR CNRS, LINC-IFR 37 - Université de Strasbourg Rapporteur M. Charbel Massaad, Pr CNRS UMR 8194 - Université Paris Descartes (Paris 5) Examinateur M. Mustapha Cherkaoui-Malki , Pr Inserm U866 - Université de Bourgogne Examinateur M. Gérard Lizard , CR Inserm U866 - Université de Bourgogne Directeur de thèse
Qu’il me soit permis de remercier :
Les Docteurs Nathalie Cartier et Saïd Ghandour qui ont accepté de bien vouloir lire et
évaluer ce travail. Qu’ils soient assurés de ma profonde reconnaissance,
Messieurs les Professeurs Charbel Massaad et Mustapha Cherkaoui-Malki pour avoir
accepté d’examiner ce travail,
Monsieur le Professeur Patrick Aubourg pour avoir fourni les échantillons biologiques
(plasmas de patients atteints de l’X-ALD),
Mesdames Anne Athias et Christine Arnould pour leur assistance technique (analyse
lipidique et microscopie confocale),
Messieurs André Bouchot et Franck Ménetrier pour leur assistance technique (vidéo-
Microscopie et Microscopie électronique à transmission),
Monsieur le Professeur Norbert Latruffe pour m’avoir accueilli dans son laboratoire,
Monsieur le Docteur Gérard Lizard de m’avoir accueilli dans son équipe et d’avoir
supervisé ces travaux.
Mes remerciements vont également à tous les membres de l'équipe 'Biochimie Métabolique
et Nutritionnelle' qui m'ont accompagné au quotidien dans mon travail de Thèse :
Stéphane Savary, Doriane Trompier, Valérie Nicolas, Stéphane Mandard, Pierre Andreoletti
(Merci pour la mesure de l'activité Acox1, Catalase...).
Flore, Fred (arrête de toucher partout !!), Julie, Manu : (collègues du bureau), Hammam,
Kévin, Ségolène, Didier, Emeric (toi alors !!!! t’as besoin d’une bonne correction), Virginie
ou chromosome 28 (salsa ! salsa !), Jacques (le polonnais), Allan, Zilal, Thomas (le
nouveau).
Et enfin à Nathalie Bancod (Mme Bancod) : Notre secrétaire si aimable, si rigolote (je sais
que j’étais parfois lourd � mais c’est toujours dans le bon sens☺)
Qu'ils trouvent ici mes sincères remerciements.

J’aimerais également remercier tous les amis de Dijon : Maher ou hamidaaaa (Dr 3ala nafask), café des ducs, café droits-letrre,Hâagen-dazs……oufffffff
Samer (pipo), celui qui n’arrête jamais alors jamais de parler
Houssein nasrallah (oh lala …..Nos folles soirées, nos matchs de foot où on s’engueule tout le temps
… que de bons souvenirs)
Jack hindieh ou jaco ou encore drink machin (l’irlandais)
Chadi dit il lembi
Toni abi habi : le canadien
Ahmad youssif (le grec) dit houbi wa hanani
Bilal abou cha3ar : il belgiqui
Jalal il 2awi wal batal
Omar kobani : le plus mauvais joueur de foot que je n’ai jamais vu
Bechara al bouna ou bach (mon voisin et mon super amigo)
Alawiyi : ya kabir, mon collègue de l’ESC de Dijon, et collègue de la pose café entre midi et deux
Cosette: Sadikati al 3akariyi WA oustazat al lough al3arabiya ☺
Roy : la2 PLeaz wati sawtak
Ouaiss : ami de Lyon
Stéphane : je pourrai dire qu’après 6 ans à Dijon j’ai un vrai ami français ☺
Guillaume et Ludiwine : mes amis les méditerranéens, les soirées, la piscine,… que de bons souvenirs
Grand merci à tous les autres que je n’ai pas pu citer…
Je n’oublie pas non plus mes parents, mes frères et sœurs et toute ma famille pour leur soutien moral
et financier.

A ma mère A mon père A ma famille
RésuméRésuméRésuméRésumé
L’X-ALD et la P-NALD sont deux maladies peroxysomales, métaboliques et neurodégénératives rares. L'X-ALD et la P-NALD résultent de déficiences respectives en ABCD1 et ACOX1. Ces deux maladies dans leurs formes sévères sont associées à des phénomènes de démyélinisation inflammatoire du SNC. Au niveau des lésions, des signes d'oxydation et une mort cellulaire sont observés. L’accumulation des AGTLC plasmatiques et tissulaires est le critère biochimique commun à ces deux maladies. Dans un premier temps, nous avons caractérisé une lignée d'oligodendrocytes murins 158N afin de l'utiliser comme modèle. Cette lignée qui présente des caractéristiques d'oligodendrocytes matures (expression des protéines de myéline MOG, MBP, PLP) possède aussi des peroxysomes fonctionnels possédant les protéines Abcd1 et Acox1. Ensuite, nous avons étudié les effets cytotoxiques et pro-oxydants des AGTLC (C24:0 et C26:0), ainsi que l’incidence de l’extinction d’Abcd1 et d’Acox1 par siRNA sur l'équilibre RedOx et la mort cellulaire. Les effets des AGTLC sur les caractéristiques biophysiques de la membrane cytoplasmique ont aussi été abordés. Par ailleurs, des marqueurs du stress oxydant ont été recherchés sur des plasmas des patients atteints de différentes formes d’X-ALD. In vitro, nous avons montré que l’accumulation d'AGTLC dans les cellules 158N induit une surproduction d'espèces radicalaires de l'oxygène et de l'azote et une perturbation des défenses anti-oxydantes (catalase, SOD, GSH). Ceci s'accompagne d'une peroxydation lipidique, d'une carbonylation des protéines et d'une dégradation de l'ADN. L'extinction d'Abcd1 et d'Acox1 par des siRNA augmente la production d'espèces radicalaires et potentialise le stress oxydant induit par les AGTLC. Sur les plasmas de patients atteints de différentes formes d’X-ALD, comparativement à des sujets sains, nous avons montré l’accumulation des produits de peroxydation lipidiques (7-hydroxycholestérols, HODEs). Le taux de ces deux produits est corrélé avec la sévérité de la maladie: CCALD>AMN>Addison>ACALD. Les AGTLC induisent aussi la mort des cellules 158N par un processus non apoptotique. Cette mort cellulaire est caractérisée par: une perturbation rapide du calcium intracellulaire, une diminution du pH, une chute du potentiel transmembranaire mitochondrial associée à des modifications structurales des mitochondries, une déstabilisation des lysosomes et une formation de figures d'autophagie. Les AGTLC perturbent aussi la fluidité membranaire. Par ailleurs, les AGTLC n'affectent pas l'expression des protéines majeures de la myéline PLP et MBP. Ces travaux ont mis en évidence un lien direct entre l'accumulation des AGTLC, le stress oxydant et l'induction de mort cellulaire faisant intervenir les lysosomes. La déficience en Abcd1 et Acox1 favorise le stress oxydant. En accord avec les résultats obtenus in vitro, la mise en évidence de marqueurs de peroxydation lipidiques dans le plasma de malades atteints d'X-ALD conforte l'hypothèse d'une intervention du stress oxydant dans cette pathologie. Mots-clés : Peroxysome, X-ALD, P-NALD, oligodendrocytes 158N, AGTLC, mort cellulaire, stress oxydant, protéines de myéline, siRNA, lysosome.

AbstractAbstractAbstractAbstract
X-ALD and P-NALD are two rare, peroxisomal metabolic and neurodegenerative diseases. ABCD1 and ACOX1 are known to be responsible for X-ALD and P-NALD, respectively. The actively demyelinating lesions in CNS, exhibited signs of oxidative stress and cell death. The accumulation of VLCFA in plasma and tissue is the biochemical common hallmark to both diseases. First, we characterized a murine oligodendrocytes cell line 158N to use it as a model. This 158N cell line which has characteristics of mature oligodendrocytes (expression of myelin proteins MOG, MBP, PLP), has also functional peroxisomes with Abcd1 and Acox1 proteins. Then, we studied the cytotoxic and pro-oxidative effects of VLCFA (C24: 0 and C26: 0), and the effects of in vitro silencing of the Abcd1 and Acox1 genes by siRNA on the redox balance and cell death. Effects of VLCFA on the biophysical characteristics of cytoplasmic membrane were also evaluated. Moreover, markers of oxidative stress were researched on plasma of patients with different forms of X-ALD.
In vitro, we showed that the accumulation of VLCFA on 158N cells induced overproduction of reactive oxygen and nitrogen species and a disruption of antioxidant defense systems (catalase, SOD, GSH). This was accompanied by lipid peroxidation, protein carbonylation and degradation of DNA. The extinction of Abcd1 and Acox1 by siRNA increased the production of radical species and potentialized the oxidative stress induced by VLCFA. On plasma of patients with different forms X-ALD, compared to healthy subjects, we showed an accumulation of lipid peroxidation products (7-hydroxycholesterol, HODEs). The rate of these two products is correlated with the severity of the disease: CCALD> AMN> Addison> ACALD.
The VLCFA also induce cell death on 158N by a non-apoptotic process. This cell death is characterized by: a rapid increased of intracellular Ca2+ level, pH decrease, a loss of mitochondrial transmembrane potential associated with structural changes of mitochondria, a destabilization of lysosomes, and formation of autophagic vacuoles. The VLCFA also disrupt the membrane fluidity. Furthermore, VLCFA do not affect the expression of myelin major proteins PLP and MBP. This work highlighted a direct link between VLCFA accumulation, oxidative stress and induction of cell death involving lysosomes. Abcd1 and Acox1 deficiency promotes oxidative stress. In agreement with results obtained in vitro, the detection of markers of lipid peroxidation in the plasma of X-ALD patients favors the hypothesis of an involvement of oxidative stress in this pathology.
Keywords : Peroxisome, X-ALD, P-NALD, oligodendrocytes 158N, AGTLC, cell death, oxidative stress, myelin proteins, siRNA, lysosome.
1
SOMMAIRE LISTE DES FIGURES ________________________________________________________________ 3
LISTE DES TABLEAUX ______________________________________________________________ 4
ABREVIATIONS ___________________________________________________________________ 5
ETUDE BIBLIOGRAPHIQUE __________________________________________________________ 7
I Avant-propos ____________________________________________________________________ 8
II Le Peroxysome __________________________________________________________________ 10
1 Généralités ____________________________________________________________________________ 10 2 Structure des peroxysomes _______________________________________________________________ 10 3 Biogenèse des peroxysomes _______________________________________________________________ 10
3.1 Adressage des protéines vers le peroxysome _______________________________________________ 14 3.2 Prolifération peroxysomale _____________________________________________________________ 16
4 Rôles des peroxysomes ___________________________________________________________________ 16 4.1 Fonctions peroxysomales en relation avec le métabolisme des lipides __________________________ 17
4.1.1 Béta-oxydation peroxysomale ______________________________________________________ 17 4.1.2 Alpha-oxydation peroxysomale _____________________________________________________ 23 4.1.3 Synthèse d’éthers de lipides : les plasmalogènes _______________________________________ 25
4.2 Autres fonctions métaboliques __________________________________________________________ 27 4.2.1 Synthèse d’acide docosahexaénoïque (DHA) __________________________________________ 27 4.2.2 Synthèse des acides biliaires _______________________________________________________ 29 4.2.3 Métabolisme des leucotriènes ______________________________________________________ 29
4.3 Fonctions de détoxication (catalase – oxydase) _____________________________________________ 30 4.4 Peroxysome et système nerveux central __________________________________________________ 32
4.4.1 Rôle du peroxysome dans le système nerveux central et incidence sur la myélinisation ________ 32 4.4.2 Peroxysome et médiateurs lipidiques d’inflammation dans le système nerveux central ________ 35
5 Interaction du peroxysome avec d’autres organelles ___________________________________________ 37 5.1 Interaction peroxysome - mitochondrie ___________________________________________________ 37 5.2 Interaction peroxysome – réticulum endoplasmique_________________________________________ 39
III Maladies peroxysomales __________________________________________________________ 40
1 L’adrénoleucodystrophie liée au chromosome X (X-ALD) ________________________________________ 40 1.1 Origine génétique de l’X-ALD et transporteurs ABCDs ________________________________________ 40 1.2 Fonctions biochimiques du transporteur ALDP _____________________________________________ 41 1.3 Formes cliniques de l’X-ALD _____________________________________________________________ 42 1.4 Caractérisation des lésions d’X-ALD ______________________________________________________ 43 1.5 Diagnostique de l’X-ALD ________________________________________________________________ 44 1.6 Traitement de l’X-ALD _________________________________________________________________ 45
2 La Pseudo-adrénoleucodystrophie néonatale P-NALD __________________________________________ 45
IV Mort cellulaire __________________________________________________________________ 47
1 Apoptose ______________________________________________________________________________ 50 2 Nécrose/Oncose ________________________________________________________________________ 52 3 Autophagie ____________________________________________________________________________ 53 4 Lysosome et mort cellulaire _______________________________________________________________ 55 5 X-ALD et mort cellulaire __________________________________________________________________ 58
V Stress oxydant __________________________________________________________________ 60
1 Espèces réactives de l’oxygène (ERO) et de l’azote (ERN) ________________________________________ 60 2 Origines cellulaires des ERO et ERN _________________________________________________________ 61 3 Défenses anti-oxydantes _________________________________________________________________ 62
3.1 Systèmes enzymatiques ________________________________________________________________ 63 3.2 Systèmes non enzymatiques ____________________________________________________________ 65
4 Effets du stress oxydant sur les molécules biologiques__________________________________________ 66
2
4.1 Effets des ERO/ERN sur les lipides ________________________________________________________ 67 4.1.1 Oxystérols et dégénérescence neuronale _____________________________________________ 69 4.1.2 Oxystérols et homéostasie du cholestérol ____________________________________________ 71
4.2 Effets des ERO/ERN sur les protéines _____________________________________________________ 73 4.3 Effets des ERO/ERN sur les glucides ______________________________________________________ 74 4.4 Effets des ERO/ERN sur l’ADN ___________________________________________________________ 74
5 Maladies associées à un stress oxydant ______________________________________________________ 75 5.1 Maladies neurodégénératives ___________________________________________________________ 75 5.2 Diabète _____________________________________________________________________________ 75 5.3 Cancer ______________________________________________________________________________ 76
6 X-ALD, AGTLC et Oxydation _______________________________________________________________ 76 7 X-ALD, AGTLC et Inflammation _____________________________________________________________ 77
VI Modèles d’études _______________________________________________________________ 78
1 In vitro ________________________________________________________________________________ 78 1.1 Vésicules lipidiques ___________________________________________________________________ 78 1.2 Lignées cellulaires ____________________________________________________________________ 78 1.3 Cultures primaires et organotypiques _____________________________________________________ 79 1.4 Utilisation des siRNA __________________________________________________________________ 79
2 In vivo ________________________________________________________________________________ 80 2.1 Souris déficientes conventionnelles ______________________________________________________ 80 2.2 Souris déficientes conditionnelles (système Cre-Lox) ________________________________________ 81
OBJECTIFS ______________________________________________________________________ 82
RESULTATS _____________________________________________________________________ 85
I Article 1 : Peroxisomal and Mitochondrial Status of Two Murine Oligodendrocytic Cell Lines (158N,
158JP): Potential Models for the Study of Peroxisomal Disorders Associated with Dysmyelination
Processes __________________________________________________________________________ 86
1 Introduction ___________________________________________________________________________ 86
II Article 2 : Pro-oxidative activities of Abcd1 or Acox1 deficiency, and of VLCFA on murine
oligodendrocytes support evidences of lipid peroxidation in X-ALD patients ____________________ 104
1 Introduction __________________________________________________________________________ 104
III Article 3 : Characterization of cell death and myelin protein expression (PLP, MBP) in wild type and
Abcd1 inactivated 158N Murine Oligodendrocytes treated with C24:0 or C26:0 _________________ 153
1 Introduction __________________________________________________________________________ 153
IV Article 4 : Impact of 7-ketocholesterol and very long chain fatty acids on oligodendrocyte lipid membrane organization: evaluation via LAURDAN and FAMIS spectral image analysis. ______ 186
1 Introduction __________________________________________________________________________ 186
DISCUSSION ___________________________________________________________________ 219
I Modèle cellulaire utilisé _________________________________________________________ 220
II Traitement avec les AGTLC _______________________________________________________ 221
III AGTLC et stress oxydant _________________________________________________________ 222
IV AGTLC et mort cellulaire _________________________________________________________ 226
V AGTLC et modulation des caractéristiques membranaires ______________________________ 229
CONCLUSION ET PERSPECTIVES ___________________________________________________ 230
ANNEXES ______________________________________________________________________ 234
REFERENCES ___________________________________________________________________ 238
3
LISTE DES FIGURES FIGURE 1 : VOIE DE MATURATION DU PEROXYSOME DEPENDANTE DU RE (KUNEAU, 2005) ................................................................... 12 FIGURE 2 : VOIE DE MATURATION DU PEROXYSOME PAR DIVISION ET FISSION (LAZAROW, 2003) ............................................................ 13 FIGURE 3 : ADRESSAGE DES PROTEINES PEROXYSOMALES MATRICIELLES OU CYTOSOLIQUE DU CYTOPLASME VERS LE PEROXYSOME (MICHELS ET
AL., 2005) ................................................................................................................................................................... 15 FIGURE 4 : METABOLISME DES DIFFERENTS SUBSTRATS DE Β-OXYDATION PEROXYSOMALE (WANDERS ET AL., 2010) .................................. 19 FIGURE 5 : ENZYMOLOGIE DE LA Β-OXYDATION PEROXYSOMALE : CHANGEMENT D’ISOFORMES ENZYMATIQUES SELON LE TYPE DE SUBSTRATS
(WANDERS & WATERHAM, 2006A). ................................................................................................................................. 21 FIGURE 6 : Β-OXYDATION PEROXYSOMALE : ACTIVATION DES AG DANS LE CYTOPLASME (A), Β-OXYDATION DANS LE PEROXYSOME (B), L’ACETYL-
COA EST TRANSFORME EN ACETYL-CARNITINE QUI EST TRANSPORTE VERS LA MITOCHONDRIE POUR ETRE Β-OXYDE (WANDERS &
WATERHAM, 2006A). .................................................................................................................................................... 22 FIGURE 7 : VOIE D’Α-OXYDATION DE L’ACIDE PHYTANIQUE ET DIFFERENTES ENZYMES IMPLIQUEES (STEINBERG ET AL., 1999) ....................... 24 FIGURE 8 : STRUCTURE D’UN PLASMALOGENE ............................................................................................................................... 26 FIGURE 9 : SYNTHESE DE DHA : DHA EST SYNTHETISE A PARTIR DE L’ACIDE Α-LINOLEIQUE PAR DEUX ETAPES DANS LE RE PUIS DANS LE
PEROXYSOME (FERDINANDUSSE ET AL., 2001). .................................................................................................................... 28 FIGURE 10 : ENZYMES PEROXYSOMALES IMPLIQUEES DANS L’HOMEOSTASIE DES ERO (SCHRADER & FAHIMI, 2006). ................................ 31 FIGURE 11 : MODELE HYPOTHETIQUE DU ROLE DES PEROXYSOMES OLIGODENDROCYTAIRES DANS LA MYELINISATION, INCLUANT LA Β-OXYDATION
ET LA DEGRADATION DES LIPIDES BIOACTIFS (KASSMAN & NAVE, 2008). .................................................................................. 36 FIGURE 12 : ECHANGE ENTRE PEROXYSOME ET MITOCHONDRIE (SCHUMANN & SUBRAMANI, 2008). ...................................................... 38 FIGURE 13 : HYPOTHESE SUR LA PHYSIOPATHOLOGIE DE L’X-ALD IMPLIQUANT LE STRESS OXYDANT COMME FACTEUR DECLENCHANT (SING &
PUJOL, 2010). .............................................................................................................................................................. 44 FIGURE 14 : DIFFERENTES VOIES CONDUISANT A LA MORT CELLULAIRE (FINK & COOKSON, 2005). .......................................................... 49 FIGURE 15 : CHRONOLOGIE ET MORPHOLOGIE DE L’APOPTOSE ......................................................................................................... 50 FIGURE 16 : MOLECULES RELARGUEES PAR LA MITOCHONDRIE AU COURS DE LA MORT CELLULAIRE PAR APOPTOSE. ..................................... 52 FIGURE 17 : CHRONOLOGIE ET MORPHOLOGIE DE LA NECROSE.......................................................................................................... 53 FIGURE 18 : DIFFERENTES FORMES ET MECANISMES D’AUTOPHAGIE (VICENCIO ET AL., 2008). ............................................................... 54 FIGURE 19 : REGULATION DE LA PERMEABILITE LYSOSOMALE ET IMPACT SUR L’ACTIVATION DE DIFFERENTES FORMES DE MORT CELLULAIRE (TANG
ET AL., 2008). ............................................................................................................................................................... 57 FIGURE 20 : FORMATION DES DIFFERENTES ERO ET ERN ................................................................................................................ 61 FIGURE 21 : ORIGINE CELLULAIRE DU STRESS OXYDANT ................................................................................................................... 62 FIGURE 22 : NIVEAX D’ACTION ET LOCALISATION DES DIFFERENTS EFFECTEURS ANTI-OXYDANTS .............................................................. 63 FIGURE 23 : ENZYMES ANTI-OXYDANTES ...................................................................................................................................... 64 FIGURE 24 : GLUTATHION PEROXYDASE ET REDUCTASE .................................................................................................................... 65 FIGURE 25 : SYNTHESE DE GLUTATHION (FORMAN ET AL., 2009) ..................................................................................................... 66 FIGURE 26 : VOIES ET PRODUITS DE PEROXYDATION LIPIDIQUE (VALKO ET AL., 2006). .......................................................................... 68 FIGURE 27 : VOIES ET PRODUITS D’OXYDATION DU CHOLESTEROL ENZYMATIQUES ET NON ENZYMATIQUES (BROWN & JESSUP, 2009) ........... 69 FIGURE 28 : DIFFERENTES VOIES D’OXYDATION DE LA GUANINE CONDUISANT A DIFFERENT PRODUITS ....................................................... 75 FIGURE 29 : DIFFERENCIATION ET MATURATION DES OLIGODENDROCYTES (OL). .................................................................................. 87 FIGURE 30 : MODELE PROPOSE POUR L’ACTIVATION DE LA MORT CELLULAIRE OLIGODENDROCYTAIRE PAR LES AGTLC (C24:0 ET C26:0). .... 228
4
LISTE DES TABLEAUX TABLEAU 1 : LES FONCTIONS METABOLIQUES DES PEROXYSOMES (SCHRADER & FAHIMI, 2008). ............................................................ 17 TABLEAU 2 : PRINCIPALES ENZYMES PEROXYSOMALES IMPLIQUEES DANS LA DEGRADATION OU LA SYNTHESE DES ERO (ANGERMULLER ET AL.,
2009; SCHRADER & FAHIMI, 2004; SCHRADER & FAHIMI, 2006).......................................................................................... 30 TABLEAU 3 : MALADIES PEROXYSOMALES AVEC DES PATHOLOGIES AU NIVEAU DU SNC (BAES & AUBOURG, 2009). .................................. 32 TABLEAU 4 : DIFFERENTES FORMES CLINIQUES D’X-ALD. ................................................................................................................ 42
5
ABREVIATIONS ∆Ψm : Potentiel transmembranaire mitochondrial °OH : Radicaux hydroxyls 4-HNE : 4-hydroxy-2-nonenal 5-LOX : 5-lipoxygenase 7KC: 7-Cétocholesterol 7-OH : 7-hydroxycholestérol 7β-OH : 7β-hydroxycholesterol 8-OHG : 8-oxoguanine ABC : ATP-binding cassette ACALD : Adolescent or Adult Cerebral ALD Acox-1 : AcylCoA oxydase-1 ADHAP-S : Alkyl-dihydroxyacetone phosphate synthase AGI : Acides gras insaturés AGPI : Acides gras polyinsaturés AGTLC : Acides Gras à Très Longue Chaine ALD : Adrenoleukodystrophy ALDP : Adrenoleukodystrophy Protein ALDRP : Adrenoleukodystrophy Related Protein AMN : Adrénomyéloneuropathie APP : Amyloïd protein precursor CAT : Carnitine Acétyl Transférase CCALD : Childhood Cerebral ALD CNPase : 2’, 3’-cyclic nucleotide 3-phosphohydrolase COT : Carnitine Octanoyl Transférase CPG : Chromatographie en Phase Gazeuse CuZnSOD : Superoxyde dismutase de cuivre-zinc DHA : Acide docosahéxaénoïque DHAP : Dihydroxyacétone phosphate DHAP-AT : Dihydroxyacétone phosphate acyltransférase DRP1 : Dynamin-Related Protein 1 ELOVL : Elongation of Very-Long Chain Fatty Acids ERN : Espèces Réactives de l’Azote ERO : Espèces Réactives de l’Oxygène Fis1: Mitochondrial fission protein GFAP : Glial Fibrillary Acidic Protein GPx : Glutathion-Peroxydase GSH : Gluthation réduit H2O2 : Peroxyde d'hydrogène
HDCA : Acide hydrodésoxycholique HODE : Hydroxyoctadecadienoic acid HPLC : Chromatographie Liquide à Haute Performance LTs : Leucotriènes LysoPC : Lysophosphatidilcholine MAPL : Mitochondria-Anchored Protein Ligase MBP : Myelin Basic Protein MDA : Malonedialdéhyde MDVs : Mitochondria-derived vesicles M-LP : Mpv17-like protein

6
MnSOD : Superoxyde dismutase de manganèse MS : Spectrométrie de masse NADPH: Nicotinamide adénine dinucléotide phosphate oxydase NO : Monoxyde d’azote NOS : NO synthase O2
.- : Anions superoxydes OL : Oligodendrocyte ONOO- : Peroxynitrites OPCs : Précurseurs d’oligodendrocytes PAF : Platelet-Activating Factor PBE : Peroxisomal Bifunctional Enzyme Pex : Peroxine PLP : Proteolipid protein P-NALD : Pseudo-adrénoleucodystrophie néonatale PPAR: Peroxisome proliferator-activated receptor pTh1 : Thiolase (41 kDa) PTS : Peroxisomal Targeting Signal RCDP2 et RCDP3 : Chondrodysplasie rhizomelique ponctuée de type 2 et 3 RE : Réticulum Endoplasmique R-OOH : Hydroperoxydes SCPx : Sterol carrier protein X siRNA : small interfering RNA SNC : Système Nerveux Central SNP: Système Nerveux Périphérique THCA : Acide trihydroxycholestanoïque TNF: Tumor necrosis factor VIH : Virus de l’immunodéficience humaine VLCS : Very Long Chain Acyl-CoA Synthetases X-ALD : Adrénoleucodystrophie liée au chromosome X

7
ETUDE BIBLIOGRAPHIQUE
ETUDE BIBLIOGRAPHIQUE Avant-Propos
8
I Avant-propos
Depuis la découverte du peroxysome en 1954 par Rhodin et la révélation de sa fonction métabolique
dans la dégradation du peroxyde d’hydrogène par la catalase mise en évidence par de Duve et
Baudhuin en 1966, la recherche sur ces organelles n’a pas cessé de révéler des rôles cruciaux du
peroxysome dans la physiologie des organismes mono et pluricellulaires. Du fait que les
peroxysomes ont des fonctions essentielles dans le métabolisme et l’homéostasie lipidique, ainsi que
dans le contrôle de l’équilibre RedOx, le(s) dysfonctionnement(s) de cet organelle peuvent entrainer
toute une série de maladies plus ou moins graves, allant d’un simple dysfonctionnement métabolique
jusqu’à une dégénérescence du système nerveux central (SNC) ou périphérique (SNP).
Les travaux les plus récents ont mis en évidence un rôle essentiel du peroxysome pour le bon
fonctionnement du SNC.
Ainsi, les peroxysomes des cellules productrices de myéline dans le SNC (oligodendrocytes), jouent
des rôles déterminants dans la myélinisation, ainsi que dans le métabolisme lipidique et le maintien
de l’équilibre oxydatif et inflammatoire du SNC.
Parmi les maladies liées à des dysfonctionnements du peroxysome, l’X-ALD est la maladie la plus
fréquente. Cette maladie génétique sous sa forme la plus sévère fait intervenir des phénomènes de
démyélinisation au niveau du SNC associés à des problèmes inflammatoires et oxydatifs. Au niveau
plasmatique et tissulaire, cette maladie est caractérisée par une accumulation d’Acides Gras à Très
Longue Chaîne (AGTLC) en particulier C26:0 et C24:0. La séquence d’évènements conduisant au
phénotype de l’X-ALD est associée à des mutations du gène ABCD1 localisé sur le chromosome X et
à un processus de démyélinisation centrale et / ou périphérique encore mal connu. Les relations entre
l’accumulation d’AGTLC et la physiopathologie de l’X-ALD restent obscures.
La pseudo-adrénoleucodystrophie néonatale (P-NALD) est une maladie peroxysomale beaucoup plus
rare que l’X-ALD, caractérisée elle aussi par une accumulation plasmatique et tissulaire d’AGTLC.
Elle se distingue de l’X-ALD par une déficience en acide docosahexaénoique (DHA) nécessaire au
bon fonctionnement du SNC. Cliniquement, elle est caractérisée par une neurodégénérescence
précoce, une hypotonie et des désordres moteurs. La déficience en Acyl-CoA oxydase-1 (ACOX-1),
qui catalyse la première étape de la béta-oxydation peroxysomale, résulte d’anomalies génétiques
localisées sur le chromosome 17 qui sont à l’origine de cette maladie.

ETUDE BIBLIOGRAPHIQUE Avant-Propos
9
Dans le contexte de l’X-ALD et la P-NALD, l’objectif de notre travail a consister à mieux
comprendre la physiopathologie de l’X-ALD et de la P-NALD, notamment les liens mécanistiques
pouvant exister entre stress oxydant, mort cellulaire et expression des protéines majeures de la
myéline (PLP, MBP) dans des oligodendrocytes en cherchant à préciser la part prise par les protéines
peroxysomales ABCD1 et ACOX1.
Dans ce travail, nous avons d’abord caractérisé la lignée d’oligodendrocytes murins 158N. Par la
suite, la capacité des AGTLC (C26:0, C24:0) à induire un stress oxydant et à activer la mort des
oligodendrocytes a été établie sur les oligodendrocytes murins 158N sauvages ou déficients en
Abcd1 et Acox1 obtenus par transfection à l’aide de siRNAs. Les résultats in vitro ont conduit à
utiliser des plasmas de malades avec différentes formes d’X-ALD (forme inflammatoire cérébrale et
démyélinisante (Childhood Cerebral ALD : CCALD); forme non inflammatoire cérébrale
démyélinisante (Adolescent or Adult Cerebral ALD : ACALD); forme démyélinisante périphérique
ou adrénomyéloneuropathie (AMN); maladie d’Addison affectant les glandes corticosurrénales). Sur
ces échantillons plasmatiques, des marqueurs du stress oxydant ont été recherchés (7-
hydroxycholestérols et HODEs) pour distinguer les différents formes de l’X-ALD afin
ultérieurement de pouvoir suivre l’évolution de cette maladie et d’adapter aux patients les traitements
les mieux appropriés.
ETUDE BIBLIOGRAPHIQUE Le Peroxysome
10
II Le Peroxysome
1 Généralités
Par définition « peroxysome » est un terme issu du latin (per : grande quantité) et du grec (oxus :
pointu et sôma : corps). « Peroxysome » signifie donc corps de peroxyde. Il s'agit de particules
présentes à l'intérieur du cytoplasme de toutes les cellules eucaryotes, à l’exception des érythrocytes.
Le peroxysome a été décrit pour la première fois en 1954 par J. Rhodin (Rhodin, 1954). En 1966, la
première fonction physiologique a été montrée par de Duve (de Duve & Baudhuin, 1966). La taille
du peroxysome, le nombre, la composition protéique et le rôle biochimique dépendent du type
d’organisme ou des cellules et des conditions environnementales (stress, besoin métabolique…)
(Titorenko & Rachubinski 2001; Gunkel et al., 1999).
2 Structure des peroxysomes
Les peroxysomes sont constitués d’une matrice protéique dense délimitée par une membrane simple
(0,1 – 1µm de diamètre) de type bicouche lipidique qui les isole du cytosol. Cette structure renferme
un corps cristallin appelé noyau cristalloïde ou nucloïde. A la différence de la mitochondrie, ils ne
possèdent pas d’acides nucléiques (Schrader & Fahimi, 2008). Entre espèces (animaux, plantes,
levures…..), certaines caractéristiques des peroxysomes sont conservées, notamment certaines
enzymes ou systèmes enzymatiques concernant les espèces réactives de l'oxygène (Michels et al.,
2005).
3 Biogenèse des peroxysomes
La biogenèse des peroxysomes se subdivise en 3 parties : (1) la formation de la membrane
peroxysomale, (2) l'import des enzymes peroxysomales matricielles et (3) la prolifération. Une
famille de protéines est en particulier impliquée dans ces processus, appelée les peroxines, codées
par des gènes Pex (Girzalsky et al., 2010); 32 peroxines différentes sont connues, conservées de la
levure à l'Homme (Platta & Erdmann, 2007).
Les premières observations en microscopie électronique montraient une proximité des peroxysomes
et du réticulum endoplasmique (RE), avec parfois une continuité entre les deux structures. Ceci a
laissé supposer que les peroxysomes étaient issus du bourgeonnement du RE (Novikoff & shin,
1964; Titorenko & Rachubinski, 1998; Mullen et al., 2001). Hoepfner et ses collègues ont transformé
des levures mutantes en Pex3 et Pex19 avec deux plasmides contenant les gènes codant pour Pex3p
ETUDE BIBLIOGRAPHIQUE Le Peroxysome
11
et Pex19p (gènes de la biogenèse du peroxysome (Eckert & Erdmann, 2003; Purdue & Lazarow,
2001)) fusionnés avec un gène rapporteur : le YFP (yellow fluorescent protein). L’utilisation de la
microscopie à fluorescence en temps réel a permis de montrer que Pex3 et Pex19 se concentrent à la
périphérie du RE et recrutent par la suite Pex19p afin de produire par bourgeonnement une structure
capable d’importer d’autres protéines membranaires peroxysomales et donnent lieu à un pré-
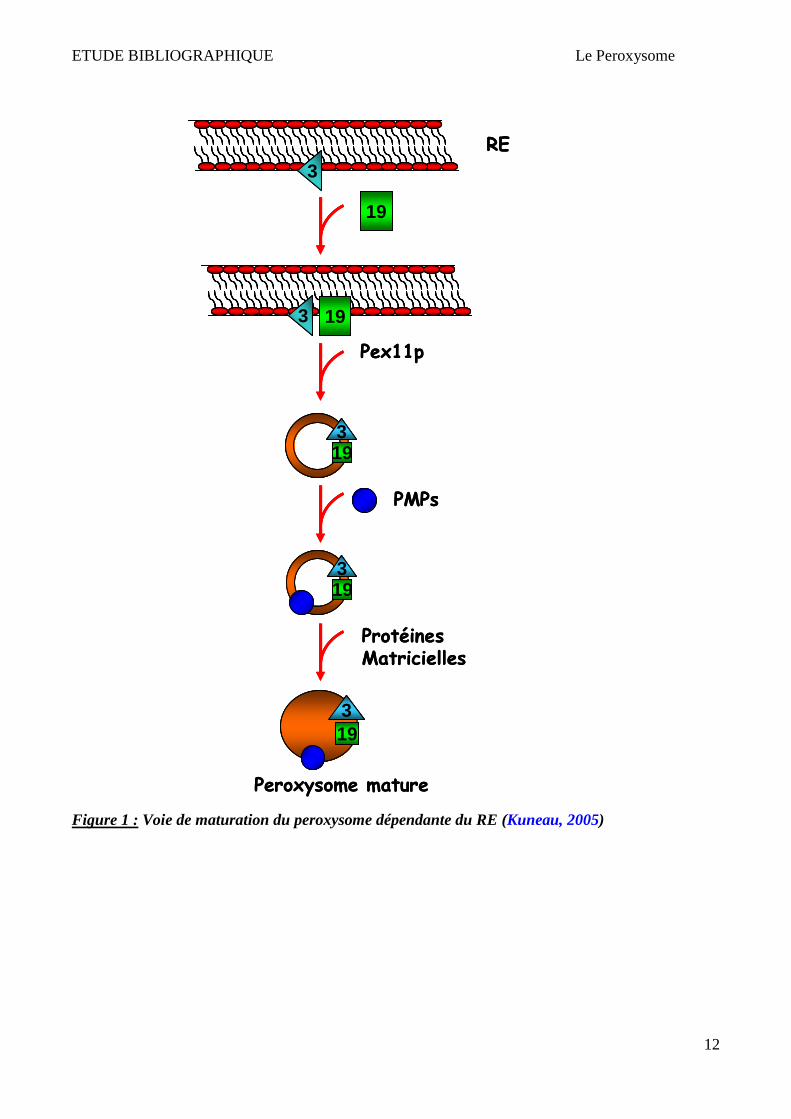
peroxysome (Hoepfner et al. 2005). Cette structure pré-peroxysome intègre par la suite les protéines
membranaires peroxysomales qui sont dirigées vers le peroxysome grâce à des signaux d’adressage
(mPTS) (Figure 1).
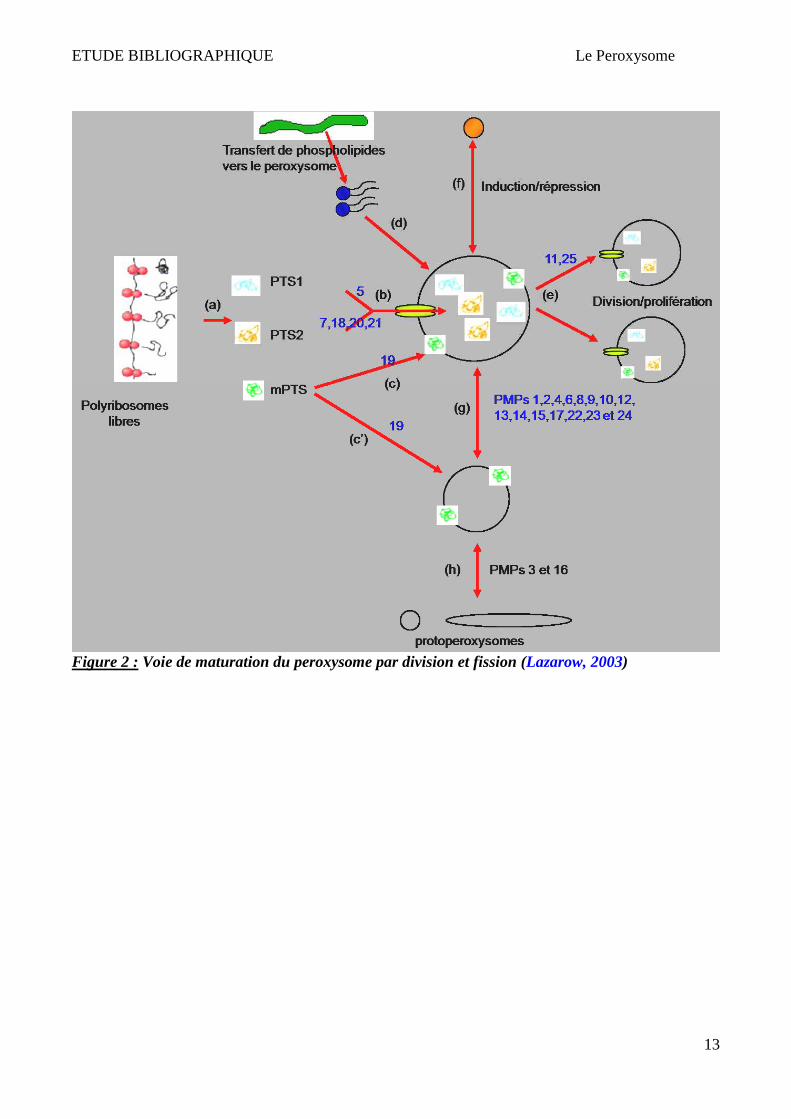
Par ailleurs, Lazarow et Fukui proposèrent le modèle de croissance et division, dans lequel les
peroxysomes bourgeonnent à partir de peroxysomes pré-existants. Des peroxysomes « primitifs »
seraient ainsi la cible de nouvelles protéines peroxysomales synthétisées lors de la croissance
cellulaire. Ces organites augmentent alors de taille par importation de protéines et se multiplient par
division. Il semblerait qu'après cette fission, l'organite mature perde sa capacité à incorporer de
nouvelles protéines (Lazarow & Fujiki, 1985; Purdue & Lazarow, 2001; Van der Klei & Veenhuis,
2002; Lazarow, 2003). Dans cette hypothèse, le réticulum endoplasmique est supposé fournir les
phospholipides nécessaires à la formation des nouveaux peroxysomes via des vésicules spécialisées
(Lazarow, 2003) (Figure 2).
Deux revues (Hoepfner et al., 2005; Lazarow, 2003) montrent que les deux théories de la biogenèse
des peroxysomes sont concevables. Il reste à élucider si les deux mécanismes de biogenèse ont lieu
en même temps.
ETUDE BIBLIOGRAPHIQUE Le Peroxysome
12
Figure 1 : Voie de maturation du peroxysome dépendante du RE (Kuneau, 2005)
19
RE
3
3 19
193
193
193
Pex11p
PMPs
ProtéinesMatricielles
Peroxysome mature
19
RE
33
3 193 19
193193
193193
193193
Pex11p
PMPs
ProtéinesMatricielles
Peroxysome mature
ETUDE BIBLIOGRAPHIQUE Le Peroxysome
13
Figure 2 : Voie de maturation du peroxysome par division et fission (Lazarow, 2003)
ETUDE BIBLIOGRAPHIQUE Le Peroxysome
14
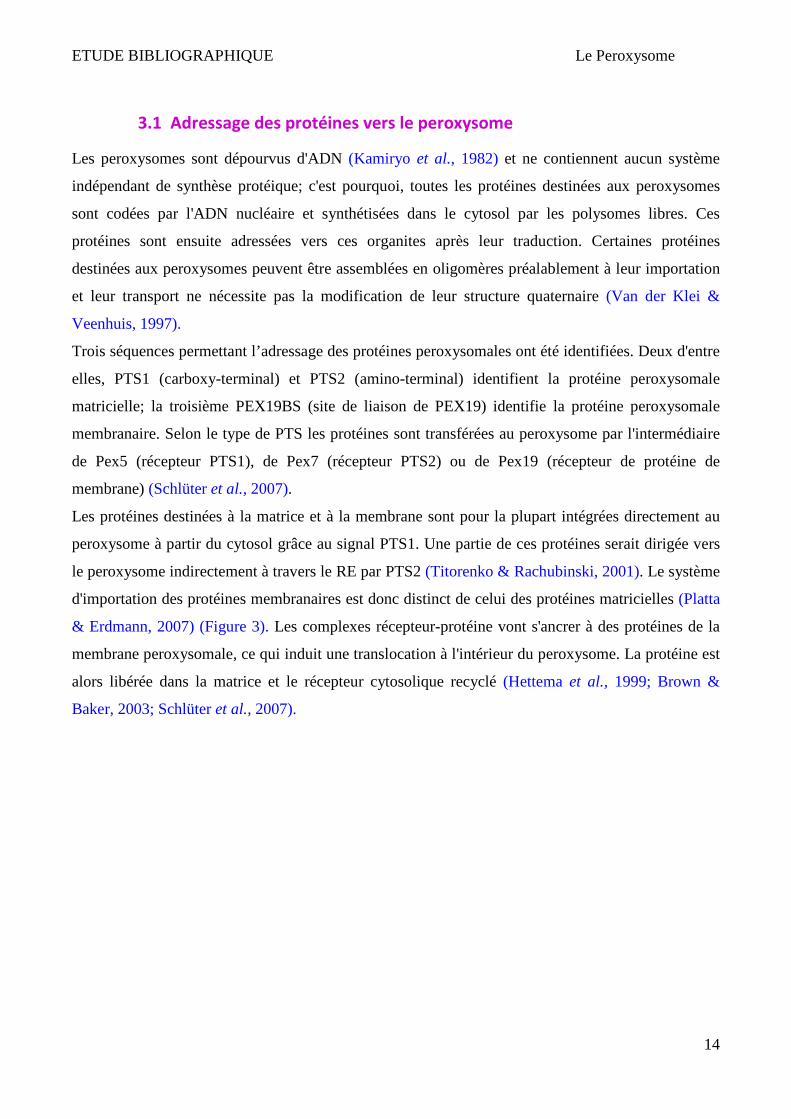
3.1 Adressage des protéines vers le peroxysome
Les peroxysomes sont dépourvus d'ADN (Kamiryo et al., 1982) et ne contiennent aucun système
indépendant de synthèse protéique; c'est pourquoi, toutes les protéines destinées aux peroxysomes
sont codées par l'ADN nucléaire et synthétisées dans le cytosol par les polysomes libres. Ces
protéines sont ensuite adressées vers ces organites après leur traduction. Certaines protéines
destinées aux peroxysomes peuvent être assemblées en oligomères préalablement à leur importation
et leur transport ne nécessite pas la modification de leur structure quaternaire (Van der Klei &
Veenhuis, 1997).
Trois séquences permettant l’adressage des protéines peroxysomales ont été identifiées. Deux d'entre
elles, PTS1 (carboxy-terminal) et PTS2 (amino-terminal) identifient la protéine peroxysomale
matricielle; la troisième PEX19BS (site de liaison de PEX19) identifie la protéine peroxysomale
membranaire. Selon le type de PTS les protéines sont transférées au peroxysome par l'intermédiaire
de Pex5 (récepteur PTS1), de Pex7 (récepteur PTS2) ou de Pex19 (récepteur de protéine de
membrane) (Schlüter et al., 2007).
Les protéines destinées à la matrice et à la membrane sont pour la plupart intégrées directement au
peroxysome à partir du cytosol grâce au signal PTS1. Une partie de ces protéines serait dirigée vers
le peroxysome indirectement à travers le RE par PTS2 (Titorenko & Rachubinski, 2001). Le système
d'importation des protéines membranaires est donc distinct de celui des protéines matricielles (Platta
& Erdmann, 2007) (Figure 3). Les complexes récepteur-protéine vont s'ancrer à des protéines de la
membrane peroxysomale, ce qui induit une translocation à l'intérieur du peroxysome. La protéine est
alors libérée dans la matrice et le récepteur cytosolique recyclé (Hettema et al., 1999; Brown &
Baker, 2003; Schlüter et al., 2007).

ETUDE BIBLIOGRAPHIQUE Le Peroxysome
15
Figure 3 : Adressage des protéines peroxysomales matricielles ou cytosolique du cytoplasme vers le peroxysome (Michels et al., 2005)
PEX5PEX7
PEX19
PEX5
PE
X13PE
X14
PEX
14PEX17
Pex8
PE
X12
PE
X10
PE
X2
PE
X12
/PE
X26
PEX6
PEX1
PEX4
PE
X22 PE
X3
PE
X16
PMP
PTS1
PTS2
PEX7
Peroxysome
Cytoplasme
PMP
B- Insertion des protéinesmembranaires
1 - Reconnaissance
2 - Formation de complex
3 - Insertion de PMP
A- Importation des protéinesmatricielles
PTS1PTS2
PEX18/PEX21
1 – Interaction Protéine-Cargo
2 - Transport
4 - Translocation
3 – Interaction avec le complexe recruteur
5 - Recyclagedes recepteurs
PEX5PEX5PEX7PEX7
PEX19PEX19
PEX5PEX5
PE
X13PE
X14
PEX
14PEX17
Pex8
PE
X12
PE
X10
PE
X2
PE
X12
/PE
X26
PEX6
PEX1
PEX4
PE
X22 PE
X3
PE
X16
PMP
PTS1PTS1
PTS2PTS2
PEX7PEX7
Peroxysome
Cytoplasme
PMP
B- Insertion des protéinesmembranaires
1 - Reconnaissance
2 - Formation de complex
3 - Insertion de PMP
A- Importation des protéinesmatricielles
PTS1PTS1PTS2PTS2
PEX18/PEX21
1 – Interaction Protéine-Cargo
2 - Transport
4 - Translocation
3 – Interaction avec le complexe recruteur
5 - Recyclagedes recepteurs

ETUDE BIBLIOGRAPHIQUE Le Peroxysome
16
3.2 Prolifération peroxysomale
Les peroxysomes sont dynamiques (modification de la taille et de la forme) et possèdent la capacité
de proliférer en réponse à une stimulation intra ou extracellulaire (Lazarow, 2003). Il existe trois
mécanismes qui peuvent réguler le dynamisme des peroxysomes :
- (1) promotion de la division par des mécanismes qui impliquent Pex11 et/ou des « protéines
dynamine-like » (Schrader et al., 1998; Koch et al., 2003). Ces mécanismes sont induits
généralement par des lipides, via l’activation de PPARα chez les cellules humaines par exemple
(Gurvitz & Rottensteiner, 2006).
- (2) inhibition de la division via la complexation entre ACOX et Pex16p chez les levures Yarrowia
lipolytica (Guo et al., 2003).
- (3) contrôle métabolique du dynamisme peroxysomale (Chang et al., 1999).
4 Rôles des peroxysomes
Les peroxysomes possèdent environ 50 activités enzymatiques différentes d’où leurs rôles
métaboliques essentiels dans le développement harmonieux des organismes (Wanders & Waterham,
2006a), ces rôles pouvant changer d’un organisme à un autre (homme, plantes, levures, bactéries...)
(Tableau 1).

ETUDE BIBLIOGRAPHIQUE Le Peroxysome
17
Rôles Levures Fungi plantes Mammifères
(Homme)
Métabolisme des peroxydes (Catalase, SOD),
Métabolisme de ROS/RNS Oui Oui Oui Oui
Biosynthèse des lipides (éthers de
phospholipides/plasmalogène; acides biliaires,
cholestérol, élongation des acides gras)
Non Non Non Oui
Béta-oxydation (AGTLC…….) Oui Oui Oui Oui
Alpha-oxydation (acide phytanique) Non Non Non Oui
Régulation du rapport acyl-CoA/CoA Oui Oui Oui Oui
Métabolisme des acides aminés (polyamines..) Oui Oui Oui Oui
Catabolisme des purines Non Non Oui Oui
Métabolisme du nicotinate et nicotinamide ? ? ? Oui
Métabolisme du rétinoïde ? ? ? Oui
Biosynthèse des antibiotiques Non Oui Non Non
Synthèse de glycérol ? ? Oui ?
Métabolisme de glyoxylate et dicarboxylate Oui Oui Oui Non
Tableau 1 : Les fonctions métaboliques des peroxysomes (Schrader & Fahimi, 2008).
4.1 Fonctions peroxysomales en relation avec le métabolisme des lipides
4.1.1 Béta-oxydation peroxysomale
La β-oxydation est la voie de dégradation principale et universelle des acides gras chez les
mammifères, les levures, les bactéries ou encore les plantes. Elle a lieu dans les mitochondries et les
peroxysomes (en fonction du nombre de carbones des acides gras) chez les eucaryotes supérieurs et
seulement dans les peroxysomes chez les plantes et les levures. Chez les eucaryotes, la β-oxydation
peroxysomale des acides gras à très longue chaîne (AGTLC) est incomplète, la phase terminale de ce
processus est assurée par la mitochondrie. Le mécanisme est identique dans ces deux organites et
implique une série de quatre réactions successives qui sont :
(1) déshydrogénation
(2) hydratation
(3) déshydrogénation
(4) clivage thiolytique

ETUDE BIBLIOGRAPHIQUE Le Peroxysome
18
A la fin de chaque cycle de β-oxydation, les acides gras sont raccourcis de deux atomes de carbones
qui sont libérés sous la forme d’Acétyl-CoA.
Plusieurs types de substrats sont béta-oxydés dans le peroxysome :
a) AGTLC (C ≥ 22 carbones), notamment l’acide hexacosanoïque ou C26:0 : ces acides gras ont
des origines exogènes (sources alimentaires) ou endogènes (élongation à partir d’autres
acides gras (voie majeure chez les mammifères))
b) Acide pristanique « 2,6,10,14-tetramethylpentadecanoic acid » : cet acide gras branché a
deux origines : (1) exogène (alimentaire); (2) produit de l’α-oxydation de l’acide phytanique
c) Les acides di- et tri-hydroxycholestéanoïques (DHCA et THCA) : ce sont des intermédiaires
dans la synthèse des acides biliaires
d) L’acide tétracosahexaénoïque (C24:6ω-3) est béta-oxydé dans le peroxysome afin de
produire l’acide docosahexaénoïque : DHA ou C22:6ω-3
e) L’acide dicarboxylique
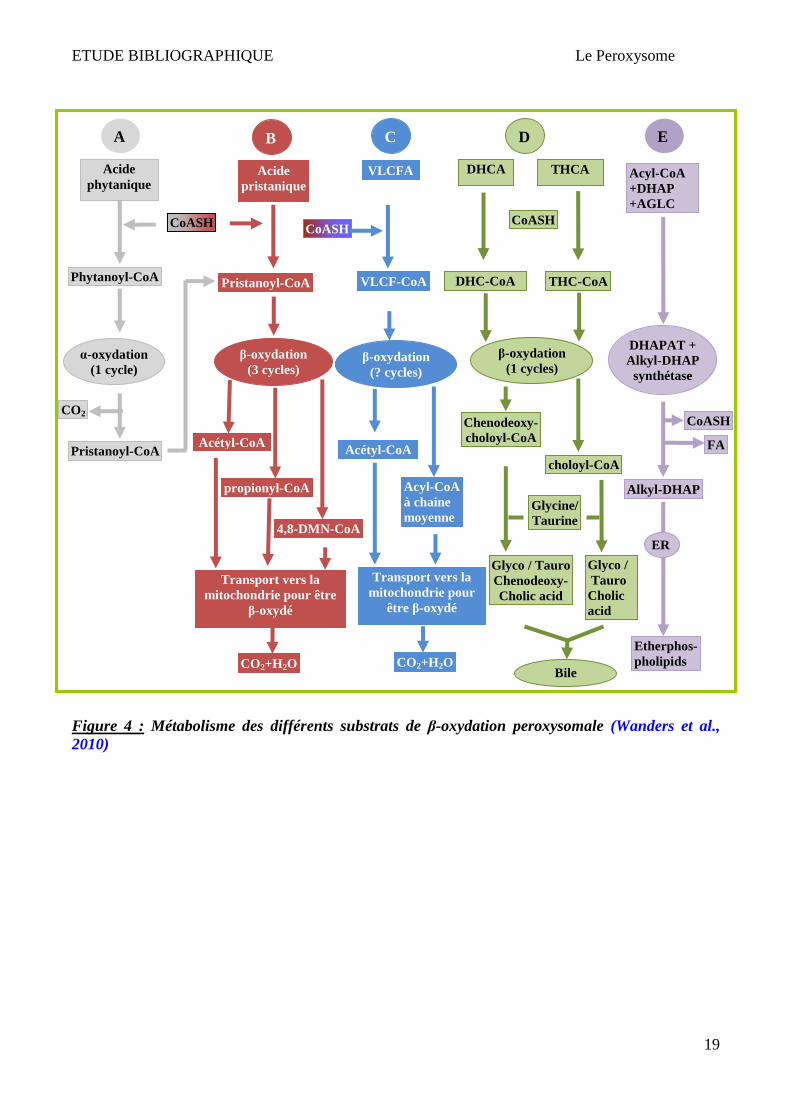
La β-oxydation des différents substrats dans les peroxysomes est présentée dans la Figure 4. L’acide
pristanique exogène ou endogène subit 3 cycles de β-oxydation pour donner lieu à 3 produits
(propionyl-CoA (2×), Acetyl-CoA et 4,8-dimethylnonanoyl-CoA) qui seront transportés dans la
mitochondrie pour une oxydation complète (CO2 et H2O) (Figure 4 A-B). Les nombres de cycles de
la β-oxydation d’AGTLC (notamment C24:0 et C26:0) sont indéterminés (Figure 4 C). Les
intermédiaires des acides biliaires (DHCA et THCA) sont confrontés à un seul cycle de β-oxydation
peroxysomale pour donner lieu à 2 produits finaux : choloyl-CoA et chenodeoxycholoyl-CoA
respectivement (Figure 4 D). Ces 2 produits sont par la suite transportés dans le cytosol pour
terminer la synthèse d’acide biliaire. Certaines étapes de la biosynthèse d’éther de phospholipides ont
lieu uniquement dans les peroxysomes (Figure 4 E). Ces substrats doivent être activés avant leur
entrée dans le peroxysome pour être β-oxydés via l’ intervention d’enzymes appelées "Very Long
Chain acyl-CoA Synthetases" ou VLCS (Steinberg et al., 1999; Watkins & Seifert, 2000; Jia et al.,
2004), et interagissent avec les transporteurs ABC (ATP Binding Cassette) afin de permettre l'entrée
des AGTLC dans le peroxysome (Makkar et al., 2006).
ETUDE BIBLIOGRAPHIQUE Le Peroxysome
19
Figure 4 : Métabolisme des différents substrats de β-oxydation peroxysomale (Wanders et al., 2010)
C
VLCFA
CoASH
VLCF-CoA
β-oxydation (? cycles)
Acétyl-CoA
Acyl-CoA à chaine moyenne
Transport vers la mitochondrie pour
être β-oxydé
CO2+H2O
Acide phytanique
CO2
A
CoASH
Phytanoyl-CoA
α-oxydation (1 cycle)
Pristanoyl-CoA Acétyl -CoA
propionyl-CoA
4,8-DMN-CoA
Transport vers la mitochondrie pour être
β-oxydé
CO2+H2O
B
Acide pristanique
Pristanoyl-CoA
β-oxydation (3 cycles)
β-oxydation (1 cycles)
Chenodeoxy- choloyl-CoA
choloyl-CoA
D
DHCA THCA
CoASH
DHC-CoA THC-CoA
Glycine/ Taurine
Glyco / Tauro Cholic acid
Glyco / Tauro Chenodeoxy- Cholic acid
Bile
E
Acyl-CoA +DHAP +AGLC
DHAPAT + Alkyl-DHAP synthétase
CoASH
FA
Alkyl-DHAP
ER
Etherphos- pholipids

ETUDE BIBLIOGRAPHIQUE Le Peroxysome
20
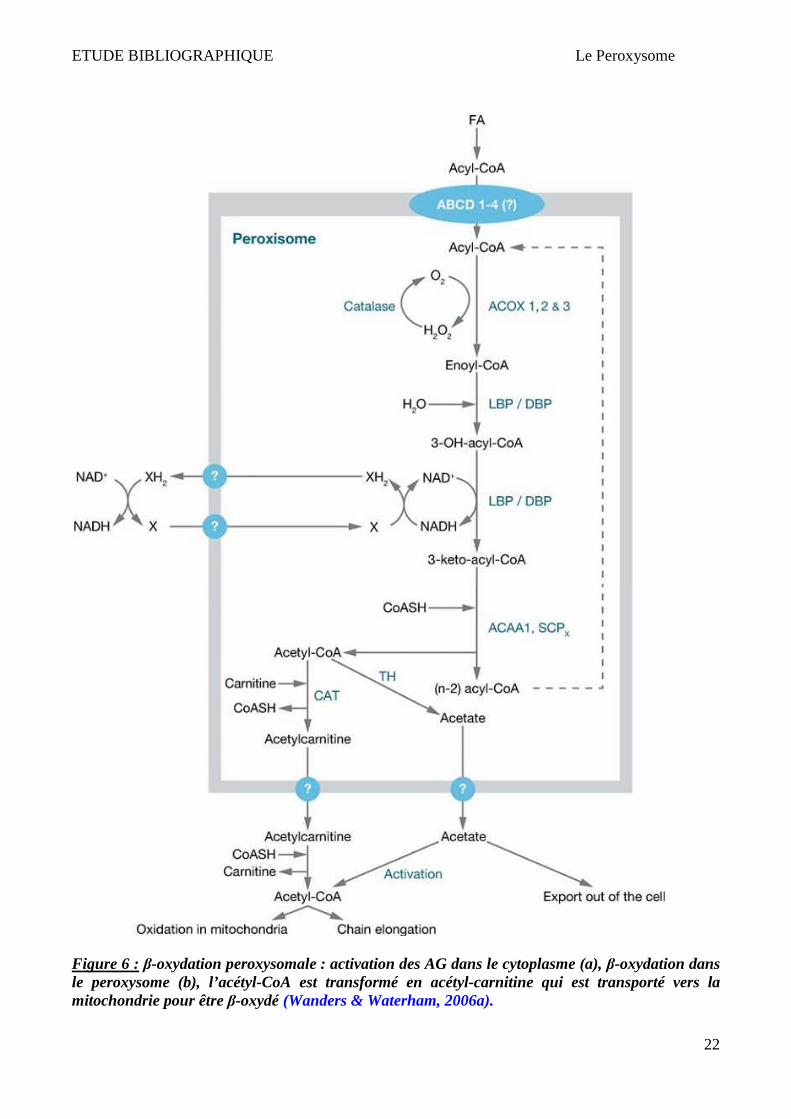
Les AGTLC doivent d’abord être convertis en dérivés CoA (par l’AGTLC-CoA Synthétase) dans le
cytosol, puis transportés dans les peroxysomes pour y être β-oxydés (Watkins, 1997) (Figure 6). Il
est possible que les protéines ALDs importent les AGTLCs ou leurs dérivés CoA dans les
peroxysomes (Aubourg, 2007). Les ALDs sont des « hémi-transporteurs » peroxysomaux de type
ABC (Visser et al., 2007). Ces hémi-transporteurs ont la capacité de s’homodimériser ou de
s’hétérodimériser avec un autre transporteur de la famille ABCD (Smith et al., 1999; Tanaka et al.,
2002; Guimarães et al., 2004). L'homo ou l'hétérodimérisation entre les différents transporteurs
ABCD serait à l'origine des spécificités de substrats et donc du type d'acides gras transportés.
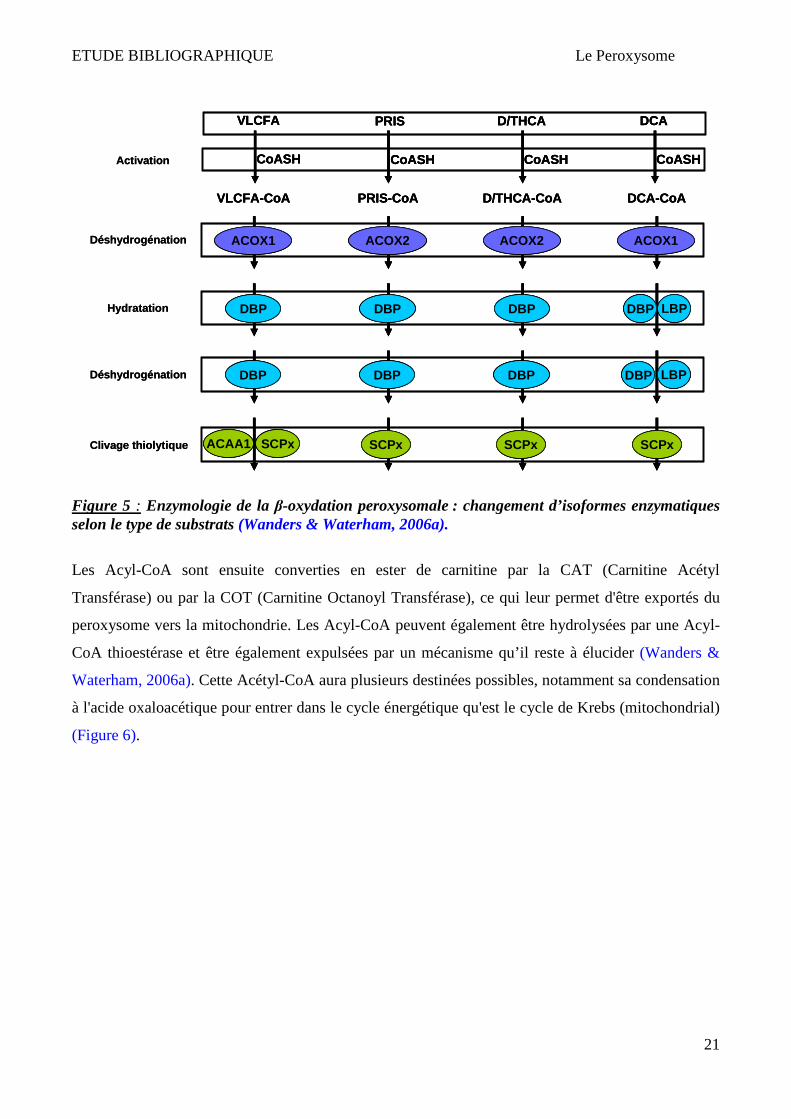
Un cycle de β-oxydation peroxysomale fait intervenir 3 enzymes différentes (Figure 5). L'Acyl-CoA
oxydase est la première de ces enzymes. Elle est considérée comme étant l'enzyme régulant le flux
"d'entrée" des Acyl-CoA dans la voie de dégradation. Elle catalyse la réaction qui transforme l'Acyl-
CoA en 2-trans-énoyl-CoA. Chez l'Homme, 2 Acyl-CoA oxydases ont été identifiées dans le peroxy-
some : la palmitoyl-CoA oxydase pour les AGTLC (ACOX1) et la pristanoyl-CoA oxydase
(ACOX2) qui ne se retrouve que dans le foie et est spécifique des précurseurs des acides biliaires et
des acides gras branchés (Baumgart et al., 1996). Deux isoformes de l'ACOX1, issues d'un épissage
alternatif, sont également présentes : ACOX1a et ACOX1b. La spécificité de substrats de l'ACOX1a
concernerait les AG à chaîne moyenne et longue chaîne alors que l'ACOX1b prendrait en charge les
AGTLC (Oaxaca-Castillo et al., 2007). Les deux étapes suivantes de la β-oxydation des AG sont
catalysées par une seule enzyme dite bifonctionnelle ou multifonctionnelle : (PBE : "Peroxisomal
Bifunctional Enzyme"). Celle-ci possède à la fois une activité énoyl-CoA hydratase et une activité 3-
hydroxyacyl-CoA déshydrogènase. La première activité permet l'hydratation du 2-trans-énoyl-CoA
en D-3-hydroxyacyl-CoA, puis la seconde réaction est une réaction d'oxydo-réduction permettant la
conversion du D-3-hydroxyacyl-CoA en 3-cétoacyl-CoA. Chez l'Homme, deux protéines bifonction-
nelles distinctes sont présentes : la L-PBE et la D-PBE. Elles ont une petite séquence homologue
mais sont structurellement différentes. Chacune des isoformes deshydrogène les 2 énantiomères L et
D du 3-hydroxyacyl-CoA. La dernière étape de la β-oxydation peroxysomale consiste à cliver le 3-
cétoacyl-CoA pour libérer une molécule d'Acétyl-CoA et un acide gras raccourci de deux atomes de
carbone. Cette étape est catalysée par les thiolases peroxysomales. Chez l'Homme, 2 enzymes ont
des activités thiolases : la pTh1 et la SCPx essentielle à l'oxydation de l'acide pristanique, de l'acide
hydrodésoxycholique (HDCA) et de l'acide tri-hydroxycholestéanoïque (THCA). Ces 4 étapes se
répètent jusqu'à obtention d'un Acyl-CoA à chaîne moyenne (Hashimoto et al., 2001) (Figure 6).
ETUDE BIBLIOGRAPHIQUE Le Peroxysome
21
Figure 5 : Enzymologie de la β-oxydation peroxysomale : changement d’isoformes enzymatiques selon le type de substrats (Wanders & Waterham, 2006a).
Les Acyl-CoA sont ensuite converties en ester de carnitine par la CAT (Carnitine Acétyl
Transférase) ou par la COT (Carnitine Octanoyl Transférase), ce qui leur permet d'être exportés du
peroxysome vers la mitochondrie. Les Acyl-CoA peuvent également être hydrolysées par une Acyl-
CoA thioestérase et être également expulsées par un mécanisme qu’il reste à élucider (Wanders &
Waterham, 2006a). Cette Acétyl-CoA aura plusieurs destinées possibles, notamment sa condensation
à l'acide oxaloacétique pour entrer dans le cycle énergétique qu'est le cycle de Krebs (mitochondrial)
(Figure 6).
ACOX1
DBP
DBP DBP
DBP LBP
LBP
ACAA1 SCPx
VLCFA-CoA PRIS-CoA D/THCA-CoA DCA-CoA
CoASH CoASH CoASH CoASH
ACOX2
DBP
DBP
SCPx
ACOX2
DBP
DBP
SCPx
ACOX1
SCPx
VLCFA PRIS D/THCA DCA
Activation
Déshydrogénation
Hydratation
Déshydrogénation
Clivage thiolytique
ACOX1
DBP
DBP DBP
DBP LBP
LBP
ACAA1 SCPx
VLCFA-CoA PRIS-CoA D/THCA-CoA DCA-CoA
CoASH CoASH CoASH CoASH
ACOX2
DBP
DBP
SCPx
ACOX2
DBP
DBP
SCPx
ACOX1
SCPx
VLCFA PRIS D/THCA DCA
ACOX1
DBP
DBP DBP
DBP LBP
LBP
ACAA1 SCPx
VLCFA-CoA PRIS-CoA D/THCA-CoA DCA-CoA
CoASH CoASH CoASH CoASH
ACOX2
DBP
DBP
SCPx
ACOX2
DBP
DBP
SCPx
ACOX1
SCPx
VLCFA PRIS D/THCA DCA
Activation
Déshydrogénation
Hydratation
Déshydrogénation
Clivage thiolytique
ETUDE BIBLIOGRAPHIQUE Le Peroxysome
22
Figure 6 : β-oxydation peroxysomale : activation des AG dans le cytoplasme (a), β-oxydation dans le peroxysome (b), l’acétyl-CoA est transformé en acétyl-carnitine qui est transporté vers la mitochondrie pour être β-oxydé (Wanders & Waterham, 2006a).

ETUDE BIBLIOGRAPHIQUE Le Peroxysome
23
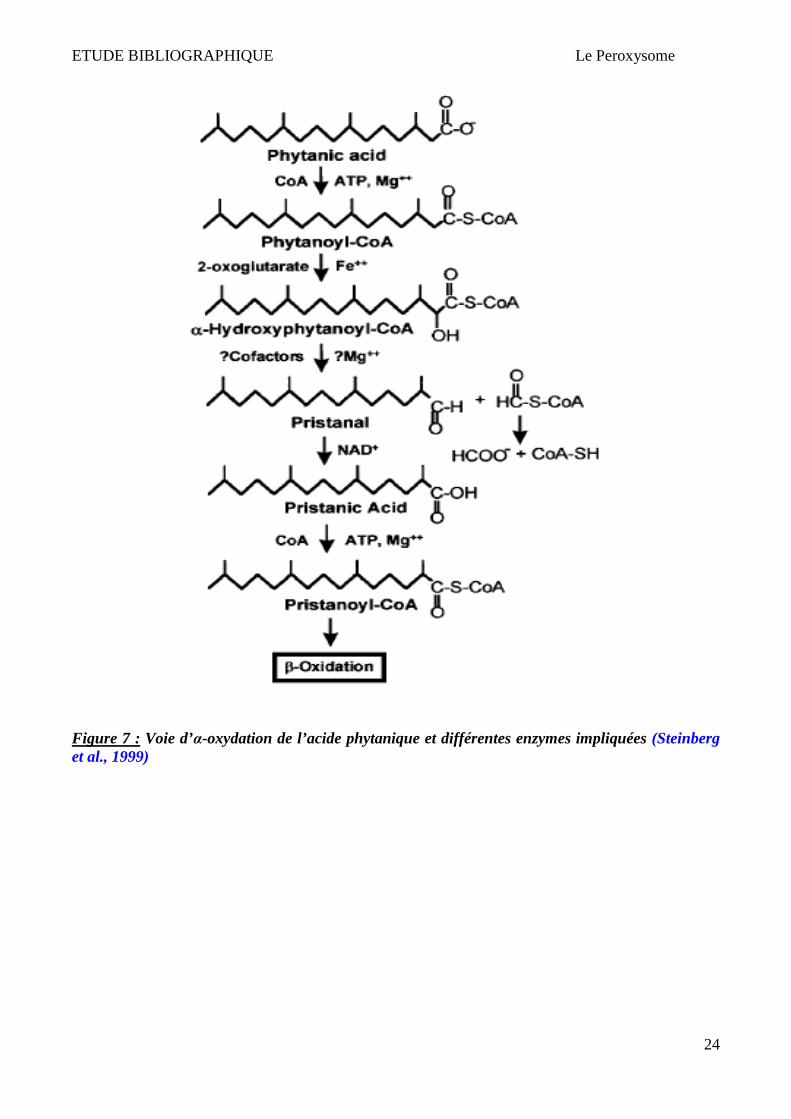
4.1.2 Alpha-oxydation peroxysomale
Les acides gras qui ont un groupement méthyle sur le carbone numéro 3 (ex : acide phytanique) ne
peuvent pas être dégradés par la voie de β-oxydation. En effet, le groupe méthyle en position 3
bloque la béta-oxydation. Ces acides gras sont pris en charge par une autre voie d’oxydation
exclusivement peroxysomale : l’α-oxydation (Figure 7). L’α-oxydation implique une
décarboxylation oxidative d’acide gras méthylé sur le carbone 3 afin de produire un acide gras (n-1)
dont le groupe méthyle est sur le carbone 2 (Wanders & Waterham, 2006a ; Wanders & Waterham,
2006b). L’activation du substrat (forme CoA-ester) a lieu soit dans le cytoplasme grâce à « Long-
Chain Acyl-CoA synthetase » qui se situe du côté cytosolique du peroxysome (Watkins et al., 1996 ;
Miyazawa et al., 1985), soit dans le peroxysome grâce à « Very Long-Chain Acyl-CoA synthetase »
(protéine periphérique peroxysomale contenant un PTS2) (Steinberg et al., 1999). L’α-oxydation
nécessite l’intervention de 3 enzymes différentes : (1) phytanoyl-CoA 2-hydroxylase dont le rôle est
de convertir le phytanoyl-CoA en 2-Hydroxyphytanoyl-CoA; (2) 2-Hydroxyphytanoyl-CoA lyase
dont le rôle est de transformer 2-Hydroxyphytanoyl-CoA en pristanal et formyl-CoA; (3) Pristanal-
dehydrogenase dont le rôle est de transformer le pristanal en acide pristanique. L’acide pristanique
ainsi obtenu sera activé et métabolisé par la voie de β-oxydation peroxysomale (Wanders &
Waterham HR, 2006a; Wanders & Waterham HR, 2006b).
ETUDE BIBLIOGRAPHIQUE Le Peroxysome
24
Figure 7 : Voie d’α-oxydation de l’acide phytanique et différentes enzymes impliquées (Steinberg et al., 1999)

ETUDE BIBLIOGRAPHIQUE Le Peroxysome
25
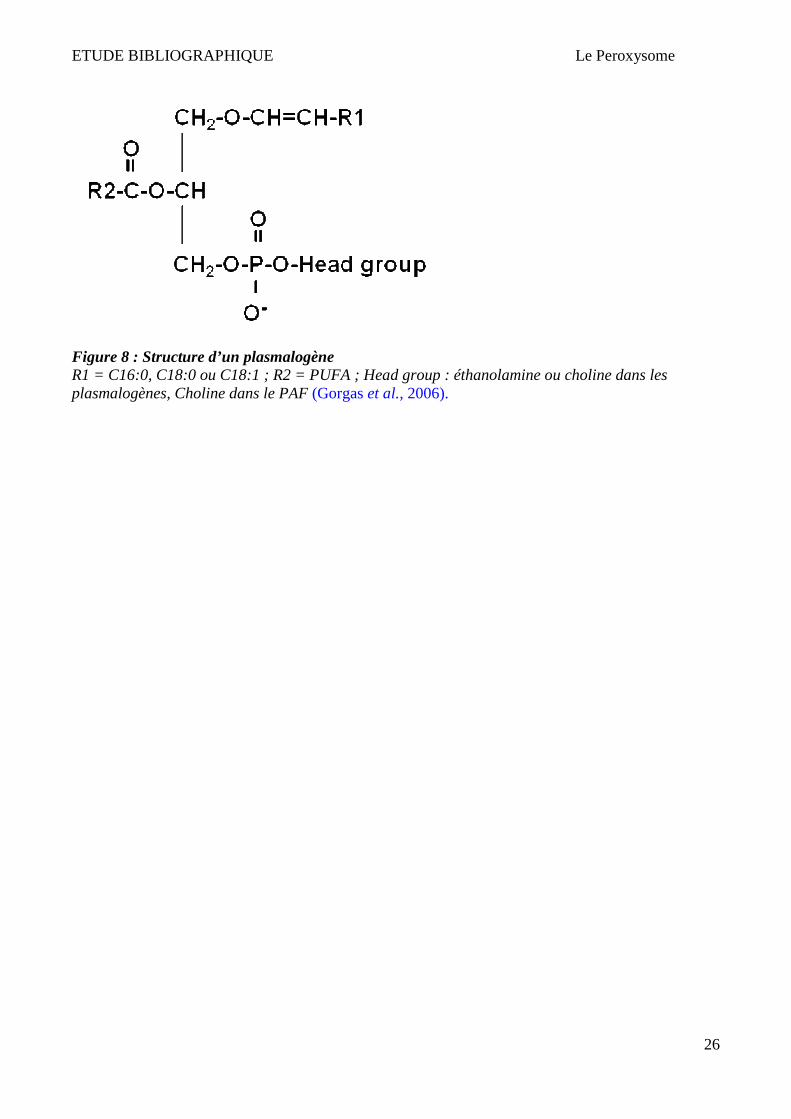
4.1.3 Synthèse d’éthers de lipides : les plasmalogènes
La synthèse d’éthers des phospholipides (plasmalogènes) est l’un des rôles métaboliques majeurs du
peroxysome. La biosynthèse de plasmalogène a lieu dans le peroxysome (les deux premières étapes)
puis dans le RE. Dans le peroxysome, la première étape consiste à estérifier le dihydroxyacétone
phosphate (DHAP) avec un acyl-coA à longue chaîne grâce à l’enzyme dihydroxyacétone phosphate
acyltransférase (DHAP-AT). La deuxième étape transforme l’acyl-DHAP en alkyl-DHAP grâce à
l’enzyme alkyl-dihydroxyacétone phosphate synthase (ADHAP-S) (Brites et al., 2004). Les DHAP-
AT et ADHAP-S sont exclusivement peroxysomales (Singh et al., 1993; Gitshan et al., 1989;
Hardeman & Van den Bosch, 1989). Les plasmalogènes constituent une classe particulière de
glycérophospholipides membranaires particulièrement abondants dans la substance blanche au
niveau du cerveau, des reins et des testicules (la forme plasményl éthanolamine), alors que dans le
cœur et les muscles squelettiques, la forme plasményl choline prédomine (Brites et al., 2004; Brites
et al., 2009). Les macrophages et les neutrophiles contiennent, en plus des plasmalogènes, des
quantités importantes d’éther de phospholipides saturés de plamanyl-choline utilisée pour la synthèse
du facteur d'activation plaquettaire (Platelet-Activating Factor ou PAF) (Wanders & Waterham,
2006a). La myéline est riche en éthanolamine plasmalogènes (PE-plasmalogen) (Figure 8). Les
fonctions des plasmalogènes seraient liées à la réactivité chimique particulière de leur fonction éther
vinylique (Gorgas et al., 2006). Ils semblent jouer des rôles dans la dynamique membranaire, la
signalisation cellulaire, le métabolisme et le transport du cholestérol, la lutte contre les oxydants et le
métabolisme des acides gras polyinsaturés (AGPI) (Nagan & Zoeller, 2001; Zoeller et al., 1988;
Gaposchkin & Zoeller, 1999; Zoeller et al., 1999; Maeba & Ueta, 2003a; Maeba R & Ueta N, 2003b;
Kuczynski & Reo, 2006). Les plasmalogènes pourraient aussi intervenir dans la migration des
cellules neuronales dans l’adrenoleucodystrophie liée à l’X (X-ALD) (Brites et al., 2009).
L’importance des plasmalogènes a été révélée par les différentes maladies métaboliques où la
biosynthèse de plasmalogènes est déficiente (syndrome de Zellweger, maladie d’Alzheimer, ceroid-
lipofuscinosis neuronal…) (Schrakamp et al., 1985; Han et al., 2001; Kohlschutter et al., 1993;
Granier et al., 2000). Néanmoins, 2 maladies sont provoquées directement par la déficience en
DHAP-AT et ADHAP-S à savoir la chondrodysplasie rhizomélique ponctuée de type 2 et 3 (RCDP2
et RCDP3) (Wanders & Waterham, 2006b). La concentration de plasmalogène augmente rapidement
au cours de la myélinisation, l’éthanolamine et les glycérophospholipides de la myéline
correspondent à 70% de plasmalogènes (Reddy & Horrocks, 1982).
ETUDE BIBLIOGRAPHIQUE Le Peroxysome
26
Figure 8 : Structure d’un plasmalogène R1 = C16:0, C18:0 ou C18:1 ; R2 = PUFA ; Head group : éthanolamine ou choline dans les plasmalogènes, Choline dans le PAF (Gorgas et al., 2006).

ETUDE BIBLIOGRAPHIQUE Le Peroxysome
27
4.2 Autres fonctions métaboliques
Les peroxysomes jouent d’autres rôles métaboliques en intervenant dans la synthèse de l’acide
docosahéxaénoique (DHA), les acides biliaires et des leucotriènes.
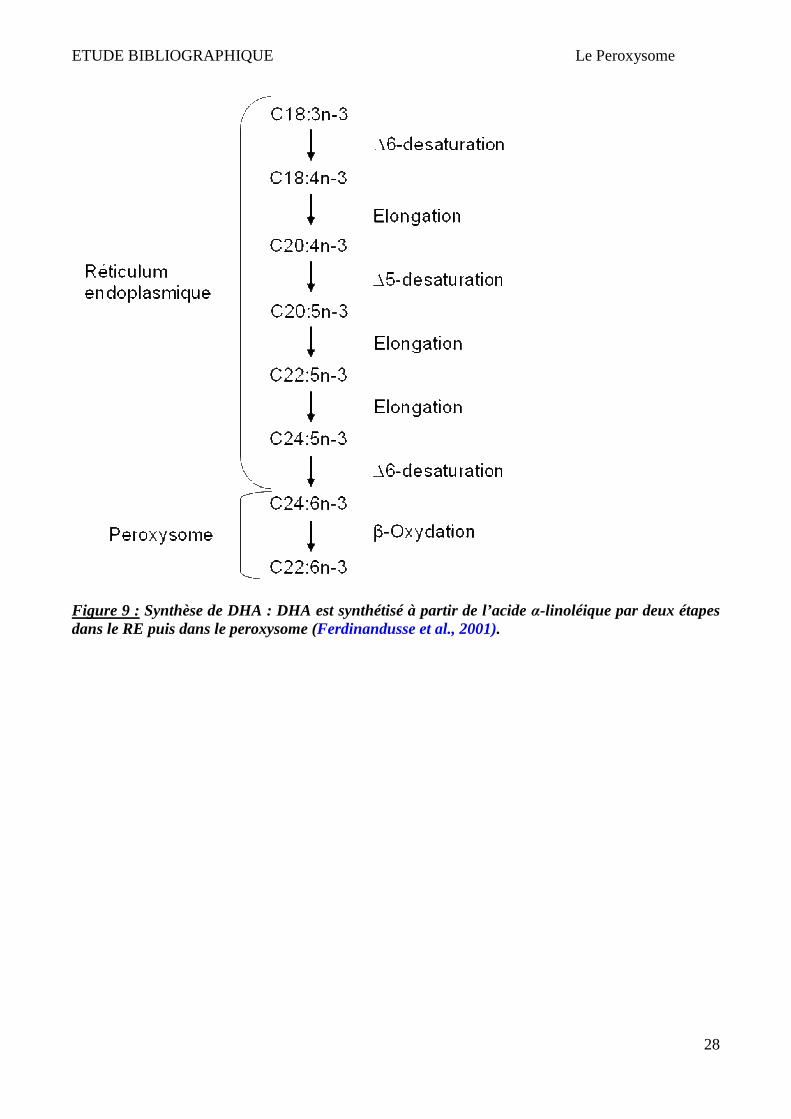
4.2.1 Synthèse d’acide docosahexaénoïque (DHA)
L’acide docosahexaénoïque (DHA) est un constituant majeur d’AGPI de la membrane des cellules
neuronales et rétiniennes. Il est nécessaire pour un bon développement de la rétine et du système
nerveux central (SNC) (Guesnet & Alessandri, 2010). Le déficit en DHA perturbe la composition
lipidique de la membrane et donc les fonctions des astrocytes au niveau du SNC (Champeil-Potokar
et al., 2004). Le DHA est synthétisé dans l’organisme à partir des précurseurs essentiels (acide α-
linolénique C18:3n-3) apportés par l’alimentation (origine végétale) (Alessandri et al., 2004). La
formation de DHA fait intervenir une succession de désaturations et d’élongations (Figure 9), qui se
déroulent principalement dans le foie, le muscle ou même le tissu adipeux (Alessandri et al., 2009).
Le DHA est synthétisé à partir de l’acide α-linoléique par 2 étapes : la conversion de C18:3n-3 en
C20:5n-3 (acide eicosapentaénoique) puis en C22:5n-3 (acide docosapentaénoique) et enfin C24:5n-
3 dans le RE. La deuxième étape consiste en une β-oxydation peroxysomale d’un seul cycle de
C24:6n-3 en C22:6n-3 (DHA) (Ferdinandusse et al., 2001). Cette étape de β-oxydation
peroxysomale nécessite l’intervention d’ACOX1, DBP, 3-Ketoacyl-CoA thiolase et SCPx. La chute
de la teneur en DHA dans les membranes du SNC s’accompagne d’importantes perturbations
fonctionnelles affectant la vision et les capacités d’apprentissage (Alessandri et al., 2004). Dans
certaines maladies neurodégénératives (syndrome de Zellweger….), on constate une absence quasi-
totale de DHA (Ferdinandusse et al., 2001).
ETUDE BIBLIOGRAPHIQUE Le Peroxysome
28
Figure 9 : Synthèse de DHA : DHA est synthétisé à partir de l’acide α-linoléique par deux étapes dans le RE puis dans le peroxysome (Ferdinandusse et al., 2001).
ETUDE BIBLIOGRAPHIQUE Le Peroxysome
29
4.2.2 Synthèse des acides biliaires
Le cholestérol est converti en acide biliaire par des voies multiples qui impliquent différentes
enzymes hépatiques. La synthèse d’acide biliaire joue un rôle important dans l’homéostasie du
cholestérol (Russel, 2003). La β-oxydation peroxysomale est nécessaire pour la transformation de
l’acide bilaire intermédiaire C27 en acide biliaire mature C24 (Ferdinandusse & Houten, 2006). Chez
les patients atteints du syndrome de Zellweger, une accumulation de cet intermédiaire a été identifiée
(Hanson et al., 1979). Les intermédiaires (DHCA et THCA) sont métabolisés dans le peroxysome
(un seul cycle de β-oxydation). Dans la dernière étape de synthèse, les produits de β-oxydation
peroxysomale sont conjugués avec la taurine ou la glycine. Après la conjugaison avec ces 2 acides
aminés, ces produits sont exportés dans le cytoplasme via des transporteurs non encore identifiés et
sont ensuite stockés dans la vésicule biliaire (Ferdinandusse & Houten, 2006).
4.2.3 Métabolisme des leucotriènes
Les leucotriènes (LTs) sont des médiateurs lipidiques obtenus après oxydation de l’acide
arachidonique par la 5-lipoxygénase. C’est une classe des lipides de la famille des écosanoides
(Hammarstrom, 1983; Lewis & Austen, 1984; Samuelsson et al., 1987; Sala et al., 2010). Il existe 2
classes de LTs : (1) les leucotriènes A4 et B4 (LTA4 et LTB4) qui jouent un rôle chimiotactique pour
les leucocytes (Ford-Hutchinson, 1985) ; (2) et les cystéinyl leucotriènes C4, D4, E4 (LTC4, LTD4,
LTE4) qui jouent un rôle important dans l’augmentation de la perméabilité vasculaire et la
contraction des fibres musculaires lisses (Murphy, 1979; Hammarstrom, 1983; Lewis & Austen,
1984; Samuelsson et al., 1987). En fonction du rôle des LTs dans diverses situations physiologiques,
leur inactivation et dégradation sont majeures (Keppler et al., 1989; Ford-Hutchinson, 1989).
Le foie représente l'organe principal pour la captation, l'inactivation, et l'élimination biliaire des LTs
et de leurs métabolites. L'inactivation des LTs est atténuée par ω-oxydation et β-oxydation
peroxysomale à partir de la partie ω-terminale de LTB4, LTE4, et N-acetyl-LTE4 (Keppler et al.,
1992). Les LTC4 et le LTD4 sont instables et sont convertis immédiatement en LTE4. Le N-acétyl-
LTE4 est métabolisé uniquement dans le peroxysome alors que le LTB4 est métabolisé à la fois dans
le peroxysome et dans la mitochondrie (Jedlitschky et al., 1991). Dans certaines maladies
peroxysomales (syndrome de Zellweger….), le taux de LTs est important et notamment le LTB4 qui
est une des substances chimiotactiques les plus puissantes (Mayatepek et al., 1993; Johansson et al.,
2010). Le LTE4 est capable d’activer PPARγ et provoque la génération de la prostaglandine D2
(Paruchuri et al., 2008). Le LTB4 est un agoniste endogène de PPARα (Narala et al., 2010).
ETUDE BIBLIOGRAPHIQUE Le Peroxysome
30
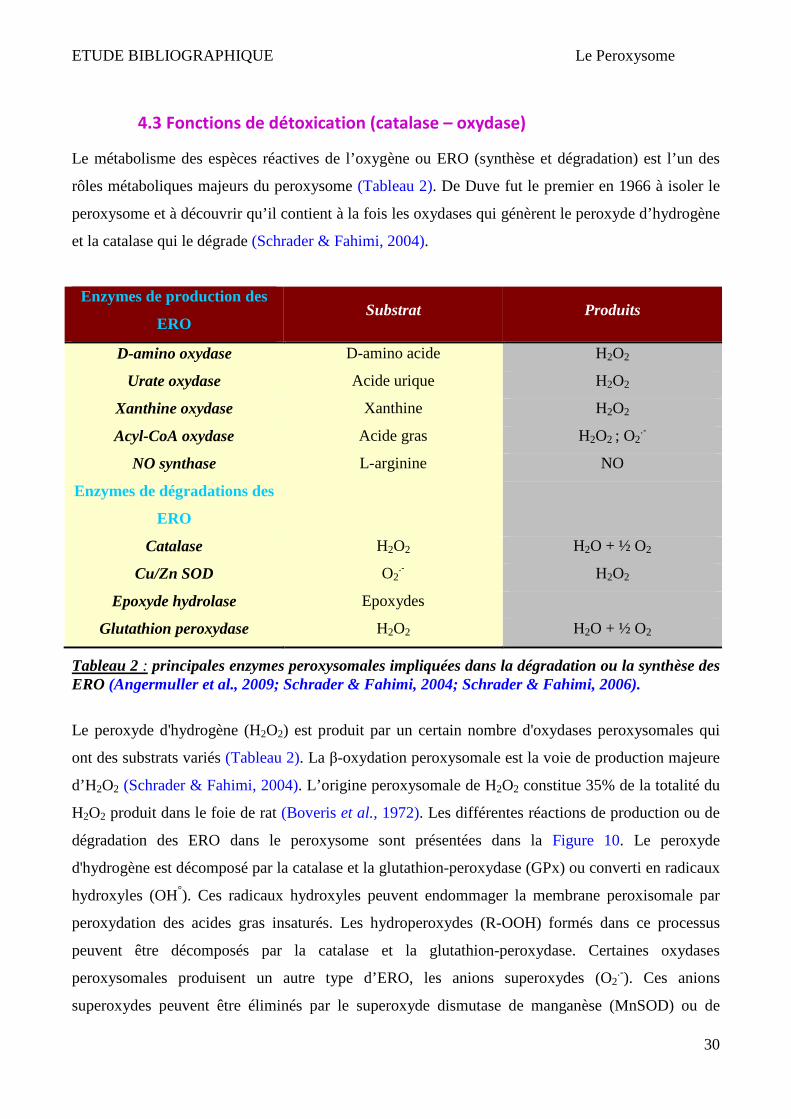
4.3 Fonctions de détoxication (catalase – oxydase)
Le métabolisme des espèces réactives de l’oxygène ou ERO (synthèse et dégradation) est l’un des
rôles métaboliques majeurs du peroxysome (Tableau 2). De Duve fut le premier en 1966 à isoler le
peroxysome et à découvrir qu’il contient à la fois les oxydases qui génèrent le peroxyde d’hydrogène
et la catalase qui le dégrade (Schrader & Fahimi, 2004).
Enzymes de production des
ERO Substrat Produits
D-amino oxydase D-amino acide H2O2
Urate oxydase Acide urique H2O2
Xanthine oxydase Xanthine H2O2
Acyl-CoA oxydase Acide gras H2O2 ; O2.-
NO synthase L-arginine NO
Enzymes de dégradations des
ERO
Catalase H2O2 H2O + ½ O2
Cu/Zn SOD O2.- H2O2
Epoxyde hydrolase Epoxydes
Glutathion peroxydase H2O2 H2O + ½ O2
Tableau 2 : principales enzymes peroxysomales impliquées dans la dégradation ou la synthèse des ERO (Angermuller et al., 2009; Schrader & Fahimi, 2004; Schrader & Fahimi, 2006).
Le peroxyde d'hydrogène (H2O2) est produit par un certain nombre d'oxydases peroxysomales qui
ont des substrats variés (Tableau 2). La β-oxydation peroxysomale est la voie de production majeure
d’H2O2 (Schrader & Fahimi, 2004). L’origine peroxysomale de H2O2 constitue 35% de la totalité du
H2O2 produit dans le foie de rat (Boveris et al., 1972). Les différentes réactions de production ou de
dégradation des ERO dans le peroxysome sont présentées dans la Figure 10. Le peroxyde
d'hydrogène est décomposé par la catalase et la glutathion-peroxydase (GPx) ou converti en radicaux
hydroxyles (OH°). Ces radicaux hydroxyles peuvent endommager la membrane peroxisomale par
peroxydation des acides gras insaturés. Les hydroperoxydes (R-OOH) formés dans ce processus
peuvent être décomposés par la catalase et la glutathion-peroxydase. Certaines oxydases
peroxysomales produisent un autre type d’ERO, les anions superoxydes (O2.-). Ces anions
superoxydes peuvent être éliminés par le superoxyde dismutase de manganèse (MnSOD) ou de

ETUDE BIBLIOGRAPHIQUE Le Peroxysome
31
cuivre-zinc (CuZnSOD). La NO synthase (NOS) catalyse la production de monoxyde d’azote (NO)
via l'oxydation de la L-arginine (L-Arg). Le NO ainsi formé est capable de réagir avec les anions
superoxydes pour former un oxydant puissant, les peroxynitrites (ONOO-) (Schrader & Fahimi,
2004; Schrader & Fahimi, 2006). Une surproduction de la NO synthase inductible (iNOS) peut
provoquer une diminution de l’expression de la catalase et favoriser la formation des peroxynitrites
(Stolz et al., 2002). H2O2 et NO peuvent traverser la membrane peroxysomale et jouer un rôle dans la
signalisation cellulaire. Peroxiredoxin 1 et PMP20 sont impliqués dans la dégradation de H2O2.
Mpv17 et M-LP sont impliqués dans le règulation du métabolisme peroxisomal d’ERO (Schrader &
Fahimi, 2006).
Figure 10 : Enzymes peroxysomales impliquées dans l’homéostasie des ERO (Schrader & Fahimi, 2006).
Puisque le peroxysome est un organite dynamique, une augmentation de la quantité d’oxygène peut
provoquer une augmentation modérée de la densité et du volume des peroxysomes ainsi qu’une
activité enzymatique plus importante pour les enzymes impliquées dans l’élimination d’ERO. Des
cellules ovariennes de hamster CHO exposées à un environnement de 99 % d’oxygène montrent un
doublement du volume des peroxysomes et une augmentation (x 4) de l’expression des enzymes anti-
oxydantes (catalase, glutathion peroxydase et Cu/Mn SODs) (Van der Valk et al., 1985).
ETUDE BIBLIOGRAPHIQUE Le Peroxysome
32
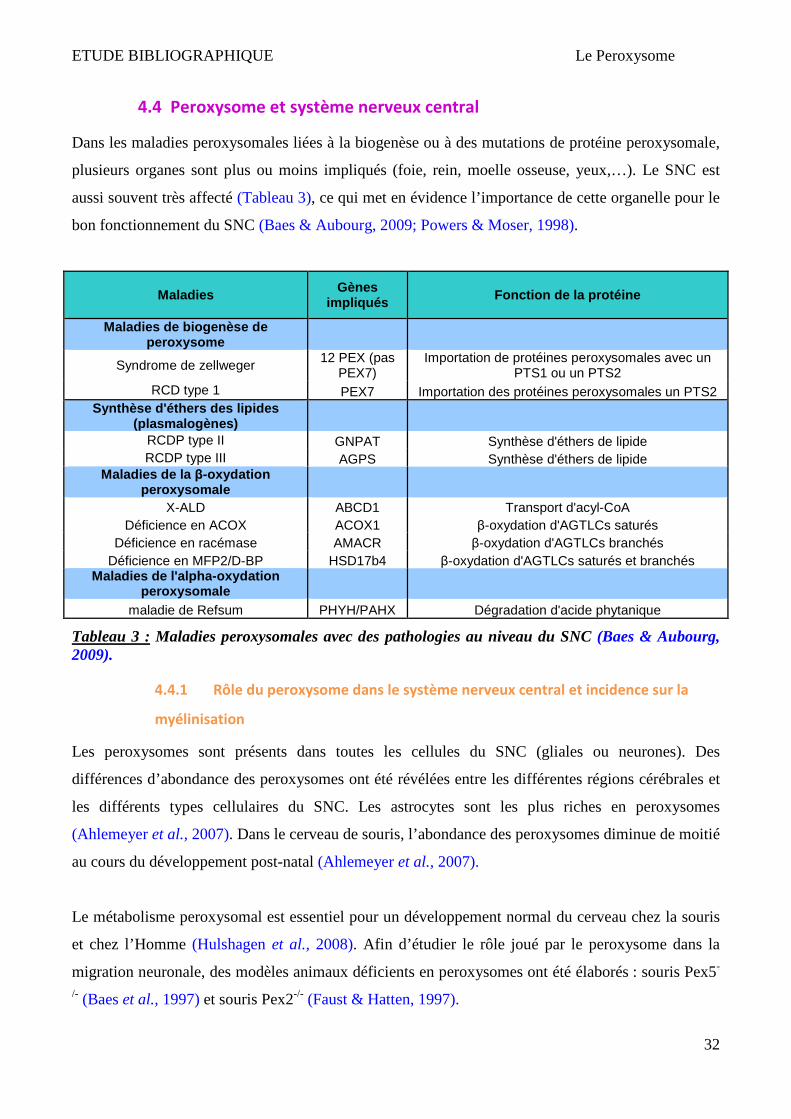
4.4 Peroxysome et système nerveux central
Dans les maladies peroxysomales liées à la biogenèse ou à des mutations de protéine peroxysomale,
plusieurs organes sont plus ou moins impliqués (foie, rein, moelle osseuse, yeux,…). Le SNC est
aussi souvent très affecté (Tableau 3), ce qui met en évidence l’importance de cette organelle pour le
bon fonctionnement du SNC (Baes & Aubourg, 2009; Powers & Moser, 1998).
Maladies
Gènes impliqués Fonction de la protéine
Maladies de biogenèse de peroxysome
Syndrome de zellweger 12 PEX (pas
PEX7) Importation de protéines peroxysomales avec un
PTS1 ou un PTS2 RCD type 1 PEX7 Importation des protéines peroxysomales un PTS2
Synthèse d'éthers des lipides (plasmalogènes)
RCDP type II GNPAT Synthèse d'éthers de lipide RCDP type III AGPS Synthèse d'éthers de lipide
Maladies de la β-oxydation peroxysomale
X-ALD ABCD1 Transport d'acyl-CoA Déficience en ACOX ACOX1 β-oxydation d'AGTLCs saturés
Déficience en racémase AMACR β-oxydation d'AGTLCs branchés Déficience en MFP2/D-BP HSD17b4 β-oxydation d'AGTLCs saturés et branchés
Maladies de l'alpha -oxydation peroxysomale
maladie de Refsum PHYH/PAHX Dégradation d'acide phytanique
Tableau 3 : Maladies peroxysomales avec des pathologies au niveau du SNC (Baes & Aubourg, 2009).
4.4.1 Rôle du peroxysome dans le système nerveux central et incidence sur la
myélinisation
Les peroxysomes sont présents dans toutes les cellules du SNC (gliales ou neurones). Des
différences d’abondance des peroxysomes ont été révélées entre les différentes régions cérébrales et
les différents types cellulaires du SNC. Les astrocytes sont les plus riches en peroxysomes
(Ahlemeyer et al., 2007). Dans le cerveau de souris, l’abondance des peroxysomes diminue de moitié
au cours du développement post-natal (Ahlemeyer et al., 2007).
Le métabolisme peroxysomal est essentiel pour un développement normal du cerveau chez la souris
et chez l’Homme (Hulshagen et al., 2008). Afin d’étudier le rôle joué par le peroxysome dans la
migration neuronale, des modèles animaux déficients en peroxysomes ont été élaborés : souris Pex5-
/- (Baes et al., 1997) et souris Pex2-/- (Faust & Hatten, 1997).

ETUDE BIBLIOGRAPHIQUE Le Peroxysome
33
Chez les souris Pex5-/-, l'analyse du néocortex a indiqué que la migration et la maturation neuronale
sont altérées et que la mort apoptotique des neurones est importante (Baes et al., 1997). Dans le SNC
des souris nouveau-nées Pex2-/- , il y a une stratification désordonnée dans le cortex cérébral et une
densité accrue de cellules dans la matière blanche fondamentale, indiquant une anomalie de
migration neuronale (Faust & Hatten, 1997). Les études sur le modèle de souris mimant la maladie
de Zellweger (Pex2-/-) démontrent que les défauts dans la migration neuronale, la prolifération
neuronale, la différenciation et survie neuronale au niveau du SNC peuvent contribuer à des
malformations au cours du développement (Faust et al., 2005). Par l’utilisation des souris Pex5-/- et
après une restauration sélective de l’expression de Pex5-/- dans le SNC et dans un autre tissu
extraneuronal, Janssen et ses collaborateurs (Janssen et al., 2003) ont montré que le métabolisme
peroxysomal dans le cerveau, mais aussi dans des tissus extraneuronaux (foie), peut affecter le
processus de migration neuronale dans le néocortex du souris. Ces observations ont été confortées
par Krysko et collaborateurs (Krysko et al., 2007). L’accumulation des AGTLC et la déplétion en
plasmalogène et en DHA provoquent une perturbation de la migration neuronale aussi observée dans
les maladies peroxysomales (Janssen et al., 2003).
Parmi les différents types cellulaires du cerveau, l’oligodendrocyte a la plus grande capacité à
détoxifier les ERO (Hirrlinger et al., 2002). Les peroxysomes sont abondants dans les
oligodendrocytes au cours de la myélinisation (Adamo et al., 1986). Afin de déterminer le rôle joué
par les peroxysomes dans les oligodendrocytes, des souris CNPase-Pex5 KO ont été réalisées
(Kassman et al., 2007). La CNPase est une enzyme exprimée dans les oligodendrocytes immatures et
matures. Ces souris sont caractérisées par une inactivation sélective des peroxysomes dans les
oligodendrocytes. Elles montrent une accumulation d’AGTLCs et une diminution de la synthèse de
plasmalogène (80%) dans la myéline purifiée. Les taux d’acides gras accumulés sont équivalents aux
taux observés dans les lysats du cerveau des souris déficientes en Abcd1 (x4) (Kobayashi et al.,
1997), ce qui indique que les peroxysomes oligodendrocytaires sont largement responsables de la
dégradation des AGTLCs dans le cerveau. A l’âge de 4 mois, ces souris présentent des anomalies
comportementales et de troubles neurologiques. Une démyélinisation progressive au niveau du SNC
est observée tardivement (à partir de 6 mois) chez ces souris au niveau du corps calleux, alors que
des signes de perturbation de transport axonal (gonflement axonal) ont été identifiés précocement. Ce
phénomène n’est pas accompagné par une mort cellulaire des oligodendrocytes. L’incapacité des
oligodendrocytes déficients en Pex5 à maintenir l’intégrité axonale, même avant une démyélinisation
visible, indique une fonction critique des peroxysomes des oligodendrocytes comme un support de
l’intégrité axonale (Kassman et al., 2007). Chez ces souris, un phénomène de gliose a été observé au
niveau du SNC via l’activation des macrophages et des astrocytes avant même la démyélinisation et

ETUDE BIBLIOGRAPHIQUE Le Peroxysome
34
la perte des axones. A partir de 4 mois, ces souris présentent une augmentation importante des
facteurs pro-inflammatoires et chemo-attractants des lymphocytes (MIP1-α; MCP-1; TNF- α; IL-
10…). L’expression de ces facteurs pro-inflammatoires est suivi par une infiltration de monocytes,
des lymphocytes B et T (notamment CD8+). Cette étude a montré l’importance des peroxysomes des
oligodendrocytes dans la neuroprotection des axones et dans le maintien d’un environnement non-
inflammatoire au niveau du SNC (Kassman et al., 2007).
Un autre modèle Nestin-Pex5 a été élaboré. Dans ce modèle, l’inactivation du peroxysome a lieu
dans les astrocytes, les neurones et les oligodendrocytes (Hulshagen et al., 2008). L’initiation de
neurodégénération de ces souris est plus précoce, la progression est plus rapide. Ces souris meurent
au bout du 6 mois (Hulshagen et al., 2008) alors que les souris CNPase-Pex5 meurent au bout de 12
mois (Kassman et al., 2007). Ces observations indiquent l’importance des peroxysomes des autres
cellules gliales dans la formation et la stabilité de la myéline autour des axons (Hulshagen et al.,
2008). Dans ces deux modèles, les peroxysomes fonctionnels sont absents au cours de la
différenciation et dans la période active de myélinisation (10-20 jours post-natals) (Baes & Aubourg,
2009). L’absence du peroxysome dans les oligodendrocytes ne les empêche pas de différencier. Chez
les souris CNPase-Pex5, la formation et la maintenance de la myéline est normale jusqu’à l’âge de
deux mois ce qui indique que les peroxysomes ne sont pas pré-requis pour la myélinisation. Ceci
peut être expliqué par le fait que les autres cellules du SNC ont des peroxysomes intacts (Baes &
Aubourg, 2009). Par contre, une fois la myélinisation terminée, le métabolisme du peroxysome
oligodendrocytaire semble crucial pour préserver les axones et assurer le maintien de l’intégrité de la
myéline (Baes & Aubourg, 2009). L’absence de peroxysomes fonctionnels dans les neurones des
souris NEX-Pex5 et les astrocytes dans les souris GFAP-Pex5 ne provoque pas une dégénérescence
axonale ou comportementale chez les souris avant l’âge de 20 mois (tardivement) (Bottelbergs et al.,
2010). Ceci indique que les fonctions des peroxysomes astrocytaires et neuronaux sont mineures par
rapport à ceux des oligodendrocytes pour le maintien des axones et de la myéline (Baes & Aubourg,
2009; Bottelbergs et al., 2010).
ETUDE BIBLIOGRAPHIQUE Le Peroxysome
35
4.4.2 Peroxysome et médiateurs lipidiques d’inflammation dans le système
nerveux central
Le peroxysome assure la dégradation de certains éicosanoïdes (leucotriènes) (Diczfalusy, 1994) qui
sont des médiateurs lipidiques importants de l’inflammation. Ces médiateurs jouent le rôle de
chemo-attractants des lymphocytes (Funk, 2001). Ces éicosanoïdes s’accumulent dans le cas de
dysfonctionnement primaire ou secondaire du peroxysome. L’accumulation des leucotriènes a été
confirmée dans les hépatocytes de patients souffrant du syndrome de Zellweger (Mayatepek &
Tiepelmann, 1996), ou encore dans le liquide céphalorachidien de patients atteints d’X-ALD d’une
façon indépendante de la phase de la maladie (Mayatepek & Tiepelmann, 2003).
Par ailleurs, la myéline est composée de 70% de lipides dont la moitié sont des phospholipides. Ces
phospholipides peuvent être dégradés par la phospholipase A2 qui libère l’acide arachidonique et des
lysophospholipides (susbtances démyélinisantes). Ensuite, le métabolisme de l’acide arachidonique
donne des écoisanoides (médiateurs d’inflammation). Dans un cerveau intact, ces produits sont
directement éliminés et ne dépassent pas un certain seuil (Farooqui et al., 2007).
Il est possible que la perturbation du métabolisme lipidique dans les oligodendrocytes de maladies
peroxysomales puisse diminuer le catabolisme des écosanoides, ce qui provoque leur accumulation
dans le SNC (Kassmann & Nave, 2008). Kassmann et Nave ont proposé un modèle qui pourrait
expliquer l’implication des peroxysomes oligodendrocytaires dans la demyelinisation inflammatoire
(Figure 11). A partir d'un certain seuil, les médiateurs lipidiques d’inflammation s’accumuleraient
dans le SNC, activeraient la microglie, et provoqueraient une infiltration de leucocytes dans le SNC,
ce qui conduirait à une démyélinisation inflammatoire du SNC. Ces attaques inflammatoires du SNC
pourraient perturber le métabolisme lipidique des oligodendrocytes, et ainsi amplifier la
démyélinisation (Kassmann & Nave, 2008).
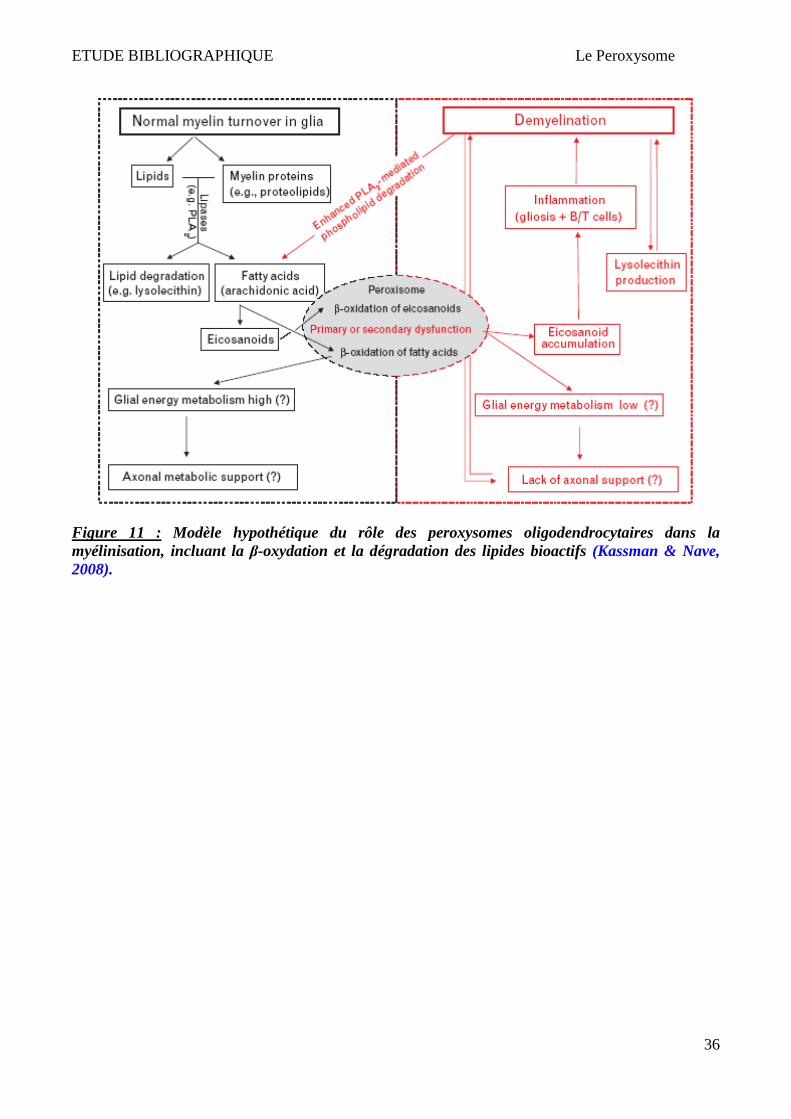
ETUDE BIBLIOGRAPHIQUE Le Peroxysome
36
Figure 11 : Modèle hypothétique du rôle des peroxysomes oligodendrocytaires dans la myélinisation, incluant la β-oxydation et la dégradation des lipides bioactifs (Kassman & Nave, 2008).

ETUDE BIBLIOGRAPHIQUE Le Peroxysome
37
5 Interaction du peroxysome avec d’autres organelles
La communication et les interactions inter-organelles sont nécessaires. Les peroxysomes
interagissent avec plusieurs organelles essentiellement avec la mitochondrie et le réticulum
endoplasmique, mais aussi avec les organelles de stockage de lipides (ladiposomes…) (Goodman et
al., 2008) ou avec les autophagosomes et les lysosomes (Sakai et al., 2006).
5.1 Interaction peroxysome - mitochondrie
La mitochondrie et le peroxysome sont deux organelles essentielles pour les cellules des
mammifères. Bien que des différences évidentes existent entre ces deux organelles, ceux-ci montrent
des similitudes morphologiques et fonctionnelles (métabolisme des AG, ERO..). Ces organelles
fortement dynamiques partagent certains composants de leurs machines de division. Les
mitochondries et les peroxysomes sont des organelles métaboliquement liées (β-oxydation des acides
gras) qui coopèrent et communiquent (Schrader & Yoon, 2007). Dans la voie de la β-oxydation,
l’ester de l’acylcarnitine transporte les métabolites de la β-oxydation peroxysomale du peroxysome
vers la mitochondrie. L’ATP synthétisé dans la mitochondrie est transporté dans le peroxysome pour
générer l’acyl-CoA à chaîne moyenne (Schrader & Yoon, 2007). Plus récemment, une voie
vésiculaire de transport des mitochondries aux peroxysomes a été identifiée. Les vésicules dérivées
de la mitochondrie (MDVs pour « Mitochondria-derived vesicles ») contiennent une protéine qui a
un domaine RING et qui est considérée comme une protéine mitochondriale d’ancrage (MAPL pour
mitochondria-anchored protein ligase). Ces vésicules peuvent fusionner avec les peroxysomes
(Neuspiel et al., 2008). Les MDVs peuvent être produites par les mitochondries suite à une
surexpression de MAPL, mais leur biogenèse est indépendante de MAPL ou de la DRP1
(« Dynamin-related Protein 1 ») qui est un facteur de fission commun entre la mitochondrie et le
peroxysome. Ces nouvelles vésicules pourraient être impliquées dans le transport de protéines, de
lipides ou de métabolites des mitochondries vers le peroxysome (Thoms et al., 2009). Schumann et
Subramani ont proposé un modèle récapitulant les différentes voies d’échanges des métabolites,
protéines ou lipides entre la mitochondrie et le peroxysome (Schumann & Subramani, 2008) (Figure
12).
PPARα est un activateur des facteurs de transcription impliqués dans l’expression des certaines
enzymes de la β-oxydation peroxysomale et mitochondriale et dans la prolifération peroxysomale.
Certains ligands pharmacologiques de PPARα induisent la prolifération des peroxysomes et de la
mitochondrie chez les rongeurs (Thoms et al., 2009). Certains facteurs de fission sont partagés entre

ETUDE BIBLIOGRAPHIQUE Le Peroxysome
38
les mitochondries et les peroxysomes. DRP1 (Dnm1 chez la levure) et Fis1 sont des facteurs
moléculaires qui règlent la fission des deux organelles. Ils sont localisés dans les mitochondries et les
peroxysomes. L’adressage de Fis1 aux membranes peroxysomales ou mitochondriales semble suivre
des mécanismes indépendants, mais il pourrait y avoir une concurrence entre les mitochondries et les
peroxysomes pour DRP1 et Fis1 (Thoms et al., 2009).
Chez les souris déficientes en Pex5, l’absence d’un peroxysome fonctionnel est associé à une
formation des mitochondries avec des altérations ultrastructurales et fonctionnelles sévères
(Baumgart et al., 2001).
Figure 12 : Echange entre peroxysome et mitochondrie (Schumann & Subramani, 2008). Le transfert des métabolites ou des cofacteurs entre les compartiments peut se produire par diffusion ou par des transporteurs sans exiger le contact physique ou par des mécanismes qui impliquent le transport par des vésicules. Des métabolites peuvent être échangés entre ces compartiments par la diffusion ou par des détachements de vésicules mitochondriales.
ETUDE BIBLIOGRAPHIQUE Le Peroxysome
39
5.2 Interaction peroxysome – réticulum endoplasmique
Certaines études suggèrent que le réticulum endoplasmique (RE) contribue à la formation des
peroxysomes, en particulier en donnant les lipides nécessaires à la formation de la membrane
peroxysomale. De ce fait, certains classent les peroxysomes comme une organelle issue du RE
(Novikoff & Shin, 1964; Titorenko & Rachubinski, 1998; Mullen et al., 2001; Hoepfner et al.,
2005).
Chez les levures, certaines peroxines comme Pex2, Pex3, Pex16 atteignent le peroxysome après
passage par le RE. Les peroxysomes dérivent du RE via un mécanisme qui est dépendant de Pex19
(Hoepfner et al., 2005). Chez l’homme, Pex16 atteint aussi le peroxysome via le RE (Kim et al.,
2006). Dans les hépatocytes dépourvus de peroxysomes, une prolifération de RE a été observée ainsi
qu’une surexpression de cytochrome P450 (enzyme CYP4A1) (Dirkx et al., 2005).

ETUDE BIBLIOGRAPHIQUE Maladies peroxysomales
40
III Maladies peroxysomales
Les maladies peroxysomales constituent une famille de maladies héréditaires rares mais sévères. On
distingue deux groupes de maladies peroxysomales (Wanders & Waterham, 2006b) :
� Les maladies liées à la biogenèse du peroxysome (syndrome de Zellweger, RCDP1…).
� Les maladies liées à une mono ou multi-déficiences de protéines peroxysomales, parmi
lesquelles figurent l’X-ALD et la P-NALD.
1 L’adrénoleucodystrophie liée au chromosome X (X-ALD)
Le premier cas de patient atteint d’X-ALD a été décrit en 1910 par Haberfeld et Spieler (Moser,
1997). Ce n’est qu’en 1970 que Blaw donna le nom d’Adrénoleucodystrophie à cette maladie :
Adréno pour glande surrénale, leuco pour la substance blanche du système nerveux qui est atteint
lors de la maladie et dystrophie signifiant croissance ou développement anormal (Moser, 1997).
1.1 Origine génétique de l’X-ALD et transporteurs ABCDs
L’X-ALD (OMIM 300100) (Berger & Gärtner, 2006), la plus fréquente des maladies peroxysomales
(1/17000), est une maladie génétique rare à transmission autosomique récessive. Elle touche
essentiellement les enfants de sexe masculin. L’X-ALD a pour origine une ou plusieurs mutations du
gène ABCD1, localisé sur le chromosome X au niveau du locus q28. Ce gène code pour un
hémitransporteur ABC (ATP-binding cassette) de la sous famille D localisé au niveau de la
membrane peroxysomale, l’ALDP (Adrenoleukodystrophy Protein) (Mosser et al., 1993). ABCD1
est un gène de 19,9 Kb qui contient 10 exons et code pour l’ALDP comprenant 745 acides aminés et
dont le poids moléculaire est de 75 KDa. L’ALDP contient six domaines transmembranaires. La
partie NH2 terminale qui fixe un ATP est intra-peroxysomale. A ce jour, 1096 mutations du gène
codant pour l’ALDP ont été identifiées conduisant dans la plupart des cas à une absence de cette
protéine (www.X-ALD.nl ). Actuellement, aucune relation génotype-phénotype n’a été mise en
évidence chez les malades atteints d’X-ALD (Smith et al., 1999).
La famille de transporteurs ABCD est constituée de 4 hémi-transporteurs dont 3 (ABCD1, ABCD2,
ABCD3) sont peroxysomaux (Kemp & Wanders, 2007) et dont le quatrième a été localisé dans le
réticulum endoplasmique (kashiwayama et al., 2009).
- ABCD2 code pour une protéine nommée Adrenoleucodystrophy related Protein (ALDRP)
présentant 66% d’identité avec l’ALDP.

ETUDE BIBLIOGRAPHIQUE Maladies peroxysomales
41
- ABCD3 code pour une protéine de 70 kDa nommée PMP70 présentant 49% d’homologie
avec ABCD1.
Ces hémi-transporteurs sont synthétisés dans le cytosol puis transportés dans le peroxysome via la
protéine PEX19 (Halbach et al., 2005). Un transporteur ABCD est constitué de deux hémi-
transporteurs : ALDP (ABCD1) peut s’homodimériser ou s’hétérodimériser en s’associant soit avec
ALDRP (ABCD2) ou PMP70 (ABCD3) pour constituer un transporteur fonctionnel (Berger &
Gärtner, 2006). Au niveau du système nerveux central, ALDP est surtout exprimée par les
oligodendrocytes, les astrocytes et les cellules endothéliales; elle est faiblement exprimée par les
neurones (Ferrer et al., 2010).
1.2 Fonctions biochimiques du transporteur ALDP
L’ALDP est un hémi-transporteur potentiel des AGTLC (C>22) - activés sous forme d’AGTLC-CoA
– du cytosol à l’intérieur du peroxysome (Kemp & Wanders, 2010; Van roermund et al., 2008;
Ofman et al., 2010). La déficience en ALDP conduit à une diminution de la β-oxydation
peroxysomale des AGTLC et à une synthèse accrue de ces derniers (Kemp et al., 2005) avec pour
conséquence une accumulation plasmatique et tissulaire des AGTLC saturés (acide lignocérique
(C24:0); acide cérotique (C26:0)) et mono-insaturés (C26:1) en particulier dans la substance blanche
du cerveau, les testicules et le cortex surrénalien (Berger & Gärtner, 2006). Cette accumulation
d’AGTLC conduit à une augmentation du rapport C26:0/C22:0 qui constitue aussi un critère de
caractérisation de l’X-ALD. Les AGTLC s’accumulent sous forme d’esters de cholestérol,
s’intègrent dans les phospholipides ou les gangliosides. Au niveau du SNC, les AGTLC
s’accumulent dans la myéline, notamment en interagissant avec la Protéolipide Protéine (PLP), mais
aussi en s’intégrant dans les phosphatidylcholines et lysophosphatidylcholines du cerveau (Igarashi
et al., 1976; Kemp & Wanders, 2010; Ferrer et al., 2010; Singh & Pujol, 2010).
Dans l’organisme, ces AGTLC ont deux origines 1) source alimentaire (source mineure), 2)
élongation des AG à moyenne chaine dans l’organisme (source majeure) (Kemp & Wanders, 2010).
Kemp et al. ont montré que l’élongation d’AGTLC dans les fibroblastes des patients atteints d’X-
ALD est augmentée (Kemp et al., 2005). Les C24:0 et C26:0 sont synthétisés par une réaction
d’élongation à deux étapes : la première consiste à synthétiser des C18:0-C22:0 grâce à l’élongase
ELOVL6 (Elongation of Very-Long Chain Fatty Acids) ; la seconde consiste à synthétiser les C24:0
et C26:0 à partir des produits de la première étape grâce à l’élongase ELOV1 (Ofman et al., 2010).

ETUDE BIBLIOGRAPHIQUE Maladies peroxysomales
42
1.3 Formes cliniques de l’X-ALD
L’X-ALD est une pathologie neuro-métabolique inflammatoire. L’X-ALD provoque une
dégénérescence progressive du SNC ou du SNP. Au niveau clinique, une grande variabilité
phénotypique a été observée. Il existe 2 phénotypes cliniques principaux : 1) la forme cérébrale
infantile (35% de cas) ou CCALD, caractérisée par une démyélinisation inflammatoire progressive
du système nerveux central qui se manifeste entre 4 et 8 ans ; 2) l’adrénomyéloneuropathie (AMN),
démyélinisation périphérique non inflammatoire, qui se manifeste à l’âge adulte par une paralysie de
degré variable mais évolue vers une paraplégie spastique et mauvais des membres inférieurs
représentant environ 45% des cas. 70% des patients atteints de l’X-ALD développe une insuffisance
adrénocorticale précoce même avant l’apparition des premier symptomes neurologiques. Certains
parmi ces patients ne développent jamais des signes neurologiques, juste une atteinte des glandes
corticosurrénales, connus sous le nom de maladie d’Addison (atteinte des glandes corticosurrénales)
constituant 10-20% des cas (Berger et al., 2010).. Néanmoins, d’autres formes moins fréquentes
existent (Berger & Gartner, 2006; Aubourg, 2007) (Tableau 4).
Formes cliniques d’adrénoleucodystrophies liées au chromosome X
Chez l’homme - Formes cérébrales démyélinisantes inflammatoires (CCALD ; 5-12 ans)
- Formes cérébrales démyélinisantes non inflammatoires (ACALD ; 10-15 ans)
- Adrénomyéloneuropathie (AMN ; 20-60 ans)
- Adrénomyéloneuropathie compliquée d’une atteinte cérébrale démyélinisante
inflammatoire (AMN ; 20-45 ans)
- Insuffisance surrénale périphérique (maladie d’Addison ; 5-40 ans)
- Insuffisance gonadotrope (testiculaire) : > 20 ans
Chez la femme - Adrénomyéloneuropathie (AMN)
Tableau 4 : Différentes formes cliniques d’X-ALD. L’absence d’une relation génotype-phénotype apparente suggère l’intervention de différents gènes
modificateurs et/ou de facteurs environnementaux ou épigénétiques dans l’évolution clinique de la
maladie (Dubois-Dalcq et al., 1999; Moser et al., 2004). Parmi les facteurs pouvant contribuer au
déclenchement de l’X-ALD figurent des infections virales, qui peuvent initier l’inflammation dans le
SNC, d’autres transporteurs ABCDs (Berger & Gartner, 2006), le niveau de plasmalogène (Brites et
al., 2009) et les traumatismes crâniens (Raymond et al., 2010).

ETUDE BIBLIOGRAPHIQUE Maladies peroxysomales
43
1.4 Caractérisation des lésions d’X-ALD
La forme la plus sévère de l’X-ALD est la forme infantile qui se caractérise par un phénomène de
démyélinisation inflammatoire. La myéline, synthétisée par les oligodendrocytes, est un complexe
lipoprotéique composé de 70% de lipides et 30% de protéines. La myéline sert à protéger les axones
et à les isoler électriquement, permettant ainsi la bonne conduction de l’influx nerveux. Dans le
processus inflammatoire, au niveau des lésions, on observe une augmentation de l’expression de
cytokines inflammatoires (notamment de TNFα et IL-1β), de NO synthase inductible (iNOS) et une
accumulation d’espèces réactives de l’oxygène (ERO) et de monoxyde d’azote (NO) (Powers et al.,
1992; Vargas et al., 2004). L’accumulation d’AGTLC dans le cerveau de patients atteints d’X-ALD
provoque aussi l’accumulation de certains médiateurs d’inflammation comme les leucotriènes (Khan
et al., 2010). Ces différents événements peuvent contribuer à la déstabilisation de la gaine de myéline
(Hudspeth & Raymond, 2007).
Singh et Pujol (Sing & Pujol, 2010) ont proposé un scénario faisant intervenir trois événements
majeurs permettant d’expliquer l’évolution des lésions de l’X-ALD (Figure 13). Dans ce scénario, le
stress oxydant conduirait à l’initiation de réactions inflammatoires aboutissant à la démyélinisation.
Ainsi, l'excès d’AGTLC et la diminution du taux de plasmalogènes provoqueraient la rupture de
l’équilibre RedOx et par conséquent l’augmentation du stress oxydant (1ère événement), ce qui
provoquerait une inflammation (2ème événement) avec l’intervention de facteurs environnementaux,
génétiques ou épigénétiques. Ultérieurement, les cytokines et les médiateurs d’inflammation
provoqueraient une perte généralisée de fonctions peroxisomales (3ème événement), créant un cercle
vicieux ayant pour conséquence la mort cellulaire et l’initiation de la démyélinisation inflammatoire
du SNC (Sing & Pujol, 2010).
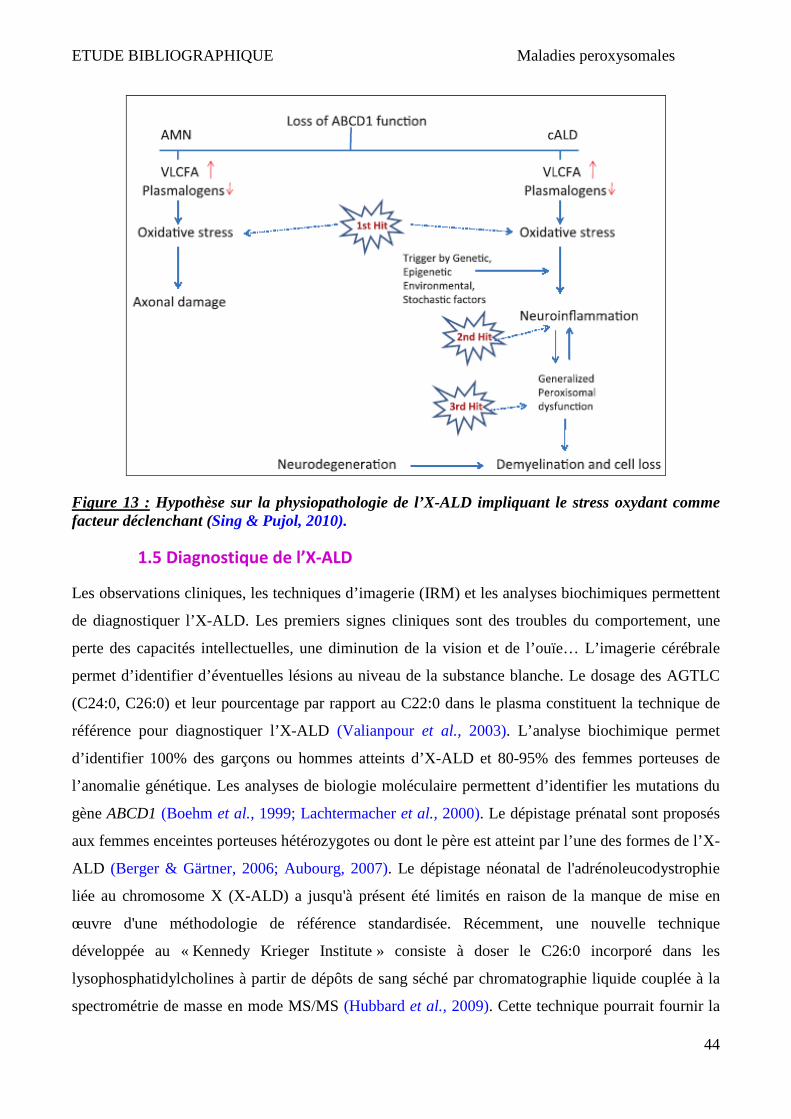
ETUDE BIBLIOGRAPHIQUE Maladies peroxysomales
44
Figure 13 : Hypothèse sur la physiopathologie de l’X-ALD impliquant le stress oxydant comme facteur déclenchant (Sing & Pujol, 2010).
1.5 Diagnostique de l’X-ALD
Les observations cliniques, les techniques d’imagerie (IRM) et les analyses biochimiques permettent
de diagnostiquer l’X-ALD. Les premiers signes cliniques sont des troubles du comportement, une
perte des capacités intellectuelles, une diminution de la vision et de l’ouïe… L’imagerie cérébrale
permet d’identifier d’éventuelles lésions au niveau de la substance blanche. Le dosage des AGTLC
(C24:0, C26:0) et leur pourcentage par rapport au C22:0 dans le plasma constituent la technique de
référence pour diagnostiquer l’X-ALD (Valianpour et al., 2003). L’analyse biochimique permet
d’identifier 100% des garçons ou hommes atteints d’X-ALD et 80-95% des femmes porteuses de
l’anomalie génétique. Les analyses de biologie moléculaire permettent d’identifier les mutations du
gène ABCD1 (Boehm et al., 1999; Lachtermacher et al., 2000). Le dépistage prénatal sont proposés
aux femmes enceintes porteuses hétérozygotes ou dont le père est atteint par l’une des formes de l’X-
ALD (Berger & Gärtner, 2006; Aubourg, 2007). Le dépistage néonatal de l'adrénoleucodystrophie
liée au chromosome X (X-ALD) a jusqu'à présent été limités en raison de la manque de mise en
œuvre d'une méthodologie de référence standardisée. Récemment, une nouvelle technique
développée au « Kennedy Krieger Institute » consiste à doser le C26:0 incorporé dans les
lysophosphatidylcholines à partir de dépôts de sang séché par chromatographie liquide couplée à la
spectrométrie de masse en mode MS/MS (Hubbard et al., 2009). Cette technique pourrait fournir la

ETUDE BIBLIOGRAPHIQUE Maladies peroxysomales
45
base pour le dépistage des nouveau-nés atteints d’X-ALD dans des laboratoires très spécialisés
(Hubbard et al., 2009).
1.6 Traitement de l’X-ALD
Le traitement de l’X-ALD commence par la prise en charge psychologique et médicale du patient et
de ses proches. Plusieurs approches pour traiter l’X-ALD ont été proposées. Des traitements
stéroïdiens ont été utilisés pour corriger l’insuffisance surrénale chez les patients atteints de la
maladie d’Addison (Ferrer et al., 2010). Un régime alimentaire dépourvu en AGTLC avec
administration de l’huile de Lorenzo (un mélange d’acide oléique et d’acide érucique) permet de
normaliser le taux plasmatique d’AGTLC en inhibant la synthèse endogène de ces acides gras.
L’administration précoce de l’huile de Lorenzo ne fait que retarder l’apparition des signes
neurologiques de la maladie (Moser et al., 2005). La greffe allogénique de moelle osseuse
(transplantation des cellules souches hématopoïétiques) est le seul traitement qui permet de stabiliser
ou de faire régresser les lésions cérébrales de démyélinisation à condition que la greffe soit effectuée
au tout début de la maladie (Peters et al., 2004; Shapiro et al., 2000). Plus récemment, Cartier et al.
ont testé avec succès une technique de thérapie génique consistant à introduire le gène défectueux
dans un rétrovirus de type VIH pour le faire exprimer par les cellules souches du malade quand elles
sont réintroduites dans son organisme. Cette technique a permis un arrêt total de la progression de
démyélinisation cérébrale chez les deux patients traités (Cartier et al., 2009). D’autres approches
pharmacologiques envisagent de stimuler l’expression d’ABCD2, qui présent une redondance
fonctionnelle avec ABCD1 (Berger et al., 2010).
2 La Pseudo-adrénoleucodystrophie néonatale P-NALD
La pseudo-adrénoleucodystrophie néonatale (P-NALD) (OMIM264470), est une maladie génétique,
neurodégénérative, provoquée par la suppression/mutations d'ACOX1. La déficience en ACOX1
résulte soit 1) d’une large délétion qui provoque l’absence de l’enzyme, 2) soit de mutations
ponctuelles conduisant à l’absence de l’enzyme ou à la synthèse d’une enzyme non fonctionnelle
(Ferdinandusse et al., 2007). Les patients P-NALD sont caractérisés par une neurodégénérescence
précoce du SNC, une hypotonie et des désordres moteurs importants (Wanders et al., 2010). Ils
présentent aussi une régression de développement du SNC et décèdent vers l’âge de 5 ans (Wanders
et al., 2010; Ferdinandusse et al., 2010). Récemment, deux cas des personnes âgées présentant des
déficiences en ACOX1 ont été identifiés. Ces patients présentent une accumulation plasmatique
ETUDE BIBLIOGRAPHIQUE Maladies peroxysomales
46
d’AGTLC mais un taux de DHA (C22:6ω3) normal avec des symptômes neurologiques atténués par
rapport à la P-NALD (Ferdinandusse et al., 2010). L’imagerie cérébrale par résonance magnétique a
montré une atrophie profonde du tronc cérébral et le cervelet, et une atrophie cérébrale modeste. la
conduction nerveuse est normale (Ferdinandusse et al., 2010).
L’ ACOX1 est un gène qui code pour l’enzyme contrôlant la première étape limitante de la β-
oxydation des AGTLC (Fournier et al., 1994). Chez l’Homme, le gène ACOX1 est localise sur le
chromosome 17 (17q25), il est constitué de 15 exons et 14 introns avec deux exons 3 nommés exon
3a et 3b. L’épissage alternatif de pré-ARNm donne lieu à deux ARNm matures et par conséquent à
deux isoformes d’ACOX1 : ACOX1a et ACOX1b. Chaque ARNm code pour une protéine de 72
kDa (660 acides aminés), qui contient au niveau C-terminal un signal d’adressage peroxysomal :
«S/K/L» (Varanasi et al., 1994). L’activité ACOX1 provoque la production d’enoyl-CoA et le
peroxyde d’hydrogène (Wanders et al., 2010). Au niveau biochimique, la déficience en ACOX1
résulte en une accumulation d’AGTLC saturés et en une déficience en acide docosahexaénoique
(DHA), mais n’a pas d’effet sur le métabolisme des acides gras branchés et des acides biliaires
(Oaxaca-Castillo et al., 2007; Kemp & Wanders, 2007). Les souris Acox1-/- présentent aussi une
accumulation d’AGTLC dans le sérum dès l’âge de 2 à 4 mois (Fan et al., 1996a). Chez la souris,
l’absence du gène Acox1 conduit au développement d’une stéatose microvasculaire au niveau
hépatique et à une accumulation du peroxyde d’hydrogène, ainsi qu’à une prolifération peroxisomale
massive dans les hépatocytes (Vluggens et al., 2010).
Dans des conditions physiologiques normales, l’expression du gène de l’ACOX1 peut être régulée
par des proliférateurs de peroxysomes (PPARs : peroxisome proliferator activated receptors) en
particulier des PPARα (Wahli et al., 1995); mais aussi, par des hormones comme la prolactine (PRL)
et l’hormone de croissance (GH). La GH et la PRL sont des activateurs potentiels de STAT5 et
exercent une variété d’effets sur l’expression des gènes adipocytaires (Coulter et al., 2006).

ETUDE BIBLIOGRAPHIQUE Mort cellulaire
47
IV Mort cellulaire
Perpétuellement, au niveau des tissus, les cellules se multiplient, se divisent ou meurent (Amon &
Tyers, 2009).
La mort cellulaire est un processus fondamental, elle participe au maintien de l’homéostasie
cellulaire et tissulaire, au développement et à la différenciation cellulaire. Par ailleurs, la mort
cellulaire intervient dans de nombreuses maladies (maladies neurodégénératives, maladies auto-
immunes, maladies virales, cancers…) (Thompson, 1995; Geng & Libby, 1995). La capacité de
moduler la vie et la mort d'une cellule représente un immense potentiel thérapeutique.
Trois principaux types de mort cellulaire (Figure 14) sont décrits, reposant sur des critères
morphologiques et biochimiques (Boya & Kroemer, 2008):
Type 1 : l’apoptose
Type 2 : l’autophagie
Type 3 : la nécrose/oncose
Plusieurs autres types de mort cellulaire dérivant de ces trois principaux types sont recensés :
La catastrophe mitotique : est une forme aberrante de mitose associée à des
changements morphologiques typiques mais biochimiquement variables
(Vakifahmetoglu et al., 2008; Kroemer et al., 2008).
L’anoïkis : correspond à de l'apoptose associée à une perte d’attachement des cellules
à la matrice extracellulaire (Gilmore, 2005; Kroemer et al., 2008).
L’excitotoxicitée : il s'agit d'une forme de mort cellulaire survenant dans les neurones
provoquée par le glutamate, qui conduit à l'ouverture de canaux calcique (la N-
méthyl-D-aspartate), suivie par une surcharge de calcium cytosolique et l'activation
des voies de signalisation conduisant à la mort cellulaire (Orrenius et al., 2003;
Kroemer et al., 2008).
La paraptose : ce terme a été introduit pour décrire une forme de mort cellulaire
programmée, morphologiquement et biochimiquement distincte de l'apoptose. Dans
plusieurs types de cellules, la paraptose est déclenchée par l'expression du récepteur
du facteur de croissance insulin-like I, et elle est associée à une vacuolisation
cytoplasmique prononcé et à un gonflement mitochondrial, sans les autres marques
morphologiques distinctives de l'apoptose (Sperandio et al., 2000; Kroemer et al.,
2008).
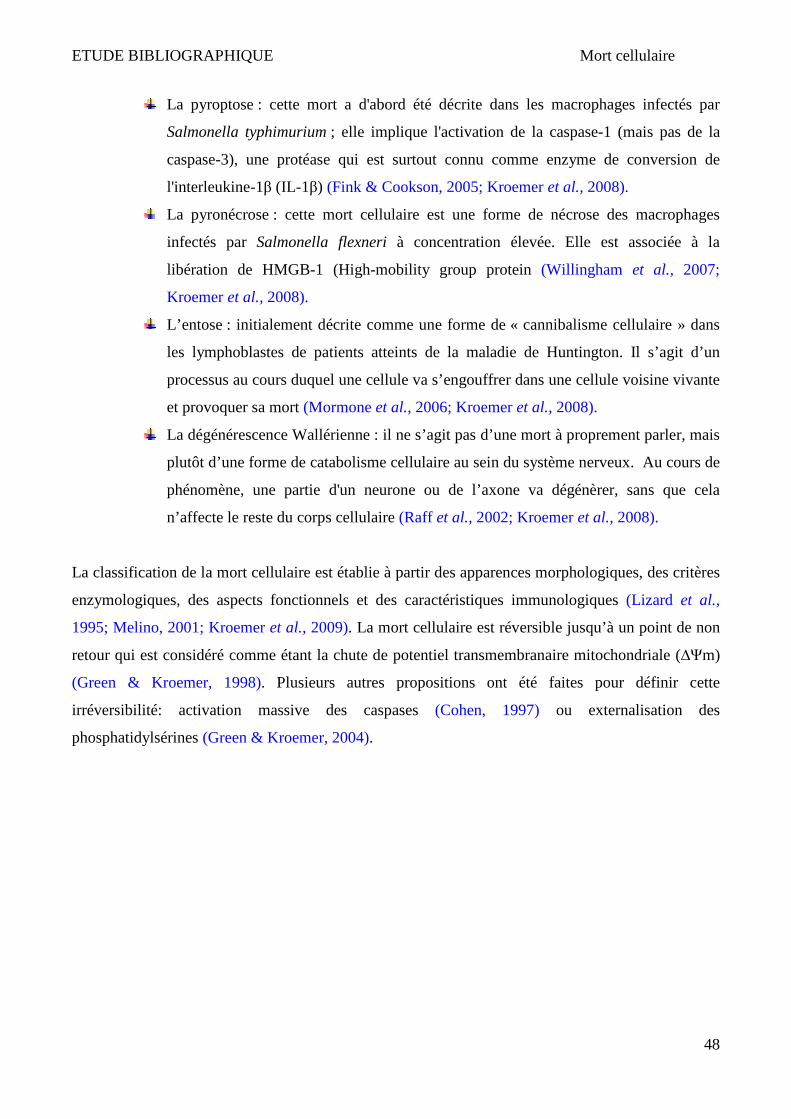
ETUDE BIBLIOGRAPHIQUE Mort cellulaire
48
La pyroptose : cette mort a d'abord été décrite dans les macrophages infectés par
Salmonella typhimurium ; elle implique l'activation de la caspase-1 (mais pas de la
caspase-3), une protéase qui est surtout connu comme enzyme de conversion de
l'interleukine-1β (IL-1β) (Fink & Cookson, 2005; Kroemer et al., 2008).
La pyronécrose : cette mort cellulaire est une forme de nécrose des macrophages
infectés par Salmonella flexneri à concentration élevée. Elle est associée à la
libération de HMGB-1 (High-mobility group protein (Willingham et al., 2007;
Kroemer et al., 2008).
L’entose : initialement décrite comme une forme de « cannibalisme cellulaire » dans
les lymphoblastes de patients atteints de la maladie de Huntington. Il s’agit d’un
processus au cours duquel une cellule va s’engouffrer dans une cellule voisine vivante
et provoquer sa mort (Mormone et al., 2006; Kroemer et al., 2008).
La dégénérescence Wallérienne : il ne s’agit pas d’une mort à proprement parler, mais
plutôt d’une forme de catabolisme cellulaire au sein du système nerveux. Au cours de
phénomène, une partie d'un neurone ou de l’axone va dégénèrer, sans que cela
n’affecte le reste du corps cellulaire (Raff et al., 2002; Kroemer et al., 2008).
La classification de la mort cellulaire est établie à partir des apparences morphologiques, des critères
enzymologiques, des aspects fonctionnels et des caractéristiques immunologiques (Lizard et al.,
1995; Melino, 2001; Kroemer et al., 2009). La mort cellulaire est réversible jusqu’à un point de non
retour qui est considéré comme étant la chute de potentiel transmembranaire mitochondriale (∆Ψm)
(Green & Kroemer, 1998). Plusieurs autres propositions ont été faites pour définir cette
irréversibilité: activation massive des caspases (Cohen, 1997) ou externalisation des
phosphatidylsérines (Green & Kroemer, 2004).
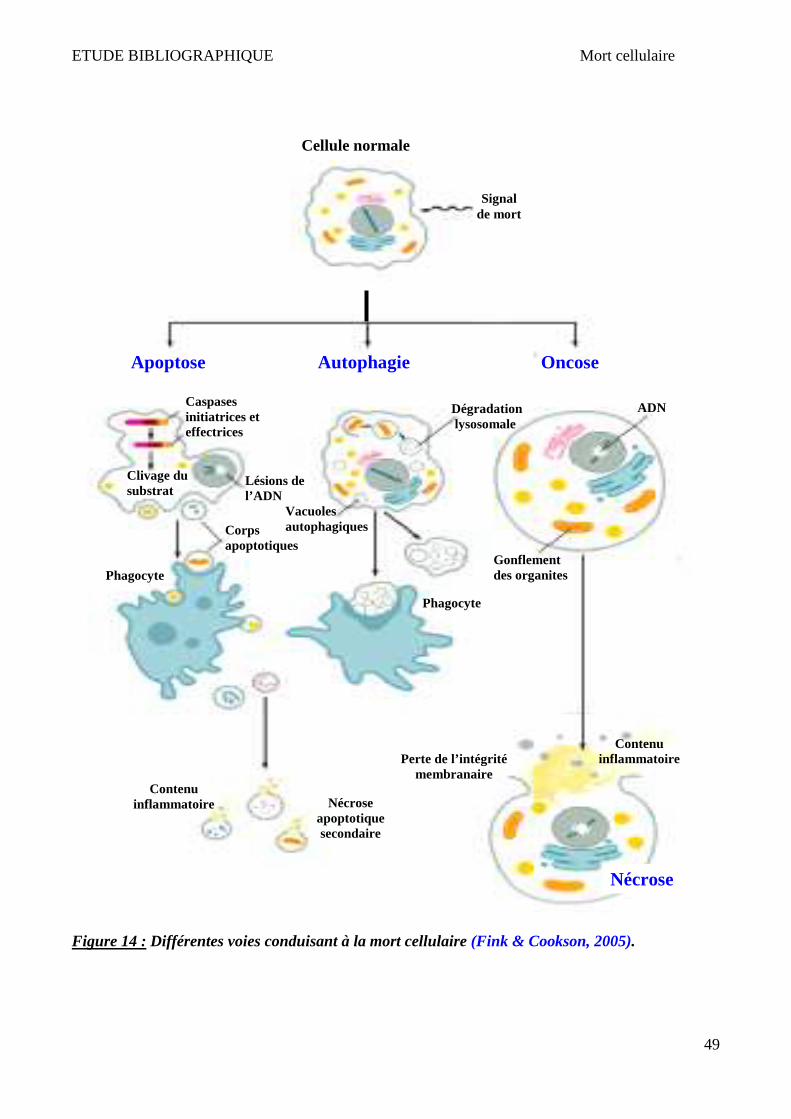
ETUDE BIBLIOGRAPHIQUE Mort cellulaire
49
Figure 14 : Différentes voies conduisant à la mort cellulaire (Fink & Cookson, 2005).
Apoptose Autophagie Oncose
ADN
Gonflement des organites
Nécrose
Dégradation lysosomale
Phagocyte
Perte de l’intégrité membranaire
Vacuoles autophagiques
Caspases initiatrices et effectrices
Clivage du substrat
Phagocyte
Lésions de l’ADN
Corps apoptotiques
Contenu inflammatoire Nécrose
apoptotique secondaire
Cellule normale
Signal de mort
Contenu inflammatoire

ETUDE BIBLIOGRAPHIQUE Mort cellulaire
50
1 Apoptose
Le terme apoptose, d’origine grecque, désigne la chute des feuilles d’un arbre en automne. Il a été
proposé par Kerr et al. en 1972 pour décrire la mort programmée dans l’organisme qui survient dans
certains organes au cours de l’ontogenèse. L’apoptose est un mécanisme de mort intervenant dans
plusieurs processus physiologiques (embryogenèse, développement normal des organes,…) et
pathologiques. Ce mécanisme peut être activé (SIDA, maladie d’Alzheimer…) ou inhibé
(Cancers…) (Meier et al., 2000). L’apoptose se caractérise par des aspects morphologiques
spécifiques la distinguant des autres types de mort : nécrose/oncose, autophagie… . La mort
cellulaire par apoptose est rapide et n’entraine en général ni lésion, ni inflammation, contrairement à
la nécrose (Figure 14).
Morphologiquement, l’apoptose se définit par la diminution du volume cellulaire, le maintien de
l’intégrité membranaire, la condensation de la chromatine, la fragmentation nucléaire (Figure 15).
Les organelles cytoplasmiques sont peu ou pas modifiées structuralement au cours de l’apoptose
(Kroemer et al., 2009). La condensation nucléaire est accompagnée d’une dégradation spécifique de
l’ADN en nucléotides de 50 à 300 kb résultant de l’excision des boucles d’ADN et de leurs
oligomères (Lagarkova et al., 1995), suivie ou non d’une multiples fragmentation internucléosomale
de 180-200 pb, donnant un profil électrophorétique caractéristique « en échelle » sur gel d’agarose
(Wyllie et al., 1980).
Figure 15 : Chronologie et morphologie de l’apoptose Plusieurs sous-types d’apoptose sont décrits. Ils présentent des caractéristiques morphologiques
identiques mais des diversités biochimiques et fonctionnelles importantes. Ces diversités sont
associées à l’activation de plusieurs voies extrinsèques avec implication ou non de la mitochondrie
(voies des récepteurs à domaines de mort) ou intrinsèques (voie mitochondriale) (Kroemer et al.,
2009). La voie des récepteurs à domaines de mort inclue la superfamille du TNF (tumor necrosis

ETUDE BIBLIOGRAPHIQUE Mort cellulaire
51
factor) qui conduit à l’activation des caspases. Les voies initiées par un stress cellulaire
(xénobiotiques, agents physiques, radiations….), le stress de réticulum endoplasmique et la protéine
P53 conduisent à l’activation de la voie intrinsèque.
La voie des récepteurs à domaine de mort fait intervenir des récepteurs de la membrane
cytoplasmique qui, après fixation à leurs ligands spécifiques, déclenchent rapidement les
mécanismes moléculaires conduisant à l’apoptose (Kitanaka & Kuchino, 1999).
Des nombreuses voies apoptotiques (telles que celles déclenchées par des xénobiotiques) convergent
vers la mitochondrie et entrainent, suite à la chute du potentiel mitochondrial transmembranaire
(∆Ψm), la perméabilité des membranes mitochondriales, qui est à l’origine de la libération de
protéines pro-apoptotiques de l’espace intermembranaire mitochondriale vers le cytosol
(Cytochrome c, AIF, Smac /Diablo, Omi/HtrA2, endonucléase G) (Ferri & Kroemer, 2001). La voie
mitochondriale est une voie complexe qui permet d’induire l’apoptose cellulaire de façon dépendante
ou indépendante des caspases (Figure 16). La mitochondrie est impliquée à la fois dans l’apoptose et
dans la nécrose en fonction de la sévérité des dommages infligés à cette organelle (Beal, 2000).
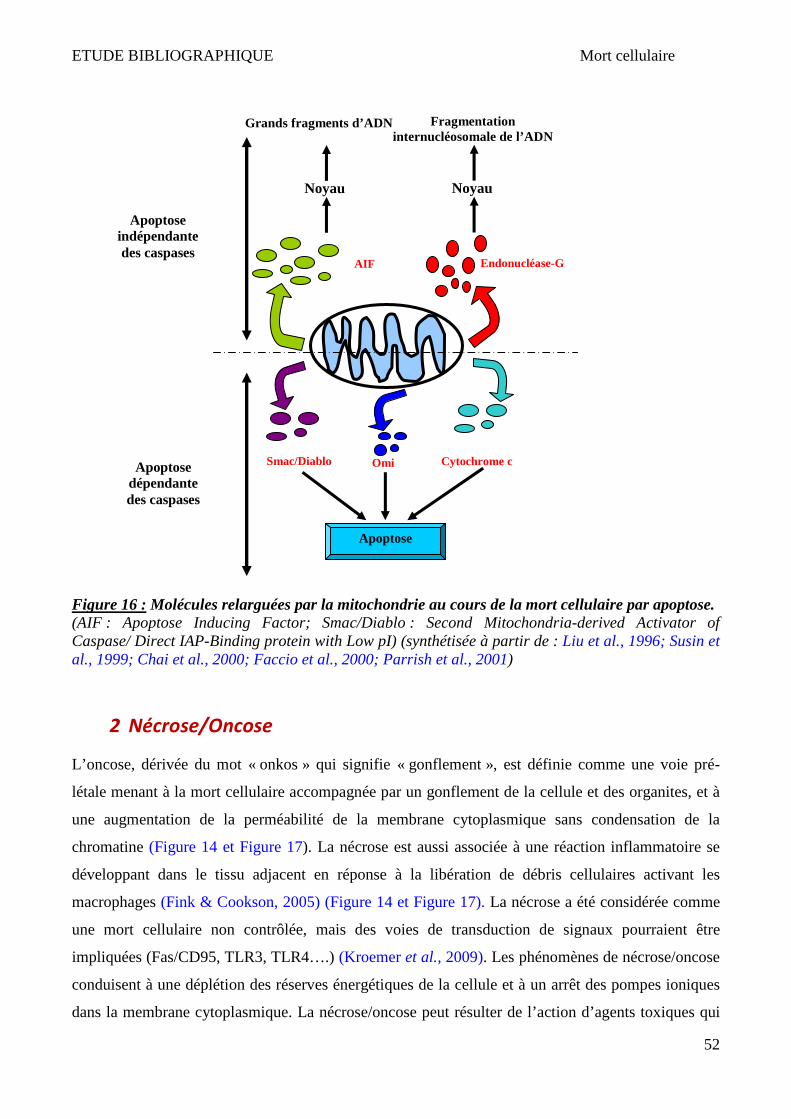
ETUDE BIBLIOGRAPHIQUE Mort cellulaire
52
Figure 16 : Molécules relarguées par la mitochondrie au cours de la mort cellulaire par apoptose. (AIF : Apoptose Inducing Factor; Smac/Diablo : Second Mitochondria-derived Activator of Caspase/ Direct IAP-Binding protein with Low pI) (synthétisée à partir de : Liu et al., 1996; Susin et al., 1999; Chai et al., 2000; Faccio et al., 2000; Parrish et al., 2001)
2 Nécrose/Oncose
L’oncose, dérivée du mot « onkos » qui signifie « gonflement », est définie comme une voie pré-
létale menant à la mort cellulaire accompagnée par un gonflement de la cellule et des organites, et à
une augmentation de la perméabilité de la membrane cytoplasmique sans condensation de la
chromatine (Figure 14 et Figure 17). La nécrose est aussi associée à une réaction inflammatoire se
développant dans le tissu adjacent en réponse à la libération de débris cellulaires activant les
macrophages (Fink & Cookson, 2005) (Figure 14 et Figure 17). La nécrose a été considérée comme
une mort cellulaire non contrôlée, mais des voies de transduction de signaux pourraient être
impliquées (Fas/CD95, TLR3, TLR4….) (Kroemer et al., 2009). Les phénomènes de nécrose/oncose
conduisent à une déplétion des réserves énergétiques de la cellule et à un arrêt des pompes ioniques
dans la membrane cytoplasmique. La nécrose/oncose peut résulter de l’action d’agents toxiques qui
Noyau Noyau
Endonucléase-G AIF
Cytochrome c Smac/Diablo Omi
Apoptose
Apoptose indépendante des caspases
Apoptose dépendante des caspases
Fragmentation internucléosomale de l’ADN
Grands fragments d’ADN
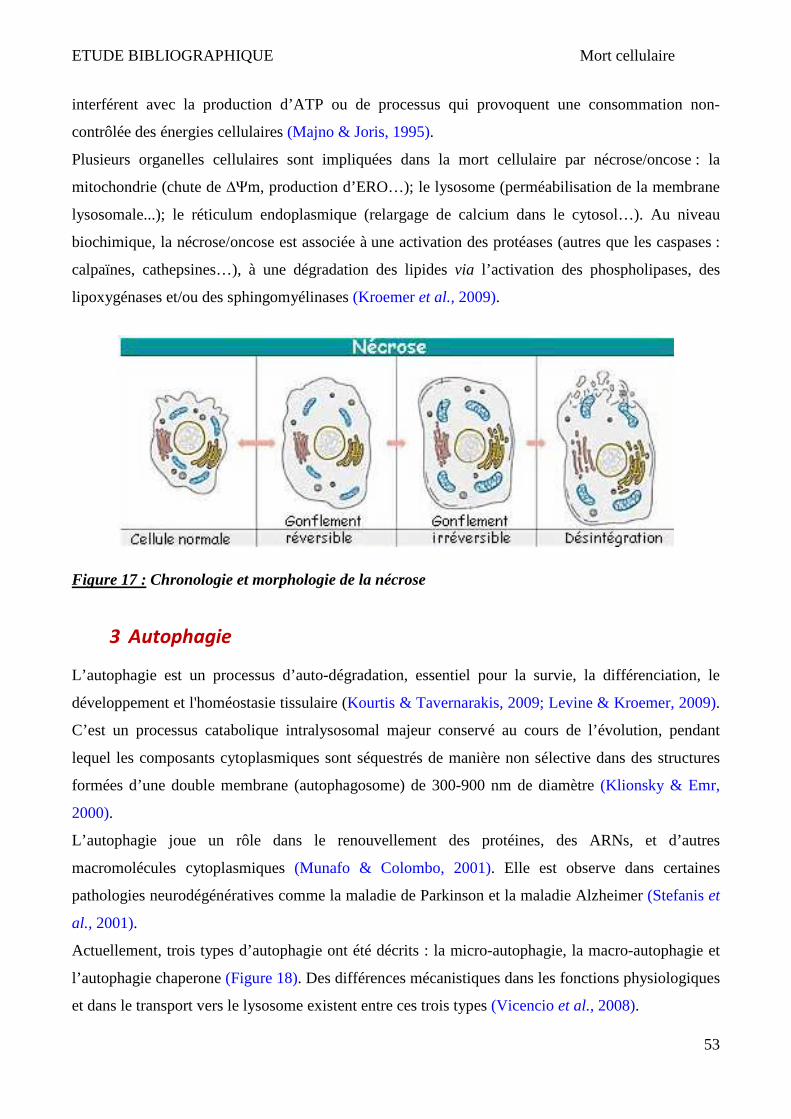
ETUDE BIBLIOGRAPHIQUE Mort cellulaire
53
interférent avec la production d’ATP ou de processus qui provoquent une consommation non-
contrôlée des énergies cellulaires (Majno & Joris, 1995).
Plusieurs organelles cellulaires sont impliquées dans la mort cellulaire par nécrose/oncose : la
mitochondrie (chute de ∆Ψm, production d’ERO…); le lysosome (perméabilisation de la membrane
lysosomale...); le réticulum endoplasmique (relargage de calcium dans le cytosol…). Au niveau
biochimique, la nécrose/oncose est associée à une activation des protéases (autres que les caspases :
calpaïnes, cathepsines…), à une dégradation des lipides via l’activation des phospholipases, des
lipoxygénases et/ou des sphingomyélinases (Kroemer et al., 2009).
Figure 17 : Chronologie et morphologie de la nécrose
3 Autophagie
L’autophagie est un processus d’auto-dégradation, essentiel pour la survie, la différenciation, le
développement et l'homéostasie tissulaire (Kourtis & Tavernarakis, 2009; Levine & Kroemer, 2009).
C’est un processus catabolique intralysosomal majeur conservé au cours de l’évolution, pendant
lequel les composants cytoplasmiques sont séquestrés de manière non sélective dans des structures
formées d’une double membrane (autophagosome) de 300-900 nm de diamètre (Klionsky & Emr,
2000).
L’autophagie joue un rôle dans le renouvellement des protéines, des ARNs, et d’autres
macromolécules cytoplasmiques (Munafo & Colombo, 2001). Elle est observe dans certaines
pathologies neurodégénératives comme la maladie de Parkinson et la maladie Alzheimer (Stefanis et
al., 2001).
Actuellement, trois types d’autophagie ont été décrits : la micro-autophagie, la macro-autophagie et
l’autophagie chaperone (Figure 18). Des différences mécanistiques dans les fonctions physiologiques
et dans le transport vers le lysosome existent entre ces trois types (Vicencio et al., 2008).
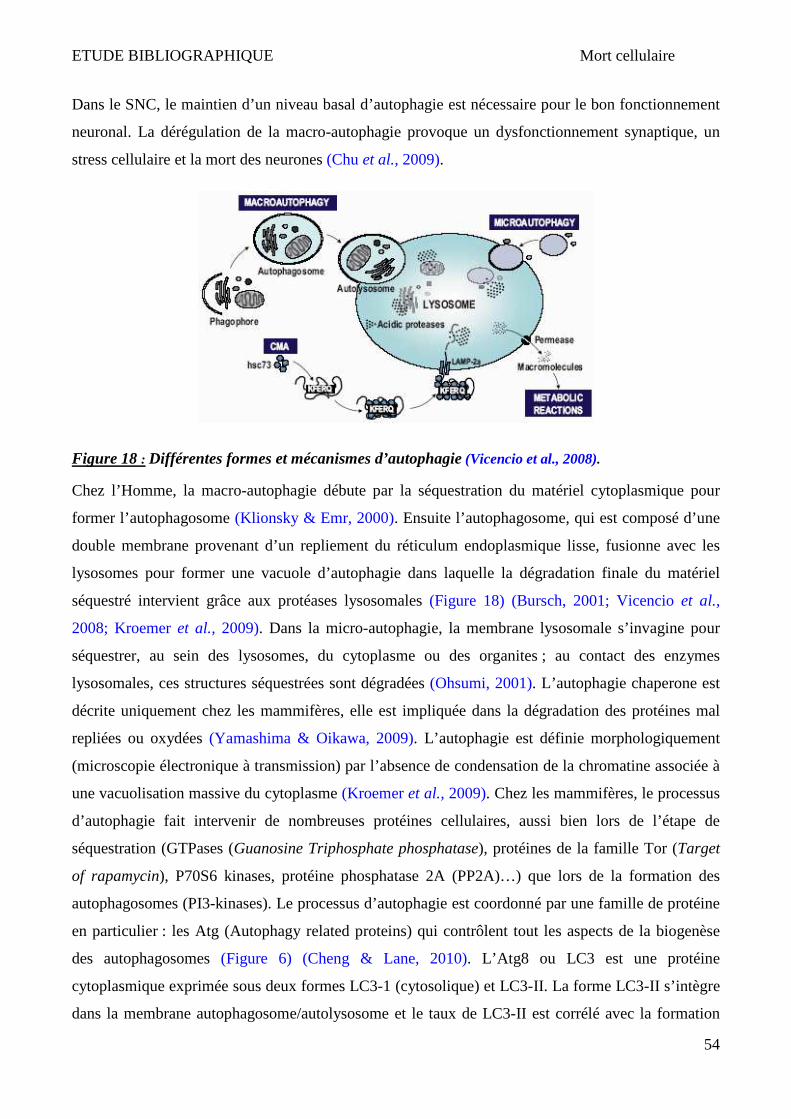
ETUDE BIBLIOGRAPHIQUE Mort cellulaire
54
Dans le SNC, le maintien d’un niveau basal d’autophagie est nécessaire pour le bon fonctionnement
neuronal. La dérégulation de la macro-autophagie provoque un dysfonctionnement synaptique, un
stress cellulaire et la mort des neurones (Chu et al., 2009).
Figure 18 : Différentes formes et mécanismes d’autophagie (Vicencio et al., 2008).
Chez l’Homme, la macro-autophagie débute par la séquestration du matériel cytoplasmique pour
former l’autophagosome (Klionsky & Emr, 2000). Ensuite l’autophagosome, qui est composé d’une
double membrane provenant d’un repliement du réticulum endoplasmique lisse, fusionne avec les
lysosomes pour former une vacuole d’autophagie dans laquelle la dégradation finale du matériel
séquestré intervient grâce aux protéases lysosomales (Figure 18) (Bursch, 2001; Vicencio et al.,
2008; Kroemer et al., 2009). Dans la micro-autophagie, la membrane lysosomale s’invagine pour
séquestrer, au sein des lysosomes, du cytoplasme ou des organites ; au contact des enzymes
lysosomales, ces structures séquestrées sont dégradées (Ohsumi, 2001). L’autophagie chaperone est
décrite uniquement chez les mammifères, elle est impliquée dans la dégradation des protéines mal
repliées ou oxydées (Yamashima & Oikawa, 2009). L’autophagie est définie morphologiquement
(microscopie électronique à transmission) par l’absence de condensation de la chromatine associée à
une vacuolisation massive du cytoplasme (Kroemer et al., 2009). Chez les mammifères, le processus
d’autophagie fait intervenir de nombreuses protéines cellulaires, aussi bien lors de l’étape de
séquestration (GTPases (Guanosine Triphosphate phosphatase), protéines de la famille Tor (Target
of rapamycin), P70S6 kinases, protéine phosphatase 2A (PP2A)…) que lors de la formation des
autophagosomes (PI3-kinases). Le processus d’autophagie est coordonné par une famille de protéine
en particulier : les Atg (Autophagy related proteins) qui contrôlent tout les aspects de la biogenèse
des autophagosomes (Figure 6) (Cheng & Lane, 2010). L’Atg8 ou LC3 est une protéine
cytoplasmique exprimée sous deux formes LC3-1 (cytosolique) et LC3-II. La forme LC3-II s’intègre
dans la membrane autophagosome/autolysosome et le taux de LC3-II est corrélé avec la formation
ETUDE BIBLIOGRAPHIQUE Mort cellulaire
55
d’autophagosome qui est un signe d’autophagie. La LC3-II est la première protéine de mammifère
identifiée comme protéine associée spécifiquement à la membrane de l’autophagosome (Kabeya et
al., 2000). Dans des cellules graisseuses de la drosophile, la surexpression d’Atg1 provoque la mort
cellulaire par autophagie avec l’activation de caspases (Scott et al., 2007).
Récemment, la fonction d’autophagie dans la régulation du stockage des lipides a été révélée via un
mécanisme appelé macro-lipophagie (Singh et al., 2009a). Dans des conditions de restrictions
alimentaire, les gouttelettes lipidiques sont prises en charge par des vacuoles autophagiques ;
l’inhibition de l’autophagie dans des hépatocytes en culture ou dans le foie de souris augmente le
stockage des triglycérides sous forme de gouttelettes lipidiques (Singh et al., 2009a). Ce phénomène
révèle de nouvelles fonctions de l’autophagie dans le métabolisme lipidique, ce qui peut avoir des
implications importantes dans les maladies associées à des anomalies de stockage de lipides (Singh
et al., 2009a; Singh, 2010).
4 Lysosome et mort cellulaire
Le lysosome est une organelle cellulaire avec une simple membrane qui le sépare du cytoplasme. Les
lysosomes ont été découverts en 1949 par de Duve qui les a nommé « suicide bags » (Turk & Turk,
2009). Les lysosomes contiennent plus que 80 hydrolases acides qui jouent un rôle dans la
dégradation des protéines, des acides nucléiques, des lipides, des polysaccharides… (Yamashima &
Oikawa, 2009). Les lysosomes ont été considérés pendant longtemps comme des organelles de
dégradation, mais il est maintenant admis qu’ils jouent des rôles actifs dans plusieurs processus
biologiques et en particulier dans la mort cellulaire (Dell’Angelica et al., 2000).
Suite à différents types de stress ou sous l’influence d’inducteurs de mort cellulaire (TNF-α, radicaux
oxygénés, certains types de lipides (oxystérols, lysophosphatidylcholine…) ...), la perméabilité de la
membrane lysosomale est perturbée (Nilsson et al., 2006; Kurz et al., 2006). La déstabilisation de la
membrane lysosomale provoque le relargage de protéases dans le cytoplasme (Repnik & Turk,
2010). Ce phénomène a été décrit dans des cellules normales et tumorales issues de différents
organes comme les cellules promonocytaires leucémiques humaines U937 (Prunet et al., 2005), des
cellules humaines de tumeurs coliques (Roussi et al., 2007), des cellules épithéliales humaines de
rétine ARPE-19 (Malvitte et al., 2008) et des neurones de primates (Yamashima, 2000; Yamashima,
2004; Windelborn & Lipton, 2008). Les enzymes lysosomales constituent une large variété de
famille des protéase (cathepsines, nucléases, glycosidases, sulfatases et lipases) qui peuvent dégrader
des molécules essentielles pour la cellule et activer d’autres hydrolases comme les caspases et la

ETUDE BIBLIOGRAPHIQUE Mort cellulaire
56
DNAase II (Tardy et al., 2006). La relargage des protéases lysosomales, en particulier les
cathepsines provoque la mort cellulaire via des voies de signalisation aboutissant ou non à
l’activation de caspases (Guicciardi et al., 2004). Ces protéases peuvent modifier la perméabilité
mitochondriale et provoquer le relargage de molécules mitochondriales contribuant à la mort
cellulaire (Cytochrome c, AIF, Endo-G, …) (Tang et al., 2008). Le facteur qui détermine le type de
mort cellulaire dépendant du lysosome est fonction du degré de perméabilisation de ce dernier : une
forte perméabilisation aboutirait à une mort par nécrose, alors qu’une plus faible perméabilisation
conduirait soit à l’apoptose, soit à l’autophagie ou à une mort cellulaire indépendante des caspases
(Guicciardi et al., 2004; Tang et al., 2008) (Figure 19).
Dans des conditions de stress, le lysosome synthétise des radicaux °OH, ce qui peut provoquer la
rupture de la membrane lysosomale (Terman et al., 2006). Le 4-hydroxy-2-nonenal (4-HNE) est un
produit de la peroxydation lipidique, qui réagit avec des protéines lysosomales et peut provoquer leur
carbonylation. L’accumulation de ces protéines modifiées par le 4-HNE peut provoquer la rupture de
la membrane lysosomale (Marques et al., 2004; Sayre et al., 2006). L’exposition des neurones au 4-
HNE favorise leur mort via la rupture de la membrane lysosomale (Hwang et al., 2008; Castino et
al., 2007). Pour faire face au stress cellulaire, les lipases lysosomales pourraient aussi dégrader les
lipides afin de fournir l’énergie nécessaire au métabolisme (Czaja & Cuervo, 2009).
L’activation des voies métaboliques lysosomales est déjà connue comme un processus précoce dans
la maladie d’Alzheimer, où une augmentation importante du taux de cathepsine B et D ainsi que du
nombre de lysosomes a été décrite dans les neurones altérés (Yamashima & Oikawa, 2009).
L’implication du lysosome est aussi établie dans différents types de maladies neurodégénératives,
telles que la leucodystrophie métachromatique, la maladie de Krabbe, et la maladie de Niemann Pick
de type B et C (Yamashima & Oikawa, 2009).
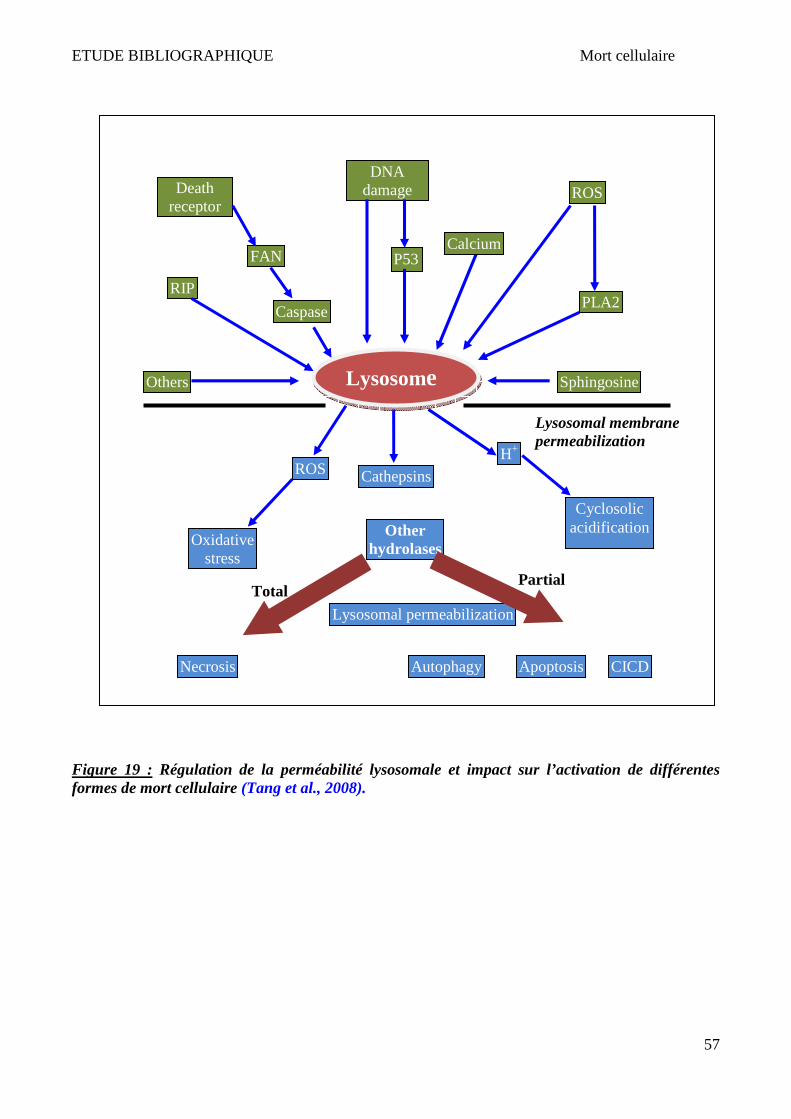
ETUDE BIBLIOGRAPHIQUE Mort cellulaire
57
Figure 19 : Régulation de la perméabilité lysosomale et impact sur l’activation de différentes formes de mort cellulaire (Tang et al., 2008).
Total Partial
Lysosomal membrane permeabilization
ROS Cathepsins
Other hydrolases Oxidative
stress
Lysosomal permeabilization
Apoptosis CICD Necrosis Autophagy
DNA damage
P53
Death receptor
RIP
Others
Caspase
FAN
Lysosomeee
ROS
Sphingosine
Calcium
PLA2
Cyclosolic acidification
H+
ETUDE BIBLIOGRAPHIQUE Mort cellulaire
58
5 X-ALD et mort cellulaire
Bien que l’accumulation des AGTLC dans les tissus et le plasma constitue le marqueur biochimique
de référence de l’X-ALD, les rôles des AGTLC dans la physiopathologie de cette maladie sont
encore peu connus (Kemp & Wanders, 2010).
Au niveau structural, il a été montré que le C26:0 peut provoquer des modifications de la membrane
cellulaire et par conséquent affecter la stabilité et les fonctions de cette membrane (Ho et al., 1995;
Knazek et al., 1983). Ainsi, le C26:0 est toxique sur les cellules adrénocorticales humaines en
provoquant une diminution de leur sensibilité vis-à-vis de l’hormone adrénocorticotropique (ACTH)
(Whitcomb et al., 1988). Par ailleurs, chez les patients atteints d’X-ALD, la microviscosité de la
membrane érythrocytaire est augmentée (Knazek et al., 1983).
Heins et al. ont montré qu’à partir de 20 µM les AGTLC (C22:0, C24:0 et C26:0) sont cytotoxiques
pour les cellules neuronales de rats en culture primaire mixte (oligodendrocytes, astrocytes et
neurones) (Hein et al., 2008). Ces AGTL provoquent des altérations dans le fonctionnement de la
mitochondrie, et des modifications du taux intracellulaire de calcium aboutissant à la mort cellulaire.
Les oligodendrocytes sont les cellules les plus sensibles aux AGTLC (Hein et al., 2008).
Parallèlement, Fourcade et al. ont décrit in vitro et in vivo que l’excès d’AGTLC (100 µM) peut
provoquer le déclenchement d’un stress oxydant, une déplétion en GSH, une diminution du potentiel
transmembranaire mitochondriale et l’activation du système enzymatique anti-oxydant (glutathion
peroxydase (Gpx), catalase, superoxyde dismutase cytosolique (Cu/Zn SOD) et mitochondriale (Mn
SOD)) (Fourcade et al., 2008). La rupture de la balance RedOx provoque l’oxydation de
macromolécules, telles que les lipides (peroxydation), les protéines (carbonylation) et l’ADN
(Fourcade et al., 2008). Il a été observé que les fibroblastes humains déficients en ABCD1 sont plus
sensibles au stress oxydant que les fibroblastes non déficients, ce qui indique que l’absence
d’ABCD1 peut altérer l’équilibre RedOx (Fourcade et al., 2008). Des nouvelles études montrent que
la cytotoxicité des AGTLC dans le SNC est due à leur capacité à former des complexes avec certains
phospholipides et notamment avec la lysophosphatidilcholine (LysoPC) (le C26:0 incorporé dans les
lysoPC est d’ailleurs utilisé comme biomarqueur de l’X-ALD) (Eichler et al., 2008 ; Hubbard et al.,
2009). L’injection de lysoPC-C24:0 dans le cortex pariétal du cerveau d’une souris provoque
l’activation et la mort des cellules microgliales, cette mort étant fonction de la longueur de chaîne
des AG (Eichler et al., 2008). L’extinction des gènes Abcd1 et Abcd2 et l’accumulation de C26:0
provoquent l’activation de 5-lipoxygénase (5-LOX) dans les astrocytes en culture primaire (Khan et
al., 2010). Dans toutes les zones du cerveau de patients atteints d’X-ALD, la 5-LOX est activée et les

ETUDE BIBLIOGRAPHIQUE Mort cellulaire
59
taux de leucotriène LTB4 (médiateurs lipidiques d’inflammation) sont augmentés (Khan et al.,
2010). Sur des cultures primaires d’hépatocytes murins ainsi que sur des cellules d’hépatome
HepG2, il a été montré que l’oléate et le plamitate induisent une lipotoxicité via la synthèse de TNF-
α dont la synthèse est augmentée suite à la déstabilisation des lysosomes (Feldstein et al., 2004).
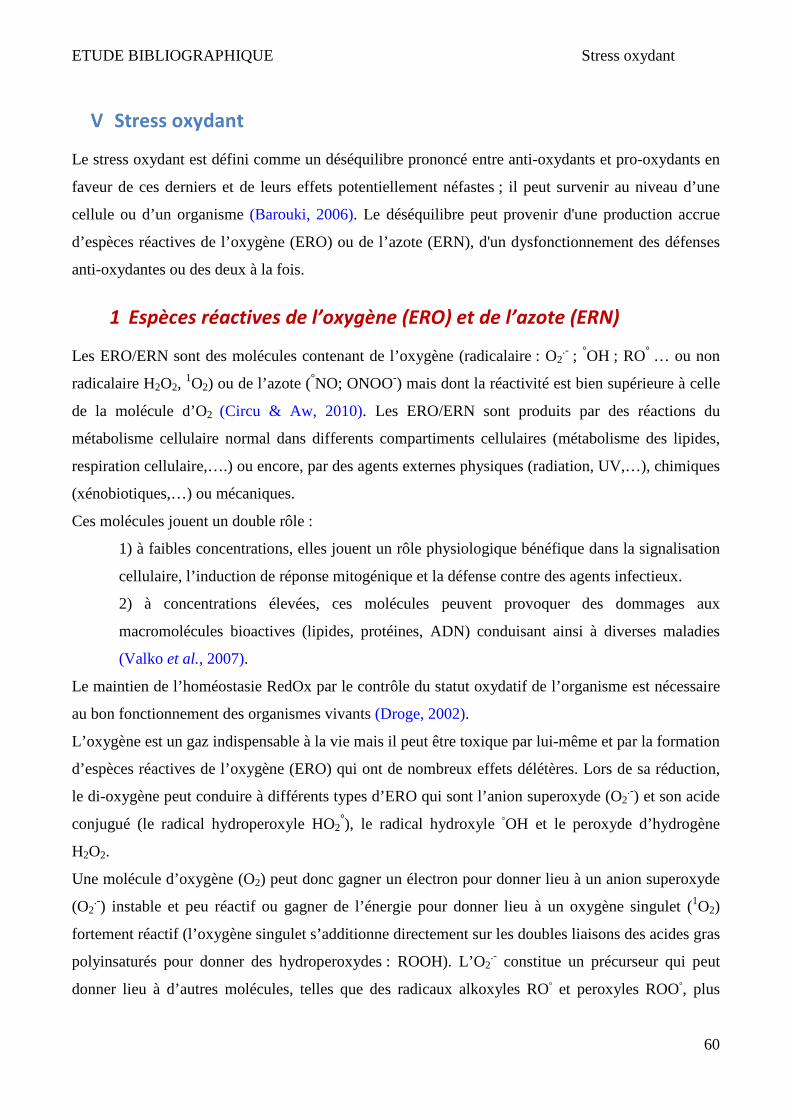
ETUDE BIBLIOGRAPHIQUE Stress oxydant
60
V Stress oxydant
Le stress oxydant est défini comme un déséquilibre prononcé entre anti-oxydants et pro-oxydants en
faveur de ces derniers et de leurs effets potentiellement néfastes ; il peut survenir au niveau d’une
cellule ou d’un organisme (Barouki, 2006). Le déséquilibre peut provenir d'une production accrue
d’espèces réactives de l’oxygène (ERO) ou de l’azote (ERN), d'un dysfonctionnement des défenses
anti-oxydantes ou des deux à la fois.
1 Espèces réactives de l’oxygène (ERO) et de l’azote (ERN)
Les ERO/ERN sont des molécules contenant de l’oxygène (radicalaire : O2.- ; °OH ; RO° … ou non
radicalaire H2O2, 1O2) ou de l’azote (°NO; ONOO-) mais dont la réactivité est bien supérieure à celle
de la molécule d’O2 (Circu & Aw, 2010). Les ERO/ERN sont produits par des réactions du
métabolisme cellulaire normal dans differents compartiments cellulaires (métabolisme des lipides,
respiration cellulaire,….) ou encore, par des agents externes physiques (radiation, UV,…), chimiques
(xénobiotiques,…) ou mécaniques.
Ces molécules jouent un double rôle :
1) à faibles concentrations, elles jouent un rôle physiologique bénéfique dans la signalisation
cellulaire, l’induction de réponse mitogénique et la défense contre des agents infectieux.
2) à concentrations élevées, ces molécules peuvent provoquer des dommages aux
macromolécules bioactives (lipides, protéines, ADN) conduisant ainsi à diverses maladies
(Valko et al., 2007).
Le maintien de l’homéostasie RedOx par le contrôle du statut oxydatif de l’organisme est nécessaire
au bon fonctionnement des organismes vivants (Droge, 2002).
L’oxygène est un gaz indispensable à la vie mais il peut être toxique par lui-même et par la formation
d’espèces réactives de l’oxygène (ERO) qui ont de nombreux effets délétères. Lors de sa réduction,
le di-oxygène peut conduire à différents types d’ERO qui sont l’anion superoxyde (O2.-) et son acide
conjugué (le radical hydroperoxyle HO2°), le radical hydroxyle °OH et le peroxyde d’hydrogène
H2O2.
Une molécule d’oxygène (O2) peut donc gagner un électron pour donner lieu à un anion superoxyde
(O2.-) instable et peu réactif ou gagner de l’énergie pour donner lieu à un oxygène singulet (1O2)
fortement réactif (l’oxygène singulet s’additionne directement sur les doubles liaisons des acides gras
polyinsaturés pour donner des hydroperoxydes : ROOH). L’O2.- constitue un précurseur qui peut
donner lieu à d’autres molécules, telles que des radicaux alkoxyles RO° et peroxyles ROO°, plus
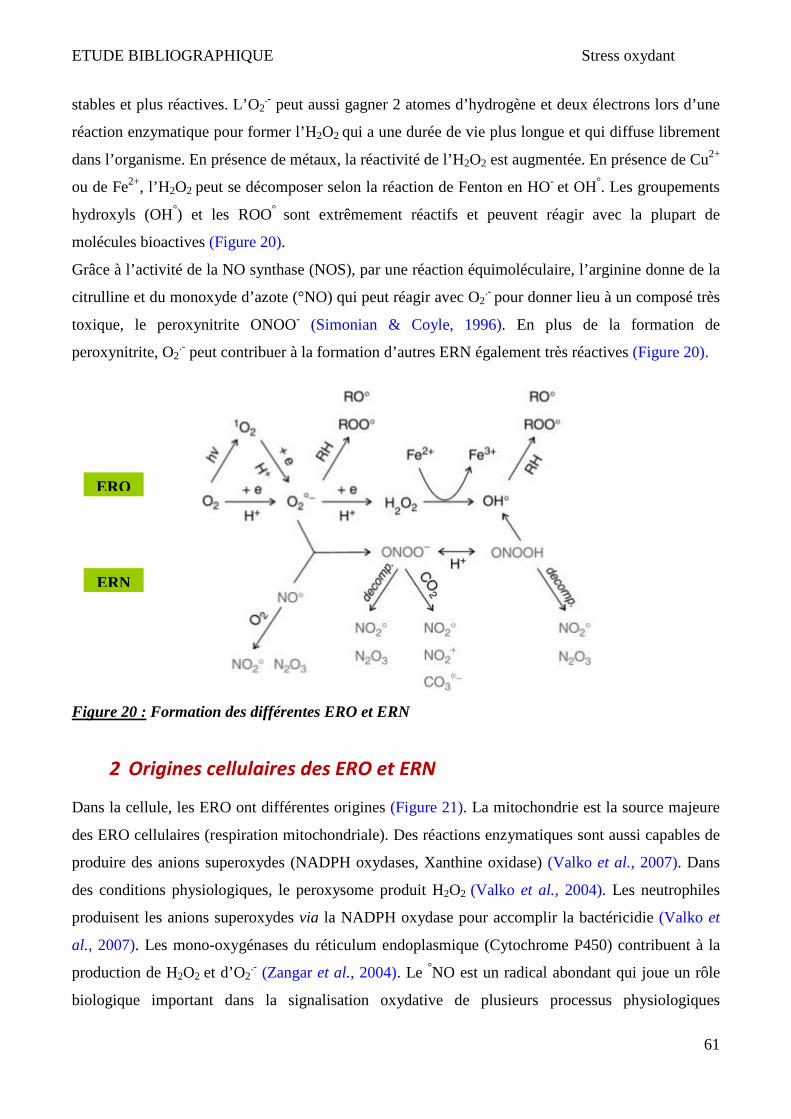
ETUDE BIBLIOGRAPHIQUE Stress oxydant
61
stables et plus réactives. L’O2.- peut aussi gagner 2 atomes d’hydrogène et deux électrons lors d’une
réaction enzymatique pour former l’H2O2 qui a une durée de vie plus longue et qui diffuse librement
dans l’organisme. En présence de métaux, la réactivité de l’H2O2 est augmentée. En présence de Cu2+
ou de Fe2+, l’H2O2 peut se décomposer selon la réaction de Fenton en HO- et OH°. Les groupements
hydroxyls (OH°) et les ROO° sont extrêmement réactifs et peuvent réagir avec la plupart de
molécules bioactives (Figure 20).
Grâce à l’activité de la NO synthase (NOS), par une réaction équimoléculaire, l’arginine donne de la
citrulline et du monoxyde d’azote (°NO) qui peut réagir avec O2.- pour donner lieu à un composé très
toxique, le peroxynitrite ONOO- (Simonian & Coyle, 1996). En plus de la formation de
peroxynitrite, O2.- peut contribuer à la formation d’autres ERN également très réactives (Figure 20).
Figure 20 : Formation des différentes ERO et ERN
2 Origines cellulaires des ERO et ERN
Dans la cellule, les ERO ont différentes origines (Figure 21). La mitochondrie est la source majeure
des ERO cellulaires (respiration mitochondriale). Des réactions enzymatiques sont aussi capables de
produire des anions superoxydes (NADPH oxydases, Xanthine oxidase) (Valko et al., 2007). Dans
des conditions physiologiques, le peroxysome produit H2O2 (Valko et al., 2004). Les neutrophiles
produisent les anions superoxydes via la NADPH oxydase pour accomplir la bactéricidie (Valko et
al., 2007). Les mono-oxygénases du réticulum endoplasmique (Cytochrome P450) contribuent à la
production de H2O2 et d’O2.- (Zangar et al., 2004). Le °NO est un radical abondant qui joue un rôle
biologique important dans la signalisation oxydative de plusieurs processus physiologiques
ERO
ERN
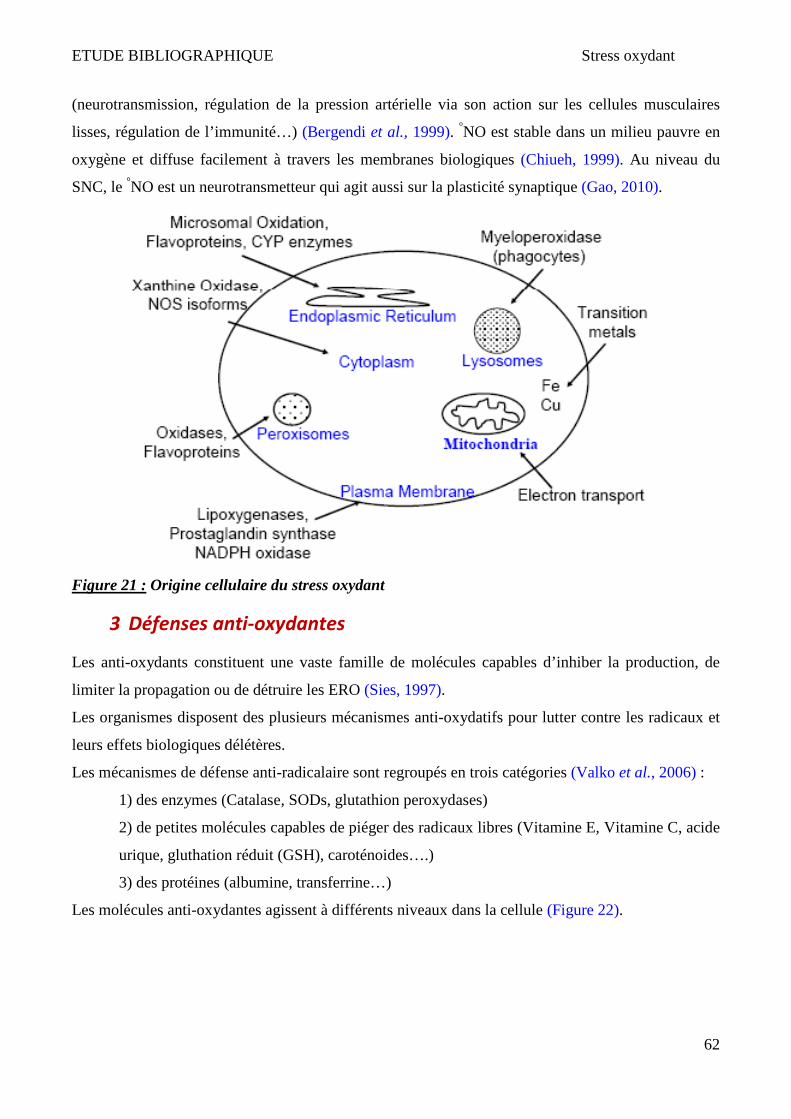
ETUDE BIBLIOGRAPHIQUE Stress oxydant
62
(neurotransmission, régulation de la pression artérielle via son action sur les cellules musculaires
lisses, régulation de l’immunité…) (Bergendi et al., 1999). °NO est stable dans un milieu pauvre en
oxygène et diffuse facilement à travers les membranes biologiques (Chiueh, 1999). Au niveau du
SNC, le °NO est un neurotransmetteur qui agit aussi sur la plasticité synaptique (Gao, 2010).
Figure 21 : Origine cellulaire du stress oxydant
3 Défenses anti-oxydantes
Les anti-oxydants constituent une vaste famille de molécules capables d’inhiber la production, de
limiter la propagation ou de détruire les ERO (Sies, 1997).
Les organismes disposent des plusieurs mécanismes anti-oxydatifs pour lutter contre les radicaux et
leurs effets biologiques délétères.
Les mécanismes de défense anti-radicalaire sont regroupés en trois catégories (Valko et al., 2006) :
1) des enzymes (Catalase, SODs, glutathion peroxydases)
2) de petites molécules capables de piéger des radicaux libres (Vitamine E, Vitamine C, acide
urique, gluthation réduit (GSH), caroténoides….)
3) des protéines (albumine, transferrine…)
Les molécules anti-oxydantes agissent à différents niveaux dans la cellule (Figure 22).

ETUDE BIBLIOGRAPHIQUE Stress oxydant
63
Figure 22 : Niveax d’action et localisation des différents effecteurs anti-oxydants
3.1 Systèmes enzymatiques
Les systèmes enzymatiques de défense anti-oxydante sont constitués de plusieurs enzymes comme
les superoxydes dismutases (SODs), la catalase ou encore la glutathion peroxydase (GPx) (Valko et
al., 2007) (Figure 23).
• Superoxydes dismutases :
Les SODs sont des métalloenzymes qui catalysent la transformation des anions superoxydes
en peroxyde d’hydrogène (Choi, 1993). Chez les mammifères, trois isoformes de SOD ont
actuellement été identifiées :
1) SOD1 ou Cu/Zn-SOD est un homodimère cytosolique prédominant dans la plupart des
types cellulaires. SOD1 représente 70 à 80% de l’activité totale de SODs. Les ions Cu2+
noyau lysosomes
peraxysomes
Vitamine E
β-carotène
catalase
Cu/Zn SOD
Vitamine E β-carotène
Bicouche lipidique de la menbrane cellulaire
Mn SOD + glutathion Peroxydase + GSH
Vitamine C
glutathion Peroxydase
GSH
Vitamine C et E β-carotène
cytoplasme
mitochondrie
Vitamine E
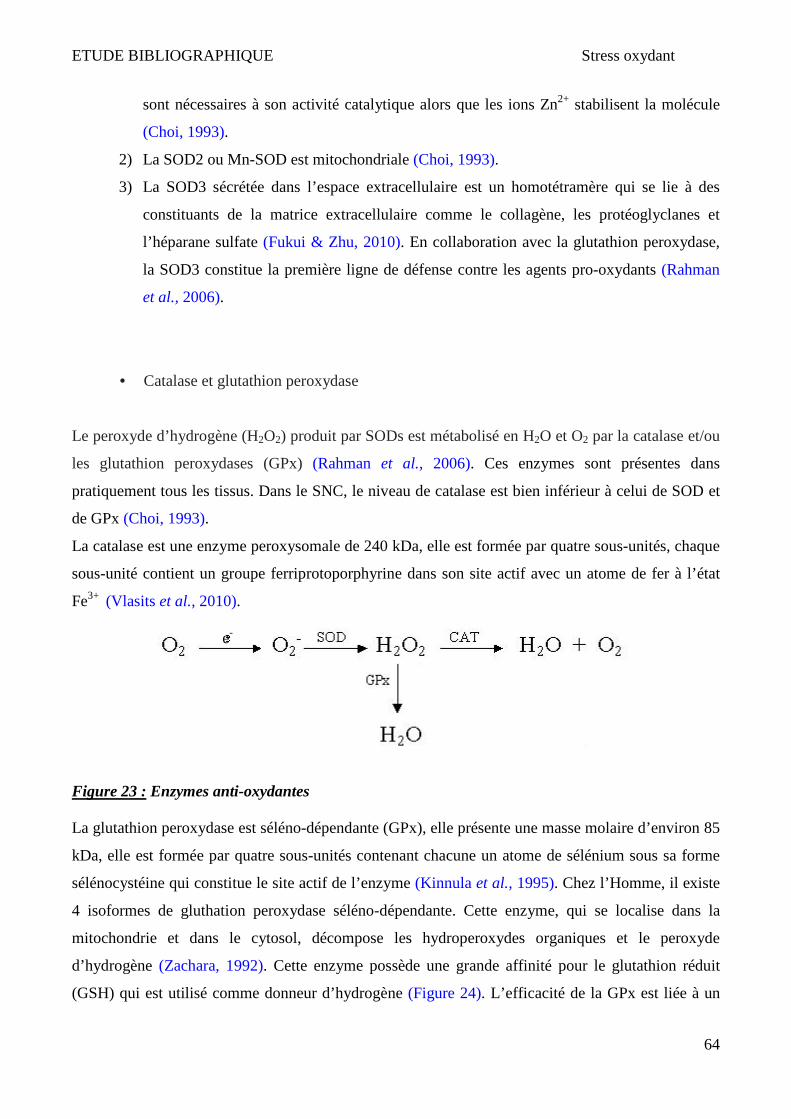
ETUDE BIBLIOGRAPHIQUE Stress oxydant
64
sont nécessaires à son activité catalytique alors que les ions Zn2+ stabilisent la molécule
(Choi, 1993).
2) La SOD2 ou Mn-SOD est mitochondriale (Choi, 1993).
3) La SOD3 sécrétée dans l’espace extracellulaire est un homotétramère qui se lie à des
constituants de la matrice extracellulaire comme le collagène, les protéoglyclanes et
l’héparane sulfate (Fukui & Zhu, 2010). En collaboration avec la glutathion peroxydase,
la SOD3 constitue la première ligne de défense contre les agents pro-oxydants (Rahman
et al., 2006).
• Catalase et glutathion peroxydase
Le peroxyde d’hydrogène (H2O2) produit par SODs est métabolisé en H2O et O2 par la catalase et/ou
les glutathion peroxydases (GPx) (Rahman et al., 2006). Ces enzymes sont présentes dans
pratiquement tous les tissus. Dans le SNC, le niveau de catalase est bien inférieur à celui de SOD et
de GPx (Choi, 1993).
La catalase est une enzyme peroxysomale de 240 kDa, elle est formée par quatre sous-unités, chaque
sous-unité contient un groupe ferriprotoporphyrine dans son site actif avec un atome de fer à l’état
Fe3+ (Vlasits et al., 2010).
Figure 23 : Enzymes anti-oxydantes La glutathion peroxydase est séléno-dépendante (GPx), elle présente une masse molaire d’environ 85
kDa, elle est formée par quatre sous-unités contenant chacune un atome de sélénium sous sa forme
sélénocystéine qui constitue le site actif de l’enzyme (Kinnula et al., 1995). Chez l’Homme, il existe
4 isoformes de gluthation peroxydase séléno-dépendante. Cette enzyme, qui se localise dans la
mitochondrie et dans le cytosol, décompose les hydroperoxydes organiques et le peroxyde
d’hydrogène (Zachara, 1992). Cette enzyme possède une grande affinité pour le glutathion réduit
(GSH) qui est utilisé comme donneur d’hydrogène (Figure 24). L’efficacité de la GPx est liée à un
e-
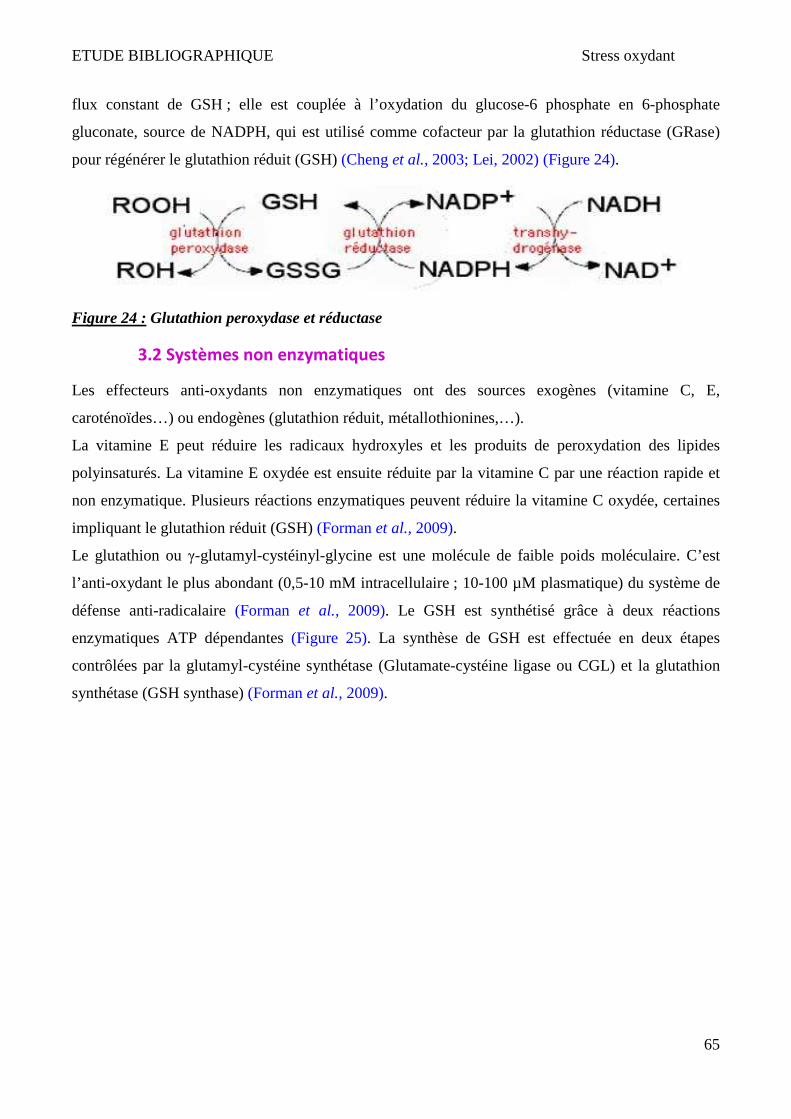
ETUDE BIBLIOGRAPHIQUE Stress oxydant
65
flux constant de GSH ; elle est couplée à l’oxydation du glucose-6 phosphate en 6-phosphate
gluconate, source de NADPH, qui est utilisé comme cofacteur par la glutathion réductase (GRase)
pour régénérer le glutathion réduit (GSH) (Cheng et al., 2003; Lei, 2002) (Figure 24).
Figure 24 : Glutathion peroxydase et réductase
3.2 Systèmes non enzymatiques
Les effecteurs anti-oxydants non enzymatiques ont des sources exogènes (vitamine C, E,
caroténoïdes…) ou endogènes (glutathion réduit, métallothionines,…).
La vitamine E peut réduire les radicaux hydroxyles et les produits de peroxydation des lipides
polyinsaturés. La vitamine E oxydée est ensuite réduite par la vitamine C par une réaction rapide et
non enzymatique. Plusieurs réactions enzymatiques peuvent réduire la vitamine C oxydée, certaines
impliquant le glutathion réduit (GSH) (Forman et al., 2009).
Le glutathion ou γ-glutamyl-cystéinyl-glycine est une molécule de faible poids moléculaire. C’est
l’anti-oxydant le plus abondant (0,5-10 mM intracellulaire ; 10-100 µM plasmatique) du système de
défense anti-radicalaire (Forman et al., 2009). Le GSH est synthétisé grâce à deux réactions
enzymatiques ATP dépendantes (Figure 25). La synthèse de GSH est effectuée en deux étapes
contrôlées par la glutamyl-cystéine synthétase (Glutamate-cystéine ligase ou CGL) et la glutathion
synthétase (GSH synthase) (Forman et al., 2009).
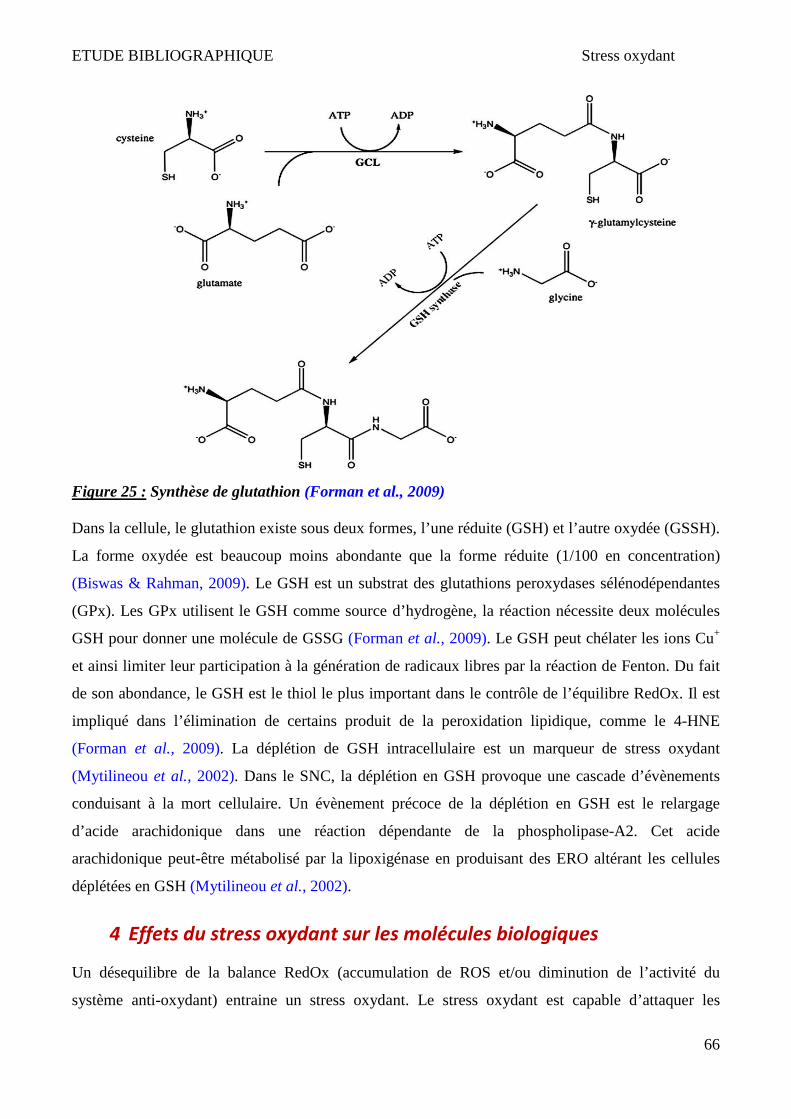
ETUDE BIBLIOGRAPHIQUE Stress oxydant
66
Figure 25 : Synthèse de glutathion (Forman et al., 2009) Dans la cellule, le glutathion existe sous deux formes, l’une réduite (GSH) et l’autre oxydée (GSSH).
La forme oxydée est beaucoup moins abondante que la forme réduite (1/100 en concentration)
(Biswas & Rahman, 2009). Le GSH est un substrat des glutathions peroxydases sélénodépendantes
(GPx). Les GPx utilisent le GSH comme source d’hydrogène, la réaction nécessite deux molécules
GSH pour donner une molécule de GSSG (Forman et al., 2009). Le GSH peut chélater les ions Cu+
et ainsi limiter leur participation à la génération de radicaux libres par la réaction de Fenton. Du fait
de son abondance, le GSH est le thiol le plus important dans le contrôle de l’équilibre RedOx. Il est
impliqué dans l’élimination de certains produit de la peroxidation lipidique, comme le 4-HNE
(Forman et al., 2009). La déplétion de GSH intracellulaire est un marqueur de stress oxydant
(Mytilineou et al., 2002). Dans le SNC, la déplétion en GSH provoque une cascade d’évènements
conduisant à la mort cellulaire. Un évènement précoce de la déplétion en GSH est le relargage
d’acide arachidonique dans une réaction dépendante de la phospholipase-A2. Cet acide
arachidonique peut-être métabolisé par la lipoxigénase en produisant des ERO altérant les cellules
déplétées en GSH (Mytilineou et al., 2002).
4 Effets du stress oxydant sur les molécules biologiques
Un désequilibre de la balance RedOx (accumulation de ROS et/ou diminution de l’activité du
système anti-oxydant) entraine un stress oxydant. Le stress oxydant est capable d’attaquer les
ETUDE BIBLIOGRAPHIQUE Stress oxydant
67
macromolécules (lipides, protéines, glucides, ADN) en provoquant des changements structuraux et
fonctionnels participant à l’évolution des pathologies (Curtin et al., 2002; Valko et al., 2006).
4.1 Effets des ERO/ERN sur les lipides
Les métaux (cuivre, fer...) sont utilisés comme des agents initiateurs de l’oxydation des lipides par
l’intermédiaire de la réaction de Fenton. Le radical hydroxyle généré par la réaction de Fenton est
essentiel pour la peroxydation lipidique. Le mécanisme, proposé par Bucher et al. implique la
formation d'un complexe Fe (II) : Fe (III). Le taux maximal de la peroxydation lipidique est observé
lorsque le rapport de Fe (II) : Fe (III) est de 1:1 (Bucher et al., 1983). Le processus global de la
peroxydation lipidique se compose de trois étapes: initiation, propagation et terminaison présentées
dans la Figure 26. La peroxydation lipidique est une réaction en chaine initiée par l’arrachement d’un
atome d’hydrogène par HO° ou O2.- à des esters d’acides gras insaturés isolés ou constituants des
membranes lipidiques (Valko et al., 2006). Le radical carboné du constituant lipidique tend alors à se
déstabiliser par un réarrangement conduisant à un diène conjugué. Celui-ci réagit avec O2 pour
former un radical peroxyl qui peut être réduit en hydroperoxyde (stable et peu réactif en absence de
métal) ou pour arracher un atome d’hydrogène à un autre acide gras ce qui génère un nouveau radical
lipidique. Les principaux produits générés par cette réaction sont le malonedialdéhyde (MDA)
(Figure 26) et 4-hydroxy-2-nonenal (4-HNE) (Valko et al., 2006). La peroxydation des lipides est un
processus auto-catalytique qui est résilié par la recombinaison des radicaux (R• + R • → produit non-
radicalaire) ou l’absence de substrat (Valko et al., 2006).
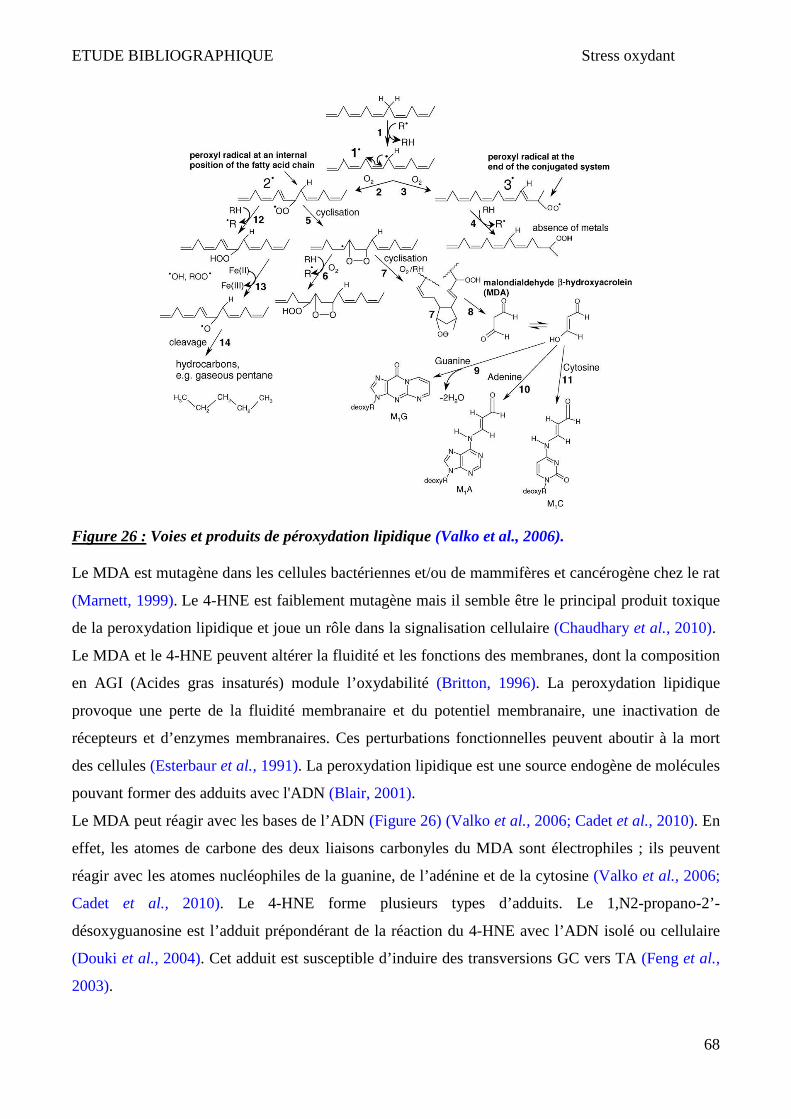
ETUDE BIBLIOGRAPHIQUE Stress oxydant
68
Figure 26 : Voies et produits de péroxydation lipidique (Valko et al., 2006). Le MDA est mutagène dans les cellules bactériennes et/ou de mammifères et cancérogène chez le rat
(Marnett, 1999). Le 4-HNE est faiblement mutagène mais il semble être le principal produit toxique
de la peroxydation lipidique et joue un rôle dans la signalisation cellulaire (Chaudhary et al., 2010).
Le MDA et le 4-HNE peuvent altérer la fluidité et les fonctions des membranes, dont la composition
en AGI (Acides gras insaturés) module l’oxydabilité (Britton, 1996). La peroxydation lipidique
provoque une perte de la fluidité membranaire et du potentiel membranaire, une inactivation de
récepteurs et d’enzymes membranaires. Ces perturbations fonctionnelles peuvent aboutir à la mort
des cellules (Esterbaur et al., 1991). La peroxydation lipidique est une source endogène de molécules
pouvant former des adduits avec l'ADN (Blair, 2001).
Le MDA peut réagir avec les bases de l’ADN (Figure 26) (Valko et al., 2006; Cadet et al., 2010). En
effet, les atomes de carbone des deux liaisons carbonyles du MDA sont électrophiles ; ils peuvent
réagir avec les atomes nucléophiles de la guanine, de l’adénine et de la cytosine (Valko et al., 2006;
Cadet et al., 2010). Le 4-HNE forme plusieurs types d’adduits. Le 1,N2-propano-2’-
désoxyguanosine est l’adduit prépondérant de la réaction du 4-HNE avec l’ADN isolé ou cellulaire
(Douki et al., 2004). Cet adduit est susceptible d’induire des transversions GC vers TA (Feng et al.,
2003).

ETUDE BIBLIOGRAPHIQUE Stress oxydant
69
Le 4-HNE est toxique pour les oligodendrocytres et pour les axones. Sur des oligodendrocytes en
culture, la cytotoxicité de 4-HNE est dépendante du temps et de la concentration. In vivo, après
l’injection de 4-HNE dans le cerveau de souris, la réactivité contre la β-APP (marqueur de dommage
de l’axone) est augmentée. Cela indique que la peroxydation lipidique et la production des 4-HNE
dans le cerveau est toxique à la fois pour les oligodendrocytes et pour les neurones (McCracken et
al., 2000).
Les radicaux libres induisent l’oxydation du cholestérol. L’auto-oxydation du cholestérol a lieu
préférentiellement sur le cycle B, formant les 7-hydroxycholestérols (α et β), le 7-cétocholestérol, les
epoxydes 5,6 (5α, 6α et 5β, 6β) et le cholestantériol (Brown & Jessup, 2009). Le 7-cétocholestérol
qui est le principal oxystérol issu de l’auto-oxydation du cholestérol semble être un bon marqueur du
stress oxydant (Dyer et al., 1997; Brown & Jessup, 2009) (Figure 27). Comme le cerveau est
l’organe le plus riche en cholestérol, il n’est pas donc surprenant qu’il contienne beaucoup
d’oxystérols quand il est le siège d’une rupture de l’équilibre RedOx.
Figure 27 : Voies et produits d’oxydation du cholésterol enzymatiques et non enzymatiques (Brown & Jessup, 2009)
4.1.1 Oxystérols et dégénérescence neuronale
La myéline est un complexe contenant 70 % de lipides (Björkhem et Meaney, 2004 ; Taylor
et al., 2004). Elle est composée de cholestérol, de phospholipides et de glycosphingolipides dans un
rapport molaire 4 : 4 : 2 (Björkhem et Meaney, 2004). Dans le SNC, la myéline est formée par
extension des membranes des oligodendrocytes et permet la bonne conduction de l'influx nerveux.

ETUDE BIBLIOGRAPHIQUE Stress oxydant
70
Sa fonction est donc primordiale pour le développement et la fonctionnalité du SNC. Le cholestérol,
qui est un lipide impliqué dans de nombreuses fonctions cellulaires, est aussi un régulateur majeur de
l’organisation structurale lipidique et de voies de signalisation cellulaire. C’est également un
précurseur de neurostéroïdes. Au niveau des cellules du SNC le cholestérol présent, qui résulte d’une
synthèse endogène très finement régulée, assume donc des activités biologiques majeures. Lors de
dysfonctionnement des cellules du SNC, son oxydation peut conduire à la formation de composés
toxiques comme le 7-cétocholestérol (7KC) et le 7β-hydroxycholestérol (7β). Des patients avec une
sclérose en plaque ont montré de fortes concentrations de 7KC dans leurs liquides céphalorachidiens
(Diestel et al., 2003). Le 7KC pourrait donc jouer un rôle majeur dans la démyélinisation observée
dans les scléroses en plaque (Leoni et al., 2005 ; Carter, 2007).
Dans la maladie d'Alzheimer, le peptide Aβ est un important composant des plaques amyloïdes. Le
24-hydroxycholestérol (24OH), produit par la 24-hydrolase (CYP46) à partir du cholestérol, peut se
fixer sur le peptide Aβ et les patients atteints d'Alzheimer montrent le plus souvent des taux de
24OH diminuant avec l’avancée de la maladie (Kristofikova et al., 2007). Il pourrait donc jouer un
rôle crucial dans le développement de la pathologie. Le 27-hydroxycholestérol (27OH) est l'oxystérol
majeur produit par réaction enzymatique (CYP27) au niveau périphérique. Dans la maladie
d’Alzheimer, le 27OH passe la barrière hématoméningée et s’accumule dans le SNC. Dasari et al.
ont montré que ce composé était capable d'activer le clivage et la production du peptide Aβ dans des
cellules épithéliales humaines de rétine (ARPE-19). Sur ces même cellules, le 27OH est également
capable d'induire un stress du réticulum endoplasmique, une activation de la caspase 12 et un stress
oxydatif (Dasari et al., 2010). La dérégulation métabolique du cholestérol pourrait contribuer à la
formation d'oxystérols et donc au développement de nombreuses maladies neurodégénératives
inflammatoires.
Dans ce contexte, Weinhofer et al. ont montré en 2005, une augmentation du cholestérol plasmatique
dans des souris X-ALD, et également une régulation du taux de C26:0 par le cholestérol (Weinhofer
et al., 2005).
Weinhofer et al. ont également décrit que le cholestérol régule l'expression du gène ABCD2
(Weinhofer et al., 2002). En effet, dans des cultures de fibroblastes humains, les auteurs ont décrit
une induction de l'expression du gène ABCD2 après déplétion des stérols via l'activation de SREBPs
(Sterol regulatory Element Binding Proteins), facteur de transcription régulant le métabolisme du
cholestérol. De plus, cette induction du gène ABCD2, réduit significativement les taux d'AGTLC
dans des fibroblastes X-ALD. La protéine ABCD2 est un transporteur ABC montrant une forte
homologie de séquence avec ABCD1. Depuis quelques années, ABCD2 est devenue une cible
ETUDE BIBLIOGRAPHIQUE Stress oxydant
71
thérapeutique potentielle puisque sa surexpression dans des souris ABCD1 déficientes permet de
restaurer les taux plasmatiques d'AGTLC (Pujol et al., 2004).
Plus récemment, des travaux ont révélé une augmentation de marqueurs du stress oxydant (adduits
glyoxal, methylglyoxal, 4-hydroxynonenal et malondialdehyde se fixant sur les protéines lors de
stress oxydants) dans des extraits de moelles épinières de souris ABCD1- et dans des fibroblastes X-
ALD comparés à des souris sauvages ou à des fibroblastes contrôles. Ces travaux ont également
montré une diminution d'expression de protéines impliquées dans la détoxification des ERO (SOD1,
SOD2, Gpx4) dans le cortex de souris ABCD1- comparées aux souris sauvages (Fourcade et al.,
2008). Le C26:0 potentialise le stress oxydant observé sur des fibroblastes X-ALD comparés aux
fibroblastes contrôles (Fourcade et al., 2008).
D'après ces données, les mutations du gène ABCD1, responsable de l'X-ALD, pourraient conduire à
la dérégulation du métabolisme du cholestérol et à la production de stress oxydants. Les ERO ainsi
produites pourraient alors contribuer à oxyder le cholestérol intracellulaire et le cholestérol présent
dans la gaine de la myéline et conduire à la formation d'oxystérols. Les 7-OH, composés toxiques,
pourraient donc participer au développement de l'X-ALD. Dans ce contexte et pour évaluer cette
hypothèse, nous avons cherché à préciser si les 7-OH (en particulier le 7KC et le 7β) pouvaient
activer la mort d’oligodendrocytes.
4.1.2 Oxystérols et homéostasie du cholestérol
Le cholestérol est un dérivé cyclopentanoperhydrophénantrènique. Il est présent dans les
tissus, dans les lipoprotéines plasmatiques sous forme libre ou combiné à un acide gras pour former
un ester de cholestérol. Ces esters de cholestérol sont la forme de stockage et de transport du
cholestérol. Le cholestérol a un rôle structural : il est présent dans les membranes cellulaires des
animaux aux cotés des phospholipides, et en moindre quantité, dans la membrane des organites. Il
possède également un rôle métabolique en étant le précurseur de la synthèse des acides biliaires
(indispensables à la digestion des lipides) dans le foie, des hormones stéroïdiennes dans les organes
stéroïdogènes (corticosurrénales, gonades et placenta), et de la vitamine D dans la peau. Son
métabolisme a lieu dans l'intestin, le foie, les tissus périphériques puis il est transporté via les
lipoprotéines. Le cholestérol est aussi un régulateur important de l'homéostasie lipidique et de la
signalisation cellulaire. C’est également un composé majeur de la myéline. La dérégulation de son
homéostasie peut aboutir à la surproduction d'oxystérols qui sont des dérivés du cholestérol. Ils
contiennent un second atome d'oxygène au niveau des groupes carbonyl, hydroxyl ou epoxyde. In

ETUDE BIBLIOGRAPHIQUE Stress oxydant
72
vivo, les oxystérols agissent comme des intermédiaires dans le catabolisme du cholestérol, comme
régulateurs du métabolisme lipidique et comme des stérols toxiques ayant des effets pro-athérogènes
(Massey et al., 2006). Jusqu'à maintenant, les oxystérols ont été décrits comme ayant de nombreuses
activités : apoptose, nécrose, inflammation, immunosuppression... (Guardiola et al., 1996 ; Brown et
Jessup, 1999 ; Schroepfer, 2000). Les oxystérols les plus souvent détectés in vivo sont le 7KC, le 7α
et le 7β (Brown et Jessup, 1999). Les oxystérols proviennent de réactions chimiques diverses et
d'oxydations enzymatiques. Mais les oxystérols peuvent également provenir de la nourriture,
notamment les nourritures riches en cholestérol comme les œufs, les produits laitiers (beurre,
fromages...), la viande rouge (bœuf, porc, veau), de foies, des reins et de poissons séchés. En effet, le
cholestérol présent dans ces aliments peut être sujet à des radiations et à des hautes températures
favorisant son oxydation en oxystérols. Certains oxystérols sont synthétisés par les tissus après
réaction enzymatique grâce à la 27-hydroxylase (pour le 27OH), la 25-hydroxylase (pour le 25OH)
ou la 24-hydroxylase (pout le 24OH) par exemple. La synthèse la plus néfaste pour l’organisme est
sans doute la synthèse par auto-oxydation puisqu'elle n'est pas régulée et à lieu dans les lésions
(zones démyélinisées) présentant de forts stress oxydants. En effet, les radicaux libres peuvent
induire l'oxydation du cholestérol présent dans les LDLs (Low Density Lipoprotein). Cette auto-
oxydation du cholestérol génère préférentiellement des dérivés oxydés en position 7, c'est-à-dire des
7-hydroxycholestérols : les 7-OH. Ces 7-OH sont composés de trois membres : le 7-cétocholestérol
(7KC), le 7α-hydroxycholestérol (7α) et le 7β-hydroxycholestérol (7β).
Le 7KC et le 7β ont largement été démontrés comme ayant des activités néfastes à fortes
concentrations (Vejux et al., 2008 ; Vejux et Lizard, 2009). Le 7KC induit, dans de nombreux types
cellulaires, la mort par apoptose dépendante ou indépendante de la caspase 3 (Prunet et al., 2005),
une accumulation de lipides neutres et polaires (Vejux et al., 2005), un stress du réticulum
endoplasmique (Pedruzzi et al., 2004), un fort stress oxydant (Biasi et al., 2004 ; Larsson et al.,
2006). Les effects du 7β sont identiques à ceux observés avec le 7KC aux mêmes concentrations (Li
et al., 2005). Le 7α et le 27OH ont été testés sur les mêmes lignées cellulaires et il a été montré que
ni l'un ni l'autre n'induisait la mort par apoptose, une surproduction d'espèces réactives de l'oxygène,
ou une peroxydation lipidique (Miguet-Alfonsi et al., 2002). Seule une publication a rapporté des
effets néfastes du 27OH in vitro (Dasari et al., 2010).
Le 7KC et le 7β sont les oxystérols les plus fréquemment retrouvés au niveau des lésions, qu'elles
soient athéromateuses ou au niveau du SNC dans les zones démyélinisées de maladies
neurodégénératives. Ces deux oxystérols sont extrêmement toxiques ; leur surproduction pourrait
donc contribuer au développement des pathologies neurodégénératives démyélinisantes et même les
ETUDE BIBLIOGRAPHIQUE Stress oxydant
73
potentialiser. Le 27OH s’accumule dans le SNC (Björkhem et al., 2006a ; Björkhem, 2006b), dans
les cas de rupture de la barrière hémato-encéphalique. Cet oxystérol, contrairement au 7KC et au 7β,
n'a jamais été décrit comme possèdant des activités toxiques in vivo (apoptotiques, pro-oxydantes ou
inflammatoire), alors qu'il est fortement retrouvé au niveau des lésions du SNC.
Le 7KC a été montré comme s'accumulant, dans la membrane plasmique, au niveau des
microdomaines lipidiques (Royer et al., 2009). En revanche, aucun travail n'a montré le même
phénomène pour le 27OH et le 7β.
4.2 Effets des ERO/ERN sur les protéines
Les protéines sont des constituants cellulaires structuraux et fonctionnels de la cellule. Les réactions
des protéines avec des espèces radicalaires peuvent provoquer leur oxydation principalement au
niveau des résidus cystéine, méthionine, thyrosine, tryptophane, phénylalanine, valine, leucine,
histidine, glutamine, proline, thréonine, arginine et lysine (Stadtman, 1992; Stadtman et al., 1992).
Les protéines les plus sensibles aux attaques radicalaires sont surtout celles qui comportent un
groupement sulfhydryle (SH) (enzyme anti-oxydante). C'est le cas de nombreuses enzymes
cellulaires et de protéines de transport qui vont ainsi être oxydées et inactivées (Valko et al., 2006).
Les produits de la peroxydation lipidique (4-HNE et MDA) peuvent contribuer à l’oxydation des
protéines, en particulier au niveau des résidus histidine, cystéine et lysine (Maier et al., 2010). Les
protéines modifiées par oxydation deviennent beaucoup plus sensibles à l'action des protéases (Valko
et al., 2006). Les changements sutructuraux des protéines oxydées altèrent l’integrité des membranes
cellulaires, ainsi que les propriétés fonctionnelles et antigéniques des protéines membranaires
(Gruber et al., 2006; Jacob et al., 2006). Les carbonyles sont utilisés comme des marqueurs de
l’oxydation des protéines et de façon générale comme des marqueurs du stress oxydant (Nakamura et
al., 2010). Les réactions des protéines avec les ERO peuvent conduire à la formation de nouveaux
radicaux organiques alcoxyles ou peroxyles (Davies et al., 1995). Ces radicaux peuvent endommager
l’ADN; c’est à dire créer des pontes entre les protéines et les bases de l’ADN et provoquer des
dommages oxydatifs, comme la 8-oxo-7,8-dihydroguanine (Furukawa et al., 2005).
L’oxydation des protéines est liée à plusieurs maladies et à l’âge. Le processus de vieillissement est
le plus souvent lié à une accumulation de protéines oxydées, l’accumulation est due à 1) une
augmentation de taux ERO/ERN dans l’organisme, 2) à une défaillance du système anti-oxydant
et/ou 3) à une diminution de la capacité du système de degradation des protéines oxydées (Valko et
al., 2006).
ETUDE BIBLIOGRAPHIQUE Stress oxydant
74
4.3 Effets des ERO/ERN sur les glucides
L’oxydation du glucose conduit à la libération d’aldéhydes et de peroxyde d’hydrogène. Cette
oxydation entraîne la glycation des protéines par attachement d’un aldéhyde conduisant à la coupure
de la chaîne protéique. La glycation des protéines favorise leur réaction avec l’oxygène pour former
des ERO (Hunt & Wolff, 1991).
4.4 Effets des ERO/ERN sur l’ADN
La stabilité du génome est essentielle pour maintenir une homéostasie des cellules et de l’organisme,
mais il est soumis à de nombreuses menaces. Les ERO représentent une menace omniprésente et
continue pour le génome. Les produits d’oxydation de l'ADN peuvent affecter la stabilité du génome.
Les lésions oxydatives de l'ADN peuvent être efficacement réparées par excision des bases ou des
nucléotides. Si le taux d’ERO dépasse la capacité du sytème anti-oxydant à maintenir un équilibre
RedOx, la capacité de la réparation de l’ADN par les cellules peut être submergée, ce qui conduit à
l'accumulation de dommages à l'ADN par oxydation (Sedelnikova et al., 2010). Plusieurs classes de
dommages à l’ADN sont décrites : la coupure simple ou double brin, la génération de bases
modifiées comme la 8-oxoguanine (8-OHdG) (Figure 28), les pontages ADN-ADN et ADN-
protéines et les sites abasiques (Radak & Boldogh, 2010).
Le radical °OH est très électrophile et donc réagit préférentiellement en position 5 du cycle de la
thymine ou de la cytosine. Le radical °OH peut également réagir avec le groupement méthyl de la
thymine en arrachant un atome d’hydrogène conduisant à la formation d’un radical allylique. Ces
radicaux formés vont réagir avec l’oxygène pour former des radicaux peroxyles. Les purines sont
plus sensibles aux ERO en particulier la guanine. Le premier mécanisme conduisant à la formation
de 8-OHdG à partir de la guanidine implique l’arrachement d’un électron à la guanine et la formation
d’un cation radical. L’oxygène singulet conduit spécifiquement à la formation de 8-OHdG. A
l’inverse du radical hydroxyle, qui peut réagir avec l’ensemble des bases, l’oxygène singulet réagit
avec la guanine uniquement (Cadet et al., 2010). La formation de la 8-OHdG est considérée comme
un biomarqueur du stress oxydant de l’ADN (Valko et al., 2006).

ETUDE BIBLIOGRAPHIQUE Stress oxydant
75
Figure 28 : Différentes voies d’oxydation de la guanine conduisant à différent produits
5 Maladies associées à un stress oxydant
Le stress oxydant est impliqué dans plusieurs pathologies comme les maladies cardiovasculaires, les
maladies neurodégénératives, le diabètes et le cancer mais également dans le vieillissement (Valko et
al., 2007; Barouki, 2006; Salmon et al., 2010).
5.1 Maladies neurodégénératives
Dans la maladie d’Alzheimer, l’oxydation des lipides et des protéines est importante. L’altération de
l’ADN mitochondrial et l’augmentation de l’activité Cu/Zn SOD sont décrites dans le cerveau de
patients atteints de la maladie d’Alzheimer. Les ERO peuvent oxyder l’APP (amyloïde protein
precurseur) entrainant son dépôt et son agrégation (Smith et al., 1995). Dans la maladie de
Parkinson, la diminution de GSH et de l’activité du complexe-I de la chaîne respiratoire
mitochondriale a été rapportée (Di Monte et al., 1992).
5.2 Diabète
Une augmentation du stress oxydant a été proposée pour être une complication majeure associée à
l’hyperglycémie. L’hyperglycémie stimule la production d’ERO à partir de sources variées (NADPH
oxydase, cytochrome P450 monooxygénases, nitric oxyde synthase (NOS)) entraînant une auto-
oxydation du glucose (Valko et al., 2007).

ETUDE BIBLIOGRAPHIQUE Stress oxydant
76
5.3 Cancer
Dans plusieurs types de cancer l’équilibre RedOx est rompu ce qui peut provoquer une stimulation
de l’oncogénèse. Le stress oxydant provoque des dommages permanents à l’ADN ce qui représente
la première étape dans la mutagenèse et la carcinogénèse. Les dommages à l’ADN provoqués par les
ERO peuvent être une modification des bases (oxydation, alkylation…), une coupure de la chaîne
(simple ou double brin), ou encore des pontages ADN-protéines (Cadet et al., 2010). La lésion à
l’ADN résultant d’une oxydation, la plus étudiée est la formation de la 8-Oxo-guanine (Cadet et al.,
2010).
6 X-ALD, AGTLC et Oxydation
L’augmentation du stress oxydatif a été rapportée chez les patients atteints de CALD et d’AMN.
Cela se traduit par une augmentation de la peroxydation lipidique (TBA-RS), une diminution de la
réactivité anti-oxydante totale (TAR) dans le plasma et par une augmentation de l’activité anti-
oxydante de la catalase et de la SOD (Vargas et al., 2004). Le statut anti-oxydant total (TAS) est
diminué chez les patients atteint d’X-ALD symptomatiques mais pas chez les patients
asymptomatiques (Deon et al., 2007). Au niveau du cerveau de patients atteints d’X-ALD, le stress
oxydant provoque une peroxydation des lipides qui se manifeste par l’augmentation du taux de 4-
HNE, qui est un aldéhyde issu de l’attaque radicalaire des acides gras polyinsaturés (AGPI) (Powers
et al., 2005). Récemment, des dommages aux protéines ont été également rapportés dans les cellules
mononucléaires périphériques de patients atteints d’X-ALD (Fourcade et al., 2010). La corrélation
entre le taux d’AGTLC plasmatique et les marqueurs du stress oxydant dans le plasma n’est pas
évidente (Deon et al., 2008). L’expression d’iNOS est augmentée dans les astrocytes et les cellules
microgliales de patients atteints d’X-ALD conduisant à une augmentation de la nitration des
protéines dans les lésions inflammatoires (Gilg et al., 2000). Chez les patients atteints d’X-ALD, la
synthèse de plasmalogène est diminuée, or le plasmalogène a un pouvoir anti-oxydant dans le SNC
(Khan et al., 2008). La diminution de la synthèse de plasmalogène peut donc avoir un effet
synergique avec l’accumulation d’AGTLC dans la production des ERO (Singh & Pujol, 2010). Chez
les souris déficientes en Abcd1 des dommages oxydatifs sur les lipides et les protéines ont été révélés
à l’âge de 3,5 mois, soit un an avant la première apparition de signes neurologiques (Fourcade et al.,
2008). La mitochondrie, qui est la première source d’ERO dans la cellule, est modifiée
structuralement mais aussi fonctionnellement (métabolisme des AG) chez les patients atteints d’X-
ALD et chez les souris déficientes en Abcd1 (Ferrer et al., 2010).
ETUDE BIBLIOGRAPHIQUE Stress oxydant
77
7 X-ALD, AGTLC et Inflammation
L’inflammation et l’altération des réponses immunitaires existent uniquement dans la forme le plus
sévère de l’X-ALD (CCALD). L’inflammation se caractérise par l’infiltration de lymphocytes T
CD8+ majoritairement, mais aussi de lymphocytes CD4+ et de lymphocytes B. On observe aussi des
macrophages qui se localisent dans les zones présentant une démyélinisation. L’infiltration de ces
cellules est souvent accompagnée d’une rupture de la barrière hématoméningée. Dans les zones avec
démyélinisation, la microglie et les astrocytes sont hyper-réactifs et expriment la molécule CD1b (Ito
et al., 2001). Le CD1 est une molécule présentatrice de l’antigène lipidique aux cellules
immunocompétentes. Il a donc été suggéré que l’expression de CD1 par des cellules gliales, suite à
l’accumulation des AGTLC, pourrait participer à la réponse inflammatoire dans la CALD (Ito et al.,
2001). Une autre hypothèse proposée par Powers et al. (Powers et al., 1992) suggère que l’excès
d’AGTLC stimule les astrocytes et les macrophages et provoque la sécrétion de TNFα, ainsi que de
tout un panel de cytokines conduisant à la destruction de la myéline par les lymphocytes T
principalement, mais aussi par les lymphocytes B. En accord avec cette hypothèse, il a été montré
une augmentation des taux d’ARNm des cytokines (INF-γ, IL-1α, IL-12, IL-6, GM-CSF, TNFα), des
chemokines et de leurs récepteurs dans les lésions cérébrales de patients atteints d’X-ALD
(McGuinness et al., 1997; Paintlia et al., 2003).
ETUDE BIBLIOGRAPHIQUE Modèles d’études
78
VI Modèles d’études
Deux types de modèles sont utilisés : des modèles in vitro et des modèles animaux.
In vitro, plusieurs modèles (vésicules lipidiques, cultures primaires mixtes ou non, lignées cellulaires
sauvages ou transfectées par des siRNA) ont été utilisés pour étudier les mécanismes d’intégration
des AGTLC dans la membrane cellulaire et leur cytotoxicité. Plusieurs modèles animaux des
maladies peroxysomales ont été générés afin d’étudier et de mieux comprendre la physiopathologie
de ces maladies (Wanders & Waterham, 2006a).
1 In vitro
1.1 Vésicules lipidiques
L’équipe de James Hamilton a été la première à utiliser une approche biophysique pour étudier
l’effet des AGTLC dans la membrane lipidique. Des vésicules lipidiques (bicouche lipidique de
phosphatidylcholine) ou des vésicules mélangées avec de l’albumine bovine sérique (BSA) ont été
utilisées pour étudier l’interaction de C26:0 avec une membrane modélisée. Il semble que la partie
hydrophobe de C26:0 s’intègre profondément dans la membrane et provoque une désorganisation et
une rupture de cette dernière (Ho et al., 1995). L’AGTLC traverse cette membrane synthétique par
un mécanisme de « flip-flop » (Pillai et al., 2009).
1.2 Lignées cellulaires
Plusieurs lignées astrocytaires et oligodendrocytaires (Buntinx et al., 2003; Bongarzone et al., 1997;
Verity et al., 1993; Feutz et al., 1995; Feutz et al., 2001; Ghandour et al., 2002) présentent un intérêt
pour aborder la physiopathologie de l’X-ALD in vitro.
La lignée de cellules gliales des rats (C6) exprimant à la fois des marqueurs astrocytaires et
oligodendrocytaires a été largement utilisée pour étudier les effets cytotoxiques du C26:0 et ses
activités sur le cytosquelette, l’homéostasie lipidique et le statut oxydatif (Di Biase et al., 2004; Khan
et al., 1998; Dobashi et al., 1997).
Des lignées de fibroblastes humains établis à partir de patients atteints d’X-ALD sont disponibles et
permettent d’étudier les effets de l’absence d’ALDP sur la β-oxydation peroxysomale, la cytotoxicité
et les effets pro-oxydants des AGTLC (Wanders et al., 1987; Ofman et al., 2010; Fourcade et al.,
2008).
ETUDE BIBLIOGRAPHIQUE Modèles d’études
79
Des hépatomes de rat H4IIEC3 exprimant ALDP et peu ALDRP, transfectés stablement par un
vecteur permettant d’exprimer Abcd2-EGFP normale ou mutée, sont aussi utilisés pour étudier
l’aspect fonctionnel de l’ALDRP (Gueugnon et al., 2006).
1.3 Cultures primaires et organotypiques
Des cultures primaires mixtes de cellules gliales (astrocytes, oligodendrocytes), avec ou sans
neurones, ont été utilisées pour évaluer les effets des AGTLC sur les différents types de cellules
gliales (Hein et al., 2008; Khan et al., 2010; Sinhg et al., 2009; Gondcaille et al., 2005). Les cultures
primaires ou secondaires de cellules gliales ont été utilisées pour étudier l’expression des protéines
peroxysomales et l’abondance des peroxysomes dans le SNC (Fouquet et al., 1997). Des cultures
primaires de fibroblastes (humain ou murin : sauvages ou déficients en ABCD1) ont été aussi
utilisées pour mesurer la β-oxydation peroxysomale (Morita et al., 2008; Petroni et al., 2007; Morita
et al., 2005; Pettus, 2004; Oezen, 2005; Yamada et al., 2004). Des cultures primaires de
macrophages de souris sauvages ou déficientes en Abcd1 (Yanagisawa et al., 2008), ou des
lymphocytes humains (issus de sujets sains ou de patients atteints d’X-ALD), ont été utilisés pour
étudier les statuts oxydatif et inflammatoire de ces cellules, ainsi que leur vulnérabilité vis-à-vis des
AGTLC (Uto et al., 2008). Fourcade et al. ont utilisé la culture organotypique de moelle épinière de
souris âgée de 18 mois (sauvage ou déficiente en Abcd1) pour étudier les effets pro-oxydants et les
conséquences biologiques de l’accumulation des AGTLC (Fourcade et al., 2008).
1.4 Utilisation des siRNA
Le siRNA est un outil de la biologie moléculaire largement utilisé pour analyser les fonctions des
gènes et de leurs produits dans le fonctionnement cellulaire (Leung & Whittaker, 2005). Dans l’X-
ALD, cette technique a été utilisée par plusieurs auteurs pour étudier l’implication de certains gènes
peroxysomaux (famille ABCD) dans l’X-ALD. Di Benedetto et al. ont utilisé des siRNA pour
inactiver Abcd3 (PMP70) dans les cellules gliales C6 afin d’étudier le rôle de cette protéine dans le
transport et le métabolisme des AGTLC (Di Benedetto et al., 2008), mais aussi sur les effecteurs du
stress oxydant et de l’inflammation (Di Benedetto et al., 2008). Le rôle d’Abcd1 et d’Abcd2 dans des
cultures primaires d’astrocytes de rat a été étudié après extinction de ces deux gènes par des siRNA
(Khan et al., 2010). Ces extinctions de gènes sont associées à une augmentation de 5-lipoxygénase
conduisant à la synthèse de leucotirène-B4 produit à partir de l’acide arachidonique et à une
diminution de glutathion réduit. Cela est en accord avec l’augmentation de 5-LOX observée au
niveau des lésions cérébrales de patients atteints d’X-ALD (Khan et al., 2010).

ETUDE BIBLIOGRAPHIQUE Modèles d’études
80
2 In vivo
Les pluparts des études biochimiques sur les maladies peroxysomales ont été réalisées sur des
cellules de patients, en particulier sur de cultures primaires des fibroblastes de peau. Bien que ces
études soient informatives; elles ne montrent pas comment et pourquoi un dysfonctionnement
peroxysomal aboutit à la pathologie. Pour mieux comprendre l’incidence physiopathologique des
maladies peroxysomales, un certain nombre de modèles murins ont été réalisés (Wanders &
Waterham, 2006a).
2.1 Souris déficientes conventionnelles
Après l’identification du gène responsable de l’X-ALD (Mosser et al., 1993), plusieurs laboratoires
ont travaillé sur l’élaboration d’un modèle animal permettant de mieux comprendre la
physiopathologie de l’X-ALD. Des modèles de souris ont été réalisés par invalidation du gène visé
(Lu et al., 1997; Forss-Petter et al., 1997; Kobayashi et al., 1997; Pujol, 2002). Les souris obtenues
(Abcd1-) présentent l’anomalie biochimique propre à l’X-ALD (accumulation des AGTLC) ainsi que
des anomalies du métabolisme du cholestérol, mais pas de manifestations phénotypiques ou
neurologiques précoces. A un stade tardif de leur vie (>15mois), ces souris présentent des anomalies
neurologiques (perte des axones au niveau de la moelle épinière avant la démyélinisation ce qui
correspond à l’adrénomyeloneuropathie (AMN) et pas à l’adrénoleucodystrophie cérébrale
(CCALD)) (Pujol, 2002; Weinhofer et al., 2005). Vu la redondance fonctionnelle entre l’ALDP
(ABCD1) et l’ALDRP (ABCD2) (Pujol et al., 2004), des souris déficientes en Abcd2, ou doublement
déficientes en Abcd1 et Abcd2 ont été élaborées (Ferrer et al., 2005; Lu et al., 2007). Les souris
Abcd2-/- accumulent moins d’AGTLC que les souris Abcd1- et que les souris (Abcd1- et Abcd2-/-).
Les souris Abcd2-/- développent une atteinte cérébrale tardive et des signes de stress oxydant se
manifestent plus précocement que chez les souris Abcd1-. Les souris (Abcd1- et Abcd2-/-)
manifestent des signes neurologiques plus précoces qu’Abcd1- ou Abcd2-/- (Ferrer et al., 2005; Lu et
al., 2007; Pujol et al., 2004). Chez les souris Abcd1- ou Abcd2-/- aucune infiltration des lymphocytes
T n’a été détectée (Ferrer et al., 2010).
Pour la P-NALD, des souris modèles ont aussi été générées (Acox1-/-). Ces souris sont infertiles avec
un développement postnatal tardif. Elles présentent une stéatose hépatique et des réactions
inflammatoires au niveau hépatique révélées par la présence de macrophages, de lymphocytes,
d’éosinophiles et de leucocytes polymorphonucléaires (Fan et al., 1996a; Fan et al., 1996b).
D’autres modèles murins pour les maladies peroxysomales ont été développés (souris Pex5-/-, Pex2-/-,
Pex7-/-,...) (Faust & Hatten, 1997; Baes et al., 1997; Brites et al., 2003). Ces inactivations miment la

ETUDE BIBLIOGRAPHIQUE Modèles d’études
81
physiopathologie de la maladie de Zellweger. Au niveau biochimique, ces souris présentent une
accumulation d’AGTLC et une diminution de plasmalogène. Ces souris présentent des problèmes de
développement postnatal, ainsi qu’une défaillance de migration neuronale et meurent précocément
dès l’âge de 6 mois (Faust & Hatten, 1997; Baes et al., 1997; Brites et al., 2003).
2.2 Souris déficientes conditionnelles (système Cre-Lox)
Le système Cre-Lox a été utilisé pour élaborer des souris KO conditionnelles. Les modèles de souris
Pex5-/- conventionnelles (absence de peroxysomes fonctionnels) montrent des anomalies
métaboliques et neurologiques (Baes et al., 1997). Afin de déterminer les rôles des peroxysomes en
fonction des tissus et du type cellulaire des lignées, des souris Pex5-/- conditionnelles ont été
produites en utilisant le système Cre-Lox. Les souris Nestine-Pex5-/- (absence des peroxysomes dans
les cellules gliales et les neurones) montrent une initiation de neurodégénérescence et mort cellulaire
très précoce, dès 6 mois (Hulshangen et al., 2008). Des souris CNPase-Pex5-/- (absence des
peroxysomes dans les oligodendrocytes) montrent des troubles neurologiques précoces, des réactions
inflammatoires et une mort précoce entre 6 et 12 mois (Kassman et al., 2007). Les souris NEX-Pex5-
/- (absence des peroxysomes dans les neurones) et les souris GFAP-Pex5-/- (absence de peroxysomes
dans les astrocytes) ne montrent pas de dégénérescences avant l’âge de 20 mois (dégénérescence très
tardive) (Bottelbergs et al., 2010). C’est grâce à ces modèles qu’il a été établi que les peroxysomes
sont essentiels au bon fonctionnement du système nerveux central et que leur fonctionnement a plus
ou moins d’incidence en fonction du type cellulaire consdéré. Les oligodendrocytes, cellules
synthétisant la myéline, étant les plus sensibles aux dysfonctionnements peroxysomaux. La
différence d’agressivité neuroinflammatoire et dégénérative d’un modèle à l’autre souligne une
éventuelle compensation fonctionnelle du peroxysome entre les différents types cellulaires du SNC.
En conclusion, les souris Abcd1- (modèle de l’X-ALD), bien qu’ayant des taux d’AGTLC
plasmatique et tissulaire élevés, ne manifestent aucuns signes neurologiques comparables à ceux
observés chez les patients. Les souris Pex5-/- (modèle du syndrome de Zellweger) présentent des
anomalies biochimiques, histologiques et neurologiques identiques à celles observées chez les
patients CCALD. Ceci permet d’utiliser ces souris comme modèle afin d’aborder la transition entre
une maladie métabolique et une maladie neurodégénérative sévère.

OBJECTIFS
82
OBJECTIFS
OBJECTIFS
83
L’X-ALD se caractérise par un phénomène de démyélinisation inflammatoire. La myéline,
synthétisée par les oligodendrocytes, est un complexe lipoprotéique (composé à 70% de lipides et à
30% de protéines) qui sert à protéger les axones et à les isoler électriquement permettant ainsi la
bonne conduction de l’influx nerveux. (Vargas et al., 2004; Hudspeth & Raymond, 2007).
L’identification de cellules apoptotiques au niveau des zones péri-lésionnelles d’X-ALD suggère que
la mort cellulaire pourrait contribuer à l’évolution de cette pathologie (Eichler et al., 2008)
La P-NALD est associée à une déficience enzymatique en AcylCoA oxydase 1 (ACOX 1) qui
catalyse l’étape initiale et limitante de la β-oxydation des acides gras à très longue chaîne (AGTLC)
(Fournier et al., 1994).
La caracteristique biochimique majeure de l’X-ALD et de la P-NALD est l’accumulation tissulaire et
plasmatique d’AGTLC (C24:0 et C26:0). Les effets des ces AGTLC sur les oligodendrocytes
(cellules productrices de la myéline) ne sont pas encore clairement elucidés actuellement (Kemp &
Wanders, 2010). Dans le cadre de l’X-ALD et de la P-NALD, il est donc important de préciser les
relations entre peroxysomes, accumulation d’AGTLC, mort cellulaire en relation avec la cytotoxicité
des AGTLC, démyélinisation, oxydation et inflammation. La compréhension de ces mécanismes de
démyélinisation constitue en effet un challenge majeur pour développer des traitements efficaces
dans ces pathologies.
Mon sujet de Thèse de Doctorat intitulé « Activités cytotoxiques et pro-oxydantes d'acides gras à très
longue chaîne sur des oligodendrocytes murins sauvages et déficients en Abcd1 et Acox1 :
application à la physiopathologie de l'X-ALD et de la P-NALD » s’inscrit dans la cadre d’un projet
qui vise à identifier et à mieux comprendre les mécanismes impliqués dans la physiopathologie de
l’X-ALD et de la P-NALD.
Pour répondre à certaines de ces questions, mes travaux de recherche ont consisté :
1) A caractériser une lignée d’oligodendrocytes murins (158N) constituant l’outil biologique
nécessaire à la réalisation de l’étude,
2) A étudier les mécanismes de cytotoxicité des AGTLC (C24:0, C26:0) sur les
oligodendrocytes 158N,
3) A évaluer les éventuels effets pro-oxydants associés à l’accumulation intracellulaire de ces
AGTLC,
4) A préciser les effets des AGTLC sur différents organelles cellulaires (mitochondrie,
lysosome),

OBJECTIFS
84
5) A définir l’impact des AGTLC sur la synthèse des protéines majeures de la myéline (PLP
(proteolipid protein) et MBP (myelin basic protein)),
6) A déterminer les conséquences de l’inactivation d’Abcd1 et/ou d’Acox1 sur la mort
cellulaire, le stress oxydant et l’expression des protéines majeures de la myéline (PLP, MBP),
7) A partir des résultats obtenus in vitro, à rechercher des biomarqueurs plasmatiques du stress
oxydant permettant de distinguer les différentes formes d’X-ALD.

85
RESULTATS
RESULTATS
86
I Article 1 : Peroxisomal and Mitochondrial Status of Two
Murine Oligodendrocytic Cell Lines (158N, 158JP): Potential
Models for the Study of Peroxisomal Disorders Associated with
Dysmyelination Processes
Mauhamad Baarine, Kévin Ragot, Emmanuelle C. Genin, Hammam El Hajj, Doriane
Trompier, Pierre Andréoletti, Said Ghandour, Franck Ménétrier, Mustapha Cherkaoui-Malki,
Stéphane Savary, Gérard Lizard.
1 Introduction
Les oligodendrocytes (OL) sont les cellules qui assurent la myélinisation au niveau du SNC.
Ils sont générés par des précurseurs d’oligodendrocytes (OPCs) qui sont des cellules
multipotentes provenant des zones germinales du SNC (Dugas et al., 2006). La maturation
des OL est un mécanisme complexe avec un programme de prolifération, de migration, de
différenciation et de myélinisation, bien contrôlé dans le temps et dans l’espace. L’exécution
de ce programme conduit à la formation d’une cellule mature capable de produire la myéline
(gaine isolante des axones). En raison de leur programme complexe de différenciation et de
leur métabolisme spécifique très actif, les oligodendrocytes sont les cellules les plus
vulnérables du SNC (Bradl & Lassmann, 2010).
La différenciation des précurseurs oligodendrocytaires (OPCs) est caractérisée par de
nombreux changements phénotypiques (évolution de la morphologie cellulaire) et
antigéniques (expression séquentielle des marqueurs spécifiques) (Figure 29). L’expression
différentielle de protéines oligodendrocytaires au cours de la maturation des OL permet de les
utiliser comme des marqueurs de différenciation (Deloulme et al., 2004) (Figure 29).

RESULTATS
87
PLPMOGPLPPLP
MOGMOG
Figure 29 : Différenciation et maturation des oligodendrocytes (OL).
(MBP : myelin basic protein ; PLP : proteolipid protein; O4 : Antigène de surface de précurseurs d’oligodendrocytes; A2B5 et NG2 marqueurs de précurseurs d’oligodendrocytes; CNPase : 2’, 3’-cyclic nucleotide 3-phosphohydrolase) (Deloulme et al., 2004). Actuellement, plusieurs lignées d’OL (humain, rat, souris) ont été constituées mais celles-ci
présentent le plus souvent des caractéristiques morphologiques et antigéniques d’OL
immatures (Buntinx et al., 2003; Bongarzone et al., 1997; Verity et al., 1993). La culture
primaire mixte de neurones et de cellules gliales (astrocytes, oligodendrocytes) a aussi
souvent été utilisée pour évaluer les effets de certains produits (Hein et al., 2008).
Dans ce premier article, nous décrivons les caractéristiques ultrastructurales, antigéniques et
fonctionnelles des deux lignées cellulaires oligodendrocytaires (158 N et 158 JP) initialement
établies par l’équipe du Dr. Saïd M Ghandour à l’université de Strasbourg (Ghandhour et
al., 2002; Feutz et al., 2001; Feutz et al., 1995).
Nous avons précisé l’état de maturation oligodendrocytaire de ces cellules en étudiant
l’expression de protéines de la myéline (MOG, PLP, MBP) et de la CNPase exprimées par les
pré-OL et les OL matures. Chez l’Homme, le gène plp qui code pour la protéine majeure de la
myéline ou PLP (proteolipid protein) est localisé sur le chromosome X. Par épissage
alternatif, plp donne lieu à deux isoformes PLP et DM20 qui constituent 50% des protéines
totales de la myéline (Nave, 1994). Chez l’Homme, une mutation du gène plp peut induire
une importante hypomyélinisation qui conduit à la pathologie de Pelizaeus-Merzbacher. Chez
la souris, la mutation jimpy qui affecte l’expression de la PLP et du DM20 induit aussi une
RESULTATS
88
hypomyélinisation, une diminution du nombre d’OL et la mort précoce des souris mutantes
(Nave, 1994). MBP représente 30% des protéines myéliniques (Hu & Isrealachvili, 2007). Il
existe plusieurs isoformes obtenues par épissage alternatif du gène localisé sur le chromosome
18 chez l’Homme et la souris (Boggs, 2006).
PLP et MBP jouent un rôle important dans la stabilisation et la compaction de la myéline (de
Vries & Hoekstra, 2000). MOG constitue moins de 0,1 % des protéines myéliniques. Cette
protéine est présente dans le SNC, essentiellement à la surface des enroulements myéliniques
et des prolongements oligodendrocytaires. MOG est hautement immunogène et constitue un
auto-antigène clé dans la sclérose en plaque (Clements et al., 2003). MOG contribue à la
maturation et à la maintenance de la myéline (Birling et al., 1993) et c’est la dernière des
protéines myéliniques à être exprimée. Son expression est donc une preuve de différenciation
oligodendrocytaire terminale. La CNPase constitue 4-5% des protéines de la myéline. C’est
un marqueur spécifique des stades précoces du développement oligodendrocytaire. Elle joue
un rôle dans la structuration de la myéline (Yin et al., 1997).
Nous avons également déterminé l’expression de protéines peroxysomales (Abcd 1, Abcd 2,
Abcd 3, Acox1 et L-PBE) par cytométrie en flux, Western blot et/ou RT-qPCR; ainsi que
l’activité mitochondriale et le statut oxydatif de ces deux lignées en prenant en compte la
production de radicaux oxygénés, le taux de glutathion réduit (GSH) et la masse
mitochondriale. En effet, pour utiliser ces cellules afin d’aborder la physiopathologie de l’X-
ALD et de la P-NALD, il était important de déterminer l’expression de ces ABC transporteurs
peroxysomaux et de l’Acox1.
Nous avons aussi recherché la présence de peroxysomes fonctionnels par microscopie
électronique à transmission et mesuré l’activité enzymatique de la catalase et de l’Acox1. La
fonctionnalité des peroxysomes des OL 158N et 158JP a aussi été abordée en traitant les
cellules avec du phénylbutyrate qui est connu pour induire une prolifération des peroxysomes.
Les différences mitochondriales observées entre 158N et 158JP, nous ont incité à préciser la
localisation de PLP (susceptible de moduler l’activité mitochondriale transmembranaire) par
rapport à la mitochondrie par microscopie confocale associée à l’analyse d’images.
Cette étude a permis d’établir que :
• les cellules 158N et 158JP expriment fortement les marqueurs PLP, MBP, MOG et
CNPase. Ces cellules sont donc des OL présentant des caractéristiques d’OL matures.
RESULTATS
89
• Les cellules 158N et 158JP ont des peroxysomes fonctionnels (activité catalase et
Acox1).
• Les cellules 158N expriment les transporteurs Abcd1 et Abcd3 alors que les cellules
158JP expriment à la fois Abcd1, Abcd2 et Abcd3.
• Les cellules 158N et 158JP expriment aussi Acox1 et L-PBE impliquées dans la β-
oxydation peroxysomale des AGTLC.
• Les cellules 158N et 158JP présentent des différences fonctionnelles au niveau de la
mitochondrie et du statut oxydatif qui pourraient impliquer la mutation jimpy.
En conclusion, les cellules 158N et 158JP, et en particulier les 158N, constituent un modèle
intéressant pour aborder les relations entre peroxysome, mitochondrie et marqueurs
myéliniques afin de mieux comprendre la physiopathologie de l’X-ALD et de la P-NALD.
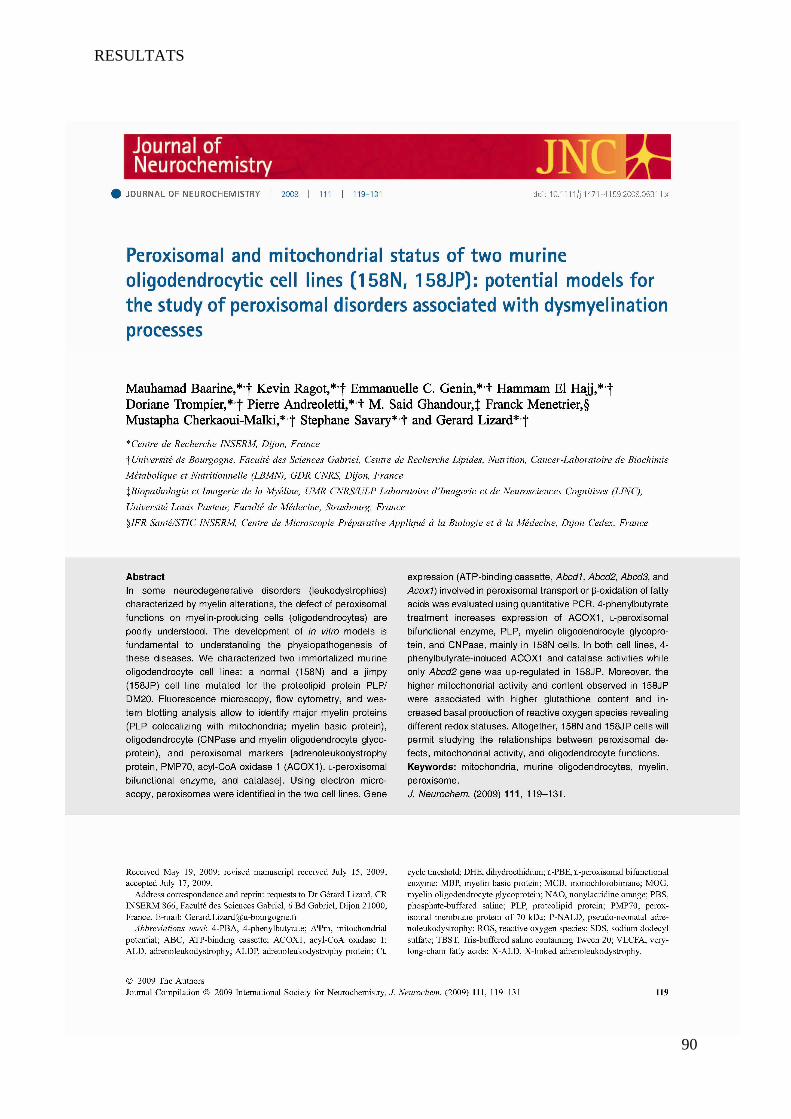
RESULTATS
90

RESULTATS
91
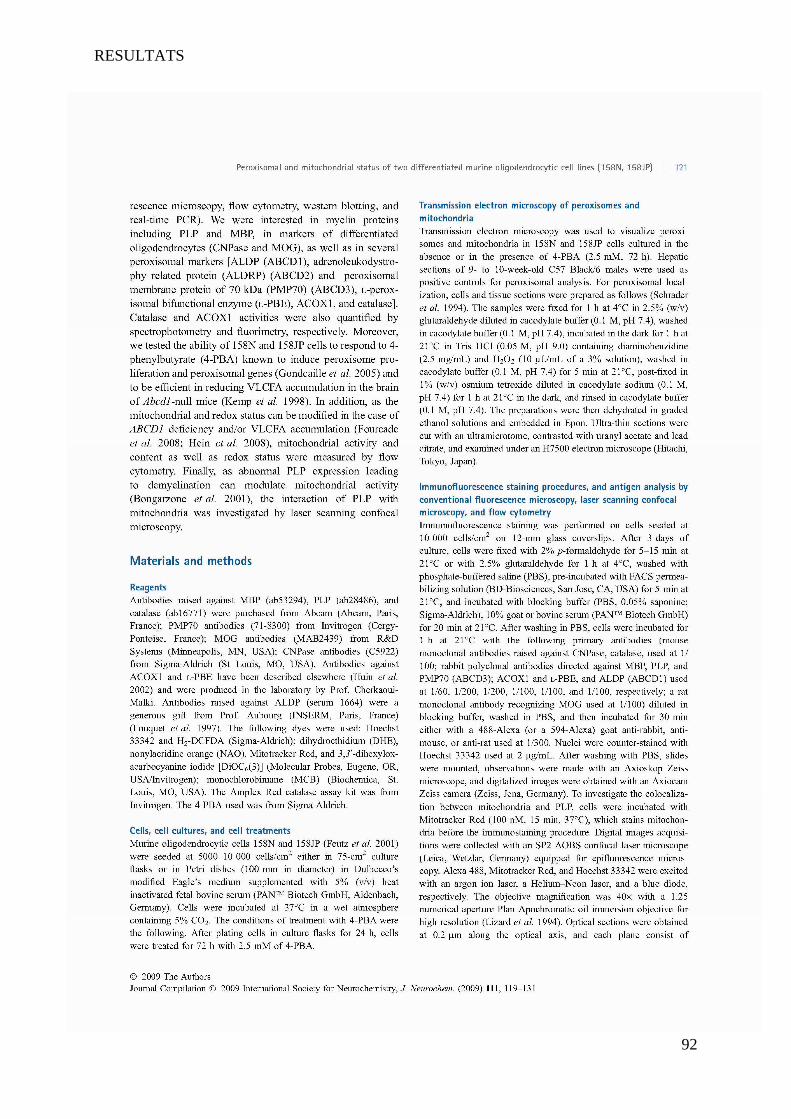
RESULTATS
92

RESULTATS
93
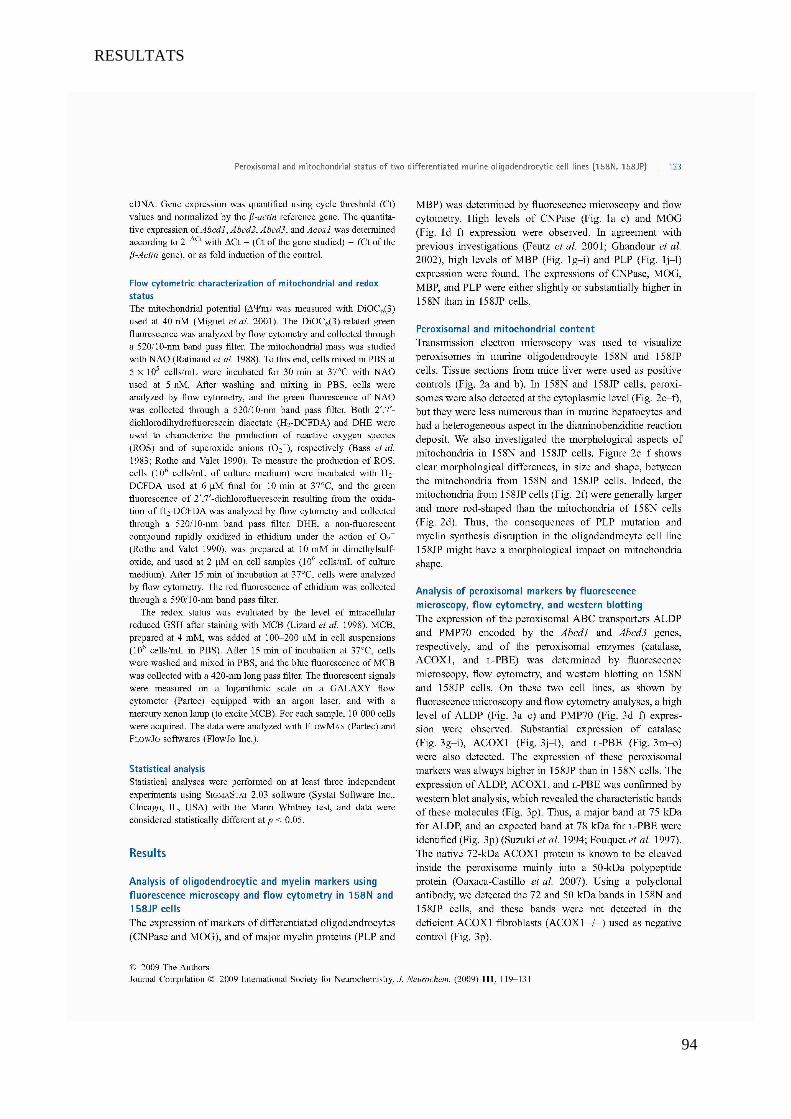
RESULTATS
94
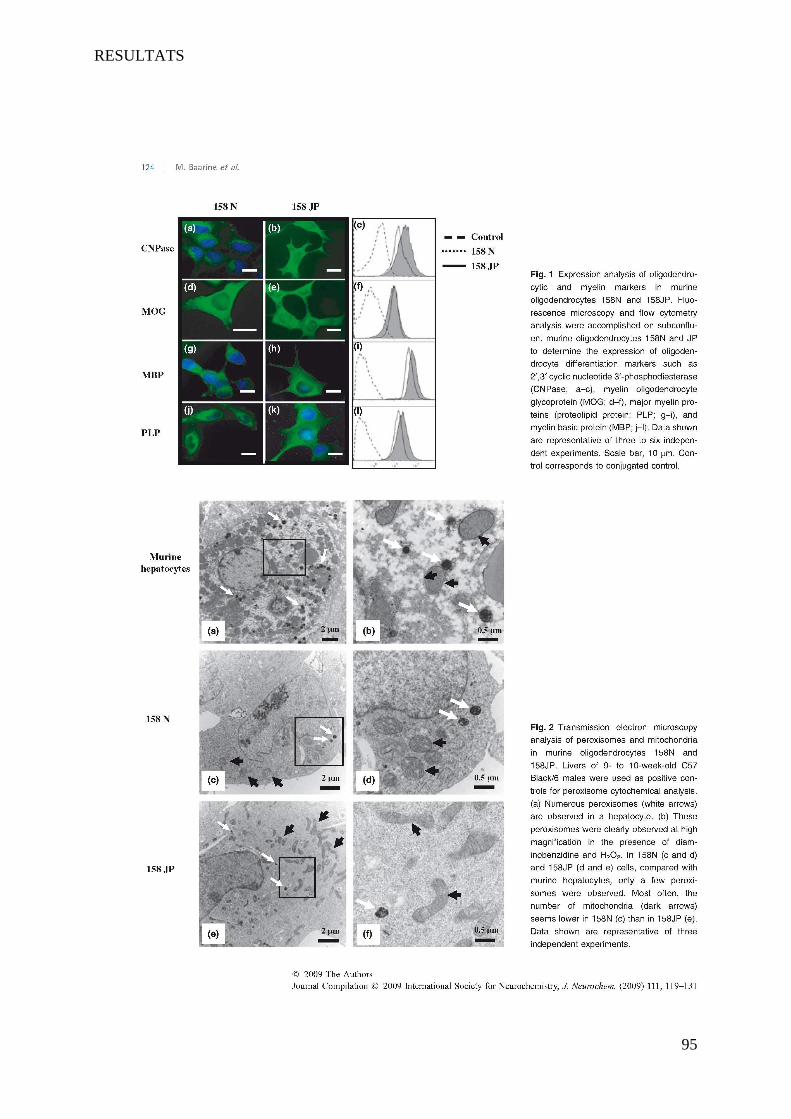
RESULTATS
95
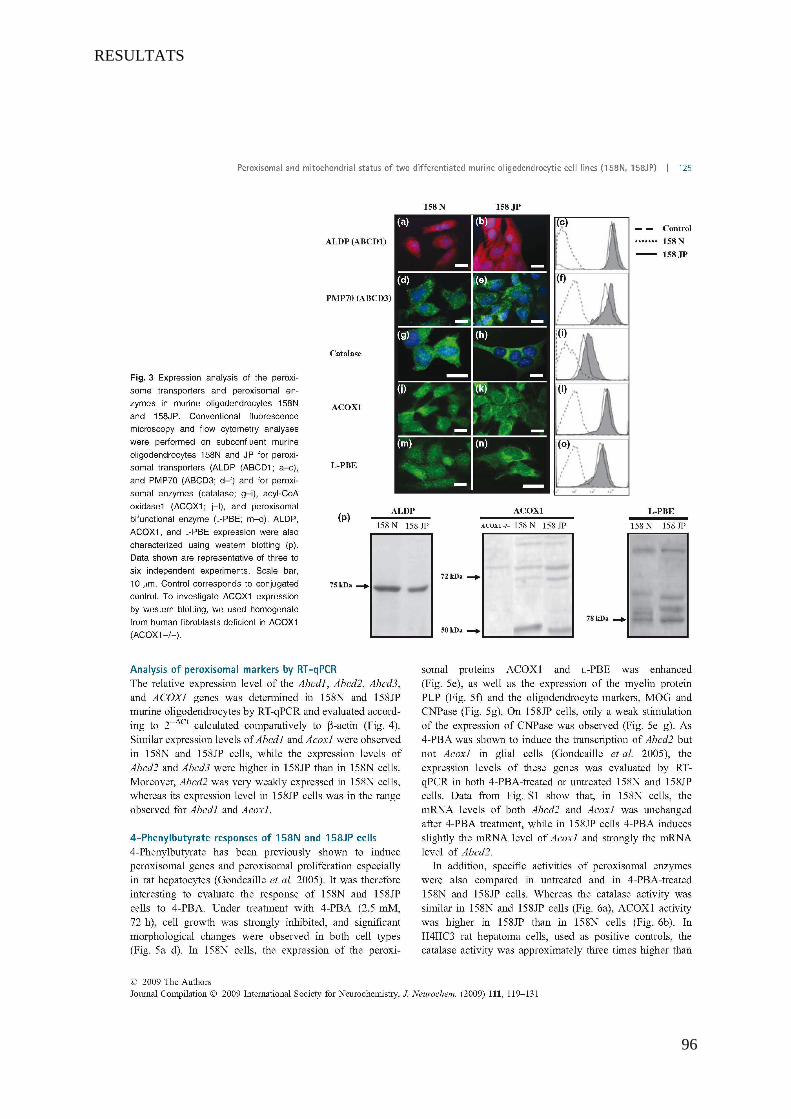
RESULTATS
96
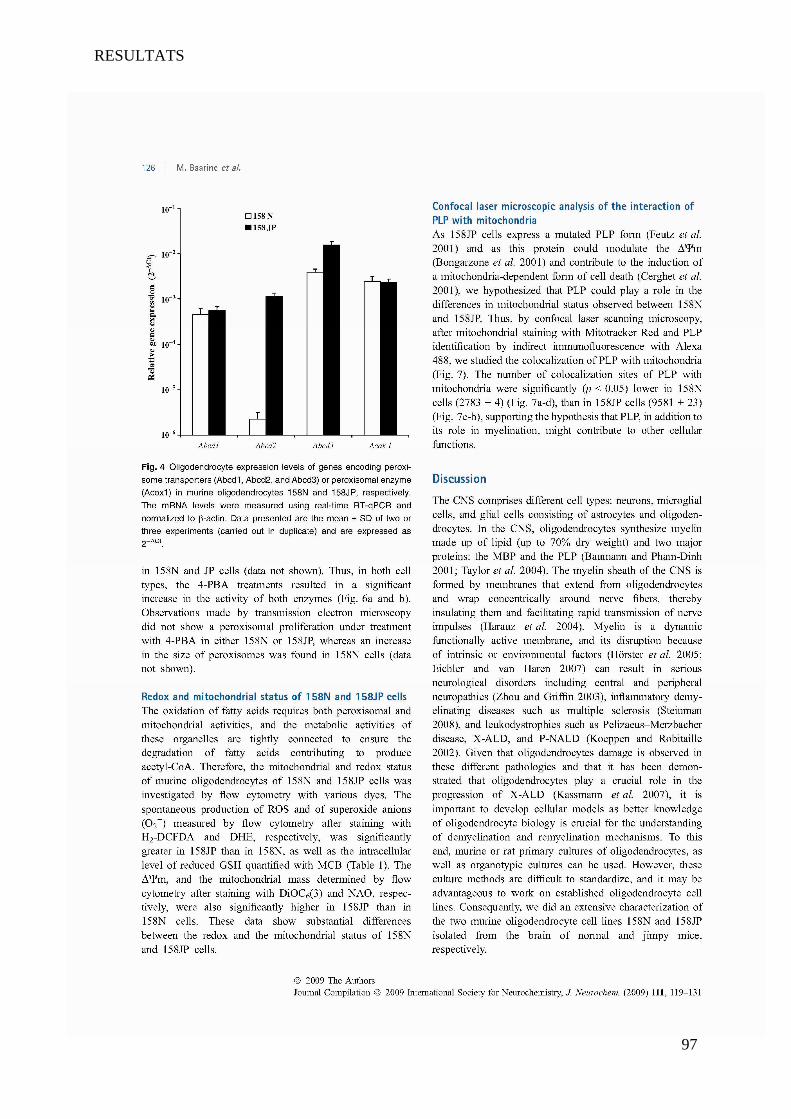
RESULTATS
97
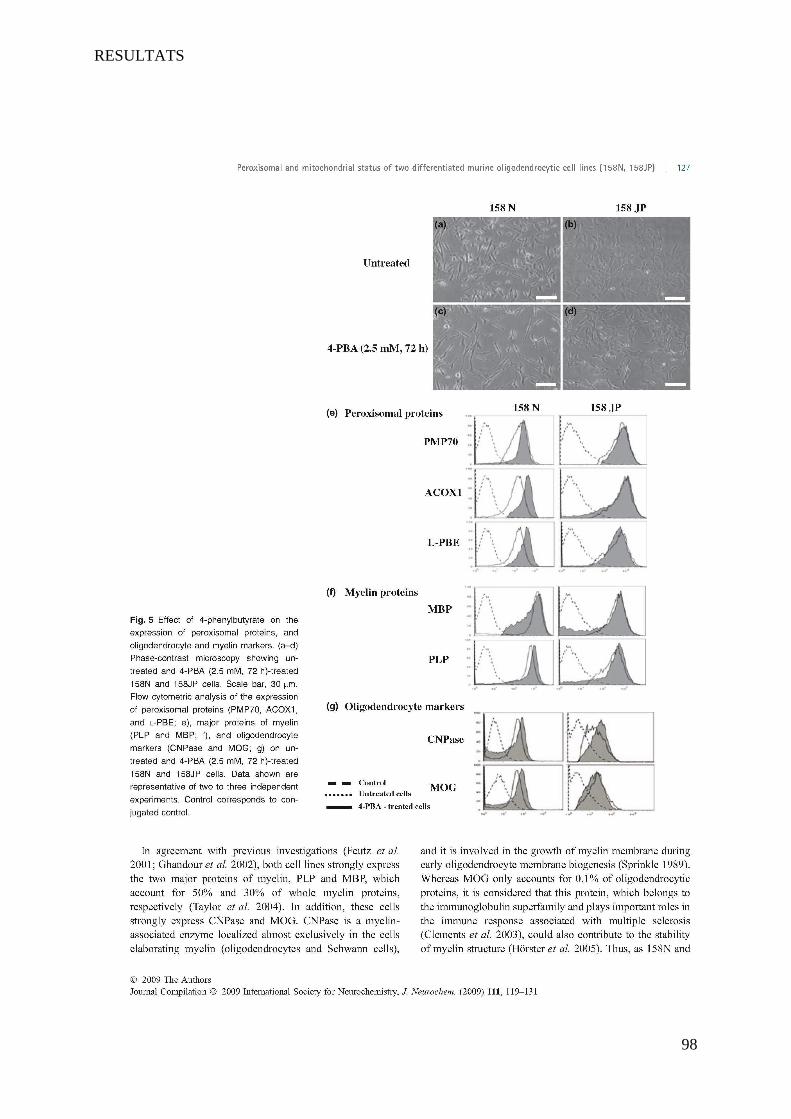
RESULTATS
98
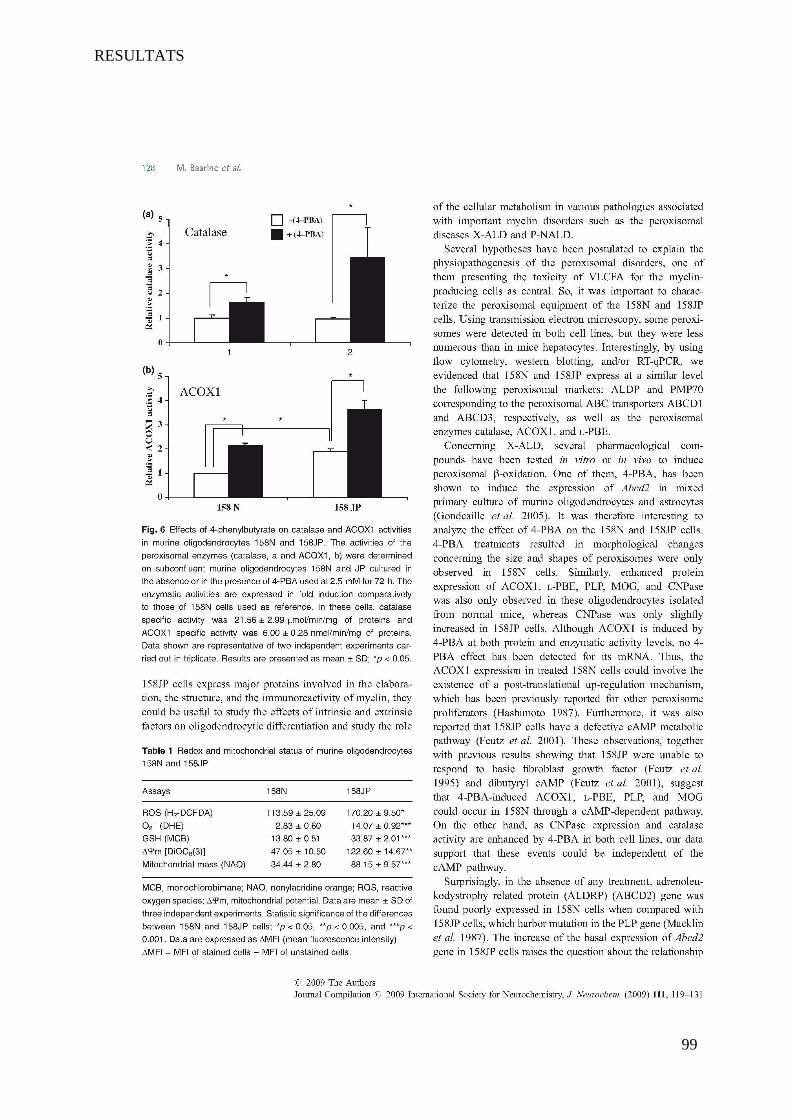
RESULTATS
99

RESULTATS
100
RESULTATS
101
RESULTATS
102
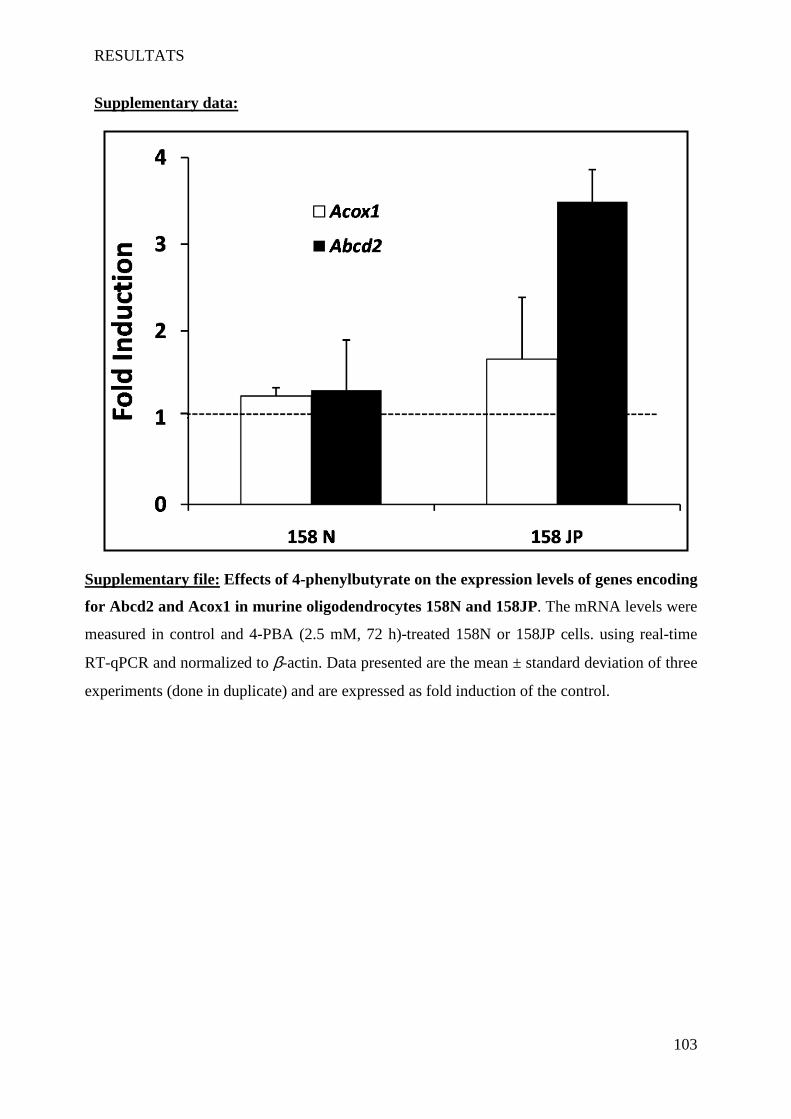
RESULTATS
103
Supplementary data:
Supplementary file: Effects of 4-phenylbutyrate on the expression levels of genes encoding
for Abcd2 and Acox1 in murine oligodendrocytes 158N and 158JP. The mRNA levels were
measured in control and 4-PBA (2.5 mM, 72 h)-treated 158N or 158JP cells. using real-time
RT-qPCR and normalized to β-actin. Data presented are the mean ± standard deviation of three
experiments (done in duplicate) and are expressed as fold induction of the control.
RESULTATS
104
II Article 2 : Pro-oxidative activities of Abcd1 or Acox1 deficiency,
and of VLCFA on murine oligodendrocytes support evidences of
lipid peroxidation in X-ALD patients
(Soumis à Human Molecular Genetics)
Mauhamad Baarine, Zilal Kattan, Kévin Ragot, Pierre Andréoletti, Anne Athias,
Emmanuelle C Genin, Stéphane Savary, Mustapha Cherkaoui-Malki, Gérard Lizard
1 Introduction
L’X-ALD et la P-NALD sont des maladies peroxysomales demyélinisantes résultant
respectivement de dysfonctionnements de l’hémitransporteur peroxysomal ABCD1 et de
l’enzyme ACOX1, première enzyme de la β-oxydation peroxysomale (Mosser et al., 1993;
Fournier et al., 1994). Ces deux pathologies ont en commun une accumulation cytoplasmique
et tissulaire d’AGTLC (C24:0 et C26:0). Comme les peroxysomes sont impliqués dans le
métabolisme des AG, ainsi que dans le métabolisme des espèces réactives de l’oxygène
(ERO) et de l’azote (ERN), nous avons étudié les effets pro-oxydants des AGTLC sur des
oligodendrocytes murins 158N exprimant ou non Abcd1 ou Acox1. Après avoir quantifié
l’accumulation des AGTLC (utilisés à 5, 10 et 20 µM) dans les cellules et leur répartition
dans différentes sous-classes de lipides, nous avons évalué la mort cellulaire induite par les
AGTLC (à 24 et 48 h) et déterminé les effets des AGTLC sur le statut RedOx (à 24 h) en
prenant en compte : 1) la production des ERO et ERN, 2) les défenses anti-oxydantes (taux de
glutathion réduit, activités catalase et SOD), 3) la peroxydation lipidique (4-HNE, 7-
hydroxycholestérols, HODEs) et les conséquences de l’oxydation au niveau de l’ADN et des
protéines, 4) l’effet de l’extinction des gènes des protéines peroxysomales Abcd1 et Acox1
sur la production d’ERO et ERN. En utilisant des plasmas de patients avec différentes formes
d’X-ALD fournis par le Pr Patrick Aubourg (INSERM UMR 745 / Hôpital St Vincent de
Paul, Paris), nous avons recherché des marqueurs de peroxydation lipidique (7-
RESULTATS
105
hydroxycholestérols, HODEs) dans ces échantillons sur lesquels les taux de C24:0 et C26:0
ont été également mesuré. Des plasmas de sujets normaux ont été utilisés comme contrôle.
Ce travail a permis de montrer, en accord avec les résultats obtenus par d’autres équipes (Hein
et al., 2008; Fourcade et al., 2008), que les AGTLC ont des effets anti-prolifératifs et activent
la mort cellulaire des cellules 158N en provoquant une dépolarisation des mitochondries dès
20 µM.
De plus, ce travail a fournis des informations nouvelles permettant de mieux comprendre la
physiopathologie de l’X-ALD et de la P-NALD : 1) l’accumulation de C24:0 et C26:0 induit
un stress oxydant important ; 2) l’extinction d’Abcd1 ou d’Acox1 est suffisante pour
augmenter le stress oxydant ; 3) l’extinction d’Abcd1 ou d’Acox1 accentue le stress oxydant
induit par les AGTLC.
Par ailleurs, les analyses biochimiques réalisées par CPG (Chromatographie en Phase
Gazeuse) ou HPLC (Chromatographie Liquide à Haute Performance) couplée à la
spectrométrie de masse (MS) sur le plasma de patients présentant différentes formes d’X-
ALD ont montré des augmentations importantes des taux de marqueurs de peroxydation
lipidique (7-hydroxcholestérols, HODEs) résultant d’un stress oxydant chez 80% des malades
atteints de CCALD. Dans les autres formes d’X-ALD moins sévères (ACALD, AMN et
Addison), cette accumulation est moins importante. Cette étude révèle pour la première fois la
présence de marqueurs du stress oxydant significativement plus élevés chez les sujets atteints
de CCALD, renforçant l’hypothèse selon laquelle le stress oxydant pourrait intervenir dans
l’évolution de l’X-ALD (Sing & Pujol, 2010).

RESULTATS
106
Pro-oxidative activities of Abcd1 or Acox1 deficiency, and of VLCFA on murine
oligodendrocytes support evidences of lipid peroxidation in X-ALD patients
(Soumis à Free Radical Biology and Medecine)
Mauhamad Baarine 1, Zilal Kattan 1, Kévin Ragot 1, Pierre Andréoletti 1, Anne Athias 2,
Emmanuelle C Genin 1, Stéphane Savary 1, Mustapha Cherkaoui-Malki 1 , Gérard Lizard 1*
1 Centre de Recherche INSERM 866 (Lipides, Nutrition, Cancer) – Equipe Biochimie
Métabolique et Nutritionnelle / Université de Bourgogne, Dijon, France
2 INSERM IFR100 Santé - STIC / Plateau Technique de Lipidomique, CHU hôpital du
Bocage, Boulevard Maréchal de Lattre de Tassigny, Dijon, France
* To whom correspondence should be addressed :
Dr. Gérard Lizard (Ph.D), Centre de Recherche INSERM 866, Faculté des Sciences Gabriel, 6
Bd Gabriel, 21000 Dijon, France
Phone: +33 380 39 62 56;
Fax: +33 380 39 62 50
Email: [email protected]
RESULTATS
107
Abstract
X-linked adrenoleukodystrophy (X-ALD) and pseudo neonatal adrenoleukodystrophies (P-
NALD) are demyelinating diseases resulting from the functional loss of the peroxisomal
ATP-binding cassette transporter D (ABCD1) and from single peroxisomal enzyme
deficiency (Acyl-CoA oxidase1: ACOX1), respectively, involved in the metabolism of very
long chain fatty acids (VLCFA: C24:0, C26:0). As peroxisomes are involved in the
metabolism of reactive oxygen species (ROS) and nitrogen species (RNS), we examined the
impact of VLCFA on 158N murine oligodendrocytes expressing or not Abcd1 or Acox1. We
show that VLCFA inhibit cell growth, induce cell death, activate an oxidative stress
characterized by an overproduction of ROS and RNS associated with lipid peroxidation,
increase superoxide dismutase activity, decrease catalase activity and glutathione level.
Protein carbonylation and DNA degradation were observed. SiRNA extinction of Abcd1 or
Acox1 increased ROS and RNS production even in the absence of VLCFA, and contributed to
enhance VLCFA-induced oxidative stress. Noteworthy, high levels of peroxidation markers
(total 7-hydroxycholesterols, HODEs) were mainly observed in the plasma of patients with
inflammatory cerebral X-ALD (CCALD). Our data demonstrate: i) VLCFA induce an
oxidative stress, ii) Abcd1 or Acox1 deficiency is sufficient to disrupt Redox equilibrium, iii)
lipid peroxidation mainly occurs in the most aggressive form of X-ALD.
Keywords: X-ALD, P-NALD, lipid peroxidation, VLCFA, total 7-hydroxycholesterols,
HODEs, 158N oligodendrocytes.
RESULTATS
108
Introduction
Peroxisomes are single cell membrane organelles present in nearly all eukaryotic cells. They
are essential to some cellular functions such as lipid metabolism [1]. These organelles are
mainly involved in the β-oxidation process of long-chain fatty acids (LCFA), very-long-chain
fatty acids (VLCFA) and branched-chain fatty acids [2]. They are also involved in the
synthesis of specific fatty acids such as docosahexaenoic acid (DHA, C22:6 n-3) that are
essential for the brain as well as of plasmalogens playing major roles in the growth of neural
cells [3], and which are important components of myelin sheath (a complex of proteins and
lipids: 30% proteins, 70% lipids, mainly cholesterol and sphingomyelin) that extends from
oligodendrocytes and wraps concentrically around nerve fibers, thereby insulating them and
facilitating rapid transmission of nerve impulses [4]. Consequently, alterations of peroxisomal
functions, especially in the oligodendrocytes, favour the accumulation of VLCFA and are
detrimental for the nervous system development and functions [5-7].
Currently, data obtained with transgenic mice support that the loss of peroxisomes in the
oligodendrocyte lineage is sufficient to lead to demyelination in central nervous system.
Indeed, in CNP-Pex5 knockout mice [5], the absence of functional peroxisomes caused
progressive demyelination. At the opposite, when peroxisomes were deleted from astrocytes
in GFAP-Pex5 (-/-) mice or from neurons in NEX- Pex5 (-/-) mice, the absence of
peroxisomal metabolism in these cells did not provoke the neurodegenerative phenotype
observed after deleting peroxisomes from oligodendrocytes whereas a marked accumulation
of VLCFA was observed in brain [7]. Thus, these data underline that peroxisomes need to be
present within oligodendrocytes to preserve axons and their myelin sheath [6].
In humans, the absence of functional peroxisomes is associated with multiple abnormalities
leading to peroxisomal leukodystrophies. X-linked adrenoleukodystrophy (X-ALD; OMIM
300100), the most frequent peroxisomal leukodystrophy (1/17,000), and pseudo-neonatal
adrenoleukodystrophy (P-NALD; OMIM 264470) a very rare peroxisomal leukodystrophy
(1/200,000), are associated with peroxisomal transporters abnormalities and a single
peroxisomal enzyme deficiency, respectively.
X-ALD is characterized by progressive demyelination within the peripheral and central
nervous system, adrenal insufficiency and accumulation of saturated (C24:0; C26:0), and to a
lesser extent, monounsaturated (C26:1) VLCFA in plasma and tissues [1, 8, 9]. X-ALD is
characterized by a highly variable clinical spectrum, and currently no genotype/phenotype
correlation has been established [10, 11]. It ranges from cerebral demyelinating, inflammatory
childhood phenotypes associated with a poor prognosis (CCALD: childhood cerebral ALD),
RESULTATS
109
to milder adolescent and adulthood disease with focal demyelination in the central nervous
system (ACALD: adolescent cerebral ALD), to adulthood forms without central nervous
system demyelination and considerably slower symptom progression (AMN:
adrenomyeloneuropathy) and to Addison disease [1, 9]. X-ALD is caused by mutations in the
ABCD1 gene located in Xq28 encoding a peroxisomal ABC transporter called
adrenoleukodystrophy protein (ALDP), which participates in the entry of VLCFA-CoA into
the peroxisome [9, 12, 13]. Recently, as ELOVL1 has been reported as the single enzyme
catalyzing the synthesis of both saturated VLCFA (C26:0) and monounsaturated VLCFA
(C26:1), this enzyme provides new insights on the pathways leading to elevated levels of
VLCFA in X-ALD [14]. Indeed, VLCFA accumulating in X-ALD are partly absorbed from
the diet [15] but mostly result from endogenous synthesis through elongation of LCFA [16].
P-NALD is a very rare single peroxisomal enzyme deficiency (Acyl-CoA oxidase1 (ACOX1)
deficiency) characterized by several signs and symtoms including generalized hypotonia,
deafness, apnea, dysphagia, retinal degeneration, enlarged liver, and also high plasmatic and
tissular levels of VLCFA [17, 18]. In addition, children with P-NALD show
neurodevelopmental regression, neurological deterioration, and early die. In humans, ACOX1
gene is located on chromosome 17q25 and consists of 15 exons and 14 introns, with two
exons 3 named 3a and 3b [19]. An alternative splicing of the pre-mRNA leads to the synthesis
of two mature mRNAs, which encode two isoforms: ACOX1a and ACOX1b [20, 21].
ACOX1 catalyzes the first and rate-limiting step of straight-chain fatty acid β-oxidation, and
ACOX1 activity leads to enoyl-CoA and hydrogen peroxide production.
Whereas it is well admitted that myelin synthesis is under the control of peroxisome present
within oligodendrocytes [6], the pathomechanisms of X-ALD and P-NALD remain unclear.
Therefore, a better understanding of the relationships between accumulation of VLCFA,
peroxisomal status [22, 23], glial cell death [21-26], inflammation and oxidation [27-31]
observed in brain lesions of patients with peroxisomal leukodystrophies is still needed.
Among these events, some investigations support the hypothesis that the oxidative stress
might be a major factor in the pathogenesis of peroxisomal leukodystrophies, especially in X-
ALD. In a mouse model of X-ALD, in which an ‘AMN-like’ phenotype was observed
(characterized by an abnormal neurological and behavioral phenotype, starting at around 15
months, correlated with slower nerve conduction, and with myelin and axonal anomalies
detectable in the spinal cord and sciatic nerve, but not in brain) [32, 33], oxidative damages to
proteins in spinal cord was observed [34]. It was also shown that an excess of VLCFA
triggers free radical production in vitro and ex vivo in an organotypic spinal cord slice culture
RESULTATS
110
system [31, 34]. In humans, in female carriers of X-ALD [35], and in symptomatic and
asymptomatic patients with X-ALD [36, 37] various oxidative stress parameters measured in
the plasma and in erythrocytes and fibroblasts were either increased (superoxide dismutase,
thiobarbituric acid reactive species) or decresased (total anti-oxidant defences, catalase, and
glutathione peroxidase activities). Moreover, a 6 months pilot trial of valproic acid in X-ALD
patients resulted in reversion of the oxidative damage of proteins in peripheral blood
mononuclear cells [31].
So, in the present study, we determined the impact of the main VLCFA (C24:0, C26:0) found
at increased levels in the plasma and tissues of patients with X-ALD and P-NALD [38] on the
oxidative status of 158N murine oligodendrocytes which have some characteristics of well
differentiated oligodendrocytes [39]. We precised the consequences of the inactivation of
Abcd1 and Acox1 expression on oxidative status, and simultaneously investigated the
plasmatic levels of C24:0, C26:0 with those of potential markers of oxidative stress (total 7-
hydroxycholesterols, hydroxyoctadecadienoic acids (HODEs)) in patients with various forms
of X-ALD (CCALD, ACALD, Addison disease, and AMN) [9].
We demonstrate that: i) C24:0 and C26:0 are able to induce an oxidative stress on 158N
murine oligodendrocytes; ii) inactivation of Abcd1 and Acox1 expression in 158N cells is
sufficient to induce overproductions of reactive oxygen species (ROS) and nitrogen species
(RNS) which are increased by C24:0 and C26:0; iii) potential markers of lipid peroxidation
(total 7-hydroxycholesterols, HODEs) are present at high levels especially in the plasma of
some patients with CCALD, the most severe form of X-ALD.
EXPERIMENTAL PROCEDURES
Cell culture and treatments
Normal murine oligodendrocytes (158N) immortalized with the SV40 large T-antigen derive
from Tabby male (Ta/Y) control mice [40, 41]. These cells have some characteristics of well
differentiated oligodendrocytes [39]. They were seeded at 5,000–10,000 cells/cm2 either in
75-cm2 culture flasks or in Petri dishes (100 mm in diameter) and cultured in Dulbecco’s
Modified Eagle Medium (DMEM) supplemented with 5% (v/v) heat inactivated fetal bovine
serum. Cells were incubated at 37°C in an humidified atmosphere containing 5% CO2,
trypsinized (0.05% trypsin-0.02% EDTA solution) and passaged twice a week .
C24:0 and C26:0 were from Sigma-Aldrich (St Louis, MO, USA). They were solubilized in
alpha-cyclodextrin (Sigma-Aldrich) as previously described [42]. Final concentration of
RESULTATS
111
alpha-cyclodextrine (vehicle) in the culture medium is 1 mg/ml [26]. For the different
experiments, the conditions of treatment with VLCFA (tetracosanoic acid C24:0;
hexacosanoic acid C26:0) were the followings. After plating 158N cells in 6 or 12 wells plates
for 48 h, the cells were further treated for 24 or 48 h with various VLCFA concentrations (5,
10, 20, 40 µM) in HAM’s-F10 medium. For transfected cells, cells were plated for 24 h in 12
well plates, transfected with Abcd1 or Acox1 siRNAs for 24 h in DMEM medium
supplemented with 10% SVF, and then treated for 24 h with different VLCFA concentrations
(5, 10, 20 µM) in HAM’s-F10 medium. The concentrations of VLCFA used were in the
ranges of those identified in the plasma of patients with X-ALD, P-NALD, and other
peroxisomal leukodystrophies [38, 43].
Cell counting
After trypsinization with a 0.05% trypsin-0.02% EDTA solution, cells were centrifuged, and
resuspended in culture medium. The total number of cells was determined after 24 h and 48 h
of treatment with C24:0 and C26:0 (5, 10, 20, and 40 µM) under a light microscope (Axioskop
right microscope, Zeiss, Jena, Germany) using a hematocytometer.
Nuclei staining with Hoechst 33342
Nuclear morphology of untreated and VLCFA-treated cells was characterized by fluorescence
microscopy after staining with Hoechst 33342 (2 µg/ml): normal cells are characterized by
round and regular nuclei, apoptotic cells by condensed and/or fragmented nuclei, necrotic
cells by irregular and diffuse nuclei [44]. Cell deposits of about 40,000 cells were applied to
glass slides by cytocentrifugation (5 min, 1,500 rpm) with a cytospin 2 (Shandon, Cheshire,
UK), mounted in Dako fluorescent mounting medium (Dako, Coppenhagen, Denmark), and
stored in the dark at 4°C until observation. The morphological aspect of cell deposits was
determined with an Axioskop fluorescent microscope (Zeiss, Jena, Germany) by using UV
light excitation. For each sample, 300 cells were examined.
Transmission electron microscopy
Transmission electron microscopy was used to visualize the ultrastructural modifications
induced by VLCFA (C24:0 and C26:0, 20 µM, 24-48 h) on 158N murine oligodendrocytes.
Briefly, the samples were fixed for 1 h at 4°C in 2.5% (w/v) glutaraldehyde diluted in
cacodylate buffer (0.1 M, pH 7.4), washed twice in cacodylate buffer (0.1 M, pH 7.4), post-
fixed in 1% (w/v) osmium tetroxide diluted in cacodylate sodium (0.1 M, pH 7.4) for 1 h at

RESULTATS
112
room temperature in the dark, and rinsed twice in cacodylate buffer (0.1 M, pH 7.4). The
preparations were then dehydrated in graded ethanol solutions and embedded in Epon. Ultra-
thin sections were cut with a diamond knife on an ultramicrotome, contrasted with uranyl
acetate and lead citrate, and examined under an H7500 electron microscope (Hitachi, Tokyo,
Japan).
Flow cytometric evaluation of cell viability by staining with propidium iodide
At the end of the incubation times (24 - 48 h) in the absence or in the presence of C24:0 or
C26:0 (5, 10, 20, and 40 µM), 158N cells were colored with propidium iodide (PI), which
enters cells with permeable plasmatic membrane and stains dead cells only [45]. Fluorescence
of PI was collected using a 590/10 nm bandpass filter and measured on a logarithmic scale.
Flow cytometric analyses were performed on Galaxy flow cytometer (Partec, Münster,
Germany). Ten thousand cells were acquired for each sample. Data were analyzed with
FlowMax software (Partec).
Flow cytometric measurement of transmembrane mitochondrial potential with JC-1
Variations of the mitochondrial transmembrane potential (∆Ψm) were measured with 5,5',6,6'-
tetrachloro-1,1',3,3'-tetraethylbenzimidazolylcarbocyanine iodide (JC-1; Invitrogen, Cergy
Pontoise, France) which allows to determine the percentage of cells with low ∆Ψm. JC-1 is a
cationic dye that exhibit potential-dependent accumulation in mitochondria, indicated by a
fluorescence emission shift from green (~525 nm) to red (~590 nm). Consequently,
mitochondrial depolarization is indicated by a decrease in the red fluorescence and by an
increase of green fluorescence. In viable cells, the potential-sensitive color shift is due to
concentration dependent formation of red fluorescent J-aggregates in mitochondria [46]. JC-1
stock solution was prepared at 1 mg/ml in DMSO, stored in the dark at -20°C, and used at 1
µg/ml on cell suspension adjusted at 1 x 10⁶ cells per ml of culture medium. Flow cytometric
analyses were performed on Galaxy flow cytometer (Partec). Ten thousand cells were
acquired for each sample. Data were analyzed with FlowJo software (Tree Star Inc., Ashland,
OR, USA).
Flow cytometric measurement of superoxide anions, hydrogen peroxide, and nitric oxide
The production of superoxide anions, hydrogen peroxide, and nitric oxide was performed on
sub-confluent 158N murine oligodendrocytes cultured in the absence or in the presence of
VLCFA (5, 10 and 20 µM) for 24 h.

RESULTATS
113
The whole intracellular production of superoxide anion (O2.−) was detected with DHE
(Invitrogen) which is a non-fluorescent compound which can diffuse through cell membranes,
and which is rapidly oxidized in ethidium under the action of O2.− [47]. DHE was initially
prepared at 10 mM in DMSO and used at 2 µM final concentration on cell samples of 1x10⁶
cells/mL of HAM’S F10 medium. Cells were incubated for 15 min at 37°C cells before flow
cytometric analysis.
The mitochondrial production of superoxide anion (O2.−) was detected with MitoSOX
(Invitrogen). MitoSOX™ Red reagent is live-cell permeant and is rapidly and selectively
targeted to the mitochondria. Once in the mitochondria, MitoSOX™ Red reagent is oxidized
by superoxide and exhibits red fluorescence (λEx= 510 nm; λEm= 580nm). MitoSOX™ Red
reagent is readily oxidized by superoxide but not by other ROS- or reactive nitrogen species
(RNS)–generating systems. The oxidation product becomes highly fluorescent upon binding
to nucleic acids [48, 49]. MitoSOX was initially prepared at 5 mM in PBS and used at 5 µM
final concentration on cell samples of 1×10⁶ cells/mL of PBS. Cells were incubated for 15
min at 37°C cells before flow cytometric analysis.
To detect nitric oxide (NO), DAF-FM diacetate (4-amino-5-methylamino- 2’, 7’-difluorescein
diacetate) (Invitrogen) was used [50]. Inside the cells, DAF-FM diacetate rapidly reacts with
NO to form the fluorescent compound benzotriazole derivative (λEx max 495 nm, λEm max
515 nm). DAF-2 was prepared at 5 mM in DMSO and used at 10 µM on cell samples of
1x10⁶ cells/ml of PBS. After 15 min of incubation at 37 °C, cells were analyzed by flow
cytometry.
DHR123 is a lipophilic oxidation-sensitive indicator of H2O2 which is known to enter cells
and intracellular compartments easily [51]. DHR123 is oxidized by H2O2 and forms the
cationic, membrane-impermeable fluorescent dye Rh123. Thus, fluorescence Rh123 reflects
intracellular H2O2 level . DHR123 (Sigma-Aldrich ) was prepared at 2 mM in DMSO and
used at 6 µM on cells samples of 1x10⁶ cells/ml of PBS. After 15 min of incubation at 37 °C,
cells were analyzed by flow cytometry.
The fluorescent signals were collected either through a 520± 20 nm band pass filter (DHR123,
DAF-FM), a 580± 20 nm band pass filter (DHE) or a 420 nm long pass filter on a logarithmic
scale of four decades of log on a GALAXY flow cytometer (Partec) equipped with an argon
laser emitting at 488 nm. For each sample, 10,000 cells were acquired and the data were
analyzed with Flomax software (Partec).
RESULTATS
114
Quantification of reduced and total glutathione
The redox status was also evaluated by the level of intracellular reduced glutathione (GSH)
and total glutathione by using flow cytometric and colorimetric methods, respectively.
By flow cytometry, intracellular level of GSH was determined after staining with
monochlorobimane (MCB) ([(syn-(ClCH2, CH3)-1,5-diazabicyclo-[3.3.0]-octa-3,6-dione-2,8-
dione); λEx max: 380 nm, λEm max: 461 nm]) (Invitrogen) [52]. MCB, which reacts with
GSH under the action of glutathione S-transferase, was prepared at 4 mM in 100% ethanol
and stored in the dark at 4°C. It was added at 200 µM in cell suspensions adjusted to 106
cells/ml in PBS. After 30 min of incubation at 37°C, cells were washed and mixed in PBS,
and the blue fluorescence of MCB was collected with a 420-nm-long pass filter on a
GALAXY flow cytometer (Partec) equipped with a UV lamp. For each sample, 10,000 cells
were acquired and the data were analyzed with Flomax software (Partec).
Total GSH was quantified by a colorimetric method by using the ApoGSHTM glutathione
colorimetric kit (BioVision, Mountain View, CA). Briefly, a cell lysat was performed on 5 x
105 cells, and for each sample 20 µl of cell lysat were added to a mix constituted of 20 µl
NADPH Generating Mix, 20 µl glutahtione reductase, and 120 µl glutathione reaction buffer.
After 10 min incubation at room temperature 20 µl of glutathione substrate (DTNB) were
added, and futher incubated for 10 min at room temperature. The absorbance was read at 405
nm, and data obtained were quantified by using a standard glutathione calibration curve and
expressed in ng of total glutathione/106 cells.
Quantification of superoxide dismutase activity
The total superoxide dismutase (SOD) activity was measured using a SOD Assay Kit-WST
(Dojindo Molecular Technologies, Tokyo, Japan). Briefly, the total SOD activity was
measured by the inhibition rate of 2-(4-iodophenyl)-3-(4-nitrophenyl)-5-(2,4-disulfophenyl)-
2H-tetrazolium, monosodium salt (WST-1) reduction. SOD activity was expressed as units
per milligram of protein (1 U was defined as the amount of enzyme protein that inhibited the
reduction of WST-1 by 50%).
Quantification of catalase activity
To perform enzymatic activity, the protein extract was prepared on 8–30 × 106 cells in the
following conditions. Cells were mixed in 7.5 ml PBS containing a mixture of protease
inhibitors (Roche Diagnostics Inc, Basel, Switzerland), and three successive freezing and
thawing cycles were performed. The samples were then sonicated, centrifuged at 14,000 rpm
RESULTATS
115
for 30 min, and the supernatant, constituting the enzymatic solution, was collected. Catalase
activity was quantified with the Amplex Red Catalase Assay Kit (Invitrogen), which is a
sensitive assay that uses a nonfluorescent detection reagent to measure the H2O2 substrate left
over from the catalase reaction. In the assay, catalase first reacts with H2O2 to produce water
and oxygen (O2). Next the Amplex Red reagent reacts with a 1:1 stochiometry with any
unreacted H2O2 in the presence of horseradish peroxidase (HRP) to produce the highly
fluorescent oxidation product, resorufin. Therefore, as catalase activity increases, the signal
from resorufin decreases. The stock solution of Amplex Red was prepared in DMSO and
stored at -20°C. The reaction medium containing 25 µl H2O2 (20 µM final concentration) and
25 µl of enzymatic solution was incubated at room temperature for 30 min. At the end of the
incubation time, 50 µL of reaction mixture (100 µM Amplex Red, 0.4 U/mL HRP) was
added, and the mixture was incubated at 37°C for 30 min. The absorbance of resorufin-
formed solution was measured at 570 nm using a spectrophotometer. One unit of the enzyme
is defined as 1µmol of H2O2 consumed per minute and the specific activity is reported as units
per milligram of protein.
Flow cytometric evaluation of DNA fragmentation
To determine the percentage of SubG1 cells (indicating the presence of cells with inter-
nucleosomal DNA fragmentation characteristic of apoptotic cells) and of hypodiploid cells
(indicating the presence of cells with degraded DNA) [53], 158N cells were seeded in 6 well
plates (70,000 cells/well) in 2 ml of culture medium. The cells were cultured in the absence or
in the presence of C24:0 or C26:0 (10 and 20 µM) for 24 h. At the end of the incubation time
non-adherent cells and cells collected by trypsinization were pooled, washed in PBS and fixed
in 2 ml cold 80% ethanol for 2 h at -20°C. The cells were washed again twice with 4 ml PBS
and stained by a 80 µg/ml solution of propidium iodide (PI) containing 200 µg/ml RNAse A.
Stained cells were analysed with a Galaxy flow cytometer (Partec) equipped with a 488 nm
blue laser providing acquisition of 10,000 events. Red fluorescent of PI was detected through
a 625 nm long pass filter to measure the DNA content. Data were analyzed with FlowJo
software (Tree Star Inc.)
Quantification of protein carbonylation
Protein carbonyl groups were quantified y using Protein Carbonyl assay kit (Cayman
Chemical, Ann Arbor, MI, USA). Cells were collected by trypsinization, homogenized and
sonicated on ice for protein extraction in 1 ml of 2-(N-morpholino) ethanesulfonic acid

RESULTATS
116
monohydrate cold buffer (50 mM). The samples were then centrifuged at 10,000 g for 15 min
at 4°C and the supernatant constituting the protein solution was collected. The contaminating
nucleic acid present in the sample was removed by incubation with streptomycin sulphate
used at 1% final concentration. 800 µL of DNPH were added to 200 µl of assay extract,
mixed, incubated for 1 h at room temperature. A blank without DNPH was performed for
each sample. Proteins were precipitated with an equal volume of 20% trichloroacetic acid and
centrifuged at 10,000 g for 10 min. The precipitated protein pellet was washed three times
with ethanol/ethylacetate mixture (v/v). After washing, the proteins were collected by
centrifugation at 10,000 g for 10 min. The pellet was dissolved in 500 µL of guanidine
hydrochloride (6 M) by vortexing, and 220 µl of this final solution was transferred into two
wells of a 96-well plate. The absorbance of DNPH in the assay (ε =0,022 µM−1 cm−1) was
measured at 380 nm against the blank.
Flow cytometric and microscopical analysis of 4-hydroxynonenal
4-hydroxynonenal (4-HNE) is an α,β-unsaturated hydroxyalkenal which is produced by lipid
peroxidation in cells and is therefore a suitable marker of oxidative stress. As 4-HNE has an
aldehyde function, it is highly reactive and can react with various molecules giving 4-
hydroxynonenal adducts [54, 55].
To identify and quantify 4-HNE and 4-HNE adducts, by flow cytometry cells were collected
by trypsinization (Sigma-Aldrich), washed, and resuspended in PBS, and fixed in freshly
prepared 2% paraformaldehyde diluted in PBS (pH 7.4) for 10 min at room temperature.
Furthermore, the cells were treated with the FACS permeabilizing solution 2 (BD-
Biosciences, San Jose, CA, USA) for 10 min. After washing in PBS, cells were then
incubated for 20 min with blocking buffer (PBS, 0.05% saponine, 10% goat serum), washed
in PBS, and incubated for 1 h at room temperature with a mouse monoclonal anti 4-HNE
(Abcys, Paris, France) diluted in blocking buffer (2 µg/ml). Cells were further washed twice
with PBS and incubated for 1 h at room temperature with a 488-Alexa goat anti mouse
polyclonal antibody diluted at 1/300 in blocking buffer. Cells were further washed and
resuspended in PBS, and immediately analyzed by flow cytometry on a GALAXY flow
cytometer (Partec). The green fluorescence of 488-Alexa was collected with a 520/10-nm
band pass filter. The fluorescent signals were measured on a logarithmic scale. For each
sample, 10,000 cells were acquired, and the data were analyzed with FlowMax (Partec) and
FlowJo (Tree Star Inc.) softwares.

RESULTATS
117
For fluorescence microscopy, immunofluorescence staining procedure was similar that by
flow cytometry but the secondary antibody is a 594 nm -Alexa goat anti mouse polyclonal
antibody (Invitrogen) diluted at 1/300 in blocking buffer. Immunofluorescence staining was
performed on cells seeded at 10,000 cells/cm2 on 12 mm glass coverslips or on cell deposits,
applied to glass slides by cytocentrifugation with a cytospin 4 centrifuge (Shandon, Cheshire,
UK). After washing with PBS, slides were mounted, and observations were realized with an
Axioskop Zeiss microscope ((Zeiss, Jena, Germany).
Quantification of total 7-hydroxycholesterols, hydroxyoctadecadienoic acids, and very long
chain fatty acids (C24:0, C26:0) by gas chromatography or liquid chromatography coupled
with mass spectrometry
Analyses performed by gas or liquid chromatography coupled with mass spectrometry were
realised with deuterated internal standards such as 7β-hydroxycholesterol-d7 and 13(S)-
hydroxyoctadecadienoic acid-d4 obtained from Cayman Chemical (Ann Arbor, MI, USA).
Oxysterol analysis was performed after reduction of 7-ketocholesterol and after hydrolysis of
oxysterol-esters with KOH in order to obtain 7β- and 7α-hydroxycholesterol (total 7-
hydroxycholesterols), as previously described [56]. A silylating agent, N,Obis(trimethylsilyl)-
trifluoroacetamide (Pierce; Rockford, IL, USA) was added to obtain trimethyl silyl esthers
which will be analysed using a HP6890 Gas Chromatograph equipped with a HP5973 Mass
Selective Detector (Agilent Technologies, Santa Clara, CA, USA) and a HP-5MS fused silica
capillary column (30 m x 0.25 mm inner diameter, 0.25 µm film thickness) (Agilent
Technologies). The gas chromatography-mass spectrometry (GC-MS) conditions were as
follows: carrier gas, helium at a flow-rate of 1.1 ml/min; injector temperature, 250°C; oven
temperature, 180°C, increased at 10 °C/min to 260°C, then at 1°C/min to 280°C and held for
5 min. The mass spectrometer was operated under electron impact mode with electron energy
of 70 eV. The ion source and the quadrupole temperature were 230°C and 150°C,
respectively.
Total hydroxyoctadecadienoic acids (9-hydroxy-octadecadienoic acid, and 13-hydroxy-
octadecadienoic acid: HODEs) analysis was carried out on a Zorbax Eclipse Plus C18,
2.1x100 mm, 1.8 µm column (Agilent Technologies) in a 1200 HPLC (Agilent Technologies).
Conditions of chromatography were as described [56]. The ESI-MS analyses were performed
using a 6460 triple quadrupole (Agilent Technologies) by multiple reaction monitoring
(MRM) after collision-induced dissociation in the negative mode with the use of nitrogen as

RESULTATS
118
collision gas. Transitions were the same as described [56] and collision energy was
determined after the optimization of MS/MS.
Quantification of C24:0 and C26:0 was realized as previously described [57] using a
HP7890A Gas Chromatograph equipped with an HP7683 Injector and a HP5975C Mass
Selective Detector (Agilent Technologies). Chromatography was performed using an HP-
5MS fused silica capillary column (30 m x 0.25 mm inner diameter, 0.25 mm film thickness,
Agilent Technologies). The GC-MS conditions were as follows: carrier gas, helium at a flow-
rate of 1.1 ml/min; injector temperature, 250°C, splitmode; oven temperature 140°C,
increased at 5°C/min to 300°C, and held for 10 min. The mass spectrometer was operated
under negative chemical ionization mode with methane as reactant gas. The ion source
temperature and the quadrupole temperature were 150°C and 106°C, respectively. A SIM
program was used for mass spectrometry with [M - 181] (-) ions as quantification.
Repartition of C24:0 and C26:0 in lipid sub-classes
Total lipids of 158N cells cultured for 24 h in the absence or in the presence of alpha-
cyclodextrine (1 mg/ml), C24:0 or C26:0 (5, 10, and 20 µM) were extracted with
chloroform/methanol (2/1 v/v) according to the method of Folch [58]. Lipid mixtures were
separated by chromatography affinity in three classes (neutral sterols, phospholipids, and free
fatty acids (FFA)) as previously described [59]. Lipid extracts were further incubated at 56°C
for 45 min. After incubation, fatty acids were extracted by adding 1 ml of 1.2 M HCl and 2 ml
of hexane to each tube. The tubes were shaken at room temperature for 5 min, centrifuged and
the organic phase was evaporated to dryness under nitrogen and derivatized to
pentafluorobenzyl esters with 100 ml of acetonitrile, 5 ml of pentafluorobenzyl bromide and 5
ml of diisopropylethylamine at room temperature for 30 min. Internal standard used were
C17:0-cholesterol, tricosanoic acid (C23:0), and diC21:0-phosphatidylcholine. Quantification
of C24:0 and C26:0 was realized as previously described [57] using a HP7890A Gas
Chromatograph equipped with an HP7683 Injector and a HP5975C Mass Selective Detector
(Agilent Technologies). The ions used for analysis (m/z) were as follows: C17:0, 269; C21:0,
325; C23:0, 353; C24:0, 367; C26:0, 395.
Inactivation of Abcd1 and Acox1 with SiRNAs
Acox1 siRNAs were from Invitrogen, and Abcd1 siRNAs were from Ambion (Applied
Biosystems, Courtaboeuf, France). These siRNAs were used at 30 nM and transfected in
158N cells by means of the INTERFERin transfection reagent according to the manufacturer's

RESULTATS
119
instructions (Polyplus / Ozyme, St Quentin en Yvelines, France). For Abcd1 inactivation,
three siRNAs were tested:
siRNA 1 (1D s62233), 5′-cacugucguuuuaagaggatt-3′(sense) and
5′-uccucuuaaaacgacagugtt-3′(antisense);
siRNA 2 (1D s62234), 5′-ccaacagacuuacuaccgatt-3′(sense) and
5′-ucgguaguaagucuguuggga-3′(antisense);
siRNA 3 (1D s62235), 5′-gaagccgucuaguagcucatt-3′(sense) and
5′- ugagcuacuagacggcuucgg-3′(antisense).
For Acox1 inactivation, three siRNAs were also used:
siRNA 1 (stealth 373), 5′-auuaacucuggauugaagguggcgg-3′(sense) and
5′-ccgccaccuucaauccagaguuaau-3′(anti-sense);
siRNA 2 (stealth 813), 5′-cccaagacccaagaguucauucuca-3′(sense) and
5′-ugagaaugaacucuugggucuuggg-3′(anti-sense);
siRNA 2 (stealth 1260), 5′-aggcgccagucugaaaucaagagaa-3′(sense) and
5′-uucucuugauuucagacuggcgccu-3′(anti-sense)].
A negative control siRNA (Ambion) directed aginst gene sequences with no significant
homology to any known genes from mouse, rat, or human were simultaneously used. Twenty-
four hours after siRNA transfection, cells were collected by trypsinization and used to analyze
the expression of Abcd1 and Acox1 mRNAs and proteins by RT-qPCR and western blotting,
respectively. To evaluate transfection efficiency, a Silencer Cy3TM labeled negative control-
siRNA (Ambion) was used, and the percentage of transfected cells was determined 24 h after
transfection by fluorescence microscopy using an Axioskop Zeiss microscope (Zeiss).
Quantification of Abcd1 and Acox1 mRNAs by RT-qPCR
Cells were harvested with trypsin/EDTA and washed with PBS. Total RNA isolation from
control, Scrambled RNA, Abcd1 SiRNAs and Acox1 SiRNAs treated-158N cells was
extracted using the RNeasy Mini kit (Qiagen, Cortaboeuf, France) following the
manufacturer’s instructions. cDNA was generated by reverse transcription using QuantiTect
Rev. Transcription Kit (Qiagen) according to the manufacturer’s protocol and analyzed by
quantitative PCR using the SYBR Green (BioScience Technology, Rockaway, NJ, USA) real-
time PCR technology, and an iCycler iQ Real-Time Detection System (Bio-Rad laboratories,
Marne la Coquette, France). The primer sequences are: (Abcd1: forward 5'-
acatccctatcatcacacccactg-3' and reverse 5'-gagaactcttgccacagccattg-3'; Acox1: forward 5'-
RESULTATS
120
gcccaactgtgacttccatt-3' and reverse 5'-ggcatgtaacccgtagcact-3'; L27: forward 5'-
ctcatgcccacaaggtactctgtg-3' and reverse 5'-tgtatcgctcctcaaacttgacct-3') were chosen using the
Beacon Designer Software (Bio-Rad laboratories). Thermal cycling conditions were as
follows: activation of DNA polymerase at 95°C for 10 min, followed by 40 cycles of
amplification at 95°C for 15 s, 60°C for 30 s, and 72°C for 30 s, followed by a melting curve
analysis to control the absence of nonspecific products. Gene expression was quantified using
cycle to threshold (Ct) values and normalized by the L27 reference gene. The quantitative
expression of Abcd1, Acox1 and β-actin, was determined according to 2-∆Ct with ∆Ct = (Ct of
the gene studied) – (Ct of the L27), or as fold induction of the control.
Characterization and quantification of Abcd1 and Acox1 proteins by western blotting
After 24 h of transfection (2 days of culture), cells were trypsinized, washed with PBS,
harvested and lysed in a 10 mM Tris/HCl buffer, pH 8, containing 10 mM EDTA, 1% Triton
X100, 100 mM NaCl and a protease inhibitor cocktail (Roche Diagnostics Inc.) for 20 min on
ice. After centrifugation at 17,000 g for 20 min at 4 C°, the total protein concentrations of
supernatants were determined using bovine serum albumin as a standard (Bio-Rad
Laboratories). A total protein (30 µg) was run on SDS-polyacrylamide gels (10%) according
to Laemmli [60], and transferred onto a PVDF membrane (Bio-Rad Labratories) as previously
described [61]. The membrane was blocked in TBS with 0, 1% Tween containing 5% skim
milk (blocking buffer) and incubated overnight at 4°C. Primary antibodies, anti Abcd1
1/5,000 (rabbit polyclonal, serum 925029), anti Acox 1/500 (rabbit polyclonal) have been
described elsewhere (36), and anti β-actin 1/10,000 (mouse monoclonal, Sigma-Aldrich) were
diluted in blocking buffer and applied to sections for 1 h at room temperature, (for anti
Abcd1, the blocking buffer contained 1% skim milk). The membranes were washed TBS with
10% Tween 20 (TBST). Bands were detected using anti-IgG polyclonal antibody conjugated
to peroxidase 1/10,000 (Santa Cruz, CA, USA) for 1 h at room temperature. The membranes
were washed in TBST and revealed using an enhanced chemiluminescence detection kit
(Santa Cruz Biotechnology Inc, Santa Cruz, CA, USA) and autoradiographed.
Patients and plasma preparation
Blood plasma taken from 25 male patients with different clinical forms of X-ALD (8
CCALD, 3 ACALD, 4 Addison dissease, 10 AMN) and from 10 healthy subjects were used to
evaluate the presence of lipid peroxidation markers associated with oxidative stress (total 7-
hydroxycholesterols, HODEs), and to measure the plasmatic levels of C24:0 and C26:0 which

RESULTATS
121
are present at increased levels in X-ALD patients. Patients were diagnosed in the department
of neurology of Pr P Aubourg (Hôpital St Vincent de Paul/INSERM U745, Paris, France).
The protocol of this clinical study was in agreement with the principles of the Helsinki’s
declaration, and was ethically approved by the local Committee on Human Research. All
patients gave written inform consent for participation in this study prior to enrolment.
Statistical analysis
Statistical analyses were performed on at least three independent experiments using SigmaStat
2.03 software (Systat Software Inc) with the Mann-Whitney test. The Wilcoxon test was used
for human plasma samples analysis. Data were considered statistically different at a P-value of
0.05 or less.
RESULTS
Effects of C24:0 and C26:0 on oligodendrocytes growth and viability
The effects of C24:0 and C26:0 (5, 10, 20, and 40 µM) on oligodendrocyte cell growth and
viability was investigated after a 24 and 48 h period of treatment on sub-confluent 158N
murine oligodendrocytes. At these concentrations, oligodendrocytes show strong
accumulations of C24:0 or C26:0 at 24 h in a dose-dependent manner (Table 1). Thus,
marked accumulations of C26:0 (up to 5.4) were observed in C24:0-treated cells, suggesting
the activation of elongases catalyzing the synthesis of VLCFA [62]. On the other hand, up to
2.7 folds increase of the C24:0 level was shown in the C26:0-treated cells, revealing the
possible induction of C26:0 peroxisomal -oxidation system. Moreover, the ratio [C24:0] /
[C26:0] in untreated cells is around 7, and is comprised between 3 to 4 in VLCFA-treated
cells. It is suggested, that this higher accumulation of C24:0 may be due either to different
capture and transport, and or different metabolisms. In addition, analysis of the repartition of
VLCFA in neutral sterols, phospholipids and free fatty acids (FFA) show a major
accumulation under the form of FFA (Table 1). However, as the fold increase of C24:0 and
C26:0 is important (up to 4 as soon as 5 µM when compared to untreated cells), a dose
dependent increase of the quantity of VLCFA in neutral sterols and phospholipids (expressed
in ng/106 cells) was observed (Table 1). In these conditions, as shown on Figure 1, at 5 and
10 µM, there was no effects on cell growth (quantified by counting on a hematocytometer)
(Figure 1A-B), and on cell viability (determined by flow cytometry after staining with
propidium iodide)(Figure 1C-D). However, at 20 and 40 µM, cell growth was strongly

RESULTATS
122
inhibited (up to 60 %) and the percentages of dead cells were 4 to 5 times higher than in
untreated cells (Figure 1A-D). As the effects of C24:0 and C26:0 on cell growth and cell
viability were in the same range of order at 24 and 48 h, the effects of C24:0 and C26:0 on
∆Ψm were only determined at 24 h (Figure 1E). In these conditions, the percentages of cells
with depolarized mitochondria were in the range of 10 % in C24:0 and C26:0 (10 µM) -
treated cells, and in the range of 40-60 % in C24:0 and C26:0 (20 µM) - treated cells, whereas
they were around of 5 % in untreated cells. With alpha-cyclodextrine, used as vehicle to
solubilized C24:0 and C26:0, no effects on cell growth, cell viability, and ∆Ψm were
observed when compared to untreated cells. In addition, in order to precise the mode of cell
death induced by C24:0 and C26:0, the morphological aspects of VLCFA-treated cells were
observed by fluorescence microscopy after staining with Hoechst 33342, and by transmission
electron microscopy allowing to distinguish viable cells with round and regular nuclei,
apoptotic cells with fragmented and/or condensed nuclei, and necrotic cells with disturbed
nuclei of various sizes and shapes [44]. In these conditions, on VLCFA (10, 20 or 40 µM; 24-
48 h)-treated cells, when compared to untreated cells, no cells with condensed and/or
fragmented nuclei were detected, and only few cells with swollen nuclei (evocating oncotic
cells) were observed (our data not shown), supporting that VLCFA did not induce an
apoptotic mode of cell death. As similar results were obtained at 20 and 40 µM, further
investigations were only performed with C24:0 and C26:0 used at 5, 10 and 20 µM after 24 h
of treatment.
VLCFA (C24:0 and C26:0) increase oligodendrocyte production of superoxide anions,
hydrogen peroxide and nitric oxide
The effects of C24:0 and C26:0 (5, 10, and 20 µM) on the production of superoxide anions
(O2.-), hydrogen peroxide (H2O2) and nitric oxide (NO) was investigated after a 24 h period of
treatment on sub-confluent 158N oligodendrocytes (Figure 2). The superoxide anions
production was analyzed by staining with DHE allowing quantification of the whole
intracellular pool of superoxide anions inside the cells, and with MitoSOX staining, which
permits the specific measurement of mitochondrial superoxide anions production, since the
loss of ∆Ψm observed with JC-1 can suggest mitochondrial dysfunctions. With DHE and
MitoSOX, when compared to untreated cells, no overproduction of superoxide anions was
observed with C24:0 or C26:0 used at 5 µM, whereas slight and high increased were detected
at 10 and 20 µM, respectively (Figure 2 A-B). With DHR123, the production of hydrogen
peroxide detected was similar to that observed in untreated cells with C24:0 or C26:0 used at
RESULTATS
123
5 µM, slightly higher at 10 µM, and strongly enhanced at 20 µM (Figure 2C). With DAF-2
allowing to quantify NO, when compared to untreated cells, a dose dependent increase of NO
production was found under treatment with C24:0 or C26:0 from 5 to 20 µM (Figure 2D).
Comparatively to untreated cells, no significant effects of alpha-cyclodextrine were observed
on superoxide anions, hydrogen peroxide and nitric oxide production (Figure 2).
VLCFA (C24:0 and C26:0) alter the anti-oxidant defences of oligodendrocytes
The effects of C24:0 and C26:0 (5, 10, 20 µM) on anti-oxidant defences were determined by
measuring the intracellular levels of total and reduced glutathione, the activity of superoxide
dismutases (SOD), which constitute a class of enzymes that catalyze the dismutation of
superoxide into oxygen and hydrogen peroxide, and the activity of catalase catalyzing the
degradation of hydrogen peroxide (2H2O2 → O2 + 2H2O). GSH level, SOD and catalase
activities were studied since they represent the major anti-oxidant defences in the CNS [63,
64].
Under treatment with C24:0 or C26:0, when compared to untreated 158N oligodendrocytes,
an important decrease of total glutathione was only observed at 10 and 20 µM (Figure 3A).
With monochlorobimane (MCB), allowing to detect reduced glutathione, comparatively to
untreated cells, a significant decrease of glutathione positive cells detected by flow cytometry
was only found at 20 µM (Figure 3B). Increased SOD activity and decreased catalase activity
were simultaneously detected when C24:0 and C26:0 were used at 20 µM (Figure 3C-D). In
addition, catalase activity was reduced in 158N by C24:0 used at 5 and 10 µM, whereas the
same concentrations of C26:0 had no effects (Figure 3D). Comparatively to untreated cells,
no significant effects of alpha-cyclodextrine were observed on the different parameters used
to estimate anti-oxidant defences (Figure 3).
VLCFA (C24:0 and C26:0) induce lipid peroxidation in oligodendrocytes
The consequences of reactive oxygen species (ROS) and reactive nitrogen species (RNS)
overproduction on lipid peroxidation was investigated on sub-confluent 158N cells treated for
24 h with C24:0 or C26:0 used at 5, 10, or 20 µM by measuring the levels of various
molecules resulting from lipid peroxidation: 4-hydroxynonenal (4-HNE), total 7-
hydroxycholesterols, and total hydroxyoctadecadienoic acids (HODEs).
Increased levels of 4-HNE were observed by fluorescence microscopy and flow cytometry in
C24:0- or C26:0- treated 158N oligodendrocytes, especially at 10 and/or 20 µM (Figure 4A),
whereas low and similar levels of 4-HNE were detected in untreated- and alpha-

RESULTATS
124
cyclodextrine-treated cells. At these concentrations, Figure 4B shows increased levels of total
7-hydroxycholesterols (including 7α-hydroxycholesterol, 7β-hydroxycholesterol, and 7-
ketocholesterol) used as biomarkers of free radical oxidation of cholesterol. In addition, total
hydroxyoctadecadienoic acids (HODEs: including 9-hydroxy-octadecadienoic acid, and 13-
hydroxy-octadecadienoic acid) resulting from peroxidation of linoleate (Figure 4C) were
significantly increased indicating the occurrence of cellular damages induced either by
reactive oxygen species and/or nitric oxygen species overproduction.
Induction of DNA degradation and protein carbonylation by VLCFA (C24:0 and C26:0)
in oligodendrocytes
The consequences of ROS and RNS overproduction on DNA degradation and protein
carbonylation was investigated on sub-confluent 158N oligodendrocytes treated for 24 h with
C24:0 or C26:0 used at 10, or 20 µM by measuring DNA degradation and protein
carbonylation.
As ROS and RNS are able to generate a variety of DNA lesions, including DNA strand breaks
[65], DNA degradation was estimated by the presence of a SubG1 peak and of hypodiploid
cells using flow cytometry analysis following propidium iodide staining (Figure 5A). The
percentages of SubG1 cells (cells with inter-nucleosomal fragmented DNA corresponding to
apoptotic cells) is similar in untreated cells and alpha-cyclodextrine-treated cells, and slightly
higher in C24:0 - or C26:0 – treated 158N cells. However, comparatively to untreated cells,
increased levels of carbonylated proteins were identified at higher concentrations (10 and 20
µM) in C24:0- or C26:0– treated 158N oligodendrocytes.
As for protein carbonylation (Figure 5B), the levels of carbonylated proteins were similar in
untreated-, alpha-cyclodextrine-, C24:0 and C26:0 (5 µM)-treated cells. However,
comparatively to untreated cells, increased levels of carbonylated proteins were identified in
C24:0 and C26:0 (10 and 20 µM) – treated cells.
Consequence of siRNA-mediated knockdown of Abcd1 or Acox1 and effects of VLCFAs
(C24:0 or C26:0) treatments on oxidative stress in oligodendrocytes
In order to determine whether Abcd1 and Acox1 are involved in the control of oxidative
stress, we chose to inactivate Abcd1 and Acox1 expression by silencing of the corresponding
mRNAs in 158N murine oligodendrocytes. The assessment of the efficiency of Abcd1 or
Acox1 silencing was accomplished at both mRNA and protein levels using different siRNAs.
In our experimental conditions, the efficiency of transfection was 90 + 10 %. As shown in
RESULTATS
125
Figure 6, the three different siRNAs raised against Abcd1 or Acox1 knock down the
expression of the corresponding mRNAs with similar efficiencies (Figure 6A). From the
three transfected different siRNAs, Abcd1#2 and Acox1 #2 were the most efficient (more
than 70% knockdown) at protein levels in oligodendrocytes (Figure 6B). Therefore, for
further investigations, these two siRNAs were used.
Interestingly, inactivation of Abcd1 or Acox1 strongly increased the production of superoxide
anions and hydrogen peroxide (Figure 7A-B), whereas it only slightly enhanced nitric oxide
production (Figure 7C). Therefore, comparatively to untransfected cells, the production of
superoxide anions and hydrogen peroxide were always higher when Abcd1 and Acox1 were
inactivated, and when the transfected cells were cultured either in the absence or in the
presence of C24:0 or C26:0 used at 5, 10 and 20 µM (Figure 7A-B). Moreover, these
increases were similar in untreated and alpha-cyclodextrin-treated cells, and no significant
increase of superoxide anions and nitric oxide were observed in cells treated with scrambled
siRNAs (Figure 7A-B).
Evidence of oxidative stress revealed by the presence of markers of lipid peroxidation
(total 7-hydroxycholesterols, hydroxyoctadecadienoic acids (HODEs)) in the plasma of
patients with X-ALD
This activation of oxidative stress by inactivation of Abcd1 or Acox1 on 158N murine
oligodendrocytes lead us to investigate the presence of markers of lipid peroxidation (total 7-
hydroxycholesterols, hydroxyoctadecadienoic acids (HODEs)) generated by an oxidative
stress in the plasma of patients with different forms of X-ALD (CCALD, ACALD, Addison
disease and AMN) as well as in the plasma of healthy subjects. To this end, total 7-
hydroxycholesterols, VLCFA, and HODES were quantified by GC/MS, and LC/MS,
respectively, in the plasma of X-ALD patients and healthy subjects (Figure 8).
Although high levels of C24:0 and C26:0 were observed in the different populations of
patients studied and do not allow to distinguish the different forms of the disease (Figure 8A-
B), the higher levels of total 7-hydroxycholesterols (Figure 8C), and HODEs (Figure 8D)
were found in patients with CCALD, and were in the following range of order for total 7-
hydroxycholesterols and HODEs: CCALD > Addison disease > AMN > ACALD.
Noteworthy, in ACALD patients, the levels total 7-hydroxycholesterols and HODEs of were
in the same range of order than in healthy subjects. So, our data underline that oxidative
damages can be involved in the physiopathology of X-ALD. However, among patients with
CCALD, 75% (6 patients among 8 studied) have both very high levels of total 7-
RESULTATS
126
hydroxycholesterols and HODEs whereas 25% (2 patients among 8 studied) have
simultaneously low levels of total 7-hydroxycholesterols and HODEs. In these later patients,
the levels of total 7-hydroxycholesterols and HODEs were in the range of those found in
ACALD patients. In the plasma of healthy subjects, low levels of C24:0, C26:0,
hydroxycholesterols and HODEs were identified.
DISCUSSION
Increased rates of oxidative and nitrosative stress are major factors associated with the
pathogenesis of neurodegenerative diseases, playing a key role in these pathologies including
amyotrophic lateral sclerosis and Parkinson’s disease [66, 67]. Furthermore, experimental
models and clinical investigations [31, 34], have brought some arguments suggesting that
oxidative stress might be involved in the pathogenesis of peroxisomal leukodystrophies
associated either with peroxisomal biogenesis disorders or with altered VLCFA peroxisomal
β-oxidation [1]. Thus, oxidative damages could be linked to both initiation and progression of
demyelination which constitutes a major event of peroxisomal leukodystrophies. However,
the origin of this oxidative stress remains to be elucidated, mainly the part taken by the
accumulation of C24:0 and C26:0 in oligodendrocytes, the myelin synthetizing cells [68], and
by peroxisomal dysfunctions (ABCD1 deficiency in X-ALD, ACOX1 deficiency in P-NALD).
Enhanced plasmatic and tissular levels of VLCFA, especially C24:0 and C26:0 [1], are
hallmarks of peroxisomal leukodystrophies [38], including X-ALD and P-NALD. Hence, it
was of interest to determine the effects of C24:0 and C26:0 on oligodendrocytes, and
especially their ability to induce oxidative stress, which can further lead to various cellular
dysfunctions contributing to the initiation and development of demyelination leading to fatal
issues. To this end, 158N murine oligodendrocytes, expressing or not Abcd1 or Acox1, were
treated with either C24:0 or C26:0 (5, 10, 20, 40 µM). Here, we report, that VLCFA can
activate the oxidative stress in 158N cells, and that the absence of Abcd1 or Acox1 is
sufficient to disrupt the Redox equilibrium in these oligodendrocytes. Accordingly, we show
the presence of lipid peroxidation markers (total 7-hydroxycholesterols, HODEs) in the
plasma of 75% of patients with the inflammatory cerebral form of X-ALD (CCALD)
underlying thus the occurence of oxidative processes in some patients with peroxisomal
leukodystrophies.
As enhanced levels of VLCFA (especially C24:0 and C26:0) in tissue and plasma are
hallmarks of peroxisomal leukodystrophies [1, 38], including X-ALD and P-NALD, it was of
interest to determine the effects of C24:0 and C26:0 on oligodendrocytes, and especially their
RESULTATS
127
ability to induce oxidative stress which can further lead to various cellular dysfunctions
contributing to the initiation and development of demyelination leading to fatal issues. Since
induction of oxidative stress and activation of cell death are often tightly connected, we
determined the effects of C24:0 and C26:0 on cell growth and viability of 158N cells. In our
experimental conditions, performed on subconfluent 158N cells, no effects on cell growth and
no induction of cell death were observed at 5 and 10 µM both at 24 h and 48 h of treatment.
At the opposite, at 20 and 40 µM, a strong inhibition of cell growth was observed as well as
an important induction of cell death characterized by enhanced permeability of propidium
iodide (PI) which enters dead cells only. As mitochondrial dysfunction leading to cell death
are known to precede membrane damages allowing the intracellular accumulation of PI [69],
we also investigated the effects of C24:0 and C26:0 on transmembrane mitochondrial
potential (∆Ψm) measured with JC-1. In these conditions, no cytotoxic effects were observed
at 5 and 10 µM whereas an important percentage of cells with depolarized mitochondria was
detected at 20 µM. This mitochondrial disturbance, also observed on normal fibroblasts and
on fibroblasts of X-ALD patients [34] as well as on oligodendrocytes and astrocytes of rat
brain [26] treated with C24:0 and/or C26:0 used at 20 µM and higher, indicates that decrease
of ∆Ψm is common to neural cells and fibroblasts, and provides evidence that mitochondrial-
based cell death mechanisms are involved subsequently to VLCFA accumulation. Therefore,
as cell death of oligodendrocytes has been supposed to contribute to demyelinization,
especially in patients with X-ALD [24, 25], the high concentrations of C24:0 and C26:0
required to induce oligodendrocyte cell death (higher than 10 µM and rarely observed in the
plasmas of patients with peroxisomal disorders [38]), rather suggest indirect effects of
VLCFA via activation of immune cytotoxic processes [70] which could be activated by
increased oxidative stress damages [71].
So, as a disruption of the Redox status could not be excluded even with low concentrations of
VLCFA, the ability of C24:0 and C26:0 to trigger an oxidative stress was investigated at 5,
10, and 20 µM. In these conditions, with C24:0 and C26:0, as no overproduction of ROS
(superoxide anions
(O2.-), hydrogen peroxide (H2O2)) were found at 5 µM, and as slight overproduction of H2O2
and/or of mitochondrial O2.- were observed at 10 µM whereas marked overproduction of O2
.-
and H2O2 were found at 20 µM, our data demonstrate that both non cytotoxic (10 µM) and
cytotoxic (20 µM) concentrations of VLCFA induce overproduction of ROS whereas the
highest overproduction was found at 20 µM. Noteworthy, in normal and X-ALD human
fibroblasts, an overproduction of ROS was also detected when the cells were treated with

RESULTATS
128
C26:0 at 25 or 50 µM for 24 h [31]. Interestingly, data obtained with DAF-FM allowing to
identify nitric oxide (NO) reveal a marked overproduction of NO with C24:0 and C26:0 as
soon as 5 and 10 µM, respectively, demonstrating thus that also non-cytotoxic (5 and 10 µM)
and cytotoxic (20 µM) concentrations of VLCFA are capable to stimulate NO production
which is known to negatively affect the oxidation of VLCFA and to favour their intracellular
accumulation [28, 72]. As an overproduction of NO is detected at 5 µM, the regulation of NO
production might be more sensitive to VLCFA than the regulation of O2.- and H2O2, and our
data support the hypothesis that accumulation of VLCFA in oligodendrocytes might
contribute to increased iNOS expression in inflammatory area of brain lesions from patients
with X-ALD [30]. Moreover, with VLCFA (20 µM) as an increased ROS production is
concomitant with a decrease of ∆Ψm, this may be due to a direct or indirect protonophoric
uncoupling action of VLCFA, whereas extra-mitochondrial sources of ROS production
capable to contribute to damage the mitochondria are also likely to be activated in response to
C26:0 and C24:0 [31]. Indeed, the accumulation of VLCFA in X-ALD lymphoblasts has been
decribed to increase the level of the catalytic subunit of NADPH oxidase gp91PHOX observed
in total cell homogenate and membrane fractions of those cells [32]. Therefore, C24:0 and
C26:0 might favor the activation of NADPH oxidase activity, leading to an overproduction of
ROS, which might further contribute to trigger cell death [33].
However, oxidative stress associated with ROS and RNS overproductions can be
underestimated in oligodendrocytes: i) due to the involvement of cellular buffers such as
glutathione, which is one of the most important cellular defense system against oxidative
stress [76, 77]; and ii) to the activation of anti-oxidant defences, such as superoxide dismutase
(SOD) and catalase enzymes involved in the degradation of O2.- and H2O2, respectively [78].
Here, we show that SOD and catalase activities were modified under the action of C24:0 and
C26:0. We observed a decrease of glutathione levels in oligodendrocytes, underlying the
potential pro-oxidative activities of VLCFA. This is in agreement with the previous
investigations, performed on normal and X-ALD human fibroblasts in the presence of C26:0
[34]. The glutathione level has been measured using monochlorobimane, which binds to thiol
groups by an enzymatic reaction catalyzed by glutathione S-transferases [52]. Under VLCFA
treatment, a decrease in glutathione level is may be due to the lower glutathione S-transferase
activity. Regarding the role of this enzyme in the degradation of a variety of cytotoxic
molecules, one could suggest that such diminution during VLCFA accumulation might
contribute to oligodendrocytes dysfunction. Additionally, the low glutathione level would
induce further sensitization of oligodendrocytes to ROS and RNS leading to demyelination
RESULTATS
129
[79], underlying the importance of environmental factors in triggering demyelination process
in peroxisomal leukodystrophies. Moreover, in agreement with investigations performed with
organotypic spinal cord slices of knockout Abcd1 mice cultured in the presence of C26:0
[34], we have shown increased levels of SOD activity while catalase activity decreased in
VLCFA-treated oligodendrocytes. The decrease of catalase activity is concomittant to H2O2
overproduction, which can oxidize the major cellular components such as lipids, proteins, and
DNA causing their inactivations and their subsequent degradations.
Beside the induction of ROS and RNS production, and alteration of anti-oxidant defences, the
evidence of lipid peroxidation on 158N murine oligodendrocytes treated with C24:0 or C26:0
has been revealed by the presence of 4-HNE, total 7-hydroxycholesterols and HODEs.
Currently, 4-HNE has already been identified in patients with neurodegenerative diseases.
Indeed, it has been detected in the brain of patients with Alzheimer’s disease [80], and it is
present at elevated levels in the plasma of patients with Parkinson’s disease [67]. As 4-HNE is
a highly reactive aldehyde, it exhibits great reactivity with biomolecules, such as proteins,
DNA, and phospholipids, generating a variety of intra- and inter-molecular covalent adducts
[81]. At the membrane level, proteins and amino lipids can be covalently modified by lipid
peroxidation products (hydoxy-alkenals) and activate various metabolic pathways
contributing to the cell death process [82]. On the other hand, radical attack of cholesterol
leading to intra cellular accumulation of total 7-hydroxycholesterols (including 7α-
hydroxycholesterol, 7β-hydroxycholesterol, and 7-ketocholesterol) is the most probable
hypothesis since overproduction of ROS and RNS are observed [83]. However, as 11β-
hydroxysteroid deshydrogenase type1 and cholesterol 7α-hydroxylase (CYP7A1) are key
enzymes of the cholesterol catabolism [84] leading to 7β-hydroxycholesterol and 7α-
hydroxycholesterol biosynthesis, respectively, an activation of these enzymes can not be
excluded as well as an interconversion between 7-ketocholesterol and 7β-hydroxycholesterol
[84]. As total 7-hydroxycholesterols have a wide range of biological activities, and are potent
inducers of cell death [83], they might contribute to the cell death process triggered by
VLCFA. Thus, the presence of 4-HNE and total 7-hydroxycholesterols in VLCFA treated-
158N cells constitutes an important link between oxidative stress and induction of cell death.
As polyunsaturated fatty acids and their esters are known to be more susceptible to free-
radical mediated oxidation than cholesterol [85], we also focused on the degradation product
of linoleate especially HODEs including 9-hydroxy-octadecadienoic acid, and 13-hydroxy-
octadecadienoic acid. Interestingly, the detection of these molecules not only constitutes an

RESULTATS
130
additional criteria of lipid peroxidation, but it is also in agreement with previous
investigations performed on mouse primary astrocytes cultures demonstrating that VLCFA
can cause lipotoxic response via 5-lipoxygenase [20]. Indeed, 9-hydroxy-octadecadienoic
acid, and 13-hydroxy-octadecadienoic acid can also be biosynthetized from linoleic acid by
various lipoxygenases including 3-lipoxygenase, 5-lipoxygenase, 8-lipoxygenase, and 12/15-
lipoxygenase [86, 87].
In addition to lipid peroxidation, DNA damage and protein carbonylation were also observed
under treatment with VLCFA. Regarding DNA degradation, as no Sub G1 cells were
identified whatever the concentrations of VLCFA used, our data rather support that VLCFA
induce a non apoptotic mode of cell death whereas apoptosis without decrease of cell DNA
content have also been reported [88]. After nuclei staining with Hoechst 33342 as weel as by
transmission electron microscopy allowing to distinguish between apoptosis and necrosis
[44], the absence of cells with condensed and/or fragmented nuclei characteristic of apoptotic
cells bring additional evidence that VLCFA induce a non apoptotic mode of cell death (our
data not shown). Thus, VLCFA-inducing DNA damages (mainly observed at 20 µM) can be
considered rather as a consequence of cell death, activating various enzymes as
endonucleases, than due to a consequence of oxidative stress revealed as low as 5 µM. At the
opposite to DNA degradation, protein carbonylation, which is known to reflect the level of
oxidative stress was significantly enhanced as soon as 10 µM. Accordingly, in the spinal cord
of Abcd1 deficient mice, as well as in cultured X-ALD fibroblasts, specific and well
characterized markers of direct oxidation of carbonyl residues were identified [31] suggesting
that the excess of VLCFA might not be the unique cause of oxidative damage in X-ALD, and
that the loss of ABCD1 might hampers oxidative stress homeostasis [34].
So, in order to determine the part taken by ABCD1 and ACOX1 in oxidative stress, murine
oligodendrocytes 158N were transfected with SiRNAs allowing to inactivate Abcd1 and
Acox1 gene expression. The interesting aspect revealed by these experiments is that the loss
(or the important decrease) of Abcd1 or Acox1 expression is associated with enhanced
overproduction of ROS (O2.- and H2O2) and NO. This enhanced oxidative stress in deficient
Abcd1 and Acox1 158N oligodendrocyte cells, which is in agreement with observations
performed on X-ALD fibroblasts and on spinal cords of Abcd1 negative mice, as early as 3.5
months of age before onset of neuropathological signs [34], could ultimately constitute a
major component leading to oxidative damages and pave the way for the cascade of events
that might lead to neurodegeneration in X-ALD and P-NALD. Further, we provide evidences
of an additional effect of C24:0 and C26:0 to enhance O2.-, H2O2 and NO overproduction
RESULTATS
131
when added on deficient Abcd1 and Acox1 158N cells. Thus, untransfected cells might
tolerate higher doses of C24:0 or C26:0 without overproduction of ROS and NO, suggesting
that the mechanisms that should buffer the oxidative stress caused by these VLCFA work less
efficiently in Abcd1 and Acox1 deficient cells, or alternatively, that the C24:0 or C26:0 -
dependent induction of oxidative stress is lower in untransfected cells, who can properly
metabolize the VLCFA. Therefore, our data establish for the first time that the knockdown of
Abcd1 or Acox1 expressions strongly increased O2.-, H2O2 and NO production even in the
absence of C24:0 and C26:0, and contributed to enhance C24:0 and C26:0-inducing oxidative
stress. Thus, in the context of X-ALD and P-NALD, oxidative stress may constitute a major
factor and an early event contributing to the pathogenesis of these diseases.
In agreement with the three-hit hypothesis of the pathogenesis of X-ALD [89], our
investigation bring additional information supporting that X-ALD is a neurodegenerative
disease associated with oxidative stress. Indeed, enhanced levels of lipid peroxidation markers
(total 7-hydroxycholesterols and HODEs) were found in the plasma of patients with different
forms of X-ALD. Thus, comparatively to healthy subjects, significant higher levels of total 7-
hydroxycholesterols and HODEs were identified in CCALD, Addison disease, and AMN, and
the higher levels of these peroxidation markers were found in CCALD patients suggesting
that the oxidative stress might contribute to the evolution of the disease, and to the
demyelination process. Interestingly, in ACALD patients no signs of lipid peroxidation were
identified with the markers used. So, these data underline that oxidative damages can be
involved in the physiopathology of CCALD, and can help to distinguish the different forms of
X-ALD. As 75% of CCALD patients (6 patients among 8 studied) have both high levels of
total 7-hydroxycholesterols and HODEs whereas 25% (2 patients among 8 studied) have
simultaneously low levels of total 7-hydroxycholesterols and HODEs, our data also highlight
that systemic oxidative stress is not a general feature of CCALD. Therefore, our data support
that antioxidant therapeutic strategies can not be envisage as a general treatment of CCALD,
whereas this therapy can have some interests in patients presenting an oxidative stress [31]. In
addition, we suggest that total 7-hydroxycholesterols and HODEs might constitute suitable
biomarkers of X-ALD in order to identify among CCALD patients those presenting a
systemic oxidative stress capable to respond to antioxidant therapies.
Altogether, our data demonstrate that: i) C24:0 and C26:0 are able to induce oxidative stress;
ii) inhibition of Abcd1 and Acox1 expression enhances oxidative stress; iii) inhibition of
Abcd1 or Acox1 expression increases C24:0 and C26:0 - induced oxidative stress; iiii) X-ALD
is a neurodegenerative disease associated with oxidative stress as indicated by the presence of
RESULTATS
132
high levels of plasmatic markers of oxidation (total 7-hydroxycholesterols, HODEs) in X-
ALD patients, especially in some CCALD patients (around 75%) . Therefore the present
investigation supports the important role of peroxisomal metabolism in homeostasis of ROS
and RNS, and shows that the implication of the oxidative stress is not a hallmark of severe
forms of X-ALD (CCALD). Consequently, these observations have important implications
for X-ALD therapy since anti-oxidants can have potential interest to prevent the evolution of
the diseases only in some CCALD patients. In addition, in X-ALD patients, as the plasmatic
levels of total 7-hydroxycholesterols and HODEs permit to distinguish the different forms of
X-ALD, these biomarkers of oxidative stress may also have some interests to follow the
evolution of the disease in order to apply to the patients the most appropriate treatment.
ACKNOWLEDGEMENTS
This work was supported by grants from the INSERM, the Université de Bourgogne, and the
Conseil Régional de Bourgogne. The authors are indebted to Pr Patrick Aubourg (Hôpital St
Vincent de Paul / INSERM U745, Paris, France) for providing plasma samples of X-ALD
patients, and for his helpful suggestions, as well as to Sylvie Guidoux-Boralevi for her
excellent technical assistance (Hôpital St Vincent de Paul/INSERM U745, Paris, France).
REFERENCES
[1] - Wanders RJ, Waterham HR. Biochemistry of mammalian peroxisomes revisited. Annu.
Rev. Biochem., 75: 295-332; 2006.
[2] - Schrader M, Fahimi D. Mammalian peroxisomes and reactive oxygen species.
Histochem. Cell. Biol., 122: 383-393; 2004.
[3] - Brites P, Waterham HR, Wanders RJ. Functions and biosynthesis of plasmalogens in
health and diseases. Biochim. Biophys. Acta, 1636: 219-231; 2004.
[4] - Harauz G, Ishiyama N, Hill C, Bates IR, Libich DS, Farès C. Myelin basic protein-
diverse conformational states of an intrinsically unstructured protein and its roles in myelin
assembly and multiple sclerosis. Micron, 35: 503-542; 2004.

RESULTATS
133
[5]- Kassmann C, Lappe-Siefke C, Baes M, Brügger B, Mildner A, Werner HK, Natt O,
Michaelis T, Prinz M, Frahm J, Nave KA. Axonal loss and neuroinflammation caused by
peroxisome-deficient oligodendrocytes. Nat. Genet., 39: 969-976; 2007.
[6] - Baes M, Aubourg P. Peroxisomes, myelination, and axonal integrity in the CNS.
Neuroscientist, 15: 367-379; 2009.
[7] - Bottelbergs A, Verheijden S, Hulshagen L, Gutmann DH, Goebbels S, Nave KA,
Kassmann C, Baes M. Axonal integrity in the absence of functional peroxisomes from
projection neurons and astrocytes. GLIA, 58: 1532-1543; 2010.
[8] - Valianpour F, Selhorst JJ, van Lint LE, van Gennip AH, Wanders RJ, Kemp S. Analysis
of very long-chain fatty acids using electrospray ionization mass spectrometry. Mol. Genet.
Metab., 79: 189-196; 2003.
[9] - Berger J, Gartner J. X-linked adrenoleukodystrophy: Clinical, biochemical and
pathogenetic aspects. Biochim. Biophys. Acta, 1763: 1721-1732; 2006.
[10] - Kemp S, Pujol A, Waterham HR, van Geel BM, Boehm CD, Raymond GV, Cutting
GR, Wanders RJ, Moser HW. ABCD1 mutations and the X-linked adrenoleukodystrophy
mutation database: role in diagnosis and clinical correlations. Hum. Mutat., 18: 499-515;
2001.
[11] - Semmler A, Bao X, Cao G, Köhler W, Weller M, Aubourg P, Linnebank M. Genetic
variants of methionine metabolism and X-ALD phenotype generation: results of a new study
sample. J. Neurol., 256: 1277-1280; 2009.
[12] - Kemp S, Wanders RJ. X-linked adrenoleukodystrophy: Very long-chain fatty acid
metabolism, ABC half-transporters and the complicated route to treatment. Mol. Genet.
Metab., 90: 268-276; 2007.
[13] - Mosser J, Douar AM, Sarde CO, Kioschis P, Feil R, Moser H, Poustka AM, Mandel JL,
Aubourg P. Putative X-linked adrenoleukodystrophy gene shares unexpected homology with
ABC transporters. Nature, 361: 726-730; 1993.
[14] - Ofman R, Dijkstra IM, van Roermund CW, Burger N, Turkenburg M, van Cruchten A,
van Engen CE, Wanders RJ, Kemp S. The role of ELOVL1 in very long-chain fatty acid
homeostasis and X-linked adrenoleukodystrophy. EMBO Mol Med 2: 90-97; 2010.
[15] - Kishimoto Y, Moser HW, Kawamura N, Platt M, Pallante SL, Fenselau C.
Adrenoleukodystrophy: evidence that abnormal very long chain fatty acids of brain
cholesterol esters are of exogenous origin. Biochem Biophys Res Commun 96: 69-76; 1980.

RESULTATS
134
[16] - Tsuji S, Sano T, Ariga T, Miyatake T. Increased synthesis of hexacosanoic acid (C26:0)
by cultured skin fibroblasts from patients with adrenoleukodystrophy (ALD) and
adrenomyeloneuropathy (AMN). J Biochem (Tokyo) 90: 1233-1236; 1981.
[17] - Fournier B, Saudubray JM, Benichou B, Lyonnet S, Munnich A, Clevers H, Poll-The
BT. Large depletion of the peroxisomal acyl-CoA oxidase gene in pseudonatal
adrenoleukodystrophy. J. Clin. Inves., 94: 526-531; 1994.
[18] - Suzuki Y, Iai M, Kamei A, Tanabe Y, Chida S, Yamaguchi S, Zhang Z, Takemoto Y,
Shimozawa N, Kondo N. Peroxisomal acyl CoA oxidase deficiency. J. Pediatr., 140: 128-
130; 2002.
[19] - Ferdinandusse S, Denis S, Hogenhout EM, Koster J, van Roermund CWT, Ljlst L,
Moser AB, Wanders RJA, Waterham HR. Clinical, biochemical, and mutational spectrum of
peroxisomal Acyl-CoenzymeA oxidase deficiency. Hum. Mut., 28: 904-912; 2007.
[20] - Oaxaca-Castillo D, Andreoletti P, Vluggens A, Yu S, van Veldhoven P, Reddy JK,
Cherkaoui-Malki M. Functional expression and characterization of recombinant human liver
acyl-CoA oxidase isoforms 1a and 1b. Biochim. Biophys. Res. Commun., 360: 314-319;
2007.
[21] - Vluggens A, Andreoletti P, Viswakarma N, Jia Y, Matsumoto K, Kulik W, Khan M,
Huang J, Guo D, Yu S, Sarkar J, Singh I, Rao MS, Wanders RJ, Reddy JK, Cherkaoui-Malki
M. Reversal of mouse Acyl-CoA oxidase 1 (ACOX1) null phenotype by human ACOX1b
isoform. Lab Invest., 90: 696-708; 2010.
[22] - Singh J, Khan M, Singh I. Silencing of Abcd1 and Abcd2 genes sensitizes astrocytes
for inflammation: implication for X-adrenoleukodystrophy. J. Lipid. Res., 50: 135-147; 2009.
[23] - Khan M, Singh J, Gilg AG, Uto T, Singh I. Very long-chain fatty acid accumulation
causes lipotoxic response via 5-lipoxygenase in cerebral adrenoleukodystrophy. J. Lipid. Res.,
51: 1685-1695; 2010.
[24] - Feigenbaum V, Gélot A, Casanova P, Daumas-Duport C, Aubourg P, Dubois-Dalcq M.
Apoptosis in the central nervous system of cerebral adrenoleukodystrophy patients.
Neurobiol. Dis., 7(6 Pt B): 600-612; 2000.
[25] - Eichler FS, Ren JQ, Cossoy M, Rietsch AM, Nagpal S, Moser AB, Frosch MP,
Ransohoff RM. Is microglial apoptosis an early pathogenic change in cerebral X-linked
adrenoleukodystrophy? Ann; Neurol., 63: 729-742; 2008.
[26] - Hein S, Schönfeld P, Kahlert S, Reiser G. Toxic effects of X-linked
adrenoleukodystrophy-associated, very long chain fatty acids on glial cells and neurons from
rat hippocampus in culture. Hum. Mol. Genet., 17: 1750-1761; 2008.

RESULTATS
135
[27] - McGuinness MC, Griffin DE, Raymond GV, Washington CA, Moser HW, Smith KD.
Tumor necrosis factor-alpha and X-linked adrenoleukodystrophy. J. Neuroimmunol.,; 61:
161-169; 1995.
[28] - Khan M, Pahan K, Singh AK, Singh I. Cytokine-induced accumulation of very long-
chain fatty acids in rat C6 glial cells: implication for X-adrenoleukodystophy. J. Neurochem.,
71: 78-87; 1998.
[29] - Cimini A, Bernardo A, Cifone G, Di Muzio L, Di Loreto S. TNFα downregulates
PPARδ expression in oligodendrocytes progenitor cells: implication for demyelinating
diseases. GLIA; 41: 3-14; 2003.
[30] - Paintlia AS, Gilg AG, Khan M, Singh AK, Barbosa E, Singh I. Correlation of very long
chain fatty acid accumulation and inflammatory disease progression in childhood X-ALD:
implications for potential therapies. Neurobiol. Dis., 14: 425-439; 2003.
[31] - Fourcade S, Ruiz M, Guilera C, Hahnen E, Brichta L, Naudi A, Portero-Otín M,
Dacremont G, Cartier N, Wanders R, Kemp S, Mandel JL, Wirth B, Pamplona R, Aubourg P,
Pujol A. Valproic acid induces antioxidant effects in X-linked adrenoleukodystrophy. Hum.
Mol. Genet., 19: 2005-2014; 2010.
[32] - Pujol A, Hindelang C, Callizot N, Bartsch U, Schachner M, Mandel JL. Late onset
neurological phenotype of the X-ALD gene inactivation in mice: a mouse model for
adrenomyeloneuropathy. Hum. Mol. Genet., 11: 499-505; 2002.
[33] - Pujol A, Ferrer I, Camps C, Metzger E, Hindelang C, Callizot N, Ruiz M, Pàmpols T,
Giròs M, Mandel JL. Functional overlap between ABCD1 (ALD) and ABCD2 (ALDR)
transporters: a therapeutic target for X-adrenoleukodystrophy. Hum. Mol. Genet., 13: 2997-
3006; 2004.
[34] - Fourcade S, López-Erauskin J, Galino J, Duval C, Naudi A, Jove M, Kemp S,
Villarroya F, Ferrer I, Pamplona R, Portero-Otin M, Pujol A. Early oxidative damage
underlying neurodegeneration in X-adrenoleukodystrophy. Hum. Mol. Genet., 17: 1762-1773;
2008.
[35] - Deon M, Sitta A, Barschak AG, Coelho DM, Terroso T, Schmitt GO, Wanderley HY,
Jardim LB, Giugliani R, Wajner M, Vargas CR. Oxidative stress is induced in female carriers
of X-linked adrenoleukodystrophy. J. Neurol. Sci., 266: 79-83; 2008.
[36] - Vargas CR, Wajner M, Sirtori LR, Goulart L, Chiochetta M, Coelho D, Latini A,
Llesuy S, Bello-Klein A, Giugliani R, Deon M, Mello CF. Evidence that oxidative stress is
increased in patients with X-linked adrenoleukodystrophy. Biochim. Biophys. Acta., 1688: 26-
32; 2004
RESULTATS
136
[37] - Deon M, Sitta A, Barschak AG, Coelho DM, Pigatto M, Schmitt GO, Jardim LB,
Giugliani R, Wajner M, Vargas CR. Induction of lipid peroxidation and decrease of
antioxidant defenses in symptomatic and asymptomatic patients with X-linked
adrenoleukodystrophy. Int. J. Dev. Neurosci., 25: 441-444; 2007.
[38] - Takemoto Y, Suzuki Y, Horibe R, Shimozawa N, Wanders RJ, Kondo N. Gas
chromatography/mass spectrometry analysis of very long chain fatty acids, docosahexaenoic
acid, phytanic acid and plasmalogen for the screening of peroxisomal disorders. Brain Dev.,
25: 481-487; 2003.
[39] - Baarine M, Ragot K, Genin EC, El Hajj H, Trompier D, Andreoletti P, Ghandour MS,
Menetrier F, Cherkaoui-Malki M, Savary S, Lizard G. Peroxisomal and mitochondrial status
of two murine oligodendrocytic cell lines (158N, 158JP): potential models for the study of
peroxisomal disorders associated with dysmyelination processes. J. Neurochem., 111: 119-
131; 2009.
[40] - Feutz AC, Pham-Dinh D, Allinquant B, Miehe M, Ghandour S. An immortalized jimpy
oligodendrocyte cell line: defects in cell cycle and cAMP pathway. GLIA, 34: 241-252; 2001.
[41] - Ghandour S, Feutz AM, Jalabi W, Taleb O, Bessert D, Cypher M, Carlock L, Skoff RP.
Trafficking of PLP/DM20 and cAMP signalling in immortalized jimpy oligodendrocytes.
GLIA, 40: 300-311; 2002.
[42] - Singh I, Kishimoto Y. Effect of cyclodextrins on the solubilization of lignoceric acid,
ceramide, and cerebroside, and on the enzymatic reactions involving these compounds. J.
Lipid Res., 24: 662-665; 1983.
[43] - Valianpour F, Selhorst JJ, van Lint LE, van Gennip AH, Wanders RJ, Kemp S.
Analysis of very long-chain fatty acids using electrospray ionization mass spectrometry. Mol
Genet Metab 79: 189-196; 2003.
[44] - Lizard G, Fournel S, Genestier L, Dhedin N, Chaput C, Flacher M, Mutin M, Panaye G,
Revillard JP. Kinetics of plasma membrane and mitochondrial alterations in cells undergoing
apoptosis. Cytometry, 21: 275-283; 1995.
[45] - Yeh, CJ, Hsi, BL, Faulk, WP. Propidium iodide as a nuclear marker in
immunofluorescence. II. Use with cellular identification and viability studies. J. Immunol.
Methods, 43: 269-275; 1981.
[46] - Smiley ST, Reers M, Mottola-Hartshorn C, Lin M, Chen A, Smith TW, Steele GD Jr,
Chen LB. Intracellular heterogeneity in mitochondrial membrane potentials revealed by a J-
aggregate-forming lipophilic cation JC-1. Proc. Natl. Acad. Sci. USA., 88: 3671-3675; 1991.
RESULTATS
137
[47] - Rothe G, Valet G. Flow cytometric analysis of respiratory burst activity in phagocytes
with hydroethidine and 2',7'-dichlorofluorescin. J. Leukoc. Biol., 47: 440-448; 1990.
[48] - Zimmerman MC, Oberley LW, Flanagan SW. Mutant SOD1-induced neuronal toxicity
is mediated by increased mitochondrial superoxide levels. J. Neurochem., 102: 609-618;
2007.
[49] - Robinson KM, Janes MS, Beckman JS. The selective detection of mitochondrial
superoxide by live cell imaging. Nat. Protoc., 3: 941-947; 2008.
[50] - McQuade LE, Lippard SJ. Fluorescent probes to investigate nitric oxide and other
reactive nitrogen species in biology (truncated form: fluorescent probes of reactive nitrogen
species). Curr. Opin. Chem. Biol., 14: 43-49; 2010.
[51] - Rothe G, Valet G. Flow cytometric assays of oxidative burst activity in phagocytes.
Methods Enzymol., 233: 539-548; 1994.
[52] - Hedley DW, Chow S. Evaluation of methods for measuring cellular glutathione content
using flow cytometry. Cytometry, 15: 349-358; 1994.
[53] - Ormerod MG, Sun XM, Brown D, Snowden RT, Cohen GM. Quantification of
apoptosis and necrosis by flow cytometry. Acta Oncol., 32: 417-424; 1993.
[54] - Esterbauer H, Schaur RJ, Zollner H. Chemistry and biochemistry of 4-hydroxynonenal,
malonaldehyde and related aldehydes. Free Radic. Biol. Med., 11: 81-128; 1991.
[55] - Poli G, Schaur RJ, Siems WG, Leonarduzzi G. 4-hydroxynonenal: a membrane lipid
oxidation product of medicinal interest. Med. Res. Rev., 28: 569-631; 2008.
[56] - Yoshida Y, Kodai S, Takemura S, Minamiyama Y, Niki E. Simultaneous measurement
of F2-isoprostane, hydroxyoctadecadienoic acid, hydroxyeicosatetraenoic acid, and
hydroxycholesterols from physiological samples. Anal. Biochem., 379: 105-115; 2008.
[57] - Arnauld S, Fidaleo M, Clémencet MC, Chevillard G, Athias A, Gresti J, Wanders RJ,
Latruffe N, Nicolas-Francès V, Mandard S. Modulation of the hepatic fatty acid pool in
peroxisomal 3-ketoacyl-CoA thiolase B-null mice exposed to the selective PPARalpha
agonist Wy14,643. Biochimie, 91: 1376-1386; 2009
[58] - Folch J, Lees M, Sloanes Stanley GH. A simple method for the isolation and
purification of total lipides from animal tissues. J. Biol. Chem., 226: 497-509; 1957.
[59] - Kaluzny MA, Duncan LA, Merritt MV, Epps DE. Rapid separation of lipid classes in
high yield and purity using bonded phase columns. J. Lipid Res., 26: 135-140; 1985.
[60] - Laemmli UK. Cleavage of structural proteins during the assembly of the head of
bacteriophage T4. Nature, 227: 680–685;1970.
RESULTATS
138
[61] - Towbin H, Staehelin T, Gordon J. Electrophoretic transfer of proteins from
polyacrylamide gels to nitrocellulose sheets. Proc. Natl. Acad. Sci. USA., 76: 4350-4354;
1979.
[62] - Kemp S, Wanders R. Biochemical aspects of X-linked adrenoleukodystrophy. Brain
Pathol., 20: 831-837; 2010.
[63] - Warner HR. Superoxide dismutase, aging, and degenerative disease. Free Radic Biol
Med. 17: 249-258; 1994.
[64] - Forman HJ, Zhang H, Rinna A. Glutathione: overview of its protective roles,
measurement, and biosynthesis. Mol Aspects Med. 30: 1-12; 2009.
[65] - Maynard S, Schurman SH, Harboe C, de Souza-Pinto NC, Bohr VA. Base excision
repair of oxidative DNA damage and association with cancer and aging. Carcinogenesis 30:
2-10; 2009.
[66] - Rothstein JD. Current hypotheses for the underlying biology of amyotrophic lateral
sclerosis. Ann. Neurol., 65 Suppl 1: S3-S9; 2009.
[67] - Seet RC, Lee CY, Lim EC, Tan JJ, Quek AM, Chong WL, Looi WF, Huang SH, Wang
H, Chan YH, Halliwell B. Oxidative damage in Parkinson disease: Measurement using
accurate biomarker. Free Radic. Biol. Med., 48: 560-566; 2010.
[68] - Baumann N, Pham-Dinh D. Biology of oligodendrocyte and myelin in the mammalian
central nervous system. Physiol. Rev., 81: 871-927; 2001.
[69] - Kroemer G, Petit P, Zamzami N, Vayssière JL, Mignotte B. The biochemistry of
programmed cell death. FASEB J., 9: 1277-1287; 1995.
[70] - Powers JM, Liu Y, Moser AB, Moser HW. The inflammatory myelinopathy of adreno-
leukodystrophy: cells, effector molecules, and pathogenetic implications. J. Neuropathol. Exp.
Neurol. 51: 630-643; 1992.
[71] - Powers JM, Pei Z, Heinzer AK, Deering R, Moser AB, Moser HW, Watkins PA, Smith
KD. Adreno-leukodystrophy: oxidative stress of mice and men. J. Neuropathol. Exp. Neurol.,
64: 1067-1079; 2005.
[72] - Dobashi K, Pahan K, Chahal A, Singh I. Modulation of endogenous antioxidant
enzymes by nitric oxide in rat C6 glial cells. J. Neurochem., 68: 1896-1903; 1997.
[73] - Skulachev VP. Uncoupling: new approaches to an old problem of bioenergetics.
Biochim. Biophys. Acta, 1363: 100-124; 1998.
[74] - Uto T, Contreras MA, Gilg AG, Singh I. Oxidative imbalance in nonstimulated X
adrenoleukodystrophy-derived lymphoblasts. Dev. Neurosci., 30: 410-418; 2008.
RESULTATS
139
[75] - Pedruzzi E, Guichard C, Ollivier V, Driss F, Fay M, Prunet C, Marie JC, Pouzet C,
Samadi M, Elbim C, O'dowd Y, Bens M, Vandewalle A, Gougerot-Pocidalo MA, Lizard G,
Ogier-Denis E. NAD(P)H oxidase Nox-4 mediates 7-ketocholesterol-induced endoplasmic
reticulum stress and apoptosis in human aortic smooth muscle cells. Mol. Cell. Biol., 24:
10703-10717; 2004.
[76] - Meister A, Anderson ME. Glutathione. Annu. Rev. Biochem., 52: 711-760; 1983.
[77] - Reed DJ. Glutathione: toxicological implication. Annu. Rev. Pharmacol., 30: 603-631;
1990.
[78] - Chaudière J, Ferrari-Iliou R. Intracellular antioxidants: from chemical to biochemical
mechanisms. Food Chem. Toxicol., 37: 949-962; 1999.
[79] - Di Biase A, Di Benedetto R, Fiorentini C, Travaglione S, Salvati S, Attorri L,
Pietraforte D. Free radical release in C6 glial cells enriched in hexacosanoic acid: implication
for X-linked adrenoleukodystrophy pathogenesis. Neurochem. Int., 44: 215-221; 2004.
[80] - Nam DT, Arseneault M, Murthy V, Ramassamy C. Potential role of acrolein in
neurodegeneration and in Alzheimer's disease. Curr. Mol. Pharmacol., 3: 66-78; 2010.
[81] - Catala A. Lipid peroxidation of membrane phospholipids generates hydroxy-alkenals
and oxidized phospholipids active in physiological and/or pathological conditions. Chem.
Phys. Lipids, 157: 1-11; 2009.
[82] - Awasthi YC, Sharma R, Cheng JZ, Yang Y, Sharma A, Singhal SS, Awasthi S. Role of
4-hydroxynonenal in stress-mediated apoptosis signaling. Mol. Aspects Med., 24: 219-230;
2003.
[83] - Vejux A, Lizard G. Cytotoxic effects of oxysterols associated with human diseases:
Induction of cell death (apoptosis and/or oncosis), oxidative and inflammatory activities, and
phospholipidosis. Mol. Aspects Med., 30: 153-170; 2009.
[84] - Garenc C, Julien P, Levy E. Oxysterols in biological systems: the gastrointestinal tract,
liver, vascular wall and central nervous system. Free Radic. Res., 44: 47-73; 2010.
[85] - Saito Y, Yoshida Y, Niki E. Cholesterol is more susceptible to oxidation than linoleates
in cultured cells under oxidative stress induced by selenium deficiency and free radicals.
FEBS Lett., 581: 4349-4354; 2007.
[86] - Engels F, Kessels GC, Schreurs AJ, Nijkamp FP. Production of arachidonic acid and
linoleic acid metabolites by human bronchoalveolar lavage cells. Prostaglandins, 42: 441-
450; 1991.
RESULTATS
140
[87] - Kawajiri H, Hsi LC, Kamitani H, Ikawa H, Geller M, Ward T, Eling TE, Glasgow WC.
Arachidonic and linoleic acid metabolism in mouse intestinal tissue: evidence for novel
lipoxygenase activity. Arch. Biochem. Biophys., 398: 51-60; 2002.
[88] - Fournel S, Genestier L, Rouault JP, Lizard G, Flacher M, Assossou O, Revillard JP.
Apoptosis without decrease of cell DNA content. FEBS Lett., 367: 188-192; 1995.
[89] - Singh I, Pujol A. Pathomechanisms underlying X-adrenoleukodystrophy: a three-hit
hypothesis. Brain Pathol., 20: 838-844; 2010.

RESULTATS
141
LEGENDS
Figure 1. Effects of VLCFA on cell proliferation, cell viability and mitochondrial status
of 158N murine oligodendrocytes. Murine oligodendrocytes (158N) were cultured for 24 to
48 h in the absence (control) or in the presence of alpha-cyclodextrine (vehicle: 1 mg/ml) or
VLCFA (C24:0 or C26:0: 5, 10, 20, 40 µM). Cell proliferation was determined by cell
counting (A, B), cell viability was evaluated with propidium iodide (C,D) and mitochondrial
transmembrane potential was determined with JC-1 only at 24 h. Data shown are mean + SD
from three separate experiments performed in triplicate. Significance of the difference
between control and vehicle, C24:0 or C26:0 (Mann Whitney test; *P < 0.05 or less).
Figure 2. Effects of VLCFA on ROS and RNS production on 158N murine
oligodendrocytes. Murine oligodendrocytes (158N) were cultured for 24 h in the absence
(control) or in the presence of alpha-cyclodextrine (vehicle: 1 mg/ml) or VLCFA (C24:0 or
C26:0: 5, 10, 20 µM). The effects of C24:0 and C26:0 on the production of intracellular
superoxide anion (O2.-) (A), mitochondrial superoxide anion (B), hydrogen peroxide (H2O2)
(C) and nitric oxide (NO) (D) were measured by flow cytometry with DHE, Mitosox,
DHR123, and DAF-FM, respectively. The dark horizontal dotted lines represent the threshold
of control cells. Data shown are mean + SD from three separate experiments performed in
triplicate. Significance of the difference between control and vehicle, C24:0 or C26:0 (Mann
Whitney test; *P < 0.05 or less).
Figure 3. Effects of C24:0 and C26:0 on glutathione level, superoxide dismutase and
catalase activities on 158N murine oligodendrocytes. Murine oligodendrocytes (158N)
were cultured for 24 h in the absence (control) or in the presence of alpha-cyclodextrine
(vehicle: 1 mg/ml) or VLCFA (C24:0 or C26:0: 5, 10, 20 µM). At the end of the incubation
time, total glutathione level was measured by colorimetry (A), the percentage of cells
containing reduced glutathione was determined by flow cytometry with monochlorobimane
(MCB) (B), superoxide dismutase (SOD) (C) and catalase (D) activities were biochemically
determined. Data shown are mean + SD from two separate experiments performed in
triplicate. Significance of the difference between control and vehicle, C24:0 or C26:0 (Mann
Whitney test; *P < 0.05 or less).
RESULTATS
142
Figure 4. Effects of C24:0 and C26:0 on lipid peroxidation on 158N murine
oligodendrocytes. Murine oligodendrocytes (158N) were cultured for 24 h in the absence
(control) or in the presence of alpha-cyclodextrine (vehicle: 1 mg/ml) or VLCFA (C24:0 or
C26:0: 10, 20 µM). The effects of C24:0 and C26:0 on lipid peroxidation were determined by
the intracellular level of 4-hydroxynonenal (4-HNE) evaluated by fluorescence microscopy
and flow cytometry (A), and by the intracellular levels of total 7-hydroxycholesterols (B) and
HODEs (C) determined by gas chromatography and liquid chromatography, respectively,
coupled with mass spectrometry. The dark horizontal dotted lines represent the threshold of
control cells. Data shown are mean + SD from two separate experiments performed in
triplicate Significance of the difference between control and vehicle, C24:0 or C26:0 (Mann
Whitney test; *P < 0.05 or less).
Figure 5. Effects of C24:0 and C26:0 on DNA degradation and protein carbonylation on
158N murine oligodendrocytes. Murine oligodendrocytes (158N) were cultured for 24 h in
the absence (control) or in the presence of alpha-cyclodextrine (vehicle: 1 mg/ml) or VLCFA
(C24:0 or C26:0: 10, 20 µM). The effects of C24:0 and C26:0 on DNA degradation was
determined by flow cytometry on propidium iodide stained cells by the percentage of
hypodiploid cells (DNA degradation) and by the percentage of Sub G1 cells (inter-
nucleosomal DNA fragmentation) (A) . The effects of C24:0 and C26:0 on protein
carbonylation was biochemically evaluated by the quantity of carbonyl content per quantity of
protein (B). Data shown are mean + SD from two separate experiments performed in
triplicate. Significance of the difference between control and vehicle, C24:0 or C26:0 (Mann
Whitney test; *P < 0.05 or less).
Figure 6. Inactivation of Abcd1 and Acox1 expression by siRNA on 158N murine
oligodendrocytes. Murine oligodendrocytes (158N) were transfected with scrambled (Sr)
siRNA, with various Abcd1 siRNAs (Abcd1 1, Abcd1 2, Abcd1 3), or with various Acox1
siRNAs (Acox1 1, Acox1 2, Acox1 3) in order to identify the most appropriated siRNAs.
Silencing was quantified by RT-qPCR at the mRNA level (A) and by Western Blotting at the
protein level (B). Data shown (A) are mean + SD from for separate experiments performed in
triplicate. Significance of the difference between non transfected 158N cells (Wt), Srambled
(Scr) and siRNA transfected cells (Mann Whitney test; *P < 0.05 or less). Data shown (B) are
representative of the data obtained on four separate experiments.
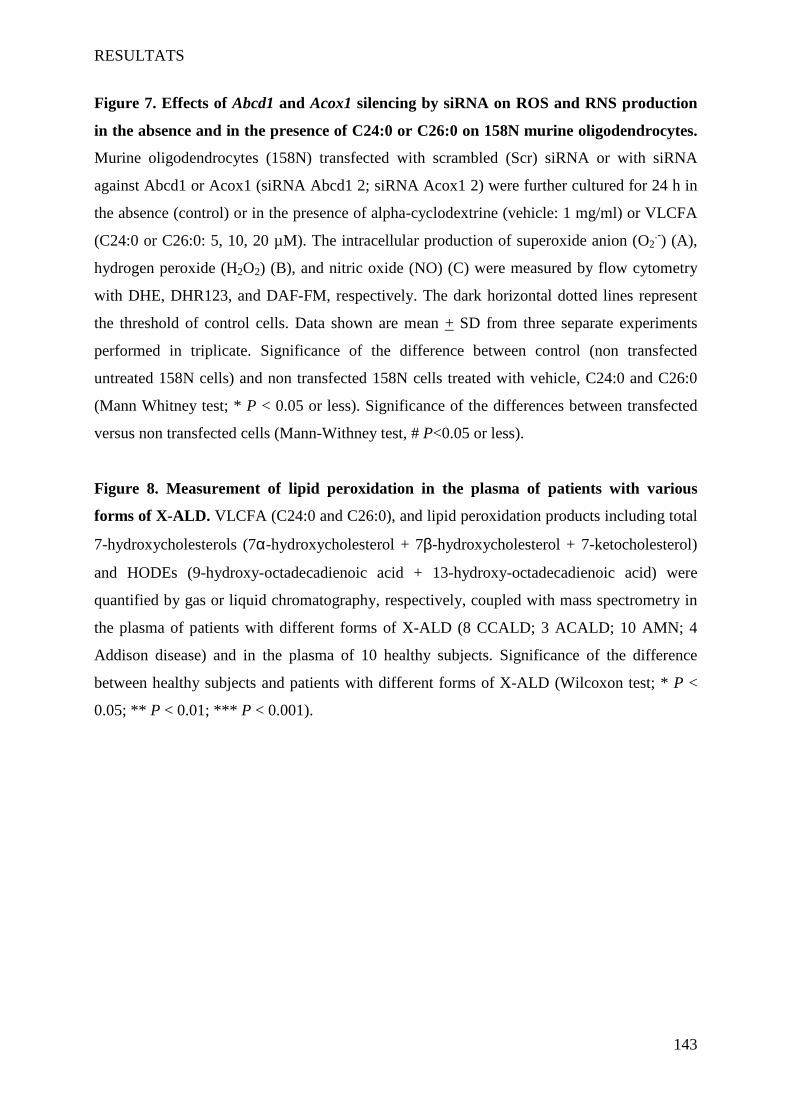
RESULTATS
143
Figure 7. Effects of Abcd1 and Acox1 silencing by siRNA on ROS and RNS production
in the absence and in the presence of C24:0 or C26:0 on 158N murine oligodendrocytes.
Murine oligodendrocytes (158N) transfected with scrambled (Scr) siRNA or with siRNA
against Abcd1 or Acox1 (siRNA Abcd1 2; siRNA Acox1 2) were further cultured for 24 h in
the absence (control) or in the presence of alpha-cyclodextrine (vehicle: 1 mg/ml) or VLCFA
(C24:0 or C26:0: 5, 10, 20 µM). The intracellular production of superoxide anion (O2.-) (A),
hydrogen peroxide (H2O2) (B), and nitric oxide (NO) (C) were measured by flow cytometry
with DHE, DHR123, and DAF-FM, respectively. The dark horizontal dotted lines represent
the threshold of control cells. Data shown are mean + SD from three separate experiments
performed in triplicate. Significance of the difference between control (non transfected
untreated 158N cells) and non transfected 158N cells treated with vehicle, C24:0 and C26:0
(Mann Whitney test; * P < 0.05 or less). Significance of the differences between transfected
versus non transfected cells (Mann-Withney test, # P<0.05 or less).
Figure 8. Measurement of lipid peroxidation in the plasma of patients with various
forms of X-ALD. VLCFA (C24:0 and C26:0), and lipid peroxidation products including total
7-hydroxycholesterols (7α-hydroxycholesterol + 7β-hydroxycholesterol + 7-ketocholesterol)
and HODEs (9-hydroxy-octadecadienoic acid + 13-hydroxy-octadecadienoic acid) were
quantified by gas or liquid chromatography, respectively, coupled with mass spectrometry in
the plasma of patients with different forms of X-ALD (8 CCALD; 3 ACALD; 10 AMN; 4
Addison disease) and in the plasma of 10 healthy subjects. Significance of the difference
between healthy subjects and patients with different forms of X-ALD (Wilcoxon test; * P <
0.05; ** P < 0.01; *** P < 0.001).

RESULTATS
144
FIGURES
Figure 1. Effects of VLCFA on cell proliferation, cell viability and mitochondrial status.
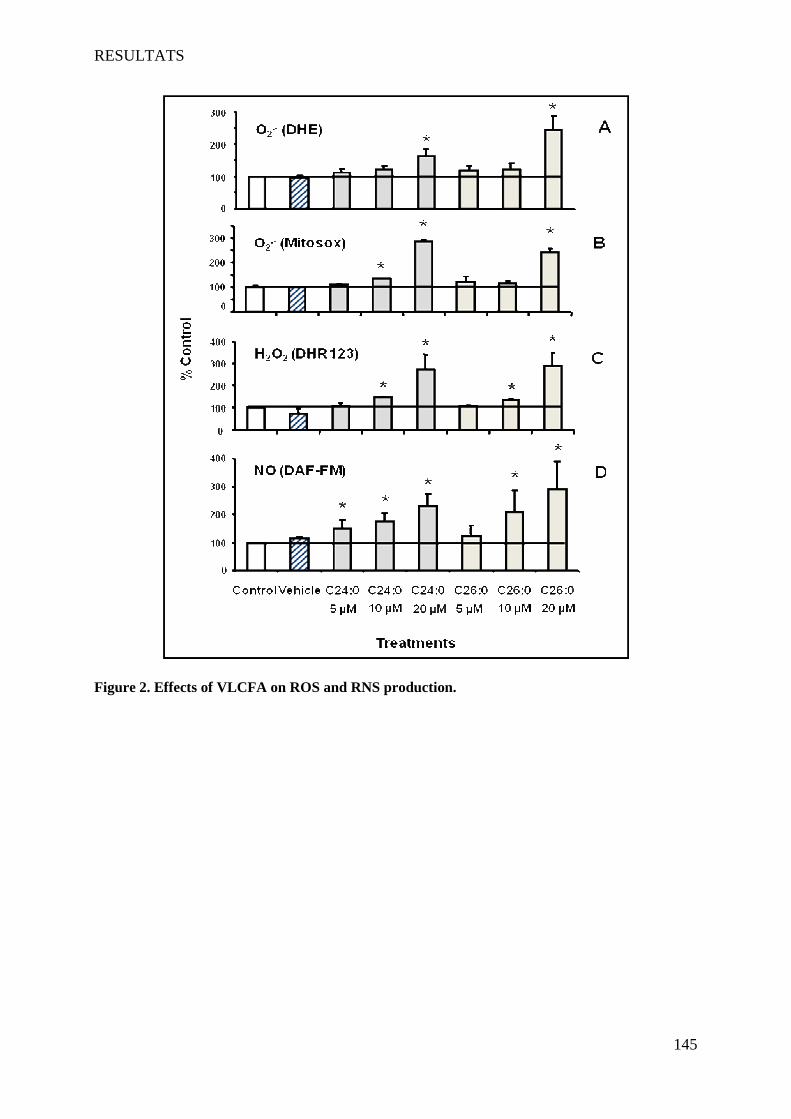
RESULTATS
145
Figure 2. Effects of VLCFA on ROS and RNS production.

RESULTATS
146
Figure 3. Effects of C24:0 and C26:0 on glutathione level, superoxide dismutase and catalase
activities.
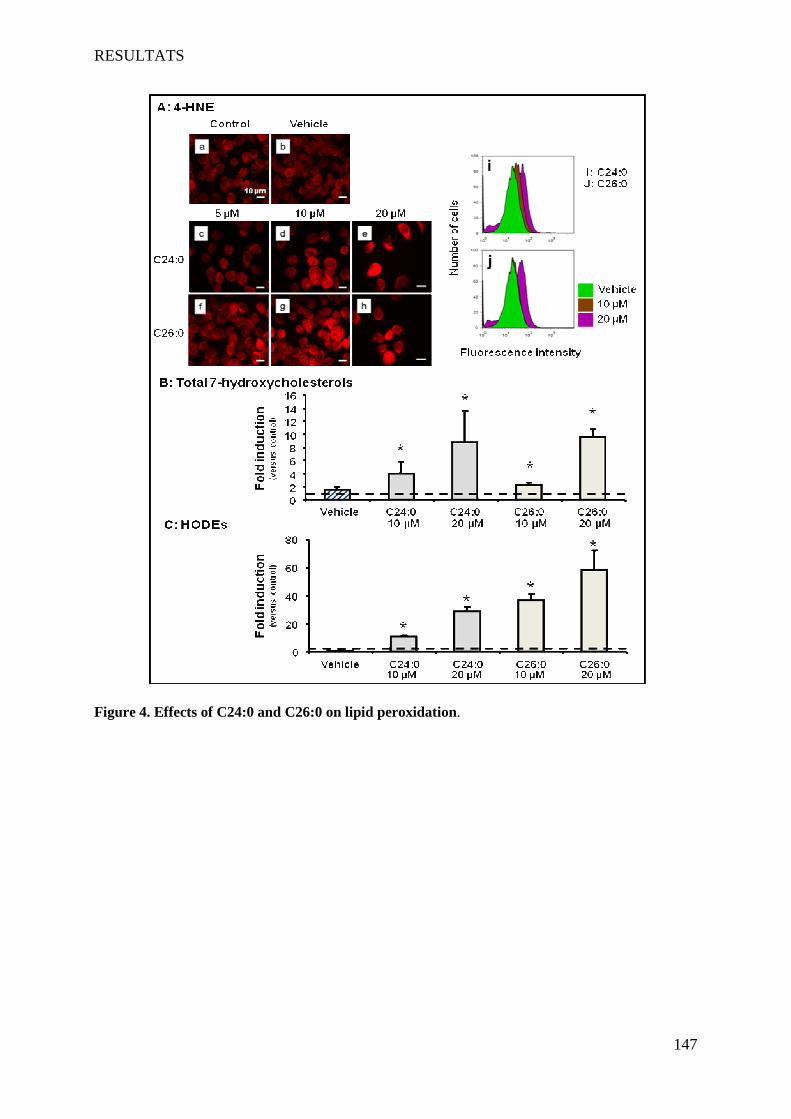
RESULTATS
147
Figure 4. Effects of C24:0 and C26:0 on lipid peroxidation.
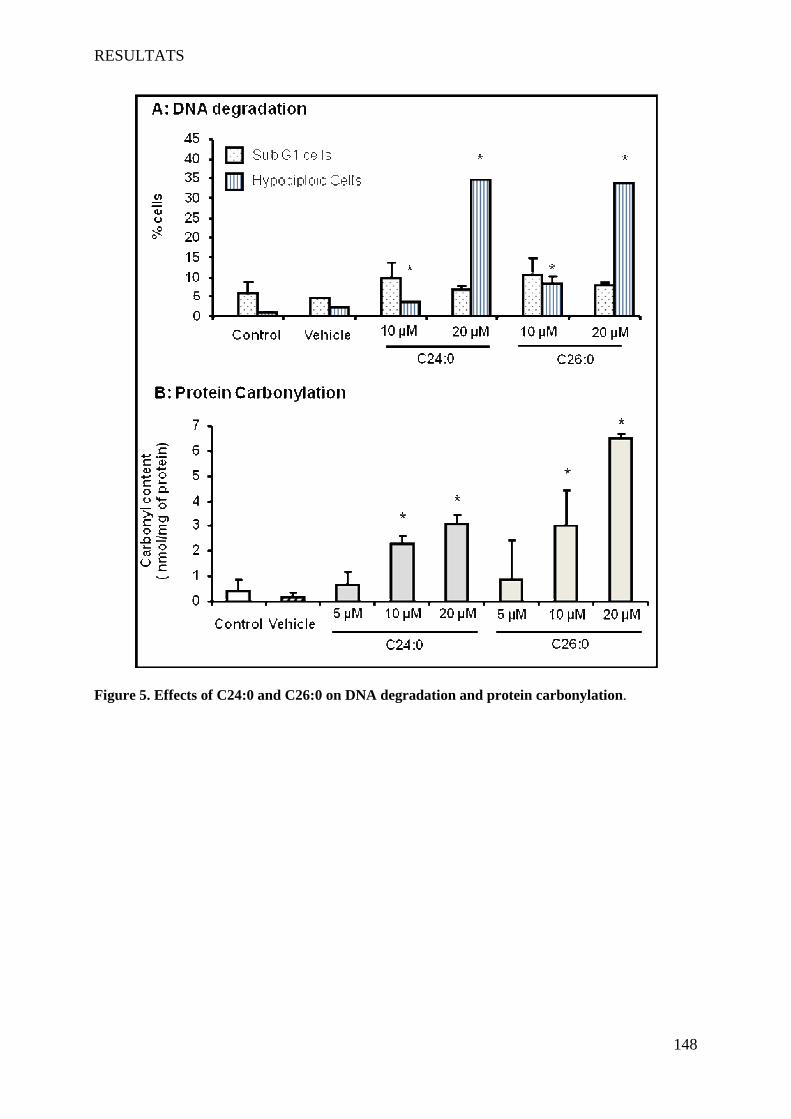
RESULTATS
148
Figure 5. Effects of C24:0 and C26:0 on DNA degradation and protein carbonylation.
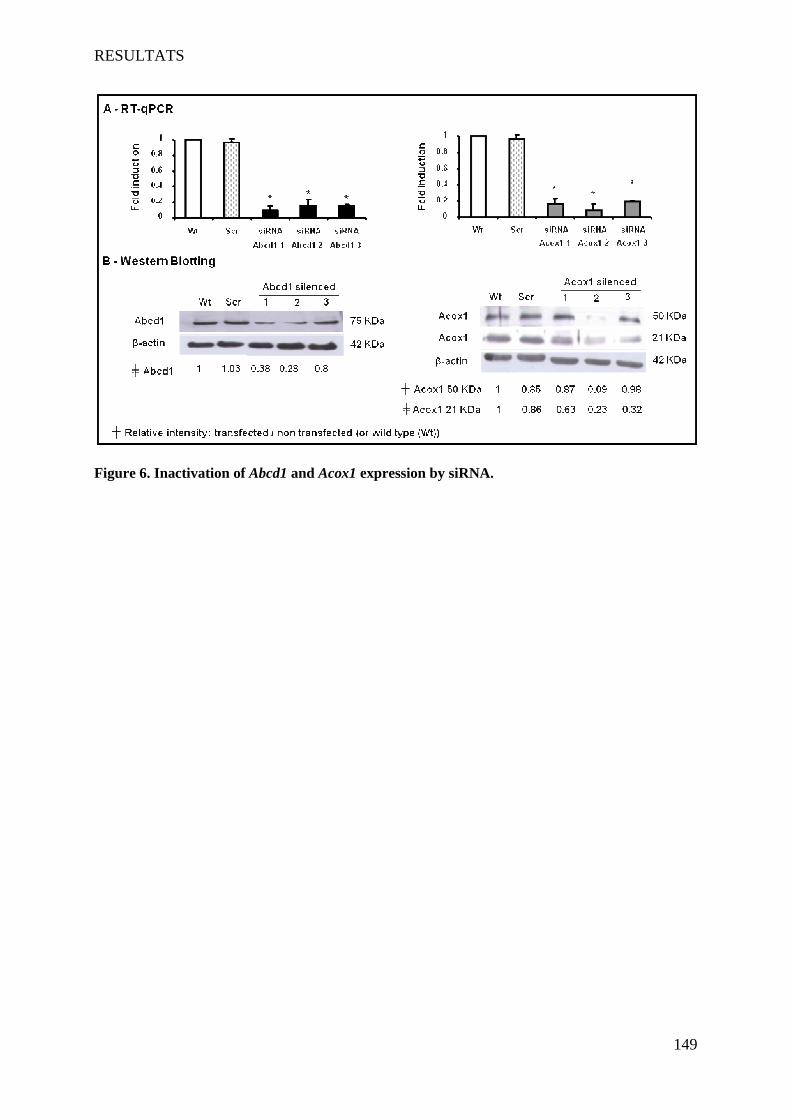
RESULTATS
149
Figure 6. Inactivation of Abcd1 and Acox1 expression by siRNA.

RESULTATS
150
Figure 7. Effects of Abcd1 and Acox1 silencing by siRNA on ROS and RNS production in the
absence and in the presence of C24:0 or C26:0.
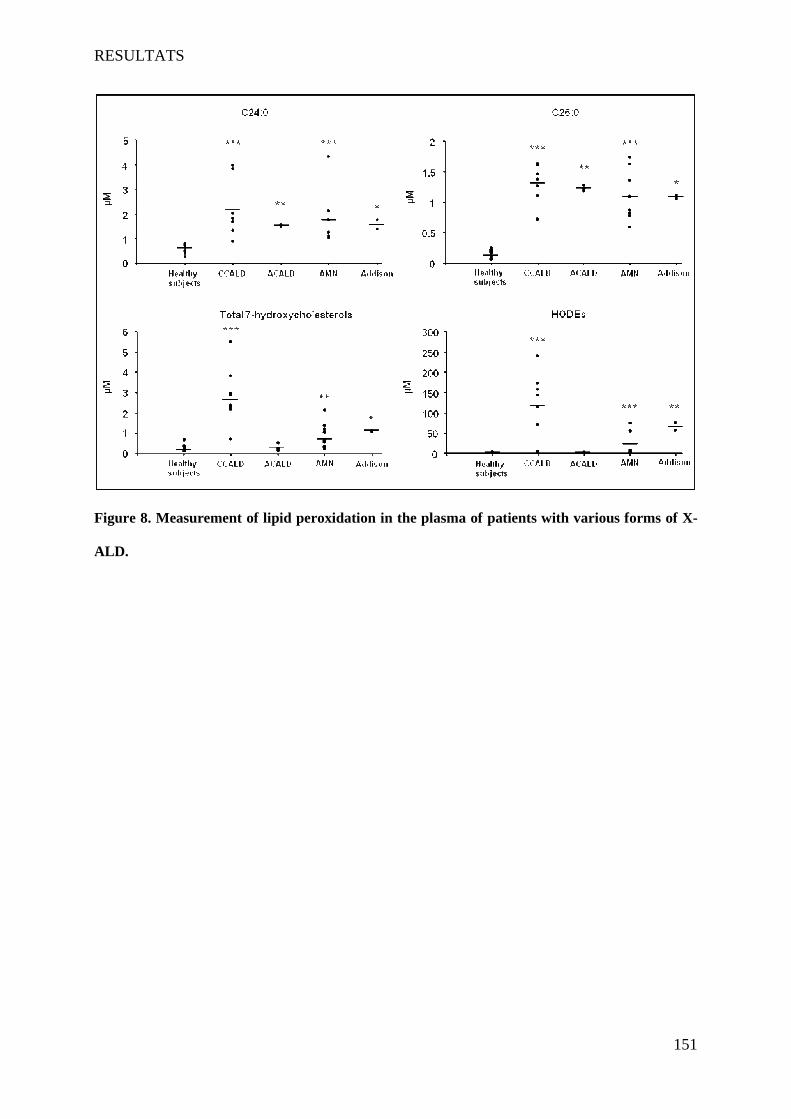
RESULTATS
151
Figure 8. Measurement of lipid peroxidation in the plasma of patients with various forms of X-
ALD.
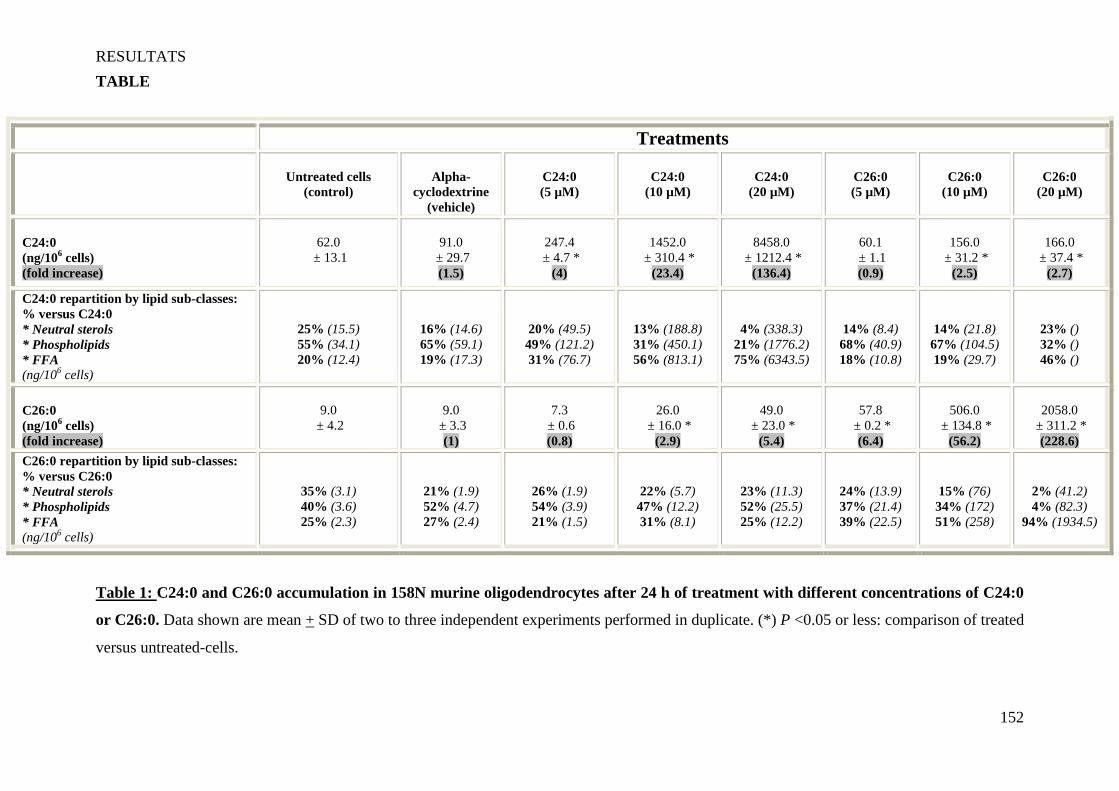
RESULTATS
152
TABLE
Table 1: C24:0 and C26:0 accumulation in 158N murine oligodendrocytes after 24 h of treatment with different concentrations of C24:0
or C26:0. Data shown are mean + SD of two to three independent experiments performed in duplicate. (*) P <0.05 or less: comparison of treated
versus untreated-cells.
Treatments
Untreated cells (control)
Alpha-
cyclodextrine (vehicle)
C24:0 (5 µM)
C24:0
(10 µM)
C24:0
(20 µM)
C26:0 (5 µM)
C26:0
(10 µM)
C26:0
(20 µM)
C24:0 (ng/106 cells) (fold increase)
62.0
± 13.1
91.0
± 29.7 (1.5)
247.4
± 4.7 * (4)
1452.0
± 310.4 * (23.4)
8458.0
± 1212.4 * (136.4)
60.1 ± 1.1 (0.9)
156.0
± 31.2 * (2.5)
166.0
± 37.4 * (2.7)
C24:0 repartition by lipid sub-classes: % versus C24:0 * Neutral sterols * Phospholipids * FFA (ng/106 cells)
25% (15.5) 55% (34.1) 20% (12.4)
16% (14.6) 65% (59.1) 19% (17.3)
20% (49.5) 49% (121.2) 31% (76.7)
13% (188.8) 31% (450.1) 56% (813.1)
4% (338.3) 21% (1776.2) 75% (6343.5)
14% (8.4) 68% (40.9) 18% (10.8)
14% (21.8) 67% (104.5) 19% (29.7)
23% () 32% () 46% ()
C26:0 (ng/106 cells) (fold increase)
9.0
± 4.2
9.0
± 3.3 (1)
7.3
± 0.6 (0.8)
26.0
± 16.0 * (2.9)
49.0
± 23.0 * (5.4)
57.8
± 0.2 * (6.4)
506.0
± 134.8 * (56.2)
2058.0
± 311.2 * (228.6)
C26:0 repartition by lipid sub-classes: % versus C26:0 * Neutral sterols * Phospholipids * FFA (ng/106 cells)
35% (3.1) 40% (3.6) 25% (2.3)
21% (1.9) 52% (4.7) 27% (2.4)
26% (1.9) 54% (3.9) 21% (1.5)
22% (5.7) 47% (12.2) 31% (8.1)
23% (11.3) 52% (25.5) 25% (12.2)
24% (13.9) 37% (21.4) 39% (22.5)
15% (76) 34% (172) 51% (258)
2% (41.2) 4% (82.3)
94% (1934.5)
RESULTATS
153
III Article 3 : Characterization of cell death and myelin protein
expression (PLP, MBP) in wild type and Abcd1 inactivated 158N
Murine Oligodendrocytes treated with C24:0 or C26:0
(Manuscrit en préparation)
Mauhamad Baarine, Franck Ménétrier, André Bouchot, and Gérard Lizard
1 Introduction
L’X-ALD est une maladie peroxysomale démyélinisante résultant d’un dysfonctionnement de
l’hémitransporteur peroxysomal ABCD1 conduisant à une accumulation cytoplasmique et tissulaire
d’AGTLC (C24:0 et C26:0). Cette maladie, pour laquelle aucune relation génotype-phénotype n’a
encore été établie pourrait être déclenchée au niveau du SNC par différents évènements impliqués
dans la démyélinisation. En raison de l’identification de cellules mortes (en particulier apoptotiques)
au niveau des lésions cérébrales d’X-ALD, il a été suggéré que la mort des oligodendrocytes
(cellules synthétisant la myéline) pouvait constituer un évènement important de la
neurodégénérescence (Cimini et al., 2003; Eichler et al., 2008; Singh & Pujol, 2010).
Pour aborder cet aspect de la physiopathologie de l’X-ALD, des oligodendrocytes murins 158N ont
été traités par différentes concentrations d’AGTLC (C24:0 et C26:0 : 5, 10, 20 et 40 µM) pendant 24
à 48 h. Dans ces conditions, nous avons caractérisé : 1) le type de mort cellulaire induite par les
AGTLC, 2) l’impact des AGTLC au niveau des mitochondries et des lysosomes, 3) les effets des
AGTLC sur les taux de calcium et sur le pH intracellulaire, 4) les effets de l’accumulation
d’AGTLC sur la synthèse des protéines majeures de la myéline (PLP et MBP).
Les conséquences de l’inactivation de l’expression d’Abcd1 réalisée à l’aide de siRNA ont aussi été
abordées sur des cellules 158N cultivées en absence ou en présence d’AGTLC. Dans ces conditions,
et comparativement à des cellules 158N non transfectées, la mort cellulaire a été quantifiée et
caractérisée et l’expression des protéines majeures de myéline (PLP et MBP) a été mesurée.
Ce travail a permis de montrer que les AGTLC induisaient essentiellement un type de mort cellulaire
non apoptotique évoquant la nécrose avec des caractéristiques d’autophagie (coloration à la
RESULTATS
154
monodansylcadavérine). Ce type de mort cellulaire est aussi associé à une dépolarisation des
mitochondries (chute du potentiel membranaire mitochondrial (∆Ψm)) et à une déstabilisation des
lysosomes montrée par coloration à l’acridine orange (AO) et au LysoTracker Red. En repérant les
mitochondries par identification du cytochrome c et les lysosomes par identification de l’antigène
Lamp1, une redistribution de ces deux organelles dans le cytoplasme a été observée. Ces évènements
sont précédés par une augmentation rapide de calcium intracellulaire, en accord avec les résultats
obtenus par d’autres équipes (Hein et al., 2008), et par une alcalinisation du cytoplasme dès
l’introduction des AGTLC dans le milieu de culture. L’accumulation des AGTLC n’induit pas une
diminution de l’expression de protéines majeures de la myéline (PLP et MBP).
Dans leur ensemble, les résultats obtenus montrent que les AGTLC induisent rapidement des
modifications cellulaires (taux de calcium, pH). Par ailleurs, ils révèlent que les AGTLC agissent
non seulement sur les mitochondries mais aussi sur les lysosomes qui pourraient largement
contribuer à la mort cellulaire en re-largant dans le cytoplasme différentes enzymes protéolytiques.
Par ailleurs, l’inactivation d’Abcd1 semble rendre plus sensible les cellules aux AGTLC et
augmenter la proportion de cellules mourant par apoptose. Les effets de l’extinction d’Abcd1
provoquent une diminution de l’expression de PLP qui n’est pas potentialisée par les AGTLC.
L’implication du lysosome dans la mort cellulaire induite par les AGTLC est une piste qui mérite
d’être approfondie en raison des applications pharmacologiques sur lesquelles elle pourrait aboutir
dans le cadre du traitement de l’X-ALD.

RESULTATS
155
Characterization of cell death and myelin protein expression (PLP, MBP) in wild type
and Abcd1 inactivated 158N Murine Oligodendrocytes treated with C24:0 or C26:0
Abstract
In X-linked adrenoleukodystrophy (X-ALD) characterized by a genetic deficiency of the
ABCD1 peroxisomal protein, the identification of dead cells in brain lesions suggested that
the death of oligodendrocytes, which are myelin synthetizing cells, might contribute to the
demyelination process observed in severe forms of X-ALD. As very long chain fatty acids
(VLCFA) are increased in the plasma and tissues, including brain, of X-ALD patients, the aim
of the present study was to characterize the impact of VLCFA (C24:0 and C26:0) on wild
type or Abcd1 deficient murine oligodendrocytes 158N. In this context, the ability of VLCFA
(5, 10, 20, and 40 µM) to induce cell death of 158N cells and to modulate the expression of
the major myelin proteins (PLP and MBP) was studied. On 158N cells, under treatment with
VLCFA, cell proliferation was inhibited in a dose dependent manner. At 10 and 20 µM,
important morphological changes were revealed by transmission electron microscopy:
mitochondria of various sizes and shapes, and smaller than in untreated cells; presence of
numerous vacuoles containing cellular debris. At these concentrations, a strong staining was
observed with monodansylcadaverine on VLCFA-treated cells suggesting the involvement of
autophagic processes. In addition, a loss of transmembrane potential was observed with
Rhodamine 123 associated with a cytoplasmic redistribution of mitochondria as well as
lysosomal modifications: enhanced permeability revealed by staining with Acridine Orange,
and cytoplasmic redistribution of lysosomes shown with Lysotracker and LAMP1. The
different methods used to characterize cell death (Hoechst staining, FLICA, TUNEL,
presence of active caspase-3) support that the mode of cell death induced by C24:0 and C26:0
is not an apoptotic process. Interestingly, this mode of cell death is immediately associated
with an increase of intracellular calcium and with a decrease of intracellular pH which can be
relied to lysosomal destabilisation. Inactivation of Abcd1 only slightly increases the cytotoxic
effects of VLCFA measured by staining with propidium iodide. In addition, Abcd1
inactivation was associated with a decrease of MBP. However, on wild type or Abcd1
deficient cells, VLCFA have mainly no effect on PLP and MBP expression.

RESULTATS
156
Introduction
X-linked adrenoleukodystrophy (X-ALD, OMIM 300100) is the most frequent peroxisomal
leukodystrophy of childhood, affecting approximately 1/20,000 boys (Berger and Gärtner,
2006). It is characterized by axonopathy in the spinal cord, demyelination in the cerebral
hemispheres, and adrenal insufficiency associated with an accumulation of saturated (C24:0
and C26:0), and to a lesser extent monounsaturated (C26:1) very long chain fatty acids
(VLCFA) in the plasma and tissues of patients, especially in the brain and adrenal cortex
(Valianpour et al., 2003; Kemp and Wanders, 2007). This disease is caused by defects of the
ABCD1 gene (located at the end of the long arm of the X-chromosome (Xq28)), which
encodes for the ATP-binding cassette (ABC) transporter adrenoleukodystrophy protein
(ALDP, ABCD1) located in the peroxisomal membrane (Mosser et al., 1993; Dubois-Dalcq et
al., 1999). To date, more than 500 different mutations have been reported in the ABCD1 gene
(Kemp et al., 2001; see also X-ALD database: www.x-ald.nl). The exact function of ALDP,
which is widely expressed in oligodendrocytes, astrocytes, microglia, and endothelial cells but
only sparsely in neurons (Höftberger et al., 2007), remains still unclear whereas it seems to
play crucial in transport of VLCFA, or their Coenzyme A derivatives, into peroxisomes
(Wanders and Waterham, 2006). Thus, it is well established that the impairment of the
functions of ALDP leads to a disturbed degradation of VLCFA via peroxisomal beta-
oxidation resulting in the plasmatic and tissular accumulation of VLCFA, especially C24:0
and C26:0 in X-ALD patients (Baes and Aubourg, 2009). Currently, data obtained with
transgenic mice demonstrated that the loss of peroxisomes in the oligodendrocytes, which are
myelin synthesising cells (Baumann and Pham-Dinh, 2001), is sufficient to lead to
demyelination in central nervous system. Indeed, in CNP-Pex5 knockout mice (Kassmann et
al., 2007), the absence of functional peroxisome caused progressive demyelination. At the
opposite, when peroxisomes were deleted from astrocytes in GFAP-Pex5(-/-) mice or from
neurons in NEX- Pex5(-/-) mice, the absence of peroxisomal metabolism in these cells did not
provoke the neurodegenerative phenotype observed after deleting peroxisomes from
oligodendrocytes whereas a marked accumulation of VLCFA was observed in brain
(Bottelbergs et al., 2010). Thus, these data underline that peroxisome need to be present
within oligodendrocytes for the preservation of axonal integrity and for the formation and
maintenance of myelin (Baes and Aubourg, 2009).
So, whereas the genetic basis of most peroxisomal disorders are well characterized (Gould
and Valle, 2000; Weller et al., 2003), and whereas the predominant role of peroxisomes in
oligodendrocytes is well established for myelination (Kassmann et al., 2007; Baes and
RESULTATS
157
Aubourg, 2009; Bottelbergs et al., 2010), the consequences of the accumulation of VLCFA in
oligodendrocytes and the associated molecular mechanisms capable to activate dys- or
demyelination are still not well known. It is possible that the incorporation of VLCFA might
destabilize cell membranes (Ho et al., 1995) or stimulate the synthesis of TNF-α in
macrophages and astrocytes in brain lesions of X-ALD patients (Paintlia et al., 2003) capable
to further induce dysfunctions or cell death in oligodendrocyte progenitor cells or in
oligodendrocytes (Cimini et al., 2003; Eichler et al., 2008; Hein et al., 2008; Singh and Pujol,
2010). Therefore, as VLCFA accumulation in oligodendrocytes may induce a cell death
process, contributing at least in part, to the demyelination and to the progression of X-ALD
(Feigenbaum et al., 2000), it is important to study the effects of tetracosanoic acid (C24:0)
and hexacosanoic acid (C26:0), (two main VLCFA enhanced in the plasma and tissues of X-
ALD patients (Takemoto et al., 2003)) on oligodendrocyte viability and on the synthesis of
main myelin proteins, proteolipid protein (PLP) and myelin basic protein (MBP), which have
not only important roles in myelin structure and function for the transmission of the nerve
impulse (Taylor et al., 2004; Hörster et al., 2005) but also on various oligodendrocytes and
neurons activities (Campagnoni and Skoff, 2001).
So, as the consequence of VLCFA accumulation in oligodendrocytes of X-ALD patients are
still questionable (Eichler et al., 2008), we used wild type murine oligodendrocytes 158N and
siRNA inactivated Abcd1 158N cells to characterize the impact of intracellular increase of
C24:0 and C26:0 on the induction of cell death, and on the expression of PLP and MBP. The
immortalized 158N murine oligodendrocytes were chosen since they contain functional
peroxisomes, and express the proteolipid protein (PLP) and the myelin basic protein (MBP) as
well as main markers of well differentiated oligodendrocytes (CNPase and myelin
oligodendrocyte glycoprotein (MOG)) (Baarine et al., 2009), allowing thus to study the
relationships between peroxisomal defects, and oligodendrocyte functions.
Materials and Methods
Cells, cell cultures, and cell treatments
Normal murine oligodendrocytes (158N) immortalized with the SV40 large T-antigen derive
from Tabby male (Ta/Y) control mice (Feutz et al., 2001; Ghandour et al., 2002). These cells,
which have some characteristics of well differentiated oligodendrocytes (Baarine et al., 2009),
were seeded at 5,000–10,000 cells/cm2 either in 75-cm2 culture flasks or in Petri dishes (100
mm in diameter) and cultured in Dulbecco’s Modified Eagle Medium (DMEM) supplemented
with 5% (v/v) heat inactivated fetal bovine serum. Cells were incubated at 37°C in a
RESULTATS
158
humidified atmosphere containing 5% CO2, trypsinized (0.05% trypsin-0.02% EDTA
solution) and passaged twice a week .
C24:0 and C26:0 were from Sigma-Aldrich (St Louis, MO, USA). They were solubilized in
alpha-cyclodextrin (Sigma-Aldrich) as previously described (Singh and Kishimoto, 1983).
Final concentration of alpha-cyclodextrine (vehicule) in the culture medium was 1 mg/ml
(Hein et al., 2008). For the different experiments, the conditions of treatment with VLCFA
(tetracosanoic acid C24:0; hexacosanoic acid C26:0) were the followings. After plating 158N
cells in 6 or 12 wells plates for 48 h, the cells were further treated for 24 or 48 h with various
VLCFA concentrations (5, 10, 20, 40 µM) in HAM’s-F10 medium. For transfected cells, cells
were plated for 24 h in 12 well plates, transfected with Abcd1 siRNAs for 24 h in DMEM
medium supplemented with 10% SVF, and then treated for 24 h with different VLCFA
concentrations (5, 10, 20 µM) in HAM’s-F10 medium.
Cell Counting and cell morphology
The total number of cells (adherent and non-adherent cells) was determined on 158N
oligodendrocytes cultured in the absence or in the presence of VLCFA (C24:0 and C26:0 used
at 5, 10, 20, and 40 µM for 24 h and 48 h) in 6-well plates by using a hematocytometer under
an inverted phase contrast microscope Diaphot (Nikon, Tokyo, Japan) which was also used to
evaluate cell morphology. Digitalized images were obtained with a Coolpix P5100 camera
(Nikon).
Transmission electron microscopy
Transmission electron microscopy was used to visualize the ultrastructural modifications
induced by VLCFA (C24:0 and C26:0 used at 10 or 20 µM for 24 h) on 158N
oligodendrocytes. Briefly, the samples were fixed for 1 h at 4°C in 2.5% (w/v) glutaraldehyde
diluted in cacodylate buffer (0.1 M, pH 7.4), washed twice in cacodylate buffer (0.1 M, pH
7.4), post-fixed in 1% (w/v) osmium tetroxide diluted in cacodylate sodium (0.1 M, pH 7.4)
for 1 h at room temperature in the dark, and rinsed twice in cacodylate buffer (0.1 M, pH 7.4).
The preparations were then dehydrated in graded ethanol solutions and embedded in Epon.
Ultra-thin sections were cut with a diamond knife on an ultramicrotome, contrasted with
uranyl acetate and lead citrate, and examined under an H7500 electron microscope (Hitachi,
Tokyo, Japan).
RESULTATS
159
Nuclei staining with Hoechst 33342
Nuclear morphology of control and VLCFA-treated cells was characterized by fluorescence
microscopy after staining with Hoechst 33342 used at 2 µg/ml: normal cells are characterized
by round and regular nuclei, apoptotic cells by condensed and/or fragmented nuclei, necrotic
cells by irregular and diffuse nuclei (Lizard et al., 1995). Cell deposits of about 40,000 cells
were applied to glass slides by cytocentrifugation (5 min, 1,500 rpm) with a cytospin 2
(Shandon, Cheshire, UK), mounted in Dako fluorescent mounting medium (Dako,
Coppenhagen, Denmark), and stored in the dark at 4°C until observation. The morphological
aspect of cell deposits was determined with an Axioskop fluorescent microscope (Zeiss, Jena,
Germany) by using UV light excitation. For each sample, 300 cells were examined.
Evaluation of transmembrane mitochondrial potential with Rhodamine 123
Variations of the mitochondrial transmembrane potential (∆Ψm) were measured with
Rhodamine 123 (Rh 123) (Sigma-Aldrich) used at 10 µM final concentration as previously
described (Lizard et al., 1995). Flow cytometric analyses were performed on a Galaxy flow
cytometer (Partec), the green fluorescence of Rh123 was collected through a 520/20 nm band
pass filter and fluorescent signals were measured on a logarithmic scale. For each sample,
10,000 cells were acquired and the data were analyzed with Flomax software (Partec).
Labelling of lysosomal compartment with Lysotracker and measurement of lysosomal
membrane integrity with acridine orange
The aspect and the cellular distribution of lysosomes, which can be evaluated by using
Lysotracker (Yoon et al., 2010), was evaluated on 158N cells cultured on glass coverslips by
staining with LysoTracker Red (Invitrogen, Cergy-Pontoise, France) used at 1 µM final
concentration in the culture medium (5 min, 37 °C). After labelling, the coverslips were
washed in PBS, mounted in Dako fluorescent mounting medium (Dako, Coppenhagen), and
stored in the dark at 4°C until observation under blue light. Observation were realized under
an Axioskop fluorescent microscope (Zeiss) using green excitation, and digitalized images
were obtained with an Axiocam Zeiss camera (Zeiss)
Integrity of lysosomal membrane was determined with the lysosomotropic weak base acridine
orange (AO) (Invitrogen) used at 5-10 µg/ml after 15 min of incubation at 37°C as previously
described (Lemaire-Ewing et al., 2005). AO is a metachromatic fluorophore that accumulates
in normal lysosomes, turning orange-red under blue light excitation. When AO-loaded
lysosomes are damaged, AO is then released into the cytosol, turning yellow-green under blue
RESULTATS
160
light excitation. Flow cytometric analyses were performed on a Galaxy flow cytometer
(Partec); the green and red fluorescence of AO were collected through a 520/20 nm band pass
filter, and a 630 nm long pass filter, respectively. Fluorescent signals were measured on a
logarithmic scale. For each sample, 10,000 cells were acquired and the data were analyzed
with Flomax software (Partec). After staining with AO, cell deposits (40,000 cells per slide)
were also applied to glass slides by cytocentrifugation (5 min, 1,500 rpm) with a cytospin 2
(Shandon), coverslipped, examined under an Axioskop fluoresent microscope (Zeiss) using
blue excitation, and digitalized images were obtained with an Axiocam Zeiss camera (Zeiss).
Identification of autophagic vacuoles after staining with monodansylcadaverine
The presence of autophagic vacuoles was analyzed by fluorescence microscopy after staining
with monodansylcadaverine (MDC) (Biederbick et al., 1995; Nieman et al., 2001). MDC was
prepared at 0.1 M in DMSO and added to the culture medium at a final concentration of 5 µM
as previously described (Miguet-Alfonsi et al., 2002). After 30 min of incubation at 37°C,
cells were collected by centrifugation, resuspended in the culture medium, applied to glass
slides by cytocentrifugation (5 min, 1,500 rpm) with a cytospin 2 (Shandon), coverslipped and
immediately examined under an Axioskop fluorescent microscope (Zeiss) by using UV light
excitation.
In situ detection of internucleosomal DNA fragmentation
In situ visualization of internucleosomal DNA fragmentation at the single-cell level was
performed by using the kit: DeadEnd™ Fluorometric TUNEL System (Promega,
Charbonnières-les-Bains, France) (Bedner et al., 2000). Briefly, cells were trypsinized,
washed twice in PBS, mixed with non-adherent cells, and applied to glass slides (40,000 cells
per slide) by centrifugation (5 min, 1,500 rpm) with a cytospin 2 (Shandon). After fixation
with 2% paraformaldehyde diluted in PBS (pH 7.4) (5 min, room temperature), the cells were
permeabilized with a 0.2% Triton X-100 solution diluted in PBS (5 min, room temperature),
washed 3 times with PBS, and incubated with 100 µl of equilibration Buffer (5 min, room
temperature). Cells were then incubated with 30 µl of TdT solution (1 h, 37°C) in a
humidified atmosphere. The signal of TUNEL was then detected by incubation (15 min, room
temperature) with SSC 2X buffer. After washing in PBS, cells were counterstained with
Hoechst 33342 (2 µg/ml, 5 min), the slides were mounted in Dako fluorescent monting
medium (Dako), coverslipped, and stored at 4°C. Observations were performed under an

RESULTATS
161
Axioskop fluorescent microscope (Zeiss) by using blue and UV light excitations. For each
sample, 300 cells were examined.
In situ detection of caspase and serine protease activities
Total caspase activities were measured with fam-VAD-fmk (Trevigen, Gaithersburg, MD)
and total serine protease activities were measured with fluorescent inhibitor of serine protease
(FLISP) using specifically dedicated kits according to manufactural procedures.
Fluorochrome-labeled inhibitors of caspase (FLICA) reagents, such as fam-VAD-fmk, and
FLISP are cell permeant and non cytotoxic compounds used to investigate in situ caspase
activities during apoptosis and in situ serine protease activities during cell death, respectively
(Grabarek et al., 2002).
Fam-VAD-fmk is a carboxyfluorescein derivative of VAD-fmk. This fluorescent inhibitor of
caspases (FLICA) reagent was dissolved in DMSO to obtain a X150 concentrated solution.
Prior to use, a X3 working solution was prepared by dilution 1:5 in PBS. Furthermore, 106
cells were distributed into 300 µl aliquots culture medium, and fam-VAD-fmk working
solutions were added to obtain a X1 final concentration. After 1 h of incubation in a 5% CO2 /
95% air-humidified atmosphere at 37°C, cells were washed twice in PBS. The cells were
resuspended in 400 µl of PBS and immediately analyzed by flow cytometry on a GALAXY
flow cytometer (Partec).
FLISP was also dissolved in DMSO to obtain a 1 mM concentrated solution. Furthermore, 106
cells were distributed into 490 µl PBS, and FLISP was added to obtain a 20 µM final
concentration. After 1 h of incubation in a 5% CO2 / 95% air-humidified atmosphere at 37°C,
cells were washed twice in PBS. The cells were resuspended in 400 µl of PBS and
immediately analyzed by flow cytometry on a GALAXY flow cytometer (Partec).
The green fluorescence of fam-VAD-fmk or FLISP were collected through a 520/20 nm band
pass filter and measured on a logarithmic scale. For each sample, 10,000 cells were acquired
and data were analyzed with Flomax software (Partec).
Immunostaining procedures for flow cytometry and fluorescence microscopy
For flow cytometric analyses, cells collected by trypsinization were mixed with non-adherent
cells, washed in PBS, and fixed in 2% paraformaldehyde diluted in PBS (pH 7.4) (10 min,
room temperature). Furthermore, the cells were treated with the FACS permeabilizing
solution (BD-Biosciences, San Jose, CA, USA) for 10 min. After washing in PBS, cells were
incubated for 20 min with blocking buffer (PBS, 0.05% saponine, 10% goat serum), washed
RESULTATS
162
in PBS, and incubated (1 h, room temperature) with the appropriate primary antibody (rabbit
polyclonal antibody raised against MBP (ab53294, Abcam, Paris, France) used at 1/60; rabbit
polyclonal antibody raised against PLP (ab28486, Abcam) used at 1/200) diluted in blocking
buffer. Cells were then washed with PBS and incubated for 1 h at room temperature with a
488-Alexa goat anti-rabbit (Invitrogen) diluted in PBS used 1/300. A conjugated control was
simultaneously realized. Finally, cells were washed and resuspended in PBS, and analyzed on
a GALAXY flow cytometer (Partec). The green fluorescence of 488-Alexa was collected with
a 520/10-nm band pass filter. The fluorescent signals were measured on a logarithmic scale.
For each sample, 10,000 cells were acquired (dead cells and debris were excluded from the
analysis by gating on living cells with the size/structure density plots). Data were analyzed
with FlowMax (Partec) and FlowJo (FlowJo Inc) softwares.
Fluorescence microscopy was realized either on cells seeded at 10,000 cells/cm2 on 12-mm
glass coverslips or on cell deposits obtained by cytocentrifugation with a cytospin 4 centrifuge
(Shandon). To this end, cells were fixed in 2% paraformaldehyde diluted in PBS (pH 7.4) (10
min, room temperature). Furthermore, the cells were treated with the FACS permeabilizing
solution (BD-Biosciences) (5 min, room temperature), washed in PBS, and incubated (20 min,
room temperature) with blocking buffer (PBS, 0.05% saponine, 10% goat serum). After
washing in PBS, cells were incubated (1 h, room temperature) with an anti-LAMP1 primary
rabbit polyclonal antibody used at 1:300, or with a rabbit polyclonal antibody directed against
Abcd1 used at 1/100 diluted in blocking buffer. Cells were then washed with PBS and
incubated for 1 h at room temperature with a 594-Alexa (Invitrogen) diluted in PBS used
1:300. Nuclei were counterstained with Hoechst 33342 used at 2 µg/ml. After washing with
PBS, slides were mounted in Dako fluorescent mounting medium (Dako), coverslipped, and
stored at 4°C. Observations were performed under an Axioskop fluorescent microscope
(Zeiss) by using green light excitation, and digitalized images were obtained with an Axiocam
Zeiss camera (Zeiss).
Video-microscopic measurement of intracellular Ca2+
To measure intracellular calcium, 158N cells were cultured in 60 mm diameter Petri dishes.
When the cells were subconfluent, alpha-cyclodextrine, C24:0 or C26:0 were added into the
culture medium and the effects on cytosolic calcium concentration were immediately
quantified by video microscopy. Cytosolic calcium concentration of calcium ([Ca2+]c) was
followed by using the cell permeable fluorescent indicator Fura2-AM (Invitrogen) (Siver,
1998). In brief, subconfluent 158N cells cultured in Petri dishes were washed in PBS buffer,

RESULTATS
163
and loaded with 5 µM Fura2-AM for 30 min at 37°C. After washing, cells were put in fresh
culture medium and after addition of C24:0 or C26:0 (20 µM final concentration) or alpha-
cyclodextrin (1 mg/ml final concentration), [Ca2+] was followed as 340/380 nm excitation
wavelength ratio at 530 nm wavelength emission using a Cell Observer Station composed of
an Axiovert 200M microscope (Leica), a digital camera (Axiocam HRm, Leica). A field of
cells was imaged at 340 nm excitation and 380 nm excitation, and emission was collected at
530 nm, each image was acquired over 5 s, and a couple of images was acquired every 16 s
over 50 min.
Video-microscopic measurement of intracellular pH
To measure intracellular pH, 158N cells were cultured in 60 mm diameter Petri dishes. When
the cells were subconfluent, with alpha-cyclodextrine (1 mg/ml final concentration), C24:0 or
C26:0 (20 µM final concentration) were added into the culture medium and their effects on
intracellular pH was followed using the cell permeable fluorescent indicator BCECF-AM
Invitrogen) (Boyer and Hedley, 1994). Briefly, cells were washed, loaded with 5 µM BCECF-
AM for 30 min at 37°C. After a final wash, cells were put in fresh culture medium, and after
addition of C24:0, C26:0 (20 µM final concentration) or alpha-cyclodextrin (1 mg/ml final
concentration), the intracellular pH was followed as 450/490 nm excitation wavelength ratio
at 530 nm wavelength emission using Cell Observer Station composed of an Axiovert 200M
microscope (Leica), a digital camera (Axiocam HRm, Leica). Each image was acquired over
25 ms, and a couple of images was acquired every 2 min for 45 min.
Inactivation of Abcd1 with SiRNAs
Abcd1 siRNAs were from Ambion (Applied Biosystems, Courtaboeuf, France). These
siRNAs were used at 30 nM and transfected in 158N cells by means of the INTERFERin
transfection reagent according to the manufacturer's instructions (Polyplus / Ozyme, St
Quentin en Yvelines, France). For Abcd1 inactivation, three siRNAs were tested:
siRNA 1 (1D s62233), 5′-CACUGUCGUUUUAAGAGGAtt-3′(sense) and
5′-UCCUCUUAAAACGACAGUGtt-3′(antisense);
siRNA 2 (1D s62234), 5′-CCAACAGACUUACUACCGAtt-3′(sense) and
5′-UCGGUAGUAAGUCUGUUGGga-3′(antisense);
A negative control siRNA (Ambion) directed aginst gene sequences with no significant
homology to any known genes from mouse, rat, or human were simultaneously used. Twenty-

RESULTATS
164
four hours after siRNA transfection, cells were collected by trypsinization and used to analyze
the expression of Abcd1 mRNA and protein by RT-qPCR and western blotting, respectively.
Quantification of Abcd1 mRNAs by RT-qPCR
Cells were harvested with trypsin/EDTA and washed with PBS. Total RNA isolation from
control, Scrambled RNA, Abcd1 SiRNAs treated-158N cells was extracted using the RNeasy
Mini kit (Qiagen, Cortaboeuf, France) following the manufacturer’s instructions. cDNA was
generated by reverse transcription using QuantiTect Rev. Transcription Kit (Qiagen)
according to the manufacturer’s protocol and analyzed by quantitative PCR using the SYBR
Green (BioScience Technology, Rockaway, NJ, USA) real-time PCR technology, and an
iCycler iQ Real-Time Detection System (Bio-Rad laboratories, Marne la Coquette, France).
The primer sequences are: (Abcd1: forward 5'-acatccctatcatcacacccactg-3' and reverse 5'-
gagaactcttgccacagccattg-3'; L27: forward 5'-ctcatgcccacaaggtactctgtg-3' and reverse 5'-
tgtatcgctcctcaaacttgacct-3') were chosen using the Beacon Designer Software (Bio-Rad
laboratories). Thermal cycling conditions were as follows: activation of DNA polymerase at
95°C for 10 min, followed by 40 cycles of amplification at 95°C for 15 s, 60°C for 30 s, and
72°C for 30 s, followed by a melting curve analysis to control the absence of nonspecific
products. Gene expression was quantified using cycle to threshold (Ct) values and normalized
by the L27 reference gene. The quantitative expression of Abcd1, and β-actin, was determined
according to 2-∆Ct with ∆Ct = (Ct of the gene studied) – (Ct of the L27), or as fold induction of
the control.
Characterization and quantification of Abcd1 protein by western blotting
After 24 h of transfection (2 days of culture), cells were trypsinized, washed with PBS,
harvested and lysed in a 10 mM Tris/HCl buffer, pH 8, containing 10 mM EDTA, 1% Triton
X100, 100 mM NaCl and a protease inhibitor cocktail (Roche Diagnostics Inc.) for 20 min on
ice. After centrifugation at 17,000 g for 20 min at 4 C°, the total protein concentrations of
supernatants were determined using bovine serum albumin as a standard (Bio-Rad
Laboratories). A total protein (30 µg) was run on SDS-polyacrylamide gels (10%) according
to Laemmli (Laemmli, 1970), and transferred onto a PVDF membrane (Bio-Rad Labratories)
as previously described (Towbin et al., 1979). The membrane was blocked in TBS with 0.1%
Tween containing 1% skim milk (blocking buffer) and incubated overnight at 4°C. Primary
antibodies, anti Abcd1 1/5,000 (rabbit polyclonal, serum 925029) described elsewhere
(Baarine et al., 2009), and anti β-actin 1/10,000 (mouse monoclonal, Sigma-Aldrich) were
RESULTATS
165
diluted in blocking buffer and applied to sections for 1 h at room temperature. The
membranes were washed TBS with 10% Tween 20 (TBST). Bands were detected using anti-
IgG polyclonal antibody conjugated to peroxidase 1/10,000 (Santa Cruz, CA, USA) for 1 h at
room temperature. The membranes were washed in TBST and revealed using an enhanced
chemiluminescence detection kit (Santa Cruz Biotechnology Inc, Santa Cruz, CA, USA) and
autoradiographed.
Statistical analysis
Statistical analyses were performed on at least three independent experiments with Prism 5
software, version 5.01 (Prism Software Corporation, Irvine, CA, USA) with the Mann and
Whitney test. Data were considered to be statistically different at a p-value of 0.05 or less.
Results
Impact of C24:0 and C26:0 on the proliferation of 158N oligodendrocytes
The effects of C24:0 and C26:0 (5, 10, 20, and 40 µM) on 158N murine oligodendrocytes
proliferation was studied after a 24 and 48 h period of treatment on sub-confluent cells. As
shown in Figure 1A, at 5 and 10 µM, there was no or slight effects on cell proliferation
(quantified by counting on a hematocytometer). However, at 20 and 40 µM, cell proliferation
was strongly inhibited (up to 60 %). As the effects of C24:0 and C26:0 on cell proliferation
were in the same range of order at 24 and 48 h, further investigations realised to characterize
the type of cell death were only performed at 24 h. In these conditions, observations
performed by phase contrast microscopy, did not revealed the presence of floating cells in the
culture medium of 158N cells treated with C24:0 or C26:0 used at 5 and 10 µM for 24 h,
whereas some non adherent cells were found at 20 and 40 µM (Fig. 1B). With alpha-
cyclodextrine, used as vehicle to solubilized C24:0 and C26:0, no effects on cell proliferation
were observed when compared to untreated cells.
Ultrastuctural modifications induced by C24:0 and C26:0 on 158N oligodendrocytes
The ultraructural modification induced by C24:0 and C26:0 (10, 20, and 40 µM) on 158N
murine oligodendrocytes were determine at 24 h of treatment on sub-confluent cells (Fig. 2).
When compared to untreated cells, no ultrastructural modifications were induced by alpha
cyclodextrine (Fig. 2A-B). In control cells, the mitochondrial cristae were clearly
distinguishable (Fig. 2C) and their aspects were similar in alpha-cyclodextrine treated cells
(data not shown). With C24:0 and C26:0 used at 10 µM, no ultrastructural changes were
RESULTATS
166
detected (data not shown). However, with C24:0 and C26:0 used at 20 and 40 µM (Fig. 2D-E,
G-H, J-K), numerous cytoplasmic changes were observed, and especially the presence of
vacuoles of various shapes and sizes containing various types of materials. In addition,
comparatively to untreated and alpha-cyclodextrine-treated cells, mitochondria smaller in
sizes and with abnormal shapes were observed in C24:0 and C26:0 – treated cells (Fig. 2 F,
2L) as well as lipid droplets (Fig. 2I) and multilamellar cytoplasmic structures, named myelin
figures (Fig. 2K).
The absence of cell with fragmented and/or condensed nuclei, characteristic of an apoptotic
mode of cell death, does not support that C24:0 and C26:0 induce apoptosis on 158N cells
(Lizard et al., 1995). As the vacuoles can be tightly associated with cellular organels such as
mitochondria (Fig. 2E), these ultrastructural features evocate mitophagic and/or autophagic
processes. Thefore, in order to evaluate whether C24:0 and C26:0 may activate autophagic
processes, cells were stained with monodansylcadaverine, which has been described to
accumulate in autophagic vacuoles (Niemann et al., 2001) (Fig. 3). Interestingly, whereas
only small and tightly fluorescent spots were detected in the cytoplasm of untreated and
alpha-cyclodextrine-treated 158N cells, a strong fluorescence was observed in the cytoplasm
of C24:0 and C26:0 – treated cells as soon as 20 µM.
Characterization of the mode of cell death induced by C24:0 and C26:0 by complementary
methods: Hoechst staining, TUNEL method, FLICA method, and detection of active
caspase-3 by immunofluorescence
In order to precise the mode of cell death induced by C24:0 and C26:0, additional tests were
used (Fig. 4 A-B). The absence of cells with fragmented and/or condensed nuclei observed by
fluorescence microscopy after staining with Hoechst 33342 were in agreement with data
obtained by transmission electron microscopy, and support that C24:0 and C26:0 (10 and 20
µM) do not induce apoptosis on 158N cells (Fig. 4A). In addition with C24:0 and C26:0 used
at 10 µM, no internucleosomal DNA fragmentation was found with the TUNEL method, no
activated caspases were detected with the FLICA method, and no activated caspase-3 were
found by immunofluorescence staining (Fig. 4A). Altogether, this data support the induction
of a non apoptotic mode of cell death. However, with C24:0 and C26:0 used at 20 µM, around
15% of cells with inter-nucleosomal fragmented DNA were detected with the TUNEL
method, and on C26:0 treated cells similar percentages of cells with activated caspases
detected with the FLICA method were found. As serine protease dependent activation of
caspases have been reported (Stenson-Cox et al., 2003), the activation of these enzymes was
RESULTATS
167
determined by FLISP method (Fig 4B). Interestingly, especially in C26:0 (20 µM) treated
158N cells, a marked and significant activation of serine protease was observed.
Effects of C24:0 and C26:0 on transmembrane mitochondrial potential and cytochrome c
repartition
As important morphological changes (sizes and shapes) of mitochondria were observed by
transmission electron microscopy in C24:0 and C26:0 – treated 158N cells, the impact of
these VLCFA on the transmembrane mitochondrial potential and on the cytoplasmic
repartition of cytochrome c were investigated (Fig. 5). Noteworthy, a loss of transmembrane
mitochondrial potential was observed at 5, 10, and 20 µM with C24:0, and at 10 and 20 µM
with C26:0 (Fig. 5A). By immunofluorescence staining, important modifications of the
reapartition of the cytochrome c were observed in the cytoplasm of VLCFA-treated cells at 10
and 20 µM (Fig. 5B).
Implication of lysosome in C24:0 and C26:0 induced cell death
In addition to mitochondria, lysosomes are also important organels capable to play important
roles in caspase-dependent and independent cell death (Yamashima and Oikawa, 2009).
Therefore, we precised the part taken by lysosomes in VLCFA-induced cell death by various
approaches (Fig. 6). By using the lysosomotropic dye, acridine orange (AO), and flow
cytometry, we analyzed the effects of C24:0 and C26:0 (5, 10 and 20 µM; 24 h) on lysosomal
membrane integrity of 158N murine oligodendrocytes (Fig. 6A). No effects were detected at 5
µM, whereas as early as 10 µM a destabilization of lysosomal integrity was observed as
shown by lower percentages of acridine orange red negative cells. By fluorescent microscopy,
on AO stained cells, only small red fluorescent spots were revealed in untreated and alpha-
cyclodextrine-treated cells (Fig. 6B). At the opposite, on C24:0 or C26:0 (20 µM)-treated
cells, mainly large or aggregated red spots were present. By using LysoTracker Red, allowing
to evaluate the size and distribution of lysosomes, we obtained similar results (Fig. 6B). In
addition, the identification of LAMP1 (a lysosomal associated membrane protein (Eskelinen
et al., 2003)) by immunostaing also show that C24:0 and C26:0 induce an aggregation and a
redistribution of the lysosomes into the cytoplasm (Fig. 6B). With alpha-cyclodextrine no
effects on lysosomal integrity, size and distribution were found.
Effects of C24:0 and C26:0 on intracellular pH

RESULTATS
168
The ability of VLCFA to induce lysosomal modifications led us to investigate the effects of
C24:0 and C26:0 on intracellular pH. To this end, we analyzed whether addition of C24:0 or
C26:0 (20 µM) in the culture medium causes changes of intracellular pH measured every 2
min for 45 min with BCECF-AM by video microscopy. Figure 7A, which displays the
representative traces of the kinetics of C24:0 and C26:0, shows that these two VLCFA very
rapidly decrease the intracellular pH suggesting a very rapid effect of these VLCFA on
membrane integrity. With alpha-cyclodextrine (1 mg/ml), no modification of intracellular pH
was observed.
Effects of C24:0 and C26:0 on intracellular calcium level
As VLCFA are able to induce deregulation of Ca2+ in rat oligodendrocytes primary cultures
(Hein et al., 2008), it was of interest to precise the mechanism of the early changes associated
with cytotoxic effects of VLCFA on 158N murine oligodendrocytes (Fig. 7B). To this end, we
analyzed whether application of C24:0 (20 µM) and C26:0 (20 µM) causes changes of
intracellular Ca2+ measured every 16 s for 50 minutes with Fura-2 by video microscopy.
Figure 4, which displays the representative traces of the kinetics of C24:0 and C26:0, shows
that these two VLCFA trigger very early intracellular increase of Ca2+ when they were added
to the culture medium, and that this increase was higher with C26:0 than with C24:0. For
comparison, we give the stable control trace obtained with vehicle solution containing alpha-
cyclodextrine (1 mg/ml).
Incidence of Abcd1 silencing on C24:0 and 26:0 - induced cell death
To precise the incidence of Abcd1 expression on the sensitivity of 158N murine
oligodendrocytes to C24:0 and C26:0 – induced cell death, the effects of C24:0 and C26:0 (10
and 20 µM; 24 h) were studied on wild type and Abcd1 knockdown 158N murine
oligodendrocytes (Fig. 8). Abcd1 silencing was performed either with siRNA Abc1 (1) or
Abc1 (2) which have similar efficiency. In these conditions, when compared to untransfected
cells, slight increase of cell death were observed in C24:0 and C26:0 treated cells excepted in
the condition C26:0 (20 µM) wild type 158N cells versus transfected Abcd1 (2) transfected
cells.
Incidence of Abcd1 silencing on PLP and MBP expression
As VLCFA-induced oligodendrocyte cell death has been suggested to contribute to
demyelination in X-ALD (Eichler et al., 2008), the effects of C24:0 and C26:0 (5, 10 and 20

RESULTATS
169
µM; 24 h) were studied on wild type and Abcd1 knockdown 158N murine oligodendrocytes to
determine the effects on the two major myelin proteins: PLP and MBP (Fig. 9). Interestingly,
Abcd1 silencing (siRNA Abcd1 (2)) decreases MBP expression whereas it has no effect on
PLP expression (Fig. 9A). When added on wild type or Abcd1 inactivated 158N cells, C24:0
and C26:0 have either no effects or slight effects (positive or negative) on PLP and MBP
expression (Fig. 9B).
Acknowledgements
This work was supported by grants from the INSERM, the Université de Bourgogne, and the
Conseil Régional de Bourgogne. The authors acknowledge Dr Zilal Kattan (Ph.D), Mr Kevin
Ragot (MS) and Mr Thomas Nury (BS) for their excellent technical assistance.
References
- Baarine M, Ragot K, Genin EC, El Hajj H, Trompier D, Andreoletti P, Ghandour MS,
Menetrier F, Cherkaoui-Malki M, Savary S, Lizard G (2009) Peroxisomal and mitochondrial
status of two murine oligodendrocytic cell lines (158N, 158JP): potential models for the study
of peroxisomal disorders associated with dysmyelination processes. J Neurochem. 111: 119-
131.
- Baes M, Aubourg P (2009) Peroxisomes, myelination, and axonal integrity in the CNS.
Neuroscientist 15: 367-379.
- Baumann N, Pham-Dinh D (2001) Biology of oligodendrocyte and myelin in the
mammalian central nervous system. Physiol Rev 81: 871-927.
- Bedner E, Smolewski P, Amstad P, Darzynkiewicz Z. (2000) Activation of caspases
measured in situ by binding of fluorochrome-labeled inhibitors of caspases (FLICA):
Correlation with DNA fragmentation. Exp Cell Res 259: 308-313.
- Berger J, Gärtner J (2006) X-linked adrenoleukodystrophy: clinical, biochemical and
pathogenetic aspects. Biochim Biophys Acta 1763: 1721-1732.
- Biederbick A, Kern HF and Elsässer HP (1995) Monodansylcadaverine (MDC) is a specific
in vivo marker for autophagic vacuoles. Eur. J. Cell. Biol. 66: 3–14.
- Bottelbergs A, Verheijden S, Hulshagen L, Gutmann DH, Goebbels S, Nave KA, Kassmann
C, Baes M (2010) Axonal integrity in the absence of functional peroxisomes from projection
neurons and astrocytes. GLIA 58: 1532-1543.
RESULTATS
170
- Boyer MJ, Hedley DW (1994) Measurement of intracellular pH, Methods in Cell Biology
41: 135-148.
- Campagnoni AT, Skoff RP (2001) The pathobiology of myelin mutants reveal novel
biological functions of the MBP and PLP genes. Brain Pathol. 11: 74-91.
- Cimini A, Bernardo A, Cifone G, Di Muzio L, Di Loreto S (2003) TNFα downregulates
PPARδ expression in oligodendrocytes progenitor cells: implication for demyelinating
diseases. GLIA 41: 3-14.
- Dubois-Dalcq M, Feigenbaum V, Aubourg P (1999) The neurobiology of X-linked
adrenoleukodystrophy, a demyelinating peroxisomal disorder. Trends Neurosci 22: 4-12.
- Eichler FS, Ren JQ, Cossoy M, Rietsch AM, Nagpal S, Moser AB, Frosch MP, Ransohoff
RM (2008) Is microglial apoptosis an early pathogenic change in cerebral X-linked
adrenoleukodystrophy? Ann Neurol. 63: 729-742.
- Eskelinen EL, Tanaka Y, Saftig P (2003) At the acidic edge: emerging functions for
lysosomal membrane proteins. Trends Cell Biol. 13: 137-145.
- Feigenbaum V, Gélot A, Casanova P, Daumas-Duport C, Aubourg P, Dubois-Dalcq M
(2000) Apoptosis in the central nervous system of cerebral adrenoleukodystrophy patients.
Neurobiol Dis. 7(6 Pt B): 600-612.
- Feutz AC, Pham-Dinh D, Allinquant B, Miehe M, Ghandour MS (2001) An immortalized
jimpy oligodendrocyte cell line: defects in cell cycle and cAMP pathway. GLIA 34: 241-252.
- Ghandour S, Feutz AM, Jalabi W, Taleb O, Bessert D, Cypher M, Carlock L, Skoff RP
(2002) Trafficking of PLP/DM20 and cAMP signalling in immortalized jimpy
oligodendrocytes. GLIA 40: 300-311.
- Gould SJ, Valle D (2000) Peroxisome biogenesis disorders: genetics and cell biology.
Trends Genet. 16: 340-345.
- Grabarek J, Du L, Johnson GL, Lee BW, Phelps DJ, Darzynkiewicz Z (2002) Sequential
activation of caspases and serine proteases (serpases) during apoptosis. Cell Cycle 1: 124-131.
- Hein S, Schönfeld P, Kahlert S, Reiser G (2008) Toxic effects of X-linked
adrenoleukodystrophy-associated, very long chain fatty acids on glial cells and neurons from
rat hippocampus in culture. Hum Mol Genet. 17: 1750-1761.
- Ho JK, Moser H, Kishimoto Y, Hamilton JA (1995) Interactions of a very long chain fatty
acid with model membranes and serum albumin. Implications for the pathogenesis of
adrenoleukodystrophy. J Clin Invest. 96: 1455-1463.
- Höftberger R, Kunze M, Weinhofer I, Aboul-Enein F, Voigtländer T, Oezen I, Amann G,
Bernheimer H, Budka H, Berger J (2007) Distribution and cellular localization of

RESULTATS
171
adrenoleukodystrophy protein in human tissues: implications for X-linked
adrenoleukodystrophy. Neurobiol Dis 28: 165-174.
- Hörster F, Surtees R, Hoffmann GF (2005) Disorders of intermediary metabolism: toxic
leukoencephalopathies. J Inherit Metab Dis 28: 345-356.
- Kassmann C, Lappe-Siefke C, Baes M, Brügger B, Mildner A, Werner HK, Natt O,
Michaelis T, Prinz M, Frahm J, Nave KA (2007) Axonal loss and neuroinflammation caused
by peroxisome-deficient oligodendrocytes. Nat. Genet. 39: 969-976.
- Kemp S, Wanders RJ (2007) X-linked adrenoleukodystrophy: very long-chain fatty acid
metabolism, ABC half-transporters and the complicated route to treatment. Mol Genet Metab.
90: 268-276.
- Laemmli UK. (1970) Cleavage of structural proteins during the assembly of the head of
bacteriophage T4. Nature, 227: 680–685.
- Lemaire-Ewing S, Prunet C, Montange T, Vejux A, Berthier A, Bessède G, Corcos L,
Gambert P, Néel D, Lizard G (2005) Comparison of the cytotoxic, pro-oxidant and pro-
inflammatory characteristics of different oxysterols. Cell Biol Toxicol. 21: 97-114.
- Lizard G, Fournel S, Genestier L, Dhedin N, Chaput C, Flacher M, Mutin M, Panaye G,
Revillard JP (1995) Kinetics of plasma membrane and mitochondrial alterations in cells
undergoing apoptosis. Cytometry. 21: 275-283.
- Miguet-Alfonsi C, Prunet C, Monier S, Bessède G, Lemaire-Ewing S, Berthier A, Ménétrier
F, Néel D, Gambert P, Lizard G (2002) Analysis of oxidative processes and of myelin figures
formation before and after the loss of mitochondrial transmembrane potential during 7beta-
hydroxycholesterol and 7-ketocholesterol-induced apoptosis: comparison with various pro-
apoptotic chemicals. Biochem Pharmacol. 64: 527-541.
- Mosser J, Douar AM, Sarde CO, Kioschis P, Feil R, Moser H, Poustka AM, Mandel JL,
Aubourg P (1993) Putative X-linked adrenoleukodystrophy gene shares unexpected homology
with ABC transporters. Nature 361: 726-730.
- Niemann A, Baltes J, and Elsässer HP (2001) Fluorescence properties and staining behavior
of monodansylpentane, a structural homologue of the lysosomotropic agent
monodansylcadaverine. J. Histochem. Cytochem. 49: 177–185.
- Paintlia AS, Gilg AG, Khan M, Singh AK, Barbosa E, Singh I (2003) Correlation of very
long chain fatty acid accumulation and inflammatory disease progression in childhood X-
ALD: implications for potential therapies. Neurobiol. Dis. 14: 425-439.
RESULTATS
172
- Singh I, Kishimoto Y. Effect of cyclodextrins on the solubilization of lignoceric acid,
ceramide, and cerebroside, and on the enzymatic reactions involving these compounds. J
Lipid Res. 1983; 24: 662-665.
- Singh I, Pujol A (2010) Pathomechanisms underlying X-adrenoleukodystrophy: a three-hit
hypothesis. Brain Pathol. 20: 838-44.
- Stenson-Cox C, Fitzgerald U, Samali A (2003) In the cut and thrust of apoptosis, serine
proteases come of age. Biochem Pharm 66: 1469-1474.
- Takemoto Y, Suzuki Y, Horibe R, Shimozawa N, Wanders RJ, Kondo N (2003) Gas
chromatography/mass spectrometry analysis of very long chain fatty acids, docosahexaenoic
acid, phytanic acid and plasmalogen for the screening of peroxisomal disorders. Brain Dev.
25: 481-487.
- Taylor CM, Marta CB, Claycomb RJ, Han DK, Rasband MN, Coetzee T, Pfeiffer SE (2004)
Proteomic mapping provides powerful insights into functional myelin biology. Proc Natl
Acad Sci U S A 101: 4643-4648.
- Valianpour F, Selhorst JJ, van Lint LE, van Gennip AH, Wanders RJ, Kemp S (2003)
Analysis of very long-chain fatty acids using electrospray ionization mass spectrometry. Mol
Genet Metab. 79: 189-196.
- Wanders RJ, Waterham HR (2006) Biochemistry of mammalian peroxisomes revisited.
Annu Rev Biochem. 75: 295-332.
- Weller S, Gould SJ, Valle D (2003) Peroxisome biogenesis disorders. Annu Rev Genomics
Hum Genet. 4: 165-211.
- Yamashima T, Oikawa S (2009) The role of lysosomal rupture in neuronal death. Prog
Neurobiol. 89: 343-358.
- Yoon J, Kim KJ, Choi YW, Shin HS, Kim YH, Min J (2010) The dependence of enhanced
lysosomal activity on the cellular aging of bovine aortic endothelial cells. Mol Cell Biochem
340: 175-178.

RESULTATS
173
Legends to Figures
Figure 1: Effects of very long chain fatty acids (C24:0 and C26:0) on cell growth of 158N
murine oligodendrocytes. Sub-confluent murine oligodendrocytes (158N) were cultured in
the absence or in the presence of C24:0 and C26:0 (5, 10, 20 or 40 µM) for 24 and 48 h.
C24:0 and C26:0 were diluted in α-cyclodextrine (vehicle: 1 mg/ml). Cell proliferation was
determined by cell counting (A). Phase contrast microscopy of untreated, α-cyclodextrine and
C24:0 or C26:0 – treated 158N cells (B). Data shown are mean + SD from five separate
experiments performed in triplicate. Significance of the difference between control and
vehicle, C24:0 or C26:0 (Mann Whitney test; *P < 0.05 or less).
Figure 2: Ultrastuctural features of 158N murine oligodendrocytes treated with very
long chain fatty acids (C24:0 and C26:0). Sub-confluent murine oligodendrocytes (158N)
were cultured in the absence or in the presence of C24:0 and C26:0 (5, 10, 20 or 40 µM) for
24 h. C24:0 and C26:0 were diluted in α-cyclodextrine (vehicle: 1 mg/ml). A: untreated cells;
B: vehicle-treated 158N cells; C: morphological aspects of mitochondria (dark arrows) in
untreated cells; mitochondrial cristae are clearly distinguishable (mitochondria with similar
aspects were observed in vehicle-treated cells, our data not shown); D: in C24:0 (20 µM)-
treated cells large vacuoles (V) are observed; E: enhanced magnification of area delineated by
a rectangle in D; cellular debris are found inside the vacuole which is tightly connected with
two mitochondria evocating a mitophagy process; mitochondria observed (dark arrows) are
smaller than in untreated cells and mitochondrial cristae are hardly distinguishable; F:
morphological aspects of mitochondria in C24:0 (20 µM)-treated cells; mitochondria
observed (dark arrows) are smaller than in untreated cells and mitochondrial cristae are hardly
distinguishable; G: in C24:0 (40 µM)-treated cells the cytoplasm contains some large
vacuoles (V) with cellular debris; H: enhanced magnification of area delineated by a rectangle
in G; cellular debris and membrane sequestration are detected inside the vacuoles; I : in C26:0
(20 µM)-treated cells vacuoles of various size and shapes are also identified as well as some
lipid droplets (LD); J: enhanced magnification of area delineated by a square in I; the dark
arrow point towards a small mitochondria; in the vacuole (V) some cellular debris are
detected; K : in C26:0 (40 µM)-treated cells, the cytoplasm is strongly disorganized, numerous
vacuoles are present and some of them contain sometimes multilamellar structures evocating
myelin figures (MF); L : morphological aspects of mitochondria (dark arrows) in C26:0 (40
RESULTATS
174
µM)-treated cells; mitochondria are smaller than in untreated cells and mitochondrial cristae
are hardly distinguishable.
Figure 3: Identification of monodansylcadaverine positive structures in 158N murine
oligodendrocytes treated with very long chain fatty acids (C24:0 and C26:0). Sub-
confluent murine oligodendrocytes (158N) were cultured in the absence or in the presence of
C24:0 and C26:0 (20 µM) for 24 h. C24:0 and C26:0 were diluted in α-cyclodextrine
(vehicle: 1 mg/ml). Whereas a slight staining with monodansylcadaverine (MDC) was
observed in control (untreated) (A) and vehicle – treated cells (B), MDC positive structures of
various sizes, evocating an autophagic process, were observed in the cytoplasm of C24:0 (20
µM) and C26:0 (20 µM) – treated 158N cells (C-D).
Figure 4: Characterization of cell death induced by C24:0 and C26:0 on 158N murine
oligodendrocytes. Sub-confluent murine oligodendrocytes 158N cells were cultured in the
absence or in the presence of α-cyclodextrin (vehicle: 1 mg/ml), C24:0 and C26:0 (10 and 20
µM) for 24 h. Effects of vehicle, C24:0 and C26:0 on 158N cells were evaluated by: A:
fluorescence microscopy after nuclei staining with Hoechst 33342 allowing to distinguish
between normal, apoptotic, and necrotic cells, flow cytometric determination of the
percentage of TUNEL positive cells (cells with inter-nucleosomal DNA fragmentation),
FLICA positive cells (cells containing activated caspases) and caspase-3 positive cells (cells
containing activated caspase-3); B: flow cytometric evaluation of FLISP positive cells (cells
with activated serine proteases). The values reported are means ± SD of three independent
experiments * p<0.05; comparison between untreated (control) and α-cyclodextrin, C24:0 or
C26:0-treated 158N cells.
Figure 5: Effects of very long chain fatty acids (C24:0 and C26:0) on mitochondrial
status. Sub-confluent murine oligodendrocytes (158N) were cultured in the absence or in the
presence of C24:0 and C26:0 (20 µM) for 24 h. C24:0 and C26:0 were diluted in α-
cyclodextrine (vehicle: 1 mg/ml). A: flow cytometric evaluation of transmembrane
mitochondrial potential measured after staining with Rh123. Data shown are mean + SD from
three separate experiments performed in triplicate. Significance of the difference between
control and vehicle, C24:0 or C26:0 (Mann Whitney test; *P < 0.05 or less). B: impact of
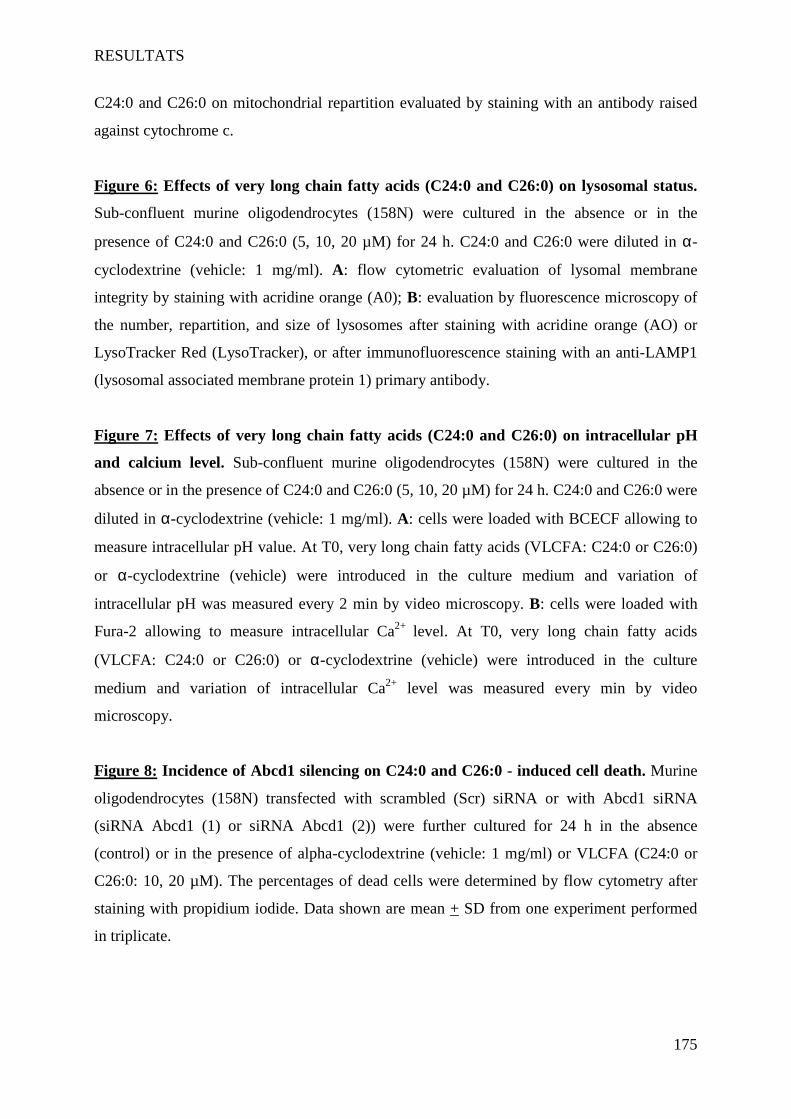
RESULTATS
175
C24:0 and C26:0 on mitochondrial repartition evaluated by staining with an antibody raised
against cytochrome c.
Figure 6: Effects of very long chain fatty acids (C24:0 and C26:0) on lysosomal status.
Sub-confluent murine oligodendrocytes (158N) were cultured in the absence or in the
presence of C24:0 and C26:0 (5, 10, 20 µM) for 24 h. C24:0 and C26:0 were diluted in α-
cyclodextrine (vehicle: 1 mg/ml). A: flow cytometric evaluation of lysomal membrane
integrity by staining with acridine orange (A0); B: evaluation by fluorescence microscopy of
the number, repartition, and size of lysosomes after staining with acridine orange (AO) or
LysoTracker Red (LysoTracker), or after immunofluorescence staining with an anti-LAMP1
(lysosomal associated membrane protein 1) primary antibody.
Figure 7: Effects of very long chain fatty acids (C24:0 and C26:0) on intracellular pH
and calcium level. Sub-confluent murine oligodendrocytes (158N) were cultured in the
absence or in the presence of C24:0 and C26:0 (5, 10, 20 µM) for 24 h. C24:0 and C26:0 were
diluted in α-cyclodextrine (vehicle: 1 mg/ml). A: cells were loaded with BCECF allowing to
measure intracellular pH value. At T0, very long chain fatty acids (VLCFA: C24:0 or C26:0)
or α-cyclodextrine (vehicle) were introduced in the culture medium and variation of
intracellular pH was measured every 2 min by video microscopy. B: cells were loaded with
Fura-2 allowing to measure intracellular Ca2+ level. At T0, very long chain fatty acids
(VLCFA: C24:0 or C26:0) or α-cyclodextrine (vehicle) were introduced in the culture
medium and variation of intracellular Ca2+ level was measured every min by video
microscopy.
Figure 8: Incidence of Abcd1 silencing on C24:0 and C26:0 - induced cell death. Murine
oligodendrocytes (158N) transfected with scrambled (Scr) siRNA or with Abcd1 siRNA
(siRNA Abcd1 (1) or siRNA Abcd1 (2)) were further cultured for 24 h in the absence
(control) or in the presence of alpha-cyclodextrine (vehicle: 1 mg/ml) or VLCFA (C24:0 or
C26:0: 10, 20 µM). The percentages of dead cells were determined by flow cytometry after
staining with propidium iodide. Data shown are mean + SD from one experiment performed
in triplicate.

RESULTATS
176
Figure 9: Incidence of Abcd1 silencing on C24:0 and C26:0 - induced PLP and MBP
expression. Murine oligodendrocytes (158N) transfected with scrambled (Scr) siRNA or with
Abcd1 siRNA (siRNA Abcd1 (2)) were further cultured for 24 h in the absence (control) or in
the presence of alpha-cyclodextrine (vehicle: 1 mg/ml) or VLCFA (C24:0 or C26:0: 5, 10, 20
µM). The expression of PLP and MBP was determined by flow cytometry. The arrows point
towards the curves associated with the expression of PLP or MBP. CC: conjugated control;
NT: non transfected; T: transfected with siRNA Abcd1 (2); α: alpha-cyclodextrine (1 mg/ml);
Scr: transfected with scramble siRNA. Data shown are the results of one experiment.
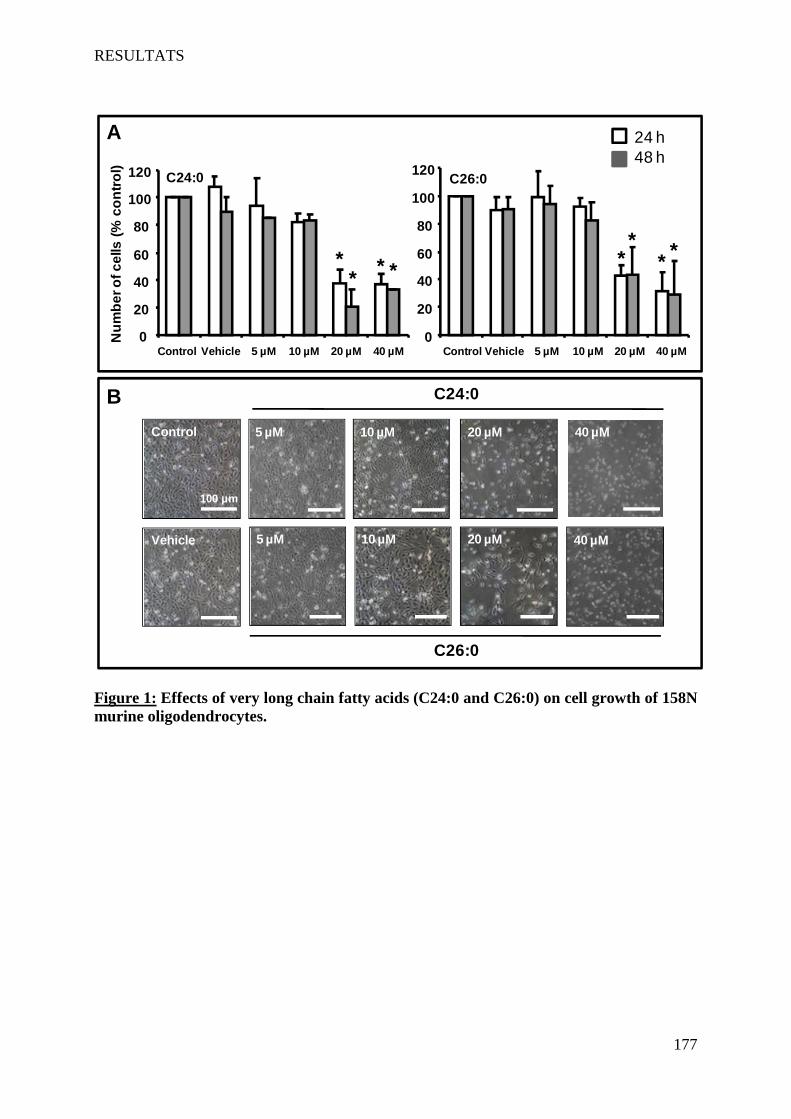
RESULTATS
177
N
umbe
rof c
ells
(% c
ontro
l)
20
40
60
80
100
120
0Control Vehicle 5 µM 10 µM 20 µM 40 µM
C26:0
**
* *
0
20
40
60
80
100
120
Control Vehicle 5 µM 10 µM 20 µM 40 µM
C24:0
**
* *
A
C24:0
C26:0
Vehicle
5 µM 10 µM 20 µM 40 µMControl
100 µm
5 µM 10 µM 20 µM 40 µM
B
24 h48 h
Figure 1: Effects of very long chain fatty acids (C24:0 and C26:0) on cell growth of 158N murine oligodendrocytes.
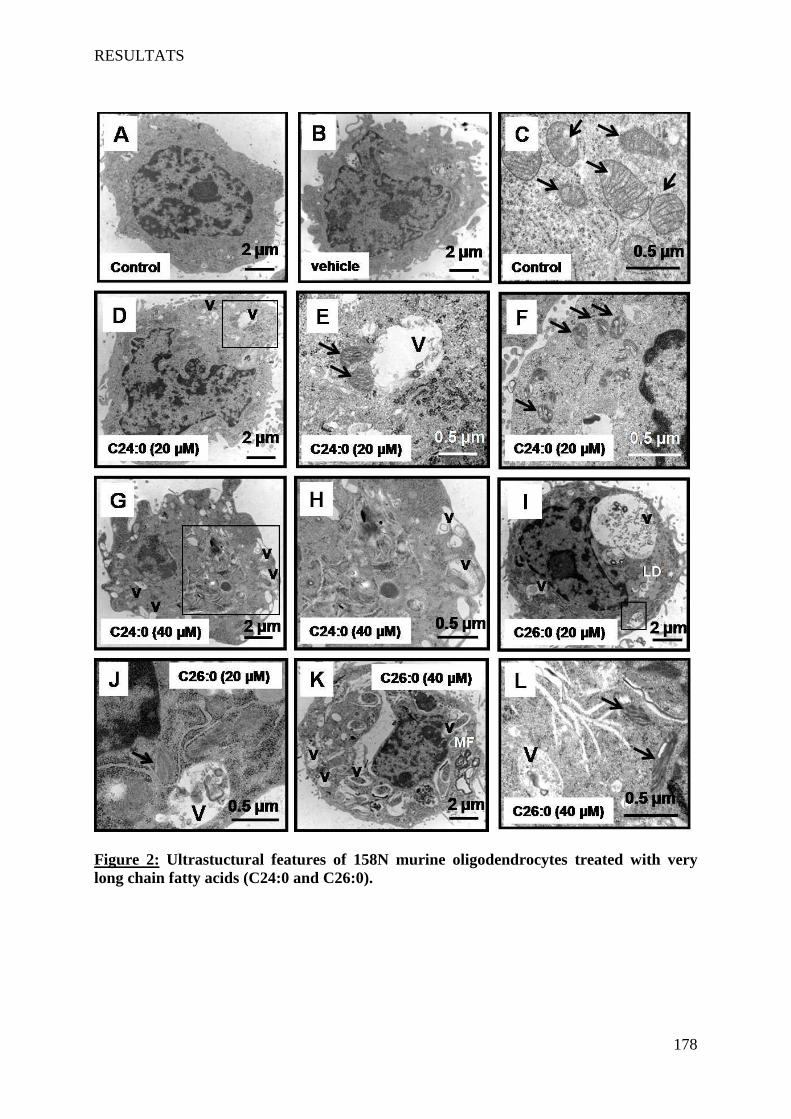
RESULTATS
178
Figure 2: Ultrastuctural features of 158N murine oligodendrocytes treated with very long chain fatty acids (C24:0 and C26:0).

RESULTATS
179
Figure 3: Identification of monodansylcadaverine positive structures in 158N murine oligodendrocytes treated with very long chain fatty acids (C24:0 and C26:0).
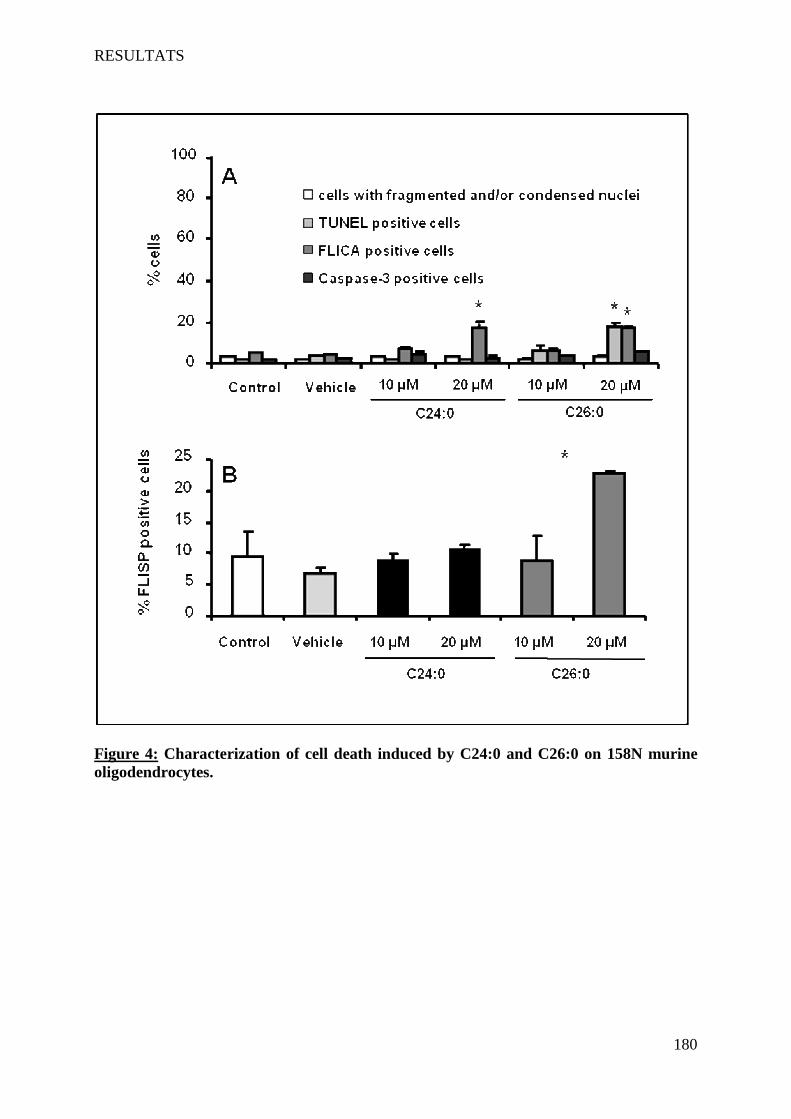
RESULTATS
180
Figure 4: Characterization of cell death induced by C24:0 and C26:0 on 158N murine oligodendrocytes.
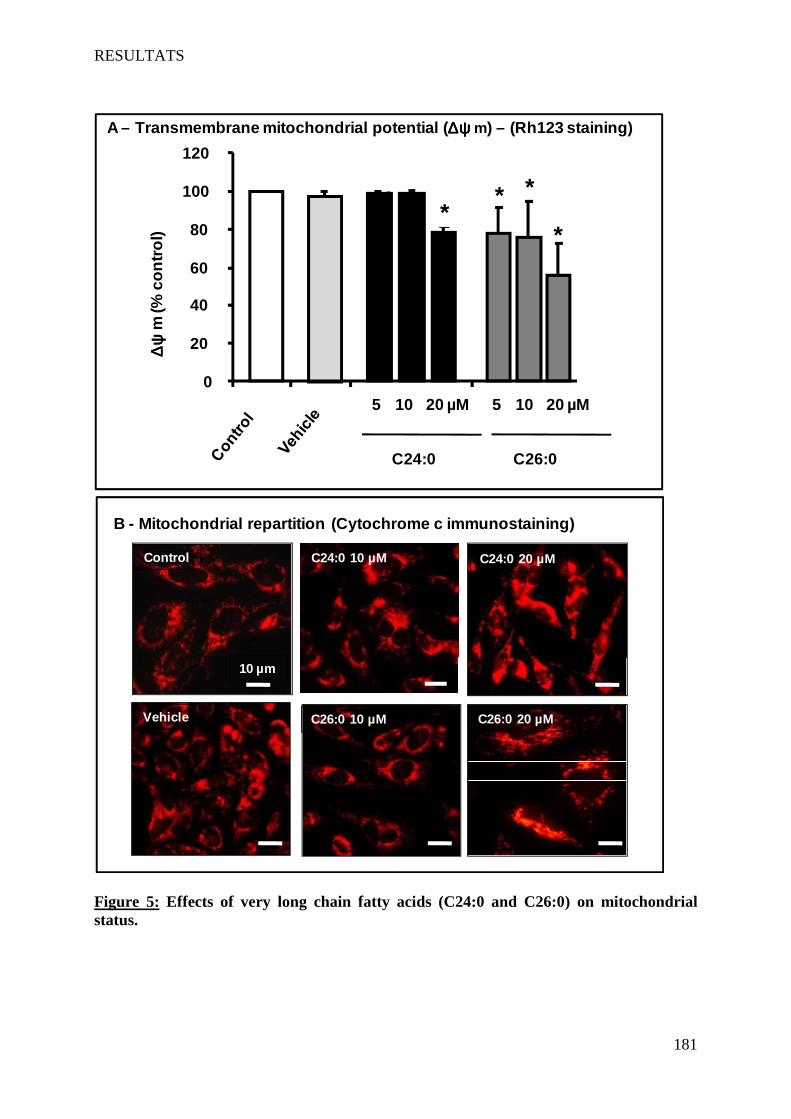
RESULTATS
181
B - Mitochondrial repartition (Cytochrome c immunost aining)
B: ∆Ψm (Rdh123)
10 µm
Control
Vehicle C26:0 10 µM C26:0 20 µM
C24:0 10 µM C24:0 20 µM
∆ψ
∆
ψ
∆ψ
∆
ψ m
(% c
ontro
l)
0
20
40
60
80
100
120
C24:0 C26:0
**
* *
5 10 20 µM 5 10 20 µM
A – Transmembrane mitochondrial potential ( ∆ψ∆ψ∆ψ∆ψ m) – (Rh123 staining)
Figure 5: Effects of very long chain fatty acids (C24:0 and C26:0) on mitochondrial status.
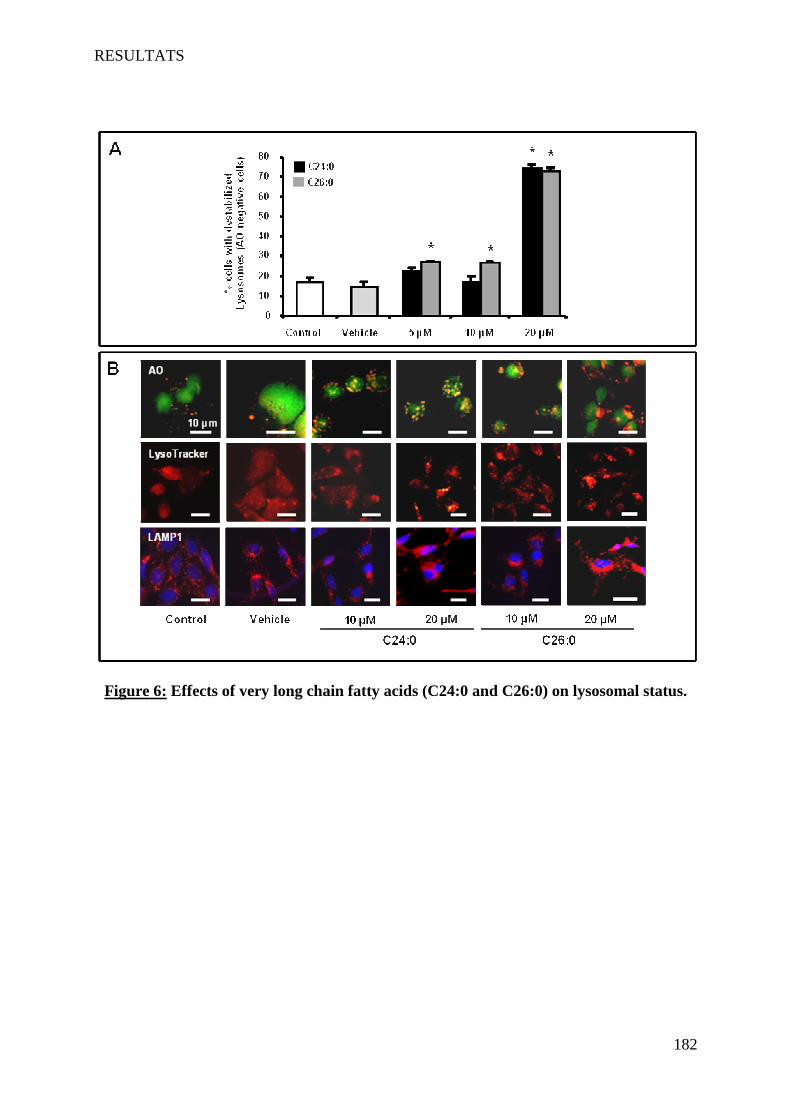
RESULTATS
182
Figure 6: Effects of very long chain fatty acids (C24:0 and C26:0) on lysosomal status.
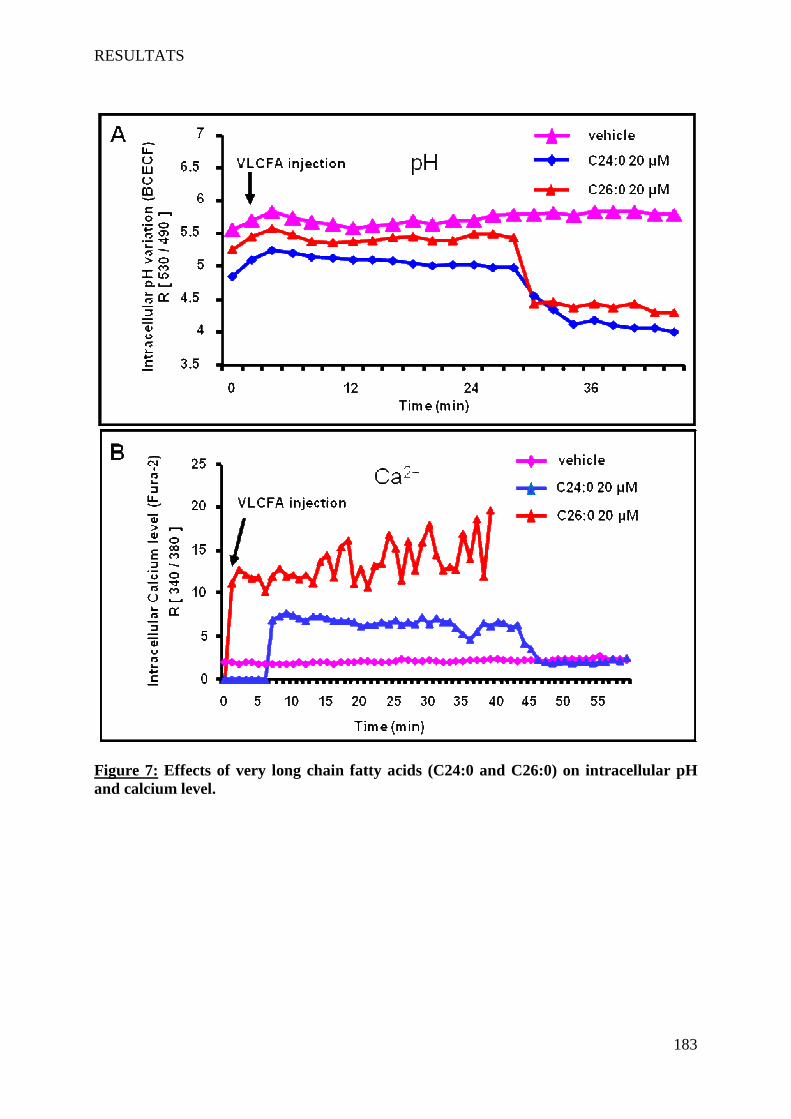
RESULTATS
183
Figure 7: Effects of very long chain fatty acids (C24:0 and C26:0) on intracellular pH and calcium level.
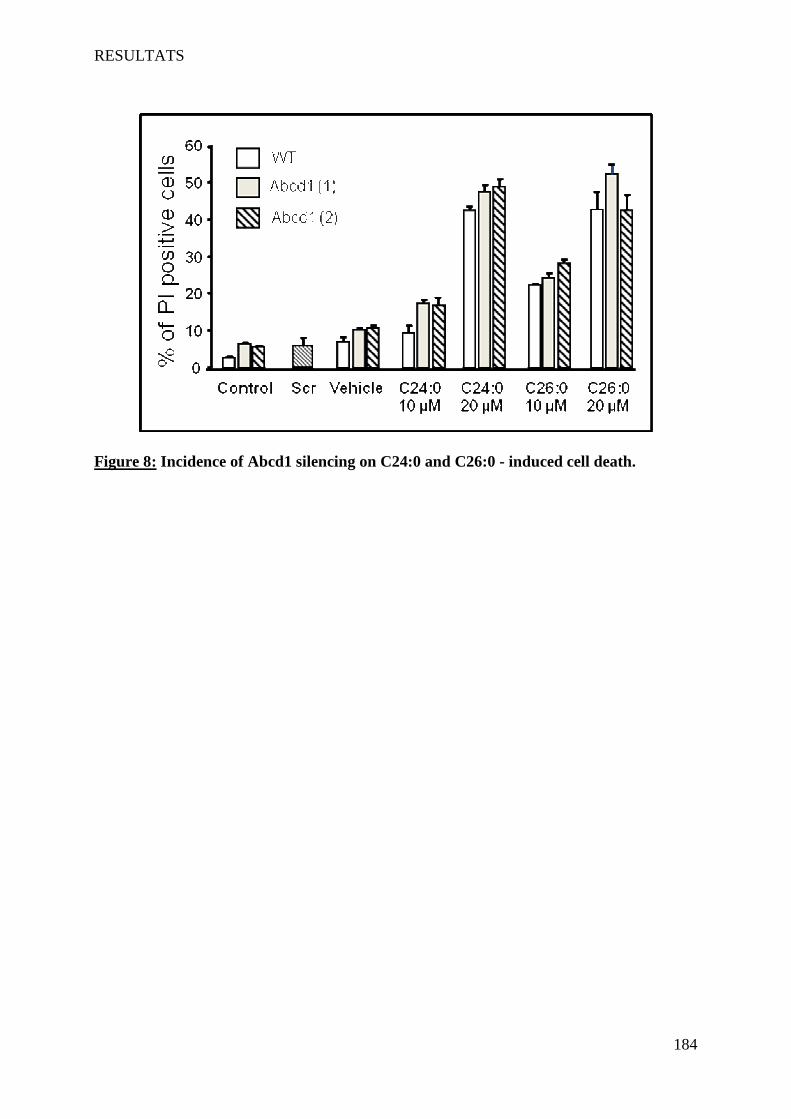
RESULTATS
184
Figure 8: Incidence of Abcd1 silencing on C24:0 and C26:0 - induced cell death.
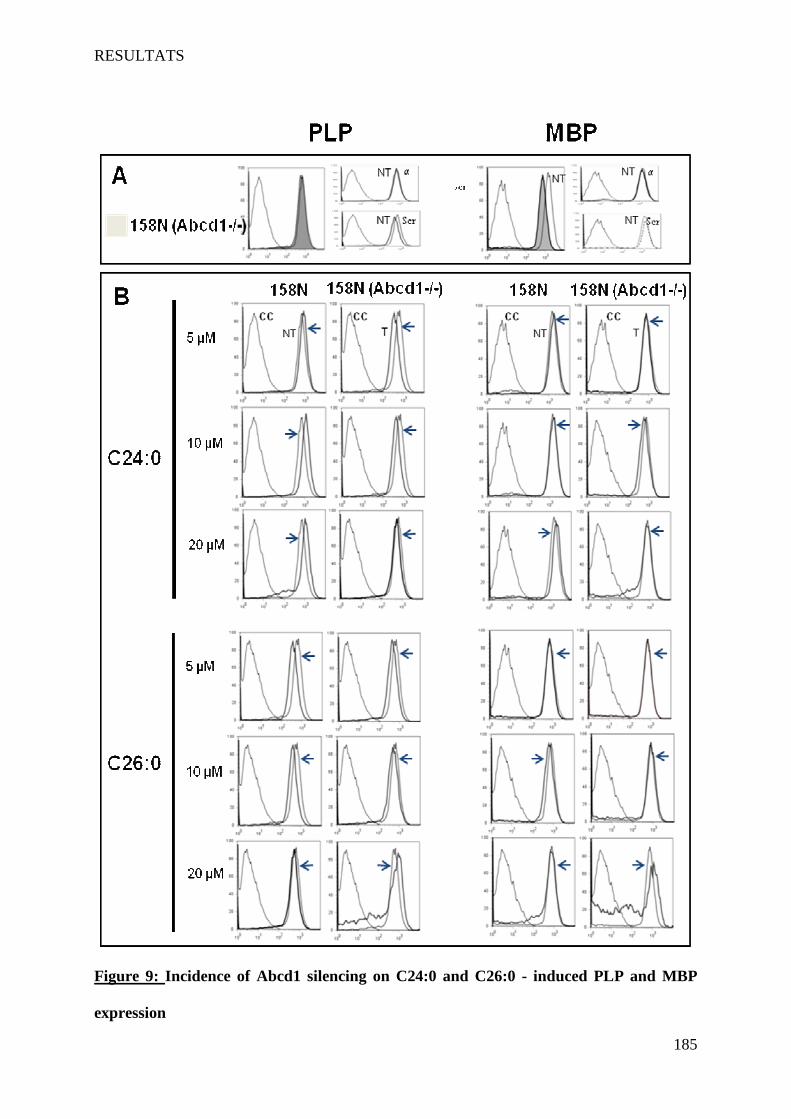
RESULTATS
185
Figure 9: Incidence of Abcd1 silencing on C24:0 and C26:0 - induced PLP and MBP
expression
RESULTATS
186
IV Article 4 : Impact of 7-ketocholesterol and very long chain fatty
acids on oligodendrocyte lipid membrane organization:
evaluation via LAURDAN and FAMIS spectral image analysis.
Soumis à Cytometry Part A
Edmond Kahn, Mauhamad Baarine, Aurélien Dauphin, Kévin Ragot, Nicolas Tissot, Alix
Seguin, Franck Ménétrier, Zilal Kattan, Claude-Marie Bachelet, Frédérique Frouin, Gérard
Lizard
1 Introduction
Les activités pro-oxydantes associées aux AGTLC sur les cellules 158N s’accompagnent
d’une augmentation intracellulaire de 7-hydroxycholestérols (7-cétocholestérol, 7béta-
hydroxycholestérol et 7alpha-hydroxycholestérol) (Article 2). Ces oxystérols, et en particulier
le 7-cétocholestérol, pourraient modifier les propriétés des membranes cellulaires en entrant
en compétition avec le cholestérol (Wang et al., 2004). Par ailleurs, au cours de la mort
cellulaire induite par les AGTLC, les images de microscopie électronique à transmission ont
montré l’accumulation dans le cytoplasme de gouttelettes lipidiques (constituées de lipides
neutres) et de structures multilamellaires (constituées majoritairement de phospholipides)
dans les oligodendrocytes 158N (Article 3). La lipotoxicité induite par les AGTLC pourrait
donc s’accompagner de modifications lipidiques intracellulaires.
En raison de ces observations, nous avons cherché à savoir si la toxicité des AGTLC pouvait
aussi s’accompagner de modifications des caractéristiques lipidiques membranaires. Pour cela
la fluidité membranaire (ou microviscosité membranaire) a été évaluée par coloration à la
mérocyanine 540 (MC540) (McEvoy et al., 1988). La coloration au LAURDAN a aussi été
utilisée car elle permet d’évaluer la désorganisation de la bicouche lipidique et, en particulier,
celle concernant les radeaux lipidiques d’où partent de nombreux signaux cellulaires
(Bagatolli, 2006).
Dans ce quatrième article, sur des cellules 158N traitées par des AGTLC (C24:0 et C26:0), la
mort cellulaire induite a aussi été caractérisée en faisant appel à différentes méthodes de
microscopie (microscopie à fluorescence, microscopie électronique) et de cytométrie en flux :
RESULTATS
187
il s’agit d’une mort cellulaire non apoptotique évoquant la nécrose. A la concentration
cytotoxique de 20 µM, les effets des AGTLC sur les lipides membranaires ont été
caractérisés.
A cette concentration, une augmentation de la fluidité membranaire a été révélée avec la
MC540 indiquant une désorganisation de la bicouche lipidique.
En revanche avec le LAURDAN (émettant une fluorescence bleue dans une phase lipidique
organisée qui se déplace dans le vert lorsque la phase lipidique est désorganisée), seule une
fluorescence bleue a été détectée par microscopie confocale monophotonique et biphotonique.
En revanche, avec le 7-cétocholestérol connu pour déstabiliser la bicouche lipidique et pour se
substituer au cholestérol dans les radeaux lipidiques (Royer et al., 2009), un important
déplacement de l’émission de fluorescence du LAURDAN dans le vert a été identifié.
Les résultats obtenus sur les oligodendrocytes murins 158N montrent que le C24:0 et le
C26:0 augmentent la fluidité membranaire sans toutefois induire de modifications structurales
de la membrane cytoplasmique. Toutefois, in vivo, les AGTLC pourraient induire
indirectement des modifications structurales membranaires via les produits d’oxydation du
cholestérol, comme le 7-cétocholestérol qui est l’un des produits d’oxydation majeur du
cholestérol.

RESULTATS
188
Impact of 7-ketocholesterol and very long chain fatty acids on oligodendrocyte lipid
membrane organization: evaluation via LAURDAN and FAMIS spectral image analysis.
Edmond Kahn1*, Mauhamad Baarine2, Aurélien Dauphin3, Kévin Ragot2, Nicolas Tissot3,
Alix Seguin2, Franck Ménétrier4, Zilal Kattan2, Claude-Marie Bachelet3, Frédérique Frouin1,
Gérard Lizard2*
1 - INSERM U678/UMR-S UPMC, IFR 14, CHU Pitié-Salpêtrière, 75634 Paris Cedex 13,
France,
2 - Centre de Recherche INSERM U866, Equipe Biochimie Métabolique et Nutritionnelle -
Université de Bourgogne, Faculté des Sciences Gabriel, 6 Bd Gabriel, 21000 Dijon, France
3 - Plateforme d’Imagerie cellulaire, UPMC, 75634 Paris Cedex 13, France,
4 - INRA, UMR Centre des Sciences du Goût et de l'Alimentation (CSGA), Equipe
Développement et dynamique des préférences et du comportement alimentaire, 21065 Dijon
Cedex, France
Runing title : Lipid membrane organization during 7-ketocholesterol and VLCFA
induced cell death in oligodendrocytes
Address correspondence to: Dr Edmond Kahn, INSERM U678/UMR-S UPMC, CHU Pitié-
Salpêtrière, 75634 Paris Cedex 13, France. ([email protected]) or Dr Gérard Lizard,
Centre de Recherche INSERM 866, Faculté des Sciences Gabriel, 6 Bd Gabriel, 21000 Dijon
* Edmond Kahn and Gérard Lizard contributed equally.
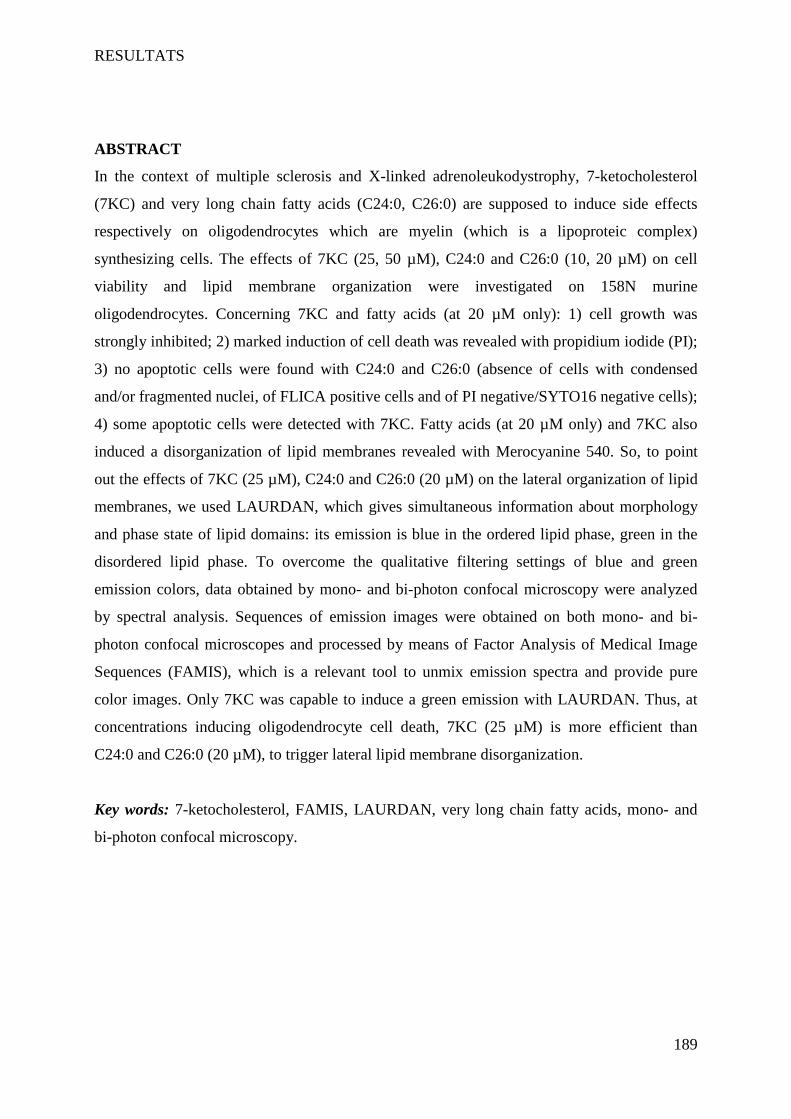
RESULTATS
189
ABSTRACT
In the context of multiple sclerosis and X-linked adrenoleukodystrophy, 7-ketocholesterol
(7KC) and very long chain fatty acids (C24:0, C26:0) are supposed to induce side effects
respectively on oligodendrocytes which are myelin (which is a lipoproteic complex)
synthesizing cells. The effects of 7KC (25, 50 µM), C24:0 and C26:0 (10, 20 µM) on cell
viability and lipid membrane organization were investigated on 158N murine
oligodendrocytes. Concerning 7KC and fatty acids (at 20 µM only): 1) cell growth was
strongly inhibited; 2) marked induction of cell death was revealed with propidium iodide (PI);
3) no apoptotic cells were found with C24:0 and C26:0 (absence of cells with condensed
and/or fragmented nuclei, of FLICA positive cells and of PI negative/SYTO16 negative cells);
4) some apoptotic cells were detected with 7KC. Fatty acids (at 20 µM only) and 7KC also
induced a disorganization of lipid membranes revealed with Merocyanine 540. So, to point
out the effects of 7KC (25 µM), C24:0 and C26:0 (20 µM) on the lateral organization of lipid
membranes, we used LAURDAN, which gives simultaneous information about morphology
and phase state of lipid domains: its emission is blue in the ordered lipid phase, green in the
disordered lipid phase. To overcome the qualitative filtering settings of blue and green
emission colors, data obtained by mono- and bi-photon confocal microscopy were analyzed
by spectral analysis. Sequences of emission images were obtained on both mono- and bi-
photon confocal microscopes and processed by means of Factor Analysis of Medical Image
Sequences (FAMIS), which is a relevant tool to unmix emission spectra and provide pure
color images. Only 7KC was capable to induce a green emission with LAURDAN. Thus, at
concentrations inducing oligodendrocyte cell death, 7KC (25 µM) is more efficient than
C24:0 and C26:0 (20 µM), to trigger lateral lipid membrane disorganization.
Key words: 7-ketocholesterol, FAMIS, LAURDAN, very long chain fatty acids, mono- and
bi-photon confocal microscopy.
RESULTATS
190
INTRODUCTION
Myelin is a complex of lipids and proteins. Thus, myelin is constituted of about 70%
lipids, mainly unesterified cholesterol, phospholipids (such as sphingomyelin and
plasmalogen), and glycosphingolipids (particularly galactocerebroside) in molar ratios of
about 4:4:2, and 30% proteins especially, proteolipid protein and myelin basic protein (1 , 2 ,
3 , 4 ). In the central nervous system (CNS), the myelin sheath is formed of membranes that
extend from oligodendrocytes and that wrap concentrically (up to a hundred times) around
nerve fibres of the neurons, thereby insulating them and facilitating rapid transmission of
nerve impulses (2 ). Consequently, alteration of myelin is detrimental to the development and
functions of the nervous system.
Because cholesterol is a major component of myelin sheath, and cholesterol oxidation
products are well known to exhibit cytotoxic effects towards neurons (5 ), the concentration of
7-ketocholesterol (7KC), a major cholesterol oxide derivative (6 , 7 ), has been measured in
the cerebrospinal fluid (CSF) of patients with multiple sclerosis (MS), and detected in high
concentrations (8 ). Whereas concentrations of KC can vary from one laboratory to another,
significant higher levels of 7KC were found in the CSF of patients with MS (8, 9). Thus, in
MS, 7KC may play critical parts in demyelination (8, 9 ).
In peroxisomal disorders, including the disorders of peroxisome biogenesis and the
single peroxisomal enzyme deficiencies (10, 11 ), patients display more or less rapidly myelin
abnormalities in the CNS (12 ), and it has been demonstrated that peroxisomes from
oligodendrocytes are necessary to the preservation of axonal integrity and to the formation
and maintenance of myelin (13 ). Peroxisomes are single cell membrane organelles present in
nearly all eukaryotic cells, and they are essential to some cellular functions such as lipid
metabolism (14 ). These organelles are mainly involved in the β-oxidation process of long-
chain fatty acids (LCFA), very-long-chain fatty acids (VLCFA) and branched-chain fatty
acids (15 ). Among peroxisomal disorders, X-linked adrenoleukodystrophy (X-ALD) is the
most frequent leukodystrophy and affects either young boys (Cerebral Childhood ALD,
CCALD, 40% of the cases) leading to a vegetative state or death, or adults
(adrenomyeloneuropathy, AMN, 50% of the cases) (16 ). X-ALD is caused by mutations in
the ABCD1 gene located in Xq28 (17, 18 ) encoding a peroxisomal ATP binding cassette
(ABC) half-transporter, named adrenoleucodystrophy protein (ALDP), which participates to
the entry of VLCFA-CoA into the peroxisome. Consequently, alteration of peroxisomal

RESULTATS
191
functions in X-ALD patients induces plasmatic and tissular accumulation of VLCFA (C24:0
and C26:0) (19 ).
In the context of MS and X-ALD, understanding the mechanism of demyelination
constitutes a major challenge to further develop efficient treatments and/or improve the
quality of life of patients. As oligodendrocytes are myelin synthesizing cells, as lipids are
major myelin components, and as 7KC and VLCFAs (C26:0 and C24:0) are environmental
factors capable to modify lipid membranes properties (7 ) and to induce cell death of
oligodendrocytes in the brain of patient with MS and X-ALD (8 , 20 ), the aim of the present
investigation was to determine whether, at concentrations inducing cell death on murine
oligodendrocyte 158N cells, 7KC and VLCFA (C26:0 and C24:0) were able to induce cellular
lipid disorganization evaluated by mono- and bi-photon confocal microscopy after staining
with LAURDAN which is reported to be excited with the UV light (360 nm) and emits a blue
fluorescence (440 nm) in the ordered lipid phase and a green fluorescence (490 nm) in the
disordered lipid phase (21 ).
To obtain visual information of the physical properties of lipid membranes,
LAURDAN was chosen for the following reasons: when it is inserted in lipid membranes,
LAURDAN displays unique characteristics compared to other fluorescent probes, namely: (i)
it shows a phase-dependent emission spectral shift, i.e., blue in the ordered lipid phase and
green in the disordered lipid phase (this effect is attributed to the reorientation of water
molecules present at the lipid interface near LAURDAN fluorescent moiety, i.e., water
dipolar relaxation process); (ii) it distributes equally into the ordered and disordered like lipid
phases; (iii) the electronic transition moment of LAURDAN is aligned parallel to the
hydrophobic lipid chains allowing the use of the photo-selection effect in the microscopic
images to discriminate qualitatively between different lipid phases; (iv) LAURDAN is
negligibly soluble in water. Thus, LAURDAN homogeneous distribution in membranes (even
when different lipid phases coexist) and its lipid phase-dependent emission spectral shift offer
a great advantage over fluorescent probes (such as DPH, pyrene and parinaric acid) that show
preferential partitioning to particular regions of the membrane and whose fluorescence
intensities and spectral maxima are generally insensitive to the lipid phase state (22 ).
Data were obtained by sequences of emission images from mono- and bi-photon
confocal microscopes and were processed by means of Factor Analysis of Medical Image
Sequences (FAMIS), which has proved to be a relevant tool to unmix emission spectra and
provide pure color images. As a result, a green color shift can be observed on 7KC treated-
158N cells. C24:0 and C26:0 do not induce a green color shift on damaged-158N cells. These
RESULTATS
192
results were obtained whatever mono- or bi-photon excitation is used (405 nm and 785 nm,
respectively), considering the fact that mono-photon confocal images with the UV light (360
nm) are reported to be difficult to get in good conditions and are usually obtained with the
widely available 405 nm light, and that the 785 nm light of the bi-photon confocal microscope
provides a better emission signal. Indeed, preliminary experiments were performed (405 nm,
755 nm, 785 nm, 805 nm), leading to the selection of 405 nm and 785 nm excitation lines,
respectively.
MATERIALS AND METHODS
Cell Culture and Treatments
Normal murine oligodendrocytes (158N) immortalized with the SV40 large T-antigen derive
from Tabby male (Ta/Y) control mice (23, 24). These cells have some characteristics of well
differentiated oligodendrocytes (25). They were seeded at 50,000–100,000 cells/cm2 either in
75-cm2 culture flasks, in Petri dishes (100 mm in diameter), or on glass coverslips in 6 well-
microplates and cultured in Dulbecco’s Modified Eagle Medium (DMEM) supplemented with
5% (v/v) heat inactivated fetal bovine serum (PAN™ Biotech GmbH)). Cells were incubated
at 37°C in a humidified atmosphere containing 5% CO2.
The conditions of treatments with 7-ketocholesterol (7KC) and VLCFA (C24:0 and C26:0)
were the followings. 7KC, C24:0, and C26:0 were provided by Sigma-Aldrich (L'Isle d'Abeau
Chesnes, France). Stock solution of 7KC was prepared at 800 µg/ml (26 ). Briefly, 800 µg of
7KC were dissolved in 50 µL of absolute ethanol, 950 µL of culture medium were added, and
the solution was sonicated. To obtain a 20 or 40 µg/ml final 7KC concentration (25 or 50
µM), 25 or 50 µL of the initial solution was added per ml of culture medium on sub-confluent
cells. C24:0 and C26:0 were solubilized in α-cyclodextrin (1 mg/ml) as previously described
(27 ). When treated with 7KC, sub-confluent 158N murine oligodendrocytes were further
cultured for 24 or 48 h. When treated with VLCFA, after plating 158N cells in 6 wells plates
for 48 h, sub-confluent cells were further treated for 24 to 48 h with different VLCFA
concentrations (10, 20 or 40 µM) diluted in HAM’s-F10 medium.
Cell counting
After trypsinization with a 0.05% trypsin-0.02% EDTA solution, cells were centrifuged, and
resuspended in culture medium. The total number of cells was determined under a light
microscope (Axioskop right microscope, Zeiss, Jena, Germany) using a hemocytometer.

RESULTATS
193
Flow cytometric evaluation of cell viability by staining with propidium iodide
At the end of the incubation times in the absence or in the presence of 7KC (25 or 50 µM),
C24:0, or C26:0 (10 or 20 µM), 158N cells were stained with propidium iodide (PI), which
enters cells with permeable cytoplasmic membrane and stains dead cells only (28 ).
Fluorescence of PI was collected using a 590/10 nm bandpass filter and measured on a
logarithmic scale. Flow cytometric analyses were performed on a Galaxy flow cytometer
(Partec, Münster, Germany). Ten thousand cells were acquired for each sample. Data were
analyzed with FlowMax software (Partec).
Microscopic characterization of nuclear morphology by staining with Hoechst 33342
Nuclear morphology was analyzed after staining with Hoechst 33342 (5 µg/ml): normal cells
were characterized by round and regular nuclei, apoptotic cells by condensed and/or
fragmented nuclei, and necrotic cells by nuclei with various sizes and shapes (29 ). Cell
deposits obtained by cytocentrifugation were observed under ultraviolet light by fluorescence
microscopy with an Axioskop right microscope (Zeiss). For each sample, 300 cells were
examined.
Flow cytometric characterization of cell death by dual staining with SYTO16 and
propidium iodide
In order to distinguish between viable, apoptotic, and primary or secondary necrotic cells,
dual staining with SYTO16 and propidium iodide (30 , 31) was performed on 158N cells
cultured in the absence or in the presence of 7KC (25 or 50 µM), α-cyclodextrin (1 mg/ml),
C24:0 or C26:0 (10 and 20 µM) for 48 h. At the end of the incubation time, adherent and non-
adherent 158N cells were pooled, washed with PBS and 1 x 10⁶ cells were stained with 20
µM of Syto 16 (Invitrogen) for 30 min at 37°C. After incubation, cells were stained with 5
µg/ml of propidium iodide (PI). Fluorescence of Syto 16 and PI were collected using a 515/15
nm bandpass filter and a 590/10 nm bandpass filter, respectively, and were measured on a
logarithmic scale. Flow cytometric analyses were performed on a Galaxy flow cytometer
(Partec). Ten thousand cells were acquired for each sample, and data were analyzed with
FlowMax software (Partec).

RESULTATS
194
In situ detection of activated Caspases with Fluorochrome-Labeled Inhibitors of
Caspases (FLICA)
Caspase total activity was measured with fam-VAD-fmk (Trevigen Inc, Gaithersburg, MD,
USA) using a specifically dedicated kit according to the manufacturer’s procedures. This
FLICA reagent was dissolved in DMSO to obtain a 150X concentrated solution. Prior to use,
a 30× working solution of fam-VAD-fmk was prepared by diluting the stock solution 1:5 in
phosphate buffer saline (PBS). In the present investigation, fam-VAD-fmk working solutions
were added to 158N cells cultured for 48 h in 24-well plates in the absence or presence of
7KC (25 or 50 µM), C24:0, or C26:0 (10 or 20 µM) to obtain a 1× final concentration. After 1
h of incubation in the dark in a 5%CO2/95% air-humidified atmosphere at 37°C, non adherent
cells and adherent cells (obtained by trypsinization with a 0.05% trypsin-0.02% EDTA
solution) were collected, mixed, and washed twice in 1× wash buffer, resuspended in 1 ml of
PBS, and analyzed by flow cytometry. Flow cytometric analyses were performed on a
GALAXY flow cytometer (Partec). The green emission of fam-VAD-fmk was collected
through a 520/10 nm band pass filter, and measured on a logarithmic scale. Ten thousand cells
were acquired for each sample, and data were analyzed with the FlowMax software (Partec).
Staining conditions with LAURDAN
6-lauroyl-2-dimethylaminonaphthalene (LAURDAN) was provided by Invitrogen (Cergy-
Pontoise, France). At the end of the incubation time (24 h) in the absence or in the presence of
7KC (25 µM), C24:0 or C26:0 (10 and 20 µM), 158N cells cultured on glass coverslips in 12
well plates were washed twice in PBS and fixed with 4% paraformaldehyde (Sigma-Aldrich)
for 24 h at 4°C. Paraformaldehyde was discarded, and cells were washed three times in PBS.
Then, cells were stained with LAURDAN (10 µM) for 15 min at 37°C, and washed twice
with PBS. The slides were mounted with Dako fluorescent mounting medium (Dako,
Copenhagen, Denmark), and stored in dark at 4°C prior to microscopic observations.
Transmission electron microscopy
Transmission electron microscopy was used to visualize the possible ultrastructural
modifications induced by 7KC (25 µM for 24 h), VLCFA (C24:0 and C26:0 used at 40 µM
for 24 h), and α-cyclodextrin (1 mg/ml for 24 h, used as vehicle to dissolve VLCFA) on 158N
murine oligodendrocytes. Briefly, the samples were fixed for 1 h at 4°C in 2.5% (w/v)
glutaraldehyde diluted in cacodylate buffer (0.1 M, pH 7.4), washed twice in cacodylate
buffer (0.1 M, pH 7.4), post-fixed in 1% (w/v) osmium tetroxide diluted in cacodylate sodium

RESULTATS
195
(0.1 M, pH 7.4) for 1 h at room temperature in the dark, and rinsed twice in cacodylate buffer
(0.1 M, pH 7.4). The preparations were then dehydrated in graded ethanol solutions and
embedded in Epon. Ultra-thin sections were cut with a diamond knife on an ultramicrotome,
contrasted with uranyl acetate and lead citrate, and examined under an H7500 electron
microscope (Hitachi, Tokyo, Japan).
Staining conditions with merocyanine 540
Merocyanine 540 (MC540) (Sigma-Aldrich) is a negatively charged chromophore that binds
to the outer leaflet of the cell membrane (32 ). The loss of asymmetry and altered packing of
the membrane enhance MC540 fluorescence (32 ). MC540 was prepared in absolute ethanol
(2 mg/ml) and added to the culture medium at 2.5 µg/ml. After 10 min of incubation at room
temperature, cells were analyzed by flow cytometry (33 ). Flow cytometric analyses were
performed on a GALAXY flow cytometer (Partec). The fluorescence of MC540 was collected
through a 590/10 nm band pass filter and measured on a logarithmic scale. A total of 10,000
cells was acquired for each sample, and data were analyzed with the FlowMax software
(Partec). Data were expressed by the [MC 540 bright cells]/[MC 540 dim cells] ratio.
Characterization of ordered and disordered lipid phase with LAURDAN: fluorescence
analysis by mono- and bi-photon Laser Scanning Confocal Microscopy (LSCM)
Mono-photon confocal observations of untreated- and α-cyclodextrin, 7-KC (25 µM), C24:0
and C26:0 (10 and 20 µM)-treated 158N cells were carried out with a LEICA SP2 CLSM
(Leica, Wetzlar, Germany) equipped with a 405 nm diode laser line. Images at 0.2 µm (x, y)
pixel sizes were obtained for each case in 512 x 512 matrices at magnification x 63 (Plan-
Apo, oil immersion, NA 1.4) of LSCM (excitation at 405 nm). Pinhole size was 1.0 Airy unit.
Regular acquisitions resulted in band-pass filtered emissions (410-470 nm, 500-536 nm, 590-
620 nm), and spectral sequences of 30 images were obtained through 10 nm band-pass filters
in the 410-700 nm emission range at increments of 10 nm. The third band-pass filtered
emission (590-620 nm) was maintained in the settings as control of a possible red
autofluorescence.
Bi-photon confocal observations of untreated- and α-cyclodextrin, 7-KC (25 µM), C24:0 and
C26:0 (10 and 20 µM)-treated 158N cells were carried out with a Zeiss LSM 710 NLO (Zeiss,
Jena, Germany) equipped with a pulsed tunable laser (700-1060 nm). Images at 0.2 µm (x, y)
pixel sizes were obtained for each case in 512 x 512 matrices at magnification x 20 (Plan-

RESULTATS
196
Apo, water immersion, NA 1.0) of LSCM (excitation at 785 nm). Regular acquisitions
resulted in band-pass filtered emissions (443-473 nm, 483-513 nm), and spectral sequences of
33 images obtained through 10 nm band-pass filters in the 393-723 nm emission range at
increments of 10 nm.
Image Analysis
Following general factor analysis techniques, FAMIS was developed to process biomedical
image sequences (34 , 35 ). This development specifically required the use of constraints. It
had to cope with mixtures of components characterized by their physical behaviors. Linearity
and component positivity basic hypothesis were investigated. FAMIS synthesizes image
sequences into a reduced number of images called factor images and curves called factor
curves (36 , 37 ). The latter ones estimate individual behaviors in the sequence of images.
Factor images correspond to spatial distribution components.
Concerning the use of FAMIS via Pixies (Apteryx, France), pixels in matrices were combined
according to 4 x 4 clusters. These clusters were all investigated. Correspondence analysis (38 ,
39 ) was performed on intensity evolution of each cluster. Then oblique analysis with
positivity constraints was performed on the results of correspondence analysis (34 ), requiring
positive factor curves and images. Factor images are recomputed in the original sampling by
oblique projection, on the factor curves and the estimation is performed in the least-squares
sense. Here, the factor curves correspond to the emission spectra of the fluorochromes. Factor
images provide images of stained fluorescent structures.
Statistical analysis
Statistical analyses were performed on at least three independent experiments with Prism 5
software, version 5.01 (Prism Software Corporation, Irvine, CA, USA) with the Mann and
Whitney test or the Kruskal-Wallis test. Data were considered to be statistically different at a
p-value of 0.05 or less.

RESULTATS
197
RESULTS
Characterization of the mode of cell death induced by 7-ketocholesterol, C24:0, and C26:0
on 158N murine oligodendrocytes
7KC was used at 20 or 40 µg/ml (25 or 50 µM, respectively), which are concentrations
previously known to induce cell death on numerous cell types (40 ). At these concentrations
(25 and 50 µM), a marked inhibition of cell growth was observed with 7KC (50-75 % after
24-48 h of culture, respectively). At 50 µM, high proportions of cells permeable to propidium
iodide (PI) and corresponding to dead cells were found (Fig. 1A). By fluorescence
microscopy and Hoechst staining, high percentages of cells with fragmented and/or
condensed nuclei characteristic of apoptotic cells were observed. High proportions of FLICA
positive cells (cells containing active Caspases) were also identified (Fig. 1A). By dual
staining with SYTO16 and PI, viable cells were detected as well as some apoptotic and
primary and/or secondary necrotic dying cells (Fig. 1B). At 25 µM, data obtained by staining
with PI, with FLICA test, and by dual staining with SYTO16 and PI were similar than those
obtained at 50 µM (our data not shown). This simultaneous presence of apoptotic and primary
and/or secondary necrotic cells under treatment with 7KC is in agreement with data obtained
on other cell lines (40 ).
C24:0 and C26:0 were used at 10 and 20 µM corresponding to the highest
concentrations measured in the plasma of patients with peroxisomal leukodystrophies (19 )
and high proportions of cells permeable to propidium iodide (PI) corresponding to dead cells
with damaged cytoplasmic membrane were identified (Fig. 1A). By fluorescence microscopy
and Hoechst staining, no apoptotic cells were found (Fig. 1A), and no FLICA positive cells
were observed (Fig. 1A). By dual staining with SYTO16 and PI, viable cells as well as cells
evocating necrotic cells were mainly revealed (Fig. 1B).
In order to point out the mode of cell death induced by 7KC, C24:0 and C26:0,
additional investigations were performed by transmission electron microscopy (Fig. 2). The
ultrastructural aspects of 158N cells cultured with α-cyclodextrin (1 mg/ml) (used to dissolve
C24:0 and C26:0) were similar than those of untreated cells (Fig. 2A-B). With 7KC (25 µM,
24 h of culture), cells with typical morphology of apoptotic cells (cells with fragmented
and/or condensed nuclei) (Fig. 2C) were detected as well as cells evocating necrotic cells
(Fig. 2D). In these apoptotic and necrotic cells, numerous vacuoles containing cellular debris
were observed (Fig. 2C-D). In C24:0- and C26:0 (20 µM, 24 h of culture)-treated 158N cells,
dying cells with numerous cytoplasmic vacuoles of various sizes and shapes containing some
cellular debris were often observed (Fig. 2E-F).
RESULTATS
198
Characterization of the effects of 7-ketocholesterol, C24:0 and C26:0 on membrane lipid
organization of 158N murine oligodendrocytes with merocyanine 540
On U937 promonocytic leukemia cells, 7KC-induced cell death is associated with some
modifications at the cytoplasmic membrane level: a rapid externalization of
phosphatidylserine (41 ), and a disorganization of cytoplasmic membrane lipids shown by
flow cytometry after staining with MC540 by the [MC540 bright cells]/[MC540 dim cells]
ratio (42 ). Therefore, in the present study, the effects of 7KC (25 µM), C26:0 and C24:0 (10
and 20 µM) and α-cyclodextrin (1 mg/ml), used as vehicle to dissolve fatty acids, were
investigated on sub-confluent 158N murine oligodendrocytes after 24 h of treatment. In these
conditions, a disorganization of cytoplasmic membrane lipids (revealed by flow cytometry
after staining with MC540 by the [MC540 bright cells]/[MC540 dim cells] ratio) was also
observed under treatment with 7KC as well as with C24:0 and C26:0 only when they were
used at 20 µM (Fig. 3). Altogether, these observations lead us to point out the effects of 7KC,
C24:0 and C26:0 on the lateral organization of cytoplasmic membrane lipid domains by using
LAURDAN and various techniques of confocal microscopy.
Laser scanning confocal microscopic analysis of untreated and 7-ketocholesterol-, C24:0
or C26:0-treated 158N murine oligodendrocytes stained with LAURDAN
As characteristics of cell death observed with 7KC were similar at 25 and 50 µM, the
investigations performed with LAURDAN to point out the effects of this compound on
membrane lipid organization were only performed at 25 µM. C24:0 and C26:0 were only used
at 20 µM allowing to induce cell death of 158N cells. Therefore, the effect of 7KC, C24:0 and
C26:0 on lipid membrane organization evaluated with LAURDAN were only analyzed at a
concentration inducing cell death. The advantages of LAURDAN to study lipid-lipid
interactions and consequently lateral organization of cytoplasmic membrane lipid domains
using fluorescence experiments are well established (21). From the characteristics of this
probe, the phase-dependent emission spectral shift, i.e., LAURDAN emission is blue (440
nm) in the ordered lipid phase and green (490 nm) in the disordered lipid phase, encouraged
us to use various fluorescence microscopic methods to obtain images of cells exposed to 7KC
(25 µM), C24:0 and C26:0 (20 µM) which are concentrations inducing cell death of 158N
murine oligodendrocytes as soon as 24 h of treatment. Indeed, under treatment with these
different compounds of 158N cells, it is important to quantify the possible color shift together
with the side effects of these molecules in order to anticipate the possible consequences on

RESULTATS
199
myelin compaction. As mono-photon confocal images with the UV light are reported to be
difficult to get in good conditions and usually obtained with the widely available 405 nm
light, we decided to use bi-photon excitation to circumvent this problem and verify the
pertinence of such a statement. To overcome the qualitative filtering settings corresponding to
the characterization of the blue and green colors, we decided also to use spectral analysis (43
). As such, sequences of emission images were obtained on both mono- and bi-photon
confocal microscopes and processed by means of FAMIS, which has proved to be a relevant
tool to unmix emission spectra and provide pure color images.
1) Untreated 158N cells
In the case of spectral observations of untreated cells in which emissions are collected through
band-pass filters then processed before interpretation, the excitations at 405 nm (mono-photon
confocal microscope) and 785 nm (bi-photon confocal microscope) were performed and
emission was collected in the regular mode (410-470 nm, 500-536 nm, 590-620 nm), (443-
473 nm, 483-513 nm) respectively (Fig 4A, C), and the spectral mode in 10 nm filters from
blue to red (415 => 695 nm), (393 => 713 nm) respectively. The resulting spectral sequences
were investigated by means of FAMIS. A blue emission (445, 448 nm) corresponding to
LAURDAN is visualized in the factor images (Fig. 4B, D). No green color shift is observed.
2) 7-ketocholesterol-treated 158N cells
In the case of spectral observations of 7KC (25 µM)-treated cells in which emissions are
collected through band-pass filters then processed before interpretation, the excitation at 405
nm and 785 nm was performed and emission was collected in the regular mode (410-470 nm,
500-536 nm, 590-620 nm), (443-473 nm, 483-513 nm) respectively (Fig. 5A, C), and the
spectral mode in 10 nm filters from blue to red (415 => 695 nm), (393 => 713 nm)
respectively. The resulting spectral sequences were investigated by means of FAMIS. A green
emission (485, 488 nm) corresponding to LAURDAN is visualized in the first factor image
and a blue emission (445, 448 nm) is visualized in the second factor image (Fig. 5B, D).
3) α-cyclodextrin, C24:0 or C26:0-treated 158N cells
In the case of spectral observations of α -cyclodextrin (1 mg/ml), C24:0 (20 µM) or C26:0 (20
µM)-treated cells in which emissions are collected through band-pass filters then processed
before interpretation, the excitation at 785 nm was performed and emission was collected in
the regular mode (410-470 nm, 500-536 nm, 590-620 nm), (443-473 nm, 483-513 nm)

RESULTATS
200
respectively (Fig 6A, C, E, Fig 7A, C, E, respectively), and the spectral mode in 10 nm filters
from blue to red (415 => 695 nm), (393 => 713 nm) respectively. When 158N cells were
cultured in the presence of α-cyclodextrin only, which is used to dissolve C24:0 and C26:0,
spectral observations were performed in similar conditions. The resulting spectral sequences
were investigated by means of FAMIS. A blue emission (445, 448 nm) corresponding to
LAURDAN is visualized in the factor images (Fig. 6B, D, F Fig7B, D, F, respectively). No
green color shift is observed.
DISCUSSION
Multiple sclerosis (MS) and X-linked adrenoleukodystrophy (X-ALD) are neurodegenerative
diseases associated with a demyelination of the central nervous system (CNS). In MS
increased levels of 7KC were identified in the cerebrospinal fluid of patients (8, 9 ), and some
apoptotic dying cells were identified in brain lesions (44 ). In X-ALD, increased levels of
C24:0 and C26:0 were found in the plasma and tissue (including in the brain) of patients (45,
19 ), and some apoptotic or necrotic cells were identified in brain lesions (46 , 47 , 48). In the
CNS, as oligodendrocytes are myelin synthesizing cells (49 ), the present study was realized
on 158N murine oligodendrocytes expressing some characteristics of well differentiated
oligodendrocytes (25 ) in order to characterize the mode of cell death induced by 7KC, C24:0
and C26:0 on mature oligodendrocytes and to point out the simultaneous consequence of the
cytotoxic effects of these compounds on lipid membrane organization which can help to
anticipate the putative impact of these molecules on myelin which is a complex lipid rich
membrane (70% lipids, 30% proteins). Data obtained on 158N murine oligodendrocytes
demonstrate that 7KC induces an apoptotic mode of cell death, whereas C24:0 and C26:0 do
not. Interestingly, by using LAURDAN, providing information on lateral lipid membrane
organization (21, 22 ), and various methods of confocal microscopy (mono- and bi-photon
confocal observations) associated with factor analysis (FAMIS) (34, 36 ), we report that only
7KC was able to trigger lateral lipid membrane disorganization.
As 7KC is capable to induce apoptosis on microglial cells (8 ), and on 158N murine
oligodendrocytes, our data provide additional evidences that 7KC can contribute to induce
neuronal damages, demyelination especially, as it induces apoptosis of oligodendrocytes
which are myelin synthesizing cells. Therefore, as 7KC has been found at increased
concentrations in the cerebrospinal fluid (CSF) of patients with MS, our investigation support
the hypothesis that increased levels of this compound can constitute a potential risk factor in
these patients. In addition, in agreement with some observations realized on different types of
RESULTATS
201
7KC-treated cells, the identification of large vacuoles in 7KC-treated oligodendrocytes
suggests that the lysosomes may contribute to 7KC-induced cell death (50, 51 ). As MS is the
most common neurological disease among young adults, the identification of the metabolic
pathways associated with 7KC-induced apoptosis on oligodendrocytes may have some
interests to develop new therapies allowing to counteract demyelination in patients with MS.
Indeed, demyelination of axons affects axonal conduction, and is associated with axonal loss,
which results in progressive neurological handicap (52 ).
With the very long chain fatty acids, C24:0 and C26:0 used at 10 and 20 µM, a marked
induction of cell death was mainly observed at 20 µM on 158N murine oligodendrocytes. As
no cells with condensed and/or fragmented nuclei characteristic of apoptotic cells (29 ) were
observed by staining with Hoechst 33342, as no active caspases were detected by FLICA, and
as no apoptotic cells were identified by dual staining with PI and SYTO16, which are reliable
methods to identify apoptotic cells (53 30 31 ), our data support that these fatty acids do not
induce apoptosis on 158N murine oligodendrocytes. This variation between the mode of cell
death observed in vitro and in vivo can have different origins. In vitro, free fatty may
accumulate inside the cells differently than in vivo (27 ). In addition, the 158N cells used have
normal peroxisomal status (25 ) and are capable to β-oxidize C26:0 and C24:0, whereas X-
ALD oligodendrocytes, which are deficient in Abcd1, are unable to β-oxidize these fatty acids
(18 ). Therefore, the part taken by Abcd1 deficiency in the mode of cell death induced by
C24:0 and C26:0 cannot be excluded. Moreover, in vivo, additional factors present in the
lesions such as inflammatory cytokines, reactive oxygen species, and reactive nitrous species
are capable to modulate the type of cell death (54, 55). Be that as it may, and whatever the
type of cell death considered, our data support the hypothesis that C24:0 and C26:0-induced
cell death of oligodendrocytes may contribute to demyelination in X-ALD associated with
high levels of C24:0 and C26:0 in the plasma and in the brain of patients (19, 56 ).
As myelin, constituted of about 70% lipids, and 30% proteins (1,2, 3 4 ), is synthesized by
oligodendrocytes that wrap the axon of neurons, insulating them and favoring the
transmission of the nervous influx, it was also important to point out the impact of 7KC,
C24:0 and C26:0 on the lipids of the cytoplasmic membrane of oligodendrocytes, in order to
anticipate the effects of these compounds on myelin sheath compaction. In agreement with
previous investigations performed on U937 cells treated with 7KC (40 ), a disorganization of
cytoplasmic membrane lipids shown by flow cytometry after staining with MC540 was
observed on 158N. With MC540, a disorganization of cytoplasmic membrane lipids was also
detected with C24:0 and C26:0. However, as MC540 is not appropriate to characterize the
RESULTATS
202
lateral organization of cytoplasmic membrane lipid domains and especially membrane
microdomains (‘rafts’) that exist in the ordered lipid phase, additional investigations were
performed with LAURDAN to give simultaneous information about morphology and phase
state of lipid domains: its emission is blue in the ordered lipid phase, green in the disordered
lipid phase (21 22 ). To this end, mono- and bi-photon confocal observations were made more
efficient and specific by using the sequences of images that can be obtained by spectral
modes, and were then processed by image analysis. Indeed, factor analysis (FAMIS) makes it
possible to differentiate spectral emissions of fluorochromes in a multi-staining system and
provide the corresponding images. Indeed, such observations would have been subject to
subjective conclusions if regular filtering settings only would have been involved and
superimposition of images performed straightforward. Overlapping of blue and possible green
emission would have made it difficult to ensure that a color shift had been produced.
Therefore, the use of the FAMIS image processing technique, which provides the
differentiation of mixed fluorescent emissions from dyes and targets or particles, makes it
possible to quantify and have an overview of a possible color shift by means of factor curves
and factor images.
In conclusion, our data support that the ability of 7KC, C24:0 and C26:0 to induce cell death
of oligodendrocytes may contribute to demyelination in neurodegenerative demyelinating
diseases such as MS and X-ALD. Moreover, they bring new evidences that the use of laser
scanning confocal microscopy (mono- or bi-photon) and subsequent spectral analysis with
FAMIS provides an efficient tool to analyze the color shift of LAURDAN, and therefore to
evaluate lipid disorders in cells. Thus, this approach with LAURDAN permitted to establish
that at concentrations inducing oligodendrocyte cell death, 7KC was more efficient than
C24:0 and C26:0 to trigger lateral lipid membrane disorganization of 158N murine
oligodendrocytes, and may consequently have an impact on myelin compaction status.

RESULTATS
203
LITTERATURE CITED
1 - Björkhem I, Meaney S. Brain cholesterol : long secret life behind a barrier. Arterioscler
Thromb Vasc Biol 2004; 24: 806-815.
2 - Harauz G, Ishiyama N, Hill C, Bates IR, Libich DS, Farès C. Myelin basic protein-diverse
conformational states of an intrinsically unstructured protein and its roles in myelin assembly
and multiple sclerosis. Micron 2004, 35: 503-542.
3 - Taylor CM, Marta CB, ClaycombRJ, Han DK, Rasband MN, Coetzee T, Pfeiffer SE.
Proteomic mapping provides powerful insights into functional myelin biology. Proc Natl Acad
Sci USA 2004; 101: 4643-4648.
4 - Hörster F, Surtees R, Hoffmann GF. Disorders of intermediary metabolism: toxic
leukoencephalopathies. J Inherit Metab Dis 2005; 28: 345-356.
5 - Chang JY, Liu LZ. Neurotoxicity of cholesterol oxides on cultured cerebellar granule cells.
Neurochem Int 1998, 32: 317-323.
6 - Schroepfer GJ. Oxysterols: modulators of cholesterol metabolism and other processesses.
Physiol Rev 2000; 80: 361-554.
7 - Vejux A, Lizard G. Cytotoxic effects of oxysterols associated with human diseases:
Induction of cell death (apoptosis and/or oncosis), oxidative and inflammatory activities, and
phospholipidosis. Mol Aspects Med. 2009; 30: 153-170.
8 - Diestel A, Aktas O, Hackel D, Hake I, Meier S, Raine CS, Nitsch R, Zipp F, Ullrich O.
Activation of microglial poly(ADP-ribose)-polymerase-1 by cholesterol breakdown products
during neuroinflammation: a link between demyelination and neuronal damage. J Exp Med.
2003; 198: 1729-1740.
9 - Leoni V, Lütjohann D, Masterman T. Levels of 7-oxocholesterol in cerebrospinal fluid are
more than one thousand times lower than reported in multiple sclerosis. J Lipid Res. 2005; 46:
191-195.
10 - Depreter M, Espeel M, Roels F. Human peroxisomal disorders. Microsc Res Tech. 2003;
61: 203-223.
11 - Wanders RJ, Waterham HR. Biochemistry of mammalian peroxisomes revisited. Annu.
Rev. Biochem. 2006; 75: 295-332.
12 - Baes M, Aubourg P. Peroxisomes, myelination, and axonal integrity in the CNS.
Neuroscientist. 2009; 15: 367-379.

RESULTATS
204
13 - Kassmann C, Lappe-Siefke C, Baes M, Brügger B, Mildner A, Werner HK, Natt O,
Michaelis T, Prinz M, Frahm J, Nave KA. Axonal loss and neuroinflammation caused by
peroxisome-deficient oligodendrocytes. Nat. Genet. 2007; 39: 969-976.
14 - Wanders RJ, Waterham HR. Peroxysomal disorders: the single peroxisomal enzyme
deficiencies. Biochim. Biophys. Acta. 2006; 1763: 1707-1720.
15 - Schrader M, Fahimi HD. The peroxisome: still a mysterious organelle. Histochem Cell
Biol. 2008; 129: 421-440.
16 - Aubourg P, Dubois-Dalcq M. X-linked adrenoleukodystrophy enigma: how does the ALD
peroxisomal transporter mutation affect CNS glia? GLIA 2000; 29: 186-190.
17 - Berger J, Gartner J. X-linked adrenoleukodystrophy: Clinical, biochemical and
pathogenetic aspects. Biochim. Biophys. Acta. 2006; 1763: 1721-1732
18 - Kemp S, Wanders RJ. X-linked adrenoleukodystrophy: Very long-chain fatty acid
metabolism, ABC half-transporters and the complicated route to treatment. Mol. Genet. Metab.
2007; 90:268-276.
19 - Takemoto Y, Suzuki Y, Horibe R, Shimozawa N, Wanders RJ, Kondo N. Gas
chromatography/mass spectrometry analysis of very long chain fatty acids, docosahexaenoic
acid, phytanic acid and plasmalogen for the screening of peroxisomal disorders. Brain Dev.
2003; 25: 481-487.
20 - Eichler FS, Ren JQ, Cossoy M, Rietsch AM, Nagpal S, Moser AB, Frosch MP, Ransohoff
RM. Is microglial apoptosis an early pathogenic change in cerebral X-linked
adrenoleukodystrophy? Ann Neurol. 2008; 63: 729-742.
21 - Bagatolli LA. Direct observation of lipid domains in free standing bilayers: from simple to
complex lipid mixtures. Chem Phys Lipids. 2003; 122: 137-145.
22 - Bagatolli LA. To see or not to see: lateral organization of biological membranes and
fluorescence microscopy. Biochim Biophys Acta. 2006; 1758: 1541-1556.
23 - Feutz AC, Pham-Dinh D, Allinquant B, Miehe M, Ghandour S. An immortalized jimpy
oligodendrocyte cell line: defects in cell cycle and cAMP pathway. GLIA 2001; 34: 241-252.
24 - Ghandour S, Feutz AM, Jalabi W, Taleb O, Bessert D, Cypher M, Carlock L, Skoff RP.
Trafficking of PLP/DM20 and cAMP signalling in immortalized jimpy oligodendrocytes.
GLIA 2002; 40: 300-311.
25 - Baarine M, Ragot K, Genin EC, El Hajj H, Trompier D, Andreoletti P, Ghandour MS,
Menetrier F, Cherkaoui-Malki M, Savary S, Lizard G. Peroxisomal and mitochondrial status of
two murine oligodendrocytic cell lines (158N, 158JP): potential models for the study of

RESULTATS
205
peroxisomal disorders associated with dysmyelination processes. J Neurochem. 2009; 111:
119-131.
26 - Lizard G, Deckert V, Dubrez L, Moisant M, Gambert P, Lagrost L. Induction of apoptosis
in endothelial cells treated with cholesterol oxides. Am J Pathol. 1996; 148: 1625-1638.
27 - Singh I, Kishimoto Y. Effect of cyclodextrins on the solubilization of lignoceric acid,
ceramide, and cerebroside, and on the enzymatic reactions involving these compounds. J Lipid
Res. 1983; 24: 662-625.
28 - Yeh, CJ., Hsi, BL., Faulk, WP., 1981. Propidium iodide as a nuclear marker in
immunofluorescence. II. Use with cellular identification and viability studies. J Immunol
Methods 1981; 43, 269-275.
29 - Lizard G, Fournel S, Genestier L, Dhedin N, Chaput C, Flacher M, Mutin M, Panaye G,
Revillard JP. Kinetics of plasma membrane and mitochondrial alterations in cells undergoing
apoptosis. Cytometry 1995; 21: 275-283.
30 - Wlodkowic D, Skommer J, Darzynkiewicz Z. SYTO probes in the cytometry of tumor cell
death. Cytometry A 2008;73:496-507.
31 - Wlodkowic D, Skommer J, Pelkonen J. Towards an understanding of apoptosis detection
by SYTO dyes. Cytometry A 2007;71:61-72.
32 - Schlegel RA, Stevens M, Lumley-Sapanski K, Williamson P. Altered lipid packing
identifies apoptotic cells. Immunol Lett 1993; 36: 283-8.
33 - Laakko T, King L, Fraker P. Versatility of merocyanine 540 for the flow cytometric
detection of apoptosis in human and murine cells. J Immunol Methods 2002; 61: 129-39.
34 - Di Paola R, Bazin JP, Aubry F, Aurengo A, Cavaillolès F, Herry JH, Kahn E. Handling of
dynamic sequences in nuclear medecine. IEEE Trans Nucl Sci 1982; 29: 1310-1321.
35 - Frouin F, Cinotti L, Benali H, Buvat I, Bazin JP, Millet P, Di Paola R. Extraction of
functional volumes from medical dynamic volumetric datasets. Comp Med Imaging Graph
1993; 17: 397-404.
36 - Kahn E, Lizard G, Pélégrini M, Frouin F, Roignot P, Chardonnet Y, Di Paola R. Four-
dimensional factor analysis of confocal images sequences (4D-FAMIS) to detect and
characterize low numbers of human papillomavirus DNA by FISH in HeLa and SiHa cells. J
Microscopy 1999; 193: 227-243.
37 - Kahn E, Frouin F, Souchier C, Bernengo JC, Bruzzoni-Giovanelli H, Clement O, Frija G,
Di Paola R, Calvo F, Linares-Cruz G. Confocal multilaser focusing and single-laser
characterization of UV excitable stains of cellular preparations. Cytometry 2000; 40: 42-49.
38 - Harman HH. Modern factor analysis, Chicago, University of Chicago Press, 1960.
RESULTATS
206
39 - Benzecri JP. L’analyse des données, Tome 2: L’analyse des correspondances. Paris:
Dunod, 1973.
40 - Vejux A, Guyot S, Montange T, Riedinger JM, Kahn E, Lizard G. Phospholipidosis and
down-regulation of the PI3-K/PDK-1/Akt signalling pathway are vitamin E inhibitable events
associated with 7-ketocholesterol-induced apoptosis. J Nutr Biochem. 2009; 20: 45-61.
41 - Kahn E, Lizard G, Frouin F, Bernengo JC, Souchier C, Bessède G, Clément O, Siitari H,
Gambert P, Frija G, Todd-Pokropek A. Confocal analysis of phosphatidylserine externalization
with the use of biotinylated annexin V revealed with streptavidin-FITC, -europium, -
phycoerythrin or -Texas Red in oxysterol-treated apoptotic cells. Anal Quant Cytol Histol.
2001; 23: 47-55.
42 - Vejux A, Malvitte L, Lizard G. Side effects of oxysterols: cytotoxicity, oxidation,
inflammation, and phospholipidosis. Braz J Med Biol Res. 2008; 41: 545-556.
43 - Kahn E, Hotmar J, Frouin F, Di Paola M, Bazin JP, Di Paola R, Bernheim A. Spectral and
dynamic confocal fluorescence characterization of cytogenetic preparations. Anal Cell Pathol.
1996; 12: 45-56.
44 - Barnett MH, Prineas JW. Relapsing and remitting multiple sclerosis: pathology of the
newly forming lesion. Ann Neurol. 2004; 55: 458-468.
45 - Valianpour F, Selhorst JJ, van Lint LE, van Gennip AH, Wanders RJ, Kemp S. Analysis of
very long-chain fatty acids using electrospray ionization mass spectrometry. Mol Genet Metab.
2003; 79: 189-196.
46 - Ito M, Blumberg BM, Mock DJ, Goodman AD, Moser AB, Moser HW, Smith KD,
Powers JM. Potential environmental and host participants in the early white matter lesion of
adreno-leukodystrophy: morphologic evidence for CD8 cytotoxic T cells, cytolysis of
oligodendrocytes, and CD1-mediated lipid antigen presentation. J Neuropathol Exp Neurol.
2001; 60: 1004-1019.
47 - Feigenbaum V, Gélot A, Casanova P, Daumas-Duport C, Aubourg P, Dubois-Dalcq M.
Apoptosis in the central nervous system of cerebral adrenoleukodystrophy patients. Neurobiol
Dis. 2000;7(6 Pt B):600-612.
48 - Eichler FS, Ren JQ, Cossoy M, Rietsch AM, Nagpal S, Moser AB, Frosch MP, Ransohoff
RM. Is microglial apoptosis an early pathogenic change in cerebral X-linked
adrenoleukodystrophy? Ann Neurol. 2008; 63:729-742.
49 - Baumann N, Pham-Dinh D. Biology of oligodendrocyte and myelin in the mammalian
central nervous system. Physiol Rev 2001; 81: 871-927.

RESULTATS
207
50 - Yuan XM, Li W, Brunk UT, Dalen H, Chang YH, Sevanian A. Lysosomal destabilization
during macrophage damage induced by cholesterol oxidation products. Free Radic Biol Med.
2000 ; 28: 208-218.
51 - Lemaire-Ewing S, Prunet C, Montange T, Vejux A, Berthier A, Bessède G, Corcos L,
Gambert P, Néel D, Lizard G. Comparison of the cytotoxic, pro-oxidant and pro-inflammatory
characteristics of different oxysterols. Cell Biol Toxicol. 2005; 21: 97-114.
52 - Lassmann H. 2004. Cellular damage and repair in multiple sclerosis. In : Myelin biology
and disorders (Ed RA Lazzarini), vol 2, pp 733-762. USA Elsevier.
53 - Darzynkiewicz Z, Bedner E, Smolewski P, Lee BW, Johnson GL. Detection of caspases
activation in situ by fluorochrome-labeled inhibitors of caspases (FLICA). Methods Mol Biol.
2002; 203: 289-299.
54 - Paintlia AS, Gilg AG, Khan M, Singh AK, Barbosa E, Singh I. Correlation of very long
chain fatty acid accumulation and inflammatory disease progression in childhood X-ALD:
implications for potential therapies. Neurobiol. Dis. 2003; 14: 425-439.
55 - Singh I, Pujol A. Pathomechanisms underlying X-adrenoleukodystrophy: a three-hit
hypothesis. Brain Pathol 2010; 20: 838-844.
56 - Wanders RJ, Ferdinandusse S, Brites P, Kemp S. Peroxisomes, lipid metabolism and
lipotoxicity. Biochim Biophys Acta. 2010; 1801: 272-280
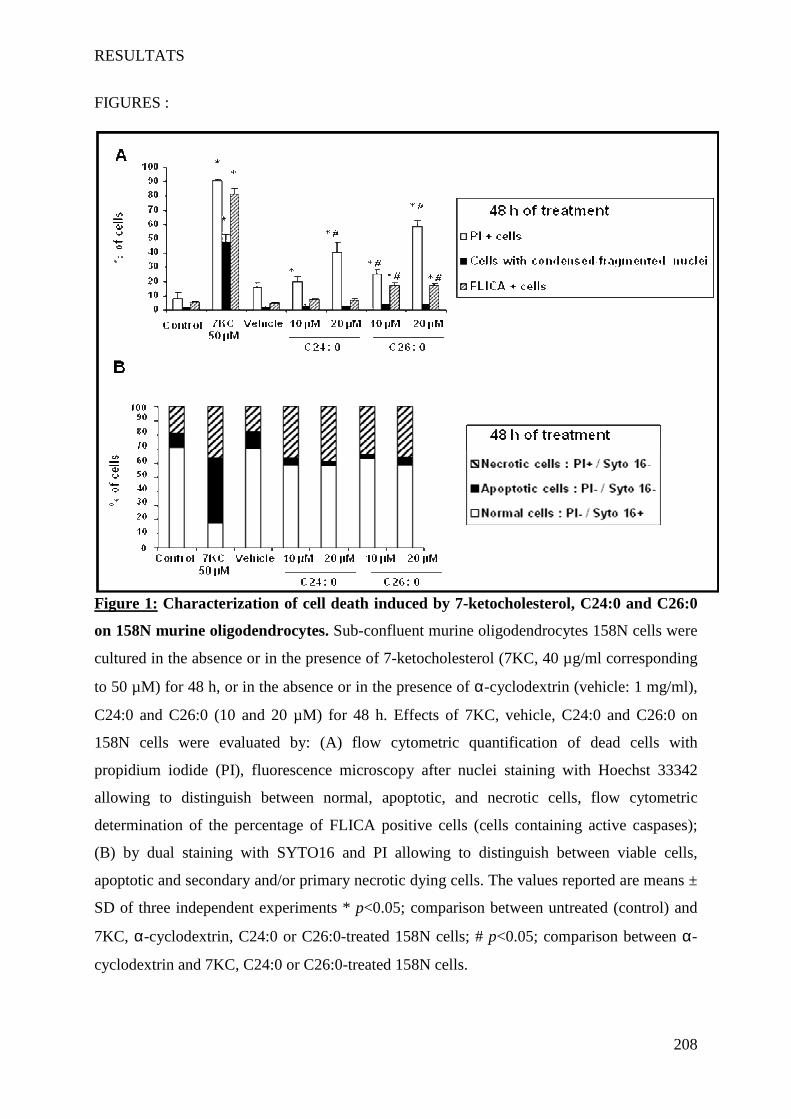
RESULTATS
208
FIGURES :
Figure 1: Characterization of cell death induced by 7-ketocholesterol, C24:0 and C26:0
on 158N murine oligodendrocytes. Sub-confluent murine oligodendrocytes 158N cells were
cultured in the absence or in the presence of 7-ketocholesterol (7KC, 40 µg/ml corresponding
to 50 µM) for 48 h, or in the absence or in the presence of α-cyclodextrin (vehicle: 1 mg/ml),
C24:0 and C26:0 (10 and 20 µM) for 48 h. Effects of 7KC, vehicle, C24:0 and C26:0 on
158N cells were evaluated by: (A) flow cytometric quantification of dead cells with
propidium iodide (PI), fluorescence microscopy after nuclei staining with Hoechst 33342
allowing to distinguish between normal, apoptotic, and necrotic cells, flow cytometric
determination of the percentage of FLICA positive cells (cells containing active caspases);
(B) by dual staining with SYTO16 and PI allowing to distinguish between viable cells,
apoptotic and secondary and/or primary necrotic dying cells. The values reported are means ±
SD of three independent experiments * p<0.05; comparison between untreated (control) and
7KC, α-cyclodextrin, C24:0 or C26:0-treated 158N cells; # p<0.05; comparison between α-
cyclodextrin and 7KC, C24:0 or C26:0-treated 158N cells.
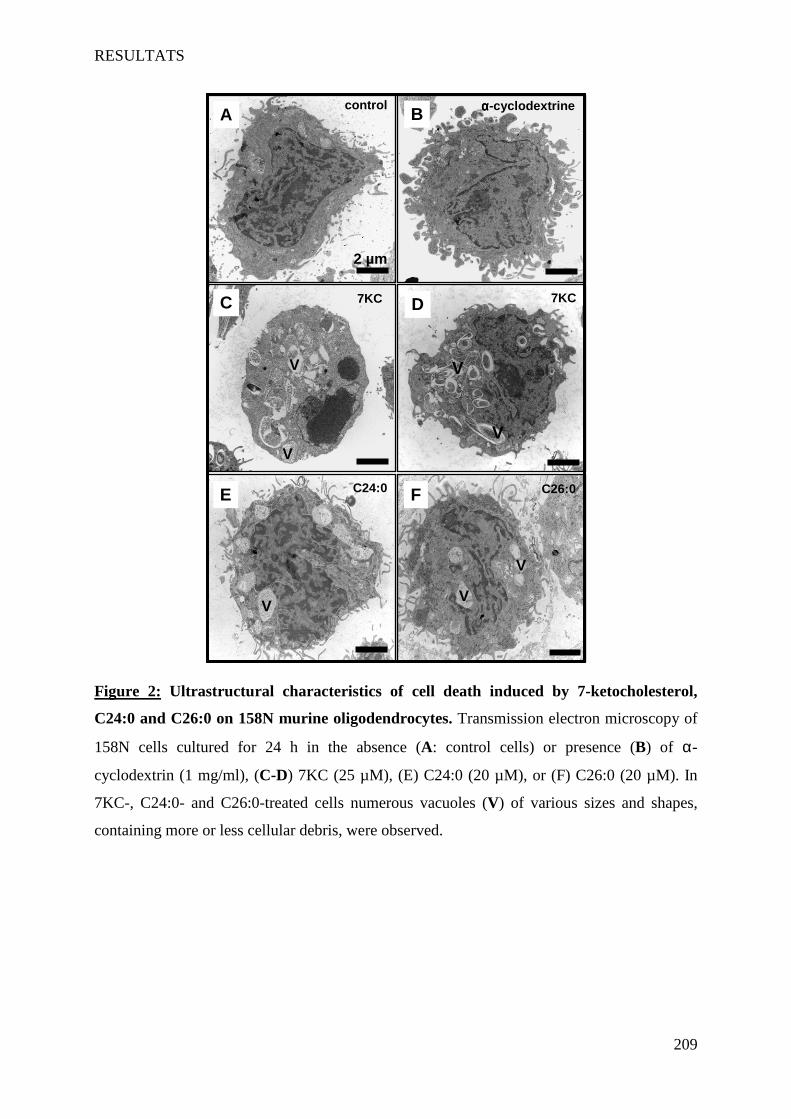
RESULTATS
209
Figure 2: Ultrastructural characteristics of cell death induced by 7-ketocholesterol,
C24:0 and C26:0 on 158N murine oligodendrocytes. Transmission electron microscopy of
158N cells cultured for 24 h in the absence (A: control cells) or presence (B) of α-
cyclodextrin (1 mg/ml), (C-D) 7KC (25 µM), (E) C24:0 (20 µM), or (F) C26:0 (20 µM). In
7KC-, C24:0- and C26:0-treated cells numerous vacuoles (V) of various sizes and shapes,
containing more or less cellular debris, were observed.
2 µm
A B
C D
E F
V
V
V V
V
V
V
control αααα-cyclodextrine
7KC 7KC
C24:0 C26:0
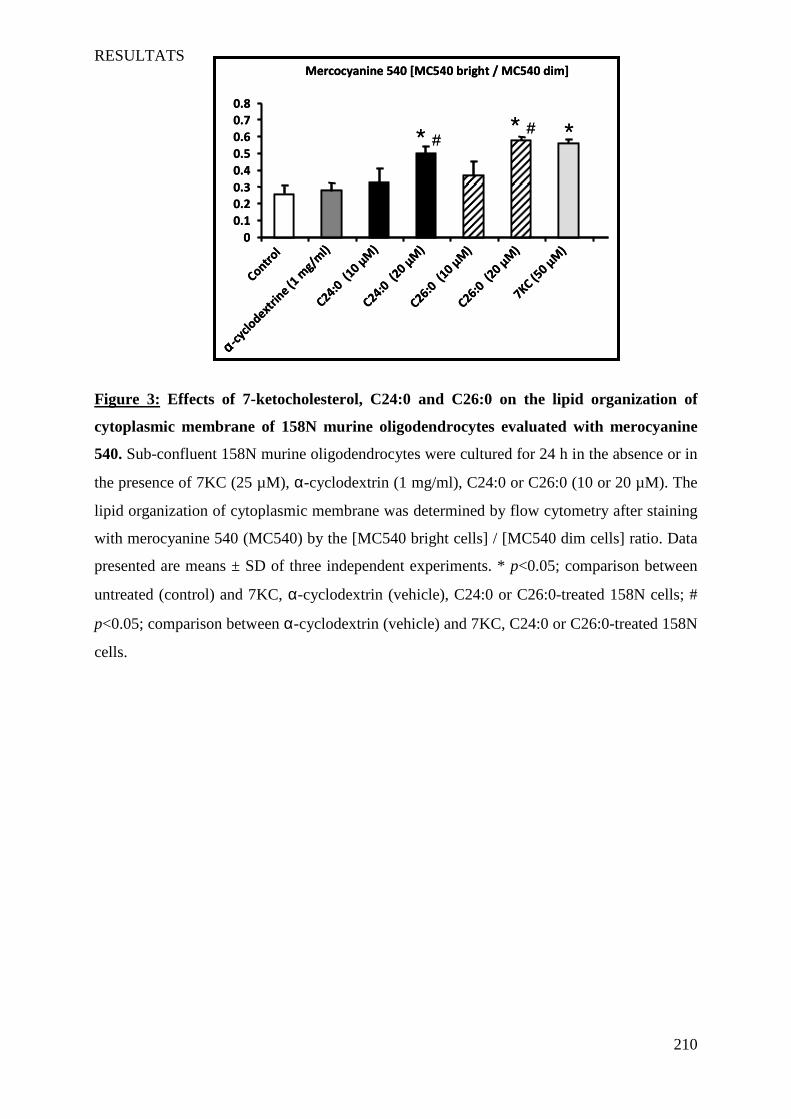
RESULTATS
210
Figure 3: Effects of 7-ketocholesterol, C24:0 and C26:0 on the lipid organization of
cytoplasmic membrane of 158N murine oligodendrocytes evaluated with merocyanine
540. Sub-confluent 158N murine oligodendrocytes were cultured for 24 h in the absence or in
the presence of 7KC (25 µM), α-cyclodextrin (1 mg/ml), C24:0 or C26:0 (10 or 20 µM). The
lipid organization of cytoplasmic membrane was determined by flow cytometry after staining
with merocyanine 540 (MC540) by the [MC540 bright cells] / [MC540 dim cells] ratio. Data
presented are means ± SD of three independent experiments. * p<0.05; comparison between
untreated (control) and 7KC, α-cyclodextrin (vehicle), C24:0 or C26:0-treated 158N cells; #
p<0.05; comparison between α-cyclodextrin (vehicle) and 7KC, C24:0 or C26:0-treated 158N
cells.
Mercocyanine 540 [MC540 bright / MC540 dim]
0
0.1
0.2
0.3
0.4
0.5
0.6
0.7
0.8
Control
αααα-cyc
lodext
rine
(1 m
g/m
l)
C24:0 (
10 µM
)
C24:0 (
20 µM
)
C26:0 (
10 µM
)
C26:0 (
20 µM
)
7KC (50 µ
M)
* # * # *
Mercocyanine 540 [MC540 bright / MC540 dim]
0
0.1
0.2
0.3
0.4
0.5
0.6
0.7
0.8
Control
αααα-cyc
lodext
rine
(1 m
g/m
l)
C24:0 (
10 µM
)
C24:0 (
20 µM
)
C26:0 (
10 µM
)
C26:0 (
20 µM
)
7KC (50 µ
M)
* # * # *
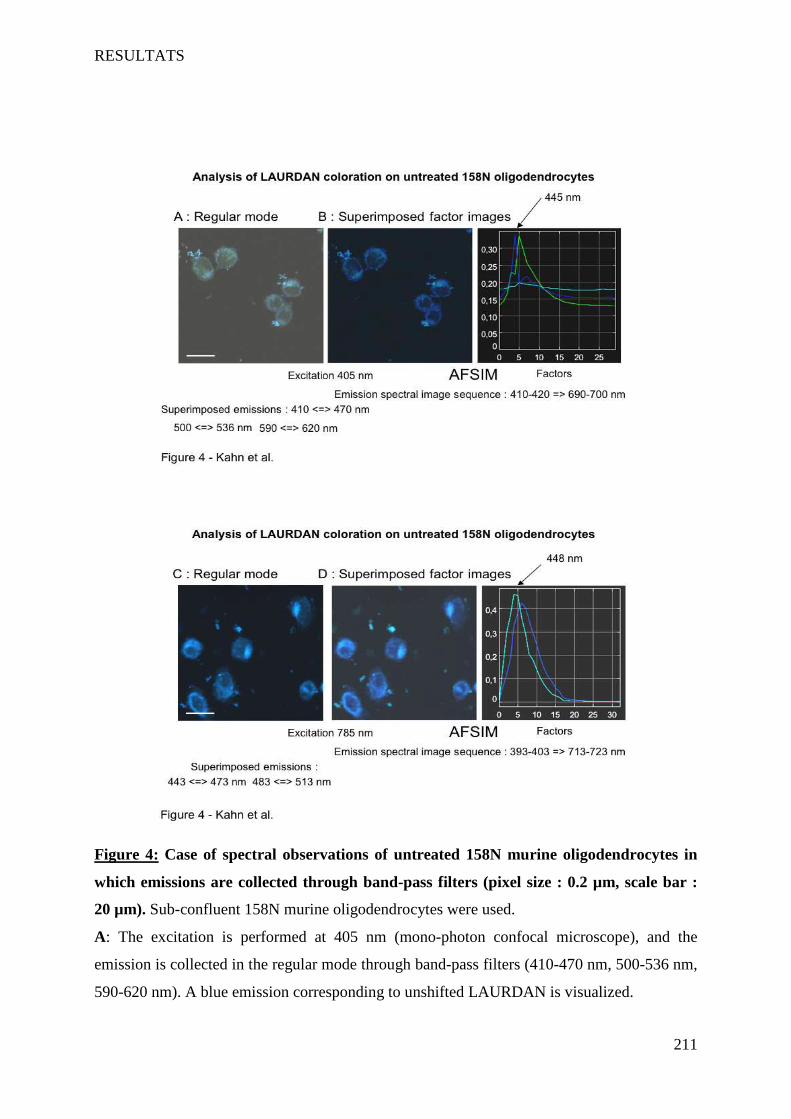
RESULTATS
211
Figure 4: Case of spectral observations of untreated 158N murine oligodendrocytes in
which emissions are collected through band-pass filters (pixel size : 0.2 µm, scale bar :
20 µm). Sub-confluent 158N murine oligodendrocytes were used.
A: The excitation is performed at 405 nm (mono-photon confocal microscope), and the
emission is collected in the regular mode through band-pass filters (410-470 nm, 500-536 nm,
590-620 nm). A blue emission corresponding to unshifted LAURDAN is visualized.
RESULTATS
212
B: Use of the spectral mode through 10 nm band-pass filters from blue to red (415 => 695
nm). The resulting spectral sequences are investigated by means of FAMIS. A blue emission
(445 nm) corresponding to unshifted LAURDAN is visualized in the first two factors and
factor images, which are superimposed in true color.
C: The excitation is performed at 785 nm (bi-photon confocal microscope), and the emission
is collected in the regular mode through band-pass filters (443-473 nm, 483-513 nm). A blue
emission corresponding to unshifted LAURDAN is visualized.
D: Use of the spectral mode through 10 nm band-pass filters from blue to red (398 => 718
nm). The resulting spectral sequences are investigated by means of FAMIS. A blue emission
(448 nm) corresponding to unshifted LAURDAN is visualized in the first two factors and
factor images, which are superimposed in true color.
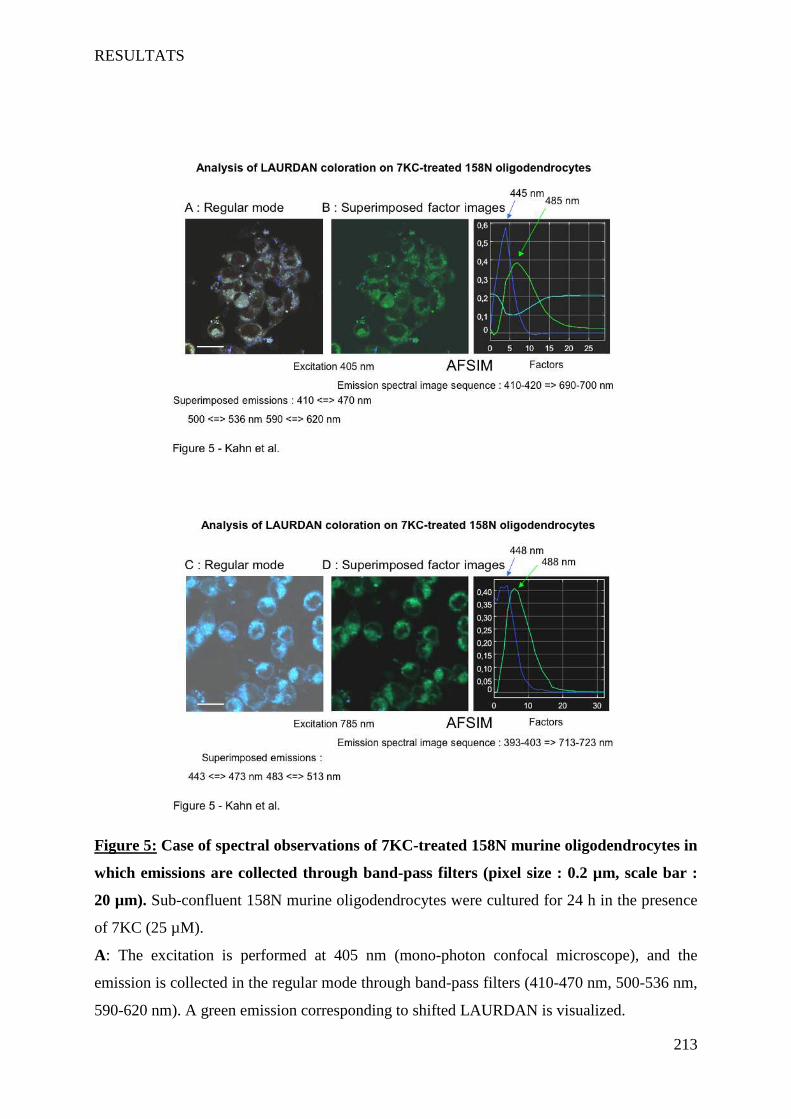
RESULTATS
213
Figure 5: Case of spectral observations of 7KC-treated 158N murine oligodendrocytes in
which emissions are collected through band-pass filters (pixel size : 0.2 µm, scale bar :
20 µm). Sub-confluent 158N murine oligodendrocytes were cultured for 24 h in the presence
of 7KC (25 µM).
A: The excitation is performed at 405 nm (mono-photon confocal microscope), and the
emission is collected in the regular mode through band-pass filters (410-470 nm, 500-536 nm,
590-620 nm). A green emission corresponding to shifted LAURDAN is visualized.

RESULTATS
214
B: Use of the spectral mode through 10 nm band-pass filters from blue to red (415 => 695
nm). The resulting spectral sequences are investigated by means of FAMIS. A blue emission
(445 nm) corresponding to unshifted LAURDAN is visualized in the first factor and factor
image. A green emission (485 nm) corresponding to shifted LAURDAN is visualized in the
second factor and factor image. They are superimposed in true color.
C: The excitation is performed at 785 nm (bi-photon confocal microscope), and the emission
is collected in the regular mode through band-pass filters (443-473 nm, 483-513 nm). A green
emission corresponding to shifted LAURDAN is visualized.
D: Use of the spectral mode through 10 nm band-pass filters from blue to red (393 => 713
nm). The resulting spectral sequences are investigated by means of FAMIS. A blue emission
(448 nm) corresponding to unshifted LAURDAN is visualized in the first factor and factor
image. A green emission (488 nm) corresponding to shifted LAURDAN is visualized in the
second factor and factor image. They are superimposed in true color.
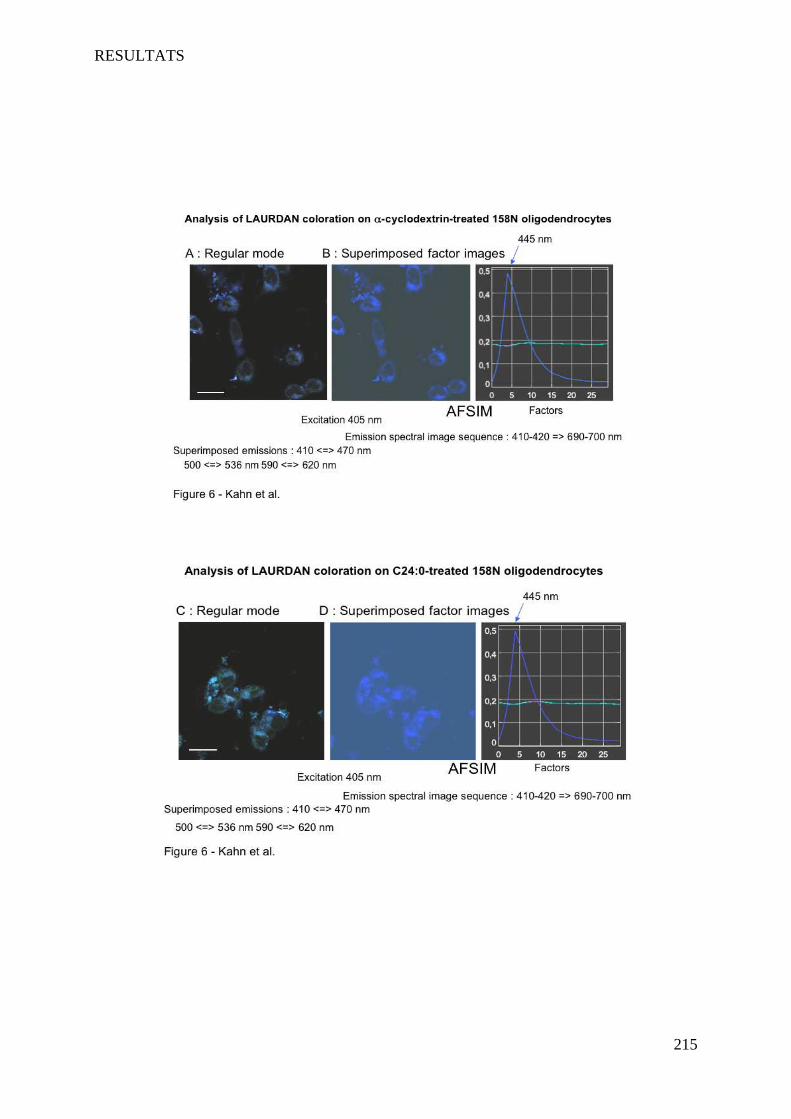
RESULTATS
215

RESULTATS
216
Figure 6: Case of spectral observations of α-cyclodextrin, C24:0 or C26:0 -treated 158N
murine oligodendrocytes cells in which emissions are collected through band-pass filters
(pixel size : 0.2 µm, scale bar : 20 µm). Sub-confluent 158N murine oligodendrocytes were
cultured for 24 h in the presence of α-cyclodextrin (1 mg/ml), C24:0 or C26:0 (20 µM).
A, C, E: The excitation is performed at 405 nm (mono-photon confocal microscope), and the
emission is collected in the regular mode through band-pass filters filters (410-470 nm, 500-
536 nm, 590-620 nm). No obvious emission corresponding to shifted LAURDAN is
visualized.
B, D, F: Use of the spectral mode through 10 nm band-pass filters from blue to red (415 =>
695 nm). The resulting spectral sequences are investigated by means of FAMIS. A blue
emission (445 nm) corresponding to unshifted LAURDAN is visualized in the first two
factors and factor images, which are superimposed in true color. No green emission
corresponding to shifted LAURDAN is visualized.
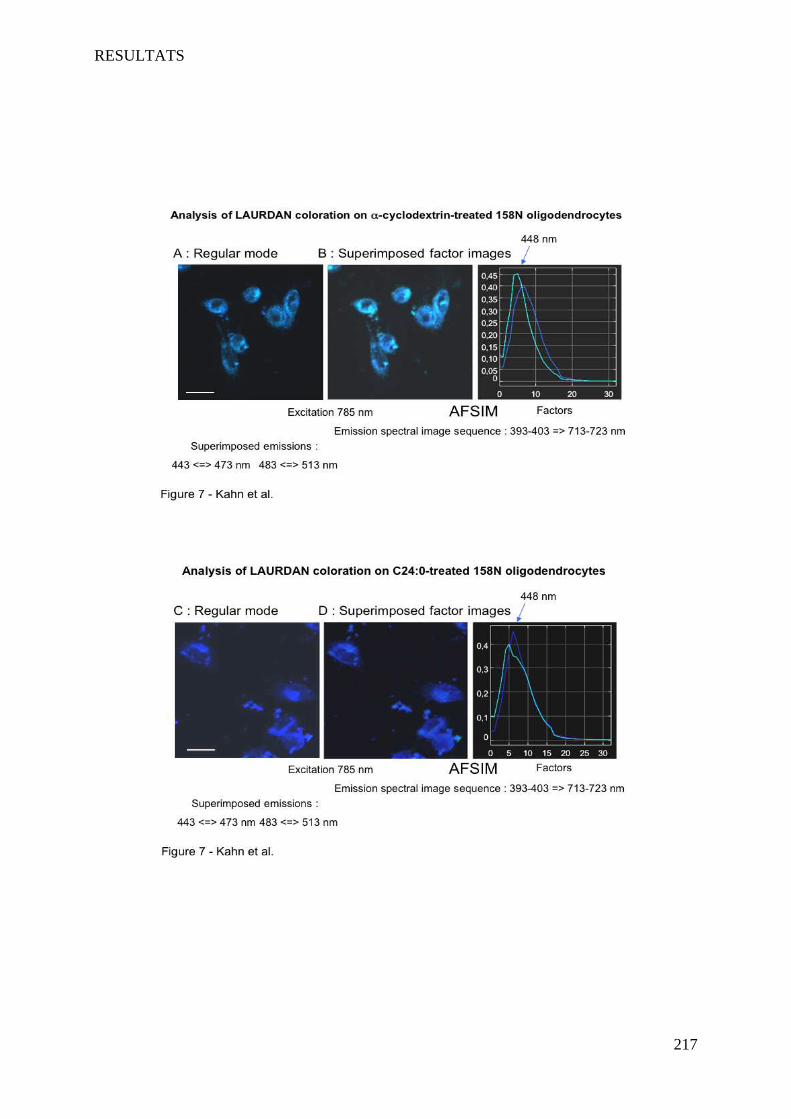
RESULTATS
217

RESULTATS
218
Figure 7: Case of spectral observations of -cyclodextrin, C24:0 or C26:0 -treated 158N
murine oligodendrocytes cells in which emissions are collected through band-pass filters
(pixel size : 0.2 m, scale bar : 20 m). Sub-confluent 158N murine oligodendrocytes were
cultured for 24 h in the presence of -cyclodextrin (1 mg/ml), C24:0 or C26:0 (20 µM).
A, C, E: The excitation is performed at 785 nm (bi-photon confocal microscope), and the
emission is collected in the regular mode through band-pass filters filters (443-473 nm, 483-
513 nm). No obvious emission corresponding to shifted LAURDAN is visualized.
B, D, F: Use of the spectral mode through 10 nm band-pass filters from blue to red (393 =>
713 nm). The resulting spectral sequences are investigated by means of FAMIS. A blue
emission (448 nm) corresponding to unshifted LAURDAN is visualized in the first two
factors and factor images, which are superimposed in true color. No green emission
corresponding to shifted LAURDAN is visualized.

DISCUSSION
219
DISCUSSION

DISCUSSION
220
I Modèle cellulaire utilisé
Dans l’X-ALD (OMIM 300100) et la P-NALD (OMIM264470), l’accumulation plasmatique
et tissulaire d’AGTLC est une caractéristique biochimique commune à ces deux maladies
peroxysomales, métaboliques et neurodégénératives (Kemp & Wanders, 2010; Wanders et al.,
2010). Les formes les plus sévères de ces maladies induisent une démyélinisation
inflammatoire au niveau du SNC (Wanders et al., 2010). La physiopathologie de ces deux
maladies reste peu connue, surtout les relations entre accumulation d’AGTLC, oxydation,
inflammation et démyélinisation.
Pour aborder in vitro ces différents aspects, il était nécessaire de disposer d’un modèle
cellulaire approprié. Nous avons ainsi caractérisé une lignée d’oligodendrocytes murin (158N)
initialement décrite pour exprimer plusieurs marqueurs myéliniques qui sont aussi des
marqueurs de différenciation terminale des oligodendrocytes (PLP, MBP, MOG, CNPase)
(Feutz et al., 2001; Ghandour et al., 2002). La PLP et la MBP sont les deux protéines
majeures de la myéline, elles sont impliquées dans la stabilisation et la compaction de la
myéline (de Vries & Hoekstra, 2000). La CNPase est associée aux cellules productrices de la
myéline dans le SNC, ainsi que dans le SNP (Sprinkle, 1989). La MOG est la protéine de
myéline la plus tardivement exprimée; elle est fortement immunogène et constitue un auto-
antigène clé dans la sclérose en plaque (Clements et al., 2003). L’expression de ces protéines
de myéline indique que la lignée oligodendrocytaire 158N constitue un outil intéressant pour
étudier les effets des facteurs intrinsèques et/ou extrinsèques sur la différenciation des
oligodendrocytes en relation avec l’expression des protéines majeures de la myéline. Ces
cellules présentent donc un intérêt pour aborder certains aspects de la démyélinisation
(expression des protéines myéliniques, composition et dynamique lipidique) dans le cadre de
différentes maladies neurodégénératives. L’abondance et la fonctionnalité des peroxysomes
dans les cellules 158N, l’expression de protéines peroxysomales associées à l’X-ALD
(Abcd1, Abcd2) et à la P-NALD (ACOX1), la capacité de moduler l’expression de certaines
protéines peroxysomales (Acox1, L-PBE), l’activité de certaines enzymes de la β-oxydation
(ACOX1) et de l’enzyme majeure de détoxification peroxysomale (catalase) permettent
d’utiliser cette lignée comme modèle pour aborder la physiopathologie de l’X-ALD et de la P-
NALD in vitro après extinction transitoire (siRNA) ou permanente (shRNA) d’Abcd1 et/ou
d’Acox1. Ce modèle n’exclut toutefois pas d’utiliser en complément d’autres approches in
vitro comme la culture primaire mixte de cellules gliales (oligodendrocytes + astrocytes) avec
DISCUSSION
221
ou sans neurones et la culture organotypique de tissus nerveux central ou périphérique
provenant de souris sauvages ou déficientes en Abcd1. En effet, les cultures mixtes ou
organotypiques permettront d’aborder les effets des AGTLC sur les différents types de
cellules neuronales dans des conditions qui permettront d’étudier plusieurs paramètres; en
particulier l’aspect inflammatoire, oxydatif et la part prise par les interactions cellulaires.
II Traitement avec les AGTLC
Pour solubiliser les AGTLC plusieurs moyens ont été testés : solubilisations dans l’éthanol, le
DMSO, l’albumine bovine et l’alpha-cyclodextrine. Le traitement des 158N avec les AGTLC
solubilisés dans l’éthanol, dans le DMSO et dans l’albumine bovine n’a pas permis d’obtenir
des résultats reproductibles car la solubilisation des AGTLC dans le milieu de culture était
aléatoire. L’utilisation de l’alpha-cyclodextrine (1 mg/ml final dans le milieu de culture) dans
un rapport molaire C24:0 ou C26:0 / alpha-cyclodextrine de 1/50 est optimale pour la
solubilisation des AGTLC. Dans ces conditions, l’accumulation des AGTLC dans les 158N a
été montrée par CPG/MS. Suite au traitement des 158N avec le C24:0 et le C26:0, la
répartition des AGTLC dans les différentes sous classes lipidiques a été mesurée (Article 2,
tableau 1).
Le dosage de la quantité de C24:0 dans les 158N après traitement au C24:0 (5, 10 ou 20 µM)
(Article 2, tableau 1) révèle, non seulement, que le C24:0 s’accumule mais également une
augmentation de C26:0. L’accumulation de C26:0 suggère que la sur-accumulation de C24:0
pourrait provoquer l’activation de certaines enzymes impliquées dans l’élongation des
AGTLC et notamment d’ELOVL1 (Kemp & Wanders, 2010).
Le dosage de la quantité de C26:0 dans les 158N après traitement au C26:0 (5, 10 ou 20 µM)
(Article 2, tableau 1), met en évidence une accumulation de C26:0, ainsi qu’une augmentation
de C24:0. Ceci peut être expliqué par le fait qu’un excès de substrat (C26:0) provoque une
activation de la β-oxydation peroxysomale et par conséquent l’accumulation de métabolites
intermédiaires de dégradation comme le C24:0.
Une vérification de cette hypothèse nécessiterait 1) une quantification de la β-oxydation
peroxysomale suite au traitement avec du C26:0, ainsi que le dosage d’autres métabolites de
la β-oxydation peroxysomale du C26:0 comme le C22:0 ; 2) un dosage de l’activité de
certaines élongases comme ELOVL1 et ELOVL6.

DISCUSSION
222
Dans les conditions de solubilisation utilisées et permettant une accumulation des AGTLC, on
observe une accumulation dose-dépendante de ces AG sous forme libre. Or in vivo, les
AGTLC sont essentiellement associés aux phospholipides. Toutefois, dans nos conditions
expérimentales, malgré un fort pourcentage d’AGTLC libres, la quantité d’AGTLC associés
aux phospholipides et aux stérols neutres (essentiellement cholestérol) est élevée. On ignore
aussi dans quelles proportions ces AGTLC sont activés par l’acyl-CoA pour pouvoir être
métabolisé par le peroxysome. Actuellement, les effets physiologiques des AGTLC sont
inconnus, une interprétation possible serait que les AGTLC puissent moduler plusieurs
réponses biologiques (Hardy et al., 1994).
III AGTLC et stress oxydant
Des études in vitro et in vivo ont mis en évidence que la présence excessive d’ERO et d’ERN
est associée à une augmentation de la démyélinisation dans les maladies neuro-inflammatoires
comme la sclérose en plaque ou l’encéphalomyélite expérimentale (Molina-holgado et al.,
2001; Tran et al., 1997; Danilov et al., 2003), ainsi que dans d’autres maladies neuro-
dégénératives comme la sclérose amyotrophique latérale (ou maladie de Charcot) ou la
maladie de Parkinson (Rothstein, 2009; Seet et al., 2010). Ces radicaux oxygénés peuvent
avoir des effets délétères sur la mémoire et la plasticité synaptique (Massaad & Klann, 2010).
Chez les patients atteints d’X-ALD, une augmentation du stress oxydant ainsi qu’une
diminution des défenses anti-oxydantes totales ont été rapportées (Vargas et al., 2004; Deon
et al., 2007; Uto et al., 2008). L’accumulation de C26:0 induit une surproduction de radicaux
libres dans des cellules gliales C6 de rat (Di Biase et al., 2004) et dans des fibroblastes
humains sauvages ou déficients en ABCD1 (Fourcade et al., 2008). Ces données suggèrent
que les AGTLC peuvent altérer l’homéostasie oxydative in vivo et in vitro. Il est donc
important de déterminer les activités oxydatives des AGTLC sur les oligodendrocytes
(sauvages ou déficientes en Abcd1 ou Acox1). Nous avons traité les cellules 158N pendant 24
h avec différentes concentrations de C24:0 et C26:0 (5, 10, 20 µM), puis nous avons évalué le
stress oxydant et ses conséquences. Le C24:0 et le C26:0 induisent la surproduction d’anions
superoxydes, de peroxyde d’hydrogène, ainsi que de monoxyde d’azote à partir de 10 µM.
L’extinction transitoire d’Abcd1 et d’Acox1 par siRNA est suffisante pour induire une rupture
de l’équilibre RedOx et pour contribuer à l’augmentation de production du stress oxydant. Sur
les cellules gliales C6, l’extinction d’Abcd3 par siRNA favorise aussi la production de stress

DISCUSSION
223
oxydant en agissant indirectement par l’intermédiaire de l’IL-12 (Di benedetto et al., 2008).
Les résultats obtenus, en accord avec ceux d’études antérieures, montrent le rôle des VLCFA
et l’importance de l’inactivation d’Abcd1 et d’Acox1 dans la stimulation du stress oxydant.
Ils confortent l’hypothèse récente du « Three hits hypothesis » proposée par Singh et Pujol
selon laquelle le stress oxydant pourrait être à l’origine de la cascade d’évènements
conduisant à la démyélinisation inflammatoire (Sing & Pujol, 2010).
En présence des anions superoxydes, le NO interagit avec les anions superoxydes pour donner
des peroxynitrites (Gao, 2010) qui réagissent avec les macromolécules biologiques (protéines,
lipides et ADN) et induisent des activités neurotoxiques (Lawson et al., 1999; Lorch et al.,
2002; Lee & Blair, 2001). Le NO et le peroxynitrite (ONOO-) peuvent inhiber les composants
de la chaîne respiratoire mitochondriale conduisant éventuellement à un état de carence
énergétique cellulaire (Heals et al., 1999). L’augmentation de l’activité SOD, qui transforme
les anions superoxydes en H2O2, ainsi que la diminution de l’activité catalase et de la quantité
de glutathion intracellulaire (leurs activités assurent la réduction de H2O2 en H2O et O2)
peuvent expliquer l’accumulation de H2O2 intracellulaire. L’identification d’ERO et d’ERN,
ainsi que les modulations d’activité des enzymes anti-oxydantes (catalase, SOD), constituent
des arguments en faveur des effets pro-oxydants des AGTLC. Dans les cellules, le GSH
élimine le H2O2 et maintien le groupe cysteinyl-thiol des protéines à l’état réduit (Mytilineou
et al., 2002). Au niveau du SNC, la déplétion des cellules gliales en GSH conduit à un
relargage d’acide arachidonique de manière dépendante de la phospholipase A2 (PLA2).
L’activation du métabolisme de l’acide arachidonique par la lipoxygénase génère aussi des
ERO (Mytilineou et al., 2002). Par ailleurs, l’accumulation de C26:0 dans des astrocytes
murins en culture primaire active la 5-lipoxygénase (5-LOX), et de même dans toutes les
zones du cerveau de patients atteints d’X-ALD, la 5-LOX est activée (Khan et al., 2010). Nos
résultats confortent les activités pro-oxydantes des AGTLC mises en évidence précédemment
sur 1) les fibroblastes humains déficients en ABCD1, 2) les fibroblastes humains sauvages
traités avec des AGTLC, 3) la moelle épinière de souris déficientes en Abcd1 (Fourcade et al.,
2008), 4) les cellules gliales C6 chargées en C26:0. Ces activités peuvent, au moins en partie,
expliquer le stress oxydant révélé chez des patients atteints d’X-ALD (Deon et al., 2007) et
des femmes hétérozygotes pou l’X-ALD (Deon et al., 2008).
Le stress oxydant observé pourrait avoir une origine mitochondriale ou extra-mitochondriale.
La production d’anions superoxydes révélée par le Mitosox au niveau des mitochondries et la
dépolarisation mitochondriale concomitante observée indiquent que les AGTLC provoquent
des altérations fonctionnelles de la mitochondrie. Nous avons aussi révélé que l’activité SOD
DISCUSSION
224
totale (incluant l’activité SOD cytosolique et mitochondriale) est augmentée dans les 158N
traitées avec les AGTLC. Des études ont montré que l’activité SOD mitochondriale (Mn SOD
ou SOD2) est augmentée dans le cerveau de patients atteints d’X-ALD (Khan et al., 2010) et
dans la moelle épinière des souris déficientes en Abcd1 à partir de 3,5 mois (Fourcade et al.,
2008), ainsi que chez les souris déficientes en Pex5 (Baugmart et al., 2001). D’autre part, des
études ont montré que les AGLC induisent la production d’ERO par blocage de la chaîne
respiratoire mitochondriale suite à un découplage des protéines de la chaine respiratoire
aboutissant à une perturbation du potentiel transmembranaire mitochondrial (Wojtczak &
Schonfeld, 1993). Dans leur ensemble, nos résultats, en accord avec ceux de la littérature,
suggèrent que les AGTLC peuvent provoquer une déstabilisation fonctionnelle de la
mitochondrie avec pour conséquence une stimulation du stress oxydant.
Les sources extra-mitochondriales d’ERO pourraient avoir pour origine 1) l’activation de
NADPH oxydase(s) (Dhaunsi et al., 2005; Uto et al., 2008), 2) l’activation de la lipoxygénase
(5-LOX) par les AGTLC (Khan et al., 2010).
Nous avons aussi évalué les conséquences de l’induction du stress oxydant par les AGTLC
sur les protéines, les lipides et l’ADN. L’accumulation des AGTLC active la peroxydation
lipidique, la modification des protéines et la dégradation de l’ADN. La peroxydation lipidique
a été révélée par l’accumulation de 4-HNE, de HODEs et de 7- hydroxycholestérols.
L’atteinte radicalaire des protéines a été révélée par la carbonylation de ces dernières. Nous
avons montré qu’à partir de 10 µM, le C24:0 et le C26:0 induisent une accumulation
significative d’HODEs qui est un marqueur précoce de stress oxydatif (Yoshida & Niki,
2006). Les HODEs peuvent être produits à partir de l’acide linoléique par différentes
lipoxygénases (Kawajiri et al., 2002), qui peuvent être activées dans les cellules gliales par
accumulation des AGTLC (Khan et al., 2010). Dans le plasma de malades atteints de
différentes formes d’X-ALD, nous avons révélé une peroxydation lipidique par la présence de
9- et 13- hydroxy-octadecadienoate (HODEs) issus de l’oxydation de l’acide linoleïque
(Yoshida et al., 2005; Yoshida & Niki, 2006) et par la présence de 7-hydroxycholestérols
résultant essentiellement de l’auto-oxydation du cholestérol et incluant le 7alpha-
hydroxycholestérol, le 7béta-hydroxycholestérol et le 7-cétocholestérol (Vejux & Lizard,
2009). Nos résultats indiquent que l’accumulation d’HODEs est plus importante dans le
plasma des patients présentant une forme CCALD que chez ceux atteints d’AMN, de maladie
d’Addison et enfin d’ACALD. Ceci laisse supposer que le stress oxydant pourrait jouer un
rôle important dans l’évolution et/ou la sévérité de la maladie. En accord avec nos résultats,
des marqueurs de peroxydation lipidique (TBA-RS ou thiobarbituric acid reactive substances)
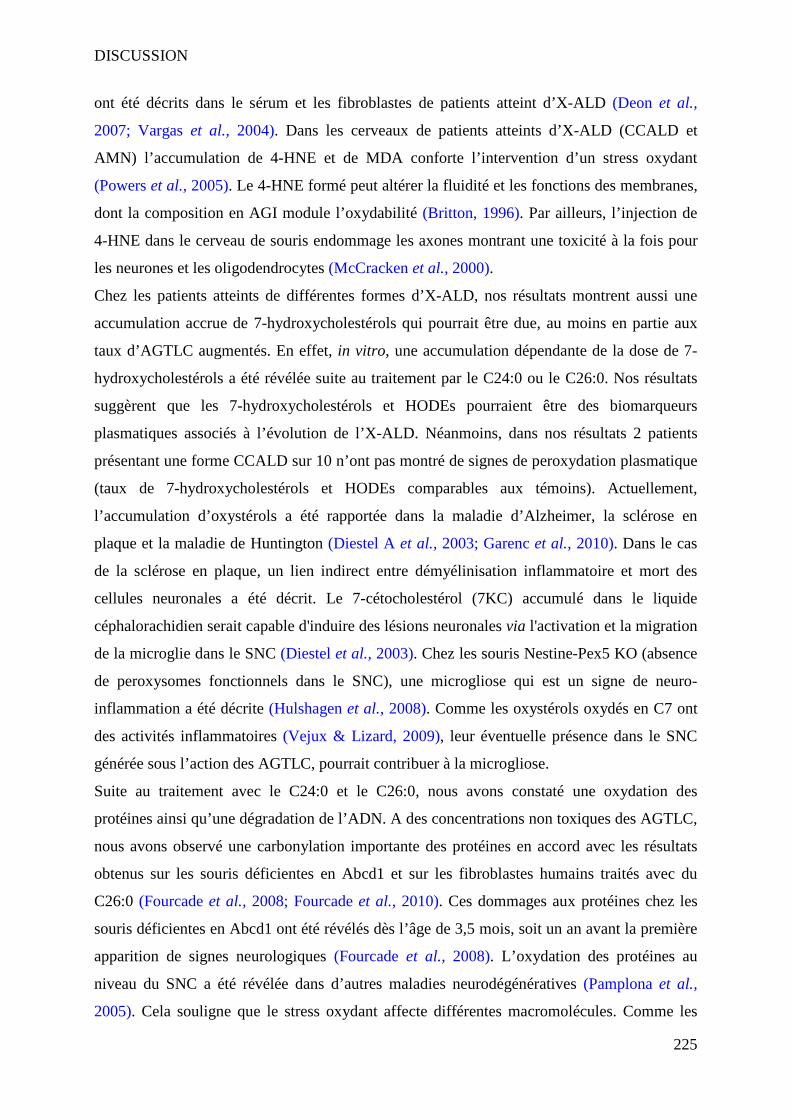
DISCUSSION
225
ont été décrits dans le sérum et les fibroblastes de patients atteint d’X-ALD (Deon et al.,
2007; Vargas et al., 2004). Dans les cerveaux de patients atteints d’X-ALD (CCALD et
AMN) l’accumulation de 4-HNE et de MDA conforte l’intervention d’un stress oxydant
(Powers et al., 2005). Le 4-HNE formé peut altérer la fluidité et les fonctions des membranes,
dont la composition en AGI module l’oxydabilité (Britton, 1996). Par ailleurs, l’injection de
4-HNE dans le cerveau de souris endommage les axones montrant une toxicité à la fois pour
les neurones et les oligodendrocytes (McCracken et al., 2000).
Chez les patients atteints de différentes formes d’X-ALD, nos résultats montrent aussi une
accumulation accrue de 7-hydroxycholestérols qui pourrait être due, au moins en partie aux
taux d’AGTLC augmentés. En effet, in vitro, une accumulation dépendante de la dose de 7-
hydroxycholestérols a été révélée suite au traitement par le C24:0 ou le C26:0. Nos résultats
suggèrent que les 7-hydroxycholestérols et HODEs pourraient être des biomarqueurs
plasmatiques associés à l’évolution de l’X-ALD. Néanmoins, dans nos résultats 2 patients
présentant une forme CCALD sur 10 n’ont pas montré de signes de peroxydation plasmatique
(taux de 7-hydroxycholestérols et HODEs comparables aux témoins). Actuellement,
l’accumulation d’oxystérols a été rapportée dans la maladie d’Alzheimer, la sclérose en
plaque et la maladie de Huntington (Diestel A et al., 2003; Garenc et al., 2010). Dans le cas
de la sclérose en plaque, un lien indirect entre démyélinisation inflammatoire et mort des
cellules neuronales a été décrit. Le 7-cétocholestérol (7KC) accumulé dans le liquide
céphalorachidien serait capable d'induire des lésions neuronales via l'activation et la migration
de la microglie dans le SNC (Diestel et al., 2003). Chez les souris Nestine-Pex5 KO (absence
de peroxysomes fonctionnels dans le SNC), une microgliose qui est un signe de neuro-
inflammation a été décrite (Hulshagen et al., 2008). Comme les oxystérols oxydés en C7 ont
des activités inflammatoires (Vejux & Lizard, 2009), leur éventuelle présence dans le SNC
générée sous l’action des AGTLC, pourrait contribuer à la microgliose.
Suite au traitement avec le C24:0 et le C26:0, nous avons constaté une oxydation des
protéines ainsi qu’une dégradation de l’ADN. A des concentrations non toxiques des AGTLC,
nous avons observé une carbonylation importante des protéines en accord avec les résultats
obtenus sur les souris déficientes en Abcd1 et sur les fibroblastes humains traités avec du
C26:0 (Fourcade et al., 2008; Fourcade et al., 2010). Ces dommages aux protéines chez les
souris déficientes en Abcd1 ont été révélés dès l’âge de 3,5 mois, soit un an avant la première
apparition de signes neurologiques (Fourcade et al., 2008). L’oxydation des protéines au
niveau du SNC a été révélée dans d’autres maladies neurodégénératives (Pamplona et al.,
2005). Cela souligne que le stress oxydant affecte différentes macromolécules. Comme les
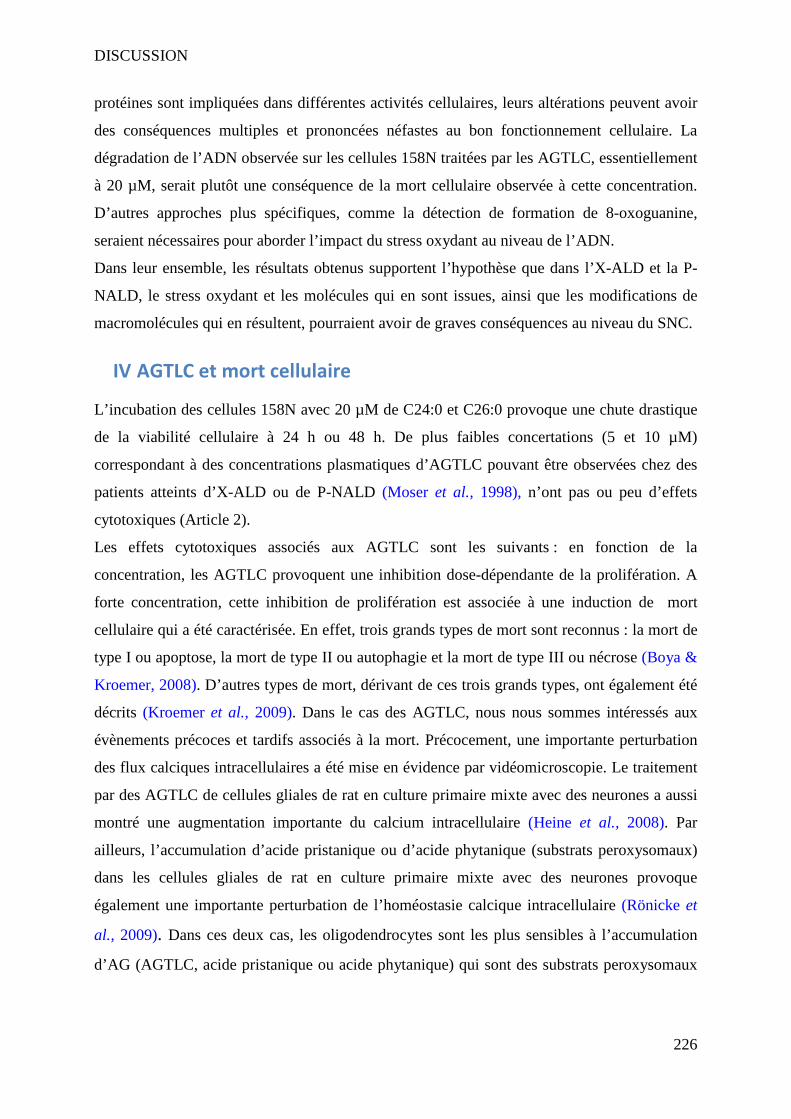
DISCUSSION
226
protéines sont impliquées dans différentes activités cellulaires, leurs altérations peuvent avoir
des conséquences multiples et prononcées néfastes au bon fonctionnement cellulaire. La
dégradation de l’ADN observée sur les cellules 158N traitées par les AGTLC, essentiellement
à 20 µM, serait plutôt une conséquence de la mort cellulaire observée à cette concentration.
D’autres approches plus spécifiques, comme la détection de formation de 8-oxoguanine,
seraient nécessaires pour aborder l’impact du stress oxydant au niveau de l’ADN.
Dans leur ensemble, les résultats obtenus supportent l’hypothèse que dans l’X-ALD et la P-
NALD, le stress oxydant et les molécules qui en sont issues, ainsi que les modifications de
macromolécules qui en résultent, pourraient avoir de graves conséquences au niveau du SNC.
IV AGTLC et mort cellulaire
L’incubation des cellules 158N avec 20 µM de C24:0 et C26:0 provoque une chute drastique
de la viabilité cellulaire à 24 h ou 48 h. De plus faibles concertations (5 et 10 µM)
correspondant à des concentrations plasmatiques d’AGTLC pouvant être observées chez des
patients atteints d’X-ALD ou de P-NALD (Moser et al., 1998), n’ont pas ou peu d’effets
cytotoxiques (Article 2).
Les effets cytotoxiques associés aux AGTLC sont les suivants : en fonction de la
concentration, les AGTLC provoquent une inhibition dose-dépendante de la prolifération. A
forte concentration, cette inhibition de prolifération est associée à une induction de mort
cellulaire qui a été caractérisée. En effet, trois grands types de mort sont reconnus : la mort de
type I ou apoptose, la mort de type II ou autophagie et la mort de type III ou nécrose (Boya &
Kroemer, 2008). D’autres types de mort, dérivant de ces trois grands types, ont également été
décrits (Kroemer et al., 2009). Dans le cas des AGTLC, nous nous sommes intéressés aux
évènements précoces et tardifs associés à la mort. Précocement, une importante perturbation
des flux calciques intracellulaires a été mise en évidence par vidéomicroscopie. Le traitement
par des AGTLC de cellules gliales de rat en culture primaire mixte avec des neurones a aussi
montré une augmentation importante du calcium intracellulaire (Heine et al., 2008). Par
ailleurs, l’accumulation d’acide pristanique ou d’acide phytanique (substrats peroxysomaux)
dans les cellules gliales de rat en culture primaire mixte avec des neurones provoque
également une importante perturbation de l’homéostasie calcique intracellulaire (Rönicke et
al., 2009). Dans ces deux cas, les oligodendrocytes sont les plus sensibles à l’accumulation
d’AG (AGTLC, acide pristanique ou acide phytanique) qui sont des substrats peroxysomaux

DISCUSSION
227
(Rönicke et al., 2009; Heine et al., 2008). Nos résultats confirment la sensibilité des
oligodendrocytes aux AGTLC.
Par ailleurs, l’accumulation d’AGTLC provoque une chute de potentiel transmembranaire
mitochondrial (montré par coloration à la Rh123 et JC1) (Article 2 et 3). Cette dépolarisation
peut augmenter la perméabilité de la membrane mitochondriale aux protons (Hein et al.,
2008). Cet effet résulte soit d’une incorporation directe des AGTLC dans la membrane
mitochondriale, soit d’un effet indirect de ces AGTLC via des effets antérieurs à d’autres
niveaux de la cellule. Par microscopie électronique à transmission, des modifications
ultrastructurales de la mitochondrie ont été observées. Nous avons aussi observé une
augmentation du nombre de vacuoles. Ces dernières pourraient refléter l’intervention de
phénomènes d’autophagie et une déstabilisation des lysosomes. Cette hypothèse a été évaluée
en recherchant le rôle des lysosomes dans la mort cellulaire induite par les AGTLC. Les
différentes approches utilisées (coloration à l’Acridine Orange, au Lysotracker et analyse de
l’expression et de la répartition cellulaire de LAMP1) démontrent une mort cellulaire induite
par les AGTLC associée à une destabilisation lysosomale.
Cette intervention des lysosomes s’accompagne d’une diminution du pH intracellulaire. Cette
acidification pourrait contribuer à maintenir actives des enzymes protéolytiques libérées par le
lysosome (Repnik & Turk, 2010) et favoriser ainsi le processus de mort cellulaire. Cette
hypothèse sera évaluée en utilisant différents inhibiteurs, tels que des inhibiteurs de protéases
lysosomales comme les cathepsines par z-FA-fmk (Schotte et al., 2001) et l’inhibiteur de
pompes à protons (Esoméprazole) (Vachhani et al., 2009).
Dans leur ensemble, les résultats obtenus sur la toxicité des AGTLC soulignent leurs effets
cytotoxiques sur les oligodendrocytes : induction de flux calciques, diminution du pH
intracellulaire, dépolarisation des mitochondries, déstabilisation des lysosomes, augmentation
de la perméabilité membranaire à l’iodure de propidium.
De plus, l’absence de cellules à noyaux fragmentés et/ou condensés caractéristiques des
cellules apoptotiques, de fragmentation internucléosomale de l’ADN et d’activation de
caspases, indiquent que la mort cellulaire induite par les AGTLC est indépendante des
caspases et non apoptotique. Une induction de mort cellulaire par apoptose étant exclue, nous
devront préciser si le type de mort induit par les AGTLC se rattache à de la nécrose ou à de
l’autophagie.
Dans nos conditions expérimentales, l’incidence des AGTLC et de l’inactivation d’Abcd1 sur
l’expression des protéines majeures de la myéline (PLP, MBP) a aussi été abordée.
L’inactivation d’Abcd1 diminue l’expression de MBP mais pas celle de PLP. Les AGTLC

DISCUSSION
228
n’entraînent pas ou peu de modulation d’expression de PLP et MBP dans les cellules
sauvages ou déficientes en Abcd1. Actuellement, une diminution d’expression forte et faible
de MBP est observée respectivement sur les souris Nestin-Pex5 et CNPase-Pex5 KO
(Kassmann et al., 2007; Hulshagen et al., 2008). Ces observations soulignent l’importance du
métabolisme peroxysomal sur la myélinisation et plus particulièrement la relation entre le
métabolisme peroxysomal et la synthèse de MBP qui est une des protéines majeures de la
myéline.
Les résultats obtenus conduisent à proposer un modèle d’induction de mort cellulaire activée
par les AGTLC présenté dans la Figure 30 Il reste à définir le rôle du peroxysome dans la
mort cellulaire. Les résultats préliminaires obtenus indiquent que les cellules 158N deviennent
plus sensibles aux AGTLC, en particulier à de faibles concentrations, suite à une extinction
transitoire d’Abcd1 par siRNA (Article 2).
Figure 30 : Modèle proposé pour l’activation de la mort cellulaire oligodendrocytaire par les AGTLC (C24:0 et C26:0).
AGTLC
[Ca2+]
t-Bid
Lysosome
Relargage de Cathepsines
∆Ψm Activation
de calpaïne
* Relocalisation du Cyt c *Surproduction d’ O 2
.- *Diminution de GSH
pH
Activation de Protéases
Destabilization de la membrane lysosomale
Autophagosom e
Mort cellulaire par necrose ou par
autophagie

DISCUSSION
229
E plus de leurs activités biologiques, les peuvent induire des modifications physico-chimiques
au niveau des membranes et en particulier de la membrane cytoplasmique (Knazek et al.,
1983; Whitcomb et al., 1988). Ceci a conduit à préciser les effets du C24:0 et du C26:0 sur les
caractéristiques physico-chimiques de la membrane cytoplasmique.
V AGTLC et modulation des caractéristiques membranaires
A la concentration induisant une mort cellulaire (20 µM), les effets des AGTLC (C24:0 et
C26:0) sur l’organisation des lipides membranaires des cellules 158N ont été recherchés en
utilisant la mérocyanine 540 (MC540) et le LAURDAN. La mérocyanine 540 donne des
informations sur la fluidité membranaire: si les lipides membranaires sont bien organisées
l’accumulation de MC540 dans la membrane cytoplasmique est faible ; si les lipides
membranaires sont désorganisés l’accumulation de MC540 dans la membrane cytoplasmique
est forte (McEvoy et al., 1988). La fluorescence qui en résulte peut être mesurée par
cytométrie en flux. Le LAURDAN s’accumule dans la membrane cytoplasmique au niveau
des radeaux lipidiques (ou microdomaines) (Bagatolli, 2006). L’utilisation combinée de ces
deux fluorochromes permet donc d’obtenir des informations concernant les effets des AGTLC
sur la fluidité membranaire et sur les microdomaines d’où partent de nombreux signaux
cellulaires. Les résultats obtenus avec les AGTLC montrent que ces derniers altèrent la
fluidité membranaire sans affecter les microdomaines. Les AGTLC sont déjà connus pour
altérer la microviscosité des membranes érythrocytaires chez les patients atteints d’X-ALD
(Knazek et al., 1983). Il a été décrit sur des cellules adrénocorticales que ces altérations de la
microviscosité rendent insensibles les cellules à l’ACTH (Whitcomb et al., 1988), ce qui
démontre que la membrane n’est plus fonctionnelle. Des effets similaires peuvent donc être
envisagés sur les cellules du SNC.
CONCLUSION ET PERSPECTIVES
230
CONCLUSION ET PERSPECTIVES
CONCLUSION ET PERSPECTIVES
231
Les travaux réalisés au cours de ma thèse ont apporté de nouvelles informations sur la
capacité des AGTLC (C24:0 et C26:0 utilisés à 5, 10, 20 et 40 µM) à induire un stress
oxydant, à activer la mort cellulaire et à modifier les propriétés physiques de la membrane
cytoplasmique des oligodendrocytes.
Ainsi, en utilisant une lignée établie d’oligodendrocytes murins 158N, il a été démontré que :
• Les AGTLC induisent une surproduction d’ERO et d’ERN et une perturbation des
systèmes anti-oxydants non enzymatique et enzymatique, ce qui entraîne une
peroxydation lipidique, une carbonylation des protéines et une dégradation de l’ADN.
• Nous montrons pour la première fois que l’inactivation d’Abcd1 et d’Acox1 est
suffisante pour augmenter la production d’ERO et d’ERN. Ces effets sont augmentés
en présence d’AGTLC.
• Ces activités pro-oxydantes sont associés à une mort cellulaire lorsque la
concentration en AGTLC est élevée (≥20 µM).
• Une déstabilisation du lysosome est associée à la mort cellulaire non apoptotique
induite par les AGTLC.
• A la concentration de 20 µM, les AGTLC altèrent la fluidité membranaire sans
affecter les microdomaines lipidiques.
Par ailleurs, des analyses ont été réalisées sur des plasmas de malades remis par le
Pr P Aubourg (INSERM UMR 745, Hôpital St Vincent de Paul, Paris).
• Nous montrons pour la première fois que des taux élevés de 7-hydroxycholestérol et
de HODES (marqueurs de peroxydation lipidique) présents dans les plasmas de
patients atteints d’X-ALD sont corrélés avec la sévérité de la maladie : CCALD >
AMN > Addison > ACALD.
CONCLUSION ET PERSPECTIVES
232
En fonction des résultats obtenus, nous tenterons de répondre à différentes questions :
• Dans le cadre du stress oxydant activé par les AGTLC, des oxystérols oxydés en C7
ont été générés. Il nous est apparait important de préciser si ces derniers peuvent agir
comme second messager et s’ils pourraient intervenir dans l’activation de la microglie
observée in vivo sur des modèles de souris Nestin-Pex5 et CNPase-Pex5. En effet, ces
molécules sont fortement pro-inflammatoires et peuvent induire la synthèse de
différentes cytokines.
• Dans la mort cellulaire, l’étude de l’intervention du lysosome sera approfondie. Le
type de mort cellulaire induit par les AGTLC devra être précisé (autophagie ou
nécrose) ainsi que les voies de signalisation associées. La chronologie et les relations
entre la perturbation des flux calciques, la déstabilisation du lysosome et la
dépolarisation mitochondriale devront être étudiées.
• Nous envisageons également de préciser les effets de différentes molécules anti-
oxydantes (vitamine E, Trolox, acide valproïque, N-acétylcystéine, …) sur le stress
oxydatif et la viabilité. Cela permettra de préciser les relations entre le stress oxydant
et la mort cellulaire, tout en permettant d’identifier de nouvelles molécules à visée
thérapeutique.
• Des transfections stables permettant d’obtenir des cellules 158N déficientes en Abcd1
et Acox1 sont en cours au laboratoire. Ces outils permettront de mieux aborder
l’incidence de ces protéines peroxysomales sur la mort cellulaire, l’oxydation et
l’inflammation.
• Les résultats préliminaires obtenus sur les plasmas de patients atteints d’X-ALD sont
encourageants et méritent d’être approfondis pour définir dans quelles mesures les 7-
hydroxycholestérol et HODEs pourraient être des biomarqueurs des différentes formes
d’X-ALD et d’en préciser l’évolution.
• En fonction des résultats obtenus sur les plasmas de patients atteints d’X-ALD, il
serait judicieux de pouvoir analyser les taux de 7-hydroxycholestérols et HODEs dans
CONCLUSION ET PERSPECTIVES
233
le liquide céphalorachidien, où ils pourraient constituer des marqueurs précoces de
l’évolution de la maladie dans la mesure où le stress oxydant en est un élément
initiateur.
ANNEXES
234
ANNEXES

ANNEXES
235
I - Presentations
A - Communication orales : • BAARINE M , RAGOT K, RISOLD PY, GHANDOUR S, LIZARD G. Analyse de
l'expression de protéines de myéline (PLP, MBP, MOG), d'antigènes de différenciation oligodendrocytaire (CNPase, protéine S100) et de marqueurs peroxysomaux (Catalase, ABCD3, ABCD4) dans deux lignées d'oligodendrocytes murins (158 N, 158 JP). XIVème Forum des Jeunes Chercheurs, Besançon, 12-13 juin 2008.
• BAARINE M , RAGOT K, GENIN E, GHANDOUR S, SAVARY S, LIZARD G. Caractérisation antigénique et fonctionnelle de deux lignées cellulaires d’oligodendrocytes murins (158N, 158JP) par microscopie à fluorescence, cytomètrie en flux et microscopie confocale : analyse de l’expression de protéines myéliniques et peroxysomales, du contenu et de l’activité mitochondriale, et du statut oxydatif. Congrès AFC CYTOMETRIE Nancy, 22-24 octobre 2008. (Prix de l’AFC).
• BAARINE M, LIZARD G. Apport de la microscopie électronique pour l’analyse du métabolisme lipidique et des peroxysomes. Conférence IFR Santé-STIC – Dijon, Recherche et microscopie électronique à l’IFR. Décembre 2009.
• BAARINE M, LIZARD G. Caractérisation de la mort cellulaire par cytometrie en flux.
Atelier Pratique de Cytométrie en Flux et en Image, Troyes, 2-3 juin 2010.
• BAARINE M, LIZARD G. Caractérisation de radicaux oxygénés par cytométrie en flux : applications en biologie et en médecine. Atelier Pratique de Cytométrie en Flux et en Image, Troyes, 2-3 juin 2010.
B - Communications affichées : • BAARINE M, RAGOT K, ATHIAS A, GHANDOUR S, LIZARD G. Evaluation of the
cytotoxic effects of Very Long Chain Fatty Acids (C24:0, C26:0) on 158N murine oligodendrocyte cell line. The 2nd ELA Research Foundation Congress, Luxembourg (26-27 June 2009).
• BAARINE M, RAGOT K, GHANDOUR S, LIZARD G. Lysosomal Dependent Cell Death of Oligodendrocytes under Treatment by Very Long Chain Fatty Acids (C24:0 and C26:0). XXV Congress of the International Society for Advancement Cytometry, Seattle - USA, May 8-12, 2010.
• ZILAL K, BAARINE M, PIERRE A, SAVARY S, CHERKAOUI-MALKI M, LIZARD G. Abcd1 and Acox1 silencing in murine oligodendrocyte cells (158N) enhances oxidative stress induced by accumulation of Very Long Chain Fatty Acids (C26:0; C24:0). 14ème réunion de l’AEP BIO “peroxysomes et PPARs, Paris 4 juin 2010.
• RAGOT K, BAARINE M, ATHIAS A, GHANDOUR S, LIZARD G. C24:0 and C26:0 favor intracellular accumulation of cholesterol oxide derivatives (7-ketocholesterol, 7β-
ANNEXES
236
hydroxycholesterol) two potent inducers of apoptosis on 158N murine oligodendrocyte cell line. The 2nd ELA Research Foundation Congress, Luxembourg (26-27 June 2009).
• RAGOT K, BAARINE M, CHARBONNIER S, ATHIAS A, AUBOURG P, LIZARD G.
Implication of oxidizes derivates of cholesterol in the physiopathology of X-ALD : in vivo and in vitro approach. 14ème réunion de l’AEP BIO “peroxysomes et PPARs, Paris 4 juin 2010.
II – Collaborations
A - Communication orales et affichées : • KAHN E, PELLOUX S, TOURNEUR Y, FROUIN F, RAGOT K, BAARINE M,
LIZARD G. Dynamic and spectral imaging analysis of the capture by cardiac cells and toxicity of fluorescent nanoparticules. XXIV International Congress. Cytometry in the age of systems biology. Budapest, Hungary, 17-21 May 2008.
• KAHN E, BAARINE M, CHARBONNIER S, PELLOUX S, FROUIN F, TOURNEUR Y, LIZARD G. Etude de la captation de nanoparticules de fer fluorescentes et de leurs activités cytotoxiques et pro-inflammatoires sur des cellules cardiaques (HL1-NB) : analyse par cytométrie en flux et microscopie confocale spectrale. Congrès AFC CYTOMETRIE Nancy, 22-24 octobre 2008.
• DUGAS B, CHARBONNIER S, BAARINE M, MALVITTE L, BRON AM, GARCHER C, LIZARD G. Toxicité des oxystérols sur des cellules de l’épithélium pigmentaire rétinien et évaluation des effets protecteurs d’acides gras oméga 3 (DHA, EPA), d’un agoniste de PPAR-α (fénofibrate) et du resvératrol. 115e Congrès de la Société Française d’Ophtalmologie. Paris, France. 9-13 mai 2009.
• DUGAS B, CHARBONNIER S, BAARINE M, MALVITTE L, BRON AM, CREUZOT-GARCHER C, LIZARD G. Toxicity of Oxysterols in Cultured Retinal Pigment Epithelial Cells and Evaluation of Fatty Acids ω3 (DHA, EPA), PPAR-α Agonist (fenofibrate) and Resveratrol Protective Effects. Reducing Disparities in Eye Disease and Treatment: ARVO, Annual Meeting Fort Lauderdale, FL May 3-7, 2009.
• • DUGAS B, CHARBONNIER S, BAARINE M, RAGOT K, DELMAS D, LIZARD G.
Effects of oxysterols on cell viability, inflammatory cytokines,VEGF and Reactive Oxygen Species production on human retinal cells: prevention of VEGF secretion by Resveratrol. International congress Tast, Nutrition, Health; vitagora-Dijon 23-24mars2010.
• • BAARINE M, THANDAPILLY S, YU L, LOUIS X, DELMAS D, NETTICADAN T,
LIZARD G., LATRUFFE N. Selective effects of dietary resveratrol on normal cardiomyocytes (anti-apoptotic activity) and on tumoral cardiac cells (pro-apoptotic activity). Séminaire Inter Cancéropôle : Grand Est (GE) – Lyon Auvergne Rhône Alpes (CLARA), Dijon, 29-30 avril 2010.
ANNEXES
237
• LIZARD G, KATTAN Z, BAARINE M. Activité métabolique de la cellule. Journée Recherche et Master Biologie, Biophotonique. 11ème colloque Rhône-Alpes de quantimétrie cellulaire. St Etienne 16 juin 2010.
• RAGOT K, BAARINE M, LIZARD G. Multiplexed and microbeads-based analyses: powerfull tools for protein and gene analysis. The Fifth National Congress of Cytometry, Sinaia, Romania, 25-27 may, 2009.
B - Publications : • DUGAS B, CHARBONNIER S, BAARINE M , RAGOT K, DELMAS D, MENETRIER
F, LHERMINIER J, MALVITTE L, KHALFAOUI T, BRON A, CREUZOT-GARCHER C, LATRUFFE N, LIZARD G. Effects of oxysterols on cell viability, inflammatory cytokines, VEGF, and reactive oxygen species production on human retinal cells : cytoprotective effects and prevention of VEGF secretion by resveratrol. European Journal of Nutrition. 2010 Oct; 49(7):435-46.
• KAHN E, BAARINE M , PELLOUX S, RIEDINGER JM, FROUIN F, TOURNEUR Y, LIZARD G. Iron nanoparticles increase 7-ketocholesterol-induced cell death, inflammation, and oxidation on murine cardiac HL1-NB cells. International Journal of Nanomedicine. 2010 Apr 7; 5:185-95.
• KAHN E, PELLOUX S, BAARINE M , KHALFAOUI T, RAGOT K, FROUIN F, RIEDINGER JM, TOURNEUR Y, LIZARD G. Analysis of the Capture and Influence of Nanoparticles on the Cytotoxic Effects of 7-Ketocholesterol on Cardiac Cells: Investigation by Flow Cytometry and by Dynamic and Spectral Imaging Microscopy associated with Factor Analysis of Medical Image Sequences (FAMIS). Analytical and Quantitative Cytology and Histology. 2009, 31: 380-394.
• MAUHAMAD BAARINE , SIJO JOSEPH THANDAPILLY, L. YU, FRÉDÉRIC MAZUÉ, X. L.LOUIS, DOMINIQUE DELMAS, THOMAS NETTICADAN, GÉRARD LIZARD, NORBERT LATRUFFE. Pro-apoptotic vs anti-apoptotic properties and cell signaling of dietary resveratrol on normal and on tumour cells. Genes and Nutrition (En révision).
REFERENCES
238
REFERENCES

REFERENCES
239
A Adamo AM, Aloise PA, Pasquini JM. 1986. A possible relationship between concentration of
microperoxisomes and myelination. Int J Dev Neurosci. 4(6):513-517. Ahlemeyer B, Neubert I, Kovacs WJ, Baumgart-Vogt E. 2007. Differential expression of
peroxisomal matrix and membrane proteins during postnatal development of mouse brain. J Comp Neurol. 505(1):1-17.
Alessandri JM, Extier A, Astorg P, Lavialle M, Simon N, Guesnet P. 2009. Gender-related differences in omega-3 metabolism. Nutrition Clinique et metabolisme. 23:55-66.
Alessandri JM, Guesnet P, Vancassel S, Astorg P, Denis I, Langelier B, Aïd S, Poumès-Ballihaut C, Champeil-Potokar G, Lavialle M. 2004. Polyunsaturated fatty acids in the central nervous system: evolution of concepts and nutritional implications throughout life. Reprod Nutr Dev. 44(6):509-538.
Amon A, Tyers M. 2009. Life and death decisions. Curr Opin Cell Biol. 21(6):767-770. Angermüller S, Islinger M, Völkl A. 2009. Peroxisomes and reactive oxygen species, a lasting
challenge. Histochem Cell Biol. 131(4):459-463. Aubourg P. 2007. X-linked adrenoleukodystrophy. Ann Endocrinol (Paris). 68(6):403-411.
B Baes M, Aubourg P. 2009. Peroxisomes, myelination, and axonal integrity in the CNS.
Neuroscientist. 15(4):367-379. Baes M, Gressens P, Baumgart E, Carmeliet P, Casteels M, Fransen M, Evrard P, Fahimi D,
Declercq PE, Collen D, van Veldhoven PP, Mannaerts GP. 1997. A mouse model for Zellweger syndrome. Nat Genet. 17(1):49-57.
Bagatolli LA. 2006. To see or not to see: lateral organization of biological membranes and fluorescence microscopy. Biochim Biophys Acta. 1758:1541-1556.
Barouki R. 2006. Ageing free radicals and cellular stress. Med Sci (Paris). 22(3):266-272. Baumgart E, Vanhooren JC, Fransen M, Mannaerts GP, Van Veldhoven PP. 1996.
Mammalian peroxisomal acyl-CoA oxidases. III. Molecular characterization of human branched chain fatty acyl-CoA oxidase. Ann N Y Acad Sci. 804:678-689.
Baumgart E, Vanhorebeek I, Grabenbauer M, Borgers M, Declercq PE, Fahimi HD, Baes M. 2001. Mitochondrial alterations caused by defective peroxisomal biogenesis in a mouse model for Zellweger syndrome (PEX5 knockout mouse). Am J Pathol. 159(4):1477-1494.
Beal MF. 2000. Energetics in the pathogenesis of neurodegenerative diseases. Trends Neurosci. 23:298–304.
Bergendi L, Benes L, Duracková Z, Ferencik M. 1999. Chemistry, physiology and pathology of free radicals. Life Sci. 65(18-19):1865-1874.
Berger J, Pujol A, Aubourg P, Forss-Petter S. 2010. Current and future pharmacological treatment strategies in X-linked adrenoleukodystrophy. Brain Pathol. 20(4):845-856.
Berger J. and Gärtner J. 2006. X-linked adrenoleukodystrophy: Clinical, biochemical and pathogenetic aspects. Biochemica et Biophysica Acta, 1763:1721-1732.
Biasi F, Leonarduzzi G, Vizio B, Zanetti D, Sevanian A, Sottero B, Verde V, Zingaro B, Chiarpotto E, Poli G. 2004. Oxysterol mixtures prevent proapoptotic effects of 7-ketocholesterol in macrophages: implications for proatherogenic gene modulation. FASEB J 18(6):693-5.

REFERENCES
240
Birling MC. Roussel G. Nussbaum F. and Nussbaum J.L. 1993. Biochemical and immunohistochemical studies with specific polyclonal antibodies directed against bovine myelin/oligodendrocyte glycoprotein, Neurochem. Res. 18:937-945.
Biswas SK, Rahman I. 2009. Environmental toxicity, redox signaling and lung inflammation: the role of glutathione. Mol Aspects Med. 30(1-2):60-76.
Björkhem I. 2006. Crossing the barrier: oxysterols as cholesterol transporters and metabolic modulators in the brain. J Intern Med 260(6):493-508.
Björkhem I, Heverin M, Leoni V, Meaney S, Diczfalusy U. 2006. Oxysterols and Alzheimer's disease. Acta Neurol Scand Suppl 185:43-9.
Björkhem I, Meaney S. 2004. Brain cholesterol: long secret life behind a barrier. Arterioscler Thromb Vasc Biol. 24(5):806-15.
Blair IA. 2001. Lipid hydroperoxide-mediated DNA damage. Experimental gerontology. 36:1473-1481.
Boehm CD, Cutting GR, Lachtermacher MB, Moser HW, Chong SS. 1999. Accurate DNA-based diagnostic and carrier testing for X-linked adrenoleukodystrophy. Mol Genet Metab. 66(2):128-136.
Boggs JM. 2006. Myelin basic protein: a multifunctional protein. Cell Mol Life Sci. 63(17):1945-1961.
Bongarzone ER, Foster LM, Byravan S, Schonmann V, Campagnoni AT. 1997. Temperature-dependent regulation of PLP/DM20 and CNP gene expression in two conditionally-immortalized jimpy oligodendrocyte cell lines. Neurochem Res 22:363-372.
Bottelbergs A, Verheijden S, Hulshagen L, Gutmann DH, Goebbels S, Nave KA, Kassmann C, Baes M. 2010. Axonal integrity in the absence of functional peroxisomes from projection neurons and astrocytes. Glia. 58(13):1532-1543.
Boveris A, Oshino N, Chance B. 1972. The cellular production of hydrogen peroxide. Biochem J. 128(3):617-630.
Boya P, Kroemer G. 2008. Lysosomal membrane permeabilization in cell death. Oncogene. 27(50):6434-6451.
Bradl M. Lassmann H. 2010. Oligodendrocytes: biology and pathology. Acta Neuropathol. 119(1):37-53.
Brites P, Mooyer PA, El Mrabet L, Waterham HR, Wanders RJ. 2008. Plasmalogens participate in very-long-chain fatty acid-induced pathology. Brain. 132(Pt 2):482-492.
Brites P, Motley AM, Gressens P, Mooyer PA, Ploegaert I, Everts V, Evrard P, Carmeliet P, Dewerchin M, Schoonjans L, Duran M, Waterham HR, Wanders RJ, Baes M. 2003. Impaired neuronal migration and endochondral ossification in Pex7 knockout mice: a model for rhizomelic chondrodysplasia punctata. Hum Mol Genet. 12(18):2255-2267.
Brites P, Waterham HR, Wanders RJ. 2004. Functions and biosynthesis of plasmalogens in health and disease. Biochim Biophys Acta. 1636(2-3):219-231.
Britton RS. 1996. Metal-induced hepatotoxicity. Semin Liver Dis. 16(1):3-12. Brown AJ, Jessup W. 1999. Oxysterols and atherosclerosis. Atherosclerosis 142(1):1-28. Brown AJ, Jessup W. 2009. Oxysterols: Sources, cellular storage and metabolism, and new
insights into their roles in cholesterol homeostasis. Mol Aspects Med. 30(3):111-122. Brown LA, Baker A. 2003. Peroxisome biogenesis and the role of protein import. J Cell Mol
Med. 7(4):388-400. Bursch W. 2001. the autophagosomal-lysosomal compartment in programmed cell death. Cell
death differ 8:569-581. Bucher JR, Tien M, Aust SD. 1983. The requirement for ferric in the initiation of lipid
peroxidation by chelated ferrous iron. Biochem. Biophys. Res. Commun. 111:777–784. Buntinx M, Vanderlocht J, Hellings N, Vandenabeele F, Lambrichts I, Raus J, Ameloot M,
Stinissen P, Steels P. 2003. Characterization of three human oligodendroglial cell lines

REFERENCES
241
as a model to study oligodendrocyte injury: morphology and oligodendrocyte-specific gene expression. J Neurocytol. 32:25-38.
C Cadet J, Douki T, Ravanat JL. 2010. Oxidatively generated base damage to cellular DNA.
Free Radic Biol Med. 49(1):9-21. Carter CJ. 2007. Convergence of genes implicated in Alzheimer's disease on the cerebral
cholesterol shuttle: APP, cholesterol, lipoproteins, and atherosclerosis. Neurochem Int 50(1):12-38.
Cartier N, Hacein-Bey-Abina S, Bartholomae CC, Veres G, Schmidt M, Kutschera I, Vidaud M, Abel U, Dal-Cortivo L, Caccavelli L, Mahlaoui N, Kiermer V, Mittelstaedt D, Bellesme C, Lahlou N, Lefrère F, Blanche S, Audit M, Payen E, Leboulch P, l'Homme B, Bougnères P, Von Kalle C, Fischer A, Cavazzana-Calvo M, Aubourg P. 2009. Hematopoietic stem cell gene therapy with a lentiviral vector in X-linked adrenoleukodystrophy. Science. 326:818–823.
Castino R, Bellio N, Nicotra G, Follo C, Trincheri NF, Isidoro C. 2007. Cathepsin D-Bax death pathway in oxidative stressed neuroblastoma cells. Free Radic Biol Med. 42(9):1305-1316.
Chai J, Du C, Wu JW, Kyin S, Wang X, Shi Y. 2000. Structural and biochemical basis of apoptotic activation by Smac/DIABLO. Nature. 406(6798):855-862.
Champeil-Potokar G, Denis I, Goustard-Langelier B, Alessandri JM, Guesnet P, Lavialle M. 2004. Astrocytes in culture require docosahexaenoic acid to restore the n-3/n-6 polyunsaturated fatty acid balance in their membrane phospholipids. J Neurosci Res. 75(1):96-106.
Chang CC, South S, Warren D, Jones J, Moser AB, Moser HW, and Gould SJ. 1999. Metabolic control of peroxisome abundance. J Cell Sci. 112:1579-1590.
Chaudhary P, Sharma R, Sharma A, Vatsyayan R, Yadav S, Singhal SS, Rauniyar N, Prokai L, Awasthi S, Awasthi YC. 2010. Mechanisms of 4-hydroxy-2-nonenal induced pro- and anti-apoptotic signaling. Biochemistry. 49(29):6263-6275.
Cheng JP, Lane JD. 2010. Organelle dynamics and membrane trafficking in apoptosis and autophagy. Histol Histopathol. 25(11):1457-1472.
Cheng WH, Zheng X, Quimby FR, Roneker CA, Lei XG. 2003. Low levels of glutathione peroxidase 1 activity in selenium-deficient mouse liver affect c-Jun N-terminal kinase activation and p53 phosphorylation on Ser-15 in pro-oxidant-induced aponecrosis. Biochem J. 370(3):927-934.
Chiueh CC. 1999. Neuroprotective properties of nitric oxide. Ann N Y Acad Sci. 890:301-311.
Choi BH. 1993. Oxygen, antioxidants and brain dysfunction. Yonsei Med J. 34(1):1-10. Chu CT, Plowey ED, Dagda RK, Hickey RW, Cherra SJ 3rd, Clark RS. 2009. Autophagy in
neurite injury and neurodegeneration: in vitro and in vivo models. Methods Enzymol. 453:217-249.
Cimini A, Bernardo A, Cifone MG, Di Marzio L, Di Loreto S. 2003. TNFalpha downregulates PPARdelta expression in oligodendrocyte progenitor cells: implications for demyelinating diseases. Glia. 41(1):3-14. Erratum in: Glia. 2003 Jan 15;41(2):212
Circu ML, Aw TY. 2010. Reactive oxygen species, cellular redox systems, and apoptosis. Free Radic Biol Med. 48(6):749-762.
Clements CS, Reid HH, Beddoe T, Tynan FE, Perugini MA, Johns TG, Bernard CC, Rossjohn J. 2003. The crystal structure of myelin oligodendrocyte glycoprotein, a key autoantigen in multiple sclerosis. Proc Natl Acad Sci U S A. 100(19):11059-11064.
Cohen GM. 1997. Caspases: the executioners of apoptosis. Biochem J. 15:326(Pt1):1-16.
REFERENCES
242
Coulter AA, Stephens JM. 2006. STAT5 activators modulate acyl CoA oxidase (AOX) expression in adipocytes and STAT5A binds to the AOX promoter in vitro. Biochem Biophys Res Commun. 344(4):1342-1345.
Curtin JF, Donovan M, Cotter TG. 2002. Regulation and measurement of oxidative stress in apoptosis. Journal of immunological methods. 265:49-72.
Czaja MJ, Cuervo AM. 2009. Lipases in lysosomes, what for? Autophagy. 5(6):866-867.
D Danilov AI, Andersson M, Bavand N, Wiklund NP, Olsson T, Brundin L. 2003. Nitric oxide
metabolite determinations reveal continuous inflammation in multiple sclerosis. J Neuroimmunol. 136(1-2):112-118.
Dasari B, Prasanthi J, Marwarha G, Singh B, Ghribi O. 2010. The oxysterol 27-hydroxycholesterol increases b-amyloid and oxidative stress in retinal pigment epithelial cells.BMC Ophthalmology 10:22
Davies, M. J., Fu, S., Dean, R. T. 1995. Protein hydroperoxides can give rise to reactive free radicals. The Biochemical journal. 305(Pt2):643-649.
De Duve C, Baudhuin P. 1966. Peroxisomes (microbodies and related particles). Physiol Rev. 46(2):323-57.
de Vries H, Hoekstra D. 2000. On the biogenesis of the myelin sheath: cognate polarized trafficking pathways in oligodendrocytes. Glycoconj J. 17(3-4):181-190.
Dell'Angelica EC, Mullins C, Caplan S, Bonifacino JS. 2000. Lysosome-related organelles. FASEB J. 14(10):1265-1278.
Deloulme JC, Raponi E, Gentil BJ, Bertacchi N, Marks A, Labourdette G, Baudier J. 2004. Nuclear expression of S100B in oligodendrocyte progenitor cells correlates with differentiation toward the oligodendroglial lineage and modulates oligodendrocytes maturation. Mol Cell Neurosci. 27(4):453-465.
Deon M, Sitta A, Barschak AG, Coelho DM, Pigatto M, Schmitt GO, Jardim LB, Giugliani R, Wajner M, Vargas CR. 2007. Induction of lipid peroxidation and decrease of antioxidant defenses in symptomatic and asymptomatic patients with X-linked adrenoleukodystrophy. Int J Dev Neurosci. 25(7):441-444.
Deon M, Sitta A, Barschak AG, Coelho DM, Terroso T, Schmitt GO, Wanderley HY, Jardim LB, Giugliani R, Wajner M, Vargas CR. 2008. Oxidative stress is induced in female carriers of X-linked adrenoleukodystrophy. J Neurol Sci. 266(1-2):79-83.
Dhaunsi GS, Kaur J, Alsaeid K, Turner RB, Bitar MS. 2005. Very long chain fatty acids activate NADPH oxidase in human dermal fibroblasts. Cell Biochem Funct. 23(1):65-68.
Di Benedetto R, Denti MA, Salvati S, Attorri L, Di Biase A. 2009. PMP70 knock-down generates oxidative stress and pro-inflammatory cytokine production in C6 glial cells. Neurochem Int. 54(1):37-42.
Di Benedetto R, Denti MA, Salvati S, Sanchez M, Attorri L, David G, Di Biase A. 2008. RNAi-mediated silencing of ABCD3 gene expression in rat C6 glial cells: a model system to study PMP70 function. Neurochem Int. 52(6):1106-1113.
Di Biase A, Di Benedetto R, Fiorentini C, Travaglione S, Salvati S, Attorri L, Pietraforte D. 2004. Free radical release in C6 glial cells enriched in hexacosanoic acid: implication for X-linked adrenoleukodystrophy pathogenesis. Neurochem Int. 44(4):215-221.
Diestel A, Aktas O, Hackel D, Hake I, Meier S, Raine CS, Nitsch R, Zipp F, Ullrich O. 2003. Activation of microglial poly(ADP-ribose)-polymerase-1 by cholesterol breakdown products during neuroinflammation: a link between demyelination and neuronal damage. J Exp Med. 198(11):1729-40.

REFERENCES
243
Di Monte DA, Chan P, Sandy MS. 1992. Glutathione in Parkinson's disease: a link between oxidative stress and mitochondrial damage? Ann Neurol. 32 Suppl:S111-115.
Diczfalusy U. 1994. Beta-oxidation of eicosanoids. Prog Lipid Res. 33(4):403-428. Diestel A, Aktas O, Hackel D, Hake I, Meier S, Raine CS, Nitsch R, Zipp F, Ullrich O. 2003.
Activation of microglial poly(ADP-ribose)-polymerase-1 by cholesterol breakdown products during neuroinflammation: a link between demyelination and neuronal damage. J Exp Med. 198(11):1729-1740.
Dirkx R, Vanhorebeek I, Martens K, Schad A, Grabenbauer M, Fahimi D, Declercq P, Van Veldhoven PP, Baes M. 2005. Absence of peroxisomes in mouse hepatocytes causes mitochondrial and ER abnormalities. Hepatology. 41(4):868-878.
Dobashi K, Pahan K, Chahal A, Singh I. 1997. Modulation of endogenous antioxidant enzymes by nitric oxide in rat C6 glial cells. J Neurochem. 68(5):1896-1903.
Douki, T., Odin, F., Caillat, S., Favier, A., Cadet, J. 2004. Predominance of the 1,N2- propano 2'-deoxyguanosine adduct among 4-hydroxy-2-nonenal-induced DNA lesions. Free radical biology & medicine. 37:62-70.
Dröge W. 2002. Free radicals in the physiological control of cell function. Physiol Rev. 82(1):47-95.
Dubois-Dalcq M, Feigenbaum V, Aubourg P. 1999. The neurobiology of X-Linked adrenoleukodystrophy, a demyelinating peroxisomal disorder. Trends in Neurosciences, 22(1):4-12.
Dugas JC, Tai YC, Speed TP, Ngai J, Barres BA. 2006. Functional genomic analysis of oligodendrocyte differentiation. J. Neurosci. 26(43):10967-10983.
Dyer RG, Stewart MW, Mitcheson J, George K, Alberti MM, Laker MF. 1997. 7-ketocholesterol, a specific indicator of lipoprotein oxidation, and malondialdehyde in non-insulin dependent diabetes and peripheral vascular disease. Clin Chim Acta. 260(1):1-13.
E Eckert JH, Erdmann R. 2003. Peroxisome biogenesis. Rev. Physiol. Biochem. Pharmacol.
147:75–121. Eichler FS, Ren JQ, Cossoy M, Rietsch AM, Nagpal S, Moser AB, Frosch MP, Ransohoff
RM. 2008. Is microglial apoptosis an early pathogenic change in cerebral X-linked adrenoleukodystrophy? Ann Neurol. 63(6):729-742.
Esterbauer H, Schaur RJ, Zollner H. 1991. Chemistry and biochemistry of 4-hydroxynonenal, malonaldehyde and related aldehydes. Free Radic Biol Med. 11(1):81-128.
F Faccio L, Fusco C, Chen A, Martinotti S, Bonventre JV, Zervos AS. 2000. Characterization of
a novel human serine protease that has extensive homology to bacterial heat shock endoprotease HtrA and is regulated by kidney ischemia. J Biol Chem. 275(4):2581-2588.
Fan CY, Pan J, Chu R, Lee D, Kluckman KD, Usuda N, Singh I, Yeldandi AV, Rao MS, Maeda N, Reddy JK. 1996a. Hepatocellular and hepatic peroxisomal alterations in mice with a disrupted peroxisomal fatty acyl-coenzyme A oxidase gene. J Biol Chem. 271: 24698-24710.
Fan CY, Pan J, Chu R, Lee D, Kluckman KD, Usuda N, Singh I, Yeldandi AV, Rao MS, Maeda N, Reddy JK. 1996b. Targeted disruption of the peroxisomal fatty acyl-CoA oxidase gene: generation of a mouse model of pseudoneonatal adrenoleukodystrophy. Ann N Y Acad Sci. 804:530-541.

REFERENCES
244
Farooqui AA, Horrocks LA, Farooqui T. 2007. Modulation of inflammation in brain: a matter of fat. J Neurochem. 101(3):577-599.
Faust PL, Hatten ME. 1997. Targeted deletion of the PEX2 peroxisome assembly gene in mice provides a model for Zellweger syndrome, a human neuronal migration disorder. J Cell Biol. 139(5):1293-1305.
Faust PL, Banka D, Siriratsivawong R, Ng VG, Wikander TM. 2005. Peroxisome biogenesis disorders: the role of peroxisomes and metabolic dysfunction in developing brain. J Inherit Metab Dis. 28(3):369-383.
Feldstein AE, Werneburg NW, Canbay A, Guicciardi ME, Bronk SF, Rydzewski R, Burgart LJ, Gores GJ. 2004. Free fatty acids promote hepatic lipotoxicity by stimulating TNF-alpha expression via a lysosomal pathway. Hepatology. 40(1):185-194.
Feng Z, Hu W, Amin S, Tang MS. 2003. Mutational spectrum and genotoxicity of the major lipid peroxidation product, trans-4-hydroxy-2-nonenal, induced DNA adducts in nucleotide excision repair-proficient and -deficient human cells. Biochemistry. 42:7848-7854.
Ferdinandusse S, Barker S, Lachlan K, Duran M, Waterham HR, Wanders RJ, Hammans S. 2010. Adult peroxisomal acyl-coenzyme A oxidase deficiency with cerebellar and brainstem atrophy. J Neurol Neurosurg Psychiatry. 81(3):310-312.
Ferdinandusse S, Denis S, Hogenhout EM, Koster J, van Roermund CWT, Ljlst L, Moser AB, Wanders RJ, Waterham HR. 2007. Clinical, biochemical, and mutational spectrum of peroxisomal Acyl-CoenzymeA oxidase deficiency. Hum Mut. 28:904-912.
Ferdinandusse S, Denis S, Mooijer PA, Zhang Z, Reddy JK, Spector AA, Wanders RJ. 2001. Identification of the peroxisomal beta-oxidation enzymes involved in the biosynthesis of docosahexaenoic acid. J Lipid Res. 42(12):1987-1995.
Ferdinandusse S, Houten SM. 2006. Peroxisomes and bile acid biosynthesis. Biochim Biophys Acta. 1763(12):1427-1440.
Ferrer I, Aubourg P, Pujol A. 2010. General aspects and neuropathology of X-linked adrenoleukodystrophy. Brain Pathol. 20(4):817-830.
Ferrer I, Kapfhammer JP, Hindelang C, Kemp S, Troffer-Charlier N, Broccoli V, Callyzot N, Mooyer P, Selhorst J, Vreken P, Wanders RJ, Mandel JL, Pujol A. 2005. Inactivation of the peroxisomal ABCD2 transporter in the mouse leads to late-onset ataxia involving mitochondria, Golgi and endoplasmic reticulum damage. Hum Mol Genet. 14(23):3565-3577.
Ferri KF, Kroemer G. 2001. Mitochondria--the suicide organelles. Bioessays. 23(2):111-115. Feutz AC, Bellomi I, Allinquant B, Schladenhaufen Y, Ghandour MS. 1995. Isolation and
characterization of defective jimpy oligodendrocytes in culture. J Neurocytol. 24:865-877.
Feutz AC, Pham-Dinh D, Allinquant B, Miehe M, Ghandour MS. 2001. An immortalized jimpy oligodendrocyte cell line: defects in cell cycle and cAMP pathway. Glia. 34:241-252.
Fink SL, Cookson BT. 2005. Apoptosis, pyroptosis, and necrosis: mechanistic description of dead and dying eukaryotic cells. Infect Immun. 73(4):1907-1916.
Ford-Hutchinson AW. 1985. Leukotrienes: their formation and role as inflammatory mediators. Fed. Proc. 44:25-29.
Ford-Hutchinson, AW. 1989. Evidence for the involvement of leukotrienes and other lipoxygenase products in disease states. In Leukotrienes and Lipoxygenases. Chemical, Biological and Clinical Aspects. J. Rokach, editor. Elsevier Science Publishing Co., Inc., New York. 405-425.
Forman HJ, Zhang H, Rinna A. 2009. Glutathione: overview of its protective roles, measurement, and biosynthesis. Mol Aspects Med. 30(1-2):1-12.

REFERENCES
245
Forss-Petter S, Werner H, Berger J, Lassmann H, Molzer B, Schwab MH, Bernheimer H, Zimmermann F, Nave KA. 1997. Targeted inactivation of the X-linked adrenoleukodystrophy gene in mice. J Neurosci Res. 50(5):829-843.
Fouquet F, Zhou JM, Ralston E, Murray K, Troalen F, Magal E, Robain O, Dubois-Dalcq M, Aubourg P. 1997. Expression of the adrenoleukodystrophy protein in the human and mouse central nervous system. Neurobiol Dis. 3(4):271-285.
Fourcade S, López-Erauskin J, Galino J, Duval C, Naudi A, Jove M, Kemp S, Villarroya F, Ferrer I, Pamplona R, Portero-Otin M, Pujol A. 2008. Early oxidative damage underlying neurodegeneration in X-adrenoleukodystrophy. Hum Mol Genet. 17(12):1762-1773.
Fourcade S, Ruiz M, Guilera C, Hahnen E, Brichta L, Naudi A, Portero-Otín M, Dacremont G, Cartier N, Wanders R, Kemp S, Mandel JL, Wirth B, Pamplona R, Aubourg P, Pujol A. 2010. Valproic acid induces antioxidant effects in X-linked adrenoleukodystrophy. Hum Mol Genet. 19(10):2005-2014.
Fournier B, Saudubray JM, Benichou B, Lyonnet S, Munnich A, Clevers H, Poll-The BT. 1994. Large deletion of the peroxisomal acyl-CoA oxidase gene in pseudoneonatal adrenoleukodystrophy. J. Clin. Invest. 94(2):526-531.
Fukui M, Zhu BT. 2010. Mitochondrial superoxide dismutase SOD2, but not cytosolic SOD1, plays a critical role in protection against glutamate-induced oxidative stress and cell death in HT22 neuronal cells. Free Radic Biol Med. 48(6):821-830.
Funk CD. 2001. Prostaglandins and leukotrienes: advances in eicosanoid biology. Science. 294(5548):1871-1875.
Furukawa A, Hiraku Y, Oikawa S, Luxford C, Davies MJ, and Kawanishi S. 2005. Guanine-specific DNA damage induced by gamma-irradiated histone. The Biochemical journal. 388:813-818.
G Gao Y. 2010. The multiple actions of NO. Pflugers Arch. 459(6):829-839. Gaposchkin DP, Zoeller RA. 1999. Plasmalogen status influences docosahexaenoic acid
levels in a macrophage cell line. Insights using ether lipid-deficient variants. J Lipid Res. 40(3):495-503.
Geng YJ, Libby P. 1995. Evidence for apoptosis in advanced human atheroma. Colocalization with interleukin-1 beta-converting enzyme. Am J Pathol. 147(2):251-266.
Ghandour S, Feutz AC, Jalabi W, Taleb O, Bessert D, Cypher M, Carlock L, Skoff RP. 2002. Trafficking of PLP/DM20 and cAMP signalling in immortalized jimpy oligodendrocytes. GLIA. 40:300-311.
Gilg AG, Singh AK, Singh I. 2000. Inducible nitric oxide synthase in the central nervous system of patients with X-adrenoleukodystrophy. J Neuropathol Exp Neurol. 59(12):1063-1069.
Gilmore AP. 2005. Anoikis. Cell Death Differ. 2:1473-1477. Girzalsky W, Saffian D, Erdmann R. 2010. Peroxisomal protein translocation. Biochim
Biophys Acta. 1803(6):724-731. Gitsham AM, Burdett K, Tappia PS, Connock MJ, Johnson P. 1989. Enzymes of plasmalogen
biosynthesis in microperoxisomes of guinea-pig intestinal mucosa. Biochem Soc Trans. 17:1074–1075.
Gondcaille C, Depreter M, Fourcade S, Lecca MR, Leclercq S, Martin PG, Pineau T, Cadepond F, ElEtr M, Bertrand N, Beley A, Duclos S, De Craemer D, Roels F, Savary S, Bugaut M. 2005. Phenylbutyrate up-regulates the adrenoleukodystrophy-related gene as a nonclassical peroxisome proliferator. J Cell Biol. 169(1):93-104.
Goodman JM. 2008. The gregarious lipid droplet. J Biol Chem. 283(42):28005-28009.
REFERENCES
246
Gorgas K, Teigler A, Komljenovic D, Just WW. 2006. The ether lipid-deficient mouse: tracking down plasmalogen functions. Biochim Biophys Acta. 1763(12):1511-1526.
Granier LA, Langley K, Leray C, Sarlieve LL. 2000. Phospholipid composition in late infantile neuronal ceroid lipofuscinosis. Eur J Clin Investig. 30:1011-1017.
Green D, Kroemer G. 1998. The central executioners of apoptosis: caspases or mitochondria? Trends Cell Biol. 8(7):267-271.
Green DR, Kroemer G. 2004. The pathophysiology of mitochondrial cell death. Science. 305(5684):626-629.
Griffiths I, Klugmann M, Anderson T, Yool D, Thomson C, Schwab MH, Schneider A, Zimmermann F, McCulloch M, Nadon N, Nave KA. 1998. Axonal swellings and degeneration in mice lacking the major proteolipid of myelin. Science. 280:1610-1613.
Gruber CW, Cemazar M, Heras B, Martin JL, Craik DJ. 2006. Protein disulfide isomerase: the structure of oxidative folding. Trends in biochemical sciences. 31:455-464.
Guardiola F, Codony R, Addis PB, Rafecas M, Boatella J. 1996. Biological effects of oxysterols: current status. Food Chem Toxicol 34(2):193-211.
Guesnet P, Alessandri JM. 2010. Docosahexaenoic acid (DHA) and the developing central nervous system (CNS) - Implications for dietary recommendations. Biochimie. PMID: 20478353.
Gueugnon F, Volodina N, Taouil JE, Lopez TE, Gondcaille C, Grand AS, Mooijer PA, Kemp S, Wanders RJ, Savary S. 2006. A novel cell model to study the function of the adrenoleukodystrophy-related protein. Biochem Biophys Res Commun. 341(1):150-157.
Guicciardi ME, Leist M, Gores GJ. 2004. Lysosomes in cell death. Oncogene. 23(16):2881-2890.
Guimarães CP, Domingues P, Aubourg P, Fouquet F, Pujol A, Jimenez-Sanchez G, Sá-Miranda C, Azevedo JE. 2004. Mouse liver PMP70 and ALDP: homomeric interactions prevail in vivo. Biochim Biophys Acta. 1689(3):235-243.
Gunkel K, van der Klei IJ, Barth G, Veenhuis M. 1999. Selective peroxisome degradation in Yarrowia lipolytica after a shift of cells from acetate/oleate/ethylamine into glucose/ammonium sulfate-containing media. FEBS Lett. 451(1):1-4.
Guo T, Kit YY, Nicaud JM, Le Dall MT, Sears SK, Vali H, Chan H, Rachubinski RA, Titorenko VI. 2003. Peroxisome division in the yeast Yarrowia lipolytica is regulated by a signal from inside the peroxisome. J Cell Biol. 162(7):1255-1266.
Gurvitz A, Rottensteiner H. 2006. The biochemistry of oleate induction : transcriptional upregulation and peroxisome proliferation. Biochim Biophys Acta. 1763(12):1392-1402.
H Halbach A, Lorenzen S, Landgraf C, Volkmer-Engert R, Erdmann R, Rottensteiner H. 2005.
Function of the PEX19-binding site of human adrenoleukodystrophy protein as targeting motif in man and yeast. PMP targeting is evolutionarily conserved. J Biol Chem. 280(22):21176-21182.
Hammarstrom S. 1983. Leukotrienes. Annu Rev Biochem. 52:355-377. Han X, Holtzman DM, McKeel DW. 2001. Plasmalogen deficiency in early Alzheimer’s
disease subjects and in animal models: molecular characterization using electrospray ionization mass spectrometry. J. Neurochem. 77:1168–1180.
Hanson RF, Szczepanik-VanLeeuwen P, Williams GC, Grabowski G, Sharp HL. 1979. Defects of bile acid synthesis in Zellweger's syndrome. Science. 203(4385):1107-1108.
Hardeman D, Van den Bosch H. 1989. Topography of ether phospholipid biosynthesis. Biochim Biophys Acta. 1006:1-8.

REFERENCES
247
Hardy SJ, Ferrante A, Poulos A, Robinson BS, Johnson DW, Murray AW. 1994. Effect of exogenous fatty acids with greater than 22 carbon atoms (very long chain fatty acids) on superoxide production by human neutrophils. J Immunol. 153(4):1754-61.
Hashimoto F, Furuya Y, Hayashi H. 2001. Accumulation of medium chain acyl-CoAs during beta-oxidation of long chain fatty acid by isolated peroxisomes from rat liver. Biol Pharm Bull. 24(6):600-606.
Heales SJ, Bolaños JP, Stewart VC, Brookes PS, Land JM, Clark JB. 1999. Nitric oxide, mitochondria and neurological disease. Biochim Biophys Acta. 1410(2):215-228.
Hein S, Schönfeld P, Kahlert S, Reiser G. 2008. Toxic effects of X-linked adrenoleukodystrophy-associated, very long chain fatty acids on glial cells and neurons from rat hippocampus in culture. Hum Mol Genet. 17(12):1750-1761.
Hettema EH, Distel B, and Tabak HF. 1999. Import of proteins into peroxisomes. Biochim Biophys Acta. 1451(1):17-34.
Hirrlinger J, Resch A, Gutterer JM, Dringen R. 2002. Oligodendroglial cells in culture effectively dispose of exogenous hydrogen peroxide: comparison with cultured neurones, astroglial and microglial cells. J Neurochem. 82(3):635-644.
Ho JK, Moser H, Kishimoto Y, Hamilton JA. 1995. Interactions of a very long chain fatty acid with model membranes and serum albumin. Implications for the pathogenesis of adrenoleukodystrophy. J Clin Invest. 96(3):1455-1463.
Hoepfner D, Schildknegt D, Braakman I, Philippsen P, Tabak HF. 2005. Contribution of the Endoplasmic Reticulum to Peroxisome Formation. Cell. 122: 85-95.
Hu Y, Israelachvili J. 2008. Lateral reorganization of myelin lipid domains by myelin basic protein studied at the air-water interface. Colloids Surf B Biointerfaces. 62(1):22-30.
Hubbard WC, Moser AB, Liu AC, Jones RO, Steinberg SJ, Lorey F, Panny SR, Vogt RF Jr, Macaya D, Turgeon CT, Tortorelli S, Raymond GV. 2009. Newborn screening for X-linked adrenoleukodystrophy (X-ALD): validation of a combined liquid chromatography-tandem mass spectrometric (LC-MS/MS) method. Mol Genet Metab. 97(3):212-220.
Hudspeth MP, Raymond GV. 2007. Immunopathogenesis of adrenoleukodystrophy: current understanding. J Neuroimmunol. 182(1-2):5-12.
Hulshagen L, Krysko O, Bottelbergs A, Huyghe S, Klein R, Van Veldhoven PP, De Deyn PP, D'Hooge R, Hartmann D, Baes M. 2008. Absence of functional peroxisomes from mouse CNS causes dysmyelination and axon degeneration. J Neurosci. 28(15):4015-4027.
Hunt JV, Wolff SP. 1991. The role of histidine residues in the nonenzymic covalent attachment of glucose and ascorbic acid to protein. Free Radic Res Commun. 14(4):279-287.
Hwang JJ, Lee SJ, Kim TY, Cho JH, Koh JY. 2008. Zinc and 4-hydroxy-2-nonenal mediate lysosomal membrane permeabilization induced by H2O2 in cultured hippocampal neurons. J Neurosci. 28(12):3114-3122.
I Igarashi M, Schaumburg HH, Powers J, Kishmoto Y, Kolodny E, Suzuki K. 1976. Fatty acid
abnormality in adrenoleukodystrophy. J Neurochem. 26(4):851-860. Ito M, Blumberg BM, Mock DJ, Goodman AD, Moser AB, Moser HW, Smith KD, Powers
JM. 2001. Potential environmental and host participants in the early white matter lesion of adreno-leukodystrophy: morphologic evidence for CD8 cytotoxic T cells, cytolysis of oligodendrocytes, and CD1-mediated lipid antigen presentation. J Neuropathol Exp Neurol. 60(10):1004-1019.
REFERENCES
248
J Jacob C, Knight I, Winyard PG. 2006. Aspects of the biological redox chemistry of cysteine:
from simple redox responses to sophisticated signalling pathways. Biol Chem. 387:1385-1397.
Janssen A, Gressens P, Grabenbauer M, Baumgart E, Schad A, Vanhorebeek I, Brouwers A, Declercq PE, Fahimi D, Evrard P, Schoonjans L, Collen D, Carmeliet P, Mannaerts G, Van Veldhoven P, Baes M. 2003. Neuronal migration depends on intact peroxisomal function in brain and in extraneuronal tissues. J Neurosci. 23(30):9732-9741.
Jedlitschky G, Huber M, Volkl A, Muller M, Leier I, Mtiller J, Lehmann WD, Fahimi HD, Keppler D. 1991. Peroxisomal degradation of leukotrienes by β-oxidation from the omega-end. J. Biol. Chem. 266:24763-24772.
Jia Z, Pei Z, Li Y, Wei L, Smith KD, Watkins PA. 2004. X-linked adrenoleukodystrophy: role of very long-chain acyl-CoA synthetases. Mol Genet Metab. 83(1-2):117-127.
Johansson AS, Haeggström JZ, Hultenby K, Palmblad J. 2010. Subcellular localization of leukotriene receptors in human endothelial cells. Exp Cell Res. 316(17):2790-2796.
K
Kabeya Y, Mizushima N, Ueno T, Yamamoto A, Kirisako T, Noda T, Kominami E, Ohsumi Y, Yoshimori T. 2000. LC3, a mammalian homologue of yeast Apg8p, is localized in autophagosome membranes after processing. EMBO J. 19(21):5720-5728.
Kamiryo T, Abe M, Okasaki K, Kato S, Shimamoto N. 1982. Absence of DNA in peroxisomes of Candida tropicali. Journal of Bacteriology. 152:269-274.
Kashiwayama Y, Seki M, Yasui A, Murasaki Y, Morita M, Yamashita Y, Sakaguchi M, Tanaka Y, Imanaka T. 2009. 70-kDa peroxisomal membrane protein related protein (P70R/ABCD4) localizes to endoplasmic reticulum not peroxisomes, and NH2-terminal hydrophobic property determines the subcellular localization of ABC subfamily D proteins. Exp Cell Res. 315(2):190-205.
Kassmann CM, Lappe-Siefke C, Baes M, Brügger B, Mildner A, Werner HB, Natt O, Michaelis T, Prinz M, Frahm J, Nave KA. 2007. Axonal loss and neuroinflammation caused by peroxisome-deficient oligodendrocytes. Nat Genet. 39(8):969-976.
Kassmann CM, Nave KA. 2008. Oligodendroglial impact on axonal function and survival - a hypothesis. Curr Opin Neurol. 21(3):235-241.
Kawajiri H, Hsi LC, Kamitani H, Ikawa H, Geller M, Ward T, Eling TE, Glasgow WC. 2002. Arachidonic and linoleic acid metabolism in mouse intestinal tissue: evidence for novel lipoxygenase activity. Arch Biochem Biophys. 398(1):51-60.
Kemp S, Valianpour F, Denis S, Ofman R, Sanders RJ, Mooyer P, Barth PG, Wanders RJ. 2005. Elongation of very long-chain fatty acids is enhanced in X-linked adrenoleukodystrophy. Mol Genet Metab. 84(2):144-151. Erratum in: Mol Genet Metab. 2008. 93(3):350.
Kemp S, Wanders R. 2010. Biochemical aspects of X-linked adrenoleukodystrophy. Brain Pathol. 20(4):831-837.
Kemp S, Wanders RJ. 2007. X-linked adrenoleukodystrophy: very long-chain fatty acid metabolism, ABC half-transporters and the complicated route to treatment. Mol Genet Metab. 90(3):268-276.
Keppler D, Müller M, Klünemann C, Guhlmann A, Krauss K, Müller J, Berger U, Leier I, Mayatepek E. 1992. Transport and in vivo elimination of cysteinyl leukotrienes. Adv Enzyme Regul. 32:107-116.
Keppler D, Huber M, Baumert T, Guhlmann A. 1989. Metabolic inactivation of leukotrienes. Adv. Enzyme Regul. 28:307-319.
REFERENCES
249
Kerr JF, Wyllie AH, Currie AR. 1972. Apoptosis: a basic biological phenomenon with wide-ranging implications in tissue kinetics. Br J Cancer. 26(4):239-257.
Khan M, Pahan K, Singh AK, Singh I. 1998. Cytokine-induced accumulation of very long-chain fatty acids in rat C6 glial cells: implication for X-adrenoleukodystrophy. J Neurochem. 71(1):78-87.
Khan M, Singh J, Gilg AG, Uto T, Singh I. 2010. Very long-chain fatty acid accumulation causes lipotoxic response via 5-lipoxygenase in cerebral adrenoleukodystrophy. J Lipid Res. 51(7):1685-1695.
Khan M, Singh J, Singh I. 2008. Plasmalogen deficiency in cerebral adrenoleukodystrophy and its modulation by lovastatin. J Neurochem. 106(4):1766-1779.
Kim PK, Mullen RT, Schumann U, Lippincott-Schwartz J. 2006. The origin and maintenance of mammalian peroxisomes involves a de novo PEX16-dependent pathway from the ER. J Cell Biol. 173(4):521-532.
Kinnula VL, Crapo JD, Raivio KO. 1995. Generation and disposal of reactive oxygen metabolites in the lung. Lab Invest. 73(1):3-19.
Kitanaka C, Kuchino Y. 1999. Caspase-independent programmed cell death with necrotic Morphology. Cell Death Differ. 6: 508-515.
Klionsky DJ, Emr SD. 2000. Autophagy as a regulated pathway of cellular degradation. Science. 290(5497):1717-1721.
Knazek RA, Rizzo WB, Schulman JD, Dave JR. 1983. Membrane microviscosity is increased in the erythrocytes of patients with adrenoleukodystrophy and adrenomyeloneuropathy. J Clin Invest. 72(1):245-248.
Kobayashi T, Shinnoh N, Kondo A, Yamada T. 1997. Adrenoleukodystrophy protein-deficient mice represent abnormality of very long chain fatty acid metabolism. Biochem Biophys Res Commun. 232(3):631-236.
Koch A, Thiemann M, Grabenbauer M, Yoon Y, McNiven MA, Schrader M. 2003. Dynamin-like protein 1 is involved in peroxisomal fission. J Biol Chem. 278(10):8597-8605.
Kohlschutter A, Schade B, Blomer B, Hubner C. 1993. Low erythrocyte plasmalogen and plasma docosahexaenoic acid (DHA) in juvenile neuronal ceroid-lipofuscinosis (JNCL). J. Inherit. Metab. Dis. 16:299-304.
Kourtis N, Tavernarakis N. 2009. Autophagy and cell death in model organisms. Cell Death Differ. 16(1):21-30.
Kroemer G, Galluzzi L, Vandenabeele P, Abrams J, Alnemri ES, Baehrecke EH, Blagosklonny MV, El-Deiry WS, Golstein P, Green DR, Hengartner M, Knight RA, Kumar S, Lipton SA, Malorni W, Nuñez G, Peter ME, Tschopp J, Yuan J, Piacentini M, Zhivotovsky B, Melino G. 2009. Classification of cell death: recommendations of the Nomenclature Committee on Cell Death. Cell Death Differ. 16(1):3-11.
Kristofikova Z,Kopecky V, Hofbauerova K, Hovorkova P, Rıpova D. 2008. Complex of Amyloid b Peptides with 24-Hydroxycholesterol and Its Effect on Hemicholinium-3 Sensitive Carriers. Neurochem Res 33:412–421
Krysko O, Hulshagen L, Janssen A, Schütz G, Klein R, De Bruycker M, Espeel M, Gressens P, Baes M. 2007. Neocortical and cerebellar developmental abnormalities in conditions of selective elimination of peroxisomes from brain or from liver. J Neurosci Res. 85(1):58-72.
Kuczynski B, Reo NV. 2006. Evidence that plasmalogen is protective against oxidative stress in the rat brain. Neurochem Res. 31:58-72.
Kunau WH. 2005. Peroxisome biogenesis: end of the debate. Curr Biol. 15(18):R774-R776. Kurz T, Gustafsson B, Brunk UT. 2006. Intralysosomal iron chelation protects against
oxidative stress-induced cellular damage. FEBS J. 273(13):3106-3117.

REFERENCES
250
L
Lachtermacher MB, Seuánez HN, Moser AB, Moser HW, Smith KD. 2000. Determination of 30 X-linked adrenoleukodystrophy mutations, including 15 not previously described. Hum Mutat. 15(4):348-353.
Lagarkova MA, Iarovaia OV, Razin SV. 1995. Large-scale fragmentation of mammalian DNA in the course of apoptosis proceeds via excision of chromosomal DNA loops and their oligomers. J Biol Chem. 270(35):20239-20241.
Larsson DA, Baird S, Nyhalah JD, Yuan XM, Li W. 2006. Oxysterol mixtures, in atheroma-relevant proportions, display synergistic and proapoptotic effects. Free Radic Biol Med 41(6):902-10.
Lawson JA, Rokach J, FitzGerald GA. 1999. Isoprostanes: formation, analysis and use as indices of lipid peroxidation in vivo. J Biol Chem. 274:24441–24444.
Lazarow PB. 2003. Peroxisome biogenesis: advances and conundrums. Current Opinion in Cell Biology. 15:489-497.
Lazarow PB, Fujiki Y. 1985. Biogenesis of peroxisomes. Annu Rev Cell Biol. 1:489-530. Lei XG. 2002. In vivo antioxidant role of glutathione peroxidase: evidence from knockout
mice. Methods Enzymol. 347:213-225. Lee SH, Blair IA. 2001. Oxidative DNA damage and cardiovascular disease. Trends
Cardiovasc Med. 11:148–155. Leoni V, Lütjohann D, Masterman T. 2005. Levels of 7-oxocholesterol in cerebrospinal fluid
are more than one thousand times lower than reported in multiple sclerosis. J Lipid Res. 46(2):191-5.
Levine B, Kroemer G. 2009. Autophagy in aging, disease and death: the true identity of a cell death impostor. Cell Death Differ. 16(1):1-2.
Lewis RA, Austen KF. 1984. The biologically active leukotrienes. J Clin Invest. 73:889-897. Leung RK, Whittaker PA. 2005. RNA interference: from gene silencing to gene-specific
therapeutics. Pharmacol Ther. 107(2):222-39. Li W, Hellsten A, Xu LH, Zhuang DM, Jansson K, Brunk UT, Yuan XM. 2005. Foam cell
death induced by 7beta-hydroxycholesterol is mediated by labile iron-driven oxidative injury: mechanisms underlying induction of ferritin in human atheroma. Free Radic Biol Med 39(7):864-75.
Liu X, Kim CN, Yang J, Jemmerson R, Wang X. 1996. Induction of apoptotic program in cell-free extracts: requirement for dATP and cytochrome c. Cell. 86(1):147-157.
Lizard G, Fournel S, Genestier L, Dhedin N, Chaput C, Flacher M, Mutin M, Panaye G, Revillard JP. 1995. Kinetics of plasma membrane and mitochondrial alterations in cells undergoing apoptosis. Cytometry. 21(3):275-283.
Long EK, Picklo MJ Sr. 2010. Trans-4-hydroxy-2-hexenal, a product of n-3 fatty acid peroxidation: make some room HNE. Free Radic Biol Med. 49(1):1-8.
Lorch S, Lightfoot R, Ohshima H, Virág L, Chen Q, Hertkorn C, Weiss M, Souza J, Ischiropoulos H, Yermilov V, Pignatelli B, Masuda M, Szabó C. 2002. Detection of peroxynitrite-induced protein and DNA modifications. Methods Mol Biol. 196:247–275.
Lu JF, Barron-Casella E, Deering R, Heinzer AK, Moser AB, deMesy Bentley KL, Wand GS, C McGuinness M, Pei Z, Watkins PA, Pujol A, Smith KD, Powers JM. 2007. The role of peroxisomal ABC transporters in the mouse adrenal gland: the loss of Abcd2 (ALDR), Not Abcd1 (ALD), causes oxidative damage. Lab Invest. 87(3):261-272.
Lu JF, Lawler AM, Watkins PA, Powers JM, Moser AB, Moser HW, Smith KD. 1997. A mouse model for X-linked adrenoleukodystrophy. Proc Natl Acad Sci. 94(17):9366-9371.

REFERENCES
251
M
Maeba R, Ueta N. 2003a. Ethanolamine plasmalogen and cholesterol reduce the total membrane oxidizability measured by the oxygen uptake method. Biochem Biophys Res Commun. 302(2):265-270.
Maeba R, Ueta N. 2003b. Ethanolamine plasmalogens prevent the oxidation of cholesterol by reducing the oxidizability of cholesterol in phospholipid bilayers. J Lipid Res. 44(1):164-171.
Maier CS, Chavez J, Wang J, Wu J. 2010. Protein adducts of aldehydic lipid peroxidation products identification and characterization of protein adducts using an aldehyde/keto-reactive probe in combination with mass spectrometry. Methods Enzymol. 473:305-330.
Majno G, Joris I. 1995. Apoptosis, oncosis, and necrosis. An overview of cell death. Am J Pathol. 146(1):3-15.
Makkar RS, Contreras MA, Paintlia AS, Smith BT, Haq E, Singh I. 2006. Molecular organization of peroxisomal enzymes: protein-protein interactions in the membrane and in the matrix. Arch Biochem Biophys. 451(2):128-140.
Malvitte L, Montange T, Vejux A, Joffre C, Bron A, Creuzot-Garcher C, Lizard G. 2008. Activation of a caspase-3-independent mode of cell death associated with lysosomal destabilization in cultured human retinal pigment epithelial cells (ARPE-19) exposed to 7beta-hydroxycholesterol. Curr Eye Res. 33(9):769-781.
Marnett LJ. 1999. Lipid peroxidation-DNA damage by malondialdehyde. Mutat Res. 424(1-2):83-95.
Marques C, Pereira P, Taylor A, Liang JN, Reddy VN, Szweda LI, Shang F. 2004. Ubiquitin-
dependent lysosomal degradation of the HNE-modified proteins in lens epithelial cells. FASEB J. 18(12):1424-1426.
Massaad CA, Klann E. 2010. Reactive Oxygen Species in the Regulation of Synaptic Plasticity and Memory. Antioxid Redox Signal. In Press. PMID: 20649473
Massey JB, Pownall HJ. 2005. Role of oxysterol structure on the microdomain-induced microsolubilization of phospholipid membranes by apolipoprotein A-I. Biochemistry 44(43):14376-84.
Mayatepek E, Baumann M, Meissner T, Hanefeld F, Korenke GC. 2003. Role of leukotrienes as indicators of the inflammatory demyelinating reaction in x-linked cerebral adrenoleukodystrophy. J Neurol. 250(10):1259-1260.
Mayatepek E, Lehmann WD, Fauler J, Tsikas D, Frolich JC, Schutgens RB, Wanders RJ, Keppler D. 1993. Impaired Degradation of Leukotrienes in Patients with Peroxisome Deficiency Disorders. J. Clin. Invest. 91:881-888.
Mayatepek E, Tiepelmann B. 1996. Defective degradation of leukotrienes in peroxisomal-deficient human hepatocytes. Biochem Biophys Res Commun. 227(1):131-134.
McCracken E, Valeriani V, Simpson C, Jover T, McCulloch J, Dewar D. 2000. The lipid peroxidation by-product 4-hydroxynonenal is toxic to axons and oligodendrocytes. J Cereb Blood Flow Metab. 20(11):1529-1536.
McEvoy L, Schlegel RA, Williamson P, Del Buono BJ. 1988. Merocyanine 540 as a flow cytometric probe of membrane lipid organization in leukocytes. J Leukoc Biol. 44(5):337-344.
McGuinness MC, Powers JM, Bias WB, Schmeckpeper BJ, Segal AH, Gowda VC, Wesselingh SL, Berger J, Griffin DE, Smith KD. 1997. Human leukocyte antigens and

REFERENCES
252
cytokine expression in cerebral inflammatory demyelinative lesions of X-linked adrenoleukodystrophy and multiple sclerosis. J Neuroimmunol. 75(1-2):174-182.
Meier P, Finch A, Evan G. 2000. Apoptosis in development. Nature. 407:796-801. Melino G. 2001. The Sirens' song. Nature. 412(6842):23. Michels PA, Moyersoen J, Krazy H, Galland N, Herman MHannaert V. 2005. Peroxisomes,
glyoxysomes and glycosomes. Mol Membr Biol. 22(1-2):133-145. Miguet-Alfonsi C, Prunet C, Monier S, Bessède G, Lemaire-Ewing S, Berthier A, Ménétrier
F, Néel D, Gambert P, Lizard G. 2002. Analysis of oxidative processes and of myelin figures formation before and after the loss of mitochondrial transmembrane potential during 7beta-hydroxycholesterol and 7-ketocholesterol-induced apoptosis: comparison with various pro-apoptotic chemicals. Biochem Pharmacol 64(3):527-41.
Miyazawa S, Hashimoto T, Yokota S. 1985. Identity of long-chain acyl-coenzyme A synthetase of microsomes, mitochondria, and peroxisomes in rat liver. J Biochem. 98(3):723-733.
Molina-Holgado E, Vela JM, Arévalo-Martín A, Guaza C. 2001. LPS/IFN-gamma cytotoxicity in oligodendroglial cells: role of nitric oxide and protection by the anti-inflammatory cytokine IL-10. Eur J Neurosci. 13(3):493-502.
Morita M, Kanai M, Mizuno S, Iwashima M, Hayashi T, Shimozawa N, Suzuki Y, Imanaka T. 2008. Baicalein 5,6,7-trimethyl ether activates peroxisomal but not mitochondrial fatty acid beta-oxidation. J Inherit Metab Dis. 31(3):442-449.
Morita M, Takahashi I, Kanai M, Okafuji F, Iwashima M, Hayashi T, Watanabe S, Hamazaki T, Shimozawa N, Suzuki Y, Furuya H, Yamada T, Imanaka T. 2005. Baicalein 5,6,7-trimethyl ether, a flavonoid derivative, stimulates fatty acid beta-oxidation in skin fibroblasts of X-linked adrenoleukodystrophy. FEBS Lett. 579(2):409-414.
Mormone E, Matarrese P, Tinari A, Cannella M, Maglione V, Farrace MG, Piacentini M, Frati L, Malorni W, Squitieri F. 2006. Genotype-dependent priming to self- and xeno-cannibalism in heterozygous and homozygous lymphoblasts from patients with Huntington's disease. J Neurochem. 98(4):1090-1099.
Moser HW. 1997. Adrenoleukodystrophy: phenotype, genetics, pathogenesis and therapy. Brain. 120:1485-1508.
Moser HW, Fatemi A, Zackowski K, Smith S, Golay X, Muenz L, Raymond G. 2004. Evaluation of therapy of X-linked adrenoleukodystrophy. Neurochemical research. 29(5):1003-1016.
Moser HW, Moser AB, Frayer KK, Chen W, Schulman JD, O'Neill BP, Kishimoto Y. 1998. Adrenoleukodystrophy: increased plasma content of saturated very long chain fatty acids. Neurology. 51(2):334-343.
Moser HW, Raymond GV, Dubey P. 2005. Adrenoleukodystrophy: new approaches to a neurodegenerative disease. JAMA. 294(24):3131-3134.
Mosser J, Douar AM, Sarde CO, Kioschis P, Feil R, Moser H, Poustka AM, Mandel JL, Aubourg P. 1993. Putative X-linked adrenoleukodystrophy gene shares unexpected homology with ABC transporters. Nature. 361(6414):726-730.
Mullen RT, Flynn CR, Trelease RN. 2001. How are peroxisomes formed? The role of the endoplasmic reticulum and peroxins. Trends Plant Sci. 6(6):256-261.
Munafó DB, Colombo MI. 2001. A novel assay to study autophagy: regulation of autophagosome vacuole size by amino acid deprivation. J Cell Sci. 114(Pt 20):3619-3629.
Murphy RC, Hammarstrom S, Samuelsson B. 1979. Leukotriene C: a slow-reacting substance from murine mastocytoma cells. Proc Nati Acad Sci. USA. 76:4275-4279.
Mytilineou C, Kramer BC, Yabut JA. 2002. Glutathione depletion and oxidative stress. Parkinsonism Relat Disord. 8(6):385-387.

REFERENCES
253
N Nagan N, Zoeller RA. 2001. Plasmalogens: biosynthesis and functions. Prog Lipid Res.
40(3):199-229. Nakamura A, Kawakami K, Kametani F, Nakamoto H, Goto S. 2010. Biological significance
of protein modifications in aging and calorie restriction. Ann N Y Acad Sci. 1197:33-39.
Narala VR, Adapala RK, Suresh MV, Brock TG, Peters-Golden M, Reddy RC. 2010. Leukotriene B4 is a physiologically relevant endogenous peroxisome proliferator-activated receptor-alpha agonist. J Biol Chem. 285(29):22067-22074.
Nave KA. 1994. Neurological mouse mutants and the genes of myelin. J Neurosci Res. 38:607-612.
Neuspiel M, Schauss AC, Braschi E, Zunino R, Rippstein P, Rachubinski RA, Andrade-Navarro MA, McBride HM. 2008. Cargo-selected transport from the mitochondria to peroxisomes is mediated by vesicular carriers. Curr Biol. 18:102–108.
Nilsson C, Johansson U, Johansson AC, Kågedal K, Ollinger K. 2006. Cytosolic acidification and lysosomal alkalinization during TNF-alpha induced apoptosis in U937 cells. Apoptosis. 11(7):1149-1159.
Novikoff AB, and Shin WY. 1964. The endoplasmic reticulum in the golgi zone and its relations to microbodies, golgi apparatus and autophagic vacuoles in rat liver cells. J Microsc. 3:187-206.
O Oaxaca-Castillo D, Andreoletti P, Vluggens A, Yu S, van Veldhoven PP, Reddy JK,
Cherkaoui-Malki M. 2007. Biochemical characterization of two functional human liver acyl-CoA oxidase isoforms 1a and 1b encoded by a single gene. Biochem Biophys Res Commun. 360(2):314-319.
Oezen I, Rossmanith W, Forss-Petter S, Kemp S, Voigtländer T, Moser-Thier K, Wanders RJ, Bittner RE, Berger J. 2005. Accumulation of very long-chain fatty acids does not affect mitochondrial function in adrenoleukodystrophy protein deficiency. Hum Mol Genet. 14(9):1127-1137.
Ofman R, Dijkstra IM, van Roermund CW, Burger N, Turkenburg M, van Cruchten A, van Engen CE, Wanders RJ, Kemp S. 2010. The role of ELOVL1 in very long-chain fatty acid homeostasis and X-linked adrenoleukodystrophy. EMBO Mol Med. 2(3):90-97.
Ohsumi Y. 2001. Molecular dissection of autophagy: two ubiquitin-like systems. Nat Rev Mol Cell Biol. 2:211-216.
Orrenius S, Zhivotovsky B, Nicotera P. 2003. Regulation of cell death: the calcium-apoptosis link. Nat Rev Mol Cell Biol. 4(7):552-565.
P Paintlia AS, Gilg AG, Khan M, Singh AK, Barbosa E, Singh I. 2003. Correlation of very long
chain fatty acid accumulation and inflammatory disease progression in childhood X-ALD: implications for potential therapies. Neurobiol Dis. 14(3):425-439.
Pamplona R, Dalfó E, Ayala V, Bellmunt MJ, Prat J, Ferrer I, Portero-Otín M. 2005. Proteins in human brain cortex are modified by oxidation, glycoxidation, and lipoxidation. Effects of Alzheimer disease and identification of lipoxidation targets. J Biol Chem. 280(22):21522-21530.
Parrish J, Li L, Klotz K, Ledwich D, Wang X, Xue D. 2001. Mitochondrial endonuclease G is important for apoptosis in C. elegans. Nature. 412(6842):90-94.

REFERENCES
254
Paruchuri S, Jiang Y, Feng C, Francis SA, Plutzky J, Boyce JA. 2008. Leukotriene E4 activates peroxisome proliferator-activated receptor gamma and induces prostaglandin D2 generation by human mast cells. J Biol Chem. 283(24):16477-16487.
Peters C, Charnas LR, Tan Y, Ziegler RS, Shapiro EG, DeFor T, Grewal SS, Orchard PJ, Abel SL, Goldman AI, Ramsay NK, Dusenbery KE, Loes DJ, Lockman LA, Kato S, Aubourg PR, Moser HW, Krivit W. 2004. Cerebral X-linked adrenoleukodystrophy: the international hematopoietic cell transplantation experience from 1982 to 1999. Blood. 104(3):881-888. Erratum in: Blood. 2004. 104(13):3857.
Petroni A, Cappa M, Carissimi R, Blasevich M, Uziel G. 2007. Effect of testosterone metabolites on ABC half-transporter relative gene expression in X-linked adrenoleukodystrophy. J Inherit Metab Dis. 30(5):828.
Pettus BJ, Baes M, Busman M, Hannun YA, Van Veldhoven PP. 2004. Mass spectrometric analysis of ceramide perturbations in brain and fibroblasts of mice and human patients with peroxisomal disorders. Rapid Commun Mass Spectrom. 18(14):1569-1574.
Pillai BK, Jasuja R, Simard JR, Hamilton JA. 2009. Fast diffusion of very long chain saturated fatty acids across a bilayer membrane and their rapid extraction by cyclodextrins: implications for adrenoleukodystrophy. J Biol Chem. 284(48):33296-33304.
Platta HW, Erdmann R. 2007. Peroxisomal dynamics. Trends cell biol. 17(10):474-484. Powers JM, Moser HW. 1998. Peroxisomal disorders: genotype, phenotype, major
neuropathologic lesions, and pathogenesis. Brain Pathol. 8(1):101-120. Powers JM, Liu Y, Moser AB, Moser HW. 1992. The inflammatory myelinopathy of adreno-
leukodystrophy: cells, effector molecules, and pathogenetic implications. J Neuropathol Exp Neurol. 51(6):630-643.
Powers JM, Pei Z, Heinzer AK, Deering R, Moser AB, Moser HW, Watkins PA, Smith KD. 2005. Adreno-leukodystrophy: oxidative stress of mice and men. J Neuropathol Exp Neurol. 64(12):1067-1079.
Prunet C, Lemaire-Ewing S, Ménétrier F, Néel D, Lizard G. 2005. Activation of caspase-3-dependent and -independent pathways during 7-ketocholesterol- and 7beta-hydroxycholesterol-induced cell death: a morphological and biochemical study. J Biochem Mol Toxicol. 19(5):311-326.
Pujol A, Ferrer I, Camps C, Metzger E, Hindelang C, Callizot N, Ruiz M, Pàmpols T, Giròs M, Mandel JL. 2004. Functional overlap between ABCD1 (ALD) and ABCD2 (ALDR) transporters: a therapeutic target for X-adrenoleukodystrophy. Hum Mol Genet. 13(23):2997-3006.
Pujol A, Hindelang C, Callizot N, Bartsch U, Schachner M, Mandel JL. 2002. Late onset neurological phenotype of the X-ALD gene inactivation in mice: a mouse model for adrenomyeloneuropathy. Hum Mol Genet. 11(5):499-505.
Purdue PE, Lazarow PB. 2001. Peroxisome Biogenesis. Annu Rev Cell Dev Biol. 17:701-752.
R Radak Z, Boldogh I. 2010. 8-Oxo-7,8-dihydroguanine: links to gene expression, aging, and
defense against oxidative stress. Free Radic Biol Med. 49(4):587-596. Raff MC, Whitmore AV, Finn JT. 2002. Axonal self-destruction and neurodegeneration.
Science. 296(5569):868-871. Rahman I, Biswas SK, Kode A. 2006. Oxidant and antioxidant balance in the airways and
airway diseases. Eur J Pharmacol. 533:222-239.

REFERENCES
255
Raymond GV, Seidman R, Monteith TS, Kolodny E, Sathe S, Mahmood A, Powers JM. 2010. Head trauma can initiate the onset of adreno-leukodystrophy. J Neurol Sci. 290(1-2):70-74.
Reddy TS, Horrocks LA. 1982. Effects of neonatal undernutrition on the lipid composition of gray matter and white matter in rat brain. J. Neurochem. 38(3):601-605.
Repnik U, Turk B. 2010. Lysosomal-mitochondrial cross-talk during cell death. Mitochondrion. PMID:20696281.
Rhodin J. 1954. Correlation of ultrastructure organization and function in normal and experimentally changed proximal convoluted tubule cells of the mouse kidney. Karolinska Institute, Stockholm.
Rönicke S, Kruska N, Kahlert S, Reiser G. 2009. The influence of the branched-chain fatty acids pristanic acid and Refsum disease-associated phytanic acid on mitochondrial functions and calcium regulation of hippocampal neurons, astrocytes, and oligodendrocytes. Neurobiol Dis. 36(2):401-410.
Rothstein JD. 2009. Current hypotheses for the underlying biology of amyotrophic lateral
sclerosis. Ann. Neurol. 65 Suppl 1:S3-S9. Roussi S, Gossé F, Aoudé-Werner D, Zhang X, Marchioni E, Geoffroy P, Miesch M, Raul F.
2007. Mitochondrial perturbation, oxidative stress and lysosomal destabilization are involved in 7beta-hydroxysitosterol and 7beta-hydroxycholesterol triggered apoptosis in human colon cancer cells. Apoptosis. 12(1):87-96.
Royer MC, Lemaire-Ewing S, Desrumaux C, Monier S, Pais de Barros JP, Athias A, Néel D, Lagrost L. 2009. 7-ketocholesterol incorporation into sphingolipid/cholesterol-enriched (lipid raft) domains is impaired by vitamin E: a specific role for alpha-tocopherol with consequences on cell death. J Biol Chem. 284(23):15826-15834.
Russel DW. 2003. The enzymes, regulation, and genetics of bile acid synthesis. Annu Rev Biochem. 72:137-174.
S Sakai Y, Oku M, van der Klei IJ, Kiel JA. 2006. Pexophagy: autophagic degradation of
peroxisomes. Biochim Biophys Acta. 1763(12):1767-1775. Sala A, Folco G, Murphy RC. 2010. Transcellular biosynthesis of eicosanoids. Pharmacol
Rep. 62(3):503-510. Salmon AB, Richardson A, Pérez VI. 2010. Update on the oxidative stress theory of aging:
does oxidative stress play a role in aging or healthy aging? Free Radic Biol Med. 48(5):642-655.
Samuelsson B, Dahlen SE, Lindgren JA, Rouzer CA, Serhan CN. 1987. Leukotrienes and lipoxins: structures, biosynthesis, and biological effects. Science. 237:1171-1176.
Sayre LM, Lin D, Yuan Q, Zhu X, Tang X. 2006. Protein adducts generated from products of lipid oxidation: focus on HNE and one. Drug Metab Rev. 38(4):651-675.
Schlüter A, Fourcade S, Domènech-Estévez E, Gabaldón T, Huerta-Cepas J, Berthommier G, Ripp R, Wanders RJ, Poch O, Pujol A. 2007. PeroxisomeDB: a database for the peroxysomal proteome, functional genomics and disease Nucleic Acids Res. 35, D815-D822.
Schotte P, Schauvliege R, Janssens S, Beyaert R. 2001. The cathepsin B inhibitor z-FA.fmk inhibits cytokine production in macrophages stimulated by lipopolysaccharide. J Biol Chem. 276(24):21153-21157.
Schrader M, Fahimi HD. 2004. Mammalian peroxisomes and reactive oxygen species. Histochem Cell Biol. 122(4):383-393.

REFERENCES
256
Schrader M, Fahimi HD. 2006. Peroxisomes and oxidative stress. Biochim Biophys Acta. 1763(12):1755-1766.
Schrader M, and Fahimi HD. 2008. The peroxisome: still a mysterious organelle. Histochem Cell Biol. 129(4):421-440.
Schrader M, Reuber BE, Morrell JC, Jimenez-Sanchez G, Obie C, Stroh TA, Valle D, Schroer TA, Gould SJ. 1998. Expression of PEX11beta mediates peroxisome proliferation in the absence of extracellular stimuli. J Biol Chem. 273(45):29607-29614.
Schrader M, Yoon Y. 2007. Mitochondria and peroxisomes: are the ‘big brother’ and the ‘little sister’ closer than assumed? Bioessays. 29:1105-1114.
Schrakamp G, Schutgens RB, Wanders RJ, Heymans HS, Tager JM, Van den Bosch H. 1985. The cerebro-hepato-renal (Zellweger) syndrome. Impaired de novo biosynthesis of plasmalogens in cultured skin fibroblasts. Biochim Biophys Acta. 833:170-174.
Schroepfer GJ Jr. 2000. Oxysterols: modulators of cholesterol metabolism and other processes. Physiol Rev 80(1):361-554.Schumann U, Subramani S. 2008. Special delivery from mitochondria to peroxisomes. Trends Cell Biol. 18(6):253-256.
Scott RC, Juhász G, Neufeld TP. 2007. Direct induction of autophagy by Atg1 inhibits cell growth and induces apoptotic cell death. Curr Biol. 17(1):1-11.
Sedelnikova OA, Redon CE, Dickey JS, Nakamura AJ, Georgakilas AG, Bonner WM. 2010. Role of oxidatively induced DNA lesions in human pathogenesis. Mutat Res. 704(1-3):152-159.
Seet RC, Lee CY, Lim EC, Tan JJ, Quek AM, Chong WL, Looi WF, Huang SH, Wang H, Chan YH, Halliwell B. (2010) Oxidative damage in Parkinson disease: Measurement using accurate biomarker. Free Radic. Biol. Med. 48:560-566.
Shapiro E, Krivit W, Lockman L, Jambaqué I, Peters C, Cowan M, Harris R, Blanche S, Bordigoni P, Loes D, Ziegler R, Crittenden M, Ris D, Berg B, Cox C, Moser H, Fischer A, Aubourg P. 2000. Long-term effect of bone-marrow transplantation for childhood-onset cerebral X-linked adrenoleukodystrophy. Lancet. 356(9231):713-718.
Sies H. 1997. Oxidative stress: oxidants and antioxidants. Exp Physiol. 82(2):291-295. Simonian NA, and Coyle JT. 1996. Oxidative stress in neurodegenerative diseases. Annual
Annu Rev Pharmacol Toxicol. 36:83-106. Singh H, Beckman K, Poulos A. 1993. Exclusive localization in peroxisomes of
dihydroxyacetone phosphate acyltransferase and alkyl-dihydroxyacetone phosphate synthase in rat liver. J Lipid Res. 34:467-477.
Singh I, Pujol A. 2010. Pathomechanisms underlying X-adrenoleukodystrophy: a three-hit hypothesis. Brain Pathol. 20(4):838-844.
Singh J, Khan M, Singh I. 2009. Silencing of Abcd1 and Abcd2 genes sensitizes astrocytes for inflammation: implication for X-adrenoleukodystrophy. J Lipid Res. 50(1):135-147.
Singh R, Kaushik S, Wang Y, Xiang Y, Novak I, Komatsu M, Tanaka K, Cuervo AM, Czaja MJ. 2009. Autophagy regulates lipid metabolism. Nature. 458(7242):1131-1135.
Singh R. 2010. Autophagy and regulation of lipid metabolism. Results Probl Cell Differ. 52:35-46.
Smith KD, Kemp S, Braiterman LT, Lu JF, Wei HM, Geraghty M, Stetten G, Bergin JS, Pevsner J, Watkins PA. 1999. X-linked adrenoleukodystrophy: genes, mutations, and phenotypes. Neurochem Res. 24(4):521-535.
Smith MA, Perry G. 1995. Free radical damage, iron, and Alzheimer's disease. J Neurol Sci. 134 Suppl:92-94.
Sperandio S, de Belle I, Bredesen DE. 2000. An alternative, nonapoptotic form of programmed cell death. Proc Natl Acad Sci USA. 97(26):14376-14381.
REFERENCES
257
Sprinkle TJ. 1989. 2',3'-cyclic nucleotide 3'-phosphodiesterase, an oligodendrocyte-Schwann cell and myelin-associated enzyme of the nervous system. Crit Rev Neurobiol. 4(3):235-301.
Stadtman ER, Starke-Reed PE, Oliver CN, Carney JM, Floyd RA. 1992. Protein modification in aging. EXS. 62:64-72.
Stadtman ER. 1992. Protein oxidation and aging. Science. 257(5074):1220-1224. Stefanis L, Larsen KE, Rideout HJ, Sulzer D, Greene LA. 2001. Expression of A53T mutant
but not wild-type alpha-synuclein in PC12 cells induces alterations of the ubiquitin-dependent degradation system, loss of dopamine release, and autophagic cell death. J Neurosci. 21(24):9549-9560.
Steinberg SJ, Kemp S, Braiterman LT, Watkins PA. 1999 Role of very-long-chaine acyl-coenzyme A synthetase in X-linked adrenoleukodystrophy. Ann Neurol. 46(3):409-412.
Stolz DB, Zamora R, Vodovotz Y, Loughran PA, Billiar TR, Kim YM, Simmons RL, Watkins SC. 2002. Peroxisomal localization of inducible nitric oxide synthase in hepatocytes. Hepatology. 36(1):81-93.
Susin SA, Lorenzo HK, Zamzami N, Marzo I, Snow BE, Brothers GM, Mangion J, Jacotot E, Costantini P, Loeffler M, Larochette N, Goodlett DR, Aebersold R, Siderovski DP, Penninger JM, Kroemer G. 1999. Molecular characterization of mitochondrial apoptosis-inducing factor. Nature. 397(6718):441-446.
T Tanaka AR, Tanabe K, Morita M, Kurisu M, Kasiwayama Y, Matsuo M, Kioka N, Amachi T,
Imanaka T, Ueda K. 2002. ATP binding/hydrolysis by and phosphorylation of peroxisomal ATP-binding cassette proteins PMP70 (ABCD3) and adrenoleukodystrophy protein (ABCD1). J Biol Chem. 277(42):40142-40147.
Tang PS, Mura M, Seth R, Liu M. 2008. Acute lung injury and cell death: how many ways can cells die? Am J Physiol Lung Cell Mol Physiol. 294(4):L632-L641.
Tardy C, Codogno P, Autefage H, Levade T, Andrieu-Abadie N. 2006. Lysosomes and lysosomal proteins in cancer cell death (new players of an old struggle). Biochim Biophys Acta. 1765(2):101-125.
Taylor CM, Marta CB, Claycomb RJ, Han DK, Rasband MN, Coetzee T, Pfeiffer SE. 2004. Proteomic mapping provides powerful insights into functional myelin biology. Proc Natl Acad Sci U S A. 101(13):4643-8. Terman A, Gustafsson B, Brunk UT. 2006. The lysosomal-mitochondrial axis theory of
postmitotic aging and cell death. Chem Biol Interact. 163(1-2):29-37. Thompson CB. 1995. Apoptosis in the pathogenesis and treatment of disease. Science.
267(5203):1456-1462. Thoms S, Erdmann R. 2005. Dynamin-related proteins and Pex11 proteins in peroxisome
division and proliferation. FEBS J. 272(20):5169-5181. Thoms S, Grønborg S, Gärtner J. 2009. Organelle interplay in peroxisomal disorders. Trends
Mol Med. 15(7):293-302. Titorenko VI, Rachubinski RA. 1998. The endoplasmic reticulum plays an essential role in
peroxisome biogenesis. Trends Biochem Sci. 23(7):231-233. Titorenko VI, Rachubinski RA. 2001. The life cycle of the peroxisome. Nat Rev Mol Cell
Biol. 2(5):357-368. Tran EH, Hardin-Pouzet H, Verge G, Owens T. 1997. Astrocytes and microglia express
inducible nitric oxide synthase in mice with experimental allergic encephalomyelitis. J Neuroimmunol. 74(1-2):121-129.
Turk B, Turk V. 2009. Lysosomes as "suicide bags" in cell death: myth or reality? J Biol Chem. 284(33):21783-21787.

REFERENCES
258
U Uto T, Contreras MA, Gilg AG, Singh I. 2008. Oxidative imbalance in nonstimulated X-
adrenoleukodystrophy-derived lymphoblasts. Dev Neurosci. 30(6):410-418.
V Vachhani R, Olds G, Velanovich V. 2009. Esomeprazole: a proton pump inhibitor. Expert
Rev Gastroenterol Hepatol. 3(1):15-27. Vakifahmetoglu H, Olsson M, Zhivotovsky B. 2008. Death through a tragedy: mitotic
catastrophe. Cell Death Differ. 15(7):1153-1162. Valianpour F, Selhorst JJ, van Lint LE, van Gennip AH, Wanders RJ, Kemp S. 2003.
Analysis of very long-chain fatty acids using electrospray ionization mass spectrometry. Mol Genet Metab. 79(3):189-196.
Valko M, Izakovic M, Mazur M, Rhodes CJ, Telser J. 2004. Role of oxygen radicals in DNA damage and cancer incidence. Mol Cell Biochem. 266(1-2):37-56.
Valko M, Leibfritz D, Moncol J, Cronin MT, Mazur M, Telser J. 2007. Free radicals and antioxidants in normal physiological functions and human disease. Int J Biochem Cell Biol. 39(1):44-84.
Valko M, Rhodes CJ, Moncol J, Izakovic M, Mazur M. 2006. Free radicals, metals and antioxidants in oxidative stress-induced cancer. Chem Biol Interact. 160(1):1-40.
Van der Klei IJ, Veenhuis M. 2002. Peroxisomes: flexible and dynamic organelles. Curr Opin Cell Biol. 14:500-505.
Van der Klei IJ, Veenhuis M. 1997. Yeast peroxisomes: function and biogenesis of a versatile cell organelle. Trends Microbiol. 5:502-509.
Van der Valk P, Gille JJ, Oostra AB, Roubos EW, Sminia T, and Joenje H. 1985. Characterization of an oxygen-tolerant cell line derived from Chinese hamster ovary. Antioxygenic enzyme levels and ultrastructural morphometry of peroxisomes and mitochondria. Cell Tissue Res. 239:61-68.
Van Roermund CW, Visser WF, Ijlst L, van Cruchten A, Boek M, Kulik W, Waterham HR, Wanders RJ. 2008. The human peroxisomal ABC half transporter ALDP functions as a homodimer and accepts acyl-CoA esters. FASEB J. 22(12):4201-4208.
Varanasi U, Chu R, Chu S, Espinosa R, LeBeau MM, Reddy JK. 1994. Isolation of the human peroxysomal acyl-CoA oxidase gene : organization, promoter analysis, and chromosomal localization. Proc natl Acad Sci USA. 91:3107-3111.
Vargas CR, Wajner M, Sirtori LR, Goulart L, Chiochetta M, Coelho D, Latini A, Llesuy S, Bello-Klein A, Giugliani R, Deon M, Mello CF. 2004. Evidence that oxidative stress is increased in patients with X-linked adrenoleukodystrophy. Biochim Biophys Acta. 1688(1):26-32.
Vejux A, Kahn E, Dumas D, Bessède G, Ménétrier F, Athias A, Riedinger JM, Frouin F, Stoltz JF, Ogier-Denis E, Todd-Pokropek A, Lizard G. 2005. 7-Ketocholesterol favors lipid accumulation and colocalizes with Nile Red positive cytoplasmic structures formed during 7-ketocholesterol-induced apoptosis: analysis by flow cytometry, FRET biphoton spectral imaging microscopy, and subcellular fractionation. Cytometry A 64(2):87-100.
Vejux A, Lizard G. 2009. Cytotoxic effects of oxysterols associated with human diseases: Induction of cell death (apoptosis and/or oncosis), oxidative and inflammatory activities, and phospholipidosis. Mol Aspects Med. 30(3):153-170.
Vejux A, Malvitte L, Lizard G. 2008. Side effects of oxysterols: cytotoxicity, oxidation, inflammation, and phospholipidosis. Braz J Med Biol Res 41(7):545-56.

REFERENCES
259
Verity AM, Bredesen D, Vonderscher C, Handeley VW, Campagnoni AT. 1993. Expression of myelin protein genes and other myelin components in an oligodendrocytic cell line conditionally immortalized with a temperature-sensitive retrovirus. J Neurochem. 60:577-587.
Vicencio JM, Galluzzi L, Tajeddine N, Ortiz C, Criollo A, Tasdemir E, Morselli E, Ben Younes A, Maiuri MC, Lavandero S, Kroemer G. 2008. Senescence, apoptosis or autophagy? When a damaged cell must decide its path. Gerontology. 54(2):92-99.
Visser WF, Van Roermund CW, Ijlst L, Waterham HR, Wanders RJ. 2007. Metabolite transport across the peroxisomal membrane. Biochem J. 401(2):365-375.
Vlasits J, Jakopitsch C, Bernroitner M, Zamocky M, Furtmüller PG, Obinger C. 2010. Mechanisms of catalase activity of heme peroxidases. Arch Biochem Biophys. 500(1):74-81.
Vluggens A, Andreoletti P, Viswakarma N, Jia Y, Matsumoto K, Kulik W, Khan M, Huang J, Guo D, Yu S, Sarkar J, Singh I, Rao MS, Wanders RJA, Reddy JK, Cherkaoui-Malki M. 2010. Reversal of mouse Acyl-CoA oxidase 1 (ACOX1) Null Phenotype by human ACOX1b isoform. Lab Invest. 90(5):696-708.
W Wahli W, Braissant O, Desvergne B. 1995. Peroxisome proliferator activated receptors:
transcriptional regulators of adipogenesis, lipid metabolism and more. Chem Biol. 2(5):261-266.
Wanders RJ, Waterham HR. 2006a. Biochemistry of mammalian peroxisomes revisited. Annu Rev Biochem. 75:295-332.
Wanders RJ, Waterham HR. 2006b Peroxisomal disorders: The single peroxisomal enzyme deficiencies. Biochim Biophys Acta. 1763:1707-1720.
Wanders RJ, Ferdinandusse S, Brites P, Kemp S. 2010. Peroxisomes, lipid metabolism and lipotoxicity. Biochim Biophys Acta. 1801(3):272-80.
Wanders RJ, van Roermund CW, van Wijland MJ, Heikoop J, Schutgens RB, Schram AW, Tager JM, van den Bosch H, Poll-Thé BT, Saudubray JM, et al. 1987. Peroxisomal very long-chain fatty acid beta-oxidation in human skin fibroblasts: activity in Zellweger syndrome and other peroxisomal disorders. Clin Chim Acta. 166(2-3):255-263.
Wang J, Megha, London E. 2004. Relationship between sterol/steroid structure and participation in ordered lipid domains (lipid rafts): implications for lipid raft structure and function. Biochemistry. 43(4):1010-1018.
Watkins BA, Seifert MF. 2000. Conjugated linoleic acid and bone biology. J Am Coll Nutr 19(4):478S-486S
Watkins PA. 1997. Fatty acid activation. Prog Lipid Res. 36 (1):55-83. Watkins PA, Howard AE, Gould SJ, Avigan J, Mihalik SJ. 1996. Phytanic acid activation in
rat liver peroxisomes is catalyzed by long-chain acyl-CoA synthetase. J Lipid Res. 37(11):2288-2295.
Weinhofer I, Forss-Petter S, Kunze M, Zigman M, Berger J. 2005. X-linked adrenoleukodystrophy mice demonstrate abnormalities in cholesterol metabolism. FEBS Lett 579(25):5512-5516.
Weinhofer I, Forss-Petter S, Zigman M, Berger J. 2002. Cholesterol regulates ABCD2 expression: implications for the therapy of X-linked adrenoleukodystrophy. Hum Mol Genet 11(22):2701-8.
Whitcomb RW, Linehan WM, Knazek RA. 1988. Effects of long-chain, saturated fatty acids on membrane microviscosity and adrenocorticotropin responsiveness of human adrenocortical cells in vitro. J Clin Invest. 81(1):185-188.
REFERENCES
260
Willingham SB, Bergstralh DT, O'Connor W, Morrison AC, Taxman DJ, Duncan JA, Barnoy S, Venkatesan MM, Flavell RA, Deshmukh M, Hoffman HM, Ting JP. 2007. Microbial pathogen-induced necrotic cell death mediated by the inflammasome components CIAS1/cryopyrin/NLRP3 and ASC. Cell Host Microbe. 2(3):147-159.
Windelborn JA, Lipton P. 2008. Lysosomal release of cathepsins causes ischemic damage in the rat hippocampal slice and depends on NMDA-mediated calcium influx, arachidonic acid metabolism, and free radical production. J Neurochem. 106(1):56-69.
Wojtczak L, Schönfeld P. 1993. Effect of fatty acids on energy coupling processes in mitochondria. Biochim Biophys Acta. 1183(1):41-57.
Wyllie AH, Kerr JF, Currie AR. 1980. Cell death: the significance of apoptosis. Int Rev Cytol. 68:251-306.
Y Yamada T, Ohyagi Y, Shinnoh N, Kikuchi H, Osoegawa M, Ochi H, Kira J, Furuya H. 2004.
Therapeutic effects of normal cells on ABCD1 deficient cells in vitro and hematopoietic cell transplantation in the X-ALD mouse model. J Neurol Sci. 218(1-2):91-97.
Yamashima T, Oikawa S. 2009. The role of lysosomal rupture in neuronal death. Prog Neurobiol. 89(4):343-358.
Yamashima T. 2000. Implication of cysteine proteases calpain, cathepsin and caspase in ischemic neuronal death of primates. Prog Neurobiol. 62(3):273-295.
Yamashima T. 2004. Ca2+-dependent proteases in ischemic neuronal death: a conserved 'calpain-cathepsin cascade' from nematodes to primates. Cell Calcium. 36(3-4):285-293.
Yanagisawa N, Shimada K, Miyazaki T, Kume A, Kitamura Y, Sumiyoshi K, Kiyanagi T, Iesaki T, Inoue N, Daida H. 2008. Enhanced production of nitric oxide, reactive oxygen species, and pro-inflammatory cytokines in very long chain saturated fatty acid-accumulated macrophages. Lipids Health Dis.7:48.
Yin X, Peterson J, Gravel M, Braun PE, Trapp BD. 1997. CNP overexpression induces aberrant oligodendrocyte membranes and inhibits MBP accumulation and myelin compaction. J Neurosci Res. 50:238-247.
Yoshida Y, Hayakawa M, Niki E. 2005. Total hydroxyoctadecadienoic acid as a marker for lipid peroxidation in vivo. Biofactors. 24(1-4):7-15.
Yoshida Y, Niki E. 2006. Bio-markers of lipid peroxidation in vivo: hydroxyoctadecadienoic acid and hydroxycholesterol. Biofactors. 27(1-4):195-202.
Z Zachara BA. 1992. Mammalian selenoproteins. J Trace Elem Electrolytes Health Dis.
6(3):137-151. Zangar RC, Davydov DR, Verma S. 2004. Mechanisms that regulate production of reactive
oxygen species by cytochrome P450. Toxicol Appl Pharmacol. 199(3):316-331. Zoeller RA, Lake AC, Nagan N, Gaposchkin DP, Legner MA, Lieberthal W. 1999.
Plasmalogens as endogenous antioxidants: somatic cell mutants reveal the importance of the vinyl ether. Biochem J. 338:769-776.
Zoeller RA, Morand OH, Raetz CR. 1988. A possible role for plasmalogens in protecting animal cells against photosensitized killing. J Biol Chem. 263(23):11590-11596.