activity report - spokane clean air · pdf fileactivity report april 1 through ... new...
TRANSCRIPT

ACTIVITY REPORT
APRIL 1 THROUGH APRIL 30, 2014
I. Communications and Education Activity Report
Community/School Presentations and Events:
Air quality educational programs and materials were provided at the following events:
Home & Garden Show
Bike Swap at Fairgrounds
Car Care Fair at SCC
Arbor Day at John A. Finch Arboretum
Earth Day at Riverfront Park
New Employee Transportation Coordinator (ETC) training with County CTR
Print/Online Materials:
Spring “Seasonal tips” added to website
News articles posted on website
Updated fact sheets; repost to web
New asbestos brochure from printer in time for spring events
Welcome to the Neighborhood cards distributed = 101
Media activities:
Radio spots produced for April, May and June (commute alternatives)
TV – asbestos spots aired in April; Rec fires to air in May
Interviewed with KYRS during Earth Day celebration
Special Projects:
Wood stove changeout program. Stats since second grant started in mid-November 2013: o 55 wood stoves replaced (12 for April - 8 gas; 2 wood, 2 pellet)
o Grant funds expended April: $10,400
o Grant funds expended to date: $43,900
o Grant funds remaining: $80,100
o Grant expires: June 2015
Valleyford (FD8) Natural Yard Debris “drop off” Day on April 12, 10 am – 3 pm
o Approx. 200 cubic yards of debris dropped-off
o 81 residents; 116 loads ($52 per person cost)
o 29 attendees at compost training
o 3 burn barrels turned-in
o Event direct cost: $4,640 ($3175 was container rental: 7 @ $425 ea; 1 @ $200 not filled)
Community/School Events & Presentations: 7
Print Materials: 2
News media (KYRS interview on Earth Day): 1

April 2014 Activity Report
Page 2 of 13
II. Compliance Activity Report
Facility Inspections
Date Inspection Type of
Completed Business Name Inspection Type of Process
2/7/2014 WSU - SPOKANE ICI-NOC #1605 Emergency Generator
2/11/2014 PROVIDENCE HOLY FAMILY HOSPITAL FCE Fuel Burning Equipment, Emergency
Generator, Sterilizing Equipment
3/5/2014 SPOKANE REGIONAL SOLID WASTE SYSTEM FCE Fuel Burning Equipment, Incinerator
3/20/2014 BNSF RAILWAY COMPANY CCI Organic liquid Tanks, Surface Coating
(Metal)
3/20/2014 TARGET MEDIA NORTHWEST/SPOKANE PRINT
& MAIL CCI Graphic Art Systems
3/25/2014 COMMERCIAL CREAMERY CCI Fuel Burning Equipment, Agricultural
Dehydration Operations
3/26/2014 ROAD PRODUCTS INC CCI Asphalt Production
3/27/2014 TRESKO MONUMENT CCI Abrasive Blasting, Materials Handling
3/27/2014 SPOKANE STEEL FOUNDRY CCI Abrasive Blasting, Materials Handling,
Metal Casting, Metallurgy Proc., Ovens
3/28/2014 PHILADELPHIA MACARONI COMPANY CCI Materials Handling, Fuel Burning
Equipment
4/2/2014 J & A BODY SHOP CCI Surface Coating (Metal)
4/2/2014 ABRA AUTO BODY & GLASS CCI Surface Coating (Metal)
4/2/2014 BMT METAL FABRICATION CCI Surface Coating (Metal)
4/3/2014 ED'S PREMIER AUTO BODY CCI Surface Coating (Metal)
4/3/2014 LIQUID TRANSFORMATIONS LLC CCI Surface Coating (Metal)
4/7/2014 KRUEGER SHEET METAL CCI Materials Handling, Surface Coating
(Metal)
4/8/2014 FOOTHILLS LINCOLN MERCURY MAZDA CCI Surface Coating (Metal)
4/15/2014 WHITLEY OIL LLC #5 CCI Gas Dispensing Facility
4/17/2014 GREENACRES GYPSUM & LIME COMPANY CCI Materials Handling, Fuel Burning
Equipment, Mineral. Proc.
4/17/2014 A-PRO AUTO BODY & TOWING CCI Surface Coating (Metal)
4/17/2014 CONTRACT RESOURCE GROUP CCI Surface Coating (Metal)
4/17/2014 SIGNATURE GENOMICS CCI
4/21/2014 FOUR SEASONS COFFEE/S. GRANT CCI Coffee Roaster
4/21/2014 MR TOUCH UP ICI-NOC #1627 Surface Coating (Metal)
4/23/2014 WESTERN STATES ASPHALT INC - THOR CCI Asphalt Production, Fuel Burning
Equipment, Organic liquid Tanks,
Soil/Groundwater Remediation
4/24/2014 DIAMOND AUTO BODY CCI Surface Coating (Metal)
4/25/2014 COBALT TRUCK EQUIPMENT CCI Surface Coating (Metal)
4/28/2014 THOMAS HAMMER COFFEE ROASTING CO CCI Coffee Roaster
CCI – Continuing Compliance Inspection – 24 FCE – Full Compliance Investigation – 2
ICI – Initial Compliance Inspection – 2 IR – Initial Registration – 0
I – Information – 0 PCE – Partial Compliance Evaluation – 0

April 2014 Activity Report
Page 3 of 13
STAFF INITIATED ACTIVITY & COMPLAINT SUMMARY
Staff Initiated Activity Complaints
Agricultural Burning 0 1
Air quality /smoke in the air 0 0
Asbestos 10 4
Dust from source/tracking 2 11
Dust from unpaved public road 0 1
Odors 0 6
Other/miscellaneous 2 6
Outdoor burning 23 28
Solid fuel burning device 0 16
Surface Coatinging 0 1
TOTAL 111
ASBESTOS PROGRAM NOTIFICATION
PROJECT SIZE OR TYPE # OF NOTIFICATIONS
> 10 ln ft and/or > 48 sq ft asbestos project (OOSFR) 14
OOSFR Abatement or OOSFR Demolition 4
All Demolition 4
10-259 ln ft and/or 48-159 sq ft with/without Demolition 11
260-999 ln ft and/or 160-4,999 sq ft with/without Demolition 14
GE 1000 ln ft and/or GE 5,000 sq ft 1
Emergency Notification 0
Alternate Asbestos Project Work Practices 0
Amendments 35
Exception for Hazardous Conditions 1
TOTAL 84
April 2014 Activity Report
Page 4 of 13
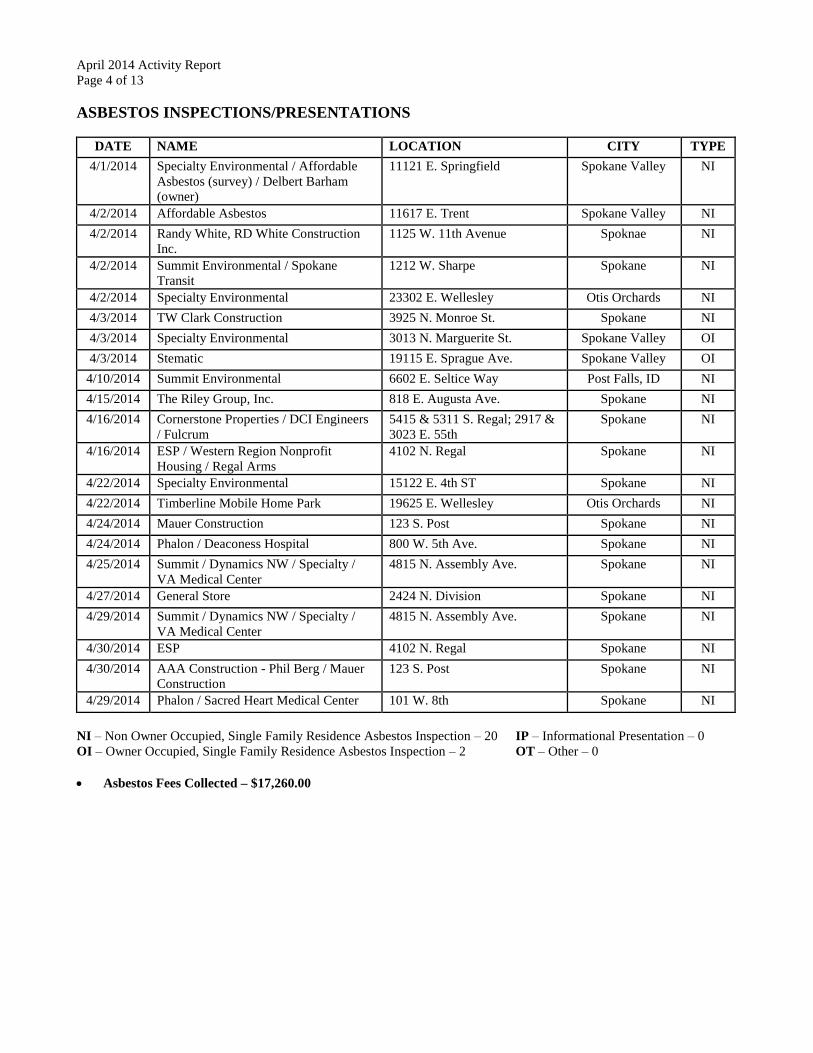
ASBESTOS INSPECTIONS/PRESENTATIONS
DATE NAME LOCATION CITY TYPE
4/1/2014 Specialty Environmental / Affordable
Asbestos (survey) / Delbert Barham
(owner)
11121 E. Springfield Spokane Valley NI
4/2/2014 Affordable Asbestos 11617 E. Trent Spokane Valley NI
4/2/2014 Randy White, RD White Construction
Inc.
1125 W. 11th Avenue Spoknae NI
4/2/2014 Summit Environmental / Spokane
Transit
1212 W. Sharpe Spokane NI
4/2/2014 Specialty Environmental 23302 E. Wellesley Otis Orchards NI
4/3/2014 TW Clark Construction 3925 N. Monroe St. Spokane NI
4/3/2014 Specialty Environmental 3013 N. Marguerite St. Spokane Valley OI
4/3/2014 Stematic 19115 E. Sprague Ave. Spokane Valley OI
4/10/2014 Summit Environmental 6602 E. Seltice Way Post Falls, ID NI
4/15/2014 The Riley Group, Inc. 818 E. Augusta Ave. Spokane NI
4/16/2014 Cornerstone Properties / DCI Engineers
/ Fulcrum
5415 & 5311 S. Regal; 2917 &
3023 E. 55th
Spokane NI
4/16/2014 ESP / Western Region Nonprofit
Housing / Regal Arms
4102 N. Regal Spokane NI
4/22/2014 Specialty Environmental 15122 E. 4th ST Spokane NI
4/22/2014 Timberline Mobile Home Park 19625 E. Wellesley Otis Orchards NI
4/24/2014 Mauer Construction 123 S. Post Spokane NI
4/24/2014 Phalon / Deaconess Hospital 800 W. 5th Ave. Spokane NI
4/25/2014 Summit / Dynamics NW / Specialty /
VA Medical Center
4815 N. Assembly Ave. Spokane NI
4/27/2014 General Store 2424 N. Division Spokane NI
4/29/2014 Summit / Dynamics NW / Specialty /
VA Medical Center
4815 N. Assembly Ave. Spokane NI
4/30/2014 ESP 4102 N. Regal Spokane NI
4/30/2014 AAA Construction - Phil Berg / Mauer
Construction
123 S. Post Spokane NI
4/29/2014 Phalon / Sacred Heart Medical Center 101 W. 8th Spokane NI
NI – Non Owner Occupied, Single Family Residence Asbestos Inspection – 20 IP – Informational Presentation – 0
OI – Owner Occupied, Single Family Residence Asbestos Inspection – 2 OT – Other – 0
Asbestos Fees Collected – $17,260.00

April 2014 Activity Report
Page 5 of 13
NOTICES OF VIOLATION
Issued – 6
Asbestos Control Standards 0
Dust Control 0
Odors 0 Resolved – 5
Outdoor Burning 3 Appealed – 0
Solid Fuel Burning Device Emissions 0
Installation of Air Pollution Source w/o a Permit/Registration 0
Not Complying with NOC/NOI Permit Requirements 2
Failure to Comply with Other Standards 1
Civil Penalties Collected – $9,140.00 Burning Permits Issued – $0
Agricultural/Spot Burn – $0 Wood Stove Exemptions – $0
III: Permitting & Air Quality
A. Notices of Construction Received – 8

April 2014 Activity Report
Page 6 of 13
Date NOC# Applicant, Site Address & Type
4/1/14 #1633 Wear-Tek, 8021 W. Hwy. 2, General Operations
4/2/14 #1634 City of Spokane Riverside Park Water Reclamation, 4401 N. Aubrey L White
Pkwy., Emergency Generator
4/4/14 #1635 Sonderen Packaging, 2906 N. Crestline St., Lithographic/Screen Printing
Process
4/7/14 #1636 Gerber Collision & Glass, 1318 W. 2nd
Ave., Paint Booth
4/10/14 #1637 City of Airway Heights, 21st Ave. & Lundstrom St., Emergency Generator
4/10/14 #1638 City of Airway Heights, Approx. 11503 W. Deno Rd., Emergency Generator
4/11/14 #1639 Phillips 66 – Spokane Terminal, 6317 E. Sharp Ave., General Operations
4/18/14 #1640 Global Harvest Foods, 3116 E. Graves Rd., Baghouse
B. Notices of Construction Approved – 4
Date NOC# Applicant, Site Address & Type
4/7/14 #1621 Bonneville Power-Admin., 1620 E. Hawthorne Rd., Emergency Generator
4/9/14 #1598 Kaiser Aluminum Washington LLC, 15000 E. Euclid Ave., General Operations
4/9/14 #1630 Convention Center Hotel LLC, 333 W. Spokane Falls Blvd., Emergency
Generator
4/29/14 #1633 Wear-Tek, 8021 W. Hwy. 2, General Operations
C. NEHAPS/MACT – None
D. Temporary Sources Received – 2
Date NOI# Applicant, Site Address & Type
4/9/14 #T530 Peak Sand and Gravel, Inc., 13304 N. Perry Rd., Rock Crusher
4/16/14 #T531 Peak Sand and Gravel, Inc., 2500 E. Ferry Ave. – Plant #3, Rock Crusher
Temporary Sources Approved – 4
Date NOC# Applicant, Site Address & Type
4/3/14 #T527 Interstate Concrete & Asphalt, 1180 W. Sprague Ave., Rock Crusher
4/9/14 #T528 Piersol Construction, Inc., 2903 E. 25th
Ave., Rock Crusher
4/21/14 #T530 Peak Sand and Gravel, Inc., 13304 N. Perry Rd., Rock Crusher
4/28/14 #T531 Peak Sand and Gravel, Inc., 2500 E. Ferry Ave. – Plant #3, Rock Crusher
E. Paving Waiver Requests – 0
Date PW# Applicant, Site Address & Type of Source
F. Surface Coating Regulation Exemption – 0
G. Number of Sources Registered – March & April - 61
Registration Fees Collected - $4,450.60
Notice of Construction/SEPA/NOI Fees Collected – $21,653.00
Air Operating Permits Issued – 0 Air Operating Permits Renewed – 0
AOP Permit Fees – $0

April 2014 Activity Report
Page 7 of 13
Spokane Regional Clean Air Agency
Air Quality Report - April 2014
Air quality remained in the “good” range of the Air Quality Index (AQI) for carbon monoxide (CO), particulate matter
(PM10) and fine particulate matter (PM2.5) throughout the month of April (Figure 1).
See Appendix 1 of this report for information about federal air quality standards or Appendix 2 for a description of the AQI.
Figure 1: Air Quality Index (AQI) values for April 2014
The particulate matter data used to determine the AQI and for other day-to-day operations are obtained using a network of
automated particulate matter monitors consisting of Tapered Element Oscillating Microbalances (TEOM) and nephelometers.
Daily mass concentrations of PM2.5 monitored in April throughout the network are shown in Figure 2.
Figure 2: PM2.5 multi-station time series for April 2014

April 2014 Activity Report
Page 8 of 13
The April daily air quality data for all monitoring stations in the Spokane region are provided in Appendix 3. Current and
historical air quality data can be obtained electronically from the Washington State Department of Ecology using its air
monitoring data website, https://fortress.wa.gov/ecy/enviwa/Default.htm.
Tables 1 and 2 contain the maximum AQI values for each pollutant for the month and for the year to date. Table 3
summarizes the year to date daily AQIs by category and compares them to last year’s AQIs.
Table 1: Maximum AQI values and pollutant concentrations for this reporting period
Pollutant AQI/Concentration Location Date
CO 10/0.9 ppm (8 hour) Spokane, 3rd
& Washington 4/17
PM10 35/38 µg/m3
Spokane, Augusta & Fiske 4/8
PM2.5 46/11.1 µg/m3 Spokane, Monroe & Wellesley 4/14
Table 2: Maximum AQI values and pollutant concentrations for year-to-date
Pollutant AQI/Concentration Location Date
CO 18/1.6 ppm (8 hour) Spokane, 3rd
& Washington 1/14
PM10 44/48 µg/m3
Spokane, Augusta & Fiske 1/11
PM2.5 66/19.0 µg/m3 Spokane, Augusta & Fiske 1/5
Table 3: AQI summary as of April 30, 2014.
Category Number of Days This
Year
Last Year to Date
(using post-3/18/2013 AQI)
Good (0-50) 108 79
Moderate (51-100) 12 40
Unhealthy for Sensitive Groups (101-150) 0 1
Unhealthy (151-200) 0 0
Very Unhealthy (201-300) 0 0
Hazardous (>300) 0 0

April 2014 Activity Report
Page 9 of 13
As is typical for the Spokane area, air quality in April was generally better with southwesterly winds associated with storm
systems (Figures 3 and 4). Fine particulate matter mass concentration data are from the monitoring station located at Monroe
St. and Wellesley Ave. in Spokane.
Figure 3: The wind rose depicts the variation of hourly average wind speed (mph) with the direction from which the
wind was blowing in April.
Figure 4: The PM2.5 pollution rose depicts the variation of hourly average PM2.5 3) with the direction from
which the wind was blowing in April.

April 2014 Activity Report
Page 10 of 13
Nitrogen oxides (NOx) are a group of highly reactive gases that contain nitrogen and oxygen. In ambient air, they consist
primarily of nitric oxide (NO) and nitrogen dioxide (NO2). The 2005 emissions inventory estimated that, on an annual basis,
59% of NOx emissions in Spokane County are from on-road mobile sources, cars and trucks, and 24% are from non-road
mobile sources, e.g., construction heavy equipment. The remaining 17% comes from a variety of sources, such as natural
emissions from soil and vegetation (6%), industrial, commercial and institutional point sources (5%), residential fuel use
(4%), e.g., natural gas and oil for heating and cooking, wood stoves and fireplaces (1%) and open burning, wildfires and
structure and vehicle fires (1%).
The SRCAA monitors nitrogen oxides at the Spokane Augusta & Fiske monitoring station. Nitrogen dioxide is a criteria air
pollutant defined in the NAAQS (see Appendix 1 of this report), but is not a significant problem in the Spokane area. The
one-hour maximum concentrations of the nitrogen oxides monitored in April at the Augusta & Fiske monitoring station are
shown in figure 5.
Figure 5: One hour maximum concentrations of nitrogen oxides and hydrocarbons for Spokane Augusta Ave
monitoring station in April. The federal standard daily 1-hour maximum for nitrogen dioxide (NO2) is 100 ppb. The
NAAQS does not set limits on the other air pollutants shown here. The NOX analyzer was disrupted April 25-27
during work to set up ozone monitoring for the summer season.
Appendix 1 – National Ambient Air Quality Standards
The Clean Air Act requires EPA to set National Ambient Air Quality Standards (NAAQS) for six common air pollutants,
carbon monoxide (CO), lead (Pb), nitrogen dioxide (NO2), particulate matter (PM10 and PM2.5), ground-level ozone (O3) and
sulfur dioxide (SO2; Table A-1). These are known as “criteria” pollutants because the US EPA established regulatory limits
to concentrations in ambient air using human health or environmentally based criteria. Carbon monoxide, particulate matter
and ozone are monitored in Spokane County by the Spokane Regional Clean Air Agency (SRCAA) and the Washington State
Department of Ecology (Ecology).

April 2014 Activity Report
Page 11 of 13
Table A-1: National Ambient Air Quality Standards
Primary Standards Secondary Standards
Pollutant Level Averaging Time Level Averaging Time
Carbon Monoxide 9 ppm (10 mg/m3) 8-hour
(1) None
35 ppm (40 mg/m3) 1-hour
(1)
Lead 0.15 µg/m3 (2)
Rolling 3-Month Average Same as Primary
1.5 µg/m3 Quarterly Average Same as Primary
Nitrogen Dioxide 53 ppb (3)
Annual (Arithmetic Average) Same as Primary
100 ppb 1-hour (4)
None
Particulate Matter
(PM10)
150 µg/m3 24-hour
(5) Same as Primary
Particulate Matter
(PM2.5)
12.0 µg/m3 Annual
(6,12) (Arithmetic Average) Same as Primary
35 µg/m3 24-hour
(7) Same as Primary
Ozone 0.075 ppm (2008 std) 8-hour (8)
Same as Primary
0.08 ppm (1997 std) 8-hour (9)
Same as Primary
0.12 ppm 1-hour (10)
Same as Primary
Sulfur Dioxide 0.03 ppm Annual (Arithmetic Average) 0.5 ppm 3-hour (1)
0.14 ppm 24-hour
(1)
75 ppb (11)
1-hour None
(1) Not to be exceeded more than once per year. (2) Final rule signed October 15, 2008. (3) The official level of the annual NO2 standard is 0.053 ppm, equal to 53 ppb, which is shown here for the purpose of clearer comparison
to the 1-hour standard. (4) To attain this standard, the 3-year average of the 98th percentile of the daily maximum 1-hour average at each monitor within an area
must not exceed 100 ppb (effective January 22, 2010). (5) Not to be exceeded more than once per year on average over 3 years. (6) To attain this standard, the 3-year average of the weighted annual mean PM2.5 concentrations from single or multiple community-
oriented monitors must not exceed 12.0 µg/m3. (7) To attain this standard, the 3-year average of the 98th percentile of 24-hour concentrations at each population-oriented monitor within an
area must not exceed 35 µg/m3 (effective December 17, 2006). (8) To attain this standard, the 3-year average of the fourth-highest daily maximum 8-hour average ozone concentrations measured at each
monitor within an area over each year must not exceed 0.075 ppm (effective May 27, 2008). (9) (a) to attain this standard, the 3-year average of the fourth-highest daily maximum 8-hour average ozone concentrations measured at each
monitor within an area over each year must not exceed 0.08 ppm.
(b) The 1997 standard—and the implementation rules for that standard—will remain in place for implementation purposes as EPA
undertakes rulemaking to address the transition from the 1997 ozone standard to the 2008 ozone standard.
(c) EPA is in the process of reconsidering these standards (set in March 2008). (10) (a) EPA revoked the 1-hour ozone standard in all areas, although some areas have continuing obligations under that standard ("anti-
backsliding").
(b) The standard is attained when the expected number of days per calendar year with maximum hourly average concentrations above
0.12 ppm is < 1. (11) (a) Final rule signed June 2, 2010. To attain this standard, the 3-year average of the 99th percentile of the daily maximum 1-hour
average at each monitor within an area must not exceed 75 ppb. (12) EPA revised the annual PM2.5 standard from 15 to 12 µg/m3 (effective March 18, 2013).
Appendix 2 – Air Quality Index
The Air Quality Index (AQI) is EPA’s color-coded tool for communicating daily air quality to the public and can be
calculated for any of the criteria pollutants except lead, provided monitoring data are available. An index value above 100

April 2014 Activity Report
Page 12 of 13
indicates that the concentration of a criteria pollutant exceeded the limit established in the NAAQS. Categories of the AQI
are “good” (green, 0-50), “moderate” (yellow, 51-100), “unhealthy for sensitive groups” (orange, 101-150), “unhealthy” (red,
151-200), “very unhealthy” (purple, 201-300) and “hazardous” (maroon, 301-500; Table A-2). The breakpoint between the -3
, effective March 18, 2013.
Table A-2: Air pollutant breakpoints for the Air Quality Index.
Air Quality Index
Levels of Health
Concern
Color
Code
Index
Numerical
Value
Breakpoints Health Effects
O3 (ppm)
8-hour
O3 (ppm)
1-hour(1)
PM2.5
(g/m3) 24-hour
PM10
(g/m3) 24-hour
CO
(ppm) 8-hour
Good Green 0-50 0.000-
0.059
(3) 0.0-12.0 0-54 0.0-4.4 Air quality is considered
satisfactory and air
pollution poses little or no risk.
Moderate Yellow 51-100 0.060-
0.075
(3) 12.1-35.4 55-154 4.5-9.4 Air quality is acceptable;
however, for some
pollutants there may be a moderate health concern
for a very small number of
people who are unusually sensitive to air pollution.
Unhealthy for
Sensitive Groups
Orange 101-150 0.076-
0.095
0.125-
0.164
35.5-65.4 155-254 9.5-12.4 People especially sensitive
to air pollution may experience health effects.
The general public is not
likely to be affected. An AQI in this category or
above indicates that air
pollution exceeds levels acceptable under federal
air quality standards.
Unhealthy Red 151-200 0.096-
0.115
0.165-
0.204
65.5-150.4 255-354 12.5-15.4 Everyone may begin to
experience health effects;
members of sensitive
groups may experience more serious health effects.
Very Unhealthy Purple 201-300 0.116-
0.374
0.205-
0.404
150.5-250.4 355-424 15.5-30.4 Health alert: everyone
may experience more
serious health effects.
Hazardous Maroon >300 (2) 0.405+ 250.5+ 425+ 30.5+ Health warnings of
emergency conditions.
The entire population is more likely to be affected.
1Areas are generally required to report the AQI based on 8-hour ozone values. However, there are a small number of areas where an AQI based on 1-hour
ozone values would be more precautionary. In these cases, in addition to calculating the 8-hour ozone index value, the 1-hour ozone index value may be calculated, and the maximum of the two values reported.
28-hour O3 values do not define higher AQI values (≥ 301). AQI values of 301 or greater are calculated with 1-hour O3 concentrations. 3There is no AQI for 1-hour O3 concentrations below the Unhealthy for Sensitive Groups level.
Appendix 3
Table A-3: Summary air quality data for April for air monitoring stations in Spokane County. The carbon monoxide
data are 8-hour maximums in parts per million (ppm) and the PM data are 24-hour averages in micrograms per cubic meter of

April 2014 Activity Report
Page 13 of 13
air (g/m3). The Spokane Valley – E Broadway PM2.5 monitor was down for repair in April. The PM2.5 TEOMs at Augusta
and Airway Heights were down for routine maintenance on April 3-4 and April 14-15, respectively.
Date
CO
3rd
& W
ash
ing
ton
(8
ho
ur
max
, p
pm
)
PM
2.5
Au
gu
sta &
Fis
ke F
RM
(µ
g/m
3),
ev
ery
six
day
s
PM
2.5
Au
gu
sta &
Fis
ke T
EO
M (
µg
/m3
)
PM
2.5
Co
lleg
e A
ve T
EO
M (
µg
/m3
)
PM
2.5
Co
lbert
TE
OM
(µ
g/m
3)
PM
2.5
Sp
ok
an
e V
all
ey
- E
Bro
ad
way
TE
OM
(µ
g/m
3)
PM
2.5
Air
way
Heig
hts
TE
OM
(µ
g/m
3)
PM
2.5
Tu
rnb
ull
NW
R T
EO
M (
µg
/m3
)
PM
2.5
Mo
nro
e &
Well
esl
ey
nep
helo
mete
r (µ
g/m
3)
PM
2.5
Lib
ert
y L
ak
e T
EO
M (
µg
/m3
)
PM
10
Au
gu
sta &
Fis
ke T
EO
M (
µg
/m3
)
PM
10
Tu
rnb
ull
NW
R T
EO
M (
µg
/m3
)
4/1 0.5 9.3 5.7 5.9 5.9 3.6 5.0 4.9 24 7
4/2 0.6 8.9 5.9 6.8 7.0 1.8 4.9 6.5 27 5
4/3 0.6 4.4 5.2 5.8 1.7 3.1 5.1 20 4
4/4 0.6 3.0 3.8 3.8 0.9 2.4 3.2 11 3
4/5 0.4 1.7 5.1 3.9 4.6 4.8 0.0 2.2 4.1 12 2
4/6 0.3 5.6 4.0 4.8 4.2 0.4 2.3 4.4 9 2
4/7 0.6 8.4 6.3 6.2 6.5 2.8 4.3 6.1 23 6
4/8 0.5 9.5 6.9 6.9 6.7 2.1 4.9 5.8 38 9
4/9 0.3 5.8 3.5 4.1 4.9 0.6 2.1 4.1 31 11
4/10 0.4 8.0 5.7 7.2 6.0 2.3 3.5 5.3 27 8
4/11 0.4 4.2 8.5 5.0 5.9 5.7 1.7 3.9 5.2 30 15
4/12 0.3 8.6 6.6 6.0 6.0 1.8 3.9 6.0 22 6
4/13 0.4 10.1 6.4 6.3 6.0 2.1 4.3 5.6 17 7
4/14 0.4 11.1 7.2 6.3 2.6 6.1 5.8 34 14
4/15 0.8 8.1 6.3 7.1 2.3 4.5 6.2 31 11
4/16 0.8 7.7 5.4 5.3 5.2 0.8 2.9 5.4 16 3
4/17 0.9 3.0 5.9 3.8 3.9 3.7 3.3 2.7 3.3 5 5
4/18 0.4 6.0 3.9 4.8 4.9 2.4 2.6 4.4 14 5
4/19 0.3 8.0 6.8 6.5 6.4 3.0 4.6 6.8 19 9
4/20 0.5 7.2 6.8 6.0 6.1 2.3 4.6 5.5 12 5
4/21 0.5 10.0 7.8 7.6 8.0 4.3 7.4 6.7 21 13
4/22 0.4 6.7 5.0 5.1 4.7 2.1 3.5 4.6 9 5
4/23 0.4 4.8 3.7 3.7 3.5 0.7 1.6 3.3 12 2
4/24 0.6 5.2 3.4 3.5 3.4 0.7 1.7 3.4 7 2
4/25 0.6 5.7 3.8 4.0 3.9 1.9 2.3 4.0 7 3
4/26 0.4 5.8 3.5 4.6 4.2 2.1 2.5 3.9 9 4
4/27 0.4 5.5 5.3 4.8 4.6 1.1 2.3 5.2 11 4
4/28 0.5 6.6 5.3 5.1 5.1 1.5 2.5 5.3 13 3
4/29 0.5 4.6 9.8 7.1 5.2 6.2 2.8 4.9 5.6 18 6
4/30 0.7 10.7 6.8 5.8 6.1 3.7 5.6 5.9 22 11
AVG 0.5 3.4 7.6 5.3 5.4 5.3 2.0 3.6 5.1 18 6
MAX 0.9 4.6 11.1 7.8 7.6 8.0 4.3 7.4 6.8 38 15