actuarial - welcome to opers | oklahoma public ... 67 2017 certification of actuarial valuation 69...
TRANSCRIPT

Actuarial
67 2017 Certification of Actuarial Valuation
69 Summary of Results
70 Analysis of Financial Experience
71 Solvency Test
72 Schedule of Active Member Valuation Data
72 Schedule of Retirants, Disabled Retirants and Beneficiaries
Added to and Removed from Rolls
73 Summary of System Provisions
75 Summary of Actuarial Assumptions and Methods

OKLAHOMA PUBLIC EMPLOYEES RETIREMENT SYSTEM
October 27, 2017
Board of Trustees Oklahoma Public Employees Retirement System 5801 N. Broadway Extension, Suite 200 P.O. Box 53007 Oklahoma City, OK 73152-3007
Members of the Board:
We have completed an actuarial valuation of the Oklahoma Public Employees Retirement System as of July 1, 2017 for the purpose of determining the actuarial contribution rate and calculating and analyzing key financial measurements. Actuarial valuations are performed annually. This valuation reflects the benefit provisions and contribution rates in effect as of July 1, 2017.
In preparing the valuation, we, as the actuary, relied on the data provided by the System. As part of our work, we performed a limited review of the data for consistency and reasonableness and did not find material defects in the data.
All of the information and supporting schedules in the Actuarial Section have been provided by Cavanaugh Macdonald Consulting, LLC. We also prepared the Schedule of Changes in the Net Pension Liability, Schedule of Pension Employer Contributions, Schedule of Changes in the Net HISP Liability, and Schedule of HISP Employer Contributions shown in the financial section of the Comprehensive Annual Financial Report. All historical information that references a valuation date prior to July 1, 2010 was prepared by the prior actuarial firm.
The assumptions recommended by the actuary and adopted by the Board are, in the aggregate, reasonably related to the experience under the System and to reasonable expectations of anticipated experience under the System and meet the parameters for the disclosures under statements issued by the Governmental Accounting Standards Board.
Future actuarial results may differ significantly from the current results presented in this report due to such factors as the following: plan experience differing from that anticipated by the economic or demographic assumptions; changes in economic or demographic assumptions; increases or decreases expected as part of the natural operation of the methodology used for these measurements (such as the end of an amortization period
Cavanaugh Macdonald C O N S U L T I N G, L L C The experience and dedication you deserve
Cavanaugh Macdonald 3550 Busbee Pkwy, Suite 250
Kennesaw, GA 30144
Phone (678) 388-1700 Fax (678) 388-1730
www.CavMacConsulting.com
OKLAHOMA PUBLIC EMPLOYEES RETIREMENT PLANAdministered by the Oklahoma Public Employees Retirement System
67 2017 Comprehensive Annual Financial Report

OKLAHOMA PUBLIC EMPLOYEES RETIREMENT SYSTEM
or additional cost or contribution requirements based on the plan’s funded status); and changes in plan provisions or applicable law. Since the potential impact of such factors is outside the scope of a normal annual actuarial valuation, an analysis of the range of results is not presented herein. The actuary prepared the following supporting schedules for the Comprehensive Annual Financial Report: Actuarial Section Summary of Results Analysis of Financial Experience Solvency Test Summary of Membership Data
This is to certify that the independent consulting actuaries, Alisa Bennett and Brent Banister, are Members of the American Academy of Actuaries and meet the qualification standards of the American Academy of Actuaries to render the actuarial opinion contained herein. They have experience in performing valuations for public retirement systems. The valuation was prepared in accordance with Actuarial Standards of Practice issued by the Actuarial Standards Board. The actuarial calculations were performed by qualified actuaries in accordance with accepted actuarial procedures, based on the current provisions of the retirement system and on actuarial assumptions that are internally consistent and reasonably based on the actual experience of the System.
Respectfully submitted,
Alisa Bennett, FSA, EA, FCA, MAAA Brent Banister, PhD, FSA, EA, FCA, MAAA Principal and Consulting Actuary Chief Pension Actuary
OKLAHOMA PUBLIC EMPLOYEES RETIREMENT PLANAdministered by the Oklahoma Public Employees Retirement System
68 2017 Comprehensive Annual Financial Report

OKLAHOMA PUBLIC EMPLOYEES RETIREMENT SYSTEM
Summary of Results 7/1/2017 7/1/2016 % Valuation Valuation Change 1. PARTICIPANT DATA Number of: Active Members 38,873 41,806 (7.0) Retired and Disabled Members and Beneficiaries 34,579 33,749 2.5 Inactive Members 5,951 5,946 0.1 Total Members 79,403 81,501 (2.6) Projected Annual Salaries of Active Members $ 1,688,543,856 $ 1,790,809,603 (5.7) Annual Retirement Payments for Retired Members $ 576,548,059 $ 553,631,087 4.1 and Beneficiaries 2. ASSETS AND LIABILITIES Total Actuarial Accrued Liability $ 9,781,617,070 $ 9,427,809,623 3.8 Market Value of Assets $ 9,229,499,873 $ 8,435,578,907 9.4 Actuarial Value of Assets $ 9,241,292,469 $ 8,790,886,036 5.1 Unfunded Actuarial Accrued Liability $ 540,324,601 $ 636,923,587 (15.2) Funded Ratio 94.5% 93.2% 1.3 3. EMPLOYER CONTRIBUTION RATES AS A PERCENT OF PAYROLL Normal Cost Rate 10.24% 10.01% Amortization of Unfunded Actuarial Accrued Liability 3.57% 3.79% Budgeted Expenses 0.40% 0.37% Total Actuarially Determined Contribution Rate 14.21% 14.17% Less Estimated Member Contribution Rate 4.14% 4.10% Employer Actuarially Determined Contribution Rate 10.07% 10.07% Less Statutory State Employer Contribution Rate 16.50% 16.50% Contribution Shortfall/(Surplus) (6.43%) (6.43%)
OKLAHOMA PUBLIC EMPLOYEES RETIREMENT PLANAdministered by the Oklahoma Public Employees Retirement System
69 2017 Comprehensive Annual Financial Report

OKLAHOMA PUBLIC EMPLOYEES RETIREMENT SYSTEM
Analysis of Financial Experience Gains & Losses in Actuarial Accrued Liability During the Year Ended June 30, 2017 Resulting from Differences Between Assumed Experience & Actual Experience
Type of Activity
(Gain) or Loss for Year End 2017
1. Age & Service Retirements. Generally, if members retire at older ages or with smaller benefits than assumed, there is a gain. If they retire at younger ages or have higher average pays, a loss occurs.
$ (2,600,000)
2. Disability Retirements. If disability claims are less than assumed, there is a gain. If more claims, a loss.
1,900,000
3. Deaths. If more deaths occur than assumed, there is a gain. If fewer, there is a loss.
(13,100,000)
4. Withdrawal from Employment. If more liabilities are released by
withdrawals than assumed, there is a gain. If smaller releases, a loss. (10,500,000)
5. Pay Increases. If there are smaller pay increase than assumed, there is a
gain. If greater increases, a loss. (106,200,000)
6. New Entrants. All new entrants to the System create a loss. 15,900,000 7. Other. Miscellaneous gains and losses resulting from data adjustments,
employee transfers, valuation methods, etc. (19,400,000)
8. (Gain) or Loss During Year From Financial Experience. (77,900,000) 9. Composite (Gain) or Loss During Year. $ (211,900,000)
OKLAHOMA PUBLIC EMPLOYEES RETIREMENT PLANAdministered by the Oklahoma Public Employees Retirement System
70 2017 Comprehensive Annual Financial Report
OKLAHOMA PUBLIC EMPLOYEES RETIREMENT SYSTEM
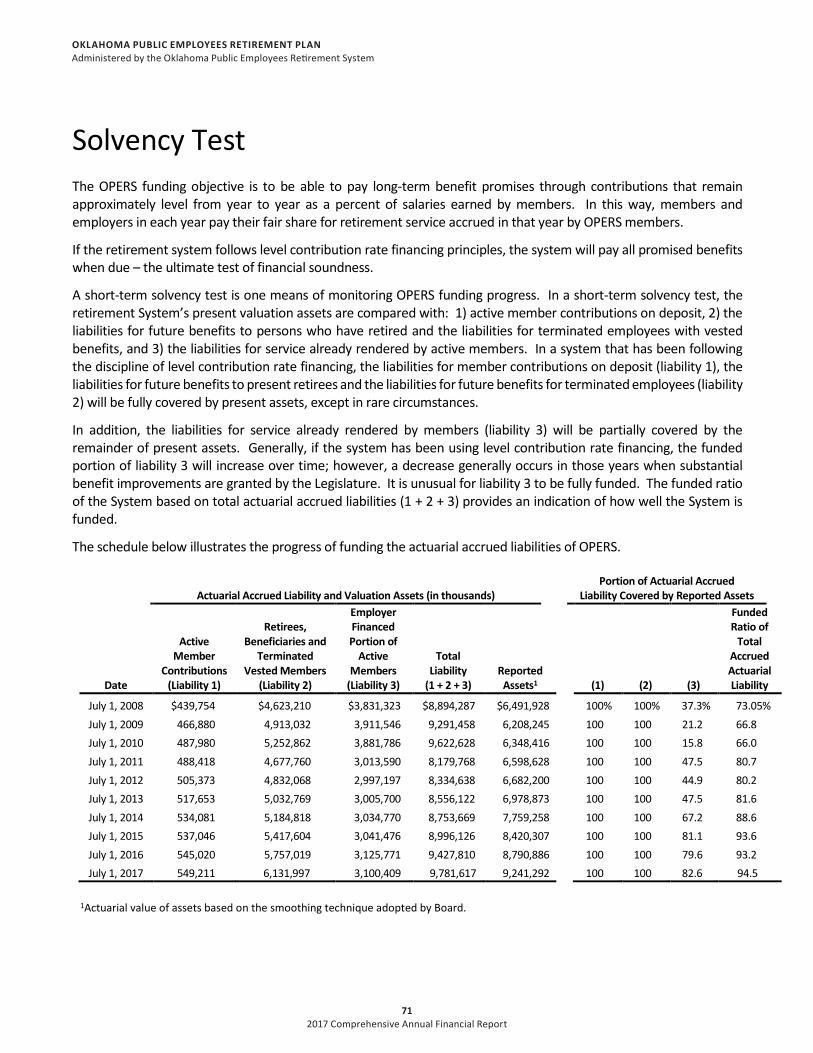
Solvency Test The OPERS funding objective is to be able to pay long-term benefit promises through contributions that remain approximately level from year to year as a percent of salaries earned by members. In this way, members and employers in each year pay their fair share for retirement service accrued in that year by OPERS members.
If the retirement system follows level contribution rate financing principles, the system will pay all promised benefits when due – the ultimate test of financial soundness.
A short-term solvency test is one means of monitoring OPERS funding progress. In a short-term solvency test, the retirement System’s present valuation assets are compared with: 1) active member contributions on deposit, 2) the liabilities for future benefits to persons who have retired and the liabilities for terminated employees with vested benefits, and 3) the liabilities for service already rendered by active members. In a system that has been following the discipline of level contribution rate financing, the liabilities for member contributions on deposit (liability 1), the liabilities for future benefits to present retirees and the liabilities for future benefits for terminated employees (liability 2) will be fully covered by present assets, except in rare circumstances.
In addition, the liabilities for service already rendered by members (liability 3) will be partially covered by the remainder of present assets. Generally, if the system has been using level contribution rate financing, the funded portion of liability 3 will increase over time; however, a decrease generally occurs in those years when substantial benefit improvements are granted by the Legislature. It is unusual for liability 3 to be fully funded. The funded ratio of the System based on total actuarial accrued liabilities (1 + 2 + 3) provides an indication of how well the System is funded.
The schedule below illustrates the progress of funding the actuarial accrued liabilities of OPERS.
Actuarial Accrued Liability and Valuation Assets (in thousands)
Portion of Actuarial Accrued Liability Covered by Reported Assets
Date
Active Member
Contributions (Liability 1)
Retirees,
Beneficiaries and Terminated
Vested Members (Liability 2)
Employer Financed Portion of
Active Members
(Liability 3)
Total Liability
(1 + 2 + 3)
Reported Assets1
(1)
(2)
(3)
Funded Ratio of
Total Accrued Actuarial Liability
July 1, 2008 $439,754 $4,623,210 $3,831,323 $8,894,287 $6,491,928 100% 100% 37.3% 73.05% July 1, 2009 466,880 4,913,032 3,911,546 9,291,458 6,208,245 100 100 21.2 66.8 July 1, 2010 487,980 5,252,862 3,881,786 9,622,628 6,348,416 100 100 15.8 66.0 July 1, 2011 488,418 4,677,760 3,013,590 8,179,768 6,598,628 100 100 47.5 80.7 July 1, 2012 505,373 4,832,068 2,997,197 8,334,638 6,682,200 100 100 44.9 80.2 July 1, 2013 517,653 5,032,769 3,005,700 8,556,122 6,978,873 100 100 47.5 81.6 July 1, 2014 534,081 5,184,818 3,034,770 8,753,669 7,759,258 100 100 67.2 88.6 July 1, 2015 537,046 5,417,604 3,041,476 8,996,126 8,420,307 100 100 81.1 93.6 July 1, 2016 545,020 5,757,019 3,125,771 9,427,810 8,790,886 100 100 79.6 93.2 July 1, 2017 549,211 6,131,997 3,100,409 9,781,617 9,241,292 100 100 82.6 94.5
1Actuarial value of assets based on the smoothing technique adopted by Board.
OKLAHOMA PUBLIC EMPLOYEES RETIREMENT PLANAdministered by the Oklahoma Public Employees Retirement System
71 2017 Comprehensive Annual Financial Report

OKLAHOMA PUBLIC EMPLOYEES RETIREMENT SYSTEM
Schedule of Active Member Valuation Data
Valuation Date
Number
Annual Payroll
Annual Average Pay
% Increase in Average Pay
July 1, 2017 38,873 $1,688,543,856 $43,437 1.40 July 1, 2016 41,806 1,790,809,603 42,836 3.82 July 1, 2015 43,843 1,808,972,785 41,260 3.97 July 1, 2014 43,947 1,744,041,536 39,685 1.29 July 1, 2013 43,273 1,695,347,809 39,178 2.08 July 1, 2012 42,569 1,633,837,374 38,381 (0.90) July 1, 2011 40,551 1,570,500,148 38,729 1.06 July 1, 2010 43,934 1,683,697,139 38,323 1.01 July 1, 2009 45,683 1,732,975,532 37,935 1.72 July 1, 2008 45,120 1,682,663,413 37,293 2.50 July 1, 2007 44,712 1,626,737,832 36,383 5.49
Schedule of Retirants, Disabled Retirants, and Beneficiaries Added to and Removed from Rolls
Added to Rolls Removed from Rolls Rolls – End of Year
Year Ended
Number
Annual
Allowances Number
Annual
Allowances
Number
Annual
Allowances
% Increase in Annual
Allowances
Average Annual
Allowances
June 30, 2017 1,846 $35,653,217 1,016 $ 12,736,245 34,579 $ 576,548,059 4.14 $ 16,673 June 30, 2016 1,986 37,356,248 991 12,505,069 33,749 553,631,087 4.70 16,404 June 30, 2015 1,898 35,731,879 977 11,895,298 32,754 528,779,908 4.72 16,144 June 30, 2014 1,667 28,477,713 969 11,707,809 31,833 504,943,327 3.44 15,862 June 30, 2013 1,767 31,633,122 895 10,184,240 31,135 488,173,423 4.60 15,679 June 30, 2012 1,703 29,234,998 858 10,430,214 30,263 466,724,541 4.20 15,422 June 30, 2011 2,232 40,890,700 823 9,670,100 29,418 447,919,757 7.49 15,226 June 30, 2010 1,867 32,394,848 807 9,942,962 28,009 416,699,157 5.69 14,877 June 30, 2009 1,595 27,216,987 679 9,117,210 26,949 394,247,271 4.81 14,629 June 30, 2008 1,526 23,815,666 790 8,508,891 26,033 376,147,494 8.42 14,449
OKLAHOMA PUBLIC EMPLOYEES RETIREMENT PLANAdministered by the Oklahoma Public Employees Retirement System
72 2017 Comprehensive Annual Financial Report

OKLAHOMA PUBLIC EMPLOYEES RETIREMENT SYSTEM
Summary of System Provisions
Effective Date: The System became effective January 1, 1964. The fiscal year is July 1 to June 30.
Employees Included: All permanent employees of the State of Oklahoma, and any other employer such as a county, county hospital, city or town, conservation districts, circuit engineering districts, and any trust in which a county, city, or town participates and is the primary beneficiary, are eligible to join if:
the employee is not eligible for or participating in another retirement system authorized under Oklahoma law, is covered by Social Security and not participating in the U.S. Civil Service Retirement System,
the employee is scheduled for 1,000 hours per year and salary is not less than the hourly rate of the monthly minimum wage for State employees (for employees of local government employers, not less than the hourly rate of the monthly minimum wage for such employees).
Membership is mandatory for new eligible employees on the first of the
month following employment. Beginning November 1, 2015, most new state employees are excluded from participating in the defined benefit plan.
Employee and Employer Contributions: 3.5% of pay for most State employees and 16.5% for employers. Local
employees, elected officials, members covered by the Department of Corrections Hazardous Duty provisions, and members who elect the step up provision contribute at varying rates.
Final Average Compensation: Generally the highest annual average of any thirty-six months within the
last ten years of participating service. For members hired on or after July 1, 2013, the highest annual average of any sixty months within the last ten years of participating service.
Retirement Date: Normal: Age 62 (age 60 for elected officials), 80 age/service points if hired before
July 1, 1992, 90 age/service points if hired on or after July 1, 1992. For non-elected employees hired on or after November 1, 2011, the
retirement age is age 65 or 90 age/service points if at least 60. For elected officials hired on or after November 1, 2011, age 65 with 8 years of service or 62 with 10 years of service.
OKLAHOMA PUBLIC EMPLOYEES RETIREMENT PLANAdministered by the Oklahoma Public Employees Retirement System
73 2017 Comprehensive Annual Financial Report

OKLAHOMA PUBLIC EMPLOYEES RETIREMENT SYSTEM
Summary of System Provisions (continued)
20 years of service for certain members covered by the Department of
Corrections Hazardous Duty provisions and certain Oklahoma Military Department Firefighters.
Early: Age 55 with 10 years of service. Normal Retirement Benefit: General formula is 2% of final average compensation multiplied by years
of credited service. Disability Benefit: After eight years of service, provided the member qualifies for disability
benefits as certified either by the Social Security Administration or the Railroad Retirement Board. Benefit is determined by the normal retirement formula based on service and salary history at date of disability. The benefit is payable immediately without actuarial reduction.
In-service Death Benefit: If the deceased member was vested, the benefit that would have been
paid the member had he retired and elected the joint and 100% survivor option (Option B).
For elected officials, it is 50% of the benefit that would have been paid the
member had he retired. Postretirement Death Benefit: $5,000 lump-sum. Forms of Payment: Life annuity, joint and 50% survivor, joint and 100% survivor annuity, life
annuity with a minimum of 120 monthly payments, and Medicare Gap Benefit option.
Supplemental Medical Insurance Premium: The System will contribute the lesser of $105 per month or the Medicare
Supplement Premium to the Office of Management and Enterprise Services, Employees Group Insurance Division (or other eligible employer health plans) for members receiving retirement benefits.
OKLAHOMA PUBLIC EMPLOYEES RETIREMENT PLANAdministered by the Oklahoma Public Employees Retirement System
74 2017 Comprehensive Annual Financial Report

OKLAHOMA PUBLIC EMPLOYEES RETIREMENT SYSTEM
Summary of Actuarial Assumptions and Methods
1. The investment return rate used in the valuation was 7.00 percent per year, net of investment expenses, compounded annually. This rate of return is not the assumed real rate of return. The real rate of return is the rate of return in excess of the inflation rate. Considering other financial assumptions, the 7.00 percent investment return rate translates to an assumed real rate of return of 4.25 percent.
2. The RP-2014 Mortality Table projected to 2025 using Scale MP-2016 with male rates multiplied by 95% under
age 70 and 105% over age 70, while female rates are multiplied by 90% and 115%. 3. The probabilities of withdrawal from service, together with individual pay increase assumptions, are shown in
Schedule 1. 4. The probabilities of retirement with an age and service allowance are shown in Schedules 2A, 2B and 2C. 5. Because of the passage of House Bill 2132, benefits are not assumed to increase due to future ad hoc cost-of-
living increases. 6. The individual entry-age normal actuarial cost method of valuation was used in determining actuarial accrued
liability and normal cost. Actuarial gains and losses reduce or increase the unfunded actuarial accrued liability and are amortized over the remaining amortization period (10 years as of July 1, 2017).
7. The actuarial value of assets is based on a five-year moving average of expected actuarial values and market
values. A preliminary expected value is determined equal to the prior year’s actuarial value of assets plus net cash flow for the year ending on the valuation date, assuming the valuation investment return. The expected actuarial asset value is equal to the preliminary expected actuarial value plus the unrecognized investment gains and losses as of the beginning of the previous fiscal year. Twenty percent (20%) of the gain/loss as measured by the difference between the expected actuarial value and the market value at the valuation date is added to the preliminary expected actuarial value plus twenty percent (20%) of the unrecognized gains or losses for the four preceding fiscal years. The final result is constrained to a value no less than 80% and no more than 120% of the market value at the valuation date.
8. The actuarial assumptions and methods used in the valuation were adopted by the Board based on System
experience from July 1, 2013 through June 30, 2016.
OKLAHOMA PUBLIC EMPLOYEES RETIREMENT PLANAdministered by the Oklahoma Public Employees Retirement System
75 2017 Comprehensive Annual Financial Report

OKLAHOMA PUBLIC EMPLOYEES RETIREMENT SYSTEM
Summary of Actuarial Assumptions and Methods (continued)
Schedule 1 Withdrawal From Active Employment Before Age & Service Retirement and Individual Pay Increase Assumptions
Sample
Service Values
Withdrawal
Sample
Ages
Percent Increase in Individual’s Pay During
Next Year 1 22.00% 25 7.80% 5 10.50 30 6.30
10 6.00 35 5.50 15 4.25 40 5.20 20 3.00 45 4.80 25 1.75 50 4.50
55 4.30
Schedule 2A Percent of Eligible Regular Non-Elected Active Members Retiring Within Next Year Those Eligible for Unreduced Retirement and Hired Before November 1, 2011
Retirement Ages
Percent
Retirement Ages
Percent
50 15% 61 20% 51 15% 62 25% 52 15% 63 15% 53 15% 64 15% 54 15% 65 30% 55 10% 66 25% 56 10% 67 25% 57 11% 68 25% 58 12% 69 25% 59 13% 70 100% 60 14%
OKLAHOMA PUBLIC EMPLOYEES RETIREMENT PLANAdministered by the Oklahoma Public Employees Retirement System
76 2017 Comprehensive Annual Financial Report

OKLAHOMA PUBLIC EMPLOYEES RETIREMENT SYSTEM
Summary of Actuarial Assumptions and Methods (continued)
Those Eligible for Unreduced Retirement and Hired on or after November 1, 2011
Retirement Ages
Percent
60 * 61 * 62 * 63 * 64 * 65 * 66 20% 67 20% 68 20% 69 25% 70 100%
*30% when first eligible and 15% thereafter.
Schedule 2B Percent of Eligible Non-Elected Active Members Retiring Within Next Year Those Not Eligible for Unreduced Retirement or Department of Corrections Members With Less Than 20 Years of Service, hired before November 1, 2011
Regular Employees Department of Corrections
Retirement Ages
Percent
Retirement Ages
Percent
Retirement Ages
Percent
55 3% 55 4% 63 22% 56 4% 56 5% 64 25% 57 4% 57 5% 65 40% 58 5% 58 5% 66 25% 59 6% 59 5% 67 25% 60 6% 60 5% 68 25% 61 15% 61 20% 69 25%
62 40% 70 100%
OKLAHOMA PUBLIC EMPLOYEES RETIREMENT PLANAdministered by the Oklahoma Public Employees Retirement System
77 2017 Comprehensive Annual Financial Report

OKLAHOMA PUBLIC EMPLOYEES RETIREMENT SYSTEM
Summary of Actuarial Assumptions and Methods (continued)
Those Not Eligible for Unreduced Retirement and hired on or after November 1, 2011
Regular Employees Department of Corrections
Retirement Ages
Percent
Retirement Ages
Percent
Retirement Ages
Percent
60 7% 60 7% 66 25% 61 7% 61 20% 67 23% 62 20% 62 20% 68 22% 63 15% 63 20% 69 21% 64 15% 64 20% 70 100%
65 40%
Schedule 2C Percent of Eligible Active Members Retiring Within Next Year Department of Corrections Members With More Than 20 Years of Service
Service Percent 20 25% 21 25% 22 20% 23 - 24 15% 25 - 29 23% 30 - 34 25% 35 100%
OKLAHOMA PUBLIC EMPLOYEES RETIREMENT PLANAdministered by the Oklahoma Public Employees Retirement System
78 2017 Comprehensive Annual Financial Report