ad-a022 incorponated
TRANSCRIPT

AD-A022 433
LIFT, DRAG, AND PRESSURE DISTRIBUTION EFFECTSACCOMPANYING DRAG-REDUCING POLYMER INJECTION ONTWO-DIMENSIONAL HYDROFOIL
Daniel H. Fruman, et al
Hydronautits, IncorponAted
"Prepared f'or:
Office of Naval Research
October 197'
.!. S.IIE KA NTO CmaY
- t

093103
A pprove!- for p~thic relpsa se s r n! 1,3n ;un I tý ei. 1'
HYDRONAUTICS, incorporatedresearch in hydrodynamics
Wu~gl& C. musPuete h" aw I"ead Cetp. Luw& M
V4 TaA ~IfdC

HYDRONAUTICS, Incorporated
TECHNICAL REPORT 7101-5
L :T, DRAG, AND PRESSUREDISTRIBUTION EFFECTS ACCOMPANYING
DRAG-REDUCING POLYMER INJECTIONON TWO-DIMENSIONAL HYDROFOIL
By
D. H. Fruman,Marshall P. Tulin,and Han-Lieh Liu
October 1975
Approved for public release; distribution unlimited.
I
Prepared for
Office of Naval ResearchDepartment of the Navy
UnderContract No. N00014-71-C-0063
NP 062-325

UNCLASS IFIEDSECURITYg CLASSIFICATION Or THIS PAGE (fth.Do ffatE#eroo
REPORT DOCMENTATION PAGE REA~D INTRUONMI. REPORT NUMBER GOVT ACCESSION NOF S. RECIPIENT'S CAT-ALOG NUMBER
4. TILE~id~ubl~e)S. TYPE or REPORT a PERIOD COVERED
EFFECTS ACCOMPANYING DRAG-REDUCING POLYMEBTcnclRprINJECTION ON TWO-DIMENSSIONAL HYDROFOIL 6. PERFORMING ORG. REPORT NUMBER
7. AUTHOR(aJ e. CONTRACT OR GRANT NUMMER1aj
Daniel H. Fruman, Marshall P. Tulin,NOO -lC.06and Han-Lieh Liur9. PERFORMING ORGANIZATION NAME AND ADDRESS SO. PROGRAM ELEMENT. PROJECT. TASKIH YDRONAUTICS, Incorporated AE OKUI UBR
7210 Pindell School Rd., Howard Co.,. 062-325Laure. Mý.20810 )11I. C')NTROLLING OFFICE NAME AND ADDRESS 12. REPORT DATE
Office of Naval Research (Code ~438) October 1975Department of the Navy 13. NUMBER OF PAGES
Arlington, Va. 22217 '481T4. -MONITORING AGIENCY NAME A AODRESSf5i EW.iffoe *00 Cnugp.*i&, Oifl..j IL SECURITY CLASS. (*I WeB r~3a"#Q
UnclassifiedISM. DECL ASSI PIC ATION/ DOWN GRADIP45
* SCHEDULE
IS. DISTRIBUTION STATEMENT (of'chi* Report)
Approved for public release; distribution unlimited.I17. DISTRIBUTION STATEMENT (of the abotrtct mimEd 1n &lot* fl. ItIbaea ba *,ef
I0. SUPPLEMENTARY NOTES
19. KEY WORDS (Centimua on rower** side #l*@W uaa8mT- Idonfllf? by block O&MW)
Polymer Additives HydrofoilPressure distributionDr-ag effectsLift effects
20.- ABSTRACT (Con~tiOnu mi W9 Oalaad* It ftc"Gaey sfd #d*An#f 67 block number)
Lift and drag forces and pressure distribution were measuredfor a 10 cm. chord, 20 percent relative thickness, MACA 634-020.,symmetrical, two-dimensional hydrofoil, with and without drag-reducing polymer injection. The 200 ppm solution of Polyox WSR301 was introduced into the foil boundary layer wit~h an injectionvelocity of 10 percent of the free stream velocity. The injection
DD , ~~S 1473EDITION oF I NOV 66 It OBSOLETEUNLSIFE
SjN ooi-@i-S~tSECURITY CLASSIFICATION OF THIS PAGE (*%mon 008& "#MOM

UNCLASSIFIED3.kC.UnITY CLASSIFICATION OF T S141 PAOFIMbS DIEN E.rOtO)
20. Cont'd.
slits were situated at 10 and 30 percent of the chord length.
The pressure distribution data dcec not indicate any sig-
nificant change of the separation point. It demonstrates,however, that the polymer injection always results in a sig-nificant decrease of pressure in the region aft of the injectionslit.
This decrease of the local pressure gives rise to a liftincrease for injections made on the suction side of the foilsurface and a lift decrease for injections made on the pressureside.
The data suggest an elongational viscoelastic effect anda tentative explanation is offered.
UNCLASSIFIEDStCuRITY CLASSIVICAT|ON Of ThIS PAO9(fren DN A8106 4

J'1
HYDaOaAtICS, Incorporated -1-
TABLE OF COCMTS
page
ABSTtACT ..... *e*... ... e.. 04 . o. ..... ***.****4** 1
IN."SODUc1CTION * ................... * *...... ... .. .......... . 2
EXPEIUCJNTAL PROCEEI3 ....................... ....... 3STEST PROCEDURES ...................... 6PREC4ISIO&O AND ACCURACY OF M DATA........................ 7
RESU'Lls. . . . . . . . . . . . . . . . . . ....... v * *4t* 4 . ......t* 11
Llft ezui Drag . ........ . . h.
•Pressum~s .........
- DISCUSIO ,............ . ... .. ..... .. .......... ..... 16"C t
i3cdary Layer Thinning. . .. -. . . I iT_ -L: t n ....
StVASY AN) C -iCLUSIK. a0
ttt ...VRSES.. .. .. .*... .. 23
0 I
HYDRONAUTICS, Incorporated -ii-
LIST OF FIGURES
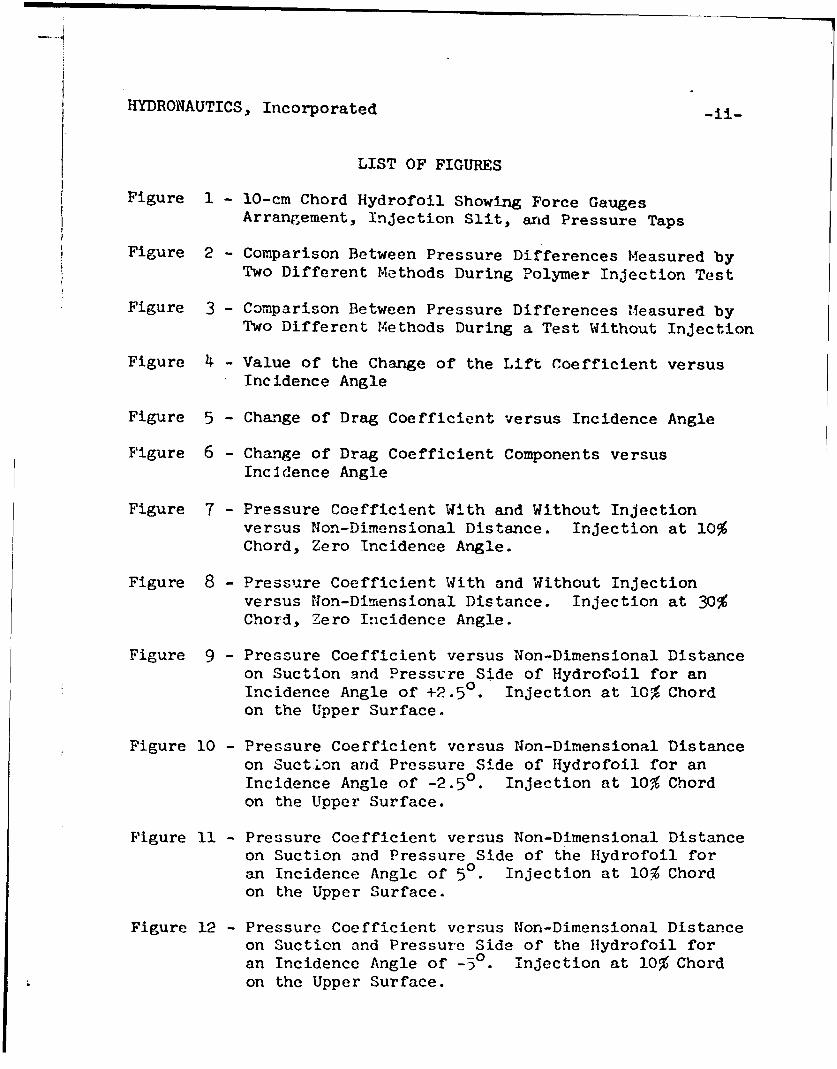
Figure 1 - 10-cm Chord Hydrofoil Showing Force GaugesArrangement, Injection Slit, and Pressure Taps
Figure 2 - Comparison Between Pressure Differences Measured byTwo Different Methods During Polymer Injection Test
Figure 3 - Comparison Between Pressure Differences Measured byTwo Different Methods During a Test Without Injection
Figure 4 - Value of the Change of the Lift Coefficient versusIncidence Angle
Figure 5 - Change of Drag Coefficient versus Incidence Angle
Figure 6 - Change of Drag Coefficient Components versusIncIdence Angle
Figure 7 - Pressure Coefficient With and Without Injectionversus Non-Dimensional Distance. Injection at 10%Chord, Zero Incidence Angle.
Figure 8 - Pressure Coefficient With and Without Injectionversus Non-Dimensional Distance. Injection at 30%Chord, Zero Incidence Angle.
Figure 9 - Pressure Coefficient versus Non-Dimensional Distanceon Suction and Pressure Side of Hydrofoil for anIncidence Angle of +2.5°. Injection at 10% Chordon the Upper Surface.
Figure 10 - Pressure Coefficient versus Non-Dimensional Distanceon Suet 'on and Pressure Side of Hydrofoil for anIncidence Angle of -2.50. Injection at 10% Chordon the Upper Surface.
Figure 11 - Pressure Coefficient versus Non-Dimensional Distanceon Suction and Pressure Side of the Hydrofoil foran Incidence Anglc of 5°. Injection at 10% Chordon the Upper Surface.
Figure 12 - Pressure Coefficient versus Non-Dimensional Distanceon Suction and Pressure Side of the Hydrofoil foran Incidence Angle of -3 . Injection at 10% Chordon the Upper Surface.

HYDRONAUTICS, Incorporated -iii-
Figure 13 - Pressure Coefficient versus Non-Dimensional Distanceon Suction and Pressure Side of the Hydrofoil for anIncidence Angle of 5 . Injection at 30% Chord on theUpper Surface.
Figure 14 - Pressure Coefficient versus Non-Dimensional D-stanceon Suction and Pressure Side of the Hydrofoil for anIncidence Angle of -5°. Injection at 30% Chord onthe Upper Surface.
Figure 15 - Comparison of the Value of the Change of the LiftCoefficient Computed from Force and PressureMeasurements
Figure 16 - Pressure Defect Measurements with a Pitot Tube Probe-Effect of Polymer Concentration
Figure 17 - Pressure Defect Measurements with a Pitot Tube Probe-Effect of Outside Diameter of Probe
Figure 18 - Pressure Defect Measurements with a Pitot Tube Probe-Effect of Velocity Over Outside Diameter Ratio
Figure 19 - Absolute Change of the Lift Force versus Free StreamVelocity
Figure 20 - Absolute Change of the Lift Force versus LocalVelocity at the injection Station
Figure 21 - Disturbance Due to Jet Swelling

HYDRONAUTICS, Incorporated
ABSTRACT
Lift and drag forces and pressure distribution were
measured for a 10 cm. chord, 20 percent relative thickness,
NACA 634-020 symmetrical, two-dimensional hydrofoil, with and
without drag-reducing polymer injection. The 200 ppm solution
of Polyox WSR 301 was introduced into the foil boundary layer
with an injection velocity of 10 percent of the free stream
velocity. The injection slits were situated at 10 and 30 per-
cent of the chord length.
The pressure distribution data does not indicate any
significant change of the separation point. It demonstrates,
however, that the polymer injection always results in a sig-
nificant decrease of pressure in the region aft of the injection
slit,
This decrease of the local pressure gives rise to a lift
increase for injections made on the suction side of the foil
surface and a lift decrease for injections made on' the pressure
side.
The data suggest an elongational viscoelastic effect and
a tentative explanation is offered.

HYDRONAUTICS, Incorporated 2
INTRODUCTION
Significant research has been devoted to lift effectsassociated with drag-reducing polymers since Wu's discovery of
pump effects in 1969(16) Some of the research has involved
tests on propellers finite span hydrofoils 3 circular
cylinders and two-dimensional hydrofoils(5) in homogeneouspolymer solutions. Other research has involved tests on hydro-
foils with polymer injection on the foil surface (67,8), asmight actually be used in practice. In addition, tests with
localized injection may facilitate separation of the different
effects which can occur in homogeneous solutions, such as the
leading edge and distributed surface effects.
The present tests are a continuation of earlier investiga-
tions of polymer effects on two-dimensional hydrofoils(7' 8 ),I
comprising extensive measurements of lift and drag changes over
a rather wide range of injection conditions on two foils of
similar shape but of different thicknesses and with a single
injection position.
Past tests established that under the circumstances of these
tests a lift augmentation generally occurred with injection on
the upper surface of the foil. The specific purpose of the pres-
sent tests was to measure the pressure changes on the foil surface
*Numbers in parentheses indicate references listed at the endof this report.

HYDRONAUTICS, Incorporated 3
accompanying injection and lift changes. The results, described
herein, are somewhat surprising as they show, in general, that
maximum pressure changes occur in the region aft of, and close to,
the injection slit. These data, together with a new analysis of
previous lift data (which show a critical speed for onset of lift
effects) seems to indicate that an elongational viscoelastic ef-
fect is involved and that the lift effects are not directly re-
lated to drag reduction.
EXPERX-1ENTAL PROCEDURE
The tests were performed in the HYDRONAUTICS High Speed
Channel'", modified to obtain a two-dimensional flow and to
eliminate the free surface effects which may otherwise have
cccurred at the high speeds used in these tests. This modifi-
cation incorporated a roof with a specially designed transition
which was attached to the original free surface sluice gate of
the channel. A slightly oversized hole allows free passage of
the models through the roof. The foil was supported vertically
by means of a block gauge arrangement and an incidence-control
system, as indicated in Figure 1. In order to eliminate air
entrainment which might have been induced by low pressures on
the suction side of the foil, the upper side of the roof %as
flooded. To create the best conditions for a two-dimensional
flow and to avoid secondary flows between the lower and upper
section of the roof, an end plate was fitted to the cross -
section of the foil, being free to move with it (Figure 1)./-
This arrangement did not completely eliminate the secondary flow
and did not restore a completely parallel flow. The testing
set-up has previously been used in extcnsive strut testing at
H}DRONAUTICS and is thoroughly discussed elsewhere(10). it is
believed to be suitable for these comparative measurements of
the hydrodynamic characteristics of foils with and without
injection.

HYDRONAUTICS, Incorporated 4
The foil used in this investigation was a NACA 63 symmet-
rical profile, 1.0.16 cm. in chord with 20 percent maximum rela-
tive thickness at 30 percent of the chord. Spanwise injection
slits were situated at 10 and 30 percent chord distance from
the leading edge. Ten pressure taps were arranged diagonally
on each side of the foil at an angle of 52 degrees to the stream
so that the downstream influence of each on the others was min-
imized. The pressure taps extended approximately from 20 percent
to 90 percent chord and were 1.01 mm. in diameter.
The injection slits were designed so as to minimize possible
local perturbations produced by the ejected fluid. The inclina-
tion of the slits, relative to the foil tangent at the injection
station, was 7 degrees for both foils. Based on an empirical
relationship describing the diffusion of a dilute polymer solu-
tion over a flat plate obtained by Fruman and Tulin(11) the gap
of the injector was selected to be 0.0127 cm. For reference,
the estimated sub-layer thickness at a speed of llm/sec in water
without additives is 0.003 cm.
The foil was fabricated from aluminum and thep. chrome
plated. A silicone spray was applied to the surface of tLe
foil in order to preserve the quality of the finish.
The free streanm velocity in the test section was measured
with a 3 mm. diameter Prandtl tube placed ahead of the hydro-
foils. Though it is known, in general, that the stagnation
pressure readings of such tuoes n*'e affected by polymer solutions,
it is certain that in the present case the relatively small
buildup of polymer concentrations (less than 1 ppm) in the re-
circulating water make any significant errors highly improbable.
The lift and drag forces were measured by means of four
reluctance-type block gauges, HYDRONAUTICS Modular Force Gauge
1HYDRONAUTICS, Incorporated 5
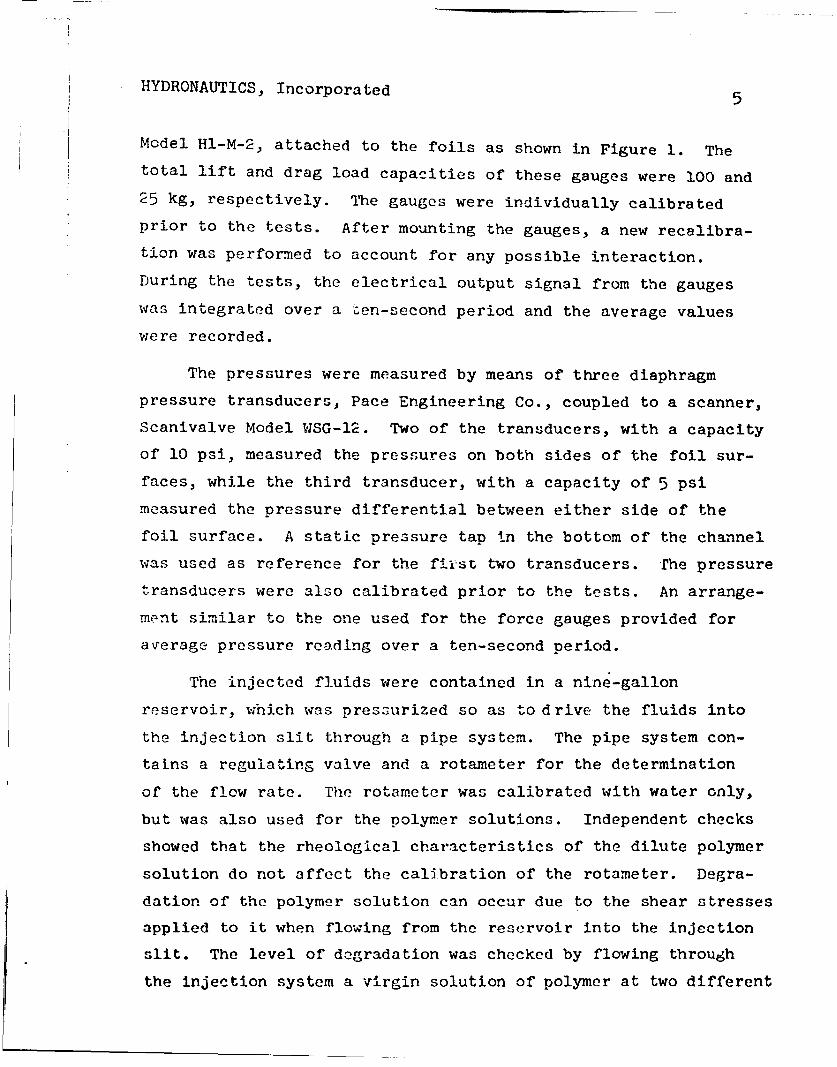
Model Hl-M-2, attached to the foils as shown in Figure 1. The
total lift and drag load capacities of these gauges were 100 and
25 kg, respectively. The gauges were individually calibrated
prior to the tests. After mounting the gauges, a new recalibra-
tion was performed to account for any possible interaction.
During the tests, the electrical output signal from the gauges
was integrated over a den-second period and the average values
were recorded.
The pressures were measured by means of three diaphragm
pressure transducers, Pace Engineering Co., coupled to a scanner,
Scanivalve Model WSG-12. Two of the transducers, with a capacity
of 10 psi, measured the pressures on both sides of the foil sur-
faces, while the third transducer, with a capacity of 5 psi
measured the pressure differential between either side of the
foil surface. A static pressure tap in the bottom of the channel
was used as reference for the fikst two transducers. The pressure
transducers were also calibrated prior to the tests. An arrange-
ment similar to the one used for the force gauges provided for
average pressure reading over a ten-second period.
The injected fluids were contained in a nine-gallon
reservoir, which was pressurized so as to drive the fluids into
the injection slit through a pipe system. The pipe system con-
tains a regulating valve and a rotameter for the determination
of the flow rate. The rotameter was calibrated with water only,
but was also used for the polymer solutions. Independent checks
showed that the rheological characteristics of the dilute polymer
solution do not affect the calibration of the rotameter. Degra-
dation of the polymer solution can occur due to the shear stresses
applied to it when flowing from the reservoir into the injection
slit. The level of degradation was checked by flowing through
the injection system a virgin solution of polymer at two different

HYDRO. 'ICS, Incorporated 6
flow rates. The solutions so circulated were collected and
tested for their drag reduction properties in a 3 mm. diameter
stainless steel pipe. The results of these tests demonstrated
no noticeable decrease of the drag reduction properties of the
circulated solutions when compared to the virgin solution. It
was therefore considered that the injection system does not
introduce a degradation of the polymer solutions capable of
significantly affecting the experimental results. The ratio
between the injection velocity and the free stream velocity,
the "rate of injection," was kept constant at 0.1 throughout
the test.
The polymer used in these tests was poly (ethylene oxide),
POLYOX WSR 301*, which has been demonstrated to be a highly
efficient drag-reducing agent in internal and external flows(II).
The solutions were al:.ayz prepared in a concentrated form (1000
ppm), the day before utilization, by gently mixing the dry
powder with the necessary amount of tap water. No specific
precautions were taken Lu !imit biological degradation of the
solutions.
TEST PROCEDURES
For all tests a specific procedure was followed in order
to eliminate possible errors and increase the degree of confi-
dence in the results. Before any injection test, the specified
hydrofoil incidence angle was set and the free stream velocity
was established in the recirculating water channel. This
velocity was continuously monitored throughout the test. The
standard deviation in the mean value of the velocity for a
series of ten measuremrents was about 0.25 percent. After setting
Manufactured by Union Carbide Corporation.

HYDRONAUTICS, Incorporated 7
the velocity, a first series of measurements of the velocity
and the lift and the drag forces was performed. The fluid was
then injected and upon stabilization of the lift and drag volt-
meters a record of the displayed values was taken. A new mea-
surement was made about ten seconds later. The injection was
then discontinued and upon stabilization of the digital volt-
meter a reading of the parameter values without injection was
taken again.
During the experiments conducted to measure the pressure
distribution the above procedure was repeated for each pair of
pressure taps. The pressures were recorded once without any
injection, twice during injection and once again without injec-
tion. This test procedure is believed to insure the reliability
of the data.
The question of precision and accuracy of the data is
discussed below.
PRECISION AND ACCURACY OF THE DATA
The objective of the test program was to investigate the
relative changes caused in the hydrodynamic forces and the pres-
sure dist;ribution between an injection of water and dilute
polymer solution; for a proper assessment of these small changes,
it is essential to ascertain the basic accuracy and degree of
repeatability of the measurements under conditions of zero
injection.
sources of experimental error are inadequacies in the
measuring equipment (such as the force gauges and the pressure
transducers), unsteadiness of flow conditions ahead of the hydro-
foils (turbulence as well as low-frequency fluctuations) and
model deflection under loads.

'HYDRONAUTICS, Incorporated 8
The force gauges are sufficiently linear in the operating
range of the tests for any errors due to nonliisearities to be
negligibly small. Moreover, since the force measurements are
obtained from a ten-second integration of the instantaneous
rgauge output, errors due to high-frequency velocity fluctuations
are unlikely. The above applies also to the velocity fluctua-
tions which are integrated during a ten-second period. In a
previous paper()" ", the question of repeatability of the tests
was analyzed. It was concluded then that the lift and drag co-
efficients can be expected to be reproducible within a variation
range of ±2 percent. This question has been further investigated
during the present research phase. Table 1 ihows the values of
the mean velocity, and the mean lift and drag coefficients with-
out injection resulting from the twenty individual measurements
performed during each test. Also the associated standard devia-
tion in percent is shown in the same table. in considering this
table it can be seen that the standard deviation associated with
the velocity fluctuation was always well below 1 percent and
generally below 0.25 percent. The force coefficients did not
show much larger standard deviations.
If the values of the force coefficients for the same
incidence angle are considered all together, they show for 5
degrees incidence a standard deviation of 3.2 percent; while
for an incidence of 2.5 degrees, the standard deviation is 2.6
percent. The drag coefficients show standard deiations of 3.8percent arid 1.0 percent for 5 degrees and 2.5 degrees,
respectively.
The mean drag cooffici.ýnt for zero incidence angle for six
tests comprising twenty individual mcasurements each is 0.01415
with a standard deviation of 1.4 percent. F.'or standard roughness
and Reynolds numbers of 6.0 Y l0 , the drag coefficient of a

HYDRONAUTICOS, Incorporated9
4-3 -0
C) V.3 O
%.i (i)U) ' 0
c, Q0
(Y) (Y) -:- ~r C tF\ Ln Cr)l (Y .G\ Cm, '00 COO Cmi r-4
OCC LUkl CV)()CmU\ ~ 1X ~~ (NI U(' fmU r4 -4H r-4r-4 I -4HW 000000000000000000
U)~~~ 0 ( a 0 04 0-U 0J 0 ~\r~oC f
.C. if\4t- M0-'f4 0 H V'ý N -t\00 0n LnkO.0O~r
0 ~4 - 4 v4 4 - >
4.4
0 0 0'~ DI a. -t~ ~ -
-r-i0 0 \,O 0 r- M CM m H N 0-4 Q r4o H' 0
4.3~ 00 00000000000001- I -t L\ 4 Z 4()U\zrH00CO D 43 0- N El IIi r4m(1 L MLNJCt C
-r- VO _____ al ___________________________M__4 -I -ir-1r- rq H
>A SL r 1, . . . . . .
U) -4' tI-4 000000000000000000
U) (T-- z3
m 00 S-
U) 4- 000000000000000000
-r-4 4- )>C.)) 00(1
S) 4- 00 0 0000
a) ) - co v co \.o - co- in- i- i>-- LP- (y- co F- Qo s- r-t- co-
4-' 0' co3oaaýoJC O0G0*~ C; r-4 H 6 8 6I- ~ ~ C (U i r- (X4ri (" 4 H' CU l (Xi (Xi ( i r-4 C-i H HH H H
0-%0 0 0 0 0 0 0 0 0 0 0n 0' 0n 0n 0n Hn H H
-H -1HHlll U 1 4r.LA 4 lývý ý s 4 HHHH
0 3.
CAHH HHHH H H U Xii H U H U H " H ' H (Xi

HYDRONAUTICS, Incorporated 10
very similar foil (634-021) given in iLeference 12 is 0.011.
The 30 percent larger values measured during the present tests
can be ascribed to some of the experimental problems discussed
earlier.
In conclusion, during a given test, the velocity and forces
on the hydrofoil are very stable with standard deviations below
1 percent. Between tests, the force coefficients show more
significant differences which may be as high as 3.8 percent.
These differences are mainly due to the -"ifficulty of precisely
reproducing the incidence angle of the foil. This latter aspect
of the problem does not have any direct bearing on the analysis
of the results, since the tests with and without injection are
made without changing the hydrofoil angle setting.
The pressure gauges were checked for proper operation by
comparing the difference between the pressures measured with
two of the gauges against the pressure differential of the third
gauge. Figures 2 and 3 show the agreement between both measure-
ments for a foil incidence of 5 degrees and a velocity of 11 m/sec
with and without injection.
Another way to check for the precision of the pressure
measurements is to consider the lift coefficients computed from
the force measurements with the lift coefficients obtained from
the integration of the pressure coefficients. The pressure
distribution on both sides of the foil surface for a given lift
coefficient can be computed, for an inviscid and unbound flow,
using the orocedure given in Reference 12. Figure 3 shows the
agre-..nt between the computed pressure difference between both
surfaces of the foil and the experimental results. The percent
of total lift contributerd by the differential pressure distri-
bution between the first and the last pressure taps is 51.47
I

HYDRONAUTICS, Incorporated II
in the case of the theoretical computation and 47.32 in the case
of the experimental results. The difference between both values
is small and may result from several factors such as boundary
layer and separation effects on the pressure distribution,
especially over the last 30 percent of the chord and the wall
effect due to the limited width of the channel. It would seem
from the above that the pressure measurements are well within
"the range of unavoidable experimental errors.
RESULTS
Lift and Drag
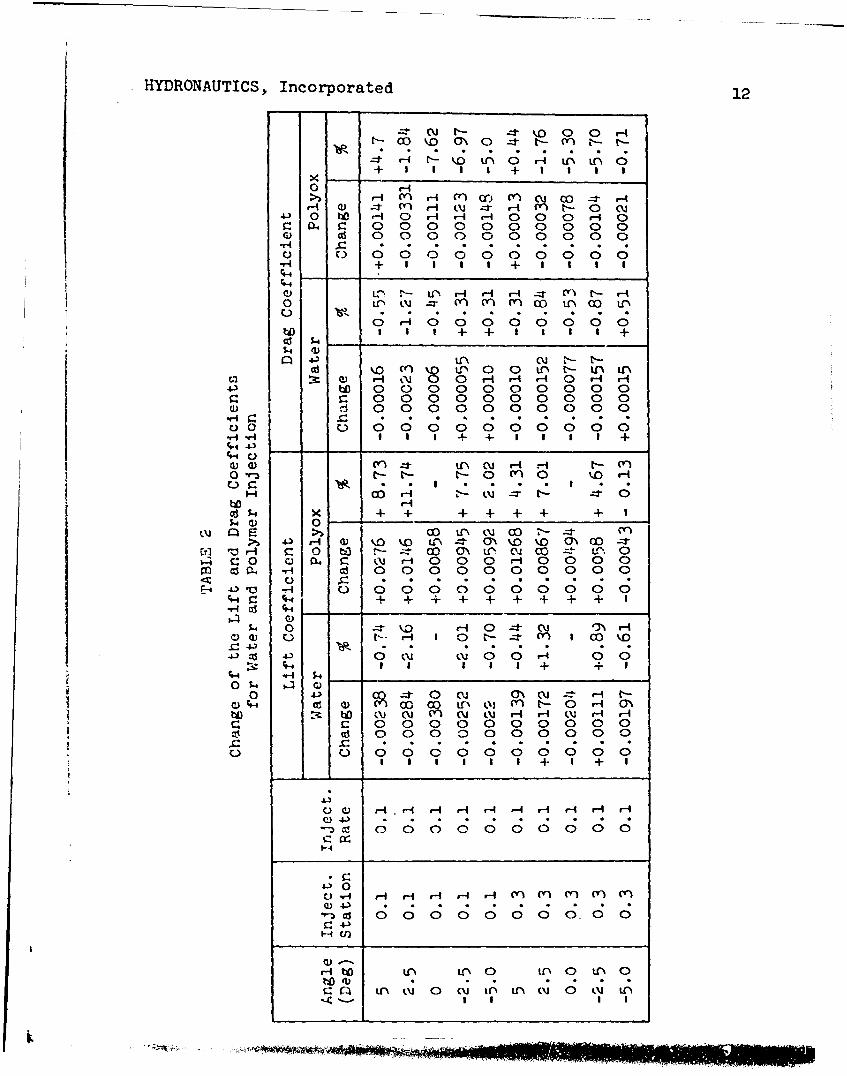
The effect of injection on both lift and drag coefficients
of the hydrofoil is summarized in Table 2, where injection is
always made on the upper surface and the lift is always measured
positive upwards. In eight out of ten measurements the injection
of water created a down force, as might normally be expected
from a jet flap effect.
In every case, the injection of polymer caused an upward
force relative to the water injection case, the.magnitude gen-
erally increasing with incidence and being greater in the case
of the 10 percent injection position than for 30 percent. The
difference between lift coefficients measured with polymer in-
jection and no injection at all, ACL, is plotted in Figure 4.
Over the range of incidence used, the pressure coefficients are
always negative in the region of injection, their magnitude in-
creasing with incidence. The lift results therefore suggest a
dependency of the polymer effect on the local velocity in the
region of injection, and/or a possible dependency on the velocity
gradients over the upper foil surface; this dependency will be
discussed later.
HYDRONAUTICS., Incorporated 12
-4- Cu r-- -- 0 0 H
+ I I I I + I S Ix -
0 r-H M~' Hi MO- m O c ~
H .-* m~ H wx -:- H M' t-- 0 N'0. Q o V-1 0 H- H 9- 0 0 0 r-i 0P 0 C 0 00 0 00a000 0
Q) C 0 00 00 00 00 0.~ . .. . . . . .
C. )0 0 0 0 0 0 0 0 0 0w-4 + I I I I + I I I
bo +~ + +
GOa) H %N H.. H~~. H. 0 LC r-4 H4.3 C) C.uQ H0 H H0 0 HH0
0 0 0 0 0 000 0 00
0 0 0 0000 000 00 0
I ~ +1 + 3 I I I +c*14
CuC 0) H Ho- c- t- - 0 M 0 ý'.0
I-I ~ ~ ~ OC r - U .4 - 4
x + + + + + +- +$40
r-4 a) %o' "0 unko M C)r- r-~ C) to 0 C-- LCO a\- a'. '0 cc) O 0
0 0 00.4 C 0U 0- 00 H- 00000 0S0 0 S 00 00 0 00
o ~ ~ .~ . . . . . . . .
E- ') ri 0 0 00 00 0 000 0r4ci 94.+ + + + +
.. 0 -4- '. H 0 -t (u yV0 0L C.) H I 0 N4 I CO kD
4.) 00 4.3 (U (. 00 -40-~ ~I I I I + +
0o-) CA 4-t0 NU M( N - I--cc Q) C Of a:) iri,' CrN- a\'
W tW ('U (\U (\('. al H H (U H- HCC 0 00()00 0 000 0
) 0S 00 00 00 00 0.c . . * . . . . .
00 0 0 000 00 00 0
4.)
F-4 ,-. H H '4
r- to 0 0 0 0 0r 0w -- 4
C~- H- t4 V) (~() V

HYDRONAUTICS, Incorporated 13
The change in the drag coefficient, ACD, shown in Figure 5
is, in the case of a two-dimensional foil, composed of two terms,
AC the friction drag, and ACD the pressure drag, where:
&C D = CD (polymer) - CD (water)
= ACD + ACD
"The rapid rise in ACD, to positive values as incidence
increases, suggests a pressure drag effect due to the reduced
surface pressures acting over the rearward sloping portion of
the foil. These can be estimated by integration of the product
of measured pressures and slopes, assuming that no pressure
changes occur outside of the region of the pressure taps (40-90
percent chord). The results are shown in Table 3 together with
the friction drag changes deduced by subtracting the calculated
estimates of ACD from the measured values of &CD, and they are
plotted in FigurB 6.
The roughly parabolic shapes of the pressure drag curves
reflects the roughly linear increase of the lift changes with
incidence shown in Figure 'I. The generally smaller pressure
drag for the .1 chord injection position reflects the fact that
the slope of the foil is forward facing for positions upstream
of the .3 chord at zero and negative incidence. For the higher
positive angL!%; of attack the forward thru:;t effect di3appears,
as the data indicate. The deduc'.-d values of friction drag are
shown alwi-ys to be reduced by the additive, and by a greater
amount in th, case of tho .3 chord injection than for the .1
posit'on, an effect which is contrary to ext)ectation and which
remains unexplained. It must be remembered though, that the
decomposition of ACD is very sensitive to pressure changes over
the nose of the hydrofoil, should they occur.

HYDoafUTCS,, Irtcorpermted
e, 0000 0 0
. . . . .
V4 r G14. 1 U't " i.
C,~
Hv V
0-
I0I4

HYDRONAUTICS, Incorporated 15
The friction drag coefficient for the foil, estimated froma turbulent friction curve, is approximately 0.009, so that the
estimated changes in friction drag coefficient in the range
.0005 to .002- correspond approximately to a 10-40 percent fric-
tion reduction, when account is taken that injection occurs on
one side only. The larger value corresponds to the .3 injection
position and is in accord with drag reduction estimates which
can be made using the result of (11), but the lower value, for
the .1 position, is only about 25 percent of the estimate.
Pressures
The pressures measured on the injection side of the foil
at zero incidence are shown in Figures 7 and 8, for the cases
with and without polymer injectionand for the two injection
positions. In both cases, the pressures aft of the injection
slit are significantly reduced when injection occurs, the re-
duction falling toward the rear of the foil. The pressure
changes upstream of the .3 chord slit arp general]..y small. Dur-
ing these tests the pressures on the foil surface opposite to
injection were also measured. In the case of the .3 slit, the
effect of polymer injection on these latter pressures was
negligible, i.e.. generally within the repeatability of the
measurements (about .002 in C). In the case of the .1 slit,
however, there seems to be a perceptible reduction in the mag-
nitude of C (an increase in pressure) on the lower surface inp.
the region between 0.1 and 0.5 chord, during injection on the
upper surface; the avt-vrage value of this change in C is aboutp-0.008. Similarly, the data for other angles of attack, Figures
9-14, show a negligible effect of injection cn bottom surface
pressureo for injection ot .3c, but a noticeable effect for
injection at .1c, except for a = -50, the effect seeming to
increase with increasing incidence.

HYDRONAUTICS, Incorporated 16
A comparison of the absolute values of the lift coefficients
computed from the force gauge measurements with those computed
from the pressure measurements indicates, Figure 15, that the
latter values somewhat overestimate, in general, the effect of
polymer injection. This overestimation may be due again to
neglect of pressures on that portion of the foil surface forward
of .187 chord, implying increased values there as a consequence
of injection.
One additional feature of the measured pressure changes
deserves mention, the rather large variation from point to point.
Whether these are an artifact of the measurement technique or
[ have a cause in Che phenomena involved is not, at present, clear.
The apparent scatter does, however, seem to be greater than the
estimated resolution in C (.002) would suggest.p
DISCUSSION
Different hypotheses can be advanced to explain how polymers
alter pressure distributions and lift forces on two-dimensional
hydrofoils. 'iyp.otheses relating such effect to a change in the
separation point, to asyrmnetric bcundary layer thinning and to
some kind of viscoelastic effect have been suggested. These
possibilities are briefly discussed below, with an emphasis on
viscoelastic phenomena.
Separation
.he prei-sure distributions shown ,reviously here do not
seem to show any changez which can clearly be identified as
arfecting separation favorably. The fact that the pressure
changes tend to occur most generally and in greatest magnitude
just aft of the injection slits, make it difficult to ascribe
the changes to separation effects.

HYDRONAUTICS, Incorporated 17
Boundary Layer Thinning
The pressure distribution on a hydrofoil is effected by the
boundary layer. This effect may be taken into account by con-
sidering the hydrofoil shape to be altered by the displacement
thickness of the boundary layer. Drag reduction and subsequent
boundary layer thinning on the upper surface, only, of a sym-
metrical foil will therefore produce a lift force. The magnitude
of this force can be estimated by imagining a change in incidence,
Aa, related to the change in 5*, the displacement thickness at
the trailing edge of the foll, and multiplying Aa by an appro-
priate lift curve slope, AC /Aa.
iL
= -5- 57.3 (degrees)
C
I (1.2) --1. according to simple momentum theoryC
and where we assume " = 1.29, and 9 is the momentum thickness.
Using AC L//An = .08/degree.
ACL 3AC
These values are tabulated below, using ACf values from Table 3.n Inj. Sta. &CLf(friction) ACLm(measured) ACLm - ACLf
+5 0.1. +.0020 +.0276 +. 0256+2.5 +. 0022 +.QO146 +.0124
0 +. O0 34 +.0086 +.0052-2.5 +.0012 +.0095 +.0083-5 +.0018 +.0059 +.0041+5 0.3 +.0055 +.0127 +.0072
+2.5 +.0050 +.0087 +.00370 +.0039 +. 00419 +.0010
+.OOkl +.0058 +.0017-5 +-.0007 -. 00043 -. 0011

HYDRONAUTICS, Incorporated 18
The Table shows that the lift induced by boundary layer thinning
could be most important in th6 case of .3 chord injection and
least in the case of .1 chord injection and a = 5 . This con-
clusion is in contrast with the changer in bottom pressures due
to injection, which were negligible for .3 chord injection and
greatest for .1 chord injection and N = 5.Nither would the
changez in pressure due to boundary layer thinning be greatest
Just aft of the injection slit and very small before. It is
therefore difficult to ascribe the major effects observed to
this cause.
Viscoelastic Effects
It is well known that dilute polymer solutions can display
viscoelastic behavior when subjected to elongational flows such
as those produced in the stagnation region of a Pitot tube probe
or when exiting from a tube( 1 3 ). In the former case the visco-
elastic effect can cause loss of head .-s measured by the Pitottube( 1 2' 1 5). This loss has been extensively studied in experi-
ments at HIYRZCNAUTICS by Wu and at the University of Crsay
(France) by Frueman and colleagues, and theoretically by Tulin
at HYD1hO:IAUTICS. The latter predicted that the anomolous pres-
sure head would occur only for super-criticnI values of a non-Udimensionnl parameter -j T where U is a characteristic flow
velocity, d a characteristic length, and T the polymer relax-[Ration time. Noe further predicted that thW anomalous pressure
would increaso linearly with the logarithm, of values of this
parnametter greater than critical. Both the data of Wu and Fruman,
et al.. vary in this way for parimeter values that are not too
large. in Figures 16-18, the measured pressure defects are
shown plotted versus the logarithm of the free stream velocity.
As demonstrated through a comparis;on of Figures 17 and 18, the
data for different probe sizes is very nearly collapsed through
use of the parameter U/d.
S.. . • .. . > - :•..,i• < • , !•'... . . . . .. . ' . .. . . . .. . • ... ... . ..

HYDRONAUTICS, Incorporated 19
The above observations suggested to us to plot the data
for added lift due to polymer injection in the same way (i.e.,
lift force vs. logarithm of the free stream velocity, V). The
data from a previous paper (7) are shown plotted in this way in
Figure 19. The law of logarithm linearity with velocity is
demonstrated but the critical velocities are dependent on foil
angle. This dependency is completely eliminated by replacing
the free stream velocity with the local velocity V,, at the
injection station, deduced from the measured pressure coeffi-
cients, as shown in Figure 20. -The critical velocity is seen
to be 9 m/sec;a value larger by an order of magnitude than the
critical velocity for drag reduction as can be calculated from
U*2 r
V
Pu* w =pV2 Cf
where u* and T are the shear velocity and stress, respectivelyw
and p the specific mass of the fluid. For Cf = .0045, P = 10-2
(cgs), and TR = 2 x 10⁻³ sec-I,
Ucrit (Cf ) =4. 5 x 10 x e x 10-)
= 33 cm/sec.
This result further suggests that the drag reduction phenomena
itself is not directly related to the lift effect, but is
fundamentally different.
The characteristic length for an elongational viscoelastic
phenomena with a critical speed (equal to the injection velocity)
of 0.7 m/sec and for a polymer relaxation time of 2 x 10⁻³ is

HYDRONAUTICS, Incorporated 20
= Uicrit X R =.7X102 x 2 x I0"7 x1.0 2
This is much smaller then the distance downstream of the slit
exit over which the turbulent diffusion of polymer is very small
(i.e., over which the polymer jet rciuains coherent), according to
(14). This latter distance is given there, according to Figure
12 of that reference, as
SlO x 10x sC x ( ) l = lO x 200 x 1 .2 x 10- 2 x (.03) = 7 mm
where v, is the injection velocity, S the slot width, and C1 the.J.
concentration.
This fact suggests the speculation that the injected polymer
swells over a distance of about 2mm. from the injection slit,
creating a local risturbance, as shown in Figure 21. This dis-
turbance would tend to effect bottom pressures much more in the
case of .1 injection than for the .3 case, as observed.
This hypothesis needs much more scrutiny. Leaving it aside,
however, the form of the lift vs. velocity curves, Figure 20,
strongly suggests that the origin of the lift and pressure changes
due to polymer injection lies in some kind of elongational visco-
elastic effect.
SUM4ARY AND CONCLUSIONS
1. Measurements of lift, drag and local pressures have been
made on a symmetrical hydrofoil of 10 cm chord and 20 cm span
with a 63,,-020 section at a water channel speed of 31 m/sec, with
and without injection of both water and drag reducing polymer.
2. The hydrofoil wss equipped with an end plate and the
flow at the center of the hydrofoil was essentially two-
dimensional.
HYDRONAUTICS, Incorporated 21
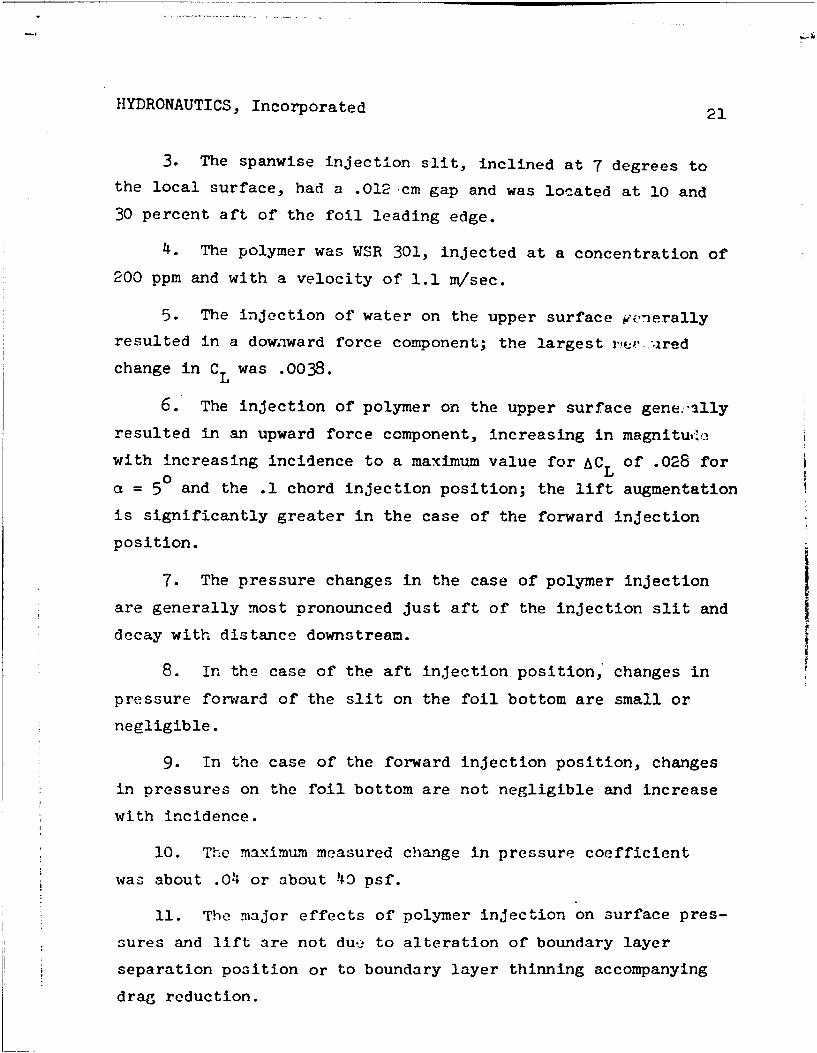
3. The spanwise injection slit, inclined at 7 degrees to
the local surface, had a .012 *cm gap and was located at 10 and
30 percent aft of the foil leading edge.
4. The polymer was WSR 301, injected at a concentration of
200 ppm and with a velocity of 1.1 m/sec.
5. The injection of water on the upper surface generally
resulted in a downward force component; the largest i', :" red
change in CL was .0038.
6. The injection of polymer on the upper surface gene:3lly
resulted in an upward force component, increasing in magnitu.'c
with increasing incidence to a maximum value for AC of .028 for05a = 5 and the .1 chord injection position; the lift augmentation
is significantly greater in the case of the forward injection
position.
7. The pressure changes in the case of polymer injection
are generally most pronounced just aft of the injection slit and
decay with distance downstream.
8. In the case of the aft injection position;, changes in
pressure forward of the slit on the foil bottom are small or
negligible.
9. In the case of the forward injection position, changes
in pressures on the foil bottom are not negligible and increase
with incidence.
10. The maximum measured change in pressure coefficient
waz about .04 or about 40 psf.
11. The major effects of polymer injection on surface pres-
sures and lift are not du.- to alteration of boundary layer
separation position or to boundary layer thinning accompanying
drag reduction.

HYDRONAUTICS, Incorporated 22
12. The lift augmentation exhibits a critical speed based
on local velocities on the foil surface, below which lift aug-
mentation does not occur; the critical speed was 9 m/sec under
the conditions of the present tests.
13. The lift augmentation varies with the logarithm of
the local velocity for speeds in excess of critical.
14. The data suggest that lift and pressure changes due
to polymer injection are due to an elongational viscoelastic
effect.
15. The suggestion is made that the effects are related
to swelling of the polymer jet within a few millimeters of the
injection slit.
16. Much more experimental research needs to be done in
order to further elucidate these effects and determine their
practical application.

HYDRONAUTICS, Incorporated 23
REFERENCES
1. Kowalsky, T., "Effect of Polymer Additives on Propeller Per-formance, J. Hydronautics, Vol. 5, No. 1, January 1971.
2. Henderson, L. H., "Effects of Polyethlene-Oxide Solutions onthe Performance of a Small Propeller," Thesis, U. S. NavaalPostgraduate School, September 1971.
3. Wolf, J. H. and Cahn, R. D., "Lifting Surfaces in PolymerSolutions," NSRDC Report 3653, May 1971.
4. Sarpkaya, T. and Rainey, P. E., "Flow of Dilute PolymerSolutions about Circular Cylinders," U. S. Naval PostgraduateSchool, NPS-59SL1021A, Febraary 1971.
5. Sarpkaya, T., "On the Performance of Hydrofoils in DilutePolyox Solutions," International Conference on Drag Reduction,Cambridge, England, September 1974.
6. Lehman, A. F. and Suessmann, R. T., "An Experimental Studyof the Lift and Drag of a Hydrofoil with Polymer Ejection,"Oceanics, Incorporated, Report Number 72-94, November 1972.
7. Fruman, D. H., Sundaram, T. R. and Daugard, S. J., "Effectof Drag Reducing Polymer Injection on the Lift and Drag ofa Two-Dimensional Hydrofoil, International Conference onDrag Reduction, Cambridge, England, September 1974.
8. Fruman, D. H., "Lift Effects Associated with Drag ReducingPolymer Injection on Two-Dimensional Hydrofoils," 1974 AnnualMeeting of the Ordnance Hydroballistics Advisory Committee,Newport, Rhode Island, October 1974. Submitted for Publica-tion to the Journal of Ship Research.
9. Johnson, V. E., Jr. and Goodman A., "The HYDRONAUTICS, Incor-porated Variable-Pressure, Free-Surface, High-Speed Channel,"Cavitation Research Facilities and Techniques, ASME, New York,p. 49, 1964.
10. Etter, R. J. and Huang, T. T., "An Experimental Investigationof the Static Hydrodynamic Characteristics of Several FairedCables Having Symmetrical NACA Airfoil Sections," HYDRONAUTICS,Incorporated Technical Report 530-1, July 1967.

HYDRONAUTICS, Incorporated 24
11. Fruman, D. H. and Tulin, M. P., "Diffusion of a TangentialDreg-Reducing Polymer Injection on a Flat Plate at HighReynolds Numbers," 1974 Annual Meeting of the OrdnanceHydroballistics Advisory Committee, Newport Rhode Island,October 1974. Submitted for Publication to the Journal ofShip Research.
12. Abbott, I. H., von Doenhoff, A. E. and Stivers, L. S.,"NACA Wartime Report," ACR Number L5C05, March 1945.
13. Tulin, M. P., "Hydrodynamic Aspects of Macromolecular Solu-tions," Sixth Symposium on Naval Hydrodynamics, ACR-136,
Office of Naval Research, Department of the Navy, Washington,D. C., pp. 3-19, 1966.
14. Smith, K. A., Merrill, E. W., Mickley, H. S., and Virk, P. S.,
"Anomalous Pitot Tube and Hot Film Measurements in DilutePolymer Solutions," Chemical Engineering Science, Volume 22,
pp. 619-626, 1967.
15. Fruman, D. H., Loiseau, G., and Sulmont, P., "Effects Visco-.
elastics dans les Mesures des Pressions Statiques et d"Arret,"La Houille Blanche, Number 5, pp. 445-452, 1970.
16. Wu, Jin, "Lift Reduction in Additive Solutions," Journal ofHYDRONAUTICS, Volume 3, Number 4, pp. 193-200, October 1969.

WY 4 -9 1
KVORMAULC~jc~ao~k -J
"IMU TAA MCORa
INCIO I
WAAEI 1-cw HOR HVIMOKSHOWN4 01t~ GAJCA
AAKAGEMET, WAMONSLIT AkD-09EMUP

HYDRONAUTICS, INCORPORATE•D
p
0.6 a Difference between pressure
transducers
o Differential pressure transducer
0 Free Stream Velocity: 11 m/sec* Incidence Angle: 50
0.5
z 0.4UU. 0.
UjuJ
S0.3-U,
"U 9
CL
L-0LU
z
UL
c 0.2
0.-
01
o9
0 0.1 0.2 0.3 0.4 0.5 0.6 0.7 0.8 0.9
DIMENSIONLESS DISTANCE, x/c
FIGURE z - COMPARISON BETWEEN PRESSURE DIFFERENCES MEASURED BYTWO DIFFERENT METHODS DURING POLYMER INJECTION TEST
x-q;WvW

HYDRONAUTICS, INCORPORATED
0.6- e Difference between pressuretransducers
0 Differential pressure transducer
Free Stream Velocity: 11 mAec
Incidence Anges 5.00
0.5 - 00
- ~AC pcomputed from Ref.[12]
z 0.4 -ujUp
14.LU
LU
5: 0.3-LU
Q.U.0LU
04~ 0.2-U-
0.1-
0 0.1 0.2 0.3 0.4 0.5 0.6 0.7 0.8 0.9
('MENSIONLESS DISTANCE, x/c
FIGURE 3 - COMPARISON BETWEEN PRESSURE DIFFERENCES MEASURED BYTWO DIFFERENT METHODS DURING A TEST WITHOUT INJECTION

HYDRONAUTICS, INCORPORATED
0.04-SYM.Velocity 11.0 m/sec 0 Injection at 10% chord
Foil Chord: 10 cm * Injection at 30% chord
Polyox WSR 301 200 ppm
Rate of Injection: 0.1 U
0.03- Z
ul':/IL.M
ui0u
LLJ
-5.0 -2." O"2.0.0.0
0zU0
FOIL ANGLE, degrees
0.011
FIGURE 4 - VALUE OF THE CHANGE OF THE LIFT COEFFICIENTVERSUS INCIDENCE ANGLEt,,

NVUEaflWTI" IKWANOWI
of ~ ~ -t~t - .
0
0
0+ I
f H~~G&J3X f - CHANGEA Of O0AG COEIFICILN0 V(ISUS INCIOENCa ANGLE

"KOWHOAUflC$.£coPaA(
- OWAGSYMOK. Wi. StAt COWeON*W1
090
-. D - uJ
g0
0-
FORIL ANW Edste.o
* z
-4 V
-0A31I --
*AtD
RGUE - HAGEOF DAG CEFIN'COMPONINIS VR

HYDRONAUTICS, INCORPORATED
-0.8 i -- 0.08
-0.7 -- 0.07
-0.6 -0.06
Free Stream Velocity =I I /secRate of In jection = 0.1Polymer: Polyox WSR 301 -0.05
-0.5 Concentration = 200 ppm - -0 Without Injection Z
U. usU. 0 With Injection ad iU. ,,UJ
- .0 -0.4----
tu'
en.- I \..
-0.3 - -o- -0.032'
-0.2 oa 2
-0.1 0.0___ ____ _
INJECTION STATION
0 0.1 0.2 0.3 0.4 0.5 0.6 0.7 0.8 0.9
NON-DIMENSIONAL DISTANCE, x/c
FIGURE 7 - PRESSURE COEFFICIENT WITH AND WITHOUT INJECTIONVS. NON-DIMENSIONAL DISTANCE. Irfjection at 10%
chord, zero incidence angle.

HYDRONAUTICS, INCORPORATED
-0.8
-07-0.07
-0.7
j-0.6 -U.06
Free Stream Velocity m 1r/secRate of Irlection =0. 1
~.-05 Polymer: Polyox WSR 301 ____-0.05
0, -0*5 Concentration =200 ppm
0 Without Injection• Z 0 With Injection
U Zu- .4 1 -0.04w
UU
C9"D-. ,-0.03
a. I 0.
-0.2 -0.02
-0.1 I00
0I INJECTION1 STATION
0 -....
00 0.1 0.2 0.3 0.4 0.5 0.6 0.7 0.8 0.9CO0 NON-DIMENSIONAL DISTANCE, x/c
FIGURE 8 - PRESSURE COEFFICIENT WITH AND WITHOUT INJECTIONVS. NON-DIMENSIONAL DISTANCE. Injecton at 30%chord, zero incidence angle.
t7-

HYDRONAUTICS, INCORPORATED
_7I77.0
-0.8 -
-0.7
-0.6
-0.5
ZU.uJ
o -0.4LU
Free Stream Velocity = 11 m/secRate of Ilnection = 0.1
,c Polymer: Polyox WSR 301 1. -0.3 Concentration = 200 ppm
* Without Injectiono With Injection
-0.2
-0.1
INJECTION STATION
0 ----20.1 0.2 0.3 0.4 0.5 0.6 0.7 0.8 0.9
NON-DIMENSIONAL DISTANCE, x/c
FIGURE 9 - PRESSURE COEFFICIENT VS. NON-DIMENSIONALDISTANCE ON SUCTION AND PRESSURE SIDE OFHYDROFOIL FOR AN INCIDENCE ANGLE OF+2.5.Injection at 10%chord on the upper surface.

HYDRONAUTICS, INCORPORATED
-0.8
-0.7
Z%
-0.'
U.-0.5_ _
1I-
z
uJ -0.4Lu
,. Free Stream Velocity 11 m/sec
t^:3 Rate of Injection = 0.1"UJ Polymer: Polyox WSR 301. -0.3 Concentration = 200 ppm
0 Without InjectionO With Injection
-0.2
-0.1
INJECTION STATION#"1 I
0 0.1 0.2 0.3 0.4 0.5 0.6 0.7 0.8 0.9
NON-DIMENSIONAL DISTANCE, x/c
FIGURE 10 - PRESSURE COEFFICIENT VS. NON-DIMENSIONALDISTANCE ON SUCTION AND PRESSURE SIDE OFHYDROFOIL FOR AN INCIDENCE ANGLE OF-2.5.Injection at 10% chord on the upper surface.

HYDRONAUTICS, INCORPORATED
-1.0* Pressure coefficient without Injectiono Pressure coefficient with Injection
I Pressure difference due to polymer Injection-0.9 from total prossure m-,surements
x Pressure difference du. to polymer Injectionfrom differential pressure measurement,
-0.8
CONCENTRATION: 200ppm
INJECTION RATE- 0.1 UPPER SURFACE-0.7- VELOCITY: "i.0m/,,c
INCIDENCE ANGLE: -50
) 0.INJECTION STATION; 0.1•Ez -0.6 ___
zLU
So i
-0.5
U_
-0.4LU
0~0
-0.3
-0.2
0I---0.04 LU
0 z
LUOLU Z
LL
-0.02 L :
/INJECTION STATION Q
I I I -0.01 "0 0.1 0.2 0.3 0.4 0.5 0.6 0.7 0.8 0.9
DIMENSIONLESS DISTANCE, x/c
FIGURE 11 - PRESSURE COEFFICIENT VERSUS NON-DIMENSIONAL DISTANCE ONSUCTION AND PRESSURE SIDE OF THE HYDROFOIL FOR AN INCIDENCEANGLE OF 5a Injection at 10M chord on the upper surface

HYDRONAUTICS, INCORPORATED
-1.0* Pressure coefficient wuthout Injectiont
o Pressure coefficient with injection-0.9 Pressure difference due to polymer Injection
from total pressure meosurementl
Pressure difference due to polymer Injecion
from differentlol pressure measurement
-0.8 - -_ _ _ - - _ _
CONCENTR.TION 200 ppm
INJECTION RATE: 0.1 LOWER SURFACE
U -0.7 VELOCITY: 1.Om/sec - - -
INCIDENCE ANGLE: -5 0
z INJECTION STAION, 0.1 ,,LU" -06 -,
Ou -0.5LU
m -0.4 -,
0 -.
-0.2 -
-0.1
- -- .05
I I I-
-0.0043
-0.2O
zuO
-0.05 '"
---0- -'4
"a Z
-- 0. 0- - -
-0.01 a U
-I M .1
INJECTION STATION -
0 0.1 0.2 0.3 0.4 0.5 0.6 0.7 0.8 0,9
DIMENSIONLESS DISTANCE, x/c
FIGURE 12 - PRESSURE COEFFICIENT VERSUS NON-DIMENSIONAL DISTANCE ON
SUCTION AND PRESSURE SIDE OF THE HYDROFOIL FOR AN INCIDENCE
ANGLE OF -50. Injection at 10% chord on the upper surface.

HYDRONAUTICS, INCORPORATED-1.0 - -
SPressure coefficien twithout injection
0 rssure coefficient with InjectionI from total pressure measrements
I I * Pressure difference due to polymer injectionI % from differential pressure measurement,
-0.8- I i I a -.CONCENTRATION: 200 prm \ UPPER SURFACESINJECTION RAMT 0.
0- -0.7 VELOCITY: II.Om/sec %- - -
INCIDENCE ANGL- -5 0
z INJECTION STATION: 0.1
LU -0.6 - -
U-ILUA0 -0.5-
LUI
Ln -0.4 --
"LOWER SURFACE\-0.3--------------- -
-0.2--
-0.1
0-0.04 t-
LUDZ
- - -- - - - - -uJI-
U UZLULU~
eUJ Z--
LU >
* .INJECTION STATION"
0 0.1 0.2 0.3 0.4 0.5 0.6 0.7 0.8 0.9DIMENSIONLESS DISTANCE, x/c
FIGURE 13 - PRESSURE COEFFICIENT VESRSU NON-DIMENSIONAL SIDTANCE ONSUCTION AND PRESSURE SIDE OF THE HYDROFOIL FOR AN INCIDENCEANGLE OF 5°. Injection at 30% chord on the upper surface.

HYDRONAUTICS, INCORPORATED
-1.0 I
* Pressure coefflclent witihout Injectlon0 Presure €oeffciolnt with Injection-0.9 0 Pressure dif'erence due to polymer injection
from total pressure measurements
N Pressure difference due to polymer Injection
from d;fferent;ol pressure measurements
ILOWER SURFACECONCENTRATION: 200 ppm IINJECTION RATE: 0.1
-O-7 VELOCITY: 11.0 m/sec
INCIDENCE ANGLE: -50
U LINJECT:ON STATION: 0.1
I-_ -0.6z0U_LL
U -0.50U0
-0.4
ZU
-0.3002D
ZLULUO
/INJECTION STATION UJ
0 0.1 0.2 0.3 0:4 0.5 0.6 0.7 0.8 0.9 0O-,
ii CLULuZ
U-.
0 . 02 03 . .5 06 0.z. 0.9
DIMENSIONLESS DISTANCE, x/c
FIGURE 14 - PRESSURE COEFFICIENT VERSUS NON-DIMENSIONAL DISTANCE ONSUCTION AND PRESSURE SIDE OF THE HYDROFOIL FOR AN INCIDENCEANGLE OF -5°, Injection at 30% chord on the upper surface
iI

HYDRONAUTICS, INCORPORATED
0.04
RATE OF INJECTION = 0.1
z
i 0.03-
u -ju.i
00
u', 0.02 -
u-
oo °u-L
-ui
0 0
00
0
0 0.01 0.02 0.03
CHANGE OF LIFT COEFFICIENTSCOMPUTED FROM PRESSURE MEASUREMENTS
,!°FIGURE 15 -COMPARISON OF THE VALUE OF THE CHANGE OP THES~LIFT COEFFICIENT COMPUTED FROM FORCE AND PRESSURE
. MEASUREMENTS
0 0!U

HYDRONAUTICS, INCORPORATED
I I I I ISYMBOL CONCENTRATION
o 27 ppm
70 o 5o ppm
* 100 ppm (degraded)
* 200 ppm
60 PITOT TUBE 0. D.: I mm _/
POLYMER: Polyox WSR 301
0X 50EE
U
0i" 4 0ui
In 30Lu
20
10-__ _
0.5 0.6 0.7 0.8 0.9 1 1.5 2.0
FREE STREAM VELOCITY V, m/sec
FIGURE 16 - PRESSURE DEFECT MEASUREMENTS WITH A PITOT TUBE PROBE-EFFECT OF POLYMER CONCENTRATION

HYDRONAUTICS, INCORPORATED
I I .. .I
SYMBOL 0. D. PROBE Polymer: POLYOX WSR 301(mm) 1Concentration:
27 ppm0 1.0 ,70- 1.5
o 2.0
6 2.560
0
- 50---EE
u. 40- _
LL.Lu
LU0.. 0- 30-
20 /
00 a10.9 1 1.25 1.5 1.75 2 2.5 3 3.5
FREE STREAM VELOCITY V, rn/sec
FIGURE 17 - PRESSURE DEFFECT MEASUREMENTS WITH A PITOT TUBE PROBE-EFFECT OF OUTSIDE DIAMETER OF PROBE

HYDRONAUTICS, INCORPORATED
AI I ISYMBOL 0. D. PROBE Polymer: POLYOX WSR 301
oI m.0 Concentration: 27 ppm
70- 0 1.5o 2.0
x 2.5
60-
0'- 50 --EE
u- 40 -U-8Lu
30Lu
u, 30 -_. ... :
20
1
1000)^, In/'/1 1 /
20 -- :
10 -- - ___--______ _
01.0 0 L_ _ I
0.8 0.9 1x 10³ 1.25 1.5 1.75 2x 10³ 2.5 3-I
FREE STREAM VELOCITY/OUTSIDE PROBE DIAMETER, sec
FIGURE 18 - PRESSURE DEFFECT MEASUREMENTS WITH A PITOT TUBE PROBE-EFFECT OF VELOCITY OVER OUTSIDE DIAMETER RATIO

HYOIONAUTICS. INCOVOAiWW
Iu, - r-" w at8-
vo ?O+d : 1" . -
+I i, ,I _ __i_ _
00
A 30
go
9 13I ....... A.. .-.... . +
-- SEAM VELOCITY V, ,... -
FIGURE 19 - ABSOLUTE CHANGE OF 1H1E LIFI FORCE VERSUS FREESrTREA VELOCIY

K 00
~I~w~gd Rcaj
8--
SYL _ OLANL
z
2
to 4t -2 -, -4 -s -6 - - - -
LOA 104 TWC*O U ,mv~
MG32 - A0 LO IN FTEtIF 0C (U~cAz E01 tTENEUN ITO

IIRGLRE~~~~ ~ ~ V. -ITIAC, TOX-W N