ad-a258 120 * dtic · ad-a258 120 * dtic selectenov 30 1992d c ... metric practice guide, published...
TRANSCRIPT

AD-A258 120* DTIC
SELECTENOV 30 1992D
CLaboratory Investigation ofTrash Rack Freezeup by Frazil IceAnnika Andersson and Steven F. Daly September 1992
avwo c, ww
aitu~ xmti
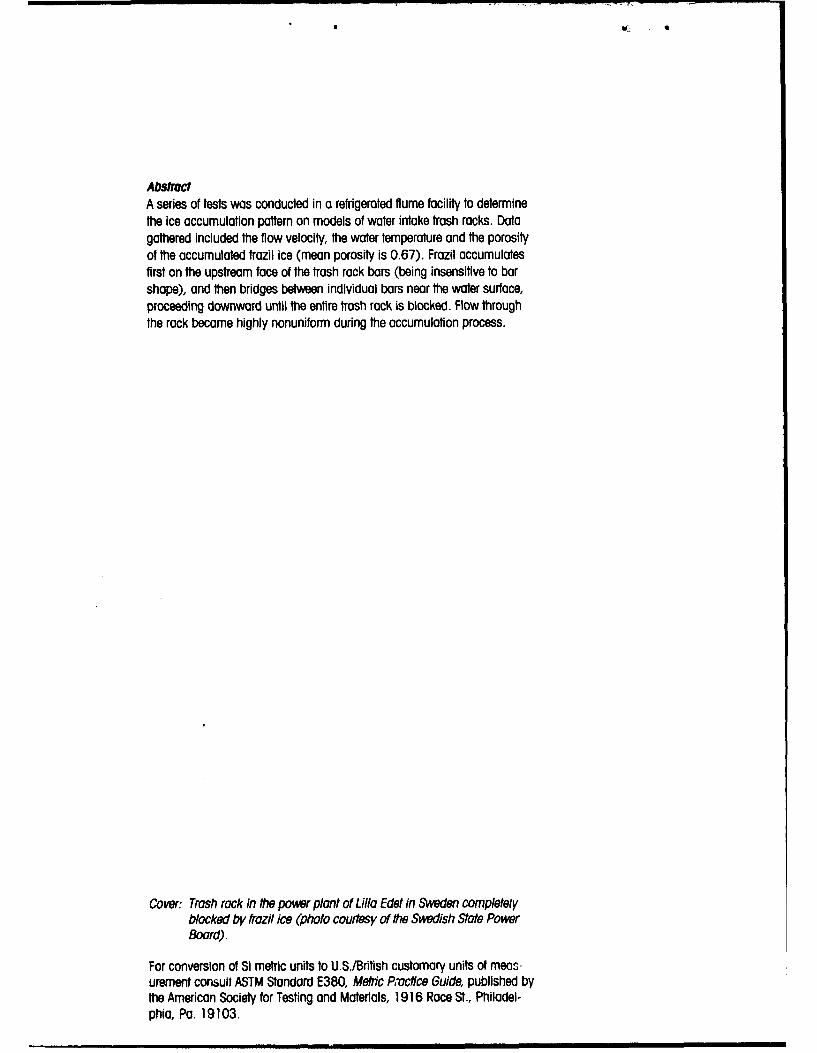
AbStractA series of tests was conducted in a refrigerated flume facility to determinethe ice accumulation pattem on models of water intake trash racks. Datagathered included the flow velocity, the water temperature and the porosityof the accumulated frazil ice (mean porosity is 0.67). Frazil accumulatesfirst on the upstream face of the trash rack bars (being insensitive to barshape), and then bridges between individual bars near the water surface,proceeding downward until the entire trash rock is blocked. Flow throughthe rack became highly nonuniform during the accumulation process.
Cover: Trash rack in the power plant of Li/Ia Edet in Sweden completelyblocked by frozil ice (photo courtesy of the Swedish Stole PowerBoard).
For conversion of Si metric units to U.S./Brifish customary units of meas-urement consult ASTM Standard E380, Metric Practice Guide, published bythe American Society for Testing and Materials, 1916 Race St., Philadel-phia, Pa. 19103.

CRREL Report 92-16
U.S. Army Corpsof EngineersCold Regions Research &Engineering Laboratory
Laboratory Investigation ofTrash Rack Freezeup by Frazil IceAnnika Andersson and Steven F. Daly September 1992
Au4Q6siom For
NTIS gaI
Uzwziuou.need
Jus t i fteat im
=A__lability Codes
IAvail and/or
Special
9q2 11I'i 0;,•
D, •7• 30322
OFFICE OF THE CHIEF OF ENGINEERS
Approved for putic release; distrilbuton Is urnlted.

PREFACE
This report was prepared by Annika Andersson, Research Engineer, LuleA University,Lulefi, Sweden, and Steven F. Daly, Research Hydraulic Engineer, Ice Engineering ResearchBranch, Experimental Engineering Division, U.S. Army Cold Regions Research and Engi-neering Laboratory. Funding was provided by the Directorate of Civil Works, Office of theChief of Engineers, under the Ice Engineering Program; Work Unit 32397, Ice Control at Intakes.
Technical review was provided by Dr. G. Ashton of CRREL and Dr. T. Carstens of theNorwegian Hydrotechnical Laboratory, Trondheim, Norway.
The authors acknowledge the help they received from John J. Gagnon, who operated therefrigerated flume facility and assisted in all the experiments, and Nancy Perron, who madeall of the thin sections.
The contents of this report are not to be used for advertising or promotional purposes.Citation of brand names does not constitute an official endorsement or approval of the useof such commercial products.
ii

CONTENTS
Preface .......................................................................................................................... ii
Introduction ................................................................................................................ 1Laboratory experim ent .............................................................................................. 1
Refrigerated flum e facility .................................................................................... 1M odel trash racks .................................................................................................. 1Instrum entation ................................................................................................. 2
Procedure ................................................................................................................ 3Experim ental results .............................................................................................. 4
H ead loss ............................................................................................................. 4Tem perature m easurem ents ............................................................................. 4Velocity profiles ................................................................................................. 5Porosity of the deposited frazil ........................................................................ 6A ccum ulation pattern ....................................................................................... 7Thin sections ......................................................................................................... 7
Discussion ................................................................................................................ 7Sum m ary ..................................................................................................................... 10Literature cited ...................................................................................................... 11A bstract ........................................................................................................................ 13
ILLUSTRATIONS
Figure1. Experimental setup in the refrigerated flume facility ................................ 22. D ata collected during experim ents .............................................................. 23. H ead loss for rectangular bars vs tim e ......................................................... 44. Head loss for different shapes vs time at 25.4-mm spacing ....................... 45. Water temperature measurements during test 1.2.2 .................................. 56. Bar temperature measurements during test 1.2.2 ....................................... 57. Velocity measurements across the trash rack during test 3.1.1 ................. 68. Vertical velocity measurements downstream of the centerline of the
trash rack during test 1.1.2 ...................................................................... 69. Porosity measurements of deposited frazil ice at the front of the trash
rack .............................................................................................................. 710. Ice accumulation patterns at the water surface ......................................... 811. Vertical ice accum ulation patterns ................................................................ 912. Thin sections taken at various levels in test 4.2.1 ...................................... 1013. Thin sections for different shapes taken at the initial water level .......... 11
TABLE
Table1. O utline of the experim ents conducted ......................................................... 2

Laboratory Investigation of Trash Rack Freezeup by Frazil Ice
ANNIKA ANDERSSON AND STEVEN F. DALY
INTRODUCTION pumps, heat transfer equipment, manual and au-tomatic valves and in-line electromagnetic flow
Trash racks, structures placed at the entrances meters. The flume is located in a refrigerated roomof water intakes to exclude unwanted material, where temperature can be controlled from ap-often become blocked by the accumulation of frazil proximately 16 to -29 0 C. The flume itself is 36.6 mice. They can be blocked suddenly, with little long, 1.2 m wide and 0.61 m deep, and is con-warning, leading to the unanticipated shutdown structed of aluminum and glass. It is tiltable, withof downstream facilities. There is little quantita- maximum slopes of approximately +0.01 to-0.005.tive understanding of how trash racks become The flow within the flume can be controlled byblocked by frazil. The difficulty in developing this upstream and downstream sluice gates, as well asquantitative understanding results directly from by vertical louver gates at the downstream end.the conditions under which blockage occurs: spo- Immediately upstream of the flume headbox is aradically, suddenly, often late at night, underwa- heat exchanger that discharges directly into it.ter and under severe weather conditions. Oppor- Additional detail concerning the flume facility istunities for observation and measurement are ob- available in other publications (Daly et al. 1985,viously limited. Daly and Colbeck 1986).
In this report, a series of laboratoryexperiments During an experiment, approximately 0.026is described in which the blockage of model trash m 3/s of water was pumped by a nominal 5-hpracks was observed and measured by placing the (3730-W) pump from the flume sump, through themodel racks in a refrigerated flume in which frazil on-line electromagnetic flow meter, and into theice was produced. The accumulation pattern of the heat exchanger. From there the flow was passedfrazil ice on the trash rack was recorded by over- into the headbox of the flume and then along thehead and underwater video cameras. The trash flume, throughthemodel trashracknearthedown-rack bar spacing and trash rack bar shape were stream end. The flow then dropped through a freevaried and their influence assessed on the head overfall and back into the sump.loss through the rack. The porosity of the accumu- The air temperature in the flume facility waslated frazil was measured. To observe the crystal typically between -12 and -17'C. The water wasstructure of the accumulation, thin sections were slightly supercooled upon leaving the heat ex-made of the accumulated ice. Based on these experi- changer and entering the headbox, where it wasments, a quantitative understanding of the frazil seeded with ice crystals that were produced byice accumulation on intake trash racks can be de- spraying fine drops of water into the air. The waterveloped. drops would quickly freeze and a continual "rain"
of ice crystals was produced. Seeding was neces-sary to generate sufficient frazil for the experi-
LABORATORY EXPERIMENT ments.
Refrigerated flume facility Model trash racksThe experiments were conducted in CRREL's The overall model trash rack dimensions were
refrigerated flume facility, consisting of a flume, a fixed by the size of the flume. They were installedsump, a reserve storage sump, three centrifugal vertically and perpendicular to the flow (Fig. 1),

Table 1. Outline of the experiments conducted. VieoMonitor
Bar Maximum Total Downwar LooingTest Bar spacing head time Vwieo Camera
number shape (mm) (mm) (min)
1.1.1 rectangular 25.4 81.7 47 Model Trash1.1.2 rectangular 25.4 166.0 56 Rack1.2.1 rectangular 47.6 91.9 621.2.2 rectangular 47.6 60.7 50 Underwater1.3.1 rectangular 60.3 114.0 137 VdoCmr1.3.2 rectangular 60.3 148.0 722.1.1 square 25.4 69.6 722.1.2 square 25.4 132.0 89
3.1.1 round 25.4 79.8 853.1.2 round 25.4 160.0 513.2.1 round 47.6 90.0 753.3.1 round 60.3 134 123 Flume4.1.1 pointed 254 71.0 72
421 pointed 47.6 114.0 65 Figure 1. Experimental setup in the refrigerated flume4.3.1 pointed 603 75.5 127 facility.
and were constructed using aluminum bars that Water levelwere held in place at the top and bottom by hori- Water levels and depths were measured usingzontal clamps. There were no other horizontal manual point gauges. These gauges have an accu-supports for the trash rack bars. The bar spacing racy of ±1/2 mm.was variable and is listed in Table 1. Four differentbar shapes-rectangular, square, round and Temperaturepointed-were used. We measured the water temperature and the
temperature in the model trash rack bars using in-Instrumentation dividually calibrated thermistors. The thermistors
The data collected during the course of an ex- used to measure water temperature were customperiment are outlined in Figure 2. The instrumen- mounted in a plastic protector and attached to atation that was used to collect this information is Teflon-coated cable, while those used to measurediscussed in this section. the trash rack bar temperatures were mounted
MODELTRASH RACK EXPERIMENTS
Temperature Head LoReorisss
Figsurem2.eDats colletedsdurie Measurements.
Water Levelsand Depths MesrI Mf
T hi n S cti o n fro m V ide o ta p e s
Slides Digitizingfrom Slides
Pice Accumulation]
Figure 2. Data collected during experiments. IPattern on Bars
, i i I I ll l2

direcly in small holes drilled into the bars, where no water drained from the tubes. The tubes werethermal contact between the thermistors and the then removed from the water, dried quickly withbars was assured by use of heat transfer paste. The tissue and weighed. This weight was compared totemperature of all thermistors was found using the tare weight of the tubes, end caps and rubberthe CRREL 10-channel digital thermometer bands. The weights are estimated to be accurate to(Trachier and Morse 1988). The digital thermom- 2g.eter automatically calculates the thermistor tem-perature from the thermistor resistance using both Accumulated patternthe Steinhart-Hart equation with three terms and The frazilice accumulation pattern was recordedthe calibration constants for each individual therm- from above using a standard color video cameraistor. The temperature data were stored by the recording on 1/ 2-in. (12-mm) VHS videotape. Thedigital thermometer and subsequently transferred underwater recordings were made using a black-totheSharedResourceManagementsystem(SRM), and-white video camera, which had a fixed focala computer network that gave us further analysis length and adjustable focus, that was mounted inand plotting capability on a range of computers. awaterproof0.61-m-long, 6.35-cm-diameter tube.The accuracy of the temperature data is e-timated For certain tests we also used a color video camerato be ±0.020 C. that had an adjustable focal length and was mount-
ed in a similar tube. The color camera was able toVelocity zoom in, allowing it to be placed further upstream
Thewatervelocitywas measured using aMarsh- from the trash rack.McBirney Model 511 electromagnetic flow meter. To provide selected scenes from the videotapeThis flow meter consists of a 0.6-cm transducer record for detailed analysis, 35-mm film slidesprobe with cable and a signal processor housed in were made of those scenes using a Polaroid Freezea portable case. The probe measures the flow vel- Frame Video Recorder, with playback providedocity in two perpendicular directions. The signal by a Panasonic 6300 video tape deck. The 35-mmprocessor provides an analog voltage signal that is slides were projected on a Talos digitizing tablet,linearly proportional to the flow velocity. This sig- custom mounted in the vertical direction. Dimen-nal was sampled by an HP3421 analog-to-digital sions were then taken using the digitizing tablet,convertor, controlled by an HP71B handheld cal- which was interfaced with an HP45C computer.culator. The data were recorded by an HP9144A The data were transferred to the SRM for furtherdisk drive, and were subsequently transferred to analysis, and long-term storage.the SRM for analysis and plotting.
The water velocity measurements were made Procedureusing the following procedure. The probe was po- Each test was conducted in the following man-sitioned and oriented so as to make the flow veloc- ner. The flume slope and discharge were set. Theity zero in one of the two directions. We manually room temperature was set at approximatelyentered the x and y location of the probe into the -150 C. We found that the room temperature var-HP71B; the reading was then taken of the flow ied throughout the course of a test as much asvelocity. Each reading was the average of 10 sam- 2 °C, probably because of normalvariations in thepies of the flow velocity, taken over a period of refrigeration operations, although ice accumula-approximately 7.5 seconds. The time, location and tion on the air handling units and other factorsreading of the flow velocity in each direction were could also be an influence. The water temperaturethen stored on a magnetic disk, and the process was closely monitored. Generally, immediatelyrepeated. The accuracy of the water velocity mea- before a test, the water temperature would steadilysurements is estimated to be ±2 cm/s. decline. When the water temperature was below
1PC at the location in the flume where the modelPorosity trash rack was tobe installed, the rack was brought
The porosity of the frazil ice deposited on the into the coldroom and placed in the flume. Themodel trash racks was measured using a modified downward-looking and underwater video cam-CRREL snow density kit (Ueda et al. 1975). The eras were aligned and started, and the date andsnow density tubes were driven into the deposited time and other relevant information were recorded.frazil, capped underwater with rubber end caps, When we saw that the water temperature was lowand then had rubber bands applied to hold the end enough--supercooled-the seeder was turned on.caps in place. The end caps were watertight so that If ice had collected on the model trash rack before
3

the seeder was started, we removed this ice with 20
warm water, applied by a hose. The test was then 25.4begun16 47.6
We periodically measured the water levels up- E - o.3stream and downstream of the model rack through-out the test. The downstream water velocities were oj / ,also measured periodically, either horizontally 8 /across the flume at a fixed elevation or vertically at - - / -the flume centerline. The test was ended when the 4 -. -
upstream water level had doubled or 2 hours had "elapsed from the beginning of test. At the end of 0 20 40 60 80
each test, the seeder was shut off, and warm glycol Time (min.)
was circulated through the bottom of the flume. Figure 3. Head loss for rectangular bars vs time,This warming released ice that had accumulatedalong the length of the flume, and slightly warmed with various spacings between the bars.the water so that frazil was no longer produced. 2oThe video recordings were stopped, and the tapes Rectangular
labeled. The model trash racks were then removed -" Rounld16-/ Pointed
from the flume and brought into a heated area / Squarewhere the accumulated ice could be easily re- -9
0 12 -moved. /An outline of the experiments conducted is - "
shown in Table 1; 15 separate tests were conduct- 8,-ed. The tests can be divided into four groups based 4" /-- /-// "on the shape of the bars used in the model trash 4" ,'
rack-rectangular, square, round and pointed. We 0)used three different spacings between the bars 0 20 40 60 80 100
(25.4, 47.6 and 60.3 mm). The length of time that Time (min.)
each experiment was conducted varied, depend- Figure 4. Head loss for different shapes vs time at 25.4-ing largely on the rate of head loss at the model mm spacing.racks. Also, during the course of an experiment,anchor icewould accumulate at thebottom and on seem to be a clear advantage of one shape overthe walls of the flume. The latent heat released by another. Figures 3 and 4 show that there was con-this ice would cause the water temperature to rise. siderable variation in the head loss with time forEventually, the water temperature at the model identical trash rack configurations. Possible rea-trash rack would reach 0°C, and at this point a test sons for h are variations in the frazil concentra-would be concluded. tions and supercooling levels. It is likely that for
trash racks with the same bar spacing, the time to
EXPERIMENTAL RESULTS reach a certain head loss decreases with increasingfrazil concentration.
Head lossFigure 3 displays the head losses as a function of Temperature measurements
time through the model trash rack constructed of Examples of the temperature measurementsrectangular bars, with different spacings between made during the course of an exreriment arethe bars. During these tests the discharge through shown in Figures 5 and 6. The water temperaturesthe model trash racks remained constant. In gen- upstream and downstream of the model rack areeral, increasing the spacing between the trash rack shown in Figure 5. A near constant level of super-bars increases the time required to reach a specific cooling was maintained during a test, although ithead loss. Figure 4 shows the measured head loss was reduced near the end. This probably reflectsversus time through the model trash rack con- the latent heat released by growing anchor ice thatstructed of different shaped bars with the same had collected in the flume upstream of the modelspacing-25.4 mm. It is difficult to draw any spe- trash rack over the course of the test.cific conclusions regarding the influence of the bar Temperatures measured in the trash rack barsshape on the head loss. Certainly, there does not are shown in Figure 6. At the start of each test,
4

' II III II II
0.2-
*-0 .
0.0)
00
* CO
I I I I I __ _ _ __ _ _ __ _ _ __ _ _
0 10 20 30 40 50 0 10 20 30 40 50Time (mi. from start) Time (mi. from star)
Figure5. Water temperature measurements during test Figure 6. Bar temperature measurements during test1.2.2. Curves I and 2 show the temperature upstream and 1.2.2. Curves 1 and 2 show the submerged thermistors;downstream the trash rack respectively, curves 3 and 4 are for the thermistors below and above the
initial water level respectively.
thermistors 1 and 2 were submerged, thermistor 3 indicative of the uniformity of the flow throughwas slightly below the starting water level and the model trash rack. A higher velocity throughthermistor 4 was just above the starting water bar spaces 20,22 and 24 can be seen in the secondlevel. The temperatures of the bars were all above profile, which was recorded 15 minutes after the00C prior to the start of a test, reflecting that the first. These higher velocity regions indicate themodel trash rack had been brought into the start of the formation of jets through the trash rack,coidroom from a warm preparation area inmnedi- as frazil ice begins to accumulate on the rack, andately before the start of a test. During the course of the head losses across the rack increase. The thirda test, as ice collected on the trash rack bars, the profile, taken 15 minutes later, shows the contin-upstream water level would rise and downstream ued development of the jets. The fourth profile,water level would tend to drop. The temperatures taken 30 minutes after the third, shows the ex-of the thermistors located higher on the bar would treme variation possible after extensive frazil iceinitially decline, reflecting heat conduction through accumulation has built up on the trash rack.the trash rack bar, and the exposure of the back Fi~ure 8 gives the development of a vertical vel-side of the bars owing to the drop in the down- ocity profile taken in the centerline of the flume,stream water level. This can be seen in the decrease immediately downstream of the trash rack. Thein temperature that occurred at each thermistor. vertical profiles can be roughly divided into threeThe extent of the decreases is proportional to the groups. The first group represents the time whenelevation of the thermistor: the higher on the bar there was no or minimal ice accumulation on thethat the thermistor was located, the greater its ex- trash rack. The maximum velocity occurs near theposure to the cold air. midpoint of the depth. The influence of the bottom
horizontal support of the model trash rack can beVelocity profiles seen in the very low velocities near the bottom of
Velocity profiles were measured downstream the profiles. As the trash rack ice accumulates, theof the model trash rack with the Marsh-McBirney maximum velocity increases, the maximum iselectromagnetic flow meter. Profiles were taken closer to the flume bottom, and the velocities nearacross the flume at a depth equal to one-half of the the top decrease and begin to go negative, repre-initial downstream flow depth. Typical results are senting flow in the upstream direction. This sec-shown in Figure 7. The velocity profiles are ini- ond phase takes place because of the accumulationtially quite uniform across the width of the flume, of ice on the top of the rack. Jets begin to form, and
5

100
80
60 '3 -
-20 i I iIi 1I Ii I 113 12 14 16 18 20 22 24 26
Bar Space NumberFigure 7. Velocity measurements across the trash rack during test 3.1.1.Numbers refer to order in which profiles were taken.
I I' 1 I I I I14-
121
10
6 -6 * -Z-
4
2
-10 0 10 20 30 40 50
Vol (cm/s)
Figure 8. Vertical velocity measurements downstream of the centerline of thetrash rack during test 1.1.2. Numbers refer to order in which profiles were taken.
a large, horizontal "roller" type of current can beseen. The formation of these jets has been noted in p-i-- pithe field, where they have been quite erosive. The e =V.
third phase results when the trash rack is nearly Pw -Piplugged in the vicinity of its centerline. Little flowis passing through the rack, and the velocity is where m, = mass of sampled frazilquite low throughout the depth. Vm = volume of the cylinder
pi = density of ice (916 kg/m 3)
Porosity of the deposited frazil pw = density of water (1000 kg/m 3).We found the porosity of the deposited frazil by
weighing 3 cm 3 of the accumulated mass of the A total of 20 samples was measured. The meanfrazil taken from the trash rack. The porosity e is porosity of the samples was 0.67, with a standardthen calculated as deviation of 0.13 (Fig. 9).
6

S I j
4
CI)
3
0 0.2 0.4 0.6 0.8 1.0Porosity
Figure 9. Porosity measurements of deposited frazil ice at the front of the trash rack.
Accumulation pattern structure oi ice. There are no previous reports inThe accumulation patterns of the frazil ice on the literature of thin sections being taken of frazil
the trash rack bars are shown in Figures 10 and 11. ice accumulated on trash rack bars. In this workFigure 10 gives views of the ice accumulation at horizontal thin sectionsatdifferentelevationswerethe water line of the bars as seen by the video cam- taken and photographed through cross polarizedera above the water. There is a basic pattern of glass.accumulation. The initial ice accumulates on the The thin sections were made in the followingupstream side of the bars. The ice then extends up- manner. At the end of a test, the water level in thestream into the flow and increases in width. At a flume was slowly lowered to allow the frazil icecertain point, the accumulated ice bridges across that had accumulated on the rack to freeze andtwo successive bars. While not visible in the fig- gain strength. If this was not done, the ice wouldures, we identified two types of bridging across fall apart, owing to its low cohesion, high porositythe bars by closely inspecting the videotapes. The and relative heaviness. When the water had beenfirst type is the joining together of the frazil that drained from the flume, the trash rack bars wereaccumulates on the upstream face of each bar. The removed with the samples of ice intact. The trashsecond is when the accumulation onabar is pushed rack bars were then heated slightly and removedto one side by the flow. The bridging then happens from the sample, after which thin sections werevery rapidly, leaving a gap on the opposite side of cut. The thin sections had to be very thin (averagethe bar. This gap may remain open or be bridged thickness of 1.2 mm) because of the small size ofby a process of the first type. Another feature that the frazil crystals.we noted by inspecting the videotapes is that a Horizontal thin sections were taken at variouslarge portion of the initial accumulation on t& 2 levels throughout the sample and are shown inbars may be removed several times in quick suc- Figure 12. Thin sections of ice accumulation at thecession by the flow. However, eventually the accu- initial water level for different shapes are shown inmulation remains and extends upstream. Figure 13. Generally, the ice in the thin sections is
Figure 11 gives views of the trash rack that can very fine grained, except immediately next to thebe seen by the underwater video, and is represen- trash rack bars. Here, the ice crystals are muchtative of all the tests. The frazil ice accumulation larger and may reflect the influence of thermalprogresses downward on the trash rack, although growth attributable to heat transfer from the bars.the time for the ice to progress downward was It is not clear if these crystals grew before or aftermuch longer than the time for the initial bridging the frazil crystals had accumulated on the bars.at the water's surface. In general, the b, *dging atthe water surface occurred first, and then the down- DISCUSSIONward progression began.
A major goal of these tests was to investigate theThin sections ice accumulation patterns on intake trash racks.
Thin sections are often used to study the crystal The accumulation pattern was consistent, regard-
7

, RM
-min m 8 12 13
a. Round bar, test 3.1.1.
lime (min.) 0 5 6.5 7.5
b. Pointed bar, test 4.1.1.
Time (min.) 0 3 J1 17 17.5
c. Rectangular bar, test 1.2.2.
Figure 10. Ice accumulation patterns at the water surface (flow is from the bottom of the figures to the top).
8

Timei(san) 18 26 40 5 80
a. Round bar, test 3.1.1.
"rie(an)013 15 40 60 100
ýme (min.) 0 1 -
b. Pointed bar, test 4.1.1.Figure 11. Vertical ice accumulation patterns (flow is directly into the figures).
less of the bar shape or spacing of the bars. The largecongelation crystals extending from the trashfrazil ice would start to accumulate first at the rack bars at the original water line. Before there iswater surface, and would then extend upstream any accumulation on the trash rack bars, minuteinto the flow. The accumulation would bridge be- variations in the water surface at the bars couldtween the bars, first at the water surface, and then coat them with a thin glaze of thermally grown iceit would progress downward. This downward immediately at the water line. This glaze wouldprogress of ice accumulation on intake trash racks then promote the additional accumulation of de-has also been observed and documented by the posited frazil ice.first author at a field site. Ice may accumulate first Just as the accumulation pattern is independentat the water surface for three reasons. First, this is of the bar shape, so is the measured head lossthe location where the trash rack bar, in contact through the rack. The head loss is definitely influ-with the water, is the coldest, and the low tempera- enced by the spacing of the trash rack bars, how-tures may increase the adhesion strength between ever. In general, the larger the spacing betweenthe frazil crystals and the bars. Second, the frazil trash rack bars, the longer the time until a specificconcentration maybe highest at the surface. While head loss was reached. This suggests that trashthere are no quantitative measurements to show if racks should be designed with the maximum spacethis is true or not, the buoyancy of the larger crys- possible between the bars, given the practical re-tals, and of the flocs of crystals, could easily in- alities of trash rack strength and the size of objectscrease the concentration of crystals at the surface. that can be accepted downstream.The video observations above and below the wa- The thin sections show that, except for a verytercannotreallydecidethis.Thelastreasonissug- small region immediately next to the trash rackgested by the thin sections, which show relatively bars, almost all of the frazil ice accumulated on the
9
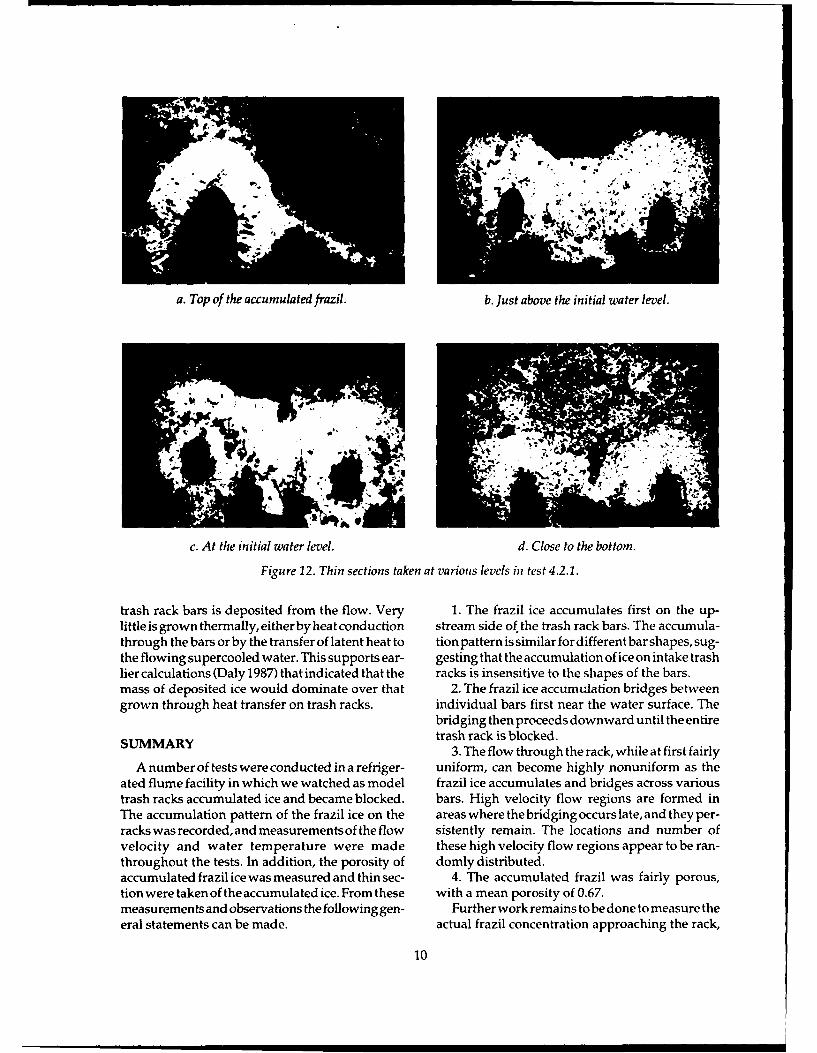
a. Top of the accumulated frazil. b. Just above the initial water level.
41,.. •.•• :.•• .'" ". .o , .",,,.
c. At the initial water level. d. Close to the bottom.
Figure 12. Thin sections taken at various levels in test 4.2.1.
trash rack bars is deposited from the flow. Very 1. The frazil ice accumulates first on the up-littleis grown thermally, either byheatconduction stream side of the trash rack bars. The accumula-through the bars or by the transfer of latent heat to tion pattern is similar for different bar shapes, sug-the flowing supercooled water. This supports ear- gesting that the accumulation of ice on intake trashlier calculations (Daly 1987) that indicated that the racks is insensitive to the shapes of the bars.mass of deposited ice would dominate over that 2. The frazil ice accumulation bridges betweengrown through heat transfer on trash racks. individual bars first near the water surface. The
bridging then proceeds downward until the entireSUMMARY trash rack is blocked.
3. The flow through the rack, while at first fairlyA number of tests were conducted in a refriger- uniform, can become highly nonuniform as the
ated flume facility in which we watched as model frazil ice accumulates and bridges across varioustrash racks accumulated ice and became blocked, bars. High velocity flow regions are formed inThe accumulation pattern of the frazil ice on the areas where the bridging occurs late, and they per-racks was recorded, and measurements of the flow sistently remain. The locations and number ofvelocity and water temperature were made these high velocity flow regions appear to be ran-throughout the tests. In addition, the porosity of domly distributed.accumulated frazil ice was measured and thin sec- 4. The accumulated frazil was fairly porous,tion were taken of the accumulated ice. From these with a mean porosity of 0.67.measurements and observations the following gen- Further work remains to be done to measure theeral statements can be made. actual frazil concentration approaching the rack,
10
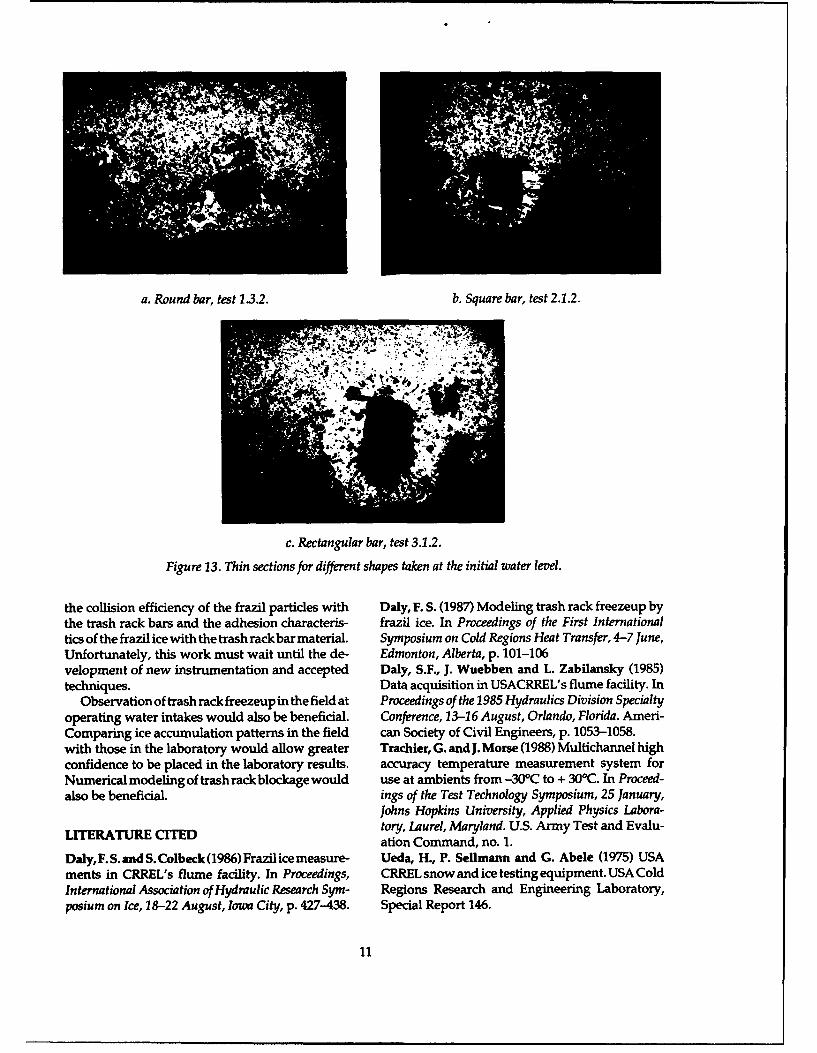
a. Round bar, test 1.3.2. b. Square bar, test 2.1.2.
c. Rectangular bar, test 3.1.2.
Figure 13. Thin sections for different shapes taken at the initial water level.
the collision efficiency of the frazil particles with Daly, F. S. (1987) Modeling trash rack freezeup bythe trash rack bars and the adhesion characteris- frazil ice. In Proceedings of the First Internationaltics of the frazil ice with the trash rackbar material. Symposium on Cold Regions Heat Transfer, 4-7 June,Unfortunately, this work must wait until the de- Edmonton, Alberta, p. 101-106velopment of new instrumentation and accepted Daly, S.F., J. Wuebben and L. Zabilansky (1985)techniques. Data acquisition in USACRREL's flume facility. In
Observation of trash rack freezeup in the field at Proceedings of the 1985 Hydraulics Division Specialtyoperating water intakes would also be beneficial. Conference, 13-16 August, Orlando, Florida. Ameri-Comparing ice accumulation patterns in the field can Society of Civil Engineers, p. 1053-1058.with those in the laboratory would allow greater Trachier, G. and J. Morse (1988) Multichannel highconfidence to be placed in the laboratory results. accuracy temperature measurement system forNumerical modeling of trash rackblockage would use at ambients from -30 0 C to + 30*C. In Proceed-also be beneficial. ings of the Test Technology Symposium, 25 January,
Johns Hopkins University, Applied Physics Labora-LITERATURE CITED tory, Laurel, Maryland. U.S. Army Test and Evalu-
ation Command, no. 1.
Daly, F.S.andS.Colbeck(1986)Frazilicemeasure- Ueda, H., P. Sellmann and G. Abele (1975) USAments in CRREL's flume facility. In Proceedings, CRREL snow and ice testing equipment. USA ColdInternational Association of Hydraulic Research Sym- Regions Research and Engineering Laboratory,posium on Ice, 18-22 August, Iowa City, p. 427-438. Special Report 146.
11

Form Approved
REPORT DOCUMENTATION PAGE OMB No. 0704-o188Public reporting burden for this collection of information is estimated to average 1 hour per response. inluding the time for reviewing instructions, searching existing data sources. gathering andmaintaining the data needed, and completing and reviewing the collection of information. Send oomments regarding this burden estimate or any other aspect of this collection of Irlormation.induding suggestion for reducing this burden, to Washington Headquarters Services, Directorate for Information Operations and Reports. 1215 Jefferson Davis Highway, Suite 1204, Arlington,VA 22202-4302. and to the Oftice of Management and Budget. Paperwork Reduction Project (0704-0188). Washington. DC 20503.
1. AGENCY USE ONLY (Leave blank) 2. REPORT DATE 3. REPORT TYPE AND DATES COVEREDI September 1992
4. TITLE AND SUBTITLE 5. FUNDING NUMBERS
Laboratory Investigation of Trash Rack Freezeup by Frazil Ice Ice Engineering ProgramWU: 32397
6. AUTHORS
Annika Andersson and Steven F. Daly
7. PERFORMING ORGANIZATION NAME(S) AND ADDRESS(ES) 8. PERFORMING ORGANIZATIONREPORT NUMBER
U.S. Army Cold Regions Research and Engineering Laboratory72 Lyme Road CRREL Report 92-16Hanover, New Hampshire 03755-1290
9. SPONSORING/MONITORING AGENCY NAME(S) AND ADDRESS(ES) 10. SPONSORING/MONITORING
AGENCY REPORT NUMBER
Office of the Chief of EngineersWashington, D.C. 20314-1000
11. SUPPLEMENTARY NOTES
12a. DISTRIBUTION/AVAILABILITY STATEMENT 12b. DISTRIBUTION CODE
Approved for public release; distribution is unlimited.
Available from NTIS, Springfield, Virginia 22161.
13. ABSTRACT (Maximum 200 words)
A series of tests was conducted in a refrigerated flume facility to determine the ice accumulation pattern on models of waterintake trash racks. Data gathered included the flow velocity, the water temperature and the porosity of the accumulatedfrazil ice (mean porosity is 0.67). Frazil accumulates first on the upstream face of the trash rack bars (being insensitive tobar shape), and then bridges between individual bars near the water surface, proceeding downward until the entire trash rackis blocked. Flow through the rack became highly nonuniform during the accumulation process.
14. SUBJECT TERMS 15. NUMBER OF PAGES16
Frazil ice Laboratory tests 16. PRICE CODEFreezeup Trash racks
17. SECURITY CLASSIFICATION 18 SECURITY CLASSIFICATION 19. SECURITY CLASSIFICATION 20. LIMITATION OF ABSTRACT
OF REPORT OF THIS PAGE OF ABSTRACT
UNCLASSIFIED UNCLASSIFIED UNCLASSIFIED UL
NSN 7S40-01-28O-5500 Standard Form 298 (Rev. 2-89)*U.S. GOVERNMENT PRINTING OFFICE: 101141000031011 Prescribed by ANSI Sid. Z39-18
296-102