adap 2.0: measurement and analysis software for biochrom
TRANSCRIPT

ADAP 2.0: Measurement and AnalysisSoftware for Biochrom Anthos Microplate Readers
Tristana von Will
Microplate Instrumentation Applications Specialist

ADAP Basic
Outline
Key Features ADAP 2.0 Software
How to use ADAP 2.0 Basic for Basic Measurements
How to set up a method in ADAP 2.0 Plus Software
How to demonstrate ADAP 2.0 Basic and Plus Software
Your questions?
Use the chat function on Go To Meeting to ask questions. All questiosn will be addressed either at the end of the meeting or offline by email.

Software is used to remotely control readers for quick measurements with optional upgrade to Plus version for data analysis
ADAP 2.0 Software
Anthos 2020 Zenyth 340 Zenyth 200EZ Read 400

Key Features
Easy to use
Easy to copy data into other analysis programs
Quick set up for quick measurements
Intuitive test (method) setup (ADAP 2.0 Plus)
Windows 7 Compatible
Software is used to remotely control readers for quick measurements with optional upgrade to Plus version for data analysis

Getting Started
A demo procedure exists to allow exploration of the features of ADAP software without connecting to an instrument.

Starting up ADAP 2.0 Software
Login:
Username: sadmin
Password: sadmin
All ADAP 2.0 modules control user access at different authorisations levels allowing users to work within FDA 21 CFR, part 11 compliance.

Accessing the demonstration mode
1. Select Setup>Instrument
2. Select Simulator
3. Select File>Save
The features of ADAP Basic will be presented with an option to simulate random measurements

Icon Function
Save data
Copy data
Print data
Setup a quick measurement
Load plate
Eject Plate
Initiate reader
Change users
ADAP 2.0 Basic Front page

Quick Measurements
1. Select quick measurement icon
2. Select Plate Type
3. Select Measurement Position
4. Select Measurement Mode
a) Endpoint Photometric for single endpoint wavelength measurements (with or without a reference filter*)
b) Kinetic Photometric for a series of measurements over a specified length of time
c) Multiwavelength for one time measurement of
more one wavelength
5. Select Start

Why use a reference filter/wavelength?
Like a spectrophotometer it is important to use a reference measurement.
Reference measurements can be a blank within the plate layout (which is automatically subtracted from all the non-blank measurements on the plate).
Eliminates interference from other absorbing substances
Or a reference wavelength/filter can be used. A wavelength is chosen where the sample of interest does not absorb. This measurement is automatically subtracted from the measurement wavelength/filter.
Eliminates interference from the plate, dust lint or other irregularities in the well.
Good practice is to use both a blank and a reference wavelength.

Presentation of Results
OD represents absorbance measurements with reference measurements subtracted
Status represents instrument error that may have occurred during the measurements during the measurement of specific wells

Presentation of results
Data can be copied and pasted into Excel using the Copy Icon:
Simply paste to transfer data to Excel or another program.
Data will paste as a matrix:

Presentation of results
Data can be printed using the print icon:

Presentation of Kinetic Data
Data is presented as cycles equivalent to number of measurements
Copy active window-copies only the shown matrix to the clipboard
Copy – copies all measurements

Select and Copy in
order to copy all kinetic
data to the clipboard as
a list
Select and Copy
Active Window to copy
only selected cycle to
the clipboard as a matrix
Presentation of Kinetic Data

Kinetic data is represented as a graph.
Clicking on a specific well represents a detailed graph.
and Copy Active Window copies the graph(s) to the clipboard.
Presentation of Kinetic Data

Presentation of Multiwavelength Data
Data is presented like kinetic data with an additional tab showing each well absorbance measurements in a table format.
Go to Raw Data tab and Print Raw Data to see a Data printout of all wavelength measurements

Other features
View log table File> View Log Table shows who, what and when software was used.
Data can be saved or copied for printing

Other features
In Setup> Instrument there are two tabs that can be used to assess the performance of the instrument:
Function 1
Function 2
Note: Functionality of the setup functions is dependent on the instrument in use.

Other features
Go to Setup>System to customize data export and printouts

Summary: Features of ADAP 2.0 Basic
User and password controlled data with log file
Intuitive interface
Easy setup of quick measurements: endpoint, kinetic and multiwavelength
Simple export of data into Excel
Detailed, customizable printout
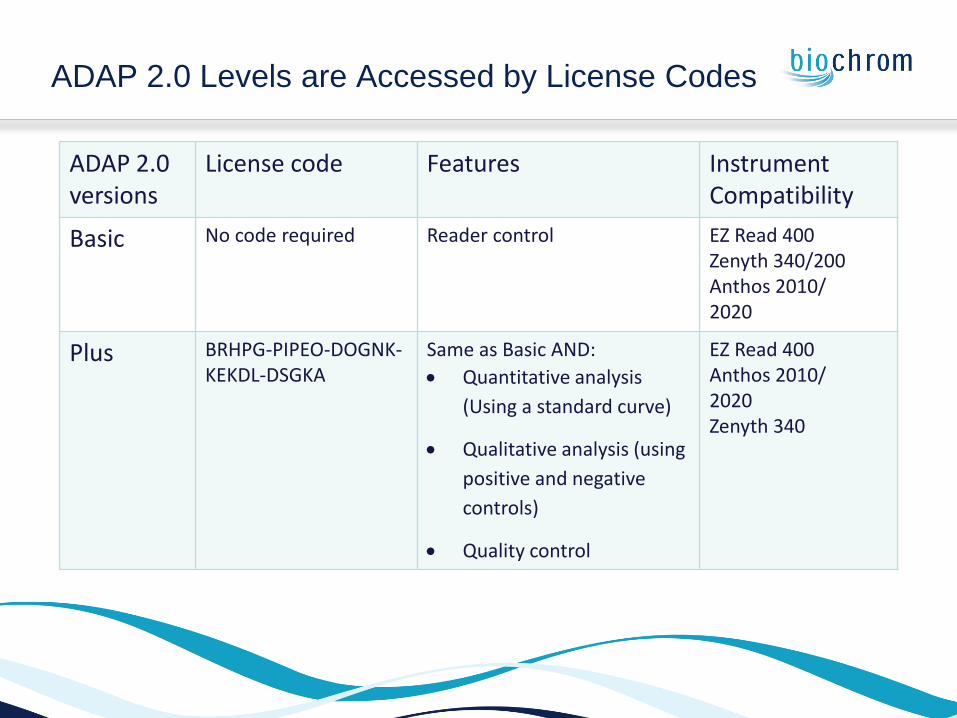
ADAP 2.0versions
License code Features Instrument Compatibility
Basic No code required Reader control EZ Read 400Zenyth 340/200Anthos 2010/2020
Plus BRHPG-PIPEO-DOGNK-KEKDL-DSGKA
Same as Basic AND:
Quantitative analysis
(Using a standard curve)
Qualitative analysis (using
positive and negative
controls)
Quality control
EZ Read 400Anthos 2010/2020Zenyth 340
ADAP 2.0 Levels are Accessed by License Codes

Accessing the features of ADAP 2.0 Plus in Demo Mode
Select Help>About to enter a demo license code.
Enter in the following license code:
BRHPG-PIPEO-DOGNK-KEKDL-DSGKA
Select OK
Go to Setup> Instrument> Read Configuration

Key Feature of ADAP 2.0 Plus
Test Definition (Analysis method)
Configure plate layout
Quantitative with essential curve-fitting
Qualitative with 5 categories
Transformation formulas
Replicate verification formulas
Test validation formulas

ADAP 2.0 Plus Front Page
Icon Function
Opens method setup
Runs a single test using a previously defined method
Recalculated results based on manual elimination or
restoration of wells.

Method Setup: General
Name test
Set measurement and
reference filters
Set instrument
Define Plate Layout
Set lot# dependent
concentrations (e.g.
antibody lots)
Set test specific
parameters (e.g.
calibration factors)
Set shaking (Zenyth 340 only)

Plate Layout
Place
controls and
samples in
the plate
Use dilution
factors
Presetreplicates for
easy plate
filling

Quantitative Analysis
Up to 10 standards can be defined
Curve-fitting with four options
Linear or log axes
Curve validation
Used for many assay types including total protein and ELISAs.
Note: 4- parameter fit is a key curve-fitting algorithm for many ELISA assays and other competitive binding assays

Quantitative Analysis- An example:The Bradford Assay
The Bradford Assay is a total protein assay used to determine the total amount of all protein in a sample.
The Bradford assay uses known concentrations of bovine serum albumin (BSA) to draw a standard curve by which to calculate the concentrations of samples.

Quantitative Analysis- An example:The Bradford Assay
The concentration of standards are suggested by the assay kit manufacturer.
Linear regression is used to draw a straight line through the concentrations so that the concentrations of the samples can be determined.
Linear x and y axes will be used to draw the graph
A minimum correlation or r2 value is set at >0.98

Results Presentation
Data is presented in multiple tabs.
Data can be copied to the clipboard for import into another software program, printed or saved.

Qualitative Analysis
Define up to 5 categories
A transformation formula can be applied to the sample absorbances
Interpretation can be based on absorbance (OD), concentration or the transformed value.
This analysis is used mostly with ELISA assays
Note: Group 1 has the highest absorbance values. Cutoff Formula 1 assumes a ‘>‘ in the formula so that absorbance values of samples in Group 1>Group 2>Group 3 ... How the groups distinguished must be defined in the formula box.

Qualitative Analysis-An example HTLV I and II ELISA
Qualitative analysis of an ELISA for the presence of HTLV infection
Plate layout specified by assay kit manufacturer
Assay measured at 450 nm. A reference measurement is also used at 620 nm

Qualitative Analysis-An example HTLV I and II ELISA
Analysis is specified by the manufacturer
All absorbance measurements (X) are compared to the negative control using this formula:
Index = Sample (OD)/ NC1(OD)+0.45
The index value is used to categorize the samples.

Replicate Rejection:
Avg PC1-NC1>=0.800, 1 replicate
PC1>=0.800, 2 replicates
Validation Criteria:
NC1<= 0.100
Each PC1 must be within 30% of the average of PC1
Blank <= 0.100 OD
Qualitative Analysis-An example HTLV I and II ELISA

Define Results Presentation
Determine how mean values will be calculated
Determine how the Blank will be used
Configure print options
Select evaluation method for controls

Results Presentation
Results are presented on multiple tabs
Info Calculation and Results List show the results

Results Presentation
Results list
Interpretation
Test Validation
Replicate Rejection
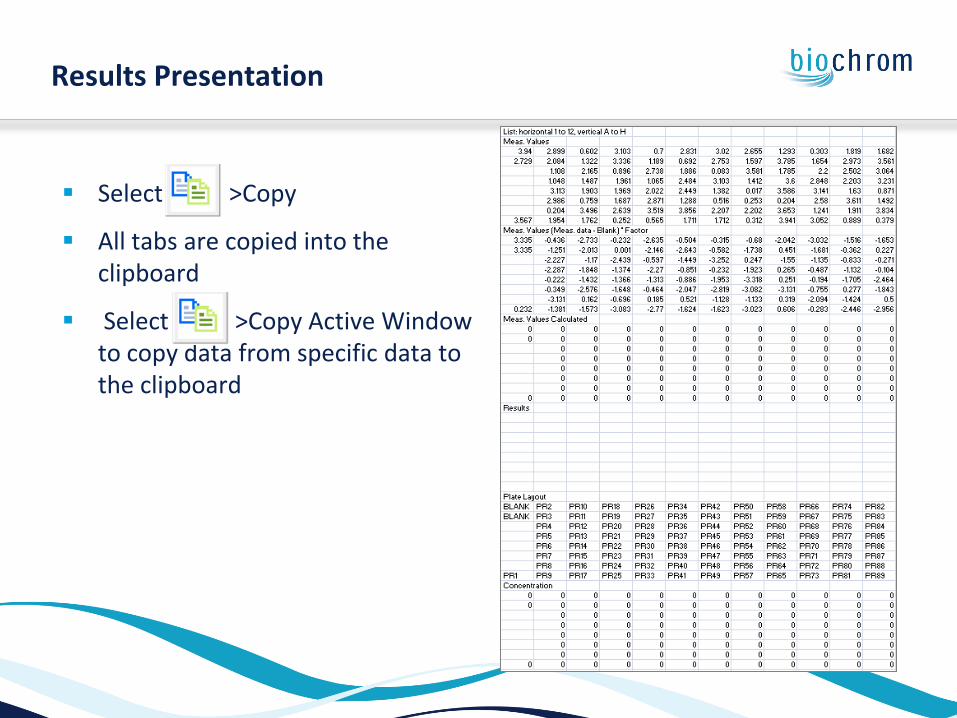
Results Presentation
Select >Copy
All tabs are copied into the clipboard
Select >Copy Active Window to copy data from specific data to the clipboard

Select
Printout configuration is a result of parameters set in Setup>System and Test Definition
Results Presentation
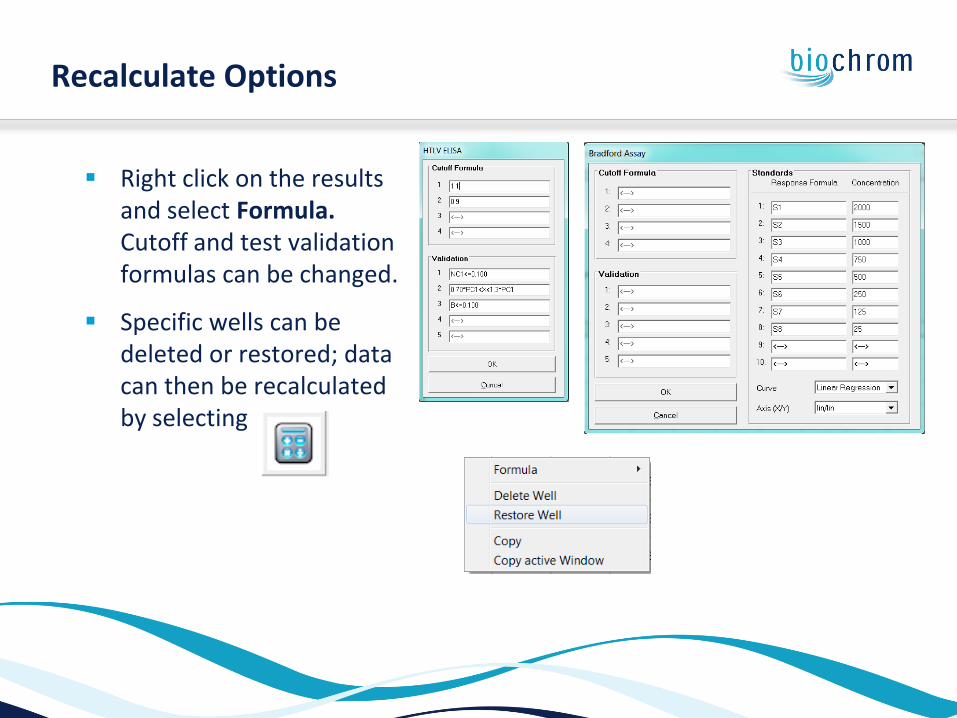
Recalculate Options
Right click on the results and select Formula. Cutoff and test validation formulas can be changed.
Specific wells can be deleted or restored; data can then be recalculated by selecting

Running a test definition
Select
A dialogue window will appear, select test to run and OK
A window will open to prompt for the number of samples. The sample number defined in the test definition will appear. Select OK or change to new sample number.

Key Features of ADAP 2.0 Plus
Quantitative and qualitative analysis- for most assays
Quality controls for replicate rejections and test validation
Recalculation Options
Options for printouts and data export
Quick method setup

Questions and Feedback
More advanced analysis options are available for the Zenyth 340 and Zenyth 200 microplate readers. Requirement for an advanced ADAP 2.0 webinar?
Questions from the field?
Customer perception of ADAP 2.0?
Other suggestions for upcoming webinars?