adaptive research for agricultural and rural development...
TRANSCRIPT

Adaptive research workshop phase II by PELUM Page 1
Adaptive Research for Agricultural and Rural Development
Phase II Workshop Report
Organized by
Participatory Ecological Land Use Management (PELUM) Association
PELUM KENYA
Workshop Held at
Hill Spa & Resort, Nakuru
29th
to 31st August 2012
Reported by Lilian Njogu

Adaptive research workshop phase II by PELUM Page 2
Table of Contents Abbreviations ................................................................................................................................................ 4
1.0 Background and Introduction ................................................................................................................. 4
1.1 Opening Remarks and Introduction of Members ............................................................................... 4
1.2 Key Opening Speech ........................................................................................................................... 5
1.3 Programme Overview and Objectives ................................................................................................ 5
1.4 Objectives............................................................................................................................................ 5
1.5 Expectations of the workshop ............................................................................................................ 5
1.6 Fears expected during the workshop ................................................................................................. 6
1.7 About PELUM Kenya ........................................................................................................................... 6
2.0 Introduction to Adaptive Research for Agricultural and Rural Development Phase II ........................... 7
2.1 Topics Covered in Phase I.................................................................................................................... 7
3.0 Research Problem (Statement) ............................................................................................................... 8
3.1 Research Objectives ............................................................................................................................ 9
3.2 Sample Selection ................................................................................................................................. 9
3.3 Sampling Options/ Methods ............................................................................................................... 9
4.0 Research Designs .................................................................................................................................. 10
4.1 Factors to consider when developing questionnaires. ..................................................................... 10
4.2 Sample of CRD Layout ....................................................................................................................... 11
4.3 Sample of RCBD Layout ..................................................................................................................... 11
4.4 Sample of SPD Layout ....................................................................................................................... 11
4.5 Management of Agricultural Experiments ........................................................................................ 12
5.0 Preparation of a Sample Questionnaire for Field use ........................................................................... 12
5.1 Adaptive Research Questionnaire .................................................................................................... 12
5.2 Field Work: Laying Out Field Experiments ........................................................................................ 13
6.0 A Recap of Day 1 and 2 ......................................................................................................................... 16
6.1 Data Processing ................................................................................................................................. 16
6.2 Data Analysis ..................................................................................................................................... 17
6.3 Data Presentation ............................................................................................................................. 18
6.4 Research Report ................................................................................................................................ 18
7.0 Case Studies from Member Organizations based on Phase I Deliberations ......................................... 19
7.1 Findings from the Survey carried out with Dondori Farmers ........................................................... 22
7.2 Processed and Analyzed Questionnaire Carried out During the Field Work Trip ............................. 23
7.3 Adaptive Research Workshop Evaluation ......................................................................................... 23
8.0 ANNEXES ............................................................................................................................................... 28

Adaptive research workshop phase II by PELUM Page 3
8.1 List of workshop Participants ............................................................................................................ 28
8.2 Work plans by Member organizations .............................................................................................. 29
8.3 Dondori analyzed research findings .................................................................................................. 34
8.4 Adaptive Research Questionnaire .................................................................................................... 36
8.5 Adaptive Research Work Plan ........................................................................................................... 38
8.6 Adaptive research case study on indigenous sheep breeds ............................................................. 38
8.7 Guidelines for On-farm Research ...................................................................................................... 41

Adaptive research workshop phase II by PELUM Page 4
Abbreviations
ARDP – Agriculture and Rural Development Programme
CRD – Completely Randomized Design
PELUM Kenya – Participatory Ecological Land Use Management
RCBD – Randomized Complete Block Design
SPD – Split Plot Design
1.0 Background and Introduction
Following an increased appreciation and increase in the role of research in agriculture and rural
development, PELUM Kenya has been carrying out capacity building in the area of adaptive
research. Adaptive research is also known as on farm research, and is conducted to validate,
modify or calibrate a new technology on specific soil, climate, and social economic or
environmental characteristics of a given area. In this type of research farmers play a key role in
the research process.
In November 2011, PELUM Kenya, held the first introductory training that mainly focused on
discussions around concepts and definitions. The participants were taken through basic aspects
of adaptive research such as its importance, roles, levels, types, processes, research plan,
development and dissemination. The participants visited community projects to identify research
aspects that can be incorporated regular development work.
To build on this process, PELUM Kenya organized the second workshop to progress the
adaptive research analysis and discussions. During this workshop, the participant shared the
information they gathered on the results of the implementation of the plans laid down in the first
workshop, which included achievements and challenges.
1.1 Opening Remarks and Introduction of Members
The participants were welcomed to the second phase of the workshop by Maryleen Micheni, the
workshop coordinator and Programme
Officer, Research and Information
Management at PELUM Kenya. She
welcomed the participants and asked
those who were not in the first phase to
read through the report for the first
phase, so that they are not left behind.
She gave the participants the
opportunity to introduce themselves in
pairs and each participant to introduce Ms Maryleen Micheni welcoming participants
Adaptive research workshop phase II by PELUM Page 5
his/her partner to the rest of the participants. This was followed by a selection of welfare officials
and norms to guide all participants during the 3 days workshop were put in place.
1.2 Key Opening Speech
The workshop was officially graced with opening prayers by one of the participants. An official,
Mr. Stanley Bii, the Acting Programme Coordinator, Agriculture and Rural Development
Programme (ARDP) delivered an opening speech. In his speech, he said investigating more on
research has helped to improve farm production. He said in ARDP they work through farmer
groups and encourage farmers to transfer their indigenous knowledge to other generations.
ARDP who were the host organization for the workshop had organized a group of farmers to
come and meet with the participants to carry out some interviews to help in the research project.
He ended by wishing the participants a good time and a warm welcome to Nakuru noting that the
climate condition was expected to be rainy and cold.
1.3 Programme Overview and Objectives
Maryleen took the participants through the overall aim of the workshop as well as the main
objectives. She also asked participants to state their expectations and fears of the workshop. The
overall aim of the training was to increase the knowledge and skills of field agricultural
facilitators in conducting on farm/ adaptive research while executing community development.
1.4 Objectives
To outline the research designs commonly used in social and in agricultural research
To elaborate on key elements in adaptive research data collection and processing
To highlight on preparation of research reports and their use in dissemination of findings
To carry out some practices in the field on the set-up and consequent implementation of
adaptive research/ on farm research projects.
To share experience on successes and challenges from programmes and projects that are
focusing on adaptive research metrics based on workshop plans from November 2011
training.
1.5 Expectations of the workshop
Learn about field design for adaptive
research
Build on introductory workshop
Share experience on adaptive research
Learn more on Adaptive Research
See how Kenyan workshops and
organized
Share experience from Spain
Share experience on livestock
Get to know more people
Gain Knowledge and learn new ideas
Socialize
How to design Agricultural Research
Simple ways to help farmers get through
Adaptive Research
How farmers can approach Adaptive
Research
How often research will be repeated
Communication of result by farmers to
the future generation
Learn application of Adaptive Research

Adaptive research workshop phase II by PELUM Page 6
1.6 Fears expected during the workshop
Knowledge trickling down to
farmers
Time challenge
Field work, the weather might be wet
Will farmers adapt the Adaptive
Research?
Kiswahili / Language Barrier
How Adaptive Research is
domesticated
Catching up with the phase / training
Terrorism and Ebola from Uganda
If participants will be friendly
Unsure of next destination
(movement from one hotel to
another)
Time frame might be too short
1.7 About PELUM Kenya
Maryleen introduced
PELUM Kenya, stated the
objectives of the
association, values, aims
and mission as well as the
programmes at PELUM
Kenya. She mentioned the
core functions of PELUM
Kenya and its role in
advocating and supporting
small scale farmers’
initiatives all over East,
Central and Southern
Africa.
What is PELUM Association?
Participatory Ecological Land Use Management (PELUM) Association is a network of Civil
Society Organizations / NGOs working with small-scale farmers in East, Central and Southern
Africa. The membership has grown from 25 pioneer members (in 1995) to over 230 members in
2010.
PELUM Kenya’s Vision
To see communities in Kenya become self organized to make choices towards an improved
quality of life that is socially, economically and ecologically sustainable
PELUM Kenya’s Mission
To build the capacity of the member organizations and partners in Kenya to empower their local
communities through participatory methodologies in ecological land use management and
sustainable development.
PELUM Kenya Programmes
Four activity based Programmes run at the secretariat:
Participants of the Adaptive Research phase II workshop

Adaptive research workshop phase II by PELUM Page 7
i. Capacity Enhancement Programme (CEP) – Headed by a Programme officer
ii. Campaign Advocacy and Lobbying (CAL) Programme – Programme Officer
iii. Research and Information Management (RIM) Programme - headed by a Programme
officer
iv. Results Based Management (RBM) – Programme officer,
v. Management, Coordination and Support - headed by the Country Coordinator,
Programme Operations Manager (POM) & the Finance and Admin Manager (FAM).
This programme offers support and facilitatory role to the 4 activity based programmes
above.
2.0 Introduction to Adaptive Research for Agricultural and Rural
Development Phase II
The session was facilitated by the
main facilitator of the workshop,
Johnstone Tungani, of Sacred
Training Institute, Bungoma.
Johnstone, who was the facilitator
during first workshop in November
2011, asked the participants to state
what they learnt during the first
phase. The participants stated the
following in brief:
We defined research as a
systematic process of data collection, analysis & interpretation to create problem solving
knowledge
Stated the emphasis we put in involving farmers in our on farm research
We should take the process of dissemination more seriously by engaging farmers
We defined different types of research and how to adapt each.
Understanding the concepts used in research, uses and sources of research
Collaboration between the farmers and the researcher
Research facilitates good planning and decision making.
The facilitator then kicked off his presentation by reviewing in brief the main topics that were
covered in the previous workshop.
2.1 Topics Covered in Phase I
Definition of adaptive research
Importance of research
Types of research
Identifying research topics/issues
Ethical issues in research
Overview of research proposals
Overview of research reports
Mr. Johnstone introducing Adaptive Research Phase II

Adaptive research workshop phase II by PELUM Page 8
a) Definition
Research is the systematic process of data collection, analysis and interpretation aimed at
generating useful knowledge / information
Adaptive research is similar except it is more about technology validation mostly with the
communities / farmers.
b) Importance of Research
Explore into new information
Accurate description of issues
Accurate explanation of scenarios
Informed evaluation of systems/persons
Reliable prediction of future
c) Types of Research
Method Based
Purpose based
d) Identifying Research Topics/ Issues
Experience & consultation
Literature & reports
Beneficiary needs assessment
Keen observation
e) Ethical issues in research
Morals
Non plagiarism
Legal issues
Mentoring
Culture / Environment mindful
f) Research proposals
A document on the projected plan of action
Introduction
Literature review
Methodology
g) Research reports
A document on findings and recommendations from research
Introduction
Literature review
Methodology
Results
Discussion, Conclusions & Recommendations It is the key tool for dissemination (outreach) of research findings.
3.0 Research Problem (Statement)
It is defined as a significant challenge facing community (One that lowers living standards) or an
issue where society has inadequate knowledge / understanding causing curiosity/ real problem.
Factors to consider in stating a problem in adaptive research:
a) ‘Felt’ problem, b) Study literature to widen knowledge of the problem
c) Clarity of statement

Adaptive research workshop phase II by PELUM Page 9
3.1 Research Objectives
Research objective is a statement of the task(s) the researcher intends to undertake with the aim
of ‘solving’ the problem.
Qualities that a research objective must have are:
Directly related to the problem
Have an action/verb word
Specify the area/location where task will be done
As specific as possible
Have a measurable nature
Be realistic
Have an estimate time frame
Examples of Objectives
The facilitator stated some examples of research objectives.
To establish the prevalence of striga weed on farms in Ugunja Division of Siaya District.
To investigate the causes of declining yield of tea among small hold farmers in Teremi
Division in Vihiga District
To determine effect of decreasing land sizes on the dairy industry in Molo District of
Nakuru County
To suggest strategies for reducing the impact of drought on livestock in Makueni
Division of Makueni District.
Mr. Johnstone Odera then asked the participants to give examples of research objectives. The
examples given were:
To determine the yields of four cassava varieties in Ugenya.
On this example, the participant said she felt the need to research on it because cassava is
a main food source in Ugenya. She therefore wants to advice the Ugenya farmers on the
best type of cassava to plant among the four varieties available
To identify the root cause of continuous poor yield of Wairimu bean in Mathira North
Zone, Nyeri County.
3.2 Sample Selection
Study area is the geographical boundaries within which a research will be done.
Population is the total number of units/individuals from which the research can collect
data.
Sample is the fraction of the population from which the research is actually collected
Sampling in research is done to reduce the cost of study, reduce time of completion and to
improve efficiency. The sample size on the other hand is determined by the funds available, time
allocated, degree of variability in the population and the quality of sampling.
During sampling, weaknesses such as errors arise due to estimation. Another weakness is that
sampling may give room for researcher bias.
3.3 Sampling Options/ Methods
Probability Sampling- Has high reliance of chance / nature/ luck
Simple Random Sampling – Use the Ballot method

Adaptive research workshop phase II by PELUM Page 10
Systematic Sampling – Select at regular in an organized list of population
Cluster Sampling – Select from prepared geographical zones
Stratified Sampling- Select based on quality criteria
Multistage Sampling – Select sample in phases
Non- Probability Sampling – It does not rely purely on chance. It has some researcher’s logic
input.
Purposive – In this kind of sampling, you go for people who have details of what you
want. If you want very fine details.
Convenience – You select farmers within the area of research for your own convenience
Availability – Take only those available within the study area
Voluntary – Go for those who are freely willing to give information
Snow Ball – Being referred from one farmer to another. It is mostly used when the
researcher does not know anyone within the study area. You rely on someone to direct
you to another.
Quota – Setting a certain percentage for example you decide to target 60% of female and
40% male.
Questions to the facilitator from the participants
1) Which among the probability and non probability method is recommended for a farmer
researcher?
Both methods are applicable to the farmer, but the probability sampling is much
better because non-probability is best for social research where you are dealing with
people’s perception.
2) How do you deal with unreliable farmers who can mess the research?
Use a reliable farmer whom you know cannot inconvenience. This can be established
from previous working relationships
Work with different farmer groups to be able to identify the reliable group. Working
with a group is more appropriate because one farmer cannot make a decision without
consulting the other farmers.
The researcher sometimes contributes to messing of the research because they do not
explain clearly and in details to the farmer what the research entails for him to
understand the importance of it.
4.0 Research Designs
The arrangement / strategy /plan for data collection deemed ideal for the study in question
i) Survey Design
Ideal for most social studies
Non manipulative
Emphasizes a good number of respondents
Relies mostly on use of questionnaires
Questionnaires can be administered through Self method, Telephone and face to face.
4.1 Factors to consider when developing questionnaires.
Study purpose / objectives
Language
Clarity of meaning
Sequence of questions

Adaptive research workshop phase II by PELUM Page 11
Number of questions
Format of questions (Closed or Open
ended)
Pre test
When drafting a questionnaire the researcher should have in mind that a very long questionnaire
can give the wrong feedback. The number of questions should not be too many.
ii) Experimental Design
It is Ideal for most natural / agricultural studies:
Manipulation / treatments
Random allocation of treatments to units (Randomization)
Several runs of the treatments on units (Replication)
Data collection forms instead of questionnaires
It lays out options in experimental designs
Completely Randomized Design (CRD)
Randomized Complete Block Design (RCBD)
Split Plot Design (SPD)
4.2 Sample of CRD Layout
Variety 1 Variety 1 Variety 3 Variety 4
Variety 2 Variety 1 Variety 2 Variety 4
Variety 2 Variety 3 Variety 4 Variety 3
4.3 Sample of RCBD Layout
Variety 1 Variety 2 Variety 3 Variety 4
Variety 2 Variety 3 Variety 1 Variety 4
Variety 4 Variety 1 Variety 2 Variety 3
4.4 Sample of SPD Layout
Compost Manure Dap Natural Fertilizer
Variety 1 Variety 1 Variety 1 Variety 1

Adaptive research workshop phase II by PELUM Page 12
Variety 2 Variety 2 Variety 2 Variety 2
Variety 3 Variety 3 Variety 3 Variety 3
4.5 Management of Agricultural Experiments
All non treatment operations must be kept similar across all plots. These may include:
Tillage
Seed variety
Fertilization
Weeding
Pest & disease control
Tools for data collection
Persons working in the plots
5.0 Preparation of a Sample Questionnaire for Field use
The facilitator divided the
participants into two groups for
each group to come up with a
sample questionnaire to be used
for field use.
The host organization ARDP
had organized a group of farmers
to assist the participants in filling
up the questionnaire as part of
the research. During the field
visit, the participants were also
involved in the farm to carrying
out demonstrations on how to
lay out the CRD, RCBD and
SPD designs.
5.1 Adaptive Research Questionnaire
See annex 8.4
Participants in groups drafting a questionnaire

Adaptive research workshop phase II by PELUM Page 13
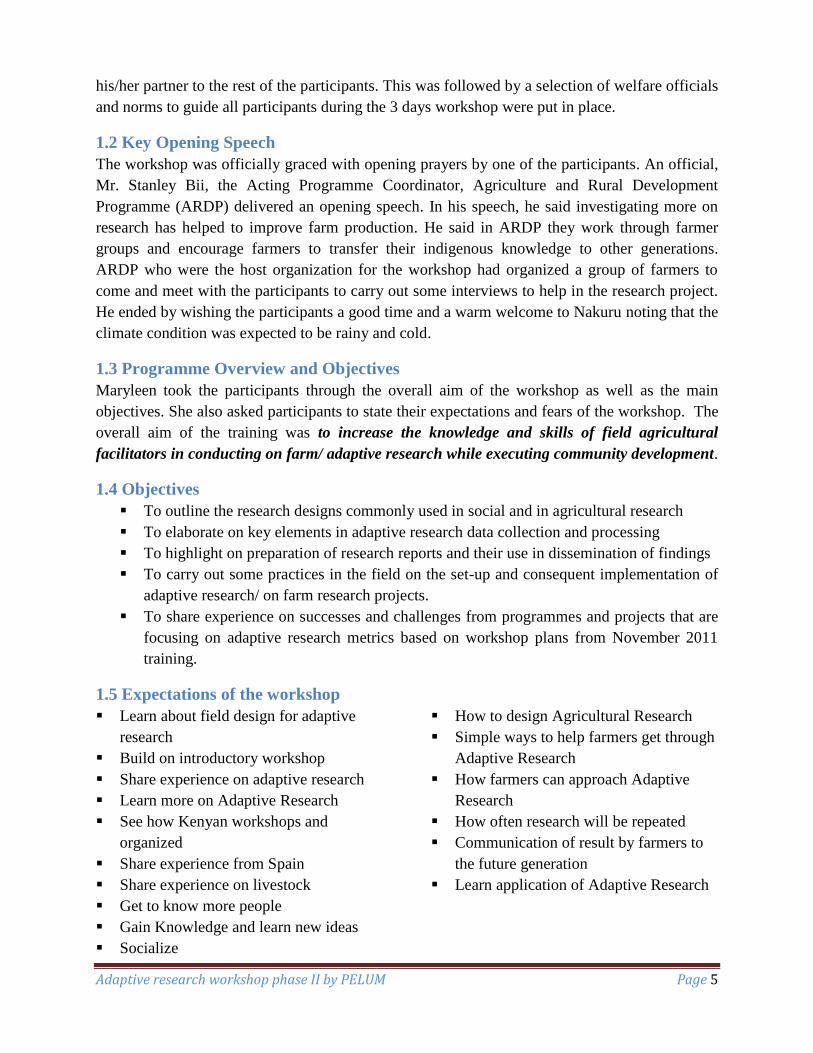
5.2 Field Work: Laying Out Field Experiments
During the field work, the participants visited a farm where they were to carry out practical
experiments on how to design the Completely Randomized Design (CRD), the Randomized
Complete Block (RCBD) and the Split Plot Design (SPD).
The facilitator, carried out the first practical demonstration with the involvement of other
participants assisting, and he later asked the participants to do it on their own without his input.
The photographs below show the process of designing the CRD by participants in a more
practical way in the field.
A group photo with the farmers and participants
Participants Familiarizing with the farmers Farmers / participants filling questionnaires
Adaptive research workshop phase II by PELUM Page 14
Participants walking in a farm and on left Mr. Johnstone demonstrating how to measure a plot
A demonstration of the first measuring steps and on left participants view a designed plot
Learning more practically by designing plots with the correct measurements in preparation for research work

Adaptive research workshop phase II by PELUM Page 15
Participants re-designing their plots on their own
It starts with getting the correct measurements and fixing the pegs to mark the points!

Adaptive research workshop phase II by PELUM Page 16
6.0 A Recap of Day 1 and 2
Johnstone took the participants through an unexpected way of recapping what he had trained
throughout the sessions. He wrote 10 questions each on a different paper, and folded them one
after the other to make a ball of papers. The participants were expected to “unfold the mask”,
read the question aloud and answer it before throwing the mask/ball to another participant. This
kind of recap was unique and challenging because nobody knew the question he/she was to
answer.
1) What is adaptive research? - It is an on farm research
2) What is the meaning of research problem? - Understanding your area of research more
clearly
3) What is sampling? Coming up with what you will do in terms of method to use and where to
carry out the research
4) Why is sampling important? – It helps to get quantified data. It can be biased or unbiased.
Unbiased gives accurate results.
5) State anything about probability sample? – It is a sample that you predict. You cannot get
actual results when looking at probability sample.
6) Name one type of non-probability sampling – Purposive sampling
7) Tell us about Split Plot Design (SPD) – It is where you can access other varieties in the same
plot
8) State any 3 things to consider in making questionnaires – Clarity, simple language and
objectives
9) What on earth is Completely Randomized Design? – It is a research design where you’re
looking at several treatments considering the differences in the area of research
10) State a situation where a Randomized Complete Block design may be used – It may be used
on flat surfaces or continuous areas.
6.1 Data Processing
After collecting data from the field the researcher prepares the data for analysis that involves:
Cleaning – If you have any forgotten information and do not have contacts of how to get
it, delete it from your data.
A complete designed plot with the tags, ready for research

Adaptive research workshop phase II by PELUM Page 17
Coding – In questions where you got statements instead of numbers, provide numbers to
represent. This will be easy for anyone analyzing your data.
Data entry – Enter the data into soft copy
Edit / Clean – Check any keyboard errors that may have occurred when typing
6.2 Data Analysis
Mathematical operations to which data gathered from the ‘field’ is subjected to reveal trends in
the issues under investigation to enable interpretation and recommendation:
a) Median
The middle value when data collected is arranged in ascending or descending order:
9, 12, 15, 16, 17, 17, 18, 18 ((16+17)/2)
b) Mode
The value in the data that appears the most number of times:
9, 12, 15, 16, 17, 17, 18, 18 (17 & 18)
c) Mean
The average of the data values:
(9+12+15+16+17+17+18+18) / 8 = 15.25
d) Range
The difference between the highest and the lowest of the values in the data:
9, 12, 15, 16, 17, 17, 18, 18 = 18 – 9 = 9
e) Standard Deviation
The square root of sum of the squares of the difference between each value and the mean of the
values:
√ ((9-15.25)2+(12-15.25)
2+(15-15.25)
2 +(16-15.25)
2+(17-15.25)
2+(17-15.25)
2+(18-15.25)
2+(18-15.25)
2) / 8 = √ (1860/8) = √233 = 15.26
Data from a Study Effect of Rate of Broiler Feed on Weight Gain
Rate of feed (Kg/week) Weight Gain (Kg/month)
1 3
2 6
3 9
4 12
5 15
6 18

Adaptive research workshop phase II by PELUM Page 18
Association:
Model of relationship between two variables:
Y = K + bX: K is Y-intercept & b is the slope of the graph
Y intercept = 1.7
b = (Change in Y) / (Change in X) = (12 - 6)/ (4 - 2) = 3
Y = 1.7 + 3X
6.3 Data Presentation
Methods of making summarized / analyzed data available to those who would read our report.
Proper titles and labels are the key thing in data presentation
Narrative - Essay approach, rational flow of ideas Tables – Titles and column tables
Pie Charts
Bar Graphs – Histograms and Line graphs
Photos
Results interpretation- it involves explaining the reasons for the trends reveals by the
presentation based on:
Rational knowledge – Rely on your knowledge
Reference to literature – Rely on other researchers’ literature
Consulting authorities – Rely on an expert in that area of research
6.4 Research Report
The research report should consist of the following:
Title – Derived from the problem to the objective
Abstract – Gives an idea of what you’re doing
Problem Statement – Highlight what was missing / gap
Statement of Objective(s) – Start by stating the broad objectives and narrowing down to
specific objectives
Methodology – Sampling, design, data collection, work plan / budget

Adaptive research workshop phase II by PELUM Page 19
Results – Objective by objective or data by data
Discussion - Interpretation of results preferable in the same order as in the results
Recommendations – Statement(s) in the study based on the data and information from the
research
7.0 Case Studies from Member Organizations based on Phase I Deliberations
NECOFA in Kibwezi - Case Study on Millet (By Priscilla Nzamalu)
NECOFA is based in Kibwezi within Makueni County. The area is semi arid and receives
minimum rainfall.
The production of millet in Kibwezi has been very slow. The Market outlets are only within the
households. There are a lot of imports from Tanzania yet the millet is the same type as what is
grown in Kibwezi. The schools no longer prepare brown porridge from millet; they prefer to buy
the white flour for porridge. Some farmers use the millet to make local brew. They want to
research on why the production is slow and causes of the change in prices.
NIA in Kajiado - Case study on Local sheep v/s the Doba sheep from South Africa (By Joyce
Saiko)
Kajiado County is home to the Maasai community in Kenya. The County is arid and most
communities rely on keeping livestock
When the Doba sheep was brought the local sheep is no longer in existence. The Doba feeds
more than the local sheep. Kajiado being a dry area, the Doba sheep is very expensive to
maintain because it drinks lots of water and eats almost double the local sheep. Its production is
very poor and expensive. They are researching on the viability of re-introducing the local sheep
again.
INADES Formation in Machakos - Case study on Moisture Content and Seed storage (By
Grace Mureithi)
INADES works within Machakos county, a semi arid zone where communities rely on keeping
livestock and crop production.
The average moisture content is below 3 and they face a big challenge is retaining the moisture.
The nature of the soil is seen to be one of the major problems. The instruments of measuring the
soil contents are very expensive and unaffordable to farmers. They are doing a lot of
management output as they research on how to maintain the moisture. They are also researching
on how they can go back to using local seeds which are more adaptable to the prevailing
ecological conditions. Most farmers do not have storage facilities and that is why they do not
store the local seeds. They will research on affordable storage facilities and inform farmers on
the usefulness of storing local seeds.
BIOGI in Vihiga - Case Study on Soil moisture testing By Ion Uranga)
In BIOGI, the case study was similar to that of Machakos. However, they had carried out some
research and identified the problem and solutions. The presentation was done by Ion Uranga, a
volunteer student from Spain who was on internship with BIOGI a Member Organization to
PELUM Kenya.

Adaptive research workshop phase II by PELUM Page 20
Objective: To Collect data of soil conditions in the
garden/s (physical and chemical) in order to see the
improvement of the soil fertility.
Purpose:
Inform our extension work on fertility changes
from inputs on yields, crop health
Confirm whether changes in physical and
chemical factors has maintained biodiversity
and increased fertilization
Have a better knowledge of our lands, in order
to know which path to follow in the future.
Methods:
pH measurement
Soil moister measurement
Soil texture
Rain data collection
Temperature data collection
Physical observations
Results of section moisture average
All sections have been wet during the 5 weeks.
The bed 2B2 with 7.3 points is the wettest.
2B1 bed is the driest with 3.5 points.
Possible Conclusions
The fact that 2B2 bed has been with a lot of mulch and compost can be the cause of the
high amount of moisture. Also the design for water catchment
Crops with low need of water should be plant at 2B1 bed
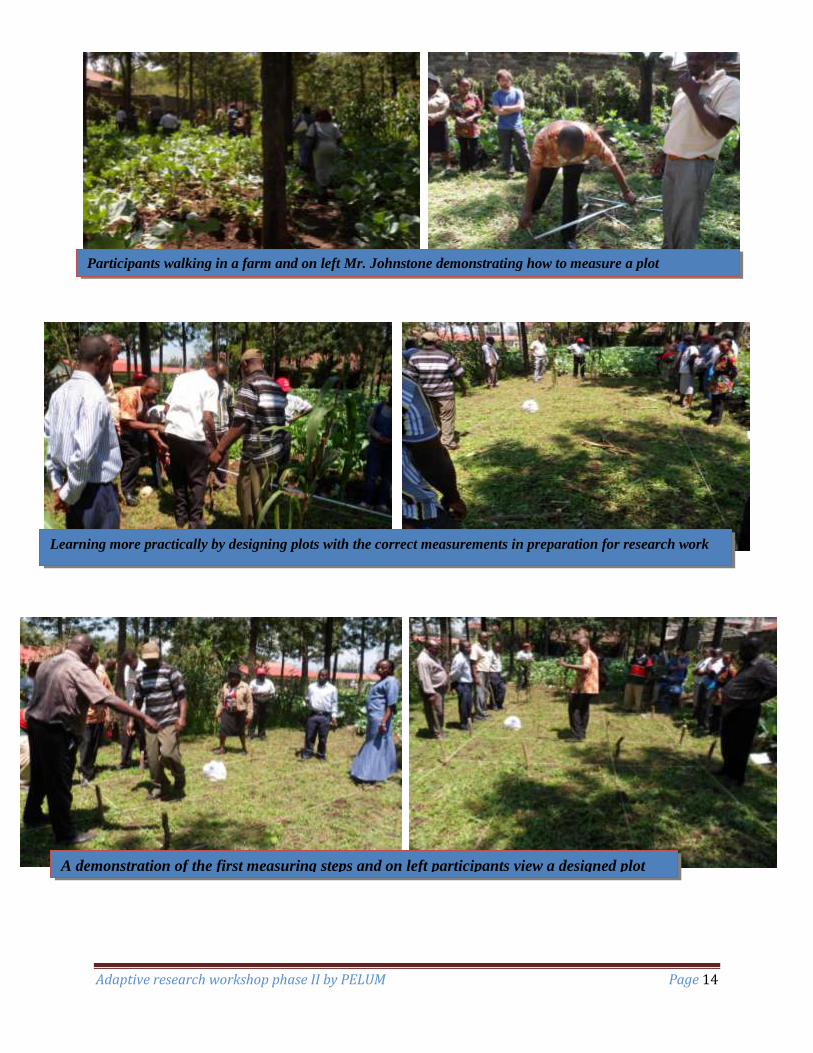
Results of soil moisture vs date
All weeks are wet and first week of August 2012 has been the wettest with above 6.1
points
Mr. Ion Uranga presenting the case study
Adaptive research workshop phase II by PELUM Page 21
Possible Conclusions
The water catchment strategies carried out in the garden such as terraces or trees
plantation might be the cause of the high moisture of the soil.
Results of rain and soil moisture vs date
August 2012 has been more rainy than July 2012.
After heavy rains the soil gets wet.
Possible Conclusion
The soil seems to retain water at least enough time until the next rain.
Results:
pH measurements:
pH (average) of the garden: 6.93
Model farmers pH between: 6.5- 7.0
Final Observation; Slightly acid to neutral and good availability of Macro and Micro nutrients

Adaptive research workshop phase II by PELUM Page 22
MHAC in Kitale Case Study to verify published books from other countries, to determine what
is suitable for Kenya e.g. a Case on pest Control methods (By John Okomba)
Kitale County is in a high potential zone within the rift valley. The county is among the highest
producer of maize nationally.
MHAC gets published books from places like California in the USA and go through the
information published, and it is from there that they pick on what is important and suitable for
Kenyan cases/adaptation. They have taken like e.g. the case of pest control. Much information
has been published but not all is suitable in Kenyan conditions. They have embarked on
researching and publishing what is suitable and take to the farmers what they call “concluded
research” They use the researchers and extensions officers to determine what is finally suitable
for the local farmer. Once the farmers have enough information, they carry out the practical in
their farms. The researchers visit the farms to see the progress to check if the results are positive.
SMART Initiatives in Kitale - Pokot Case Study to know the scientific name of a tress that
preserves milk and how it works. (By Peter Namianya)
SMART Initiative do lots of research, they are currently researching on a certain tree which
works well in milk preservation. The Pokot being nomads have lots of milk and they face a lot of
competition from established market leaders in the milk industry in Kenya such as KCC and
Brookside. Smart Initiative promotes the Pokot pastoralist in different ways so that the milk can
be used by other communities. In their research, the milk from Pokot is more healthy, medicinal
and nutritious because the animals feed on natural feeds in the fields.
The community has traditional knowledge on how to preserve milk without the use of chemicals.
The researcher will now determine how the tree works in preservation and the scientific name of
the tree.
RODI Kenya in Ruiru - Case Study of how the prisoners use their skills when out of prison
(By Samuel Mwangi)
RODI Kenya is based at Ruiru town within Kiambu County. Most farmers in the County have
small land units that they maximize in food production.
RODI Kenya focuses mostly on training prisoners and giving them knowledge on sustainable
agriculture. Those in prisons learn and train a lot on agriculture but a big percentage do not
practice it when they are released from prison. They lack the confidence to practice what they
learn because most of them are not accepted back to the community. RODI Kenya therefore
integrates them with the community during the trainings so that they are accepted back. The
participants gave an example of a research case study for RODI to find out how the prisoners are
using the skills given to better their lives once they are out of Prison.
7.1 Findings from the Survey carried out with Dondori Farmers
From the filled in questionnaires during the field visit, the participants analyzed the information
and simplified the findings.
8 women 3 men
5 married, 1 single, 5 widow
Average HH size; 6
Farmers in 5 villages
Average land size; 1.34 acres
90% quoted maize as key
45% quoted dairy goat, 35% dairy
cow & 20% poultry

Adaptive research workshop phase II by PELUM Page 23
Furthest & nearest water source 2.5
km & 0.02 km respectively
55% of them do not do any irrigation
45% rely on both family & hired
labor, 27% on hired alone and 27 %
on family labor alone
Furthest distance to input source,
20km and shortest, 0.3km
81% quoted input cost as high
80% of the farmers have more than
50% of their income from farm
activities.
54% sell produce at farm gate, 36%
via brokers & 10% did not indicate
any selling.
Only 36% access credit facilities
Reasons for Joining Groups
Knowledge empowerment
Dairy goat project
Easy selling of produce
Widow affairs
Issues they needed addressed
Finance support
Peace in the community
Access to good seed
Skills for research
Access to irrigation water
Skills & means for pest control
More training
7.2 Processed and Analyzed Questionnaire Carried out During the Field Work Trip
Responses to questionnaire administered to Dondori farmers in Nakuru
See annex 8.3
7.3 Adaptive Research Workshop Evaluation
Each participant was given an evaluation form to answer questions about the workshop. The
information is to help PELUM Kenya improve on their work in future.
1) List 1-2 things:
a) Learnt from the workshop
The simple way to draft a
questionnaire and what to put into
consideration
The approach to take in asking
questions for my questionnaire.
The basics of adaptive research
Data analysis and Report writing
Adaptive research really works
How to design Split Plot
How to formulate a questionnaire
The importance of adaptive research
Importance of farmers as researchers
The process of conducting and
analyzing research
How to come up with good
experiment (agricultural) designs
The design layouts and report system
Data preparation and presentation
Methods of sampling and research
designs

Adaptive research workshop phase II by PELUM Page 24
How to demarcate plots for research
and the process of doing it
About the CRD and RCBD way of
collecting data
How to carry out adaptive research
Activities in different organizations
Community members have
knowledge and can participate well
in adaptive research
Preparation of a questionnaire and
the practical bit of it with the
farmers.
The work done in various
organizations
How to conduct social research
How to carry out on farm research
b) Liked about the workshop
The facilitator
The workshop content was good
Active participants
Well organized field work
Adequate time
The way it was well facilitated
The different experiences shared
The good atmosphere
Time management
It was an eye opener for the
researcher
Sharing of research work by the
participants
Competence from the facilitator
Mr. Johnstone
Interactive from participants and
the technical subject matter
It was very comprehensive
Excellent facilitation
Training coming at a good time
for implementation in the new
season
The filed experience – it did not
take a lot of time which was
convenient
A friendly learning environment
Value addition (acquired
knowledge)
Interactive lecture
The ease in training – Facilitator
was very down to earth
c) Did not like about the workshop
The hotel note books – very
few paged and the poor
quality with papers plucking
off
Hotel management and
organization
Team building activities
missing
Being shifted from one hotel
to another
Getting good vehicles from
the hotel to town is a big
challenge
The low rate of asking
questions when the
participant has not got the
concept
The hotel accommodation
with incomplete facilities

Adaptive research workshop phase II by PELUM Page 25
Lack of hard copies during
presentation
Location of the hotel was
very inconveniencing
Temperatures too low
First day was mixed up
Upper Chester management
of customers was not good.
d) For c above what would you suggest for improvement
Buy tangible good quality note books with firm pages or PELUM Kenya to
provide instead of the hotel
All participants should be put in the same hotel.
More activities for group work to promote team building
Workshops should end on Thursday or Friday morning to avoid burn-outs
Better and improved hotel management
Frequent follow-ups and meetings (not 2011-2012 gap)
Active participants and more less continuity of the participants who were on the
start of the subject matter
Book the participants in a hotel with complete facilities
Planning the hotel logistics early
Issue power-point slides in hard copies so that we can follow up during the
presentation.
Book a venue with enough accommodation for all the participants
2) On a scale of 1 to 5 rate the following (1=Poor, 2=Fair, 3=Good, 4=Very good,
5=Excellent)
Poor Fair Good Very Good Excellent Extent of meeting your objectives xx xxxx xxxxxxxxxxx xxxxx Workshop relevance in your work xxxxx xxxxxxxxxxx xxxxxx Facilitation Process xxxxx xxxxxxxxxxx xxxxxxx Advance Information provided xxx xxxxxx xxxxxxxx xxxxx
3) For the Workshop Conference facility rate the following:
1=Poor, 2=Fair, 3=Good, 4=Very good, 5=Excellent)
Poor Fair Good Very Good Excellent
Location of the hotel xx xxxxx xxxxxxxxxx xxxxxx
Meals x xx xxxxxxxxxx xxxxxxxxx x
Accommodation xxxx xxxxxxxx xxxxxxxxx xx
Hospitality x xxxxxxxxx xxxxxxxxxx xxx
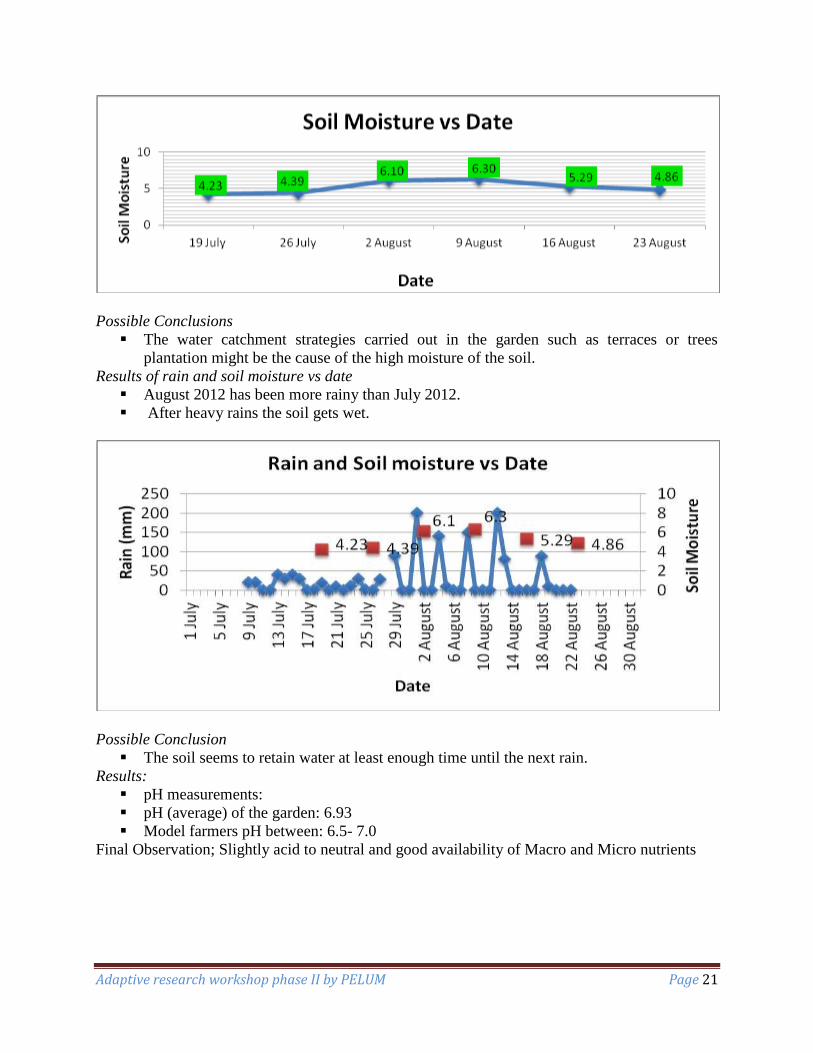
4) For (3) above what would be your suggestion for improvement?
To avoid movements, please
maintain participants in one
place.
Carry a printer to avoid
unnecessary movements
Adaptive research workshop phase II by PELUM Page 26
We should all be in one place
so that we can socialize and
share work experience after
the end of day workshop
Improve on the booking
system of the participants.
The process was too slow
We should go to a hotel not
far from town
Plan ahead of the workshop
Conference rooms needs
noise protection. The trucks
turning and movement of
people is very distrusting.
The workshop halls should be
more spacious for free
movement
PELUM needs to look at
good places where things can
be accessible with
accommodation and
hospitality up to date.
Improve on facilitation. Rates
to be improved
Efficiency at the reception
desk
Good communication prior
incase of change of venue
The hotel should keep
working hard to improve
their services
More space, we were too
squeezed
Good care of guests and
being considerate on their
welfare before money
They need to improve their
way of cooking and having a
variety especially for
vegetarians. A good example
of the Chester in town.
5) Any other additional comments?
Very greatful to PELUM Kenya for organizing such an important training
Keep up PELUM, the workshop was very educative and the first phase report was
informative especially for those who missed out.
We need more time for social networking
Keep up the good work as it is working for most of member organizations
Provide certificate for easy identification about trainings
Reporting date should be put into consideration
The organizers should ensure that there are enough rooms in their target venue before
reporting date of the participants
There was great facilitation. The facilitator opened up our minds to be able to do
much of our organizations and upcoming questions
The training is very productive
Though the hotel is still under construction, the parking area should be given first
priority
Due to too much noise from the road, the second phase of the workshop should be
situated elsewhere

Adaptive research workshop phase II by PELUM Page 27
Next time we need more time with the farmers
Improve on field visits and practical work which was well understood
The workshop should be allocated more time
Thank you for the workshop facilitation
Greatful for the knowledge acquired. My God bless you

Adaptive research workshop phase II by PELUM Page 28
8.0 ANNEXES
8.1 List of workshop Participants
Name
Organization and Position
Contacts
Postal Address Telephone Email
1. Gathuru Mburu ABN 6271-01000, Thika 0722643029 [email protected]
2. Gerald Yongo ALIN East Africa 17-40302, Ndhiwa 0716760726 [email protected]
3. Stanley Bii ARDP 1488, Nakuru 0722914862 [email protected]
4. James Maina ARDP 1488, Nakuru 0733966545 [email protected]
5. Julius Karuga Baraka Agricultural College 52, Molo 0722402544 [email protected]
6. Ion Uranga Gonzalez BIOGI 0708842840 [email protected]
7. John Adeya BERMA 42, Butula 0733893154 [email protected]
8. Johnson Nyaga COSDEP 646, Nairobi 0725805899 [email protected]
9. Millicent Akoko CREPP 86-40122, Awasi 0725877195 [email protected]
10. Peter Njeru FH Kenya 125, Marsabit 0721947474 [email protected]
11. Mary Wangui GBIACK 4171, Thika 0724265889 [email protected]
12. Anne Mbole ICE Kenya 6072, Thika 0722663384 [email protected]
13. Grace Mureithi INADES Formation 1905-90100, Machakos 0722535263 [email protected]
14. Simon Buyobe KICIP 384, Luanda 0728090428 [email protected]
15. John Okomba M-HAC MHAC Private Bag, Kitale 0715203463 [email protected]
16. David Obiero NASARDEP 62, Rodikopany 0725665781 [email protected]
17. Joyce Saiko NIA 366, Kajiado 0721324194 [email protected] [email protected]
18. Priscilla Nzamalu NECOFA 295, Kibwezi 0721404058 [email protected]
19. Samson Mwangi RODI- Kenya 746, Ruiru 0726995483 [email protected]
20. Robert Kihoro RINCOD 9642-00300, Nairobi 0721395770 [email protected]
21. Miriam Mutenyo Self Help Africa 2248, Nakuru 0728830027 [email protected]
22. Peter Namianya SMART Initiatives 3761, Kitale 0731359246 [email protected]
23. Moses Njenga YARD 4781-01000, Thika 0728009782 [email protected]
24. Johnstone Odera Facilitator 2248, Bungoma 0718473114 [email protected]
25. Lilian Njogu Rappoteur 47985-00100, Nairobi 0722556263 [email protected] 26. Roland Mwalugha PELUM Kenya 6123-01000, Thika 020 26 22 674 [email protected]
27. Janet Lang’o PELUM Kenya 6123-01000, Thika 0729223762 [email protected] [email protected]
28. Maryleen Micheni PELUM Kenya 6123-01000, Thika 020 26 22 674 0723540417

Adaptive research workshop phase II by PELUM Page 29
8.2 Work plans by Member organizations
Organization Title of the study
Statement of the research problem
Statement of objective (s)
Description of the design including timeline and data collected
Highlight of key findings from the study
Statement of key lessons/ Recommendations for the community
ICE Kenya The impact of
embracing
indigenous
knowledge on
seed saving
sovereignty
intervention
The problem of food
insecurity in the country is
alarming in most parts of the
country and a big problem is
people of Kenya cannot
control what they feed on,
simply because we have no
control over what farmers
plant, rather the likes of
Monsanto control most of
the seeds planted by our
farmers and so we can’t
control what goes to our
stomachs but the market
dictates what is available.
-During the times of our fore
fathers, they could plan what
to eat and feed their families
and there was no hunger and
people didn’t suffer from
starvation. Industrial farming
has changed most of the
indigenous farmer practices
thus changing our seeds
-To outline the existing
indigenous knowledge
on seed saving
-To investigate the
reasons for or against
the adoption of
indigenous knowledge in
seed work
-To determine whether
there is any significant
impact on food security
if indigenous knowledge
in seed work is
embraced by farmers at
all levels of food
production
-To document the
existing indigenous seed
knowledge within Yatta
community
A sample of 40 farmers
active in the Kithio Kya
mawithyululuko women
group constituted the
research population and a
sample of 12 farmers’ key
with indigenous knowledge
on seed work formed the
basis of the study. 4 farmers
practicing industrial farming
formed the sample for
comparative research. Data
on the kind of seeds they
plant, the kind of crop
management they carry out,
why they pant the kind of
seeds they plant, Starvation
data per household over the
last one year-formed the
date recorded.
Farmers have a lot
of indigenous
knowledge in seed
saving and seed
management -They
do seed selection
right from the farm
for the crops that
are vigorous in
growth, and then
the seeds are sun
dried and well
preserved using
herbs such that
seeds can be stored
for at least 3 yrs
without losing
viability and without
destruction by
storage pests.
-The 4 farmers
practicing industrial
farming didn’t
harvest anything
- There exists much
indigenous knowledge in
seed saving among
farmer in Yatta –Kithio
kya mawithyululuko
women group.
- Farmers are willing to
go back to their
indigenous seeds which
are more adaptive to
their weather conditions
because those who plant
hybrid seeds don’t
harvest anything but for
them that plant
indigenous seeds they
harvest despite the
changing climate.
- Farmers that use
indigenous seeds and
indigenous knowledge in
seed saving never lack
food throughout the
Adaptive research workshop phase II by PELUM Page 30
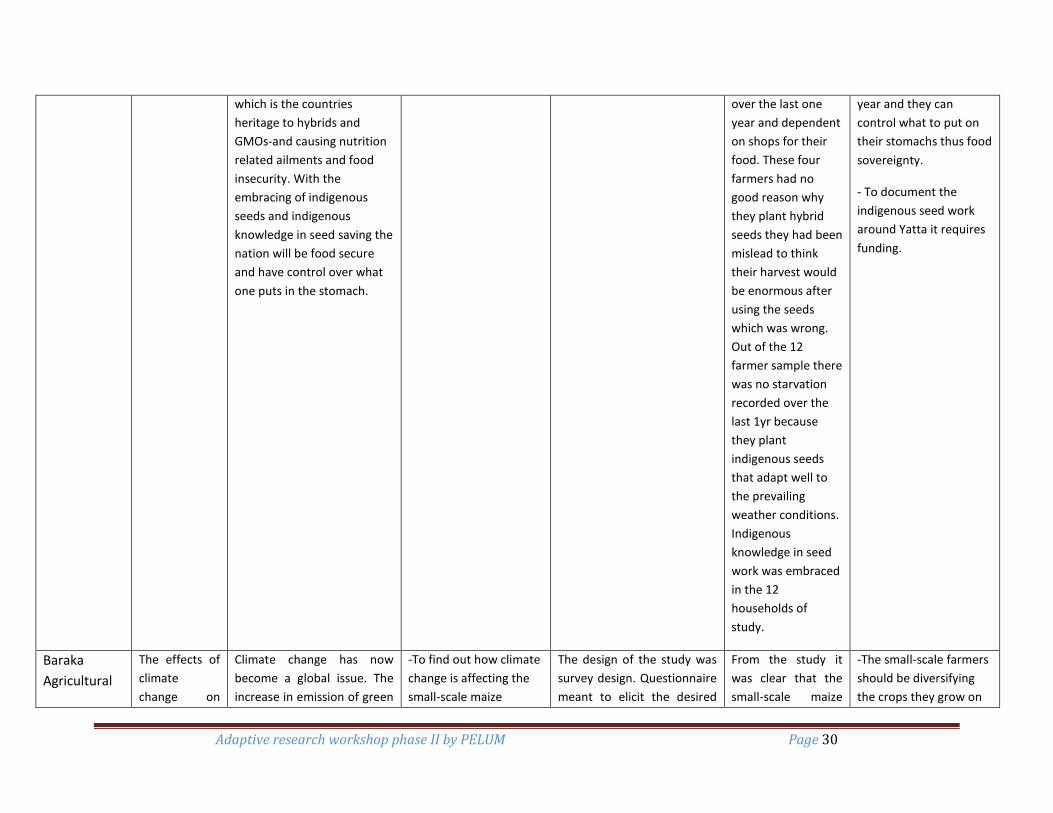
which is the countries
heritage to hybrids and
GMOs-and causing nutrition
related ailments and food
insecurity. With the
embracing of indigenous
seeds and indigenous
knowledge in seed saving the
nation will be food secure
and have control over what
one puts in the stomach.
over the last one
year and dependent
on shops for their
food. These four
farmers had no
good reason why
they plant hybrid
seeds they had been
mislead to think
their harvest would
be enormous after
using the seeds
which was wrong.
Out of the 12
farmer sample there
was no starvation
recorded over the
last 1yr because
they plant
indigenous seeds
that adapt well to
the prevailing
weather conditions.
Indigenous
knowledge in seed
work was embraced
in the 12
households of
study.
year and they can
control what to put on
their stomachs thus food
sovereignty.
- To document the
indigenous seed work
around Yatta it requires
funding.
Baraka
Agricultural
The effects of
climate
change on
Climate change has now
become a global issue. The
increase in emission of green
-To find out how climate
change is affecting the
small-scale maize
The design of the study was
survey design. Questionnaire
meant to elicit the desired
From the study it
was clear that the
small-scale maize
-The small-scale farmers
should be diversifying
the crops they grow on

Adaptive research workshop phase II by PELUM Page 31
College maize
production
among small
scale
producers in
Kamara
division,
Kuresoi
district.
house gases such as carbon
dioxide, methane, nitrous
oxide and chloro-floro
carbons has led to global
warming over years. The
greenhouse gases form a film
over the atmosphere
trapping heat and
subsequently leading to
increased temperatures
hence heating the earth
surface. Although global
warming can be attributed
by natural causes, human
activities are considered to
be the main cause of it.
Climate change has affected
many sectors in the country
including the agricultural
sector. Global warming has
led to less productivity in
agriculture since this sector
highly depends on climate.
Weather patterns have been
disrupted and therefore
people cannot predict
seasons like they used to
years ago hence cannot tell
when certain crops can do
well.
- Maize is the staple food for
the cosmopolitan Kamara
producers in Kamara
Division ,Kuresoi District
- To examine the
challenges posed by
climate change to the
small-scale maize
producers in Kamara
Division, Kuresoi District.
-To identify ways in
which the effects of
climate change on small-
scale maize producers
in Kamara Division can
be reduced.
response from the study was
administered and collected
after two weeks. Data
collected was analyzed and
interpretations done
.Conclusions and subsequent
recommendation were
made.
producers in
Kamara Division
have been adversely
affected by the
climate change.
Maize production in
the division has
declined from the
usual 15 bags to 8
bags per acre.
The temperatures
experienced in this
area have continued
to increase from the
ordinary
experienced
temperatures.
Food security
situation in this area
has worsened over
time.
School truancy due
to lack of school
fees has increased
due to increased
poverty.
Farmers have
generally moved to
small livestock
the farms and include
drought resistant ones.
-The farmers need to
implement the
requirement by the
government that 10
percent of the farm
should be under forest
cover.
- Households in the area
need to be educated not
to over rely on maize as
the staple food, and
should include other
tradition food crops on
their diet.
-Farmers should be
encouraged to adopt
coping strategies such as
keeping of small
livestock as income
generating activities to
boost their income level
to reduce school going
children truancy.

Adaptive research workshop phase II by PELUM Page 32
Division; however its
production has been
affected by climate change.
The low yield caused by the
climate change has adversely
affected community
development in this area.
This study will investigate
the effects of climate change
on maize production among
small scale producers in
Kamara Division in Kuresoi
district. The expected
outcomes include better
coping strategies for small-
scale maize producers in
Kamara Division, improved
food security situation the
division and increased
knowledge on ways to
reduce the negative effects
of climate change among
small-scale farmers in
Kamara Division, Kuresoi
District.
keeping to reduce
the effects of
climate change
Adaptive research workshop phase II by PELUM Page 33
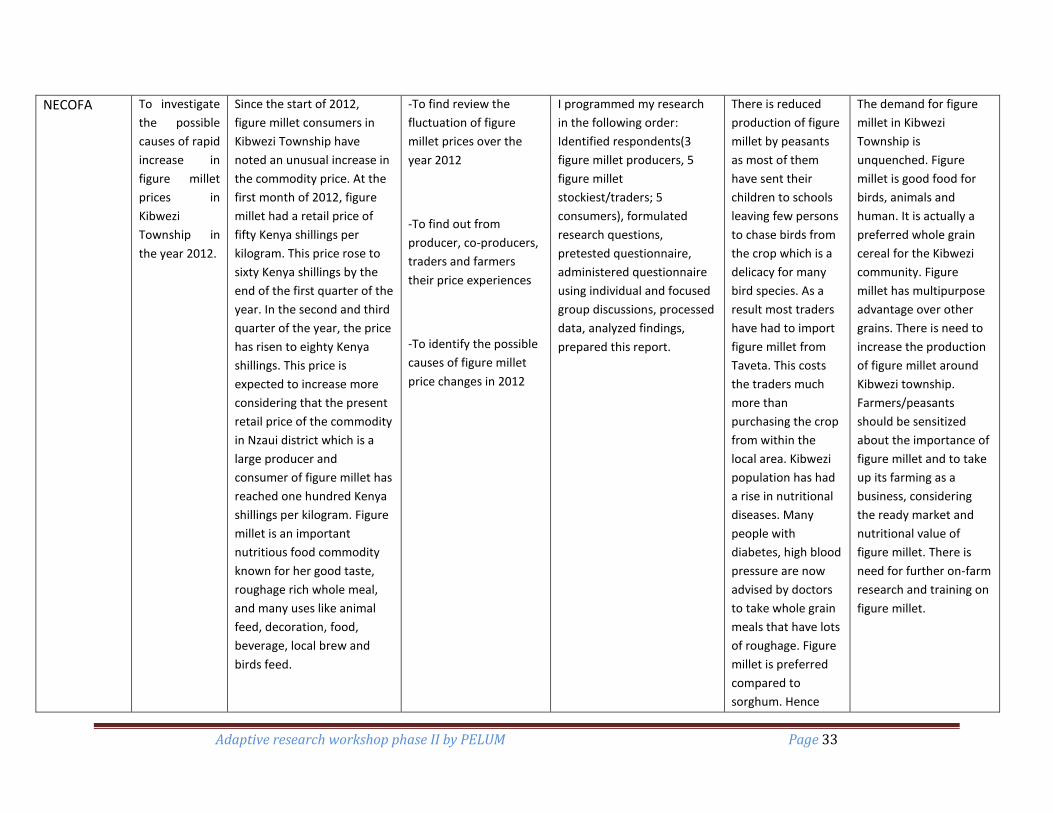
NECOFA To investigate
the possible
causes of rapid
increase in
figure millet
prices in
Kibwezi
Township in
the year 2012.
Since the start of 2012,
figure millet consumers in
Kibwezi Township have
noted an unusual increase in
the commodity price. At the
first month of 2012, figure
millet had a retail price of
fifty Kenya shillings per
kilogram. This price rose to
sixty Kenya shillings by the
end of the first quarter of the
year. In the second and third
quarter of the year, the price
has risen to eighty Kenya
shillings. This price is
expected to increase more
considering that the present
retail price of the commodity
in Nzaui district which is a
large producer and
consumer of figure millet has
reached one hundred Kenya
shillings per kilogram. Figure
millet is an important
nutritious food commodity
known for her good taste,
roughage rich whole meal,
and many uses like animal
feed, decoration, food,
beverage, local brew and
birds feed.
-To find review the
fluctuation of figure
millet prices over the
year 2012
-To find out from
producer, co-producers,
traders and farmers
their price experiences
-To identify the possible
causes of figure millet
price changes in 2012
I programmed my research
in the following order:
Identified respondents(3
figure millet producers, 5
figure millet
stockiest/traders; 5
consumers), formulated
research questions,
pretested questionnaire,
administered questionnaire
using individual and focused
group discussions, processed
data, analyzed findings,
prepared this report.
There is reduced
production of figure
millet by peasants
as most of them
have sent their
children to schools
leaving few persons
to chase birds from
the crop which is a
delicacy for many
bird species. As a
result most traders
have had to import
figure millet from
Taveta. This costs
the traders much
more than
purchasing the crop
from within the
local area. Kibwezi
population has had
a rise in nutritional
diseases. Many
people with
diabetes, high blood
pressure are now
advised by doctors
to take whole grain
meals that have lots
of roughage. Figure
millet is preferred
compared to
sorghum. Hence
The demand for figure
millet in Kibwezi
Township is
unquenched. Figure
millet is good food for
birds, animals and
human. It is actually a
preferred whole grain
cereal for the Kibwezi
community. Figure
millet has multipurpose
advantage over other
grains. There is need to
increase the production
of figure millet around
Kibwezi township.
Farmers/peasants
should be sensitized
about the importance of
figure millet and to take
up its farming as a
business, considering
the ready market and
nutritional value of
figure millet. There is
need for further on-farm
research and training on
figure millet.

Adaptive research workshop phase II by PELUM Page 34
there is increased
demand for figure
millet. There has
been an increase
over time of day
baby care centres,
training institutions
like private schools
and the early
childhood
development
teachers’ (ECD)
centres, where
parents and
learners prefer to
take figure millet
porridge compared
to other staff. These
have increased the
demand for figure
millet.
8.3 Dondori analyzed research findings Name S
ex
Mobile Family Household Village Land size
Best Crop
Best Live stock
Water Source (km)
Irrigation Labour In put Km
In put cost
Extension Farm income %
Selling Credit Group Need
Bilha N 2 0720668158 1 6 2 1.5 1 3 0.02 1 1 0.5 2 2 0.7 3 1 2 7 Agnes G 2 0725789474 3 4 1 2 1 1 2 1 1 10 1 4 0.75 1 1 1 1 Mary W 2 0720101142 3 7 4 0.4 1 3 0.02 1 1 20 2 3 1 1 2 3 5 Martha K 2 0710661385 3 7 2 0.45 1 2 0.02 1 1 0.5 2 1 0.8 3 1 4 6 Florence W 2 07164930 3 5 2 1.8 1 3 0.02 1 1 0.3 2 2 0.25 3 1 2 1 Mark K 1 0725818918 1 14 2 0.9 1 1 2.5 2 2 10 1 3 1 2 1 2 1 Dallis W 1 0722902257 1 3 2.5 1 1 0.02 2 2 16 2 4 0.66 1 2 2 4

Adaptive research workshop phase II by PELUM Page 35
Eunice M 2 0729606145 3 4 2 1.25 2 2 0.02 2 2 2 2 0.5 3 2 3 2 Danson K 1 0725536820 1 4 2 1.8 1 1 0.05 1 3 1 2 1 1 1 2 2 3 Ruth M 2 0725884542 1 5 0.5 1 2 0.4 2 3 15 2 2 0.4 3 1 2 1 Alice W 2 0733663460 2 4 5 1.5 1 3 0.02 2 3 20 2 2 1 3 1 1 7
Key
Villages Crops Livestock Labour In-put cost Selling Group Reason Need Credit access Ndege 1. Maize 1.Dairy 1.Family +hired 1. Moderate 1. Brokers 1. Empowerment 1. Finance 1. None Wanyoro 2. Kales 2. Poultry 2. Hired 2. High 2. None 2. Dairy Goat 2. Peace 2. Yes Menengai 3. Dairy Goat 3. Family 3. Gate 3. Market access 3. Seed Tambuja 4. Widow affairs 4. Research Karusha 5. Water
access
6. Pest control
7. Training

Adaptive research workshop phase II by PELUM Page 36
8.4 Adaptive Research Questionnaire
Introduction
The participants of the Adaptive Research workshop wish to conduct a survey aimed at gaining some
insights into the social and farming characteristics of the select farmers working with ARDP in Dondori
Division of Nakuru North. The information obtained from this survey may be used by the participants to
suggest to ARDP can do to improve the respondents farm productivity and income. The following set of
questions are designed to enable achieve this purpose. We request you to set apart time to respond to the
following questions as accurately as you can:
1. What is your name? ______________________________________________________
2. Sex: Male ( ) Female ( )
3. What is your mobile contact (If you have)? ____________________________________
4. Are you Married ( ) Single ( ) or Widowed ( )
5. What is the size of your house hold __________________________________________
6. What is the name of your village? ___________________________________________
7. What is the total size in acres of your Owned land ( ) Leased land ( )
8. How much of your land (Owned + Leased) do you put to farming ___________________
9. Please provide the following information about the crops you grow on your farm in order of
their importance to you:
Crop Area grown Purpose Average yield (kg) Average amount sold per season
10 Please provide the following information about the livestock you keep in order of their importance to you:
Livestock Current number Purpose Average produce per month
Average income from the type per month
11 Highlight the sources of water for your home / farm in order of importance: Source Distance (KM) Cost (High or Low) Uses
12. Do you practice any irrigation on your farm? ______________________________________ 13. Who provides labor for your farm operations? ____________________________________ 14 How far do you source your farm inputs (KM) ______________________________________ 15. How would you describe the cost of acquiring your farm inputs ______________________________ 16. Do you access to any agriculture advisory / extension services Yes ( ) No ( )
Adaptive research workshop phase II by PELUM Page 37
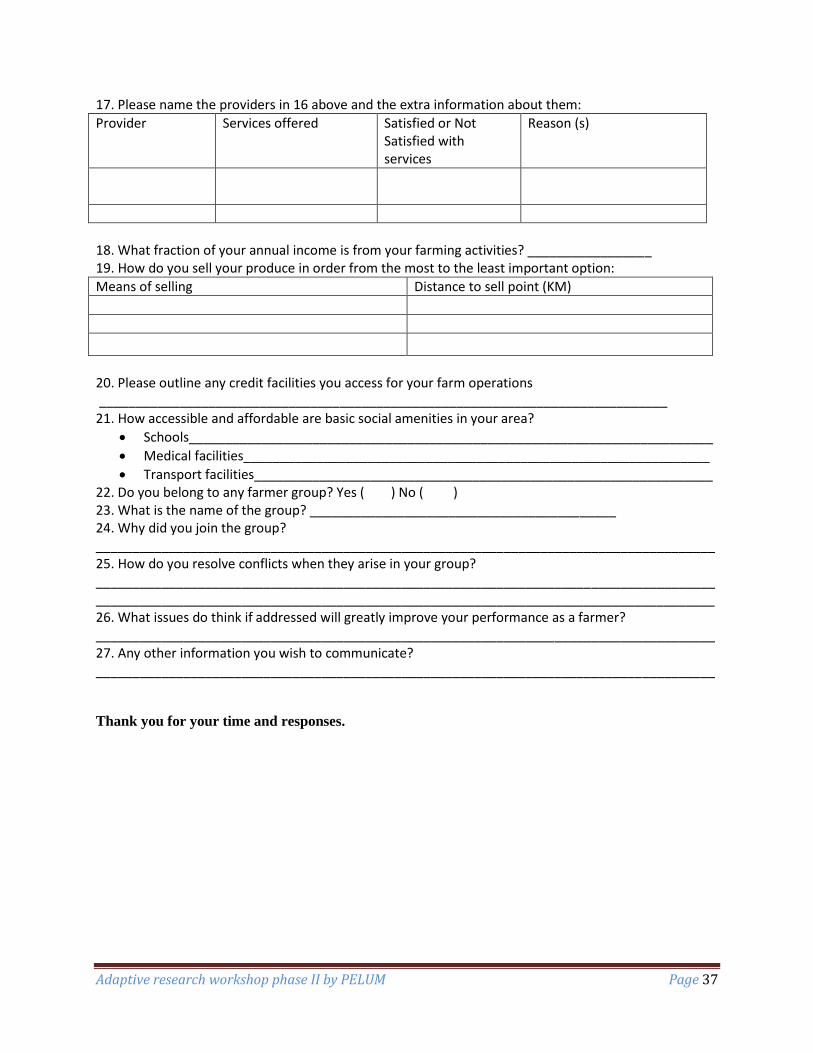
17. Please name the providers in 16 above and the extra information about them:
Provider Services offered Satisfied or Not Satisfied with services
Reason (s)
18. What fraction of your annual income is from your farming activities? _________________ 19. How do you sell your produce in order from the most to the least important option:
Means of selling Distance to sell point (KM)
20. Please outline any credit facilities you access for your farm operations ______________________________________________________________________________ 21. How accessible and affordable are basic social amenities in your area?
Schools________________________________________________________________________
Medical facilities________________________________________________________________
Transport facilities_______________________________________________________________ 22. Do you belong to any farmer group? Yes ( ) No ( ) 23. What is the name of the group? __________________________________________ 24. Why did you join the group? _____________________________________________________________________________________ 25. How do you resolve conflicts when they arise in your group? __________________________________________________________________________________________________________________________________________________________________________ 26. What issues do think if addressed will greatly improve your performance as a farmer? _____________________________________________________________________________________ 27. Any other information you wish to communicate? _____________________________________________________________________________________
Thank you for your time and responses.

Adaptive research workshop phase II by PELUM Page 38
8.5 Adaptive Research Work Plan
The participants were given a workshop plan to do based on what they had learnt during phase 1
and 11 Adaptive Research Workshops. The work plans will be used in the last phase of the
workshop.
Each workshop participant will:
1. Identify an issue worth investigation in their areas of work using any of the research topic
identification approaches outlined.
2. The participant will design and conduct a study to address the issue identified in (1). At the
end s/he will prepare a report with the following components and email to PELUM by 31st
October 2012:
a. Title of the study
b. Statement of the research problem
c. Statement of objective (s)
d. Description of the design including time lines and the data that was collected
f. Highlight of key findings from the study
g. Statement of key lessons / recommendations for the community based on the study findings
8.6 Adaptive work plan on indigenous sheep breeds
Title of the study: Indigenous breed resiliency to drought
Statement of the research problem: The Maasai livelihoods depend almost entirely on livestock- cattle
and shoats.
Frequent and
severe
drought in
the past few
years has
compromised
these
livelihoods.
Livestock
deaths of up
to< 40% in the district have severely weakened the livelihood systems of the pastoralists. Consecutive
rainfall underperformance in some years has further exacerbated the situation.
Adaptive research workshop phase II by PELUM Page 39
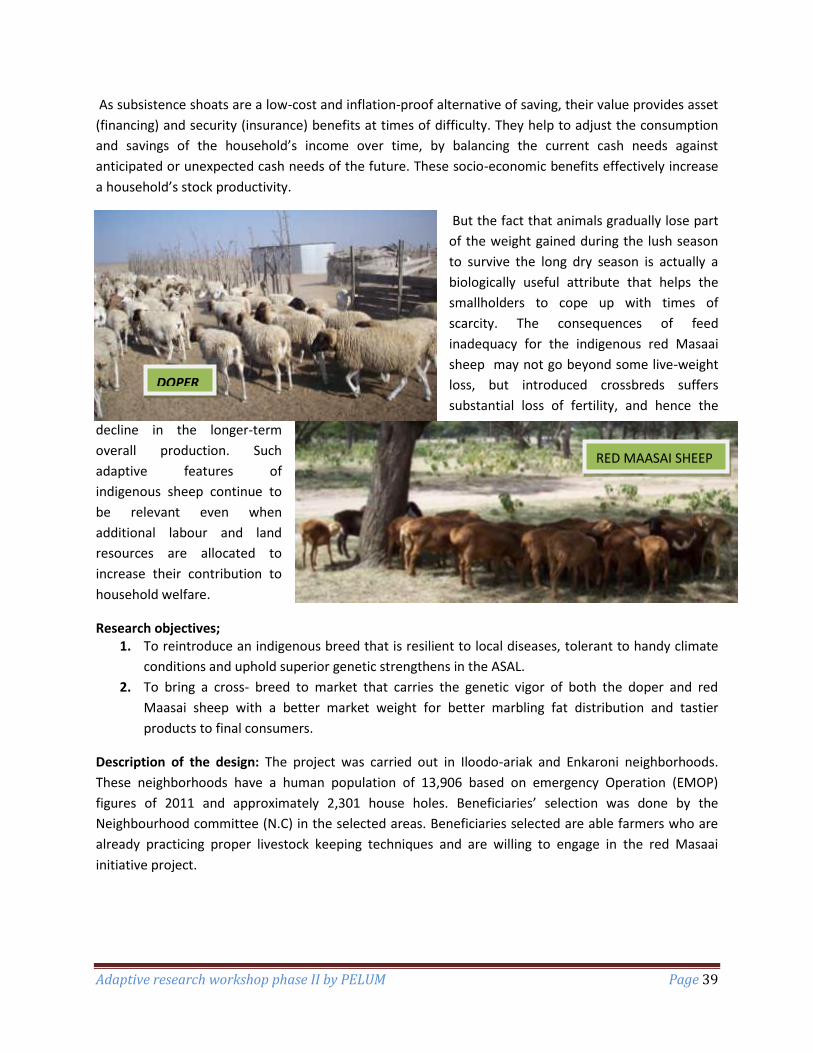
As subsistence shoats are a low-cost and inflation-proof alternative of saving, their value provides asset
(financing) and security (insurance) benefits at times of difficulty. They help to adjust the consumption
and savings of the household’s income over time, by balancing the current cash needs against
anticipated or unexpected cash needs of the future. These socio-economic benefits effectively increase
a household’s stock productivity.
But the fact that animals gradually lose part
of the weight gained during the lush season
to survive the long dry season is actually a
biologically useful attribute that helps the
smallholders to cope up with times of
scarcity. The consequences of feed
inadequacy for the indigenous red Masaai
sheep may not go beyond some live-weight
loss, but introduced crossbreds suffers
substantial loss of fertility, and hence the
decline in the longer-term
overall production. Such
adaptive features of
indigenous sheep continue to
be relevant even when
additional labour and land
resources are allocated to
increase their contribution to
household welfare.
Research objectives; 1. To reintroduce an indigenous breed that is resilient to local diseases, tolerant to handy climate
conditions and uphold superior genetic strengthens in the ASAL.
2. To bring a cross- breed to market that carries the genetic vigor of both the doper and red
Maasai sheep with a better market weight for better marbling fat distribution and tastier
products to final consumers.
Description of the design: The project was carried out in Iloodo-ariak and Enkaroni neighborhoods.
These neighborhoods have a human population of 13,906 based on emergency Operation (EMOP)
figures of 2011 and approximately 2,301 house holes. Beneficiaries’ selection was done by the
Neighbourhood committee (N.C) in the selected areas. Beneficiaries selected are able farmers who are
already practicing proper livestock keeping techniques and are willing to engage in the red Masaai
initiative project.
RED MAASAI SHEEP
DOPER

Adaptive research workshop phase II by PELUM Page 40
Key findings of the study
DESCRIPTIVE ITEM ILOODO ARIAK ENKARONI
No of Sheep Farmers in Cluster 424 farmers 554 farmers.
Number of Sheep in Cluster 3,400 3,200
Willingness of the farmers to be involved in the project
Most of the farmers in the identified clusters are already involve in most of NIA’s projects therefore will cooperate during the project
Most of the farmers in the identified clusters are already involve in most of NIA’s projects therefore will cooperate during the project
Number of villages in the cluster 6 villages 6 villages.
Grazing patterns of the Sheep The animals are kept under free range/herding in defined household grazing areas. However, sometimes in the dry season sheep are temporarily moved into areas with lush pasture resources.
The animals are kept under free range/herding in defined household grazing areas. However, sometimes in the dry season sheep are temporarily moved into areas with lush pasture resources.
Watering patterns of the Sheep Local water pans are used for livestock watering during the wet season, while in dry season the sheep utilizes the local springs as watering points.
Seasonal earth dams are used as watering points during wet season while boreholes are used in the dry period.
Contact between each of the flocks Contacts between flocks occur especially at watering points and in pasture resource concentrated areas during migration as well as grazing fields in the dry season.
Contacts between flocks occur especially at watering points and in pasture resource concentrated areas during migration as well as grazing fields in the dry season.
Migratory patterns: when is it likely to happen and overall effect on sheep health and body condition
Migration usually occurs from July to early November for all livestock farmers in this county. During these period many animals both cattle and shoats lose their body conditions and livestock diseases increase.
Migration usually occurs from July to early November for all livestock farmers in this county. During this period many animals both cattle and shoats lose their body conditions and livestock diseases increase.
Proportion of Red Maasai Sheep (RMS) and Doper or other local breeds in the flock within the cluster
There are mainly red Maasai sheep and the black head Persia (locally called Isuk). There are many red Maasai sheep (60%) than the black head persia
There are red Maasai sheep, Black head Persia and doper in this cluster The doper and red Maasai sheep are many compared to black head Persia (40% red Maasai sheep, 38% doper, and 22% black head Persia)
Proximity to markets: Which markets are farmers close to?
Iloodo-ariak farmers are able to access Kiserian and Mile 46 weekly markets.
Farmers from this cluster can access ilbisel, piliwa, sajiloni, Mile 46 and Kajiado markets respectively.
Management practices taking place –grazing control, de-worming, treatment/vaccinations
Currently the animals are kept under free range/herding in defined household grazing areas. Individual farmers are de-worming and vaccinating their animals on individual convenience basis and also using their traditional knowledge in general animal husbandry.
Currently the animals are kept under free range/herding in defined household grazing areas. Individual farmers are de-worming and vaccinating their animals on individual convenience basis.
Area occupied by cluster in Km. Sq. 142.8 km.sq 157.8 km.sq
Presence or absence of network signals in cluster-indication of use of mobile phones
There is good network signal( More than 40% farmers have mobile phones and almost 40% herders have mobile phones)
There is good network signal( More than 60% farmers have mobile phones and almost 50% herders have access to mobile phones)

Adaptive research workshop phase II by PELUM Page 41
Household characteristics: average number of HH members, proportion of men to women and children
There is an average of 6 members in each house hold(4 children, husband and wife,) In each house hold there are more women than men (52% women)
There is an average of 6 members in each house hold(4 children, husband and wife,) In each house hold there are more women than men (52% women)
Level of education: Literacy levels within the HHs
Most of the parents in each house hold are illiterate but majority of children have at least basic education.
General illiteracy level for Kajiado central district stands at 52%. Most of the parents in each household are illiterate but majority of children have at least basic education.
Road network condition: accessibility of the cluster
There are two roads leading to the cluster; an all seasonal murram road leading to Mile 46 and connects to the cluster and the Kiserian-Magadi tarmac road. To the cluster you turn left from cross junction which is an all season murram road.
The main road from Kajiado is tarmac ked up to Nkoile town. To the cluster you turn right on the road to which is an all season murram road.
Highlight key lessons/ recommendations for the community base on the study findings
1. The red Maasai Sheep is handy, resilient to diseases and uphold superior genetic strengthens
than the doper
2. Kajiado livestock farmers are emphasizing red Maasai sheep keeping after counting great loses
when keeping the high breed doper.
3. Due to diminishing land resource through land selling and population growth the pastoralists
have no choice but to embrace sustainable sources of livelihoods.
4. Lambing period is short for red Maasai sheep
5. Flock productivity and efficiency of red Maasai is high in the ASAL
6. Fertility rate of red Maasai ewes is higher compared to other breeds
7. Growth rate for red Maasai sheep’ lambs are superior in ASAL areas.
8.7 Guidelines for On-farm Research
By Alan Sundermeier
Research conducted to validate, modify, or calibrate a new technology to specific soil, climate,
socioeconomic, or environmental characteristics of a given area.
On-farm research is nothing new to farmers. However, many times much effort and expense is
put forth to conduct comparisons that are not valid. On-farm research must be practical for the
farmer by using plots that are field-scale with standard farm machinery. So that the results of the
comparison are not misleading, statistically valid designs should be used. In this way, field
variation and other factors will not discredit the reliability of the results. Successful on-farm
research begins with thorough planning before going to the field. By using the following
guidelines, it is hoped that farmers can conduct research on their farm to answer their production
and management questions.

Adaptive research workshop phase II by PELUM Page 42
1. Define the Question
Simplify your research objective into a single researchable question that makes a comparison.
Many test plots are too complicated because they are looking at too many treatments. The
problem enters when field conditions or other variables cannot be separated from true differences
in treatments. On-farm research is most successful when comparing just two practices. For
example:
"Is the profit from corn fertilized with 200 lbs nitrogen per acre different from that of corn with
150 lbs nitrogen?" Now the farmer can identify the type of treatment to set up and the data to be
collected to answer the question.
2. Plot Layout
Randomizing and replicating is the key to laying out a scientifically valid plot. This procedure is
what separates a purely demonstration plot from one which can be used to make valid
conclusions. When comparing two treatments, they must be repeated in side-by-side strips across
the field. To adequately overcome field variations, each pair of treatments should be repeated
four times, although six is better. To further overcome field variations, the treatments should be
randomly located within the pair. Always having treatment A on the left and B on the right may
favor one treatment. The following example shows one method of proper plot layout.
Pair 1 2 3 4 5 6
^ ^ ^ ^ ^ ^
A B, B A, B A, A B, B A, A B
Treatment A = 200 lb N, Treatment B = 150 lb Often a planter is used to layout a plot. One
treatment or hybrid will be applied on one side of the planter and the other on the other side. To
achieve randomization, a few more strips should be planted and then skipped during data
collection and harvesting.
Strip Treatment Pair
1 2 3 4 5 6
^ ^ ^ ^ ^ ^
A B, A B A, B A, B A B, A B A , B A B
| | | |
S S S S
K K K K
I I I I
P P P P
The above are examples of Randomized Complete Block Design experiments.

Adaptive research workshop phase II by PELUM Page 43
3. Field Site
Choose a site that is as uniform as possible. Whenever possible, avoid fields that have variable
soil types, slopes, irregular boundaries, and tile lines running parallel with the rows. Longer,
field-length strips are preferred to reduce variability in the test.
Plots should be as narrow as possible but still be convenient to plant and harvest. Border rows
are needed on each side of the plot to avoid edge effects. Be sure to flag the plot and record
treatment locations on a plot map.
4. Data Collection
Plots should be monitored frequently during the growing season. Record and date your
observations in a notebook for safe keeping. Much useful information can be gathered including-
emergence, stand, weed and insect damage, soil conditions, and weather conditions. All crop
inputs also need to be recorded. Additional data to collect may include spring soil nitrate, tissue
tests, fall corn stalk nitrate tests, and yield. Farmers need to be aware of problems that arise
which may make the plot unusable or eliminate some strips, such as weed patches or misapplied
crop inputs. The best designed field research is of little value if data is not collected accurately.
5. Analyzing the Data
Statistics are used to determine if the data collected from each treatment is due to treatment
differences or due to chance. Calculation of the L.S.D. (Least Significant Difference) will show
the minimum difference needed between treatment average results to be considered a real
difference and not due to chance. The probability that the difference between treatments could
occur by chance is called the p-level. A p-value of 95% means that the probability is only 5%
that the difference between the treatments could occur by chance. Using the above example of a
randomized complete block design, farmers can use a computer statistical program to calculate
the L.S.D. A simple, user-friendly program called AGSTATS is available by sending a disk and
postage return mailer to Russ Karow, Crop Science Building 131, Oregon State University,
Corvallis, Oregon 97331-3002.
6. Economic Evaluation
If the average difference of the treatments is greater than the calculated L.S.D. then we have
some confidence that the difference is real. But is it the best choice economically? Is the
advantage given to one treatment worth the cost difference between the treatments? A farmer
should analyze his records to determine where cost differences occurred such as seed, fertilizer,
pesticides, tillage, and management time between the treatments. The additional income benefit
can then be weighed against the possible increased costs for that treatment. Non-tangible benefits
such as improved soil quality and environmental improvement also are to be considered. General
conclusions are more safely drawn from trials repeated in more than one location and year.

Adaptive research workshop phase II by PELUM Page 44
ON FARM RESEARCH
On-Farm Trials - Some Biometric Guidelines
Release date: March 1998
This is one of a series of guides for research and support staff involved in natural resources
projects. The subject-matter here is on-farm trials. Other guides give information on allied
topics. Your comments on any aspect of the guides would be welcomed.
1. Introduction
2. Types of on-farm experiment
3. Specifying objectives
4. Choice of farms and villages
5. Choice of treatments and units
6. Measurements
7. Analysis 8. Further topics
1. Introduction
Farmer-participatory research trials have rapidly gained popularity in the past few years with due
consideration being given to the knowledge, problems and priorities of farming families. The
move towards participatory on-farm research means that many researchers, such as breeders and
agronomists, who have been trained in techniques of on-station research, are now under pressure
to move on-farm. It is therefore perhaps not surprising that the design of such trials has, too
often, resulted in miniaturized research institute experiments. Conditions for on-farm trials are
typically less controlled than those for research institute fields, and this means that more
thoughtful designs are needed.
This booklet concentrates primarily on providing guidelines on aspects of the design and analysis
of on-farm trials that are different from on-station research. It is concerned primarily with
experiments where the farmer has considerable involvement - and not situations where the
farmer's only participation is by providing land. Equally, it does not include experiments that are
really just demonstrations. You should therefore ask yourself whether your experiment (a)
involves the farmer in design, management or assessment, (b) seeks to address unanswered
questions and (c) is an experiment, i.e. it involves planned changes.
2. Types of on-farm experiment
The common distinction is whether an experiment is both designed and managed by the research
team, or researcher-designed and farmer-managed or, to some extent, farmer-designed as well as
farmer-managed. Let us consider first the trials that are researcher designed and managed. These
are trials where the farmers' fields are effectively borrowed by the research team. They become
temporarily a part of the research institute. This type of trial is important in the same way as
there remains an important place for on-station trials. Furthermore, bringing the research

Adaptive research workshop phase II by PELUM Page 45
institute, to some extent, onto farms can broaden the range of soils, pests and diseases that are
encountered as well as encourage interaction with farmers. The design of such trials is broadly
the same as on-station trials, so the information to be given in the booklet of guidelines on
Design of Experiments can be used. For researcher-managed, on-farm trials, the present booklet
is relevant on problems of site selection and on collaboration with farmers concerning site
characterization and blocking etc. However, the main emphasis of this booklet is on guidelines
for trials that are, at least to some extent, managed or designed by the farmers.
From a biometric perspective, a key point in participatory on-farm trials is that their design needs
some ideas that are normally associated with the design of a survey, together with concepts from
the design of an experiment. Thus we collect some data at the plot level (as in an experiment)
and other data at the farmer level (as in a survey). This latter component is new to some
scientists, who are used to on-station trials. It implies that concepts of survey design need to be
considered, in particular that of stratification. We give guidelines for these two components in
sections 4 and 5.
3. Specifying objectives
The initial stimulus for organizing experiments on farmers' land was to broaden the range of
validity of conclusions beyond the narrow confines of a research institute setting. This is still a
valid reason for conducting on-farm trials, but it is now recognized that farmer participation is
important and that successful programmes must incorporate farmers' abilities to experiment and
innovate.
As with any scientific investigation, it is crucial to specify the objectives of the study clearly.
Time must be allowed for this phase and the objectives need to be re-assessed during the
planning of the trial, to see whether they need to be revised. This is particularly challenging in
on-farm trials, where researcher and farmer are now working together, often with extension staff
and NGOs. It is important that the objectives are clearly identified from all perspectives.
Trials should be designed to resolve specific research questions, and researchers need to be
impartial to the perception that donors expect to see the words "on-farm" and "participatory"
before they will consider supplying funds. Usually a careful assessment of the gaps in the current
knowledge will show that a series of initiatives is needed. These may include a small survey,
plus a number of trials, some on-station and others that are on-farm, possibly some researcher-
and some farmer-managed.
In defining the objectives it is important to check that there remains some genuine research, i.e.
some hypotheses to be tested. If the major objective is to encourage adoption of a new
technology by farmers, then this may be important extension work, but it is not research. Check
also that there are not too many objectives for a single study. For example, objectives relating to
adoptability and profitability of different technologies often imply different levels of farmer
participation and hence may be better considered in separate studies.

Adaptive research workshop phase II by PELUM Page 46
4. Choice of farms and villages
The selection of farms must be closely related to the objectives of the research, and in turn to the
recommendation domain for which results are intended. The large variation that generally exists
between farms means they must be selected with care to ensure that conclusions will apply to the
appropriate group of farmers. An initial survey is valuable in identifying how farms may be
grouped, for example according to their socio-economic characteristics and environmental
conditions. Decisions have then to be made whether research results will be relevant to all
groupings or only to a subset of such farming groups. A representative (usually a random)
sample of farms is then selected from the relevant group(s) of farms. Enough farms have to be
used to have a reasonable estimate of between-farm variability. Stratified sampling may be
recommended, to ensure that a wide range of farms is included in the sample.
A multistage sampling scheme is often used, with village as the primary unit and farming
household as secondary units. The Guidelines for Planning Effective Surveys booklet gives more
guidance on this part of the design. The sample of farmers must be large enough for a valid
analysis when split into different groups, for example by soil type, tenants and owners, access to
credit or not. Where resources seriously limit the number of farms in the study, the objectives of
the study may have to be re-examined. For example, for a new topic, the first year may become a
pilot study, from which ideas and objectives are refined for the following year's research.
When selecting villages, consideration must be given to how long a village remains associated
with a research institute. Repeated use of the same villages, or use by different organisations is
simple, but such villages may become less representative of the region. When selecting farms
any restriction of the sampling scheme so that only "good" farmers are included will restrict the
recommendation domain in the same way. One justification for using "good" farmers is that they
set an example for their neighbours. Here this argument is at best weakly relevant because we are
concerned with research not demonstration.
5. Choice of treatments and units
5.1 Choice of treatments
5.2 How many treatments?
5.3 How many treatments per farm?
5.4 Replication and resources
5.5 Crop Experiments: Plot size
5.6 Crop Experiments: Plot layout
5.7 Livestock Studies: Units and replication
5.1 Choice of treatments
As noted in Section 4, the decision on the treatments and their layout within the farms depends on the
objectives of the study.
The same concepts of treatment structure are needed in participatory on-farm as in on-station trials:
* Treatments may be unstructured, e.g. genotypes;
* There may be a need for one, or more, control (or baseline) treatments;
* Factorial treatment structure remains important;

Adaptive research workshop phase II by PELUM Page 47
* The number and levels of quantitative factors have to be determined.
Below we concentrate on two points, where guidelines may be different for on-farm studies. In
participatory experiments the farmers may choose some of the treatments themselves. For
example, varieties may be chosen from a village-level nursery, or from open days at a research
institute for an experiment in the following season. This is sometimes done on a group basis, to
arrive at a consensus for the trial. Alternatively it may be done on an individual basis, with a
design that then has some treatments that differ from farm to farm. It may also result in some
farms having more treatments than others. We would encourage this flexibility: the extent to
which it is permitted will depend on the objectives of the trial. If the main objectives relate to
yield differences, then some recommended varieties may be included in all fields, to which the
individual farmers add further plots as they wish. Other objectives might imply greater, or less,
freedom for individual farmers.
The second topic is that of the control treatments. These must be justified, as treatments in their
own right. In on-farm trials the control is often the farmer's normal practice. Since this is likely
to be different for each farmer, it cannot be regarded in the usual sense of "control", i.e. as a
baseline treatment for the experiment as a whole, against which other treatment are compared.
The farmer's normal practice will be useful as a baseline for each farmer, but the researcher may
also wish to have a common baseline in addition.
In participatory trials, farmers may wish to use the concept of "controls" for their evaluation in a
way that is broader than researchers are familiar with. For example, in a soil fertility experiment,
they may request fertilizer on the control, on the grounds that the new technology should be as
good as fertilizer. Or the enhanced treatment may be planted on a poor part of the field, because
it should bring the yield to the level of the rest of the field. The extent to which such suggestions
are accepted depends on the agreed objectives of the research.
5.2 How many treatments?
We would not wish to see any rules prescribed here. The minimum may be one, when a single
new variety is distributed in an adoption study. However, normally there are at least two
treatments being compared.
We do not agree with the frequently-made statement that four treatments is in any sense a
maximum number. The statement may be related to the general view that many on-station trials
have only about eight to ten treatments, and that participatory on-farm experiments should be
simpler than on-station trials. This logic is flawed for a number of reasons. The first is that often
on-station trials could usefully have more treatments. The second is that experiments are time-
consuming and costly, and it would often be wasteful to go to the effort of an on-farm trial with
just three or four treatments. We suspect that, as real participation develops, the
researcher/farmer group will often suggest more than four treatments for experimentation.
Set against the inclination to have a large number of treatments is the recognition that many
treatments per farm usually imply complexity of the design, which may lead to partial failure of
the trial. Where there is no simple solution, the design team should reassess the objectives.
Adaptive research workshop phase II by PELUM Page 48
They could also consider splitting a complex study into simpler related experiments that may
differ in their level of farmer participation.
5.3 How many treatments per farm?
In animal experiments, where there is only one animal per farm, or in fish farming, where
farmers have only a single pond, it is only possible to study one treatment per farm. For further
discussion of this problem see section 5.7. Otherwise there are usually at least two treatments per
farm.
Questions which experimenters often ask include, "What do I do when there are more treatments
to be investigated than there are plots in each farm?" "What if some farms have more plots
available than others?" These are practical realities in on-farm experimentation, and the answer
need not be to cut down the number of treatments, or restrict the experiment only to farmers who
have a certain amount of land available to them. Care in the allocation of treatments within
farms, at the design stage, can ensure a successful experiment is carried out in such
circumstances.
5.4 Replication and resources
In designing an on-farm trial the researchers need to consider their resources carefully. For
precise treatment comparisons there needs to be sufficient replication - but at what level? It is
usually preferable to have more farms and fewer repeats of the same treatment per farm, rather
than fewer farms and more replication within a farm. Consequently, in on-farm experiments, it is
frequently the case that there are many farmers but each farmer has only one replicate of each
treatment.
The problem with having no within-farm replication is that the farmer-treatment interaction is
then normally used as the random (or residual) variation. However, the treatment effects may
really be different for the different farmers and understanding this interaction, e.g. which
treatments are most effective for which types of farmers, may be an objective of the research. In
such cases one would like to distinguish between the interaction and the residual, and having
some within-farm replication is the obvious way to do this. This does not necessarily mean that
there should be complete replication of all treatments within each farm, which would be wasteful
of resources. We suggest instead that consideration be given to a design where each farmer
repeats a single treatment. If there are a reasonable number of farms in the experiment then this
should allow a valid subsequent analysis of the data. The replication should also be sufficient if
the data are to be split into two or three subsets for analysis. The choice of which treatment is to
be repeated is not critical. It could always be the same, most important, treatment, which is then
estimated with greater precision. Alternatively, several (ten or more) farmers could each repeat
one treatment, not necessarily the same one throughout.
If within-farm replication proves impossible, then it is still possible to carry out some
investigation of the farmer-treatment interaction, provided there is information on the
characteristics of the farms (see section 7).

Adaptive research workshop phase II by PELUM Page 49
5.5 Crop Experiments: Plot size
It is often assumed that the plot size should be larger for on-farm than for on-station trials. This
is the result of past on-farm trials usually having been at the validation stage of the research.
There is no general justification, on statistical grounds, for preferring large plots in on-farm
trials. The most efficient use of a given area, or of a given number of trees, is normally achieved
with more small plots rather than fewer larger plots, unless there is considerable lateral
interference, as is the case e.g. with some agro forestry systems, or areas with nutrient or water
movement. Normally, there is a balance between the preference of farmer and researcher for
larger plots on the basis of realism, or ease of treatment application, and the statistical benefit of
improved precision from more, smaller plots.
The cases for realism when seeking farmer opinion regarding treatments, or when comparing
treatments with regard to labour requirements are examples of compelling reasons for using large
plots. However, the case for large plots should be made in relation to the objectives of the
experiment; merely stating that on-farm experiments require large plots is not enough.
5.6 Crop Experiments: Plot layout
Layout of plots within each farm will primarily be guided by perceived or known variation
within the farming area. The farmers' knowledge about the variation in their fields should be
used to determine the location of the plots and any blocking scheme, and to avoid using
particular patches of the field where necessary.
It is important to ensure that farmers and researchers are using the same criteria to define suitable
locations. Researchers normally strive for homogeneity, while farmers may have particular parts
of their field where they would like to try some treatments. For example, they may feel that
addition of crop residues is most appropriate on degraded patches. Where large sections of the
field are degraded, this can be accommodated within the design by putting all treatments on this
type of land. Otherwise the liberty given to farmers will depend on the objectives of the trial. If
farmers' opinions are of paramount importance, then the loss of randomness in the allocation of
treatments to plots is of minor concern. The important sampling is at a higher level, namely in
the choice of farmers. On the other hand, if a comparison of yields is an important part of the
trial, then it is important to allocate treatments "fairly" (i.e. with some element of randomness) to
the plots. In such a case, use of the degraded patches could be in addition to a replicate of the
treatment on ordinary parts of the field.
Many practical considerations need to be taken into account when considering block and plot
layout. In an on-station trial, for instance, a split-plot experiment may be carried out because it is
convenient to plant one large area at one time, whilst the application of different levels of
fertilizer can be on smaller areas. In on-farm trials these considerations may still apply. Another
important practical aspect is the interview process. For instance if a farmer is to give an
assessment of different varieties, where fertility is a secondary factor, then it may be convenient
if the varieties are grouped together.
5.7 Livestock Studies: Units and replication

Adaptive research workshop phase II by PELUM Page 50
Most of the principles discussed earlier with respect to crop experiments also apply to on-farm
livestock experiments. However there are particularities of livestock studies that require further
consideration.
First is the definition of the experimental unit. In livestock experiments the experimental unit is
most likely to be an individual animal, although there will be some instances where it is a group
of animals. When designing an experiment, it is important to be clear on what constitutes the
experimental unit, to ensure sufficient replication of the units. For instance in a vaccine trial
where each animal is injected with a dose of vaccine, the experimental unit is the animal. In a
poultry feeding trial where a brood of chicks eats from the same handful of feed, the
experimental unit is the brood. The fact that measurements might then be made on each chick
does not increase the amount of replication.
The second issue is that of blocking. In crop trials the natural blocking unit is the farmer. With
livestock trials, breed, parity and age of the animals are also well defined blocking units. Some
of these blocking units often need to be incorporated in the design, to construct a satisfactory
experiment.
Linked to the issue of blocking is that of resources. Farmers will have different numbers of
animals and hence, if an individual animal is the unit, this can involve a different number of
treatments per farm. In addition, many farms may have only a single animal. The value of these
farms, in an experiment, depends largely on the use of the other blocking factors, such as age and
breed of the animal.
Finally, it is sometimes possible to investigate more than one treatment on an animal. Because of
the variation that exists between animals, an appropriate design might be a cross-over design
where each animal receives successive treatments over a period of time, and so acts as its own
"control". In such designs, the order of the different treatments is varied for different groups of
animals so the conclusions are unrelated to the sequence of treatments. Here the experimental
unit is an animal for the period of time in which a single treatment is applied.
With livestock experiments there can therefore be several different levels of variation. There is
variation between farms, between animals within a farm, and between periods within animals.
Depending on the particular situation, treatments can be allocated at one or more of these
different levels. Researchers who wish to do such studies, and who are in doubt on how best to
design their experiment, should consult a statistician for advice.
6. Measurements
In participatory trials, we can distinguish between three types of measurement.
(i) Measurement of the type that are taken in on-station trials. These are usually yield
components, time to flowering, milk yields, disease scores, etc.
Adaptive research workshop phase II by PELUM Page 51
(ii) Measurements of concomitant variables. These can be at a plot level, for example problems
of waterlogging, or at a farm level, for example rainfall or soil type. Some variables, such as
dates of sowing and weeding, and other management practices may be at either level.
(iii) Measurements of the farmers' opinions. These are from informal discussions or from
questionnaires.
In on-farm trials, there is often still too great an emphasis on the first type of measurement,
because the implicit assumption is that the methods of analysis will be the same as on-station.
Whilst these data may still be of interest, we suggest that more attention be given to the
collection of measurement types (ii) and (iii). The main reason for devoting time to the
concomitant information is that we still need to try to understand the causes of as much of the
variability as possible. In on-station trials the plots may be smaller and are likely to be more
homogeneous. In on-farm trials there may be more variation within a farm than on-station and in
addition there is variation between farms. In on-station trials there is a consistent management
structure, whereas here there can be large differences in management practice between the farms.
As a general guide, what is not controlled should be measured, both at the plot level and at the
farm level, if it is of direct interest or if it might explain some of the variation in the data.
In general, the objectives of the trial determine what is to be measured. Thus the direct and
concomitant measurements to be taken are normally decided at the planning stage. Often too
much data is collected that is never analyzed. Our encouragement to measure potential
concomitant variables is not intended as support for the measurement of all possible data, just in
case they may be useful.
In some trials, where farmers have chosen where they will apply particular treatments, there may
be little reason for measuring yields. What is needed, instead, are the farmers' reasons for
choosing a particular plot and their reactions at the end of the season. In less extreme situations
there may still be little reason to devote much time to the detailed measurements of yield
components. A quick assessment of yields using "number of bundles", plus some idea of harvest
index, will often be sufficient.
A participatory trial is not really participatory, unless a record is kept of the important
contributions made by the farmers. These may be the actual farmers who use the land, or others
who view the fields. There are many ways of recording this type of data: please see the booklet
Guidelines for Planning Effective Surveys.
7. Analysis
As with the design, the analysis of the data will use a mixture of methods that are appropriate for
the analysis of experimental and survey data. The analysis can be viewed in three stages:
(i) Analysis of questionnaire-type data, resulting from interviews and other observations. This
information is normally at the farmer level, though some questions can relate to particular plots.
(ii) Analysis of yield type data. This information is mainly at the plot level, though with some
observations at the farm level.
Adaptive research workshop phase II by PELUM Page 52
(iii) Combination of (i) and (ii) above, using the results from interviews to understand the
variation in yield type data
The type of trial will dictate the proportion of time spent at each stage. One extreme might be a
farmer designed and managed trial, within which, the main objectives relate to their choices and
opinions. Most of the analysis effort would therefore be on (i) above. In some researcher-
designed and managed trials the yield data is of particular importance, in which case most of the
time is spent on (ii).
Experiments with sufficient within-site replication and detailed measurements of yield response
can have separate within-site analyses initially, then a combined analysis. This is usually only the
case for researcher-designed and managed trials. Others will use the data within a single analysis.
However there are two main differences between on-station and on-farm trials that have a
bearing on the analysis. One is that with on-farm trials we expect a farm by treatment interaction,
and one of the objectives of the trial is often to explore this interaction. The other difference is
that there is now variation at different levels - there is variation between farms because of
characteristics such as different agro climatic conditions, management practices, as well as
variation between plots within farms. As always, any analysis should try to explain as much of
the variation as possible.
Approaches used can range from some simple analyses on different subgroups of the data to
more sophisticated modeling of the whole data set. The analysis is often to evaluate relationships
between biophysical responses and environmental, management and social variables. The data
are also used to understand reasons for farmer assessments. These may be turned into decision
trees for farmers or maps of recommendation domains. In analyzing on-farm trials data we
should be ready to:
(i) Split the data up into subsets, e.g. groups of similar farms;
(ii) Omit particular plots, e.g. the farmer's own treatment; or particular farms;
(iii) Pay close attention to comments made about individual plots, e.g. "crop eaten by animals"
may mean that a recorded yield of zero should be treated as a missing value;
(iv) use additional information, both at the farmer level and at the plot level, e.g. farmers may be
classified as wealthy or poor, or plots may have information about pest damage;
(v) In the absence of within-farm replication, use treatment contrasts at the farm level to
investigate the farm by treatment interaction, or investigate the interaction using the additional
farmer information (as in (iv) above);
(vi) Report on, and possibly follow up on, particular farmers who show interesting results.
Data recorded on questionnaires, such as preference for varieties, can be summarized in two-way
(or n-way) tables of response by farm type. Percentages can be presented if the total number of
farmers is large enough. Provided there are sufficient data, models can also be fitted to these
tabulated data to explore how the responses vary across different farm types.