adding gas from biomass to the gas grid - hem | sgc · ©swedish gas center - july 2001 adding gas...
TRANSCRIPT
©Swedish Gas Center - July 2001
Adding gas from biomass to thegas grid
Report SGC 118
GASTEC NVMartin HagenErik Polman
Danish Gas Technology Center a/sJan K JensenAsger Myken
Swedish Gas CenterOwe JönssonAnders Dahl
Report SGC 118 ISSN 1102-7371 ISRN SGC-R-118-SE
FOREWORD
RD&D-projects performed by the Swedish Gas Center, are usuallypresented in reports, available to each and everyone who wants to share theresults of a project.
SGC prints and publishes the reports but the authors of each report areresponsible for the accuracy of the content. Everyone making use of anydescription, results etc, will do this on his own responsibility. Excerpts froma report may be used if the source is indicated
Swedish Gas Centre (SGC) is a joint venture of energy gas businessorganisations. SGC’s primary mission is to co-ordinate the joint Research,Development and Demonstration (RD&D) efforts that are performed withinthe Swedish gas industry. The shareholders of SGC are: The Swedish GasAssociation, Sydgas AB, Sydkraft AB, Gothenburg Energy, Lund Energyand Helsingborg Energy.
This project has been funded by:
The European CommissionThe Swedish National Energy AdministrationGastec N.V., HollandDanish Gas Technology Center, DenmarkNSR, SwedenSydgasVattenfall Naturgas ABGöteborg Energi ABBirka Energi ABÖresundskraft ABRVF - The Swedish Association of Waste ManagementLunds Energi ABSYSAV AB
SWEDISH GAS CENTRE
Johan RietzPresident

page: 2
CONTENTS
Page
1 INTRODUCTION 3
2 IMPORTANCE OF ADDING GAS FROM BIOMASS TO THE GAS GRID 42.1 Biomass for energy 42.2 Utilisation of energy from biomass 72.3 Economical aspects 13
3 PRODUCING GAS FROM BIOMASS 153.1 Biogas from anaerobic digestion 153.2 Syngas from biomass pyrolysis and gasification 20
4 PIPELINE QUALITY GAS FROM BIOGAS 264.1 Introduction 264.2 Cleaning 274.3 Upgrading 334.4 Addition of propane 464.5 Adaption to non natural gas grids 474.6 Odorisation 48
5 PIPELINE QUALITY GAS FROM SYNGAS 495.1 Process layout 495.2 Cleaning 515.3 Conversion and upgrading 525.4 Process integration 54
6 SUPPLYING GAS FROM BIOMASS TO THE GAS GRID 566.1 Gas quality aspects 566.2 Legislation 606.3 Control and measurement 716.4 Prospects 76
7 INTERNATIONAL PERSPECTIVE 797.1 Availability of biomass 797.2 Examples of pipeline quality gas from biomass by country 917.3 Policy 95
8 CONCLUSIONS AND RECOMMENDATIONS 116
9 REFERENCES 117
Appendix 1: Abbreviations, terminology and units 122
Appendix 2: Thermal gas production processes 123

page: 3
1 INTRODUCTION
Nowadays there are only a few biomass gasification plants operative worldwide delivering gas to
the grid. One of the main reasons for this is that gas from biomass is hardly competitive with natural
gas or other sources of energy. Useful application of the produced heat is in most cases restricted
to local utilisation, since large distance transport of heat is economically unattractive.
A way to improve the economics is to use biogas via the gas grid at locations where all biogas can
be used efficiently at any time. This use may involve for example the conversion to heat or
electricity, or use as a vehicle fuel. One way to accomplish this is adding the biogas to the natural
gas grid. The other way is to utilise a dedicated gas distribution grid with end-user applications fit for
the local gas quality.
The aim of this project carried out in the framework of the Altener programme is to provide an
overview of technologies for cleaning and upgrading of biogas for remote use. A further aim is to
determine to what extent gases produced from biomass (digestion or gasification) can be added to
the gas grid and what additional safety regulations are necessary. Finally, existing European
standards and national legislation have been studied in order to determine the possibility of
conflicting and/or missing regulations with the intended approach. The information collected in this
project can be used to select promising technologies and may serve as background information for
developing harmonised standards.
This report describes the various production and cleaning techniques and the present requirements
for the use of biogas.
The technology for adding gas from biomass to the gas grid on a larger scale can contribute to a
higher share of biomass in the energy supply and will also allow a highly efficient use of the energy
contained in the biomass. Moderate tax incentives will make the use of gas from biomass
economically attractive for large groups of end-users.
This project was financed by:• European Commision in the Alterner program and in:• the Netherlands by: EnergieNed and NOVEM,• Denmark by: DONG, Hoverstadsregion Naturgas I/S, Naturgas Sjælland I/S, Naturgas Fyn I/S,
Naturgas Midt-Nord I/S, Københavns Energi, The Danisch Energy Agency and• Sweden by: funds provided by the Swedish natural gas distribution companies and the Swedish
Energy Authority.Erik Polman (Gastec) provided the project management. The production of the final report wasprovided by Marijke Jansen en Rosalien Kiestra.
page: 4
2 IMPORTANCE OF ADDING GAS FROM BIOMASS TO THE GAS GRID
2.1 BIOMASS FOR ENERGY
Biomass is one of the most important sources of renewable energy. The European Commission
depicts in its 1997 White Paper ‘Energy for the Future: renewable sources of energy’ [lit.1] a
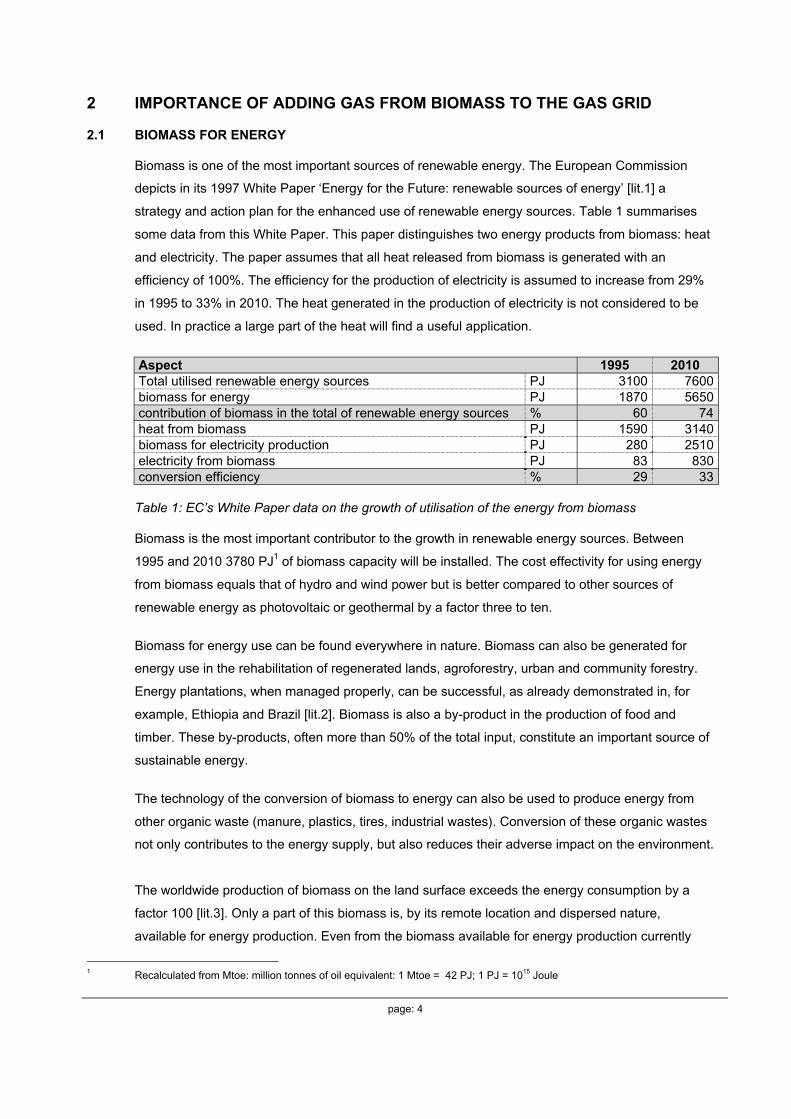
strategy and action plan for the enhanced use of renewable energy sources. Table 1 summarises
some data from this White Paper. This paper distinguishes two energy products from biomass: heat
and electricity. The paper assumes that all heat released from biomass is generated with an
efficiency of 100%. The efficiency for the production of electricity is assumed to increase from 29%
in 1995 to 33% in 2010. The heat generated in the production of electricity is not considered to be
used. In practice a large part of the heat will find a useful application.
Aspect 1995 2010Total utilised renewable energy sources PJ 3100 7600biomass for energy PJ 1870 5650contribution of biomass in the total of renewable energy sources % 60 74heat from biomass PJ 1590 3140biomass for electricity production PJ 280 2510electricity from biomass PJ 83 830conversion efficiency % 29 33
Table 1: EC’s White Paper data on the growth of utilisation of the energy from biomass
Biomass is the most important contributor to the growth in renewable energy sources. Between
1995 and 2010 3780 PJ1 of biomass capacity will be installed. The cost effectivity for using energy
from biomass equals that of hydro and wind power but is better compared to other sources of
renewable energy as photovoltaic or geothermal by a factor three to ten.
Biomass for energy use can be found everywhere in nature. Biomass can also be generated for
energy use in the rehabilitation of regenerated lands, agroforestry, urban and community forestry.
Energy plantations, when managed properly, can be successful, as already demonstrated in, for
example, Ethiopia and Brazil [lit.2]. Biomass is also a by-product in the production of food and
timber. These by-products, often more than 50% of the total input, constitute an important source of
sustainable energy.
The technology of the conversion of biomass to energy can also be used to produce energy from
other organic waste (manure, plastics, tires, industrial wastes). Conversion of these organic wastes
not only contributes to the energy supply, but also reduces their adverse impact on the environment.
The worldwide production of biomass on the land surface exceeds the energy consumption by a
factor 100 [lit.3]. Only a part of this biomass is, by its remote location and dispersed nature,
available for energy production. Even from the biomass available for energy production currently
1 Recalculated from Mtoe: million tonnes of oil equivalent: 1 Mtoe = 42 PJ; 1 PJ = 1015 Joule

page: 5
only a small part is utilised. In case of utilisation the efficiency, in which the energy in the biomass is
converted to useful energy, is below a readily achievable level. Notwithstanding this sub-optimal
utilisation, biomass already in 1990 contributed to 13% of all primary energy [lit.4]. It is estimated
that in 2050 nearly 40% of the direct fuel use and 17% of the power production will be provided from
biomass.
Fuel gas from biogas
The concept of the production of distribution quality gas from biomass is not incorporated in the
White Paper on renewable energy. This concept however can substantially improve the utilisation of
energy from biomass. In this concept biomass is converted to a gas fit for supplication to a gas grid,
the pipeline quality gas.
Addition to the local low-pressure gas grid allows a highly efficient application of the energy in
biomass. On the expense of compression and upgrading to transport grid pressure and quality
biogas can be fed to the pan-European gas grid allowing a virtually unrestricted production of
energy from biomass.
This means that pipeline quality gas from biomass allows:
Accommodation of virtually any production at any time at any place near the gas grid
As long as a connection with a sufficient capacity to the natural gas grid exists, all pipeline quality
gas can be accommodated. If the production is too high for the actual local use, the gas is
transported to users further away.
Highly efficient application
Existing installed natural gas appliances will use the biogas. This means that the already existing
standards for the efficient use of natural gas hold for all biogas added to the grid.
Security of supply for users of biomass
If the production is too low, local users will be supplied with natural gas from the grid. This allows for
optimal dimensioning and load for the conversion plant. Interruptions in the production, e.g. for
maintenance or by a temporary lack of biomass, do not effect the users.
Utilisation of biomass for heating, power production, combined heat and power production, cooling
and refrigeration and as a transport fuel
Natural gas has a wide, and still growing, range of highly energy efficient applications. Therefore all
produced biogas will find an application with high energy efficiency. Not only for highly efficient
heating (utilising condensing appliances), but also for the combined heat and power production or
as a clean and efficient transport fuel.

page: 6
Incentives by eco-labeling
By adding gas from biomass to the natural gas grid the consumption of natural gas is for that
amount replaced with the carbon dioxide neutral gas from biomass. This means that this gas from
biomass can be sold as ‘green’ electricity on the ‘green’ market. Just like ‘green’ electricity the
biogas production and utilisation are only virtually connected.
Peak shaving
A connection of a biogas plant with the natural gas grid will provide a possibility for peak shaving by
using the natural gas grid as a storage facility. The flaring of gas can be avoided during low demand
periods and 100% of the biogas can be used.
High value applications
By injecting biogas into the natural gas grid, the gas can be transferred to a location where it has a
higher value than it has at the production plant. Biogas is currently often used in ‘low tech’
applications. By injection into the natural gas grid, the gas can be sold as vehicle fuel for a higher
price at locations that are more easily accessible for customers, e.g. NGV filling stations in urban
areas. Pipeline quality gas from biomass has a market value equal to natural gas. In some countries
it may be free from eco-tax. This relief from eco-tax can be essential to provide a sufficient
profitability margin to make upgrading of the biogas economically viable.
Compared to the current practice for the production of energy from biomass the main assets for
adding gas from biomass to the grid are:
• higher energy efficiency
• low investment costs
• nearly unlimited distribution and transport facilities
• daily and seasonal buffering already provided in the actual gas grid
• unconditioned utilisation as a transport fuel
• unconditioned utilisation in distributed power production
The main reason for connecting biogas plants to the natural gas network is to make gas from
biomass available where it can be sold for a higher price than if it is used locally. The environmental
aspect must also be considered if gas from biomass, instead of being combusted in a local boiler, is
used as a transportation fuel, in for example cars, city buses or trucks.
An interconnection can also provide the producer of pipeline quality gas with possibilities of
expanding his market without the need for investment in an expansion of a local distribution grid. A
major problem in this respect is that increased production or purification capacity in a biogas
production plant often requires large investments and these investments cannot be made before the

page: 7
market for the gas is established. By connecting the biogas plant to the natural gas grid, market
development may be done without increasing the own production capacity (using gas from the grid)
and investments may be postponed until the market for gas is established.
2.2 UTILISATION OF ENERGY FROM BIOMASS
There are different routes to utilise energy from biomass. These routes can be categorised by the
secondary products involved. These secondary products are:
• heat : produced by combustion
• biogas : produced by anaerobic digestion
• syngas : produced by thermal processes (gasification and/or pyrolysis)
The heat from combustion can be used for:
• heating (residential, commercial and industrial)
• power production
• combined heat and power production
The biogas from anaerobic digestion can be used for:
• production of pipeline quality gas
• power production
• combined heat and power production
The syngas from thermal processes can be used for:
• production of pipeline quality gas
• power production
• combined heat and power production
• production of chemicals (e.g. methanol or hydrogen)
Combustion
The most widespread application of biomass is combustion for heating. The combustion of biomass
is in many rural locations the main source of heat. Only 5 to 15% of the energy in the biomass is
converted to useful heat [lit.3]. The remaining 85 - 95% is spilled to the environment.
Some biomass is fed to a boiler that provides steam to drive turbines for power production.
About 10 - 20% of the energy is converted to power.
Co-firing is a more efficient way to utilise biomass (and wastes) for energy. In this process biomass
page: 8
is mixed with coal in a combustor providing heat to a generator. Typical efficiency for the production
of power ranges from 25 - 42% [lit.5].
Large amounts of municipal and industrial waste are combusted in special installations in order to
reduce the amount of waste. Addition of biomass, either to improve the combustion properties of the
waste, or to achieve a kind of co-firing, is common practice. The efficiency of the biomass herein to
electricity conversion has efficiency between 23 and 30% [lit.6]. In some cases a part of the waste
heat is used for district heating.
Anaerobic digestion
Anaerobic digestion is the common denominator for a wide range of microbiological processes
where biomass is converted to biogas. These processes are described in chapter 3 of this report
and involve biogas production from manure, landfills, sewage plants, industrial waste streams and
solid organic wastes.
In some applications the biogas is converted to heat. This is mainly done for landfill gases where
abundant, low cost, biogas is used to provide heat in local industrial applications.
A long existing application is the anaerobic digestion of manure, followed by the generation of
electricity. This application provides heat and electricity in millions of Chinese and Indian houses
and communities [lit.3].
Also in the Western societies biogas is converted by a generator to produce electricity. This
conversion has, due to its small scale, a modest efficiency between 20 - 35%. In some cases that
waste heat from the generator finds a useful application. In Denmark most biogas is used for
cogeneration, reaching a total heat and power efficiency between 80 and 90%.
Grid applications
Biogas can be the feedstock to produce pipeline quality gas. After cleaning the biogas can be
distributed in a medium calorific gas grid. After cleaning and treatment the biogas can be fed to a
natural gas grid.
Transport applications
All pipeline quality gases from biomass can be used as a transport fuel. Successful examples exist
for cleaned biogases as well for the biogases converted to a pipeline quality gas.
Thermal gasification
Thermal gasification is the common denominator for all processes that thermally convert organic
materials into a gas. The most widespread application is the gasification of coal. The gasification of
heavy residuals of oil refineries is becoming more and more important. Also thermal processes can
readily gasify biomass. In all these processes biomass is mixed with water, air (or oxygen) and put

page: 9
to a reactor at an elevated temperature. The resulting gas contains, after cleaning, a mixture of
carbon monoxide, hydrogen and some methane. When air is used as gasifying agent the product
gas contains nitrogen.
Some advanced processes will also use hydrogen as a gasifying agent for biomass. This report
uses the term ‘syngas’ for all product gases obtained by thermal gasification.
Experience learns that the thermal conversion of organic materials to biomass is very efficient. A
study in Finland mentions an efficiency range between 85 - 90%, even for rather small-scale
installations [lit.4]. A recent report by the IGU mentions an efficiency of over 95% for large-scale
modern gasification systems [lit.7].
Conversion of syngas to electricity
Syngas can be burned to produce steam, driving a steam turbine for the production of electricity. In
this case the overall efficiency from biomass to electricity is about 30%.
Modern ‘Integrated Gasification Combine Cycle’ (IGCC) installations combine the merits of
gasification with the combined cycle electricity production. The syngas is used in a top cycle using a
gas turbine using the remaining heat to power a steam turbine. Natural gas driven combined cycles
reach efficiencies of 60%. The overall efficiency from biomass to electricity with IGCC is currently
about 45%, having 50% as a reachable target within the next decade. IGCC is a valuable concept,
reaching however its best performance at some larger scale (at least 20 - 100 MWe).
Conversion of syngas to synthetic natural gas
As its name already reveals, syngas is a basis for the synthesis of other products. There is a wide
range of experience of producing methanol and car fuels from syngas. The conversion of syngas
from coal or oil residues to methane makes it possible to produce a pipeline quality gas. This
process has been subject of many experiments and studies. Due to the low price of natural gas
itself, large-scale implementation in practice is suspended until the low cost natural gas sources are
depleted.
Also syngas from biomass can be processed to give pipeline quality gas. Currently this process
route is not demonstrated. Competing, proven technologies for using biomass are currently more
attractive. In later chapters this report will describe this process route and its merits in more detail.
Efficiency considerations
All efficiency considerations start at the availability of biomass and end with the utilisation by the
final user. The total efficiency is given in the ratio energy flow of the biomass input and the delivered
useful energy flow. Cases to be distinguished are the production of heat, the production of power,
the combined production of heat and power (cogeneration) and the production of vehicle fuel.

page: 10
Comparing efficiency data is a difficult task. The availability of data is poor and often these data lack
in a clear definition of the system border. The most important efficiency is the total efficiency of the
whole chain between the input of renewable primary energy and the end-use by the consumer. Any
dissipation of energy to the environment reduces the energy efficiency. By narrowing the system
borders essential parts of the chain are omitted and too high or low efficiency data are reported.
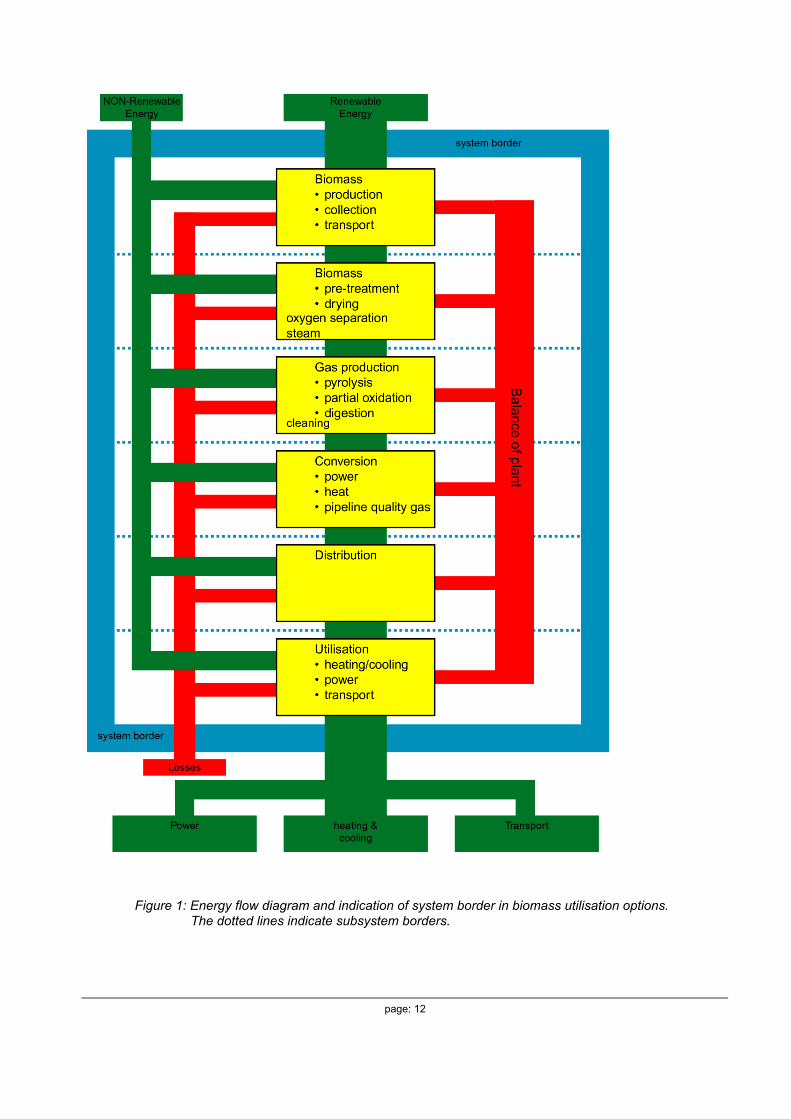
Figure 1 gives a survey of the process from the input of solar radiation to the end-use of energy.
This process follows the flow of materials and also the flow of energy. An important aspect is the
‘balance of plant’ indicating the exchange of energy (and often also mass) between partial
processes. The ‘balance of plant’ is an important tool to improve the total process efficiency. The
integrated gasification combined cycle (IGCC) biomass power plant is an example with an
elaborated balance of plant approach. This figure indicates also the partial processes: biomass
production, biomass treatment, production of gas, conversion, distribution and finally the end-use.
For each step a partial efficiency can be defined, in which care should be taken for the effects of the
balance of plant the input of energy from outside and losses to the environment. Often used
efficiency definitions are: total efficiency, gasification efficiency, efficiency heat production, efficiency
power production and distribution efficiency. The efficiency is always given by the ratio of total
useful energy output divided by the total energy input, expressed as a percentage. The total
efficiency of the process is built from partial efficiencies in the chain from input to product.
Subsystem: biomass production, collection and transport
Radiation energy from the sun is collected and stored in biomass. All human activity later in the
chain introduces losses. The addition of fertilisers, energy use in the collection and transport of
biomass can do this. The balance of plant may be improved by using the ash from the gasification
process as fertiliser and by the use of bio fuel in the collection and transport apparatus.
A practical limit is the diameter of the collection area. A 30 - 50 km diameter area seems to be the
maximum.
When organic waste, either liquid or solid, is used as the source of energy this subsystem is of no,
or minor, importance.
Subsystem: biomass pre-treatment
Some biomass conversion processes require some energy using facilities before the biomass can
be used. The facilities often include drying and grinding facilities. The energy needed by these
facilities should be accounted for in the amount of primary energy.
In the balance of plant the heat from the conversion subsystem can be used for drying.
Subsystem: gas production
page: 11
In the gas production process the input and output is to be compared. Care should be taken for the
addition of energy to maintain the gasification. The cleaning of the gas also requires energy and is
often included in the gas production subsystem. The potential for the balance of plant depends on
the gas production process. Some gasification processes produce heat, others use heat.
Subsystem: upgrading and conversion
This subsystem can include completely different technologies, including boilers, generators and gas
conversion units. Also here input and output are to be compared. Some conversion processes
produce waste heat, which can be used in the balance of plant. The production of heat should be
considered as lost energy unless useful application within or outside the process is found.
Subsystem: distribution
Energy is not utilised at the location. Care should be taken for the often considerable losses in
distribution networks. The distribution of gas requires compression, electricity has ohmic losses and
heat transport suffers considerable heat losses. Due to relatively high losses, heat can only be
efficiently distributed over short distances. Electricity and gas can be distributed over larger
distances with small losses of energy. On short distances all energy carriers are acceptable, on
medium distances electricity and gas perform well and at the long distance gas is the only efficient
and affordable mean of energy distribution. Long distance transport of gas requires compression to
high pressure or liquefaction.
Subsystem: utilisation
The utilisation of energy is an important item in selection of the preferred energy carrier. Electricity
is perfect since it can perform all user functions as the provision of power, heating and cooling
efficiently. Transport by electrical vehicles is possible but suffers to capacity limitations. The only
drawback is the lack of buffering potential. Electricity is to be used when produced. Gas is second
best. Utilisation for all purposes is possible with high efficiency, but the utilisation equipment is often
more complex than the electrical counter part. Storage of gas is very well possible, enabling full
utilisation of all energy produced from biomass. Heat is a restricted energy carrier. It can be used for
heating and with a low efficiency also for cooling. Conversion of low-grade heat to electricity has a
very low efficiency. Storage of heat for a couple of days is feasible, but heat produced in summer
will be nearly without use.
page: 12
Figure 1: Energy flow diagram and indication of system border in biomass utilisation options.The dotted lines indicate subsystem borders.
page: 13
Improving the energy efficiency in the utilisation of biomass in the fuel supply is a major asset to
enlarge the contribution of biomass to the world sustainable energy supply. The efficiency data are
rather scarce in literature but remarkably consistent. The gasification subsystem efficiency is up to
95%. This efficiency is independent of the used feedstock or technology. The efficiency of the
conversion subsystem for the power production is about 30% using single cycle generators, or
about 55% using combined cycle equipment.
The efficiency of the conversion of gas from biomass to heat, or the conversion to heat and power is
about 80 - 90%.
2.3 ECONOMICAL ASPECTS
Potential economic profit is one of the most important drives and critical success factors to realise
the addition of gases from biomass to a gas grid. The most relevant perspective is that of the
(potential) producer. At that position the economical reality demonstrates the impacts on the profits.
The main items are:
• cost biomass or organic waste (availability, quality, competing applications)
• investment costs
• operation and maintenance costs
• product revenues
Cost biomass and/or organic waste
Biomass for energy is by nature a scarce product. Cost of collection and transport limit the source
area by a distance of 30 - 50 km to the conversion plant. Within this area existing or new competing
users can readily result in rising biomass costs. Important competitors are for example the agro
industry, the production of building materials, and the producers of electricity. Organic wastes are
reduced at the source or recycled in higher value applications. Experience learns that prices for the
biomass (or organic wastes) sharply rise when the plant operation starts.
Investment costs
Biomass conversion plant hardware investments are rather well-known. A full-scale commercial
IGCC plant will typically cost 1000 €/kWe [lit.7]. Full-scale biogas treatment plants will cost typically
500 €/kWg. The estimated cost for a biomass to pipeline quality gas plant will be 1200 €/kWg.
Currently many governments give substantial subsidies for new biomass plants, often going up to
50% of the investment costs.
Operation and maintenance costs
Operation and production costs are rather well predictable. From the IGU study [lit.7]. It can be
derived that these yearly costs will be about 15% of the unsubsidised investment costs.
Product revenues
page: 14
The product revenues are the most uncertain factor in the economic evaluation process. The lower
limit is given by the prices for electricity from heavily subsidised coal and nuclear power stations
(currently about 1 c€/kWh). The upper limit is given by the prices for green electricity (currently
about 10 c€/kWh). Prices for natural gas are at this moment more stable. On further implementation
of the liberalised market also the prices of gases for the grid will show larger fluctuations.
The producer cannot influence the product revenue and the feedstock cost, important factors for the
economic viability of a plant. These uncertainties make it very troublesome to start a commercial
plant for the production of gas from biomass for the gas grid.
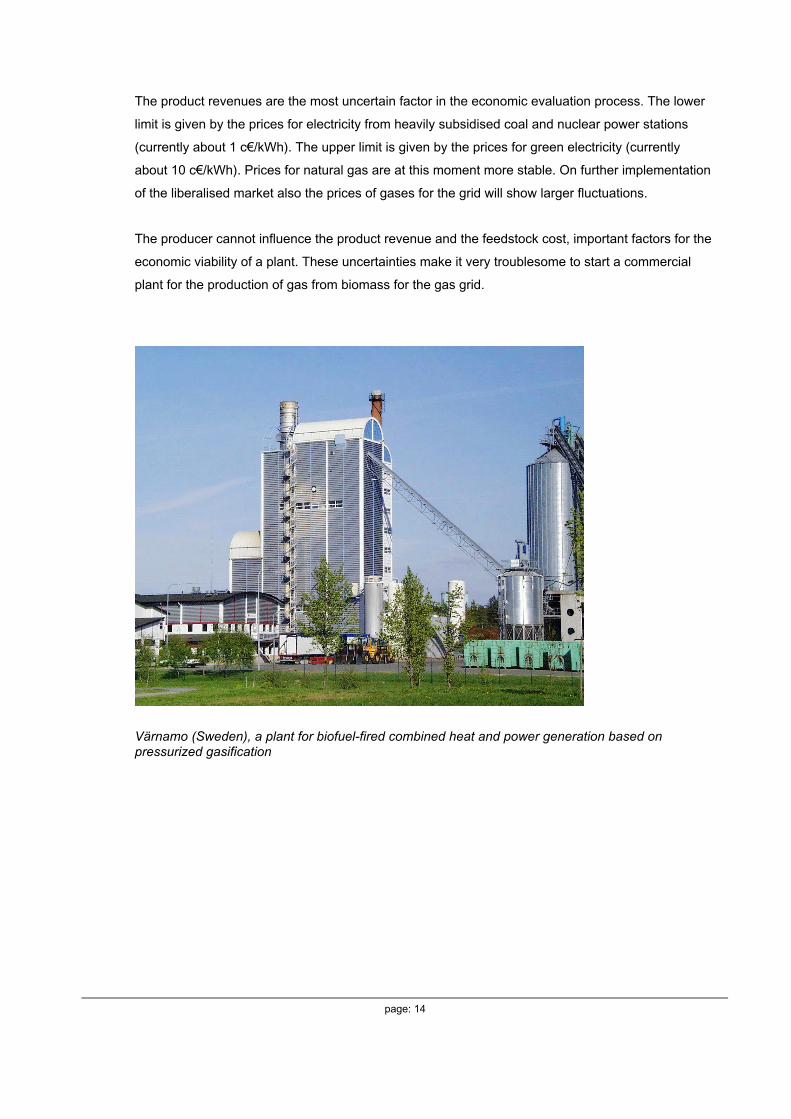
Värnamo (Sweden), a plant for biofuel-fired combined heat and power generation based onpressurized gasification

page: 15
3 PRODUCING GAS FROM BIOMASS
3.1 BIOGAS FROM ANAEROBIC DIGESTION
3.1.1 Anaerobic digestion of biomass and organic waste
In the anaerobic conversion of biomass and waste, organic materials are microbiologically
converted to methane, carbon dioxide and water. This process occurs in nature on all places where
air is excluded from the organic materials. The exclusion can be caused by submersion in water.
The methane rich swamp gases are produced by anaerobic digestion. Depletion of oxygen is
another trigger for the anaerobic digestion. The production of methane from landfill starts as soon
as all environmental oxygen is used by the aerobic conversion of the organic content. In the
anaerobic conversion the sulphurous components are converted to hydrogen sulphide and the
nitrogenous components are converted to ammonia. Also some traces of hydrogen cyanide can be
produced. The rate of the anaerobic digestion is determined by the composition of the reaction
mixture and the temperature. The rate of reaction increases with higher temperatures. This increase
of the reaction rate is limited by the stability of the microbiological agents in this process.
Temperatures to about 55 °C are however feasible.
Examples of anaerobic conversion processes for the production of biogas are:
• sewage treatment plants: Sewage treatment plants produce methane rich gases. Utilisation of
methane from sewage plants is used on a large scale in many countries. Optimised process
conditions can enhance the production and collection of these gases.
• landfills: All landfills produce methane rich gases. Collection and utilisation of the gases is quite
well possible. Improved collection, processing and utilisation of landfill gases will be an
important tool to increase the importance of landfill gas.
• cleaning of organic industrial waste streams: Anaerobic digestion processes are often
successfully applied to clean the waste streams of agricultural processing industry. The
methane rich gases are mainly utilised to produce electricity.
• mesofil and thermophil digestion of organic waste: Compact installations convert at higher
temperatures municipal organic waste to methane rich gases.
Biogas plants utilising anaerobic digestion make a valuable contribution to the solution of a range of
problems concerning agricultural, environmental and energy interests. It is therefore relevant to
regard biogas technology as a promising element in the chain of organic waste recycling.
The biogas concept offers a total appropriate system for treatment, sanitation, redistribution and
nutrient utilisation from livestock slurry and organic waste [lit.8].

page: 16
3.1.2 Survey of technologies
This paragraph gives details on centralised biogas plants, farm biogas plants, sewage plants and
landfills.
Centralised biogas plants
Denmark has a large experience with centralised biogas plants. The major biomass resource for
anaerobic digestion in Denmark is animal manure. Approximately 75% of the biomass treated in
Danish plants is manure, and around 25% of the biomass is waste that mainly originates from the
food industries. A few plants treat sewage sludge as a supplement to animal manure. A few plants
are capable of treating source separated household waste.
Animal manure, mostly slurry, is transported from farms to the biogas plant in vehicles owned by the
biogas plant. The normal situation is that food processing industries and municipalities take care of
the transportation of waste to the biogas plant.
In the biogas plant manure and organic waste are mixed and digested in anaerobic tanks for 12 to
25 days. During this period effective sanitation takes place and weeds and pathogens are killed on
a satisfactory scale.
From the digestion process biogas emerges which is cleaned and normally utilised in combined
heat and power production plants. Heat is usually distributed in district heating systems, and
electricity sold to the power grid.
The biomass leaving the digestion tanks is called digested manure. It is returned by vehicle to slurry
storage tanks, until it is end-used as fertiliser.
The biogas plant technology is simple, but many practical details have to be considered in order to
avoid interruptions and optimise production. Manure and organic waste are mixed in mixing tanks
and from here pumped into the closed and stirred reactor tanks were it is heated and anaerobically
digested. The digestion culture is self-sustaining after a start-up phase. The process is continuous,
as a daily fractional extraction is replaced by new feed. The reactor productivity is significantly
improved by the addition of organic waste.
The average residence time is between 12 and 25 days depending on temperature, shortest at high
temperature. Thermofil digestion takes place at 50 - 55 °C and mesofil at 30 - 40 °C.
In order to increase production stability and capacity and to minimise power consumption, the
following technical details have been studied and further developed based on practical experience:
• Preference of thermofil digestion depending on manure composition
• Addition of organic waste
• Buffer tanks for extracted slurry contributing to gas production
• Mixing and stirring equipment
• Pump design
• Heat exchangers between incoming and extracted slurry

page: 17
• Removal of sand from mixing tanks and reactors
• Abatement of smell from the plants
• Cleaning of gas for hydrogen sulphide, ammonia and particulate.
Farm biogas plants
The biogas production on farms uses basically the same processes as centralised plants and
normally the farm also establishes a CHP facility. Heat is usually distributed to the farm itself and to
nearby users. Electricity is sold to the power grid.
The size and the set-up vary. The reactors include horizontal and vertical steel tanks as well as
concrete basins. The mixing devices range from stirrer and propeller to pump.
Some plants have a gas storage facility to be able to take advantage of power peak hours. The
storage may be established as a gasbag covering the reactor or as a gasbag in a separate building.
Like the centralised plants, the smaller farm plants have found it attractive to mix manure and
organic waste to stabilise and increase productivity. However, the requirement of heat treatment of
waste at 70 °C for one hour in some countries seems to be a blockage.
Sewage plants
The biogas technology has its origin in sewage plants where digestion of biomass is used to reduce
the amount of dry content as opposed to oxygenation. The energy production through biogas was
secondary to these plants. Today the biogas energy production attracts attention as opposed to the
energy consumption required for oxygenation.
It is noted that half of the potential biogas energy available in sewage plants is used for
de-nitrification. Environmentally and economically it is therefore preferable to treat the sewage slurry
in centralised biogas plants where the de-nitrification is avoided and the nitrogen recycled. This
solution is not applicable however, when the content of environmental foreign elements is high.
Landfill
Landfill gas is produced biologically from organic material in waste deposits. The gas production
peaks at about 20 years after closure and continues for more than 50 years.
The gas is extracted by vertical or horizontal perforated tubes and filtered. The blower or
compressor used also establishes the supply pressure.
The extraction of the gas is seen not only as a source of energy, but also as a precaution against
green house gas emission to the atmosphere. An additional advantage is also the reduction, often
even elimination, of odour emissions. The occurrence of fires and explosions caused by involuntary
methane emissions is reduced to zero.
page: 18
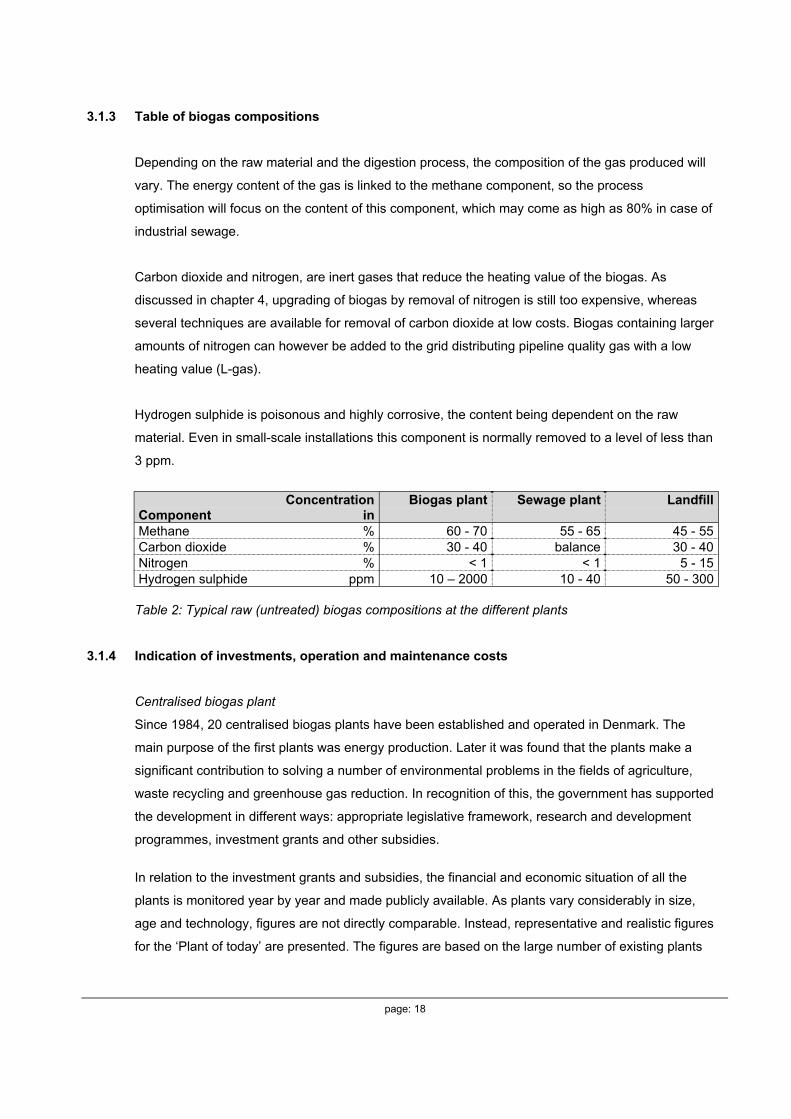
3.1.3 Table of biogas compositions
Depending on the raw material and the digestion process, the composition of the gas produced will
vary. The energy content of the gas is linked to the methane component, so the process
optimisation will focus on the content of this component, which may come as high as 80% in case of
industrial sewage.
Carbon dioxide and nitrogen, are inert gases that reduce the heating value of the biogas. As
discussed in chapter 4, upgrading of biogas by removal of nitrogen is still too expensive, whereas
several techniques are available for removal of carbon dioxide at low costs. Biogas containing larger
amounts of nitrogen can however be added to the grid distributing pipeline quality gas with a low
heating value (L-gas).
Hydrogen sulphide is poisonous and highly corrosive, the content being dependent on the raw
material. Even in small-scale installations this component is normally removed to a level of less than
3 ppm.
ComponentConcentration
inBiogas plant Sewage plant Landfill
Methane % 60 - 70 55 - 65 45 - 55Carbon dioxide % 30 - 40 balance 30 - 40Nitrogen % < 1 < 1 5 - 15Hydrogen sulphide ppm 10 – 2000 10 - 40 50 - 300
Table 2: Typical raw (untreated) biogas compositions at the different plants
3.1.4 Indication of investments, operation and maintenance costs
Centralised biogas plant
Since 1984, 20 centralised biogas plants have been established and operated in Denmark. The
main purpose of the first plants was energy production. Later it was found that the plants make a
significant contribution to solving a number of environmental problems in the fields of agriculture,
waste recycling and greenhouse gas reduction. In recognition of this, the government has supported
the development in different ways: appropriate legislative framework, research and development
programmes, investment grants and other subsidies.
In relation to the investment grants and subsidies, the financial and economic situation of all the
plants is monitored year by year and made publicly available. As plants vary considerably in size,
age and technology, figures are not directly comparable. Instead, representative and realistic figures
for the ‘Plant of today’ are presented. The figures are based on the large number of existing plants

page: 19
with correction for late developments. The capacity of the plant is chosen to be optimal in relation to
the size of Danish farms and their distribution.
Aspect Unit ValueTreatment capacity
• 80% Manure• 20% Organic waste
M3/dayM3/yearM3/dayM3/day
300109,500
240 60
Biogas production at 65% methaneat 34 m3 biogas/m3 biomass
M3/day 10,200
InvestmentsPlant investment M€ 4.0Vehicles investment €M 0.5Total costs*Treatment costs M€/year
€/m3 biomass0.55
6.0Transport costs M€/year
€/m3 biomass0.22 2.3
Price of gasBiogas C€/m3 biogas*
At 65% methane24
Table 3: Characteristics ‘Centralised Plant of today’
*) Assumptions made:
Interest rate 5% per year
Depreciation of investments:
Buildings 20 years
Tanks/mechanical equipment 15 -
Vehicles chassis 7 -
Vehicle tanks 15 -
The price, 24 c€/m3 biogas (65% methane) is not discussed in this paragraph, but it is stressed that
no other potential sources of income have been anticipated in the price calculation.
Farm biogas plants
No consistent figures are available, but the following range of investments has been found. The
farmer often performs the maintenance.

page: 20
Aspect Unit ValueManure M3/day 6Biogas production, 60% methane at17m3 biogas/m3 biomass
M3/day 100
InvestmentsPlant investment incl. powergeneration
K€ 100 - 300
Price of gas C€/m3
biogasn.a.
Table 4: ‘Farm Plant’ characteristics
Biogas from farms is always used locally for heat and power production, no examples are known
where it has been upgraded and added to the gas grid.
Sewage plants
No consistent figures are available.
Landfill
No consistent figures are available. The high content of nitrogen makes the gas unsuitable for
upgrading and injection into a high calorific natural gas grid.
3.2 SYNGAS FROM BIOMASS PYROLYSIS AND GASIFICATION
3.2.1 General aspects of thermal biomass gasification
Gasification technology for syngas production from biomass
The technology for the thermal gasification of biomass is mainly derived from the gasification of
coal. There is a tremendous worldwide experience basis in the gasification of coal. The coal
gasification is a mature technology able to fulfil any rational commercial requirements. This
experience started already in the 1850’s when the first coal gas pipelines came on stream. Current
coal gasification technology has three branches to be distinguished by their reactor characteristics.
These three branches are fixed bed, fluidised bed and entrained flow gasifiers.
In the fixed bed the biomass is embedded in a flow of the reactant. During the gasification the
remaining ashes are removed and new biomass is added. This causes some movement in the
biomass. In some gasifiers rotating the gasifier enhances this movement by some rotating
movement in the reacting chamber. This movement is to remove the ashes and to enhance the
interaction of the reactant gases with the biomass.
Essentially this reactor shows plug flow and has an essentially high conversion efficiency.

page: 21
In fluidised bed reactors the reactant gases are blown from the bottom through the biomass with
such a speed that the biomass obtains a liquid like fluid state. Fluidised bed reactors behave like
continuously stirred reactors and show essentially only a partial conversion.
In entrained bed gasifiers pulverised coal and reactant gases are flowing at high speed in the same
direction. The reactions proceed in a flame-like zone, leaving the syngas and ashes at the end of
the reaction zone. Essentially this is a plug flow reactor resulting in a completed conversion. Since
its very difficult to pulverise biomass this kind of reactors is not applied in biomass gasification.
The nature of the reactant gases further differentiates the gasification processes. Besides air the
reactant gases can be oxygen, water and hydrogen. Air is available at the lowest cost but the
resulting gas will always contain a large amount of nitrogen.
• The use of oxygen will result in a richer product gas and allows the use of a more compact
gasifiers and syngas treatment system. This has to be weighed against the expensive and
energy consuming oxygen from the air separation plant.
• Adding water will result in additional hydrolysis processes. Water is available at low cost. The
resulting hydrolysis improves the quality of the product gases.
• Also the addition of hydrogen will result in a better product gas, but is only feasible in the scarce
situation that hydrogen is available at low cost and not usable in other, more profitable,
applications.
Further differentiation is the process conditions given by the temperature and the pressure in the
reactor. Higher pressure and temperatures will result in more compact reactors. Higher pressures
(typically 30 - 50 bar) will also result in a larger fraction of methane and some other hydrocarbons in
the syngas. Higher temperatures (typically 1200 - 1600 °C) will result in higher hydrogen and carbon
monoxide fractions in the syngas. In the comparatively small biomass gasification plants rising
pressure and temperature increases also the cost of the reactor and auxiliary equipment for
introduction of the biomass and compression of the reactants.
Dedicated designed biomass plants use atmospheric or moderate (3 - 5 bar) pressure. Also
moderate gasification temperatures (400 - 800 °C) prevail.
Technologies for syngas cleaning
The syngases for biomass and coal have nearly the same properties. Generally the syngas from
biomass contains less contaminants like metals, ashes, tars and sulphurous components. Therefore
the mature technology for cleaning of syngas from coal can apply to syngas from biomass. Due to
the disperse location of biomass sources the capacity of most biomass plants will be much smaller
than the current giant coal gasification facilities.
page: 22
Technologies for syngas upgrading
The gas generated from coal has different applications. They include distribution to consumers, the
generation of power, the conversion to pipeline quality gas and the conversion to a nearly infinite
range of chemical products. All these mature processes are available for the upgrading of syngas
from biomass.
Pyrolysis
Pyrolysis is the degradation of organic materials at high temperature in absence of other reactants
like oxygen or water. Unlike coal, biomass is readily pyrolysed at relatively low temperatures. This
pyrolysis generates a considerable amount of syngas, but also some carbon rich liquids and solids.
In biomass gasification the pyrolysis step is therefore often followed by a gasification of the
remaining non-gaseous organic materials. This gasification is rather easy due to the high reactivity
of this organic material.
The pyrolysis is enhanced by the addition of water in the reaction chamber. Water at high
temperature is very reactive to the organic materials in the biomass. The reaction of water with
organic materials is called ‘reforming’. There are quite a lot of biomass gasification processes in
development combining pyrolysis, reforming and gasification. These processes hold promises since
they can be performed at a small scale and with compact and low cost equipment. The resulting
syngas contains less inert components allowing smaller and lower cost cleaning, conversion and
upgrading equipment.
Hydrolysis
Biomass can easily be gasified in the reaction with water at temperatures of about 600 ºC and
pressures at about 350 bar. This gasification results in a hydrogen and methane rich syngas
together with considerable amounts of liquid organic materials. Hydrolysis of biomass is still in the
research phase. Research is going on in the USA at NREL (National Renewable Energy
Laboratory) and in Japan at the University of Tokyo.
Hydrogenation
In the Netherlands ECN is starting a project to gasify biomass with hydrogen. This hydrogen will be
obtained as a residual of industrial processes or, in the far future, from renewable sources. This
project is dedicated to the production of pipeline quality gas.

page: 23
Overview thermal gasification for biomass
Table 5 gives a survey of thermal biomass gasification described in appendix 2.
Type Name Additional characteristicsBioneer updraft fixed bedEisenmann rotary drumLurgiPRME
Fixed bed
PrometheusBTS-fluid bedEisenmann Pressurised fluidised bedFoster WheelerLurgiPyroflow Atmospheric, circulating fluidised bedSELTECStork circulating fluidised bed
Fluidised bed
TPS Atmospheric fluidised bedBatelle/Ferco pyrolysis followed by gasificationBrightstar pyrolysis followed by reformingEVN pyrolysis gasifierGibros pyrolysis followed by gasificationNoell pyrolysis followed by high temperature gasificationThermoselect pyrolysis followed by gasification
Pyrolysis
Thermogenics pyrolysis, with utilisation of remaining liquids and solidsHydrogenation ECN
Table 5: Survey of reported thermal biomass gasification processes
The composition of the syngas obtained from biomass by the different processes can typically be
divided into five categories. These are syngases obtained by gasification of biomass with air, the
gasification of biomass with oxygen, pyrolysis, hydrogenation and hydrolysis.

page: 24
Composition
Process calo
rifi
c va
lue
MJ/
m3
hyd
rog
en
carb
on
mo
no
xid
e
met
han
e +
carb
on
dio
xid
e
nit
rog
en +
wat
er
oth
er h
ydro
carb
on
s
fixed bed: oxygen 35 13 12 35 0 0 3• PRME: 10% moisture 9.7 42 34 0 19 2 3• PRME: 20% moisture 9.3 43 29 0 22 2 3
Fluidised bed: air 5 - 7 4 - 9 - 16 1 - 5 15 - 16 3• Eisenmann medium 20 n.a. n.a. n.a. n.a. n.a.• Lurgi 7 17 22 4 14 41 1 2• Stork 5 8 11 1 15 10 0• TPS: general 5 8 16 6 15 53 0• TPS: Crève – plant 7 9 9 7 16 56 0
Fluidised bed: oxygen 40 - 45 29 - 34 19 - 22 3 0 0 2no examples available
Entrained bed 30 - 35 50 - 70 0 - 1 2 - 15 0 0 1no examples available
Pyrolysis basedprocesses
7 - 15 20 - 46 18 - 40 0 - 5 15 - 20 0 0 0-4
• Batelle/Ferco 7 4 30 4 n.a. n.a. n.a. 1• Brightstar 12 - 15 30 - 40 20 - 30 10 - 15 15 - 20 1 0• EVN 20 18 5 n.a. n.a. n.a.• Gibros PEC 10 46 38 0 14 1 0
Table 6: Typical compositions of thermal gas production processes
3.2.7 Preferred gasification processes for biomass
It is tempting to apply the mature and successful coal and lignite gasification technology directly to
biomass. Essential differences between coal and biomass urge, however the development of more
specific biomass gasification processes. The first important difference is the scale of operation. A 50
ton/day biomass gasifier is already quite large compared to the locally available supply of biomass.
A 500 ton/day coal gasification plant is still small compared to the available coal at mining locations.
page: 25
A second difference between coal and biomass is the reactivity. Biomass readily reacts with oxygen
at temperatures starting at 600 °C. Coal needs at least 800 - 1200 °C to obtain a useful rate of
conversion. Biomass also readily hydrolyses with water. Pyrolysis of biomass can also be
conducted at moderate temperatures.
Newly designed biomass gasification plants have a modest size (5 - 50 ton/day) and apply
moderate temperature and pressure processes. Pyrolysis and hydrogenation improve the quality of
the syngas.
Considering the addition of gas from biomass to the grid, most attention has to be given to small-
scale hydro-pyrolysis gasifiers. The cleaning and upgrading of the rich syngas from these reactors
is much easier than the utilisation of the lean syngas from ‘classic’ gasification processes. A recent
IGU publication [lit.7] shows that from new biomass and waste gasification plants fifty utilise classic
coal gasification processes and only seven utilise a pyrolysing reactor.

page: 26
4 PIPELINE QUALITY GAS FROM BIOGAS
4.1 INTRODUCTION
Biogas from anaerobic digestion consists primarily of methane (typically 60 - 70%) and carbon
dioxide. Other components can be oxygen and nitrogen, originating from air, sulphur compounds, in
particular hydrogen sulphide and water. In order to obtain pipeline quality gas the biogas must pass
two major processes:
• A cleaning process, in which trace components harmful to the natural gas grid, appliances or
end-users are removed.
• An upgrading process, in which the calorific value, Wobbe index and other parameters are
adjusted in order to meet the pipeline specifications.
Furthermore, the gas must be odorised before it is added to the natural gas grid.
The relevance and feasibility of the different types of cleaning and upgrading processes depends on
the specific biogas composition, which again is a result of the biomass feedstock and the digestion
process. The two major steps are not always totally separated. Some membrane separation
processes, e.g., do not only remove carbon dioxide from the methane, but also hydrogen sulphide.
This chapter describes processes that are capable of upgrading the biogas to pipeline quality.
However, in some cases the upgraded gas may not have to meet the pipeline specifications
completely. The gas quality of the mixture of natural gas and upgraded gas downstream of the point
where the upgraded gas enters the gas grid is a function of:
• The composition of the upgraded gas
• The composition of the natural gas
• The ratio between the flows of natural gas and upgraded gas
If e.g. the Wobbe index of the natural gas is somewhat higher than the minimum limit, the mixture of
natural gas and upgraded gas can meet this specification even if the Wobbe index of the upgraded
gas is lower than the limit. If lower qualities can be allowed as output from the upgrading process,
the efficiency and methane yield of the upgrading process can be improved, and the investment and
operating costs can be reduced.
If biogas is distributed in a closed biogas network or in a town gas network, only the cleaning of
biogas is necessary. This option has been demonstrated in Sweden and Denmark. § 4.5 gives
some details of this approach.
page: 27
4.2 CLEANING
The main components in biogas are methane and carbon dioxide, normally 90 - 95%. Additional
substances can be water, hydrogen sulphide, nitrogen and sometimes oxygen. When biogas is
upgraded to natural gas quality, most of these additional substances have to be removed. This can
be done before the upgrading process, in the upgrading process or after the upgrading process.
4.2.1 Removal hydrogen sulphide
Proteins and other sulphur containing materials produce hydrogen sulphide in the digestion
process. Hydrogen sulphide is poisonous and corrosive, as well as environmentally hazardous
since it is converted to sulphur dioxide by combustion. Furthermore it contaminates some upgrading
processes. Hydrogen sulphide can be removed either in the digester, from the crude biogas, or in
the upgrading process.
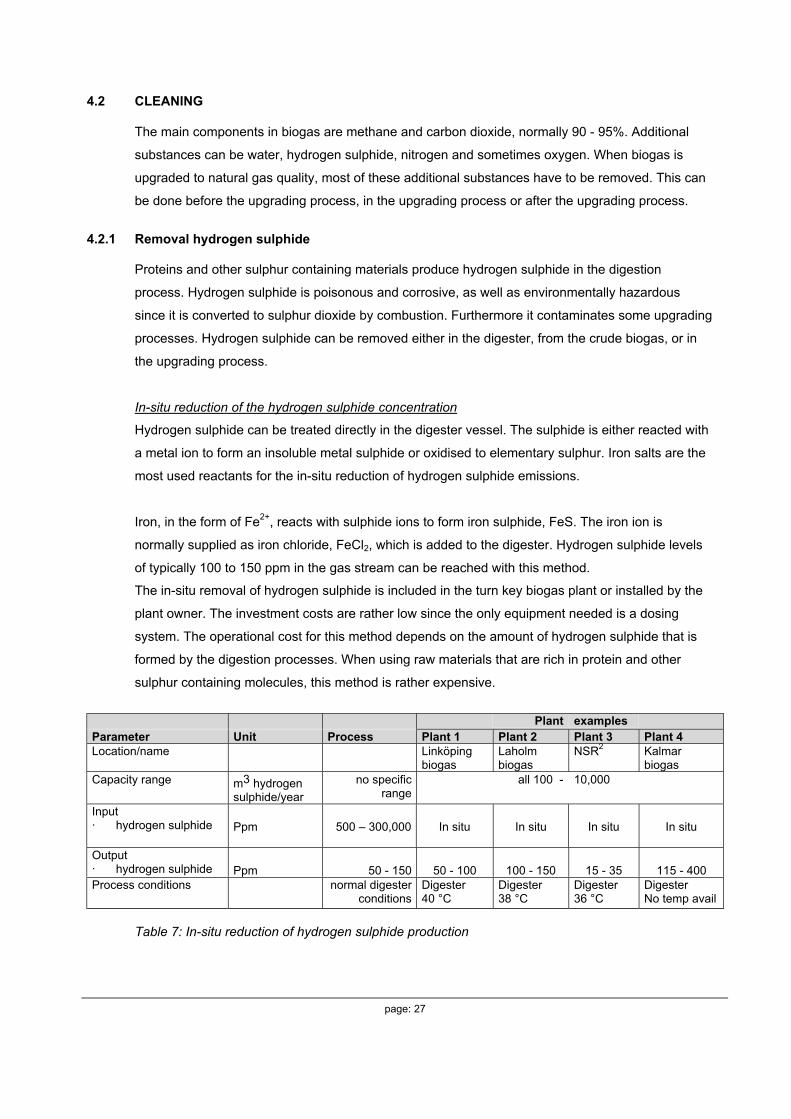
In-situ reduction of the hydrogen sulphide concentration
Hydrogen sulphide can be treated directly in the digester vessel. The sulphide is either reacted with
a metal ion to form an insoluble metal sulphide or oxidised to elementary sulphur. Iron salts are the
most used reactants for the in-situ reduction of hydrogen sulphide emissions.
Iron, in the form of Fe2+, reacts with sulphide ions to form iron sulphide, FeS. The iron ion is
normally supplied as iron chloride, FeCl2, which is added to the digester. Hydrogen sulphide levels
of typically 100 to 150 ppm in the gas stream can be reached with this method.
The in-situ removal of hydrogen sulphide is included in the turn key biogas plant or installed by the
plant owner. The investment costs are rather low since the only equipment needed is a dosing
system. The operational cost for this method depends on the amount of hydrogen sulphide that is
formed by the digestion processes. When using raw materials that are rich in protein and other
sulphur containing molecules, this method is rather expensive.
Plant examplesParameter Unit Process Plant 1 Plant 2 Plant 3 Plant 4Location/name Linköping
biogasLaholmbiogas
NSR2 Kalmarbiogas
Capacity range m3 hydrogensulphide/year
no specificrange
all 100 - 10,000
Input· hydrogen sulphide Ppm 500 – 300,000 In situ In situ In situ In situ
Output· hydrogen sulphide Ppm 50 - 150 50 - 100 100 - 150 15 - 35 115 - 400Process conditions normal digester
conditionsDigester40 °C
Digester38 °C
Digester36 °C
DigesterNo temp avail
Table 7: In-situ reduction of hydrogen sulphide production

page: 28
Removal of hydrogen sulphide with metal oxides and hydroxides
The crude biogas can be cleaned from hydrogen sulphide by different methods. The most common
methods are reaction with metal oxides or hydroxides, oxidation with air and adsorption on activated
carbon.
The most commonly used metal compound is iron oxide, but iron hydroxide and zinc oxide can also
be used. Below is a description of a mixture of iron oxides, with the registered trademark SulfaTreat.
SulfaTreat is based on a naturally occurring substance, which is processed to granules for use in
reaction beds.
The solid phase is packed in a circular reactor vessel. Biogas is fed into the reactor from the top.
The reason for this is that the reaction is exothermic and water is used to cool the solid bed. With a
downstream gas flow the water is better distributed in the bed. The gas flow is saturated with water
and excess water is added to the reaction bed. Reaction temperature is dependent on the hydrogen
sulphide content in the biogas. The reaction bed is not heated.
With fresh SulfaTreat and moderate concentrations of hydrogen sulphide, all H2S is removed from
the gas. The bed material is consumed by the reaction and this results in a rising H2S content in the
outlet stream. If it is important to keep the H2S content in the cleaned gas to virtually zero, gas
sampling can be done in the bed at some distance from the gas outlet. When the H2S content
increases in the sample, the bed material is removed and the reactor is recharged with fresh
material. For completely continuous running, two reactors can be installed and switched when the
H2S content starts to increase.
Parameter Unit Process Plant exampleLocation/name LaholmCapacity range · m3 biogas/h
· m3 H2S/h0 - 2000
0 - 5 0 - 0.5Input· hydrogen sulphide Ppm 50 - 2500 50 - 3000Output· hydrogen sulphide Ppm 0 - 10 0 - 15Process conditions· adsorbtion pressure· adsorption temperature· regeneration pressure
bar (abs)°Cmbar (abs)
105030
no regenerationSupplier SulfaTreat Co. Malmberg
Water ABInvestment M€ Included in the turn key
upgrading plant. No specificcost is available.
Operational costs k€/year 63
Table 8: Removal of hydrogen sulphide with SulfaTreat
2 NSR: North West Scania Waste Treatment Co.3 This includes the reacting agent, SulfaTreat, energy costs for compression work and labour costs for recharging the
absorption reactor.
page: 29
Removal of hydrogen sulphide by oxidation with air
The H2S content of the biogas can be reduced significantly by addition of 5 - 10% air to the biogas
in a cleaning unit after the biogas production [lit.9,10,11]. The filter vessel is filled with plastic
carriers and a liquid made up from gas condensate and liquid from effluent slurry separation is
continuously recirculated over the filter. A temperature of approximately 35 °C promotes the process
in which the H2S is biologically converted to sulphur. The sulphur is retained in the liquid in the filter.
After successful full-scale experiments at the Fangel plant in 1993, this method has been utilised
widely in Danish biogas plants. The utilisation of the method is increasing because it is cheaper
than chemical cleaning. The method is also able to remove the ammonia content of the biogas. With
addition of air in biological filters the H2S content can be reduced from 2000 - 3000 ppm to 50 - 100
ppm. In other experiments the H2S content has been reduced from 800 ppm to 10 ppm.
Limitations:
· Aftertreatment might be required to obtain pipeline gas quality.
· The addition of air may conflict with pipeline specifications for oxygen (and nitrogen) content.
· The addition of 5 - 10% air might reduce the effectiveness or capacity of an upgrading process
following the H2S cleaning.
Removal of hydrogen sulphide by adsorption on activated carbon
H2S can be adsorbed on activated carbon. The sulphur containing carbon can then either be
replaced with fresh activated carbon or regenerated.
The adsorption of hydrogen sulphide on activated carbon is catalytic and the carbon acts as
catalyst. The carbon is often impregnated with potassium iodide (KI) or sulphuric acid (H2SO4) to
increase the reaction rate. The chemical reaction is:
2H2S + O2 ---> 2S + 2H2O
Oxygen is needed for the reaction and is usually added as air. This results in nitrogen being added
to the gas, but if the H2S content is low, only minor amounts of nitrogen will be present in the
cleaned gas.
If the carbon is regenerated, this is done with hot nitrogen (inert gas) or steam. The sulphur will be
vaporised and, after cooling, liquify at approximately 130 °C. Regeneration requires two reaction
vessels for continuous running. The most common way for utilising activated carbon adsorption is
without regeneration of the carbon.
page: 30
Parameter Unit Process Plant exampleLocation/name NSR pilot plantCapacity rangewith regeneration
without regeneration
m3 biogas/hm3 hydrogen sulphide/h
m3 biogas/hm3 hydrogen sulphide/h
0 - 50000 - 10
0 - 10000 - 10
15
Inputhydrogen sulphide Ppm 50 - 2000 15-35Outputhydrogen sulphide Ppm 10 – 100 0-2Process conditions4
adsorbtion temperatureregeneration temperature
°C°C
Ambient400 - 500
ambientno regeneration
Supplier NSR
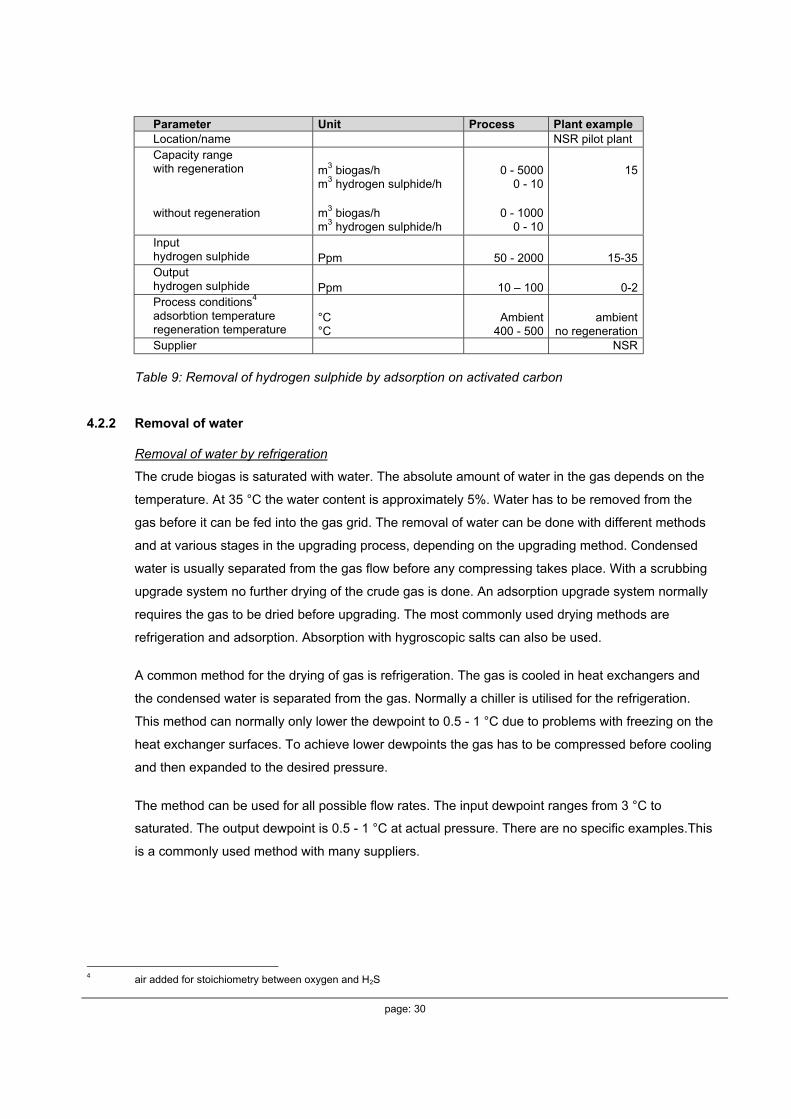
Table 9: Removal of hydrogen sulphide by adsorption on activated carbon
4.2.2 Removal of water
Removal of water by refrigeration
The crude biogas is saturated with water. The absolute amount of water in the gas depends on the
temperature. At 35 °C the water content is approximately 5%. Water has to be removed from the
gas before it can be fed into the gas grid. The removal of water can be done with different methods
and at various stages in the upgrading process, depending on the upgrading method. Condensed
water is usually separated from the gas flow before any compressing takes place. With a scrubbing
upgrade system no further drying of the crude gas is done. An adsorption upgrade system normally
requires the gas to be dried before upgrading. The most commonly used drying methods are
refrigeration and adsorption. Absorption with hygroscopic salts can also be used.
A common method for the drying of gas is refrigeration. The gas is cooled in heat exchangers and
the condensed water is separated from the gas. Normally a chiller is utilised for the refrigeration.
This method can normally only lower the dewpoint to 0.5 - 1 °C due to problems with freezing on the
heat exchanger surfaces. To achieve lower dewpoints the gas has to be compressed before cooling
and then expanded to the desired pressure.
The method can be used for all possible flow rates. The input dewpoint ranges from 3 °C to
saturated. The output dewpoint is 0.5 - 1 °C at actual pressure. There are no specific examples.This
is a commonly used method with many suppliers.
4 air added for stoichiometry between oxygen and H2S
page: 31
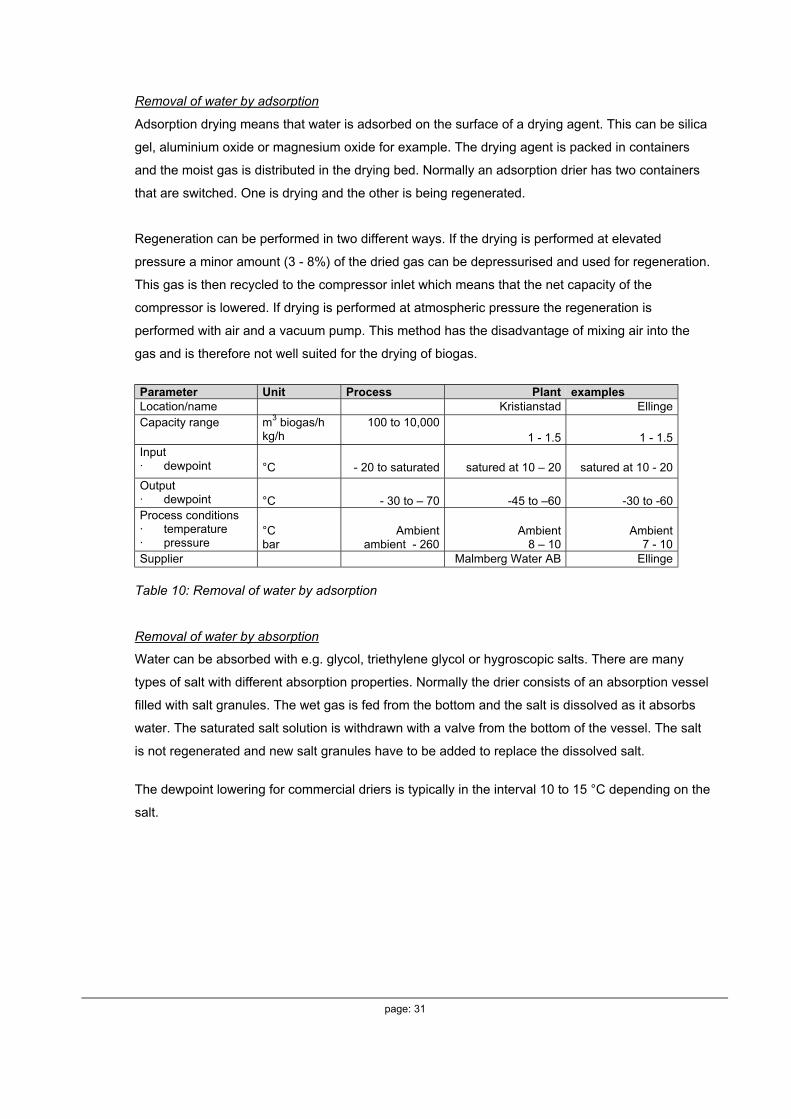
Removal of water by adsorption
Adsorption drying means that water is adsorbed on the surface of a drying agent. This can be silica
gel, aluminium oxide or magnesium oxide for example. The drying agent is packed in containers
and the moist gas is distributed in the drying bed. Normally an adsorption drier has two containers
that are switched. One is drying and the other is being regenerated.
Regeneration can be performed in two different ways. If the drying is performed at elevated
pressure a minor amount (3 - 8%) of the dried gas can be depressurised and used for regeneration.
This gas is then recycled to the compressor inlet which means that the net capacity of the
compressor is lowered. If drying is performed at atmospheric pressure the regeneration is
performed with air and a vacuum pump. This method has the disadvantage of mixing air into the
gas and is therefore not well suited for the drying of biogas.
Parameter Unit Process Plant examplesLocation/name Kristianstad EllingeCapacity range m3 biogas/h
kg/h100 to 10,000
1 - 1.5 1 - 1.5Input· dewpoint °C - 20 to saturated satured at 10 – 20 satured at 10 - 20
Output· dewpoint °C - 30 to – 70 -45 to –60 -30 to -60Process conditions· temperature· pressure
°Cbar
Ambientambient - 260
Ambient8 – 10
Ambient7 - 10
Supplier Malmberg Water AB Ellinge
Table 10: Removal of water by adsorption
Removal of water by absorption
Water can be absorbed with e.g. glycol, triethylene glycol or hygroscopic salts. There are many
types of salt with different absorption properties. Normally the drier consists of an absorption vessel
filled with salt granules. The wet gas is fed from the bottom and the salt is dissolved as it absorbs
water. The saturated salt solution is withdrawn with a valve from the bottom of the vessel. The salt
is not regenerated and new salt granules have to be added to replace the dissolved salt.
The dewpoint lowering for commercial driers is typically in the interval 10 to 15 °C depending on the
salt.

page: 32
Parameter Unit Process valueCapacity range m3 biogas/h 0 - 1000Input Gas saturated with water at ambient
temperatureOutput· dewpoint °C 10 - 15 below ambient temperatureProcess conditions· pressure· temperature
Bar°C
ambientambient
Supplier Van Air Inc.
Table 11: Removal of water by absorption
4.2.3 Removal of other contaminants
Several trace components other than hydrogen and water might be present in the biogas in
quantities that call for cleaning in order to obtain pipeline quality gas. Cleaning processes for some
of these substances are well established in the biogas sector, since they must also be removed
prior to utilisation in e.g. engines and boilers. Pipeline gas quality specifications are in general,
however, much more stringent than the limits for these purposes. The presence and amount of
undesired trace components is highly dependent on the raw material for the biogas production and
the production process. Below are the most relevant substances to consider described together with
available cleaning technologies [lit.12,13,14].
Particles
Particles are common in biogas and must be removed in filters in order to obtain pipeline gas
quality.
Halogenated hydrocarbons
Halogenated hydrocarbons, particularly chloro- and fluoro-compounds, are predominantly found in
landfill gas and can cause corrosion. They can be removed with impregnated activated carbon. In
this process small molecules like methane, carbon dioxide, nitrogen and oxygen pass through, while
larger molecules are adsorbed.
Regeneration is carried out by heating the activated carbon to 200 °C.
Ammonia
In industrial large-scale cleaning processes, ammonia is often removed from the gas by a washing
process with diluted nitric or sulfuric acid. However, the use of such acids requires equipment
constructed in stainless steel which can be expensive for small-scale applications as biogas
cleaning. Ammonia can be removed with activated charcoal units and can also be removed in some
upgrading processes, for example adsorption processes and water scrubbing.
page: 33
Oxygen
Oxygen is often present in landfill gas, originating from air extracted together with the gas, but is not
a natural component of biogas produced by controlled anaerobic digestion of manure etc. However,
oxygen might be present due to either leaks in the production and transport system or because air
is supplied to the biogas in e.g. a hydrogen sulphide cleaning process. In order to obtain pipeline
quality gas, the oxygen sources must be controlled and minimised. In some cases the upgrading
process, if e.g. membrane separation or PSA is applied, reduces the oxygen content.
Organic silicon compounds
Organic silicon compounds are occasionally present in biogas, and they can cause severe damage
to gas driven engines. They can be removed by absorption in a liquid medium, a mixture of
hydrocarbons with a special ability to absorb the silicon compounds.
Carbon dioxide
Carbon dioxide is a major component in the raw biogas and the vast majority of it will be removed in
the upgrading process in order to raise the calorific value, Wobbe index etc., see § 4.3. However,
typically traces of carbon dioxide will be present in the upgraded gas. The pipeline specifications for
carbon dioxide are varying for different grids. In some grids the natural gas contains several
percentages carbon dioxide. In case of stringent limits for the carbon dioxide content, an upgrading
process must be chosen that provides high purity methane, and therefore only a minor fraction of
carbon dioxide.
4.3 UPGRADING
4.3.1 Upgrading and carbon dioxide removal
The upgrading process is basically a separation of the methane and carbon dioxide of the biogas, in
order to obtain pipeline gas quality with regards to calorific value, Wobbe index, relative density etc.
Figure 2 illustrates how the Wobbe index is increased and the relative density decreases, as the
methane content of the upgraded gas is raised (i.e. the carbon dioxide content is reduced). A raw
biogas composition of 65% methane and 35% carbon dioxide is assumed.

page: 34
0
10
20
30
40
50
60
65 70 75 80 85 90 95 100
Methane content in upgraded gas [vol-%]
0.3
0.4
0.5
0.6
0.7
0.8
0.9
Relative density [-]Wobbe index [MJ/m3
n]
Carbon dioxide [vol-%]
Figure 2: Wobbe Index and relative density as function of the carbon dioxide concentration in methane/carbon dioxide mixtures.
The following upgrading processes are described:
· Membrane separation
· Pressure Swing Adsorption (PSA)
· Absorption without chemical reaction
· Absorption with chemical reaction
· Cryogenic removal of carbon dioxide
· Adding propane (supplementary upgrading)
4.3.2 Upgrading by membrane separation
The principle of membrane separation is that some components of the raw gas are transported
through a thin membrane (< 1 mm) while others are retained. In practice all components will be
transported through the membrane in some extent. The transport of each component is driven by
the difference in partial pressure over the membrane and is highly dependent on the permeability of
the component in the membrane material. In order to obtain high methane purity and recovery, the
selectivity of the membranes, i.e. the difference in permeability of methane and carbon dioxide
respectively, must be high. The permeability is a direct function of the chemical solubility of the
target component in the membrane.
Solid membranes can be constructed as e.g. hollow fibre modules, which give a large membrane
surface per volume and hence compact units. Solid membranes can be constructed from several
polymers as e.g. acetate-cellulose. In this material the permeability of CO2 is 20 times higher than
CH4, and the permeability of H2S is 60 times higher than for methane [lit.15,16].

page: 35
This means that CO2 and H2S will pass through the membrane (fibre wall), while methane
essentially is retained. Since the upgraded gas with reduced CO2 content is retained at the high
pressure side of the membrane, it leaves the upgrading process at high pressure, which means that
the need for further compression prior to its introduction to a gas grid is reduced or eliminated.
Typical operating pressures are in the range of 25 - 40 bar.
The principle of membrane separation constitutes a conflict between high methane purity in the
upgraded gas and high methane yield. The purity of the upgraded gas can be improved by
increasing the size or number of the membrane modules, but a larger amount of the methane will
permeate through the membranes and is therefore lost, see figure 3.
Figure 3: Relation between methane purity in upgraded gas and methane yield withmembrane modules connected in series (no recirculation) [lit.12]
For specific methane purity, the methane yield can be improved by recirculation of a part of the
permeated CO2-enriched gas. In case of several modules connected in series the best result is
obtained with recirculation of only the permeated gas from the last module [lit.12]. Another way to
maximise the methane yield and still obtain pipeline quality gas is to upgrade the biogas to a lower
quality than required and then add propane in order to meet the specifications. This solution is also
advantageous for the process control and the investment for the required equipment is small
compared to the total investment [lit.15].
In liquid membrane systems, a liquid absorbs the CO2 after it has permeated the membrane. This
type of membranes is reported to have a very high selectivity and operates at lower pressures
(approximately atmospheric) than solid membrane systems [lit.10,16].

page: 36
Figure 4 illustrates reported investments for membrane upgrading systems as a function of the plant
capacity. Some of the figures are budgets while others are data from realised plants.
Since the construction of membrane systems is of a modular nature, the specific costs per
processed volume of gas is more competitive for smaller units than for larger.
Figure 4: Specific investment of membrane upgrading system versus capacity [lit.9,15,17]
4.3.3 Upgrading by Pressure Swing Adsorption
Pressure Swing Adsorption, or PSA, is a method for the separation of carbon dioxide from methane
by adsorption/desorption of carbon dioxide on zeolites or activated carbon at different pressure
levels. The adsorption material adsorbs hydrogen sulphide irreversibly and is thus poisoned by
hydrogen sulphide. For this reason a hydrogen sulphide removing step is often included in the PSA
process.
The PSA process requires dry gas and the crude biogas is dried before it enters the upgrading
process.
The upgrading system consists of four adsorber vessels filled with adsorption material. This material
can be zeolites from carbon for example. During normal operation each adsorber operates in an
alternating cycle of adsorption, regeneration and pressure build-up. During the adsorption phase
biogas enters from the bottom into one of the adsorbers. When passing the adsorber vessel, carbon
dioxide, oxygen and nitrogen are adsorbed on the adsorbent material surface. The gas leaving the
top of the adsorber vessel contains > 97% methane.
Before the adsorbent material is completely saturated with the adsorbed feed gas components, the
adsorption phase is stopped and another adsorber vessel that has been regenerated is switched
into adsorption mode to achieve continuous operation.

page: 37
Regeneration of the saturated adsorbent material is performed by a stepwise depressurisation of
the adsorber vessel to atmospheric pressure and finally to near vacuum conditions. Initially the
pressure is reduced by a pressure balance with an already regenerated adsorber vessel. This is
followed by a second depressurisation step to almost atmospheric pressure. The gas leaving the
vessel during this step contains significant amounts of methane and is recycled to the gas inlet.
Finally, to achieve complete regeneration, the adsorber vessel is evacuated by a vacuum pump.
Before the adsorption phase starts again, the adsorber vessel is repressurised stepwise to the final
adsorption pressure. After a pressure balance with an adsorber that has been in adsorption mode
before, the final pressure build-up is achieved with feed gas.
Adso
rptio
n
Depr
essu
rise
Deso
rptio
n
Pres
suris
e
Raw biogas
Compressor
Vacuumpump
Upgradedbiogas
Vent gas(CO2)
Figure 5: Biogas upgrading with PSA
Plant examplesParameter Unit Process Plant 1 Plant 2 Plant 3 Plant 4 Plant 5Location/name NSR
(pilot)Göteborg(pilot)
Bromma Nuenen VAMWijster
Capacity range m3 biogas/h 10 –10,000
20 12 -15 2 * 400
Input· methane· carbon dioxide· nitrogen· hydrogen sulphide
%%%ppm
45 - 7525 - 55
< 1< 25
70 - 7326 - 290.5 - 1
0 - 2
58 - 6239 - 410.5 - 1
0-2
60391
not startedOutput· methane· carbon dioxide· dewpoint· hydrogen sulphide
%%°C at 4 barppm
973
3 - 50
95 - 981 - 4
-65 to -700
95 – 971.5 - 4
-40 to -450
not started
Process conditions· adsorption pressure· adsorption temperature· regeneration pressure
Bar°Cmbar (abs)
4-550 - 60
100 - 200
6-1030
100 - 200
1030
100 - 200
not started
Supplier GPM Väst GPM Väst Hahnemann CIRMAC CIRMACInvestment M€ no data no data 1.246
Operational costs k€/year no data no data not started
Table 12: Biomass upgrading with PSA
5 Excess H2S (> 2 ppm) removed separately6 High pressure system included
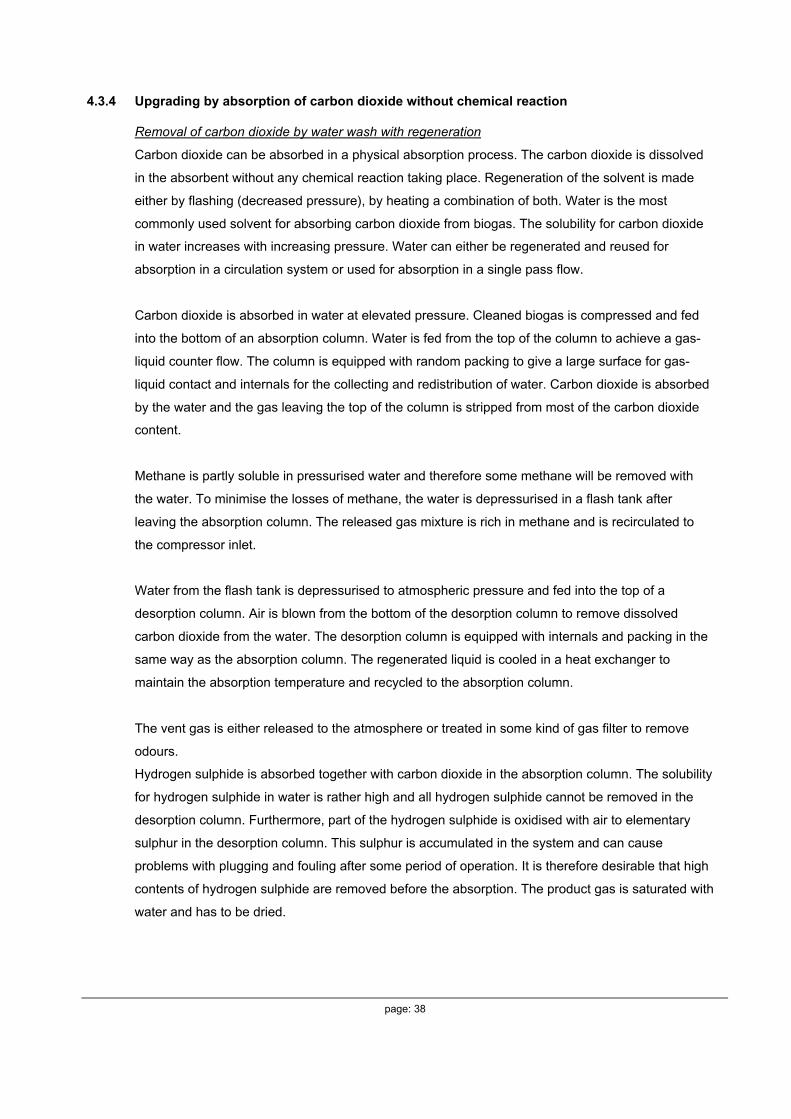
page: 38
4.3.4 Upgrading by absorption of carbon dioxide without chemical reaction
Removal of carbon dioxide by water wash with regeneration
Carbon dioxide can be absorbed in a physical absorption process. The carbon dioxide is dissolved
in the absorbent without any chemical reaction taking place. Regeneration of the solvent is made
either by flashing (decreased pressure), by heating a combination of both. Water is the most
commonly used solvent for absorbing carbon dioxide from biogas. The solubility for carbon dioxide
in water increases with increasing pressure. Water can either be regenerated and reused for
absorption in a circulation system or used for absorption in a single pass flow.
Carbon dioxide is absorbed in water at elevated pressure. Cleaned biogas is compressed and fed
into the bottom of an absorption column. Water is fed from the top of the column to achieve a gas-
liquid counter flow. The column is equipped with random packing to give a large surface for gas-
liquid contact and internals for the collecting and redistribution of water. Carbon dioxide is absorbed
by the water and the gas leaving the top of the column is stripped from most of the carbon dioxide
content.
Methane is partly soluble in pressurised water and therefore some methane will be removed with
the water. To minimise the losses of methane, the water is depressurised in a flash tank after
leaving the absorption column. The released gas mixture is rich in methane and is recirculated to
the compressor inlet.
Water from the flash tank is depressurised to atmospheric pressure and fed into the top of a
desorption column. Air is blown from the bottom of the desorption column to remove dissolved
carbon dioxide from the water. The desorption column is equipped with internals and packing in the
same way as the absorption column. The regenerated liquid is cooled in a heat exchanger to
maintain the absorption temperature and recycled to the absorption column.
The vent gas is either released to the atmosphere or treated in some kind of gas filter to remove
odours.
Hydrogen sulphide is absorbed together with carbon dioxide in the absorption column. The solubility
for hydrogen sulphide in water is rather high and all hydrogen sulphide cannot be removed in the
desorption column. Furthermore, part of the hydrogen sulphide is oxidised with air to elementary
sulphur in the desorption column. This sulphur is accumulated in the system and can cause
problems with plugging and fouling after some period of operation. It is therefore desirable that high
contents of hydrogen sulphide are removed before the absorption. The product gas is saturated with
water and has to be dried.

page: 39
Upgraded gas
Gas dryer
Water pump
Absorptioncolumn
Flashtank
Desorptioncolumn
Vent gas(CO2)
Cooler
Biofilter
Filter
Airblower
Raw biogas
Waterseparator
Compressor
Figure 6: Water wash process to reduce carbon dioxyde concentration including regeneration of the water
Plant examplesParameter Unit Process Plant 1 Plant 2 Plant 3 Plant 4Location/name Trollhättan Uppsala Linköping KalmarCapacity range m3
biogas/h
10 - 1000 140 200 660 60 - 70
Input· methane· carbon dioxide· nitrogen· hydrogen sulphide
%%%ppm
45 - 7525 - 55
< 1< 2007
60 - 7029 - 39no datano data
63 - 7029 - 36no datano data
68 - 6930 - 320 - 0.1
70
64 - 6733 - 36
0100 - 450
Output· methane· carbon dioxide· air· dewpoint
%%%°C
> 98< 2
< 1.5 20 - 35
96 - 971.5 - 2
1-100
93 - 972 - 4
1 - 2.5-80
96 - 982.30-1
< -80
94 - 964 - 60 - 1
< -30
Process conditions· adsorption pressure· adsorption temperature· pressure in flash tank· desorption pressure· water flow8
Bar°Cbarbarm3/h
6 - 1220 - 35
2 - 5atmospheric
12 - 20
6 - 7no datano data
atmosphericno data
7.5no datano data
atmosphericno data
8 - 8.5no datano data
atmosphericno data
8no datano data
atmosphericno data
Supplier FEAB FEAB FEAB FEABInvestment M€ no data 0.86 2.5 no dataOperational costs K€/year no data no data no data no data
Table 13: Removal of carbon dioxide using water wash with regeneration
7 High pressure system included8 Depending on the absorption pressure and degree of regeneration, for every 100 m3/h processed biogas
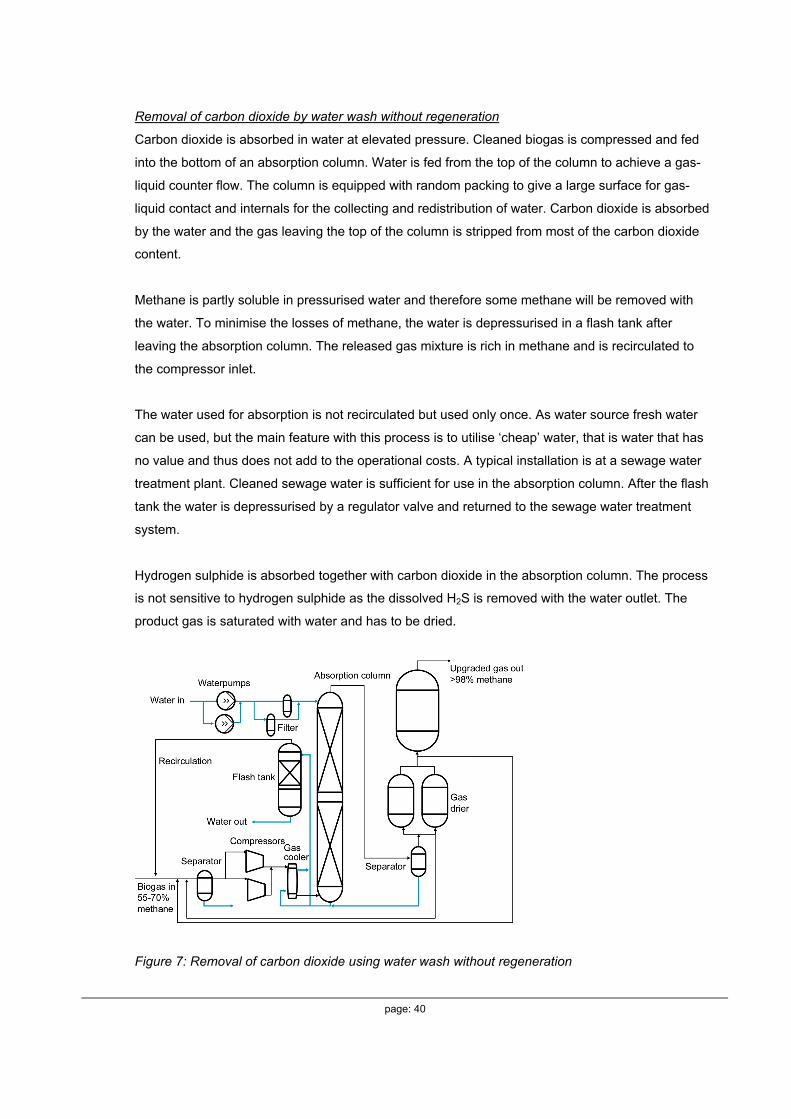
page: 40
Removal of carbon dioxide by water wash without regeneration
Carbon dioxide is absorbed in water at elevated pressure. Cleaned biogas is compressed and fed
into the bottom of an absorption column. Water is fed from the top of the column to achieve a gas-
liquid counter flow. The column is equipped with random packing to give a large surface for gas-
liquid contact and internals for the collecting and redistribution of water. Carbon dioxide is absorbed
by the water and the gas leaving the top of the column is stripped from most of the carbon dioxide
content.
Methane is partly soluble in pressurised water and therefore some methane will be removed with
the water. To minimise the losses of methane, the water is depressurised in a flash tank after
leaving the absorption column. The released gas mixture is rich in methane and is recirculated to
the compressor inlet.
The water used for absorption is not recirculated but used only once. As water source fresh water
can be used, but the main feature with this process is to utilise ‘cheap’ water, that is water that has
no value and thus does not add to the operational costs. A typical installation is at a sewage water
treatment plant. Cleaned sewage water is sufficient for use in the absorption column. After the flash
tank the water is depressurised by a regulator valve and returned to the sewage water treatment
system.
Hydrogen sulphide is absorbed together with carbon dioxide in the absorption column. The process
is not sensitive to hydrogen sulphide as the dissolved H2S is removed with the water outlet. The
product gas is saturated with water and has to be dried.
Figure 7: Removal of carbon dioxide using water wash without regeneration

page: 41
Plant examplesParameter Unit Process Plant 1 Plant 2 Plant 3Location/name Ellinge Bromma KristianstadCapacity range m3
biogas/h10 - 1000 70 55 175
Input· methane· carbon dioxide· nitrogen· hydrogen sulphide
%%%ppm
45 - 7525 - 55
< 1< 1000
58 - 6040 - 42
0< 10
61 - 6633 - 38
0.4 - 1.6< 0.5
60400
no data
Output· methane· carbon dioxide· air· dewpoint
%%%°C
> 98< 2< 1
20 - 35
96 - 990.5 - 3
0.8-60
96 - 972 - 3
1-50
97 - 981.5 - 20 - 0.5< -20
Process conditions· adsorption pressure· adsorption temperature· pressure in flash tank· water flow
bar°Cbarm3/h
6 - 1210 - 252 - 5
10 - 159
7 - 1110 - 25
no flash tank8 - 20
2210-25
no data5 - 15
8 - 1010 - 251.5 - 220 - 25
Supplier Ellinge FEAB Malmberg Water
Table 14: Removal of carbon dioxide using water wash without regeneration
Removal of carbon dioxide using Selexol
Selexol is a registered trade mark for a polyglycol ether. The chemical is dissolved in water and has
a very low vapour pressure. This means that the losses of chemicals are very low in the process.
Selexol removes carbon dioxide, hydrogen sulphide and water simultaneously.
The selectivity for hydrogen sulphide is very high compared to carbon dioxide and regeneration
from H2S requires increased energy input.
Carbon dioxide is absorbed in a circulating Selexol solution at elevated pressure. Cleaned biogas is
compressed and fed into the bottom of an absorption column. Selexol is fed from the top of the
column to achieve a gas-liquid counter flow. The column is equipped with random packing to give a
large surface for gas-liquid contact and internals for the collecting and redistribution of Selexol.
Carbon dioxide is absorbed by the Selexol solution and the gas leaving the top of the column is
stripped from most of the carbon dioxide content.
Methane is partly soluble in pressurised Selexol solution and therefore some methane will be
removed with the liquid. To minimise the losses of methane, the Selexol solution is depressurised in
a flash tank after leaving the absorption column. The released gas mixture is rich in methane and is
recirculated to the compressor inlet.
9 Depending on the absorption pressure, for every 100 m3/h processed biogas

page: 42
Selexol from the flash tank is depressurised to atmospheric pressure and fed into the top of a
desorption column. Air is blown from the bottom of the desorption column to remove dissolved
carbon dioxide from the Selexol solution. The desorption column is equipped with internals and
packing in the same way as the absorption column. The regenerated liquid is cooled in a heat
exchanger to maintain the absorption temperature and recycled to the absorption column.
The vent gas is either released to the atmosphere or treated in some kind of gas filter to remove
odours.
Hydrogen sulphide is absorbed together with carbon dioxide in the absorption column. The solubility
for H2S in Selexol is very high and H2S cannot be removed in the desorption column. To remove
H2S from a Selexol solution, heating with steam is needed. It is therefore desirable that H2S is
removed before the absorption to minimise energy costs. If very large gas flows are treated, it can
be economically interesting to use Selexol for H2S removal. The recovered H2S is then processed
further to produce sulphur.
The product gas has a low water content since Selexol absorbs water. Further drying is normally not
needed.
Figure 8: Biogas cleaning and upgrading with ‘SulfaTreat’ and ‘Selexol’

page: 43
Parameter Unit Process Plant exampleLocation/name LaholmCapacity range M3 biogas/h 100 to > 10,000 250Input· methane· carbon dioxide· nitrogen· hydrogen sulphide
%%%ppm
45 - 7525 - 55
< 1< 1010
69 - 7228 - 310 - 0.20 - 15
Output· methane· carbon dioxide· air· dewpoint· hydrogen sulphide
%%%°Cppm
> 98< 2
< 1.5< -20
0
95 - 982 - 5
0 - 0.5< -60
0
Process conditionsAbsorption pressureAbsorption temperaturePressure in flash tankDesorption pressureSelexol flow
Bar°C barmbar (abs)m3/h
10 - 1220 - 35
2 - 5atmospheric to 200
3 - 611
7 - 97
1.5 - 2950
10 - 15Supplier Malmberg Water AB
Table 15: Removal of carbon dioxide using Selexol
4.3.5 Removal of carbon dioxide by chemical reaction
This process is based on the same principle as the absorption processes without chemical reaction,
see § 4.3.4. The raw gas is led through a liquid, typically at elevated pressure and temperature, and
the undesired components (e.g. CO2, H2S) are absorbed in the liquid. However, instead of simply
dissolving these components, the liquid reacts chemically with them and therefore drives them into
solution.
Due to absorber costs and the disposal of contaminated absorber, the absorber is always
regenerated, i.e. single pass operation know, from water scrubbers are not applied. The process is
continuous and the absorber is regenerated in a reversal chemical reaction in which the absorbed
CO2 is released.
Table 15 illustrates the characteristics of a number of gas treatment processes with absorption in
chemically reacting absorbers. The alkanolamines MEA, DEA and DGA are examples of absorbers.
Several of the alkanolamines also absorb a significant amount of the water contained in the biogas.
MEA, that is an organic base in an aqueous solution, is one of the most feasible chemical
absorbers. MEA is often used in gas separation processes in e.g. CO2 production from flue gases,
cleaning of natural gases, and production of hydrogen and ammonia. It is a colourless, viscous,
10 Excess H2S (> 10 ppm) removed separately to reduce energy costs11 Depending on the absorption pressure, for every 100 m3/h processed biogas

page: 44
poisonous and aggressive liquid with a boiling temperature of 170 °C and a weak smell of ammonia.
The MEA process does not remove water, halogenated carbon hydrates or ammonia.
The methane yield and methane purity in the upgraded gas are both close to 100%. Chemical
absorption is more cost competitive for larger plants than for smaller.
Process name/Absorbent
Op
erat
ing
tem
per
atu
re
Op
erat
ing
pre
ssu
re
Method ofRegeneration
Strong and weakassets
°C Bar
Amine-guard
Mono-ethanol-amine(MEA)
50 High ReboilingLow pressure
strong: High efficiency,moderate solvent cost
weak: High capital cost,corrosive inhibitors,toxic, foaming agentsneeded
SNPA-DEA
Diethanolamine(DEA)
50 > 34 HeatingLow pressure
strong: High efficiencynoncorrosive &nonfoaming
weak: High capital andsolvent costs
Econamine
Hydroxyaminoethylester
up to 50 > 34 HeatingLow pressure
strong: Moderatecapital and operatingcosts
weak: High solventcost,corrosion inhibitorsneeded
Benfield
Potassium carbonate
115 7 - 138 Steam strong: Low solventcost, high efficiency
weak: High capital cost,corrosion inhibitorsneededFoaming agentsneeded
Catacarb
Potassium carbonateplus amine borate
15 - 230 7 - 69 Steam strong: Low solventcost, high efficiency,non toxic additives
weak: High capital cost,corrosion inhibitors &Foaming agentsneeded
Table 16: Characteristics of gas treatment processes with absorption in chemically reacting absorbers. None of these processes removes mercaptans [lit.18].
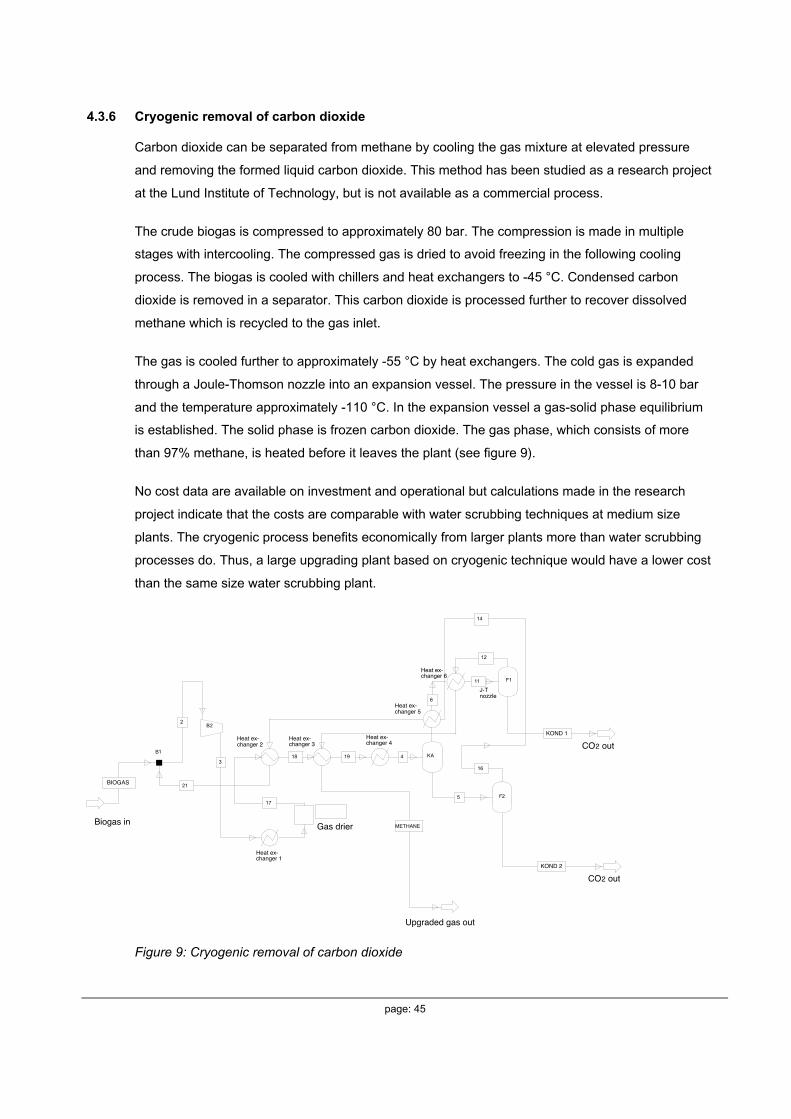
page: 45
4.3.6 Cryogenic removal of carbon dioxide
Carbon dioxide can be separated from methane by cooling the gas mixture at elevated pressure
and removing the formed liquid carbon dioxide. This method has been studied as a research project
at the Lund Institute of Technology, but is not available as a commercial process.
The crude biogas is compressed to approximately 80 bar. The compression is made in multiple
stages with intercooling. The compressed gas is dried to avoid freezing in the following cooling
process. The biogas is cooled with chillers and heat exchangers to -45 °C. Condensed carbon
dioxide is removed in a separator. This carbon dioxide is processed further to recover dissolved
methane which is recycled to the gas inlet.
The gas is cooled further to approximately -55 °C by heat exchangers. The cold gas is expanded
through a Joule-Thomson nozzle into an expansion vessel. The pressure in the vessel is 8-10 bar
and the temperature approximately -110 °C. In the expansion vessel a gas-solid phase equilibrium
is established. The solid phase is frozen carbon dioxide. The gas phase, which consists of more
than 97% methane, is heated before it leaves the plant (see figure 9).
No cost data are available on investment and operational but calculations made in the research
project indicate that the costs are comparable with water scrubbing techniques at medium size
plants. The cryogenic process benefits economically from larger plants more than water scrubbing
processes do. Thus, a large upgrading plant based on cryogenic technique would have a lower cost
than the same size water scrubbing plant.
2
34
5
6
11
12
14
16
17
18 19
21
B1
B2
KA
F2
F1
Gas drierBiogas in
Upgraded gas out
Heat ex-changer 1
Heat ex-changer 6
Heat ex-changer 5
Heat ex-changer 4
Heat ex-changer 3
Heat ex-changer 2 CO2 out
CO2 out
BIOGAS
METHANE
KOND 1
KOND 2
J-Tnozzle
Figure 9: Cryogenic removal of carbon dioxide
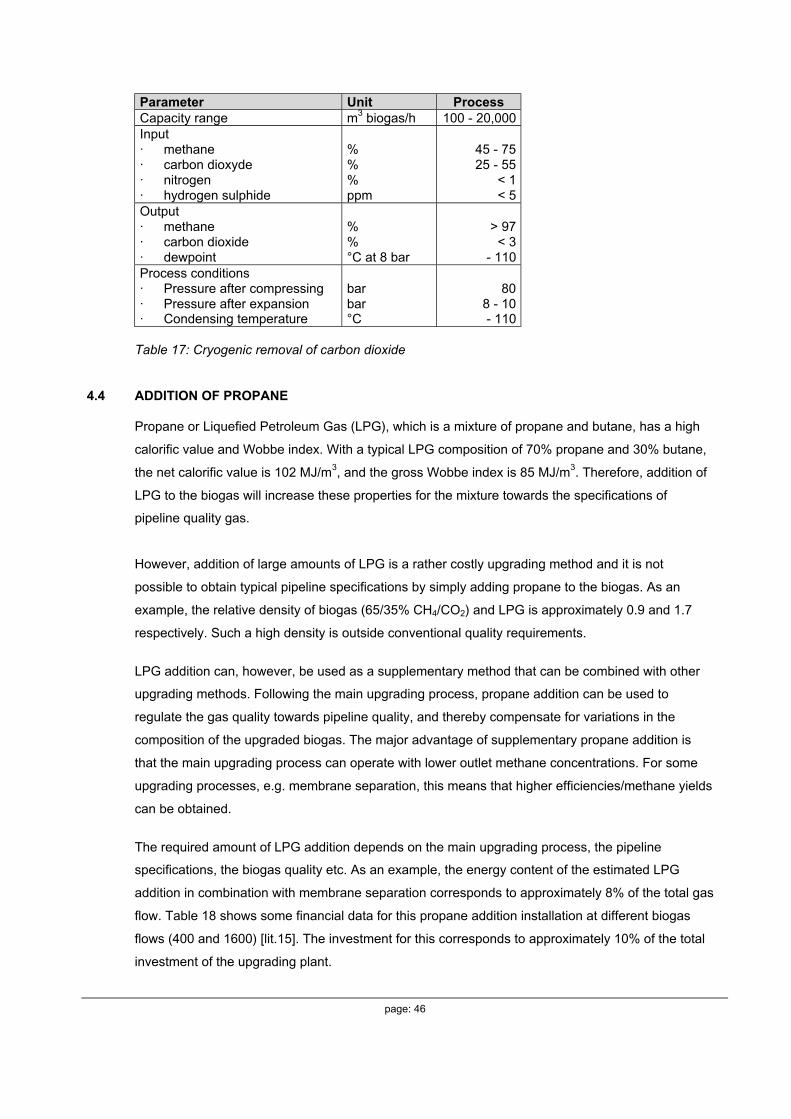
page: 46
Parameter Unit ProcessCapacity range m3 biogas/h 100 - 20,000Input· methane· carbon dioxyde· nitrogen· hydrogen sulphide
%%%ppm
45 - 7525 - 55
< 1< 5
Output· methane· carbon dioxide· dewpoint
%%°C at 8 bar
> 97< 3
- 110Process conditions· Pressure after compressing· Pressure after expansion· Condensing temperature
barbar°C
808 - 10- 110
Table 17: Cryogenic removal of carbon dioxide
4.4 ADDITION OF PROPANE
Propane or Liquefied Petroleum Gas (LPG), which is a mixture of propane and butane, has a high
calorific value and Wobbe index. With a typical LPG composition of 70% propane and 30% butane,
the net calorific value is 102 MJ/m3, and the gross Wobbe index is 85 MJ/m3. Therefore, addition of
LPG to the biogas will increase these properties for the mixture towards the specifications of
pipeline quality gas.
However, addition of large amounts of LPG is a rather costly upgrading method and it is not
possible to obtain typical pipeline specifications by simply adding propane to the biogas. As an
example, the relative density of biogas (65/35% CH4/CO2) and LPG is approximately 0.9 and 1.7
respectively. Such a high density is outside conventional quality requirements.
LPG addition can, however, be used as a supplementary method that can be combined with other
upgrading methods. Following the main upgrading process, propane addition can be used to
regulate the gas quality towards pipeline quality, and thereby compensate for variations in the
composition of the upgraded biogas. The major advantage of supplementary propane addition is
that the main upgrading process can operate with lower outlet methane concentrations. For some
upgrading processes, e.g. membrane separation, this means that higher efficiencies/methane yields
can be obtained.
The required amount of LPG addition depends on the main upgrading process, the pipeline
specifications, the biogas quality etc. As an example, the energy content of the estimated LPG
addition in combination with membrane separation corresponds to approximately 8% of the total gas
flow. Table 18 shows some financial data for this propane addition installation at different biogas
flows (400 and 1600) [lit.15]. The investment for this corresponds to approximately 10% of the total
investment of the upgrading plant.
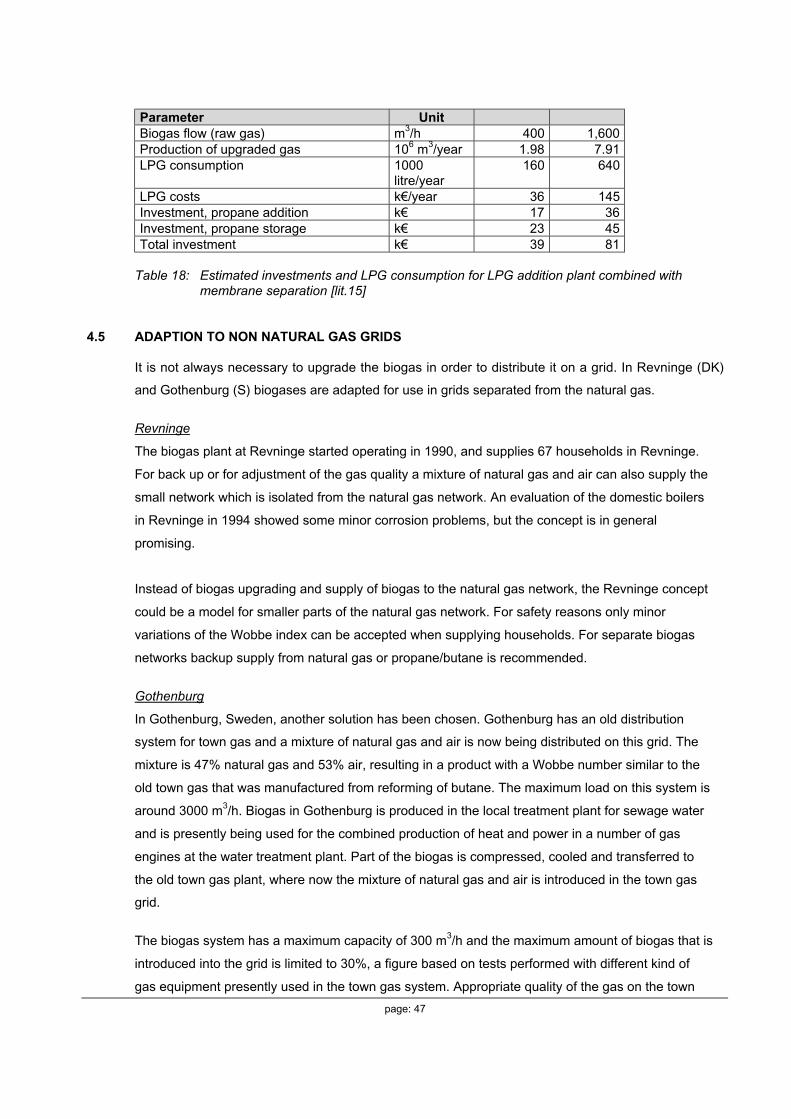
page: 47
Parameter UnitBiogas flow (raw gas) m3/h 400 1,600Production of upgraded gas 106 m3/year 1.98 7.91LPG consumption 1000
litre/year160 640
LPG costs k€/year 36 145Investment, propane addition k€ 17 36Investment, propane storage k€ 23 45Total investment k€ 39 81
Table 18: Estimated investments and LPG consumption for LPG addition plant combined withmembrane separation [lit.15]
4.5 ADAPTION TO NON NATURAL GAS GRIDS
It is not always necessary to upgrade the biogas in order to distribute it on a grid. In Revninge (DK)
and Gothenburg (S) biogases are adapted for use in grids separated from the natural gas.
Revninge
The biogas plant at Revninge started operating in 1990, and supplies 67 households in Revninge.
For back up or for adjustment of the gas quality a mixture of natural gas and air can also supply the
small network which is isolated from the natural gas network. An evaluation of the domestic boilers
in Revninge in 1994 showed some minor corrosion problems, but the concept is in general
promising.
Instead of biogas upgrading and supply of biogas to the natural gas network, the Revninge concept
could be a model for smaller parts of the natural gas network. For safety reasons only minor
variations of the Wobbe index can be accepted when supplying households. For separate biogas
networks backup supply from natural gas or propane/butane is recommended.
Gothenburg
In Gothenburg, Sweden, another solution has been chosen. Gothenburg has an old distribution
system for town gas and a mixture of natural gas and air is now being distributed on this grid. The
mixture is 47% natural gas and 53% air, resulting in a product with a Wobbe number similar to the
old town gas that was manufactured from reforming of butane. The maximum load on this system is
around 3000 m3/h. Biogas in Gothenburg is produced in the local treatment plant for sewage water
and is presently being used for the combined production of heat and power in a number of gas
engines at the water treatment plant. Part of the biogas is compressed, cooled and transferred to
the old town gas plant, where now the mixture of natural gas and air is introduced in the town gas
grid.
The biogas system has a maximum capacity of 300 m3/h and the maximum amount of biogas that is
introduced into the grid is limited to 30%, a figure based on tests performed with different kind of
gas equipment presently used in the town gas system. Appropriate quality of the gas on the town
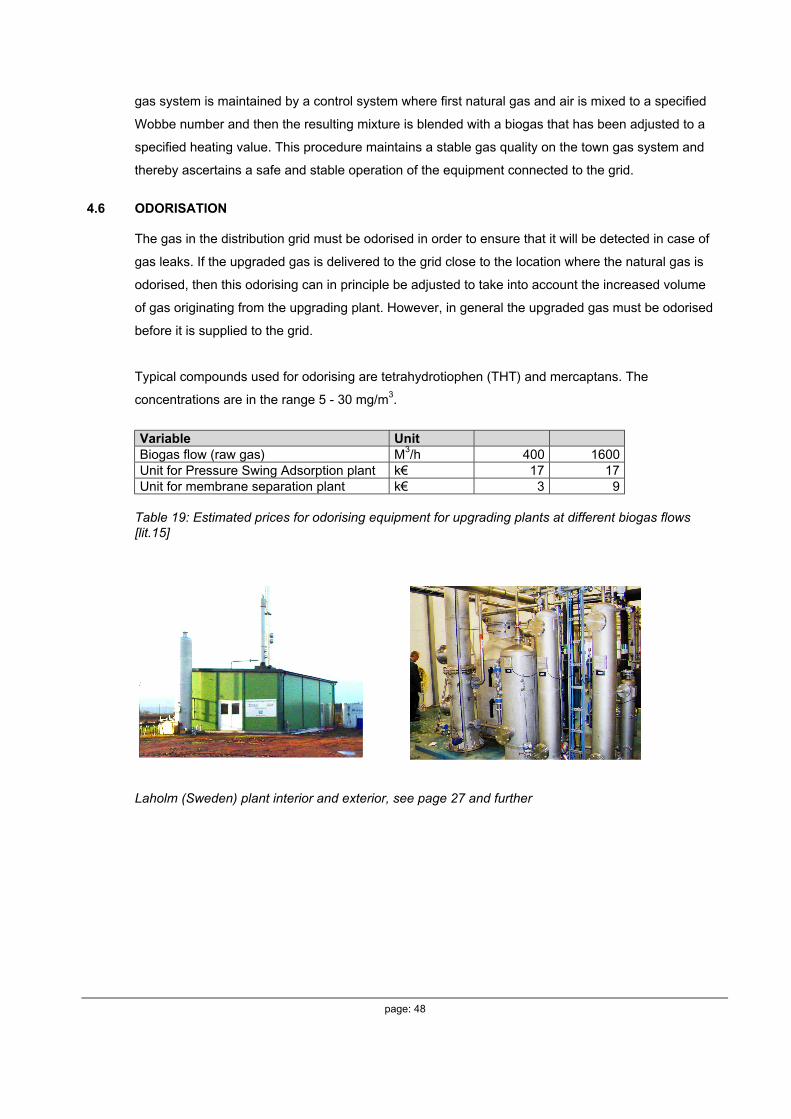
page: 48
gas system is maintained by a control system where first natural gas and air is mixed to a specified
Wobbe number and then the resulting mixture is blended with a biogas that has been adjusted to a
specified heating value. This procedure maintains a stable gas quality on the town gas system and
thereby ascertains a safe and stable operation of the equipment connected to the grid.
4.6 ODORISATION
The gas in the distribution grid must be odorised in order to ensure that it will be detected in case of
gas leaks. If the upgraded gas is delivered to the grid close to the location where the natural gas is
odorised, then this odorising can in principle be adjusted to take into account the increased volume
of gas originating from the upgrading plant. However, in general the upgraded gas must be odorised
before it is supplied to the grid.
Typical compounds used for odorising are tetrahydrotiophen (THT) and mercaptans. The
concentrations are in the range 5 - 30 mg/m3.
Variable UnitBiogas flow (raw gas) M3/h 400 1600Unit for Pressure Swing Adsorption plant k€ 17 17Unit for membrane separation plant k€ 3 9
Table 19: Estimated prices for odorising equipment for upgrading plants at different biogas flows[lit.15]
Laholm (Sweden) plant interior and exterior, see page 27 and further
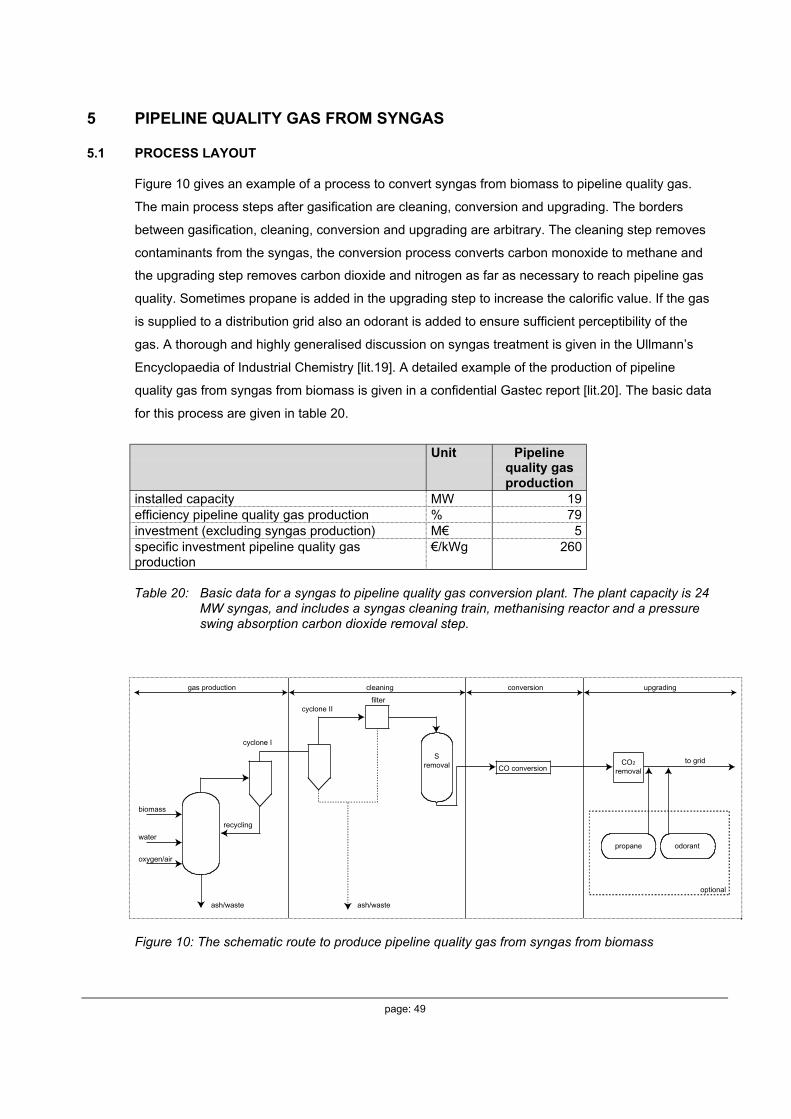
page: 49
5 PIPELINE QUALITY GAS FROM SYNGAS
5.1 PROCESS LAYOUT
Figure 10 gives an example of a process to convert syngas from biomass to pipeline quality gas.
The main process steps after gasification are cleaning, conversion and upgrading. The borders
between gasification, cleaning, conversion and upgrading are arbitrary. The cleaning step removes
contaminants from the syngas, the conversion process converts carbon monoxide to methane and
the upgrading step removes carbon dioxide and nitrogen as far as necessary to reach pipeline gas
quality. Sometimes propane is added in the upgrading step to increase the calorific value. If the gas
is supplied to a distribution grid also an odorant is added to ensure sufficient perceptibility of the
gas. A thorough and highly generalised discussion on syngas treatment is given in the Ullmann’s
Encyclopaedia of Industrial Chemistry [lit.19]. A detailed example of the production of pipeline
quality gas from syngas from biomass is given in a confidential Gastec report [lit.20]. The basic data
for this process are given in table 20.
Unit Pipelinequality gasproduction
installed capacity MW 19efficiency pipeline quality gas production % 79investment (excluding syngas production) M€ 5specific investment pipeline quality gasproduction
€/kWg 260
Table 20: Basic data for a syngas to pipeline quality gas conversion plant. The plant capacity is 24MW syngas, and includes a syngas cleaning train, methanising reactor and a pressureswing absorption carbon dioxide removal step.
biomass
water
oxygen/air
recycling
ash/waste ash/waste
cyclone I
cyclone IIfilter
Sremoval CO conversion
CO2
removal
propane odorant
to grid
optional
upgradingconversioncleaninggas production
Figure 10: The schematic route to produce pipeline quality gas from syngas from biomass
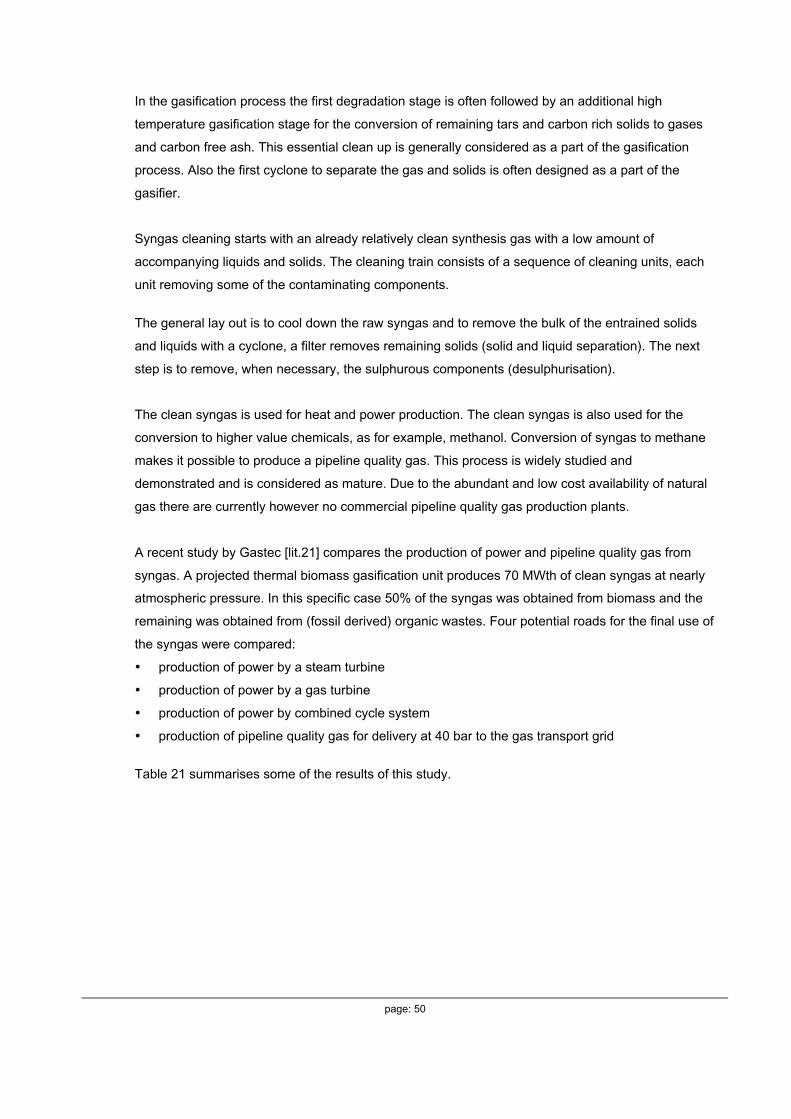
page: 50
In the gasification process the first degradation stage is often followed by an additional high
temperature gasification stage for the conversion of remaining tars and carbon rich solids to gases
and carbon free ash. This essential clean up is generally considered as a part of the gasification
process. Also the first cyclone to separate the gas and solids is often designed as a part of the
gasifier.
Syngas cleaning starts with an already relatively clean synthesis gas with a low amount of
accompanying liquids and solids. The cleaning train consists of a sequence of cleaning units, each
unit removing some of the contaminating components.
The general lay out is to cool down the raw syngas and to remove the bulk of the entrained solids
and liquids with a cyclone, a filter removes remaining solids (solid and liquid separation). The next
step is to remove, when necessary, the sulphurous components (desulphurisation).
The clean syngas is used for heat and power production. The clean syngas is also used for the
conversion to higher value chemicals, as for example, methanol. Conversion of syngas to methane
makes it possible to produce a pipeline quality gas. This process is widely studied and
demonstrated and is considered as mature. Due to the abundant and low cost availability of natural
gas there are currently however no commercial pipeline quality gas production plants.
A recent study by Gastec [lit.21] compares the production of power and pipeline quality gas from
syngas. A projected thermal biomass gasification unit produces 70 MWth of clean syngas at nearly
atmospheric pressure. In this specific case 50% of the syngas was obtained from biomass and the
remaining was obtained from (fossil derived) organic wastes. Four potential roads for the final use of
the syngas were compared:
• production of power by a steam turbine
• production of power by a gas turbine
• production of power by combined cycle system
• production of pipeline quality gas for delivery at 40 bar to the gas transport grid
Table 21 summarises some of the results of this study.
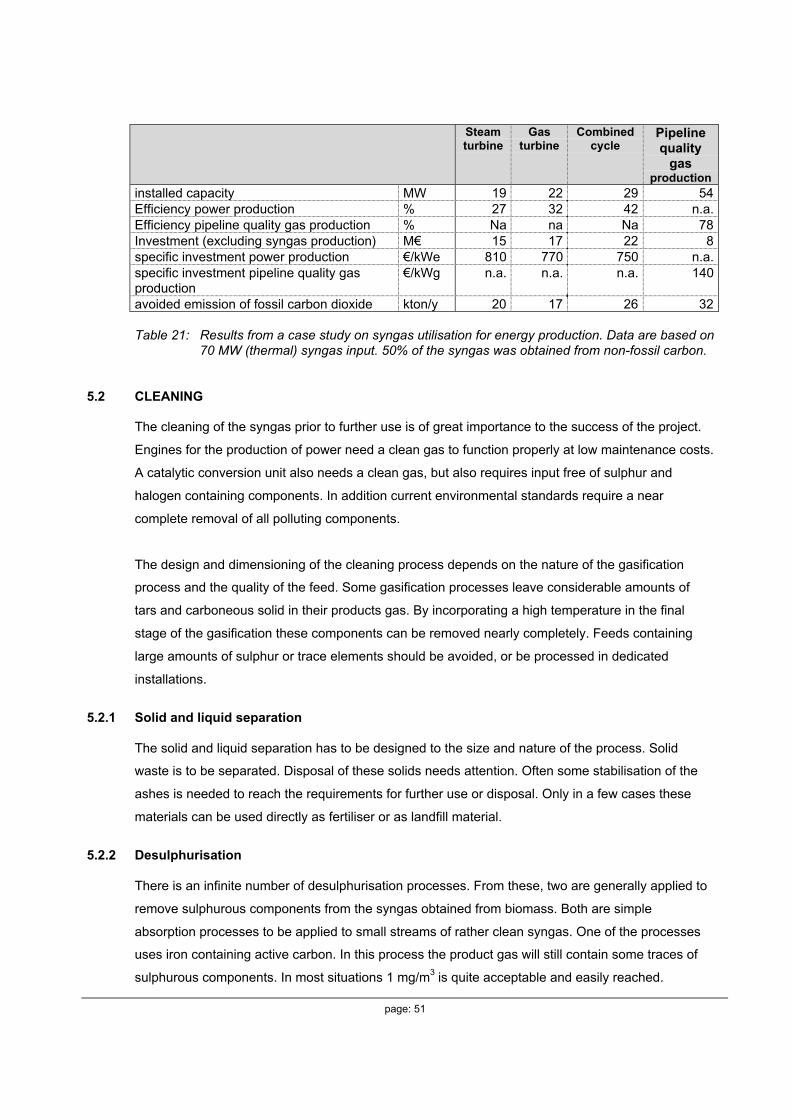
page: 51
Steamturbine
Gasturbine
Combinedcycle
Pipelinequality
gasproduction
installed capacity MW 19 22 29 54Efficiency power production % 27 32 42 n.a.Efficiency pipeline quality gas production % Na na Na 78Investment (excluding syngas production) M€ 15 17 22 8specific investment power production €/kWe 810 770 750 n.a.specific investment pipeline quality gasproduction
€/kWg n.a. n.a. n.a. 140
avoided emission of fossil carbon dioxide kton/y 20 17 26 32
Table 21: Results from a case study on syngas utilisation for energy production. Data are based on70 MW (thermal) syngas input. 50% of the syngas was obtained from non-fossil carbon.
5.2 CLEANING
The cleaning of the syngas prior to further use is of great importance to the success of the project.
Engines for the production of power need a clean gas to function properly at low maintenance costs.
A catalytic conversion unit also needs a clean gas, but also requires input free of sulphur and
halogen containing components. In addition current environmental standards require a near
complete removal of all polluting components.
The design and dimensioning of the cleaning process depends on the nature of the gasification
process and the quality of the feed. Some gasification processes leave considerable amounts of
tars and carboneous solid in their products gas. By incorporating a high temperature in the final
stage of the gasification these components can be removed nearly completely. Feeds containing
large amounts of sulphur or trace elements should be avoided, or be processed in dedicated
installations.
5.2.1 Solid and liquid separation
The solid and liquid separation has to be designed to the size and nature of the process. Solid
waste is to be separated. Disposal of these solids needs attention. Often some stabilisation of the
ashes is needed to reach the requirements for further use or disposal. Only in a few cases these
materials can be used directly as fertiliser or as landfill material.
5.2.2 Desulphurisation
There is an infinite number of desulphurisation processes. From these, two are generally applied to
remove sulphurous components from the syngas obtained from biomass. Both are simple
absorption processes to be applied to small streams of rather clean syngas. One of the processes
uses iron containing active carbon. In this process the product gas will still contain some traces of
sulphurous components. In most situations 1 mg/m3 is quite acceptable and easily reached.
page: 52
A catalytic process requires a feed with an even lower sulphur concentration. In these cases zinc
oxide (ZnO) is applied operating at 200 - 350 °C. Zinc oxide removes traces of sulphur to
concentrations down to 100 ppb or even lower. Zinc oxide also removes halogen compounds. At
high chloride concentrations and higher temperatures some of the formed zinc chloride can
evaporate and move to the following process step. A second adsorption layer based on activated
aluminium oxide (‘alumina’) unit can absorb the volatile halogen components.
In both processes the design usually aims at a replacement time of at least once per year. The used
active carbon or zinc oxide reagents are to be treated as chemical waste.
5.3 CONVERSION AND UPGRADING
The cleaned syngas will generally contain too much carbon monoxide and will also have a low or
medium calorific value. By a chemical conversion the carbon monoxide is converted to methane
(‘conversion’). In a sequencing step non-combustible gases are removed to leave a clean, high
calorific fuel gas. Optional is the addition of propane and odorant to bring the product gas to grid
specifications (‘upgrading’). The addition of propane is often referred to as ‘carburisation’.
Conversion
Conversion is the process step to remove most of the carbon monoxide. Both hydrogen and water
can react with carbon monoxide to methane. This process can be described by the equilibrium
reactions:
• the reaction of carbon monoxide with hydrogen to give methane and water (’shift’)
CO + 3H2 <--> CH4 + H2O
• the reaction of carbon monoxide with water to give methane and carbon dioxide (’methanation’)
CO + 2H2O <--> CH4 + CO2
These equilibriums will have the maximum yield of methane at low temperatures. At temperatures to
300 °C a 99% conversion or better will be reached. High pressures, up to 100 bar, can improve the
conversion at higher temperatures. The shift and methanation reactions are slow at reaction
temperatures. To ensure a sufficient rate of the reactions a nickel based catalyst is used. A
complication in these reactions is the deposition of carbon on the catalyst. This can be suppressed
by increasing the amount of water in the feed. Some new catalysts are claimed to be resistant to
carbon deposition.
page: 53
Another problem is the potential formation of nickel and iron carbonyl components.
These components are formed by the reaction of iron or nickel with carbon monoxide. This reaction
takes place at temperatures below 300 °C. Iron and nickel carbonyl are highly toxic volatile
components. Reactor construction materials will lose their strength when subjected to carbonyl
formation. A careful reactor design, in process temperature selection, material selection and
reactant gas composition is essential.
This conversion reaction is highly exothermic. Unless the heat can find a useful application, an
energy loss of 20 - 30% occurs. To allow cooling of the reactor the carbon monoxide conversion is
performed in a tube reactor. The quality of the feed gas and the quality requirements of the product
gas largely determine the operating conditions. Pressure ranges between 3 - 20 bars and
temperature ranges between 250 and 400 °C. The resulting gas mainly consists of methane, carbon
dioxide and nitrogen. The produced heat can be used for electricity production. Waste heat can
often be applied for drying of the (wet biomass) feed. Some proposed processes use the generated
heat to facilitate the thermal gasification.
Upgrading
The conversion of carbon monoxide to methane generates a surplus of carbon dioxide. Chapter 4 of
this report describes the processes to remove the carbon dioxide from a gas. The capacity and the
composition of the incoming gas mainly determine the selection and dimensioning of the process.
The amount and composition of the non-combustible fraction in the feed depends on the gasification
process selected and, to a much smaller extent, on the nature of the biomass feed.
Carbon dioxide is much easier removed than nitrogen and argon, which are also often present in
raw biogas. The upgrading process requires a pyrolysis based gasification process. Additional
gasification is mainly obtained by water as the reactive agent. The additionally needed oxygen
should be provided by an air separator, minimising the intrusion of nitrogen.
Proven technologies are:
• pressure swing adsorption,
• gaseous membrane separation
• liquid wash
Detailed engineering has to provide the optimal choice in these technologies.
Carburation and odorisation
Without carburation with propane most processes will allow the production of a low calorific natural
gas quality. The production of high calorific natural gas quality will often require the addition of a
small amount of propane to reach the required high calorific value. Odorisation is only required if the
gas in the grid is to be odorised.
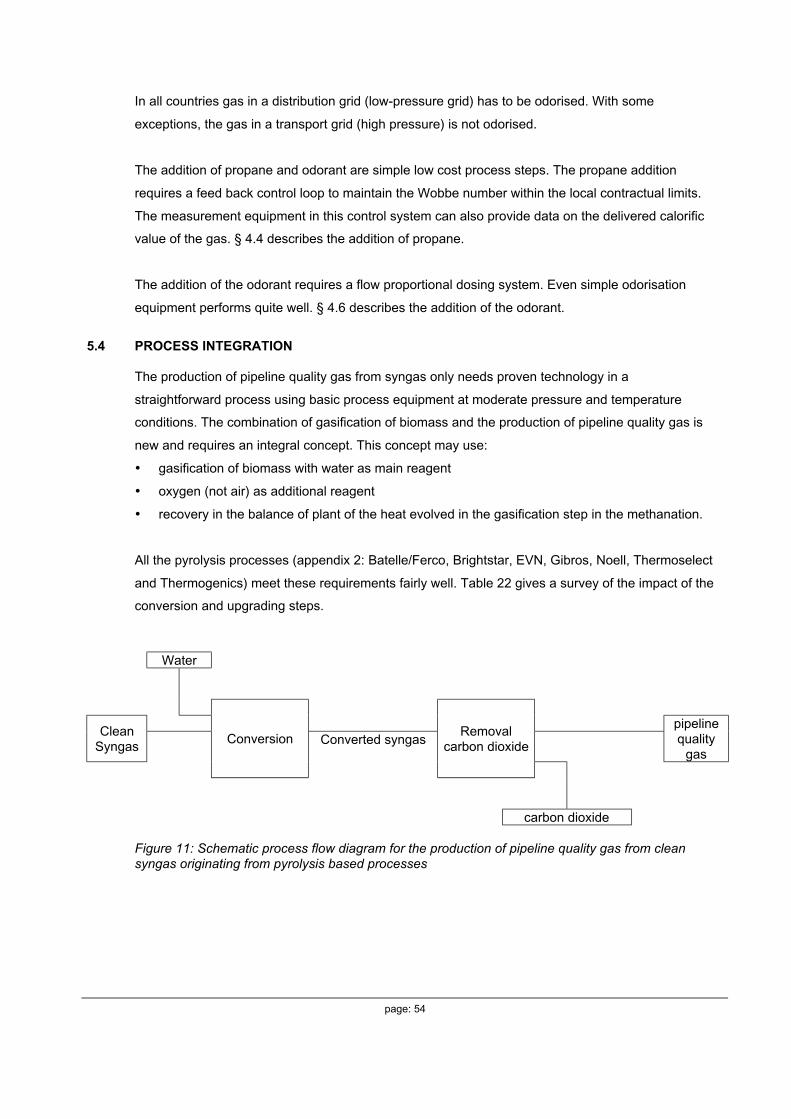
page: 54
In all countries gas in a distribution grid (low-pressure grid) has to be odorised. With some
exceptions, the gas in a transport grid (high pressure) is not odorised.
The addition of propane and odorant are simple low cost process steps. The propane addition
requires a feed back control loop to maintain the Wobbe number within the local contractual limits.
The measurement equipment in this control system can also provide data on the delivered calorific
value of the gas. § 4.4 describes the addition of propane.
The addition of the odorant requires a flow proportional dosing system. Even simple odorisation
equipment performs quite well. § 4.6 describes the addition of the odorant.
5.4 PROCESS INTEGRATION
The production of pipeline quality gas from syngas only needs proven technology in a
straightforward process using basic process equipment at moderate pressure and temperature
conditions. The combination of gasification of biomass and the production of pipeline quality gas is
new and requires an integral concept. This concept may use:
• gasification of biomass with water as main reagent
• oxygen (not air) as additional reagent
• recovery in the balance of plant of the heat evolved in the gasification step in the methanation.
All the pyrolysis processes (appendix 2: Batelle/Ferco, Brightstar, EVN, Gibros, Noell, Thermoselect
and Thermogenics) meet these requirements fairly well. Table 22 gives a survey of the impact of the
conversion and upgrading steps.
Water
CleanSyngas Converted syngas
pipelinequality
gasConversion
Removalcarbon dioxide
carbon dioxide
Figure 11: Schematic process flow diagram for the production of pipeline quality gas from cleansyngas originating from pyrolysis based processes
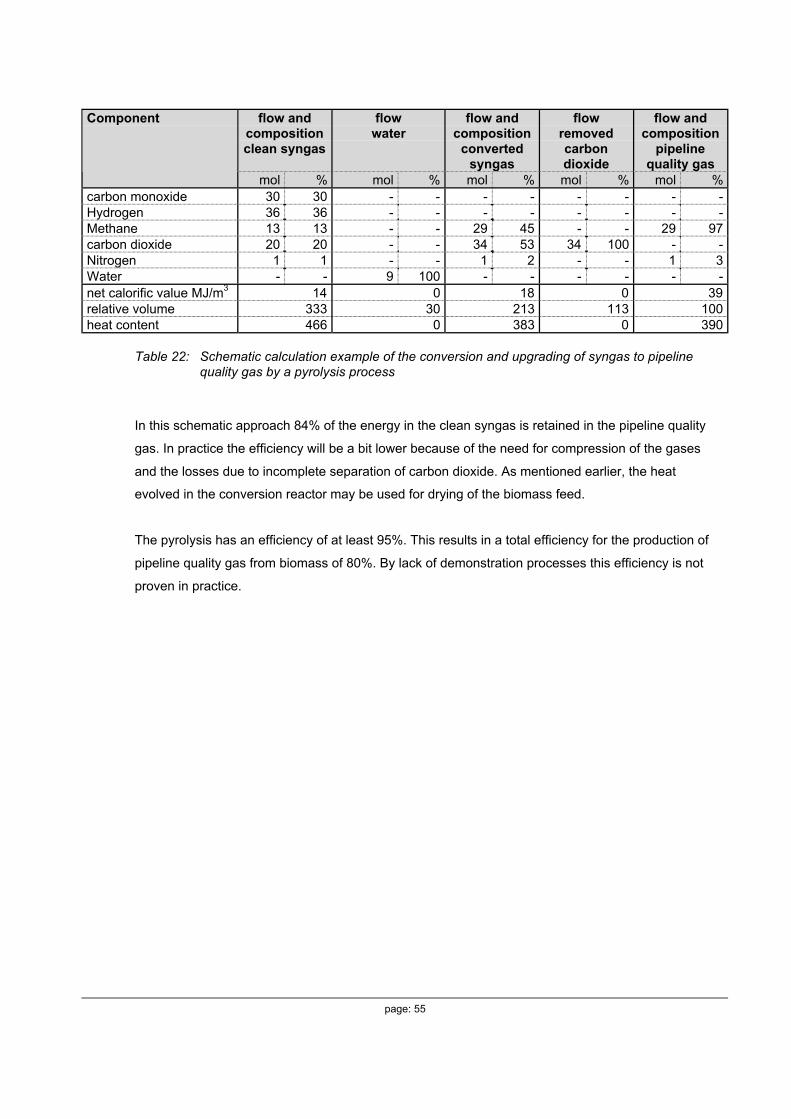
page: 55
flow andcompositionclean syngas
flowwater
flow andcomposition
convertedsyngas
flowremovedcarbondioxide
flow andcomposition
pipelinequality gas
Component
mol % mol % mol % mol % mol %carbon monoxide 30 30 - - - - - - - -Hydrogen 36 36 - - - - - - - -Methane 13 13 - - 29 45 - - 29 97carbon dioxide 20 20 - - 34 53 34 100 - -Nitrogen 1 1 - - 1 2 - - 1 3Water - - 9 100 - - - - - -net calorific value MJ/m3 14 0 18 0 39relative volume 333 30 213 113 100heat content 466 0 383 0 390
Table 22: Schematic calculation example of the conversion and upgrading of syngas to pipelinequality gas by a pyrolysis process
In this schematic approach 84% of the energy in the clean syngas is retained in the pipeline quality
gas. In practice the efficiency will be a bit lower because of the need for compression of the gases
and the losses due to incomplete separation of carbon dioxide. As mentioned earlier, the heat
evolved in the conversion reactor may be used for drying of the biomass feed.
The pyrolysis has an efficiency of at least 95%. This results in a total efficiency for the production of
pipeline quality gas from biomass of 80%. By lack of demonstration processes this efficiency is not
proven in practice.
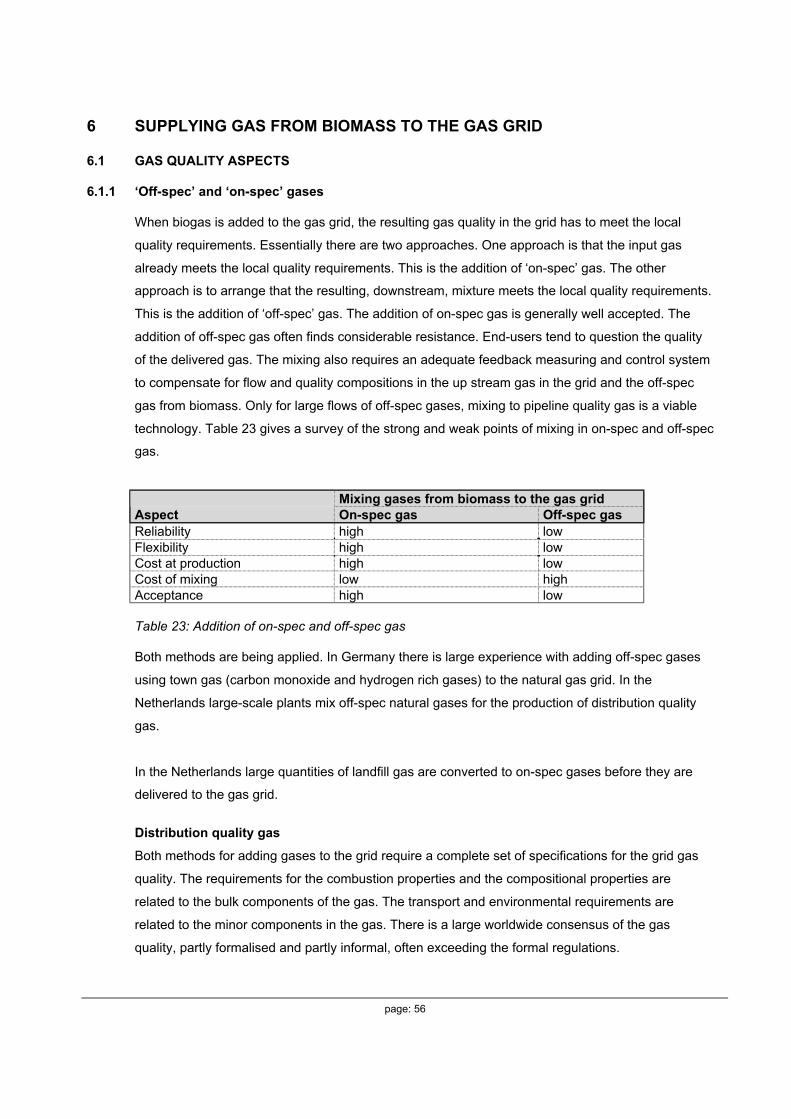
page: 56
6 SUPPLYING GAS FROM BIOMASS TO THE GAS GRID
6.1 GAS QUALITY ASPECTS
6.1.1 ‘Off-spec’ and ‘on-spec’ gases
When biogas is added to the gas grid, the resulting gas quality in the grid has to meet the local
quality requirements. Essentially there are two approaches. One approach is that the input gas
already meets the local quality requirements. This is the addition of ‘on-spec’ gas. The other
approach is to arrange that the resulting, downstream, mixture meets the local quality requirements.
This is the addition of ‘off-spec’ gas. The addition of on-spec gas is generally well accepted. The
addition of off-spec gas often finds considerable resistance. End-users tend to question the quality
of the delivered gas. The mixing also requires an adequate feedback measuring and control system
to compensate for flow and quality compositions in the up stream gas in the grid and the off-spec
gas from biomass. Only for large flows of off-spec gases, mixing to pipeline quality gas is a viable
technology. Table 23 gives a survey of the strong and weak points of mixing in on-spec and off-spec
gas.
Mixing gases from biomass to the gas gridAspect On-spec gas Off-spec gasReliability high lowFlexibility high lowCost at production high lowCost of mixing low highAcceptance high low
Table 23: Addition of on-spec and off-spec gas
Both methods are being applied. In Germany there is large experience with adding off-spec gases
using town gas (carbon monoxide and hydrogen rich gases) to the natural gas grid. In the
Netherlands large-scale plants mix off-spec natural gases for the production of distribution quality
gas.
In the Netherlands large quantities of landfill gas are converted to on-spec gases before they are
delivered to the gas grid.
Distribution quality gas
Both methods for adding gases to the grid require a complete set of specifications for the grid gas
quality. The requirements for the combustion properties and the compositional properties are
related to the bulk components of the gas. The transport and environmental requirements are
related to the minor components in the gas. There is a large worldwide consensus of the gas
quality, partly formalised and partly informal, often exceeding the formal regulations.
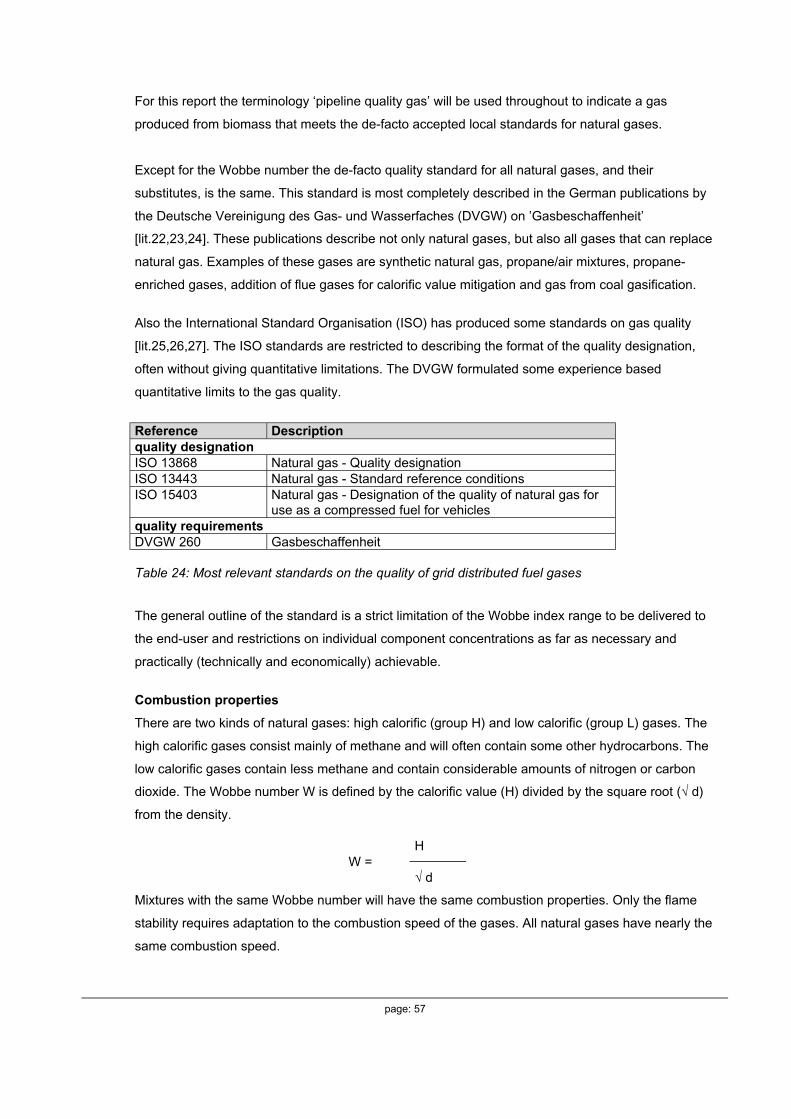
page: 57
For this report the terminology ‘pipeline quality gas’ will be used throughout to indicate a gas
produced from biomass that meets the de-facto accepted local standards for natural gases.
Except for the Wobbe number the de-facto quality standard for all natural gases, and their
substitutes, is the same. This standard is most completely described in the German publications by
the Deutsche Vereinigung des Gas- und Wasserfaches (DVGW) on ’Gasbeschaffenheit’
[lit.22,23,24]. These publications describe not only natural gases, but also all gases that can replace
natural gas. Examples of these gases are synthetic natural gas, propane/air mixtures, propane-
enriched gases, addition of flue gases for calorific value mitigation and gas from coal gasification.
Also the International Standard Organisation (ISO) has produced some standards on gas quality
[lit.25,26,27]. The ISO standards are restricted to describing the format of the quality designation,
often without giving quantitative limitations. The DVGW formulated some experience based
quantitative limits to the gas quality.
Reference Descriptionquality designationISO 13868 Natural gas - Quality designationISO 13443 Natural gas - Standard reference conditionsISO 15403 Natural gas - Designation of the quality of natural gas for
use as a compressed fuel for vehiclesquality requirementsDVGW 260 Gasbeschaffenheit
Table 24: Most relevant standards on the quality of grid distributed fuel gases
The general outline of the standard is a strict limitation of the Wobbe index range to be delivered to
the end-user and restrictions on individual component concentrations as far as necessary and
practically (technically and economically) achievable.
Combustion properties
There are two kinds of natural gases: high calorific (group H) and low calorific (group L) gases. The
high calorific gases consist mainly of methane and will often contain some other hydrocarbons. The
low calorific gases contain less methane and contain considerable amounts of nitrogen or carbon
dioxide. The Wobbe number W is defined by the calorific value (H) divided by the square root (√ d)
from the density.
HW =
√ d
Mixtures with the same Wobbe number will have the same combustion properties. Only the flame
stability requires adaptation to the combustion speed of the gases. All natural gases have nearly the
same combustion speed.
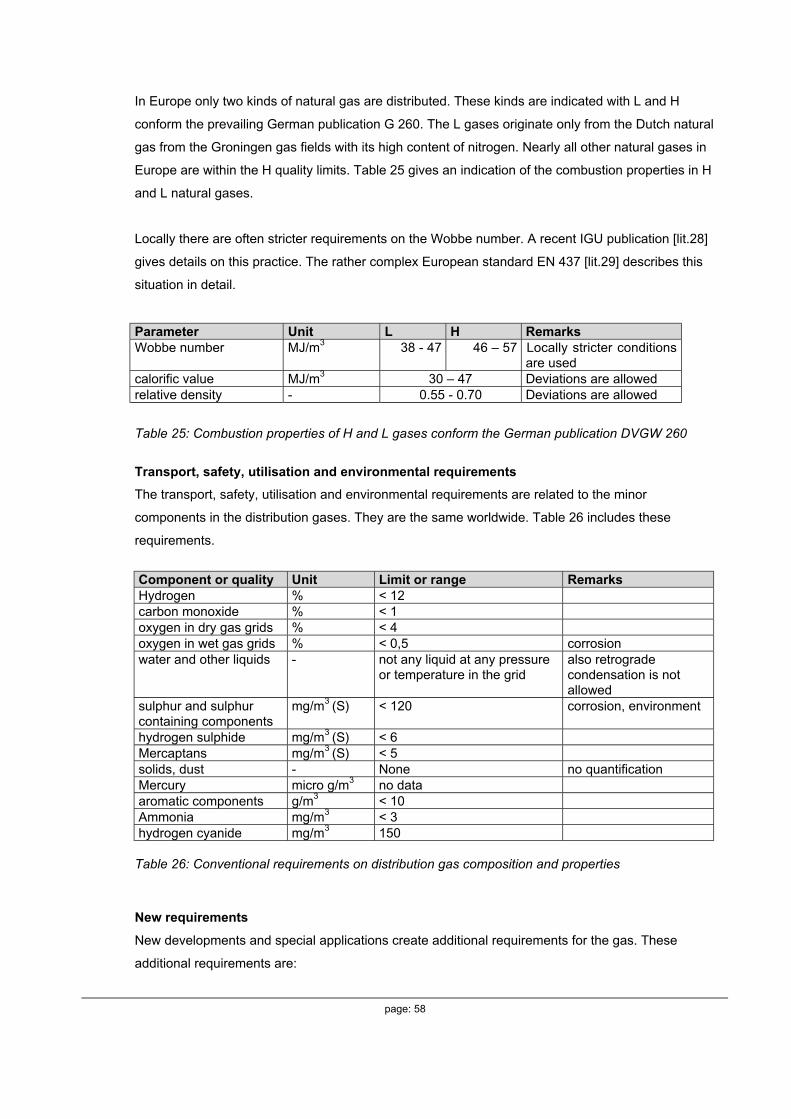
page: 58
In Europe only two kinds of natural gas are distributed. These kinds are indicated with L and H
conform the prevailing German publication G 260. The L gases originate only from the Dutch natural
gas from the Groningen gas fields with its high content of nitrogen. Nearly all other natural gases in
Europe are within the H quality limits. Table 25 gives an indication of the combustion properties in H
and L natural gases.
Locally there are often stricter requirements on the Wobbe number. A recent IGU publication [lit.28]
gives details on this practice. The rather complex European standard EN 437 [lit.29] describes this
situation in detail.
Parameter Unit L H RemarksWobbe number MJ/m3 38 - 47 46 – 57 Locally stricter conditions
are usedcalorific value MJ/m3 30 – 47 Deviations are allowedrelative density - 0.55 - 0.70 Deviations are allowed
Table 25: Combustion properties of H and L gases conform the German publication DVGW 260
Transport, safety, utilisation and environmental requirements
The transport, safety, utilisation and environmental requirements are related to the minor
components in the distribution gases. They are the same worldwide. Table 26 includes these
requirements.
Component or quality Unit Limit or range RemarksHydrogen % < 12carbon monoxide % < 1oxygen in dry gas grids % < 4oxygen in wet gas grids % < 0,5 corrosionwater and other liquids - not any liquid at any pressure
or temperature in the gridalso retrogradecondensation is notallowed
sulphur and sulphurcontaining components
mg/m3 (S) < 120 corrosion, environment
hydrogen sulphide mg/m3 (S) < 6Mercaptans mg/m3 (S) < 5solids, dust - None no quantificationMercury micro g/m3 no dataaromatic components g/m3 < 10Ammonia mg/m3 < 3hydrogen cyanide mg/m3 150
Table 26: Conventional requirements on distribution gas composition and properties
New requirements
New developments and special applications create additional requirements for the gas. These
additional requirements are:
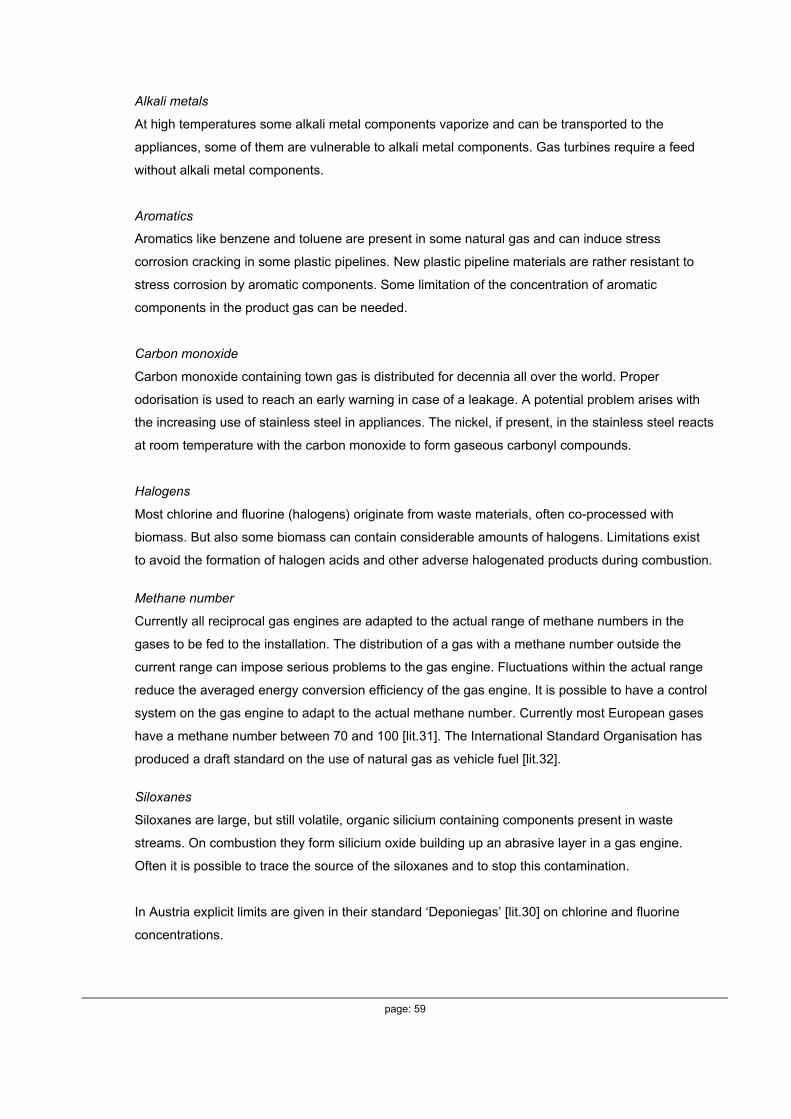
page: 59
Alkali metals
At high temperatures some alkali metal components vaporize and can be transported to the
appliances, some of them are vulnerable to alkali metal components. Gas turbines require a feed
without alkali metal components.
Aromatics
Aromatics like benzene and toluene are present in some natural gas and can induce stress
corrosion cracking in some plastic pipelines. New plastic pipeline materials are rather resistant to
stress corrosion by aromatic components. Some limitation of the concentration of aromatic
components in the product gas can be needed.
Carbon monoxide
Carbon monoxide containing town gas is distributed for decennia all over the world. Proper
odorisation is used to reach an early warning in case of a leakage. A potential problem arises with
the increasing use of stainless steel in appliances. The nickel, if present, in the stainless steel reacts
at room temperature with the carbon monoxide to form gaseous carbonyl compounds.
Halogens
Most chlorine and fluorine (halogens) originate from waste materials, often co-processed with
biomass. But also some biomass can contain considerable amounts of halogens. Limitations exist
to avoid the formation of halogen acids and other adverse halogenated products during combustion.
Methane number
Currently all reciprocal gas engines are adapted to the actual range of methane numbers in the
gases to be fed to the installation. The distribution of a gas with a methane number outside the
current range can impose serious problems to the gas engine. Fluctuations within the actual range
reduce the averaged energy conversion efficiency of the gas engine. It is possible to have a control
system on the gas engine to adapt to the actual methane number. Currently most European gases
have a methane number between 70 and 100 [lit.31]. The International Standard Organisation has
produced a draft standard on the use of natural gas as vehicle fuel [lit.32].
Siloxanes
Siloxanes are large, but still volatile, organic silicium containing components present in waste
streams. On combustion they form silicium oxide building up an abrasive layer in a gas engine.
Often it is possible to trace the source of the siloxanes and to stop this contamination.
In Austria explicit limits are given in their standard ‘Deponiegas’ [lit.30] on chlorine and fluorine
concentrations.
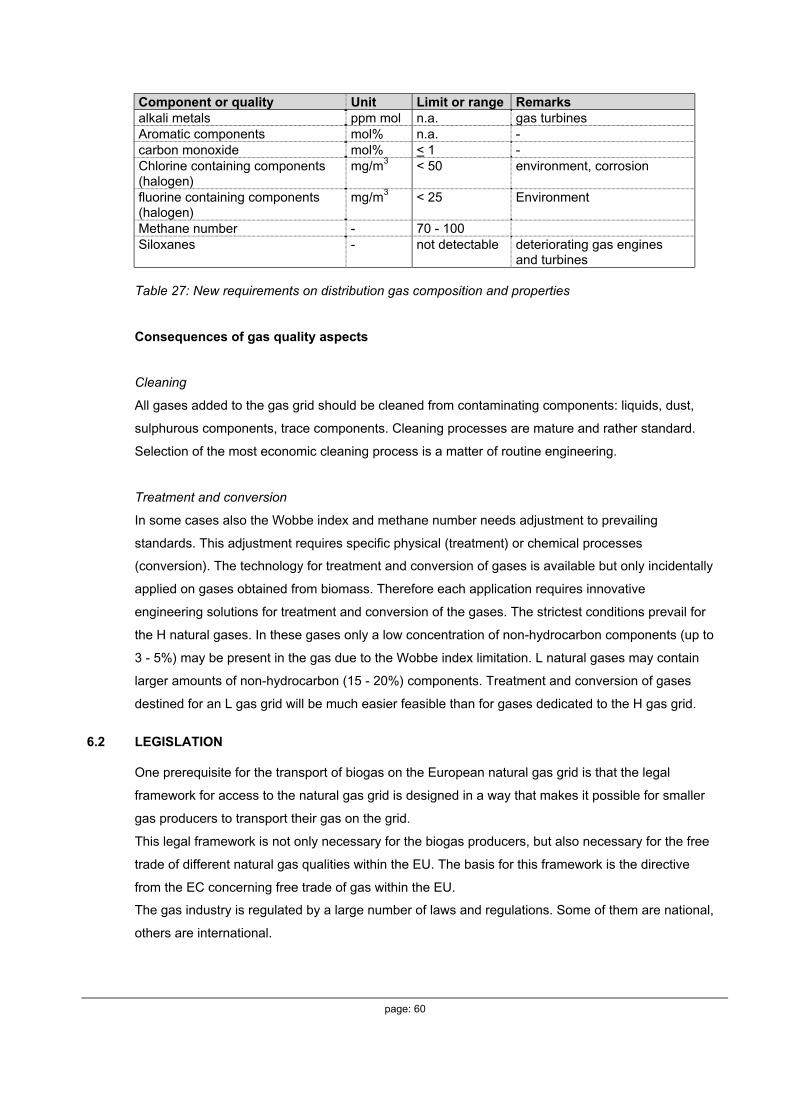
page: 60
Component or quality Unit Limit or range Remarksalkali metals ppm mol n.a. gas turbinesAromatic components mol% n.a. -carbon monoxide mol% < 1 -Chlorine containing components(halogen)
mg/m3 < 50 environment, corrosion
fluorine containing components(halogen)
mg/m3 < 25 Environment
Methane number - 70 - 100Siloxanes - not detectable deteriorating gas engines
and turbines
Table 27: New requirements on distribution gas composition and properties
Consequences of gas quality aspects
Cleaning
All gases added to the gas grid should be cleaned from contaminating components: liquids, dust,
sulphurous components, trace components. Cleaning processes are mature and rather standard.
Selection of the most economic cleaning process is a matter of routine engineering.
Treatment and conversion
In some cases also the Wobbe index and methane number needs adjustment to prevailing
standards. This adjustment requires specific physical (treatment) or chemical processes
(conversion). The technology for treatment and conversion of gases is available but only incidentally
applied on gases obtained from biomass. Therefore each application requires innovative
engineering solutions for treatment and conversion of the gases. The strictest conditions prevail for
the H natural gases. In these gases only a low concentration of non-hydrocarbon components (up to
3 - 5%) may be present in the gas due to the Wobbe index limitation. L natural gases may contain
larger amounts of non-hydrocarbon (15 - 20%) components. Treatment and conversion of gases
destined for an L gas grid will be much easier feasible than for gases dedicated to the H gas grid.
6.2 LEGISLATION
One prerequisite for the transport of biogas on the European natural gas grid is that the legal
framework for access to the natural gas grid is designed in a way that makes it possible for smaller
gas producers to transport their gas on the grid.
This legal framework is not only necessary for the biogas producers, but also necessary for the free
trade of different natural gas qualities within the EU. The basis for this framework is the directive
from the EC concerning free trade of gas within the EU.
The gas industry is regulated by a large number of laws and regulations. Some of them are national,
others are international.

page: 61
The laws and rules that provide the framework for the gas industry can be categorised into rules
controlling:
• Gas trade
• Gas quality to end-user
• Gas quality/quantity measurement
• Gas requirement from safety aspects
6.2.1 Gas trade
The main legal document that provides the framework for the gas trade within the European Union,
is the directive 98/30/EG [lit.33] from the European Commission that was approved by the European
Parliament on the 22nd of June 1998. This directive is now being implemented in the national
legislation in the member countries and should be integrated in the legislation by the year 2000. The
directive is based on the general principle within the EU, i.e. there shall be no obstacles within the
EU prohibiting a free movement of goods, persons, services or capital. The directive states that:
• "The technical framework for operation of gas systems must be clear and provide operation
compatibility."
• "Distribution companies must in no case discriminate users of the system, especially not in
favour of own customers or suppliers to the system."
• "Every distribution company shall provide any other distribution company with sufficient
information in order to ascertain a safe and efficient operation of the interconnected systems."
• "Access to the grid…shall be approved in accordance with national legislation. The legislation
shall be fair and open. The following may be considered: a) The need to reject access where
discrepancies between technical specifications in a reasonable way not may be overcome."
The general intention of the directive 98/30/EG is to provide an open market that does not
discriminate any supplier of gas. An interesting detail in the directive is a lack of definition of natural
gas. The directive not even states that natural gas should be a gas containing mainly methane. This
has been added in some of the national legislation but natural gas is here normally only defined as
"a gas containing mainly methane" which in most cases is also a definition that covers gas from
anaerobic digestion. The definition of natural gas is according to ISO [lit.34] “complex mixture of
hydrocarbons, primarily methane, but generally also including ethane, propane and higher
hydrocarbons in much smaller amounts and some non-combustible gases, such as nitrogen and
carbon dioxide”. Note 4 in the standard states: "Natural gas consists predominantly of methane
(mole fraction greater than 0,712) and has a superior calorific value normally within the range 30
MJ/m3 to 45 MJ/m3". Syngas, for example obtained by thermal gasification of biomass, is thereby
excluded.
12 A mole fraction 0.7 equals closely a volume percentage of 70

page: 62
The directive thus also provides possibilities for new suppliers to enter new markets. The problem
with interoperability of the gas networks within the EU countries has caused the Commission to
study the subject and a final report [lit.35] was ready in 1999. The conclusions from this report
concerning the need for an updated legal framework is cited below:
"The legal framework concerning natural gas transportation, storage and trade is very different
within the EU member states. The range covers strict regulations, monopoly rights for state-owned
companies up to completely deregulated markets. In some countries, regulation of the gas supply is
completely delegated to the gas industry.
To enable interoperability of the networks and to allow third party access, it is essential that some
countries substantially change their legal framework. While these changes in some countries
already have started, others have been granted a deferment due to their classification as emerging
markets."
The general conclusion concerning the development of the legal framework for gas trade within the
EU is that the directive 98/30/EG will make it easier for small gas producers and gas distribution
companies to gain access to the natural gas grid. The lack of definition of natural gas in the directive
(or very wide definition in national legislation) may make it possible for gas from anaerobic digestion
to be transported on the natural gas grid in the future. The pipeline companies or distribution
companies can refuse access to the grid only if technical and administrative problems cannot be
overcome in a reasonable way. Gases containing carbon monoxide and hydrogen and less then
70% methane will probably have more difficulties in gaining access to the grid, being ‘non methane’
gases. For gases containing lower fractions of carbone monoxide and hydrogen it may be more
easy to find access to the grid.
6.2.2 Gas quality to end-user
The gas qualities that are delivered to end-users in Europe vary between different countries and
sometimes even within individual countries. The quality specifications are normally not incorporated
in the legislation but are defined in national and international standards and regulations. The most
used standards and regulations in Europe are based on the European standard EN 437 and the
DVGW 260.
All fuel gases that are distributed in Europe are categorised in three ‘families’. The first comprises
fuel gases with high hydrogen content, e.g. town gases. The second family comprises methane
gases with, for example, natural gas and biogas. The third family comprises liquid gases, e.g.
propane/butane mixtures. The second gas family is divided into two groups L and H according to
Wobbe index.
The standards EN 437 [lit.29] and DVGW 260 [lit.22] are compared to the national regulations for L
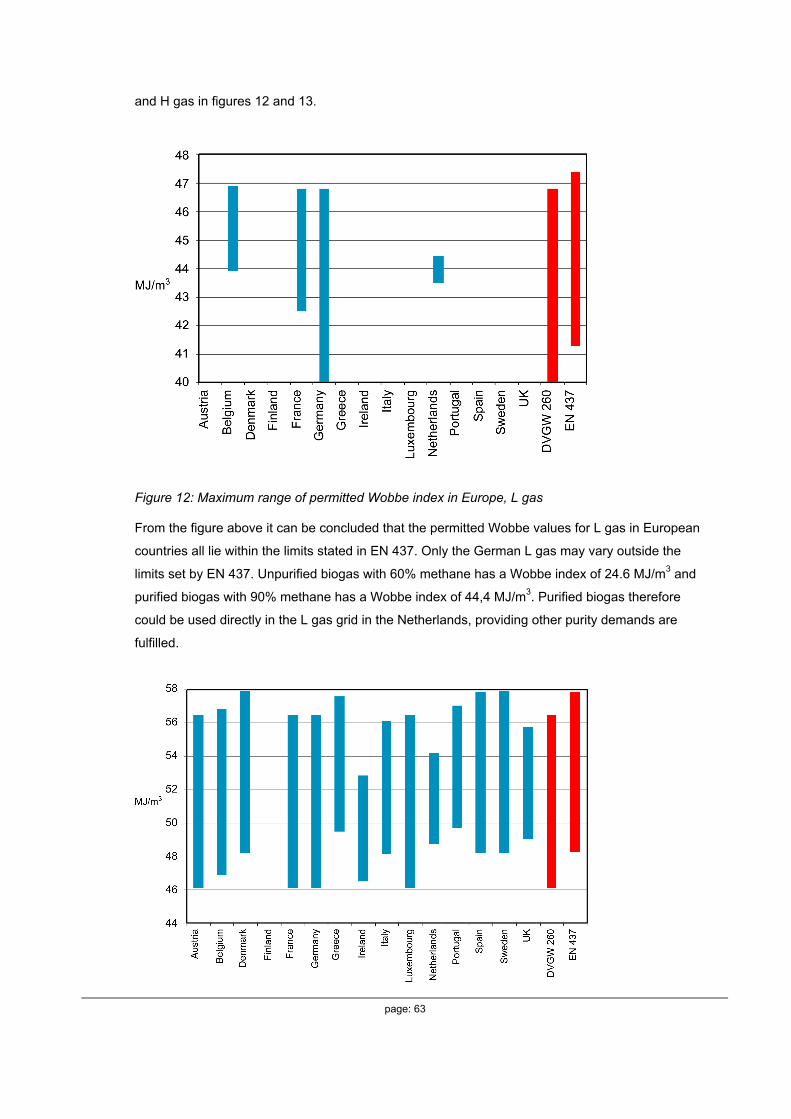
page: 63
and H gas in figures 12 and 13.
Figure 12: Maximum range of permitted Wobbe index in Europe, L gas
From the figure above it can be concluded that the permitted Wobbe values for L gas in European
countries all lie within the limits stated in EN 437. Only the German L gas may vary outside the
limits set by EN 437. Unpurified biogas with 60% methane has a Wobbe index of 24.6 MJ/m3 and
purified biogas with 90% methane has a Wobbe index of 44,4 MJ/m3. Purified biogas therefore
could be used directly in the L gas grid in the Netherlands, providing other purity demands are
fulfilled.
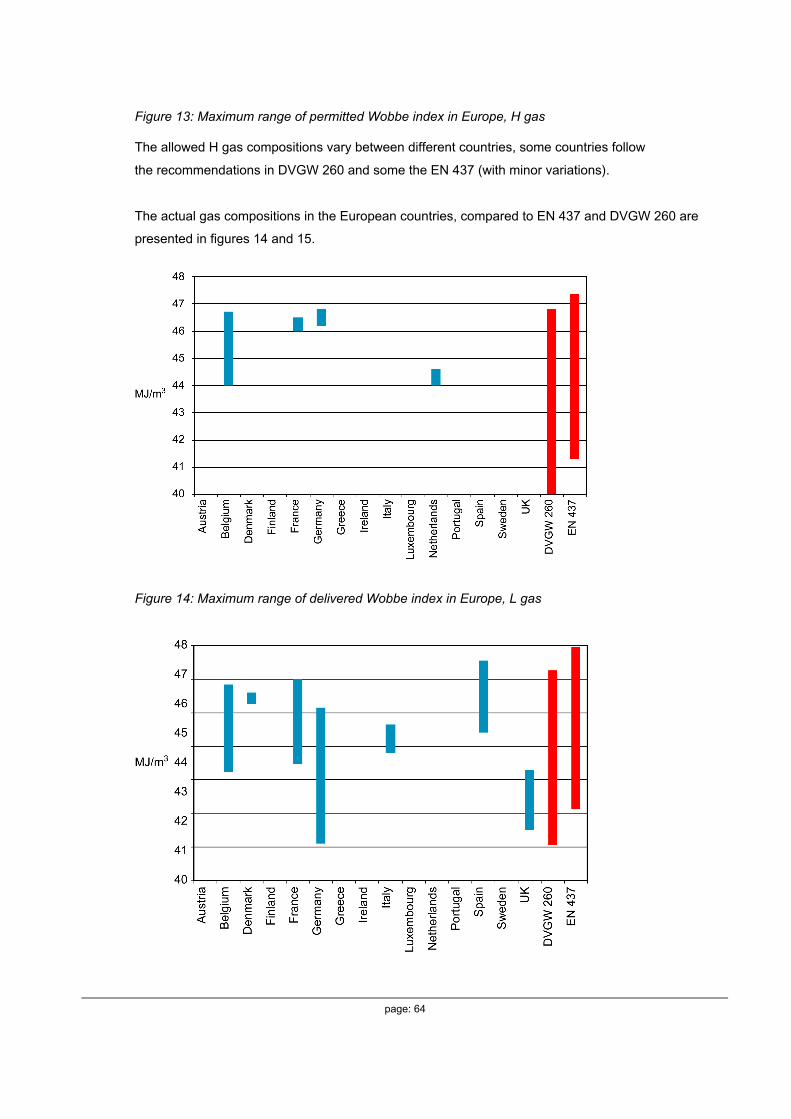
page: 64
Figure 13: Maximum range of permitted Wobbe index in Europe, H gas
The allowed H gas compositions vary between different countries, some countries follow
the recommendations in DVGW 260 and some the EN 437 (with minor variations).
The actual gas compositions in the European countries, compared to EN 437 and DVGW 260 are
presented in figures 14 and 15.
Figure 14: Maximum range of delivered Wobbe index in Europe, L gas
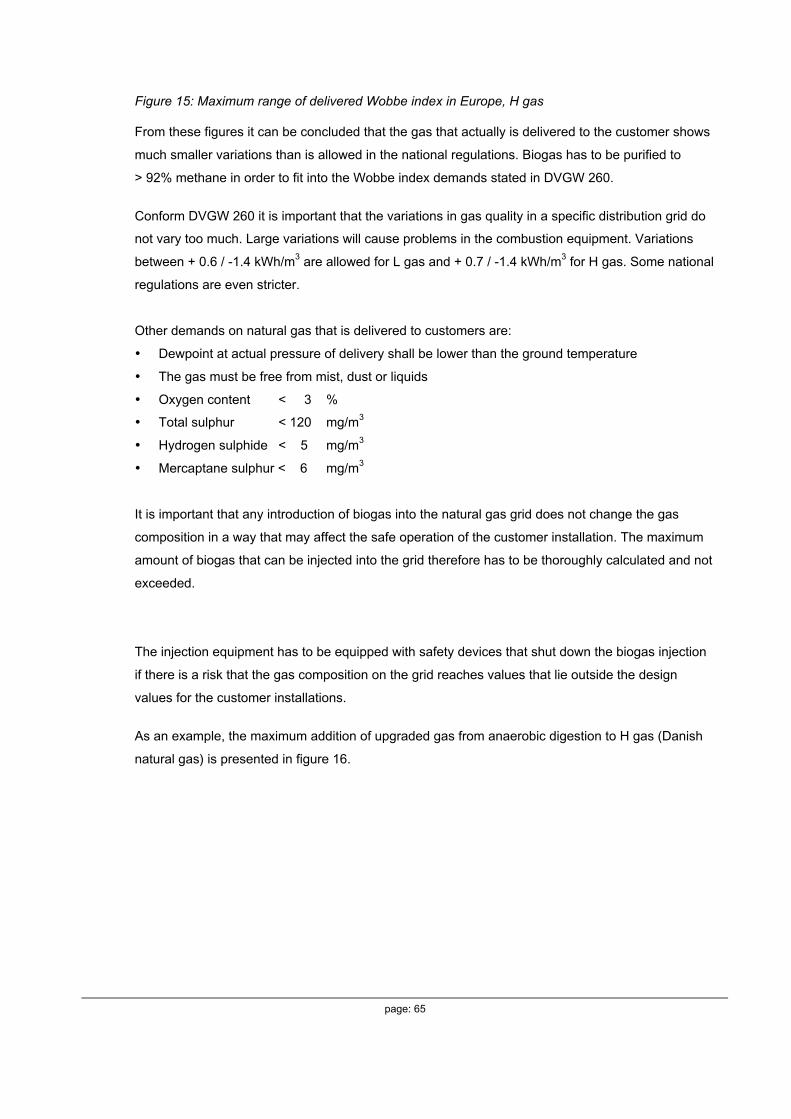
page: 65
Figure 15: Maximum range of delivered Wobbe index in Europe, H gas
From these figures it can be concluded that the gas that actually is delivered to the customer shows
much smaller variations than is allowed in the national regulations. Biogas has to be purified to
> 92% methane in order to fit into the Wobbe index demands stated in DVGW 260.
Conform DVGW 260 it is important that the variations in gas quality in a specific distribution grid do
not vary too much. Large variations will cause problems in the combustion equipment. Variations
between + 0.6 / -1.4 kWh/m3 are allowed for L gas and + 0.7 / -1.4 kWh/m3 for H gas. Some national
regulations are even stricter.
Other demands on natural gas that is delivered to customers are:
• Dewpoint at actual pressure of delivery shall be lower than the ground temperature
• The gas must be free from mist, dust or liquids
• Oxygen content < 3 %
• Total sulphur < 120 mg/m3
• Hydrogen sulphide < 5 mg/m3
• Mercaptane sulphur < 6 mg/m3
It is important that any introduction of biogas into the natural gas grid does not change the gas
composition in a way that may affect the safe operation of the customer installation. The maximum
amount of biogas that can be injected into the grid therefore has to be thoroughly calculated and not
exceeded.
The injection equipment has to be equipped with safety devices that shut down the biogas injection
if there is a risk that the gas composition on the grid reaches values that lie outside the design
values for the customer installations.
As an example, the maximum addition of upgraded gas from anaerobic digestion to H gas (Danish
natural gas) is presented in figure 16.
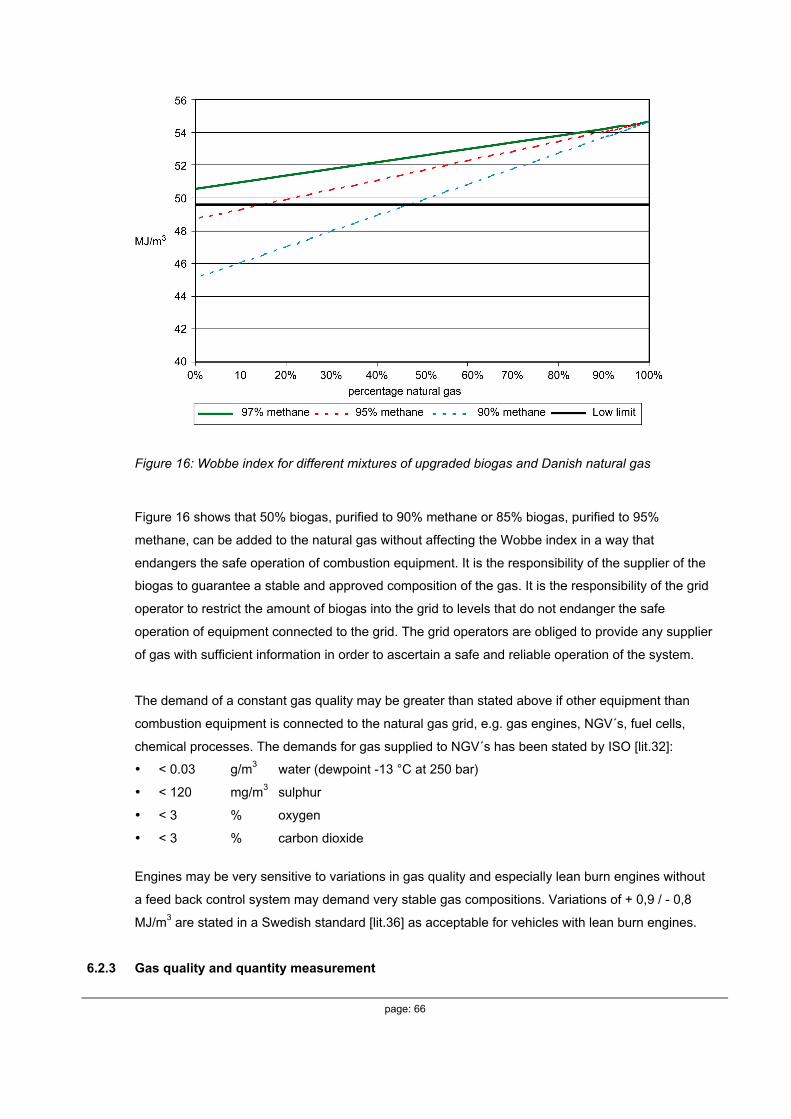
page: 66
Figure 16: Wobbe index for different mixtures of upgraded biogas and Danish natural gas
Figure 16 shows that 50% biogas, purified to 90% methane or 85% biogas, purified to 95%
methane, can be added to the natural gas without affecting the Wobbe index in a way that
endangers the safe operation of combustion equipment. It is the responsibility of the supplier of the
biogas to guarantee a stable and approved composition of the gas. It is the responsibility of the grid
operator to restrict the amount of biogas into the grid to levels that do not endanger the safe
operation of equipment connected to the grid. The grid operators are obliged to provide any supplier
of gas with sufficient information in order to ascertain a safe and reliable operation of the system.
The demand of a constant gas quality may be greater than stated above if other equipment than
combustion equipment is connected to the natural gas grid, e.g. gas engines, NGV´s, fuel cells,
chemical processes. The demands for gas supplied to NGV´s has been stated by ISO [lit.32]:
• < 0.03 g/m3 water (dewpoint -13 °C at 250 bar)
• < 120 mg/m3 sulphur
• < 3 % oxygen
• < 3 % carbon dioxide
Engines may be very sensitive to variations in gas quality and especially lean burn engines without
a feed back control system may demand very stable gas compositions. Variations of + 0,9 / - 0,8
MJ/m3 are stated in a Swedish standard [lit.36] as acceptable for vehicles with lean burn engines.
6.2.3 Gas quality and quantity measurement
page: 67
Biogas that is injected into the natural gas grid will always affect the quality of the gas in the grid
and variations in gas quality will automatically affect the energy measurement accuracy if heating
value and gas flow are not measured simultaneously.
The directive 98/30/EG does however not state the measurement procedure for gas that is
delivered to the grid; this is clarified when the directive is implemented into the national legislation.
Some general principles in the national legislations are:
• The supplier of gas is responsible for the measurement of gas supplied to the grid
• Suppliers of gas must measure the delivered quantity with an accuracy that is stated in the
national legislation. The accuracy is generally expressed as % of the volume flow, not the
energy flow.
• The supplier of gas must report the amount of supplied gas (m3 and kWh) to the grid to the
owner of the grid. Reporting should be performed with an interval stated in the national
legislation, normally once every 24 hours.
• The measurement system that is used to measure the gas that is supplied to the grid should be
calibrated and documented according to national legislation.
The directive 98/30/EG does not state any differences in legislation concerning the measurement of
biogas compared to the measurement of natural gas and it must therefore be assumed that the
same measurement principles should apply to biogas as to natural gas. This will probably make it
difficult for the biogas plant to administrate the measurement and reporting of delivered gas quantity
and quality. These tasks should therefore be handed over to the grid operator or the natural gas
distribution company.
6.2.4 Gas requirement from safety aspects
The gas that is transported in the natural gas grid and used by customers connected to the natural
gas grid must fulfil a number of safety requirements and the most important are linked to the safe
operation of the customer application. These properties are discussed in § 6.2.2. Other gas
properties that must be considered from a safety aspect, are the properties that may affect the safe
operation of the grid, e.g. content of corrosive and erosive components and odorisation of the gas.
All these requirements are generally not quantified in the legislation but belong to a task that the
owner of the grid must fulfil. The legislation states that the owner of the grid is responsible for the
safe operation of the grid and therefore must develop operating procedures and quality assurance
systems that guarantees that no gas that can harm the grid is introduced into the grid. Limits for
specific compounds are generally not included in the legislation, but are stated in the procedures
and standards that are used nationally. In order to make it possible for the grid operator to
guarantee a safe operation of the grid, he has to demand that the quality of the gas is measured
and controlled in a way that ascertains a safe operation of the grid. This task is also better
performed together with (or by) the local owner of the grid (see § 6.2.3).

page: 68
6.2.5 Discrepancies between standards and technical and economical feasibility
All standards and regulations for distribution of gas on the natural gas grid in Europe are developed
for natural gas, even if it is not explicitly expressed. This means that biogas, and especially gas from
thermal gasification may have difficulties in fulfilling the demands in these standards and
specifications and in some cases fulfilment is impossible. This can cause economical and technical
problems for the company that want to introduce biogas into the grid.
There will always be a balance between upgrading costs and market value for the gas. A biogas can
be upgraded to exactly fit the gas composition in the natural gas grid, but the cost for the upgrading
will probably be very high. Less upgrading will result in a product that may not be as valuable on the
market, but on the other hand is less costly to produce.
Wobbe index
One of the basic demands is the Wobbe index. A biogas must generally be upgraded in order to
reach a sufficient Wobbe index to be injected into the natural gas grid without causing too large
disturbances in the natural gas quality. Upgrading costs money and energy and should thus be
minimised. Problems may then occur with the distribution company that will have to deal with a
mixed gas of lower Wobbe index and lower heating value. Fluctuations will occur if the gas quality
and the gas flow are not constant from the biogas plant. These fluctuations may be neglectable if
the natural gas flow is sufficient, but has to be considered when the load is low. There are several
different ways of solving the problem: addition of propane to the biogas, flow control of the biogas
etc. A good co-operation between the biogas plant and the operator of the grid is in all cases a
prerequisite for an economical system design.
Wobbe index may be adjusted by the addition of LPG to the biogas but this addition has to be kept
on a low level in order to avoid condensation of hydrocarbons in the grid and also to keep the cost
for LPG-addition on a low level.
Nitrogen
Nitrogen is a component that may be very costly to remove from biogas if it is present in larger
quantities, such as in gas from air gasification of bio fuels. Current standards do not require the
removal of nitrogen. In case the new standards mention an upper limit for nitrogen, removal may be
done by PSA or membrane technology but these processes are generally not economically feasible.
Oxygen
Oxygen is a compound that normally is not present in gas from gasification or anaerobic digestion,
but in some cases considerable amounts have been found in gas from anaerobic digestion where
air leaks have been detected in the digester or in the biogas system. Oxygen can be removed in a
similar way as nitrogen, but the best way avoiding oxygen in the biogas, is to equip the digestion
process with a process supervision- and control system that automatically shuts down the system if
page: 69
an oxygen leak is detected. This requirement is often also set by the national legislation, in order to
avoid explosions in digestion reactors.
Gas quality measurement- and data acquisition systems
Gas quality measurement- and data acquisition systems are necessary to check and report the
delivered gas quantity and quality to the grid operator. These systems may be costly for a small
supplier of gas and it is therefore recommended that these systems are standardised and integrated
with the systems operated by the grid operator.
6.2.6 ‘Responsible Bodies’ for gas quality
The European legislation generally states that the operator of the grid is responsible for the safe
operation of the grid and he thereby has to set the standards for the gas that is introduced into the
grid. The grid operator is also responsible for the quality of the gas in the grid. The demands on gas
quality is then further specified by the national authorities that control the natural gas sector in the
individual countries and these demands vary between rather detailed definitions of the natural gas
quality to definitions like "gas containing mainly methane".
The European body that handles the discussions within the gas industry about gas quality
questions, is Marcogaz. Twelve European countries are represented in Marcogaz and the work
within Marcogaz is performed within three different committees. It is important that the partners
within Marcogaz bring up the discussion on how to handle biogas injection into the grid. This is
however a matter that must be co-ordinated with the organisations producing biogas or representing
the biogas industry. It may be feasible to set up a joint working group with representatives from the
biogas industry and the natural gas industry to draw up a proposal for standards that can be used
within the European countries. These standards should include recommendations for:
• quality assurance systems for biogas injection
• measurement procedures for biogas injection
• quality requirements for biogas injected into natural gas grids.
These recommendations can then be discussed in CEN/TC 234 ‘Gas supply’ in order to form
European guidelines for the handling of biogases on the natural gas grid.
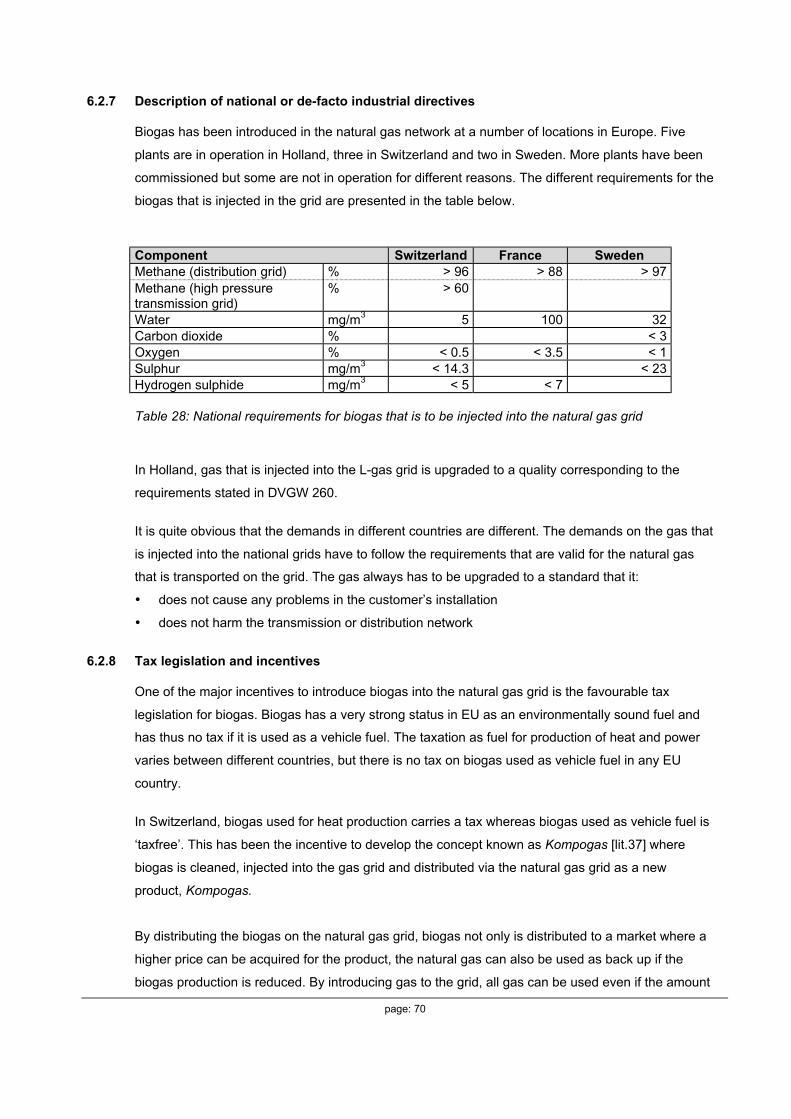
page: 70
6.2.7 Description of national or de-facto industrial directives
Biogas has been introduced in the natural gas network at a number of locations in Europe. Five
plants are in operation in Holland, three in Switzerland and two in Sweden. More plants have been
commissioned but some are not in operation for different reasons. The different requirements for the
biogas that is injected in the grid are presented in the table below.
Component Switzerland France SwedenMethane (distribution grid) % > 96 > 88 > 97Methane (high pressuretransmission grid)
% > 60
Water mg/m3 5 100 32Carbon dioxide % < 3Oxygen % < 0.5 < 3.5 < 1Sulphur mg/m3 < 14.3 < 23Hydrogen sulphide mg/m3 < 5 < 7
Table 28: National requirements for biogas that is to be injected into the natural gas grid
In Holland, gas that is injected into the L-gas grid is upgraded to a quality corresponding to the
requirements stated in DVGW 260.
It is quite obvious that the demands in different countries are different. The demands on the gas that
is injected into the national grids have to follow the requirements that are valid for the natural gas
that is transported on the grid. The gas always has to be upgraded to a standard that it:
• does not cause any problems in the customer’s installation
• does not harm the transmission or distribution network
6.2.8 Tax legislation and incentives
One of the major incentives to introduce biogas into the natural gas grid is the favourable tax
legislation for biogas. Biogas has a very strong status in EU as an environmentally sound fuel and
has thus no tax if it is used as a vehicle fuel. The taxation as fuel for production of heat and power
varies between different countries, but there is no tax on biogas used as vehicle fuel in any EU
country.
In Switzerland, biogas used for heat production carries a tax whereas biogas used as vehicle fuel is
‘taxfree’. This has been the incentive to develop the concept known as Kompogas [lit.37] where
biogas is cleaned, injected into the gas grid and distributed via the natural gas grid as a new
product, Kompogas.
By distributing the biogas on the natural gas grid, biogas not only is distributed to a market where a
higher price can be acquired for the product, the natural gas can also be used as back up if the
biogas production is reduced. By introducing gas to the grid, all gas can be used even if the amount

page: 71
exceeds the consumption near the location of the production. Similar systems are applied in
Sweden. In Gothenburg, unpurified biogas is injected into the town gas grid, which normally is
supplied from a mixing station where natural gas and air is mixed to town gas specifications.
The Wobbe index of the biogas and the town gas is almost the same and the biogas therefore does
not have to be upgraded. An amount of natural gas, corresponding to the energy input from biogas
into the town gas, is distributed from the natural gas grid as vehicle fuel. This gas then can be
distributed without taxes as long as the corresponding amount of biogas (on a yearly basis) is
injected in the town gas grid.
6.3 CONTROL AND MEASUREMENT
6.3.1 Gas industry organisation on control and measurement
In the natural gas transport and distribution industry it is common practice that the supplier takes all
responsibilities on control and measurement activities on the supplied gas. Detailed agreements
form the basis of this understanding, covering essentially the control of the minimum quality of the
gas and the measurement of the energy amount delivered.
In most cases a gas that moves from source to end-user changes from ownership. At the point
where the custody transfer takes place the gas should have the agreed quality. There will also be a
correlation between delivered energy and the money paid for the gas. The custody transfer takes
place between producer and the transport company, at national borders, between transporting and
distributing companies or between suppliers and end-users.
Quality measurements are performed as far as possible upstream, thereby reducing the number of
measurements as much as possible. Energy flow measurements are mostly performed at the points
of custody transfer.
6.3.2 Quality control
Due to the dispersed location of biogas production, plants will be quite small. To reduce the
instrumentation cost, the process control and gas quality measurements are often combined. Figure
17 shows the typical design of the instrumentation for a biogas production plant. A single set of
instruments performs three tasks: process control, shut of and flaring of off-spec gases and the
quality control of the delivered gas.
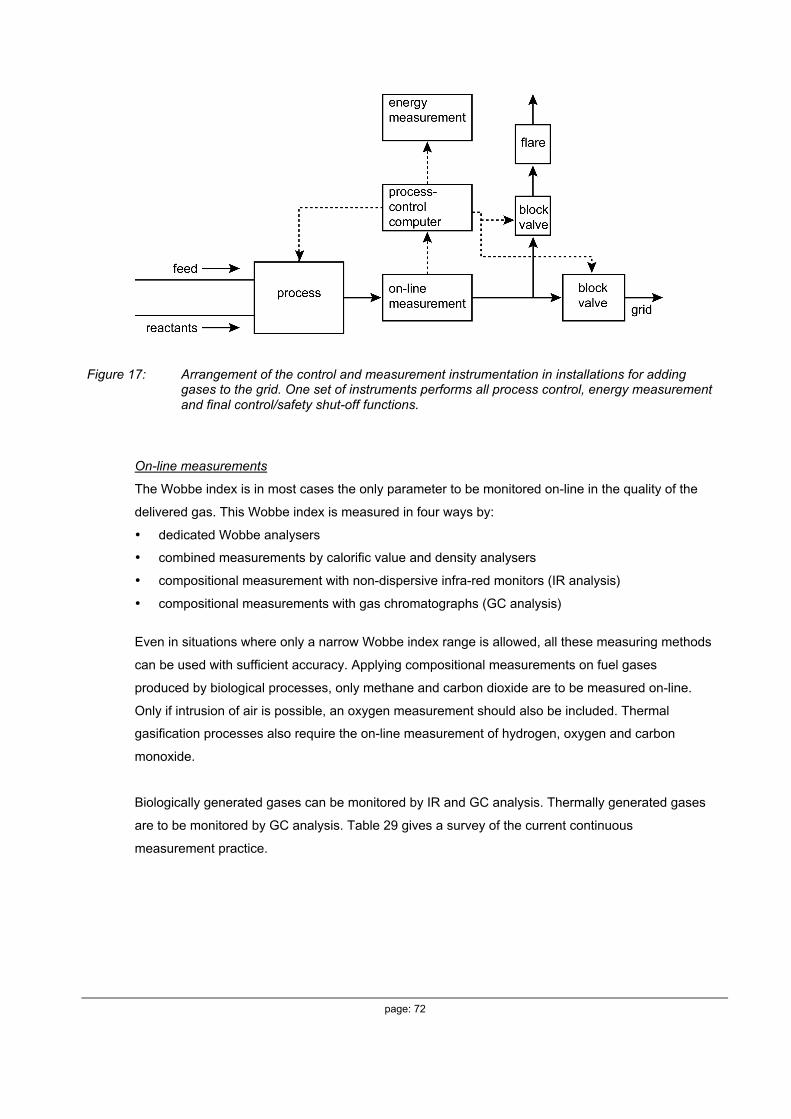
page: 72
Figure 17: Arrangement of the control and measurement instrumentation in installations for addinggases to the grid. One set of instruments performs all process control, energy measurementand final control/safety shut-off functions.
On-line measurements
The Wobbe index is in most cases the only parameter to be monitored on-line in the quality of the
delivered gas. This Wobbe index is measured in four ways by:
• dedicated Wobbe analysers
• combined measurements by calorific value and density analysers
• compositional measurement with non-dispersive infra-red monitors (IR analysis)
• compositional measurements with gas chromatographs (GC analysis)
Even in situations where only a narrow Wobbe index range is allowed, all these measuring methods
can be used with sufficient accuracy. Applying compositional measurements on fuel gases
produced by biological processes, only methane and carbon dioxide are to be measured on-line.
Only if intrusion of air is possible, an oxygen measurement should also be included. Thermal
gasification processes also require the on-line measurement of hydrogen, oxygen and carbon
monoxide.
Biologically generated gases can be monitored by IR and GC analysis. Thermally generated gases
are to be monitored by GC analysis. Table 29 gives a survey of the current continuous
measurement practice.

page: 73
Measuring methodUnit Typical
accuracyRemarks
Continuous Wobbe indexmeasurement
MJ/m3 0.4% On-line Wobbe meters arebecoming obsolete. Some low costmeasuring systems use Wobbemeters.Combined with on-line densitymeasurement they provide calorificvalues.
Continuous calorific valueMeasurement
MJ/m3 0.4% On-line calorific value measurementequipment is becoming obsolete.Some large transport pipelines arestill metered by direct recordingcalorimeters.
Continuous relative densitymeasurement
- 0.4% On-line density meters are availableand quite versatile.
IR analysis: composition,calorific value, density andmethane numberCalculation from composition
mol% 2% relativeoncomposition
Typical components measured:methane, carbon monoxide, andcarbon dioxide.
Not measured by IR analysis:hydrogen, nitrogen and oxygen
GC analysis: composition,calorific value, density andmethane numberCalculation from composition
mol% 1% relativeoncomposition
Frequent but discontinuouscompositional measurements
Oxygen mol% 10% relativeoncomposition
In some processes oxygenmeasurements are essential for theprocess control.
Water dewpoint °C +/- 2 °C Accuracy only essential nearcontract limit (typical - 8 °C at 4 bar)values.
Table 29: On-line measurements applied in the process and quality control of gases obtained frombiomass
Spot checks
Other quality parameters are controlled by spot checks in a frequency depending on the expected
variations in the feedstock and the design of the conversion installation.
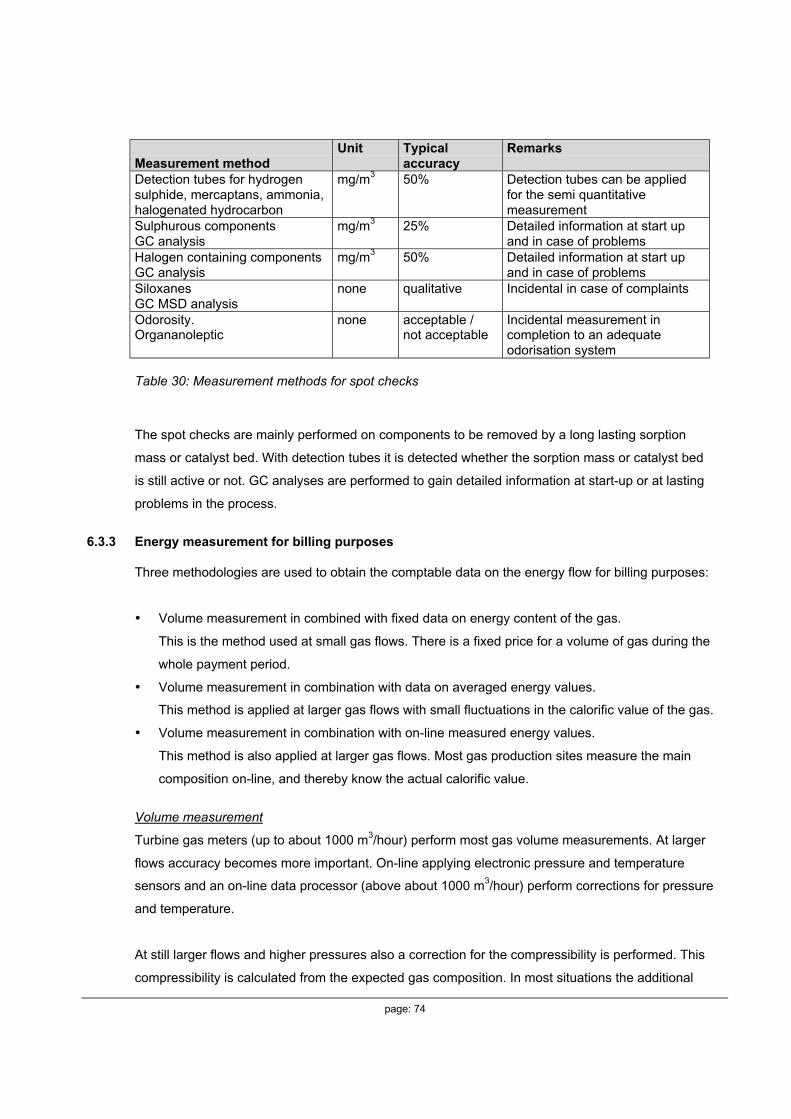
page: 74
Measurement methodUnit Typical
accuracyRemarks
Detection tubes for hydrogensulphide, mercaptans, ammonia,halogenated hydrocarbon
mg/m3 50% Detection tubes can be appliedfor the semi quantitativemeasurement
Sulphurous componentsGC analysis
mg/m3 25% Detailed information at start upand in case of problems
Halogen containing componentsGC analysis
mg/m3 50% Detailed information at start upand in case of problems
SiloxanesGC MSD analysis
none qualitative Incidental in case of complaints
Odorosity.Organanoleptic
none acceptable /not acceptable
Incidental measurement incompletion to an adequateodorisation system
Table 30: Measurement methods for spot checks
The spot checks are mainly performed on components to be removed by a long lasting sorption
mass or catalyst bed. With detection tubes it is detected whether the sorption mass or catalyst bed
is still active or not. GC analyses are performed to gain detailed information at start-up or at lasting
problems in the process.
6.3.3 Energy measurement for billing purposes
Three methodologies are used to obtain the comptable data on the energy flow for billing purposes:
• Volume measurement in combined with fixed data on energy content of the gas.
This is the method used at small gas flows. There is a fixed price for a volume of gas during the
whole payment period.
• Volume measurement in combination with data on averaged energy values.
This method is applied at larger gas flows with small fluctuations in the calorific value of the gas.
• Volume measurement in combination with on-line measured energy values.
This method is also applied at larger gas flows. Most gas production sites measure the main
composition on-line, and thereby know the actual calorific value.
Volume measurement
Turbine gas meters (up to about 1000 m3/hour) perform most gas volume measurements. At larger
flows accuracy becomes more important. On-line applying electronic pressure and temperature
sensors and an on-line data processor (above about 1000 m3/hour) perform corrections for pressure
and temperature.
At still larger flows and higher pressures also a correction for the compressibility is performed. This
compressibility is calculated from the expected gas composition. In most situations the additional
page: 75
compressibility data are provided once a month by setting switches connected to the data processor
(‘flow computer’).
Only at very high gas flows (about above 100,000 m3/hour) an on-line signal is provided to the data
processor. These data can be supplied by the central control post, or derived from local
compositional measurements.
Energy measurement
The energy content of the gas is obtained by on-line calorimeters or calculated from compositional
data obtained by IR or GC analysis. Since compositional data are already indispensable for the
process control, calorimeters are becoming obsolete.
6.3.4 Standards and regulations
The measurement methods are described in a large array of national and international standards.
All measurements for the custody transfer (e.g. volume flow, calorific value, composition analysis,
and calculation methods) are standardised by the International Standard Organisation (ISO). The
determination of the other parameters is partly described in ISO standards. Most of the remaining
determinations are described in DIN or ASTM standards. Table 31 lists the most important
standards on gas quality control.
Particles and impurities
The gas that is injected into the grid must be ‘technically free’ from impurities and particles. The
term ‘technically free’ means that the gas must be upgraded to a quality that does not cause any
operation problems if it used in certified equipment. It is difficult to set any limits for impurities and
particles since these parameters often are very difficult to measure. Therefore in some cases a
filtration of the gas is prescribed and the mesh size of the filter is defined. In the Swedish standard
for biogas as vehicle fuel, a filter with maximum 5 micron mesh size is prescribed and this filter must
be placed as close as possible to the point of injection.
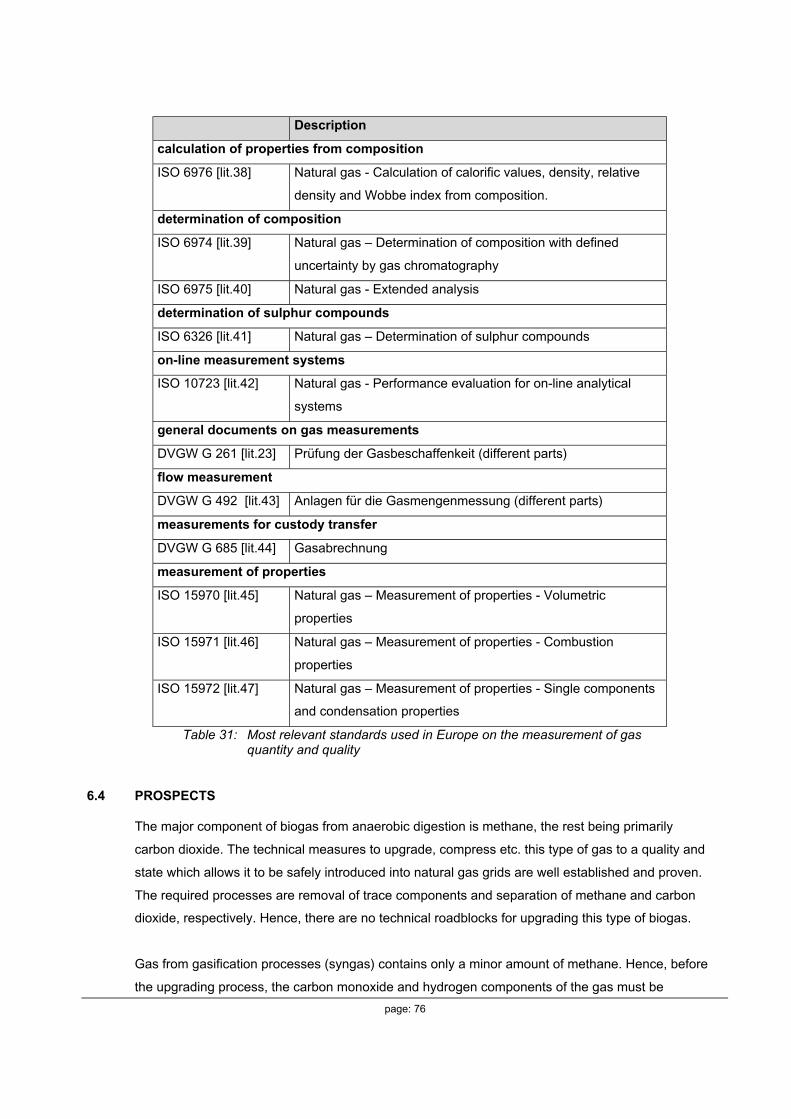
page: 76
Description
calculation of properties from composition
ISO 6976 [lit.38] Natural gas - Calculation of calorific values, density, relative
density and Wobbe index from composition.
determination of composition
ISO 6974 [lit.39] Natural gas – Determination of composition with defined
uncertainty by gas chromatography
ISO 6975 [lit.40] Natural gas - Extended analysis
determination of sulphur compounds
ISO 6326 [lit.41] Natural gas – Determination of sulphur compounds
on-line measurement systems
ISO 10723 [lit.42] Natural gas - Performance evaluation for on-line analytical
systems
general documents on gas measurements
DVGW G 261 [lit.23] Prüfung der Gasbeschaffenkeit (different parts)
flow measurement
DVGW G 492 [lit.43] Anlagen für die Gasmengenmessung (different parts)
measurements for custody transfer
DVGW G 685 [lit.44] Gasabrechnung
measurement of properties
ISO 15970 [lit.45] Natural gas – Measurement of properties - Volumetric
properties
ISO 15971 [lit.46] Natural gas – Measurement of properties - Combustion
properties
ISO 15972 [lit.47] Natural gas – Measurement of properties - Single components
and condensation properties
Table 31: Most relevant standards used in Europe on the measurement of gasquantity and quality
6.4 PROSPECTS
The major component of biogas from anaerobic digestion is methane, the rest being primarily
carbon dioxide. The technical measures to upgrade, compress etc. this type of gas to a quality and
state which allows it to be safely introduced into natural gas grids are well established and proven.
The required processes are removal of trace components and separation of methane and carbon
dioxide, respectively. Hence, there are no technical roadblocks for upgrading this type of biogas.
Gas from gasification processes (syngas) contains only a minor amount of methane. Hence, before
the upgrading process, the carbon monoxide and hydrogen components of the gas must be
page: 77
converted to a methane rich gas. After the conversion, the gas can be upgraded with the same
processes as gas from anaerobic digestion. All of the required sub-processes of converting syngas
to pipeline quality gas are well established, but the entire process has not yet been demonstrated.
Demonstration of this concept is required to pave the way for a future development towards its
utilisation.
The profitability of biogas introduction into the natural gas grid depends on a large number of
parameters like: operating costs and investment of the upgrading plant; the added value (selling
price) of the upgraded gas; taxation policy; subsidies; and alternative options for utilisation of the
biogas (boiler, CHP, use in separate gas networks etc.). The possible lack of an economic incentive
might be one of the major roadblocks for a substantial utilisation of biogas introduction into the
natural gas grid, since alternative options for utilisation in many cases will be more profitable.
Taxation and subsidisation are possible tools to promote biogas introduction into the natural gas
grid.
Reluctance from gas customers against gas originating from e.g. landfills, sewage or manure is a
potential roadblock for adding upgraded gas to natural gas grids. The reluctance can be based on
technical or emotional arguments from e.g. private consumers using the gas in stoves, or industrial
clients using the gas for e.g. food production.
Biogas introduction into the natural gas grid requires that the biogas production is located near a
gas pipeline. Transportation of the feedstock, of which the biogas is produced, over large distances
is not suitable for economic and environmental reasons. A major share of the potential biogas
production is based on manure and waste products from the agricultural industry. Due to the nature
of this industry, the biogas production is often located in sparsely populated areas, which means
that introduction of biogas from these sources in significant volumes requires a widely distributed
natural gas grid, which is not present in all European countries.
Even in cases where biogas introduction into the natural gas grid will the best option of utilisation for
the biogas plant, the incentive of the owner/operator of the natural gas grid might not be present.
Missing regulation and legislation of access rights, transparent methods to calculate the network
operator’s costs etc. can also inhibit biogas introduction in some cases.
In order to promote investments in biogas upgrading plants there is a need to establish clear
guidelines and regulations for the rights and obligations for the involved organisations, including the
owners of the upgrading plants, grid owners, customers (who buy the upgraded gas) etc. These
measures are seen as parallel to the similar regulation for introduction of ‘green’ electricity to the
power grid.

page: 78
The possibility of adding off-spec gas to the grid lowers the upgrading costs significantly, and
therefore promotes upgrading. However, off-spec delivery requires gas quality tracking and a close
communication between the upgrading plant operator and the grid owner. Therefore, off-spec
delivery is most suitable when the upgrading plant is owned and operated by the grid owner.
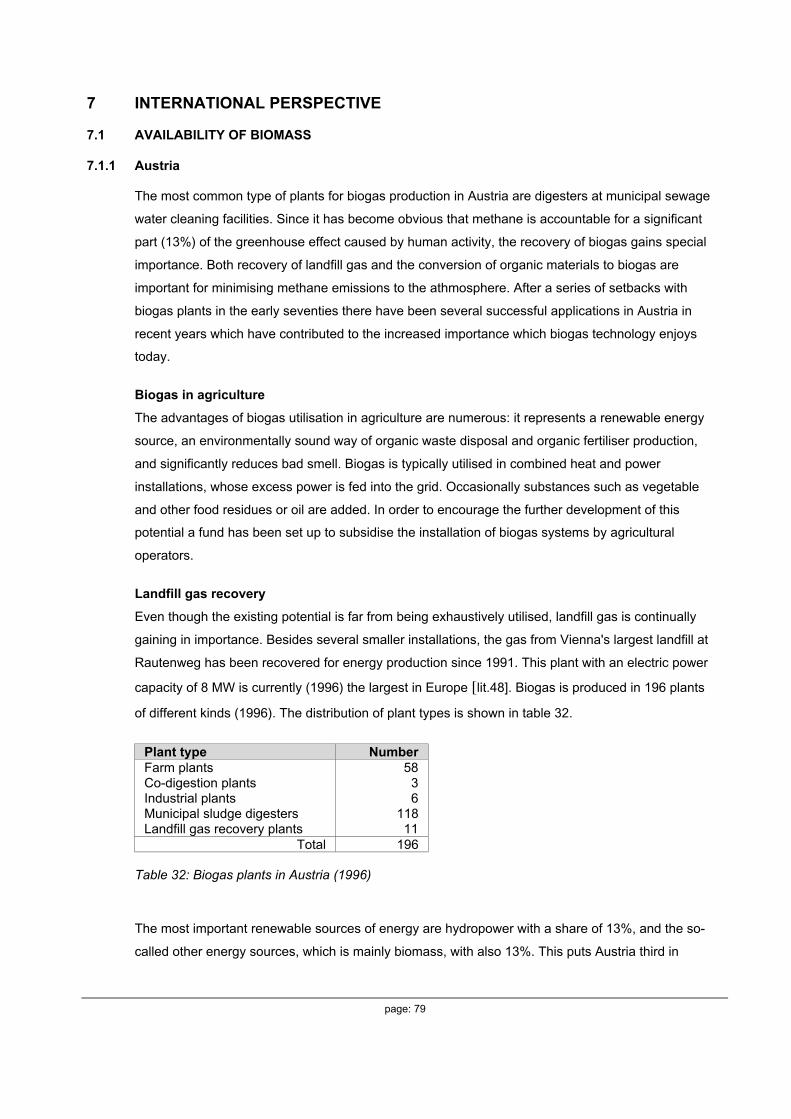
page: 79
7 INTERNATIONAL PERSPECTIVE
7.1 AVAILABILITY OF BIOMASS
7.1.1 Austria
The most common type of plants for biogas production in Austria are digesters at municipal sewage
water cleaning facilities. Since it has become obvious that methane is accountable for a significant
part (13%) of the greenhouse effect caused by human activity, the recovery of biogas gains special
importance. Both recovery of landfill gas and the conversion of organic materials to biogas are
important for minimising methane emissions to the athmosphere. After a series of setbacks with
biogas plants in the early seventies there have been several successful applications in Austria in
recent years which have contributed to the increased importance which biogas technology enjoys
today.
Biogas in agriculture
The advantages of biogas utilisation in agriculture are numerous: it represents a renewable energy
source, an environmentally sound way of organic waste disposal and organic fertiliser production,
and significantly reduces bad smell. Biogas is typically utilised in combined heat and power
installations, whose excess power is fed into the grid. Occasionally substances such as vegetable
and other food residues or oil are added. In order to encourage the further development of this
potential a fund has been set up to subsidise the installation of biogas systems by agricultural
operators.
Landfill gas recovery
Even though the existing potential is far from being exhaustively utilised, landfill gas is continually
gaining in importance. Besides several smaller installations, the gas from Vienna's largest landfill at
Rautenweg has been recovered for energy production since 1991. This plant with an electric power
capacity of 8 MW is currently (1996) the largest in Europe [lit.48]. Biogas is produced in 196 plants
of different kinds (1996). The distribution of plant types is shown in table 32.
Plant type NumberFarm plants 58Co-digestion plants 3Industrial plants 6Municipal sludge digesters 118Landfill gas recovery plants 11
Total 196
Table 32: Biogas plants in Austria (1996)
The most important renewable sources of energy are hydropower with a share of 13%, and the so-
called other energy sources, which is mainly biomass, with also 13%. This puts Austria third in

page: 80
Europe among countries relying on environmentally sound energy sources. Within the European
Union only Finland and Sweden exceed Austria in the proportion of biomass used.
Nearly 50% of the land area in Austria is forest and the amount of biomass per capita is very high.
Biomass is widely used and the potential for biomass utilisation is increasing. The cost of wood
chips in Austria is about 0.025 €/kWh.
Resource
Production 2000
PJ/year
Productionpotential 2005
PJ/yearLandfill gas, biogas 2 18Wood residues 26 46Black liquors 18 20Fire wood 95 95Straw 1 2Sewage sludge, household wastes 8 14Energy crops - 15
Total biomass 150 210
Table 33: Biomass potential in Austria
The total biomass potential for Austria, based on annual growth and available collecting methods, is
estimated at 692 PJ/year. This should be compared to the total energy consumption for Austria,
which in 1995 was 1286 PJ. The total amount of imported energy, mainly as oil, was 829 PJ. Only
0.3 PJ of biomass was imported. The distribution of types of land for biomass production is shown in
table 34.
Type of landBiomass potential
PJ/yearForests 219Farmland 173Meadows and greenlands 300
Total 692
Table 34: Biomass potential from different land types in Austria
Utilisation2005PJ/year
Residential heating 134District heating 17Industry 27Condensing power 13Automotive fuels 4Total 195
Table 35: Utilisation potentials of biomass in Austria for 2005 (not including sewage sludge andhousehold wastes)
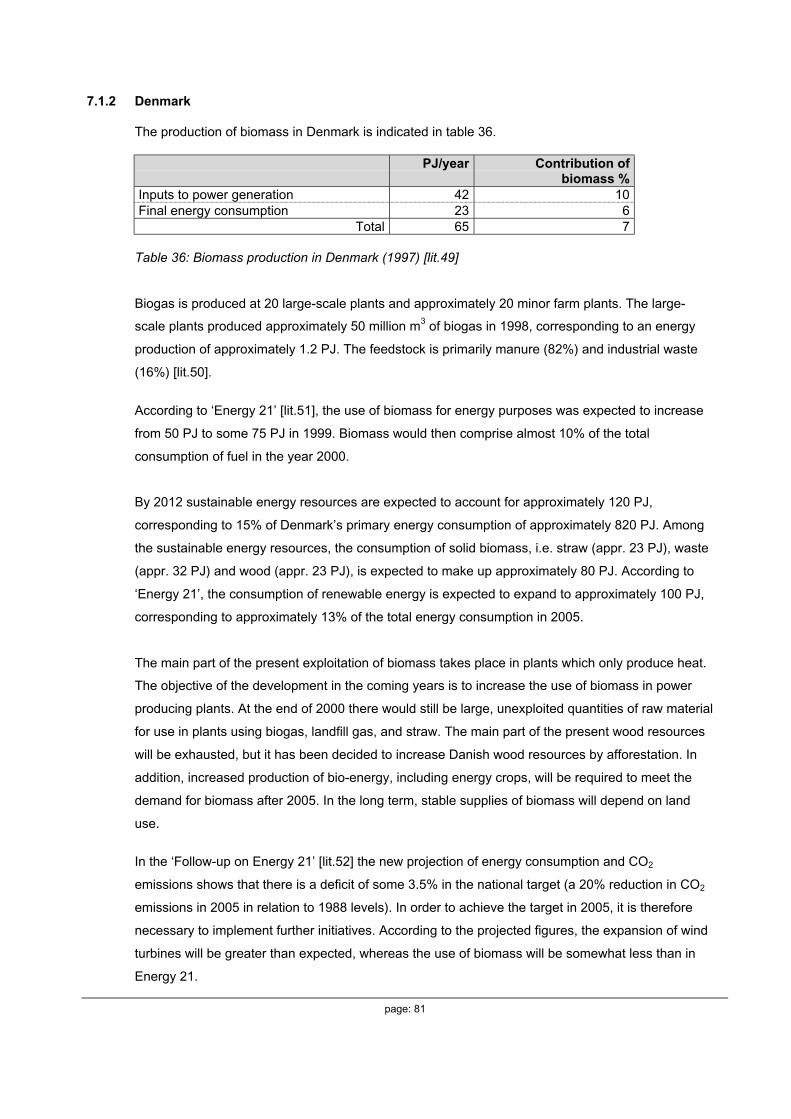
page: 81
7.1.2 Denmark
The production of biomass in Denmark is indicated in table 36.
PJ/year Contribution ofbiomass %
Inputs to power generation 42 10Final energy consumption 23 6
Total 65 7
Table 36: Biomass production in Denmark (1997) [lit.49]
Biogas is produced at 20 large-scale plants and approximately 20 minor farm plants. The large-
scale plants produced approximately 50 million m3 of biogas in 1998, corresponding to an energy
production of approximately 1.2 PJ. The feedstock is primarily manure (82%) and industrial waste
(16%) [lit.50].
According to ‘Energy 21’ [lit.51], the use of biomass for energy purposes was expected to increase
from 50 PJ to some 75 PJ in 1999. Biomass would then comprise almost 10% of the total
consumption of fuel in the year 2000.
By 2012 sustainable energy resources are expected to account for approximately 120 PJ,
corresponding to 15% of Denmark’s primary energy consumption of approximately 820 PJ. Among
the sustainable energy resources, the consumption of solid biomass, i.e. straw (appr. 23 PJ), waste
(appr. 32 PJ) and wood (appr. 23 PJ), is expected to make up approximately 80 PJ. According to
‘Energy 21’, the consumption of renewable energy is expected to expand to approximately 100 PJ,
corresponding to approximately 13% of the total energy consumption in 2005.
The main part of the present exploitation of biomass takes place in plants which only produce heat.
The objective of the development in the coming years is to increase the use of biomass in power
producing plants. At the end of 2000 there would still be large, unexploited quantities of raw material
for use in plants using biogas, landfill gas, and straw. The main part of the present wood resources
will be exhausted, but it has been decided to increase Danish wood resources by afforestation. In
addition, increased production of bio-energy, including energy crops, will be required to meet the
demand for biomass after 2005. In the long term, stable supplies of biomass will depend on land
use.
In the ‘Follow-up on Energy 21’ [lit.52] the new projection of energy consumption and CO2
emissions shows that there is a deficit of some 3.5% in the national target (a 20% reduction in CO2
emissions in 2005 in relation to 1988 levels). In order to achieve the target in 2005, it is therefore
necessary to implement further initiatives. According to the projected figures, the expansion of wind
turbines will be greater than expected, whereas the use of biomass will be somewhat less than in
Energy 21.
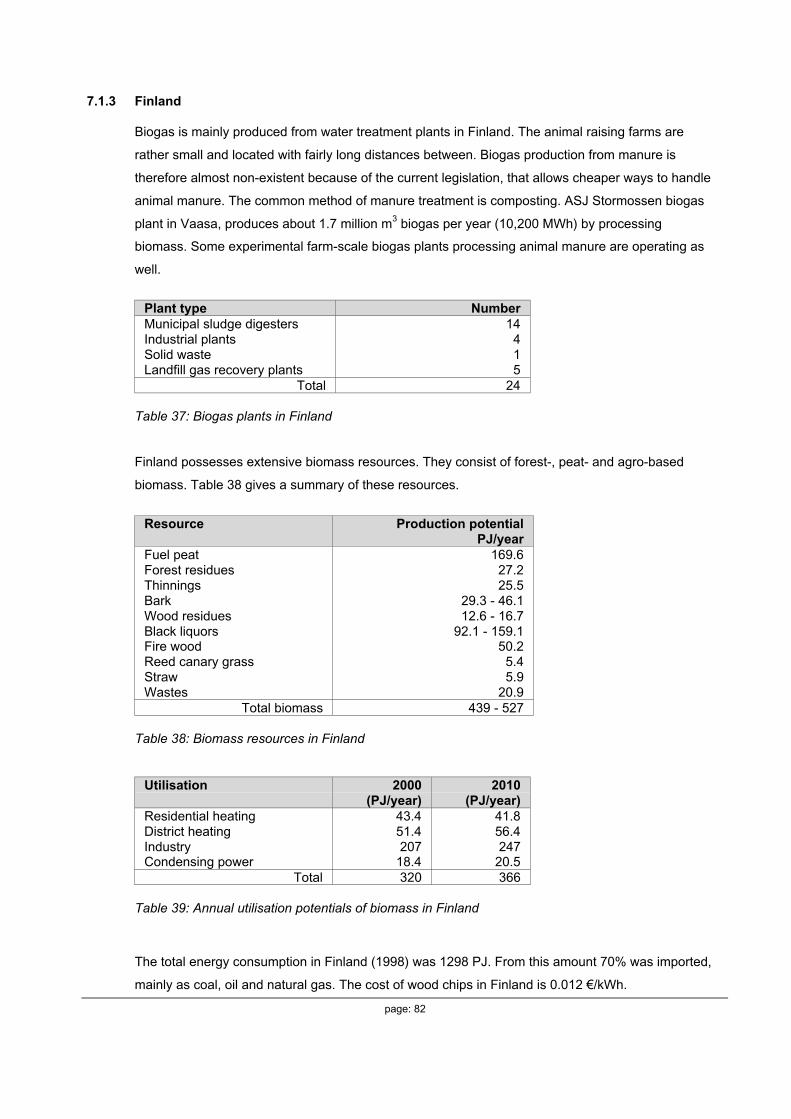
page: 82
7.1.3 Finland
Biogas is mainly produced from water treatment plants in Finland. The animal raising farms are
rather small and located with fairly long distances between. Biogas production from manure is
therefore almost non-existent because of the current legislation, that allows cheaper ways to handle
animal manure. The common method of manure treatment is composting. ASJ Stormossen biogas
plant in Vaasa, produces about 1.7 million m3 biogas per year (10,200 MWh) by processing
biomass. Some experimental farm-scale biogas plants processing animal manure are operating as
well.
Plant type NumberMunicipal sludge digesters 14Industrial plants 4Solid waste 1Landfill gas recovery plants 5
Total 24
Table 37: Biogas plants in Finland
Finland possesses extensive biomass resources. They consist of forest-, peat- and agro-based
biomass. Table 38 gives a summary of these resources.
Resource Production potentialPJ/year
Fuel peat 169.6Forest residues 27.2Thinnings 25.5Bark 29.3 - 46.1Wood residues 12.6 - 16.7Black liquors 92.1 - 159.1Fire wood 50.2Reed canary grass 5.4Straw 5.9Wastes 20.9
Total biomass 439 - 527
Table 38: Biomass resources in Finland
Utilisation 2000(PJ/year)
2010(PJ/year)
Residential heating 43.4 41.8District heating 51.4 56.4Industry 207 247Condensing power 18.4 20.5
Total 320 366
Table 39: Annual utilisation potentials of biomass in Finland
The total energy consumption in Finland (1998) was 1298 PJ. From this amount 70% was imported,
mainly as coal, oil and natural gas. The cost of wood chips in Finland is 0.012 €/kWh.

page: 83
7.1.4 France
The production of biomass in France is indicated in table 40.
PJ/year Contribution ofbiomass %
Production = Gross InlandConsumption
440 4
Inputs to power generation 49 1Final energy consumption 391 6
Table 40: Biomass production in France (1997)
In France, 52 million tons of slurry is produced annually by cattle (53%), pigs (42%) and poultry
(5%). Currently, there are only few manure based biogas plants. The potential biogas production is
1 billion m3 of methane, corresponding to 2% of the French natural gas consumption. The
exploitation of this potential requires gas-tight coverings to be installed on the slurry tanks. These
techniques are presently not utilised in France, but have been applied in Europe, particularly in
Denmark, Germany and Italy. If all tanks have gas-tight coverings, 40% of the potential will be
produced [lit.53].
There is a single biogas plant based on domestic waste (at Amiens). In 2003, at least three more
plants are expected. The French policy is that waste biomass will not be landfilled beyond 2002
[lit.54].
7.1.5 Germany
The production of biomass in Germany is indicated in table 41.
PJ/year Contribution ofbiomass %
Production = Gross InlandConsumption
248 2
Inputs to power generation 74 2Final energy consumption 174 2
Table 41: Biomass production in Germany (1997)
Biogas is produced at about 30 large-scale plants and approximately 770 small- to medium-scale
farm plants. About 350 small- to medium-scale plants are located in Bavaria, about 130 in Baden-
Württemberg. The electricity from the large-scale plants fed into the public grid amounts to over 300
million kWh (1.1 PJ) per year, corresponding to about 100 *106 m3 biogas. The average installed
power in all biogas plants is 60 kWel and the average digester volume 600 m3 per biogas plant,
providing a total installed power of about 48 MWel. All digesters produce about 250 * 106 m3 biogas
per year. Most of the engineers, construction companies, biogas plant operators, many interested
scientists and private persons are organised in the Fachverband Biogas.

page: 84
Figure 18: Distribution of capacity of installed electrical power by scaleSource: Fachverband Biogas e.V.
The German Federal Office for Agriculture & Food (FOAF) has agreed on practicable legal
requirements to grow energy crops on set-aside-land (Stillegungsflächen). FOAF finally approved a
procedure of scrutinization of non-food utilization, which was acceptable to the farmers. In 2000,
about 164 farmers digested energy crops (80% of it is silo maize) grown on a total area of 970 ha.
Compared to 1999, the increase is about 400%. A further steep growth may be anticipated [lit.55].
The potential biogas production from anaerobic digestion is indicated in table 42. The feedstock
sources from manure, waste and energy crops are shown in detail in table 43.
Source 109 m3 per year PJ/year1)
Agriculture 15.05 324Sewage sludge 1.05 23Communal biowaste 1.23 26Industry trade 0.18 4
Total 17.50 376
1): Assuming an average lower heating value of 21.5 MJ/m3 (60% CH4, 40% CO2).
Table 42: Potential biogas production from anaerobic digestion in Germany [lit.56]
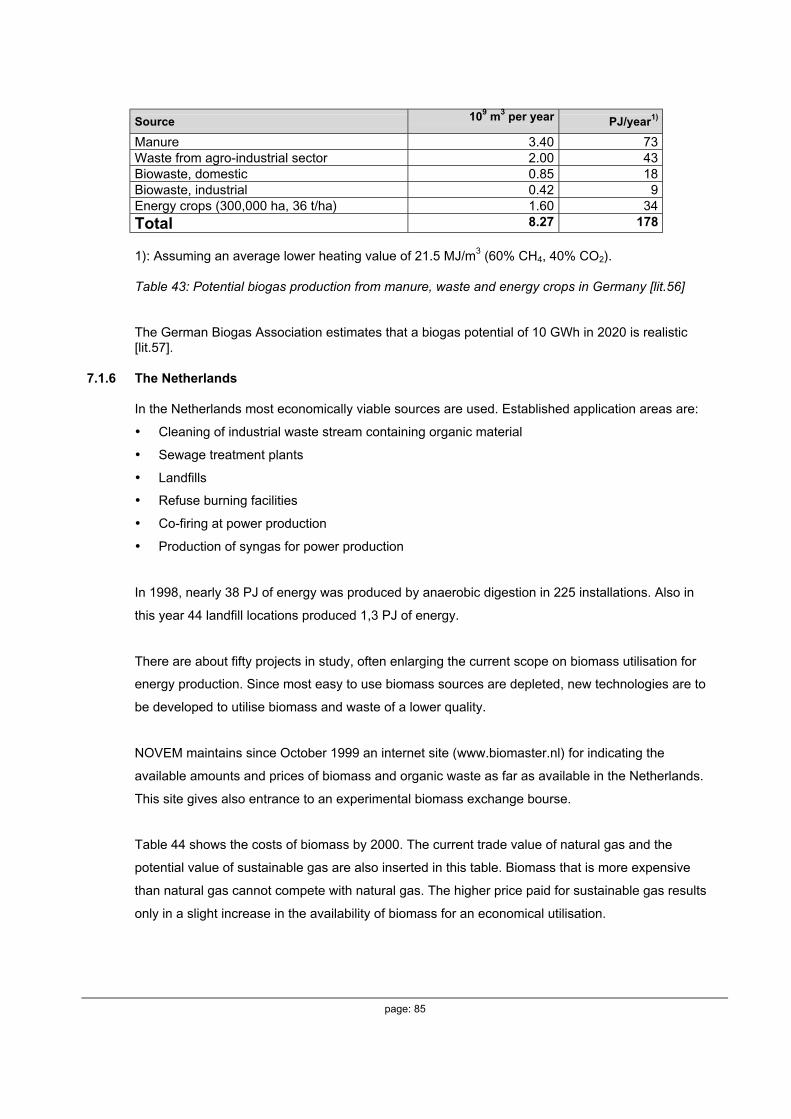
page: 85
Source 109 m3 per year PJ/year1)
Manure 3.40 73Waste from agro-industrial sector 2.00 43Biowaste, domestic 0.85 18Biowaste, industrial 0.42 9Energy crops (300,000 ha, 36 t/ha) 1.60 34
Total 8.27 178
1): Assuming an average lower heating value of 21.5 MJ/m3 (60% CH4, 40% CO2).
Table 43: Potential biogas production from manure, waste and energy crops in Germany [lit.56]
The German Biogas Association estimates that a biogas potential of 10 GWh in 2020 is realistic[lit.57].
7.1.6 The Netherlands
In the Netherlands most economically viable sources are used. Established application areas are:
• Cleaning of industrial waste stream containing organic material
• Sewage treatment plants
• Landfills
• Refuse burning facilities
• Co-firing at power production
• Production of syngas for power production
In 1998, nearly 38 PJ of energy was produced by anaerobic digestion in 225 installations. Also in
this year 44 landfill locations produced 1,3 PJ of energy.
There are about fifty projects in study, often enlarging the current scope on biomass utilisation for
energy production. Since most easy to use biomass sources are depleted, new technologies are to
be developed to utilise biomass and waste of a lower quality.
NOVEM maintains since October 1999 an internet site (www.biomaster.nl) for indicating the
available amounts and prices of biomass and organic waste as far as available in the Netherlands.
This site gives also entrance to an experimental biomass exchange bourse.
Table 44 shows the costs of biomass by 2000. The current trade value of natural gas and the
potential value of sustainable gas are also inserted in this table. Biomass that is more expensive
than natural gas cannot compete with natural gas. The higher price paid for sustainable gas results
only in a slight increase in the availability of biomass for an economical utilisation.
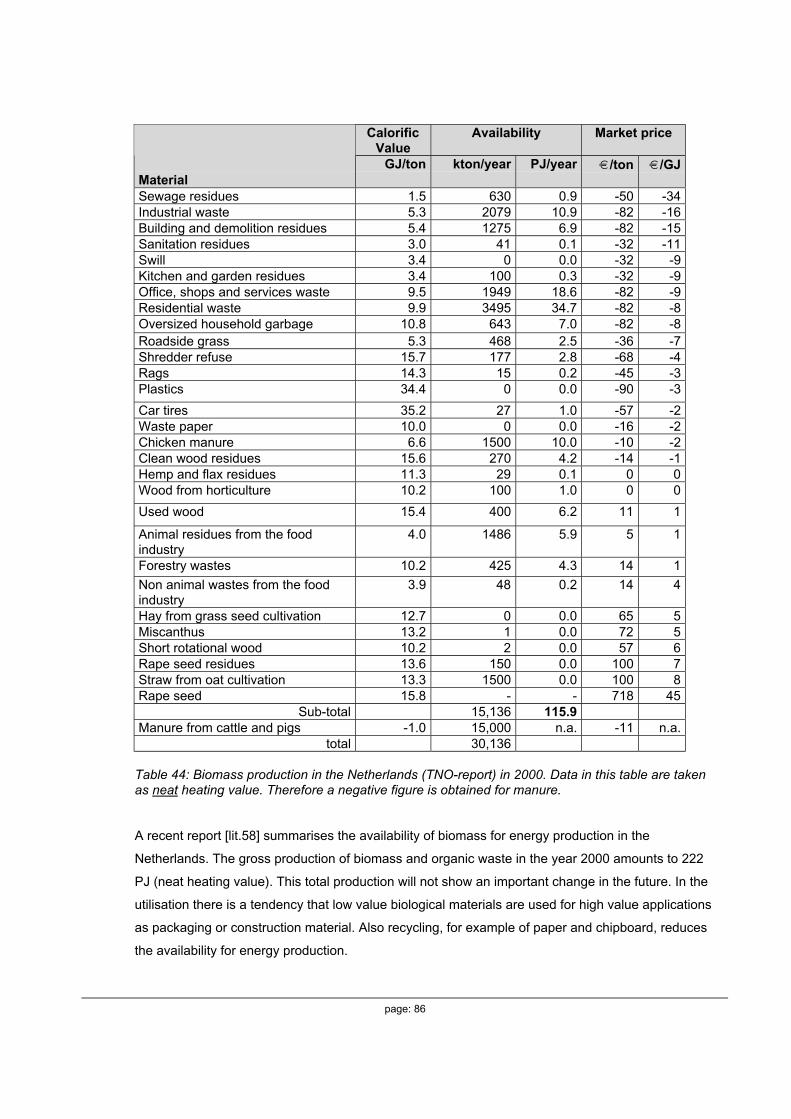
page: 86
CalorificValue
Availability Market price
MaterialGJ/ton kton/year PJ/year €/ton €/GJ
Sewage residues 1.5 630 0.9 -50 -34Industrial waste 5.3 2079 10.9 -82 -16Building and demolition residues 5.4 1275 6.9 -82 -15Sanitation residues 3.0 41 0.1 -32 -11Swill 3.4 0 0.0 -32 -9Kitchen and garden residues 3.4 100 0.3 -32 -9Office, shops and services waste 9.5 1949 18.6 -82 -9Residential waste 9.9 3495 34.7 -82 -8Oversized household garbage 10.8 643 7.0 -82 -8Roadside grass 5.3 468 2.5 -36 -7Shredder refuse 15.7 177 2.8 -68 -4Rags 14.3 15 0.2 -45 -3Plastics 34.4 0 0.0 -90 -3
Car tires 35.2 27 1.0 -57 -2Waste paper 10.0 0 0.0 -16 -2Chicken manure 6.6 1500 10.0 -10 -2Clean wood residues 15.6 270 4.2 -14 -1Hemp and flax residues 11.3 29 0.1 0 0Wood from horticulture 10.2 100 1.0 0 0
Used wood 15.4 400 6.2 11 1
Animal residues from the foodindustry
4.0 1486 5.9 5 1
Forestry wastes 10.2 425 4.3 14 1
Non animal wastes from the foodindustry
3.9 48 0.2 14 4
Hay from grass seed cultivation 12.7 0 0.0 65 5Miscanthus 13.2 1 0.0 72 5Short rotational wood 10.2 2 0.0 57 6Rape seed residues 13.6 150 0.0 100 7Straw from oat cultivation 13.3 1500 0.0 100 8Rape seed 15.8 - - 718 45
Sub-total 15,136 115.9Manure from cattle and pigs -1.0 15,000 n.a. -11 n.a.
total 30,136
Table 44: Biomass production in the Netherlands (TNO-report) in 2000. Data in this table are takenas neat heating value. Therefore a negative figure is obtained for manure.
A recent report [lit.58] summarises the availability of biomass for energy production in the
Netherlands. The gross production of biomass and organic waste in the year 2000 amounts to 222
PJ (neat heating value). This total production will not show an important change in the future. In the
utilisation there is a tendency that low value biological materials are used for high value applications
as packaging or construction material. Also recycling, for example of paper and chipboard, reduces
the availability for energy production.

page: 87
The availability of biomass to produce gas for addition to the grid is also reduced by competing
biomass to energy conversion options. For example co-firing of biomass with coal or natural gas is
highly attractive by the low investment and maintenance cost while there is an attractive market for
green electricity.
AmountPJ/year
year 2000 2020Total produced biomass and organic waste 222 not
indicatedUsed otherwise or not fit for conversion to energy 106 not
indicatedAvailable for energy production 116 235Utilised for energy production 65 164Unused potential for energy production 51 71Net import of energy from biomass 0 0
Table 45: Current (2000) and projected (2020) biomass utilisation in the Netherlands [lit.58]
Future availability of biomass for energy production
The available amount of biomass completely allows the production of energy from biomass as
projected by the government (in the year 2020 of 120 PJ - on the basis of avoided primary energy)
[lit.59].
The import of biomass opens a still wider perspective for the production of sustainable energy. This
import can be reached by physical import of biomass from abroad. The other possibility is the virtual
import of biomass. The forms of this virtual import are still in development.
The most convincing way for the virtual import is buying bio-energy from a foreign producer. In 2004
latest it will be possible for all electricity and gas users to buy these products from any producer.
Current green energy providers in the Netherlands already buy green energy at foreign suppliers. In
this case the supplier will physically feed the energy to the European grid.
Another form is the application of the flexible mechanisms as provided in the Kyoto protocol. It may
be expected that the use of biomass as an energy source will be characterised as a reduction of the
greenhouse gas emissions. In the flexible mechanisms there is no need for a physical delivery of
green energy to the European grid.
7.1.7 Sweden
The biogas production in Sweden origins mainly from waste water treatment plants. Most of the
plants are treating sewage water from households, but there are some fairly big industrial
installations at paper mills and sugar beet refineries.
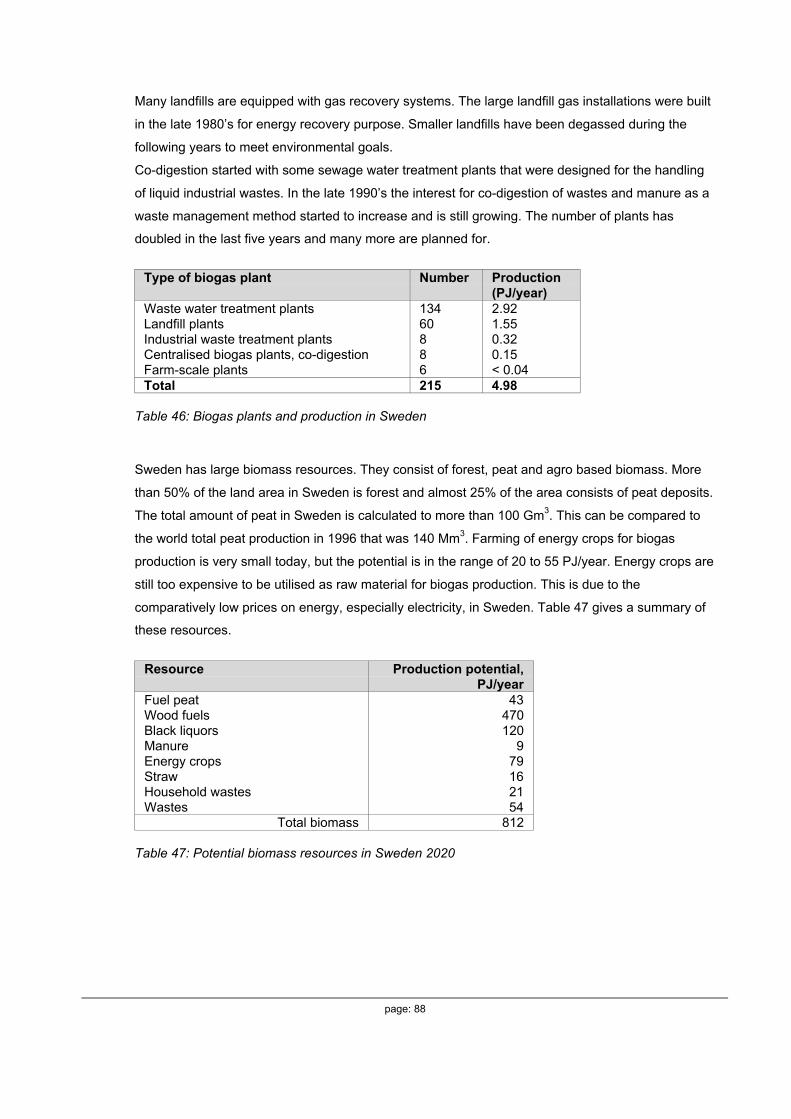
page: 88
Many landfills are equipped with gas recovery systems. The large landfill gas installations were built
in the late 1980’s for energy recovery purpose. Smaller landfills have been degassed during the
following years to meet environmental goals.
Co-digestion started with some sewage water treatment plants that were designed for the handling
of liquid industrial wastes. In the late 1990’s the interest for co-digestion of wastes and manure as a
waste management method started to increase and is still growing. The number of plants has
doubled in the last five years and many more are planned for.
Type of biogas plant Number Production(PJ/year)
Waste water treatment plants 134 2.92Landfill plants 60 1.55Industrial waste treatment plants 8 0.32Centralised biogas plants, co-digestion 8 0.15Farm-scale plants 6 < 0.04Total 215 4.98
Table 46: Biogas plants and production in Sweden
Sweden has large biomass resources. They consist of forest, peat and agro based biomass. More
than 50% of the land area in Sweden is forest and almost 25% of the area consists of peat deposits.
The total amount of peat in Sweden is calculated to more than 100 Gm3. This can be compared to
the world total peat production in 1996 that was 140 Mm3. Farming of energy crops for biogas
production is very small today, but the potential is in the range of 20 to 55 PJ/year. Energy crops are
still too expensive to be utilised as raw material for biogas production. This is due to the
comparatively low prices on energy, especially electricity, in Sweden. Table 47 gives a summary of
these resources.
Resource Production potential,PJ/year
Fuel peat 43Wood fuels 470Black liquors 120Manure 9Energy crops 79Straw 16Household wastes 21Wastes 54
Total biomass 812
Table 47: Potential biomass resources in Sweden 2020
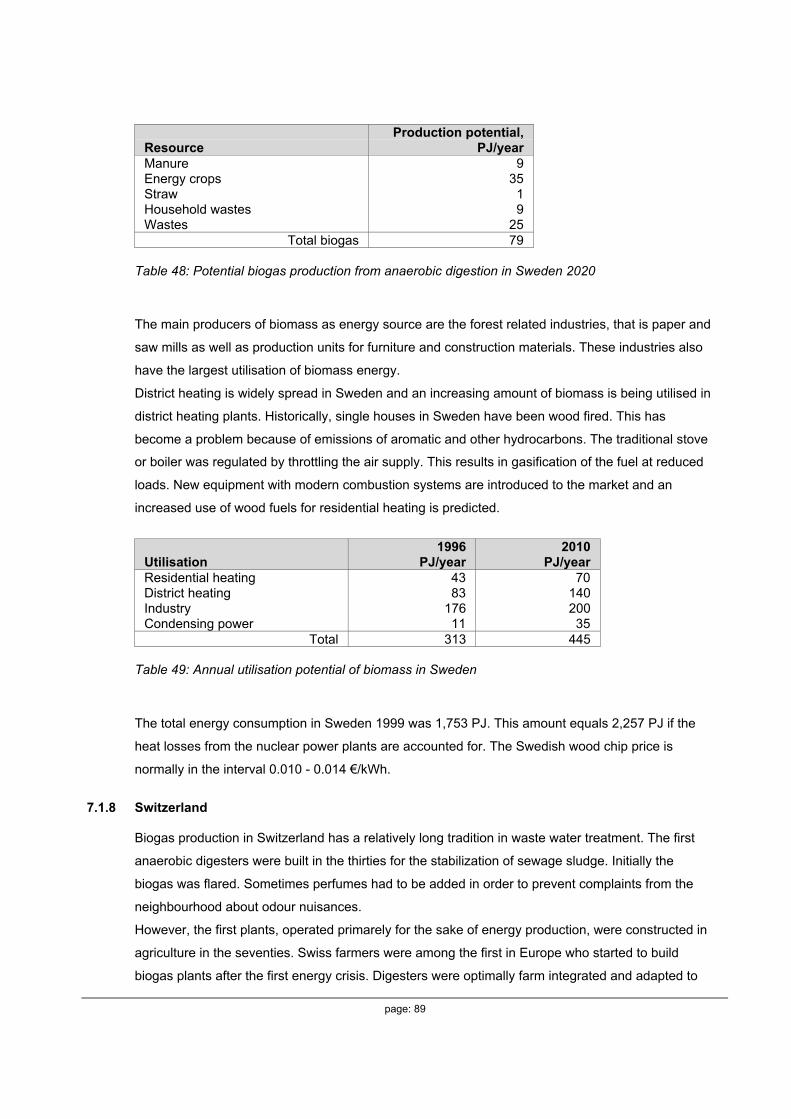
page: 89
ResourceProduction potential,
PJ/yearManure 9Energy crops 35Straw 1Household wastes 9Wastes 25
Total biogas 79
Table 48: Potential biogas production from anaerobic digestion in Sweden 2020
The main producers of biomass as energy source are the forest related industries, that is paper and
saw mills as well as production units for furniture and construction materials. These industries also
have the largest utilisation of biomass energy.
District heating is widely spread in Sweden and an increasing amount of biomass is being utilised in
district heating plants. Historically, single houses in Sweden have been wood fired. This has
become a problem because of emissions of aromatic and other hydrocarbons. The traditional stove
or boiler was regulated by throttling the air supply. This results in gasification of the fuel at reduced
loads. New equipment with modern combustion systems are introduced to the market and an
increased use of wood fuels for residential heating is predicted.
Utilisation1996
PJ/year2010
PJ/yearResidential heating 43 70District heating 83 140Industry 176 200Condensing power 11 35
Total 313 445
Table 49: Annual utilisation potential of biomass in Sweden
The total energy consumption in Sweden 1999 was 1,753 PJ. This amount equals 2,257 PJ if the
heat losses from the nuclear power plants are accounted for. The Swedish wood chip price is
normally in the interval 0.010 - 0.014 €/kWh.
7.1.8 Switzerland
Biogas production in Switzerland has a relatively long tradition in waste water treatment. The first
anaerobic digesters were built in the thirties for the stabilization of sewage sludge. Initially the
biogas was flared. Sometimes perfumes had to be added in order to prevent complaints from the
neighbourhood about odour nuisances.
However, the first plants, operated primarely for the sake of energy production, were constructed in
agriculture in the seventies. Swiss farmers were among the first in Europe who started to build
biogas plants after the first energy crisis. Digesters were optimally farm integrated and adapted to

page: 90
the type and volume of the respective farm waste. Hence, every installation was unique and prices
remained rather high with the consequence that with the decreasing prices of the oil the
construction of new installations came to a halt.
Since 1990, when Switzerland started to promote renewable energy again within the program
‘Energy 2000’, a few new plants were erected digesting bio- and food wastes together with manure.
Agricultural biogas installations
The first agricultural biogas plants in Swiss agriculture were constructed right after the first energy
crisis in the year 1973. The second crisis boosted the number of plants from 15 in 1980 up to
approx. 130 in 1983. The maximum number was reached in 1985 with 140 plants. Some of the
pioneer plants were closed down and a few new digesters have been built since then.
Today less than 70 farm-scale biogas plants are in operation in Switzerland. Three installations are
treating solid waste, all the others are running on liquid manure with addition of chopped straw (1.5
to 3 kg per animal and day). One of the solid waste digesters is a four vessel batch system made of
prefabricated, concrete side walls with a sandwich insulation and a floating plastic cover. A second
one is an upright cylindrically shaped, continuous flow reactor where the waste is pumped upwards
through an inner cylinder and flowing down by gravity through an outer cylinder. The third and last
solid waste digester is a down-flow pilot plant of 10 m3 operated by Nova Energie at the Swiss
Federal Research Station, FAT in Tänikon.
Except for five, all of the liquid digesters are operated in a continuous flow mode. The predominant
constructions are either upright cylinders made of concrete or glass fiber reinforced plastic, or sunk
in ground concrete digesters of either rectangular or cylindrical shape. The digester volumes range
from 30 m3 to over 600 m3. All of the digesters are stirred mechanically. Some of them are
connected to storage tanks covered with gas tight plastic membranes storing at the same time the
gas from the reactor and the gas produced during post fermentation in the storage tank.
The five systems not fed continuously as mentioned above are so-called accumulation systems
where the gas-tight and insulated storage tank is heated, thus serving at the same time as reactor.
All but one biogas system are operated on individual farms. Centralized anaerobic digestion is not
common at all. The only two central biogas plants serving two respectively three farmers are co-
digesting slurry with vegetable and source separated organic waste and manure.
Originally, the major motivation for the construction of the plants was ‘energetical independence’
followed by ‘improvement of the fertilizer quality’. In recent years however, the two priorities were
exchanged. The production of electricity became important when the price was fixed to CHF 0.16
per kWh for renewable energy.
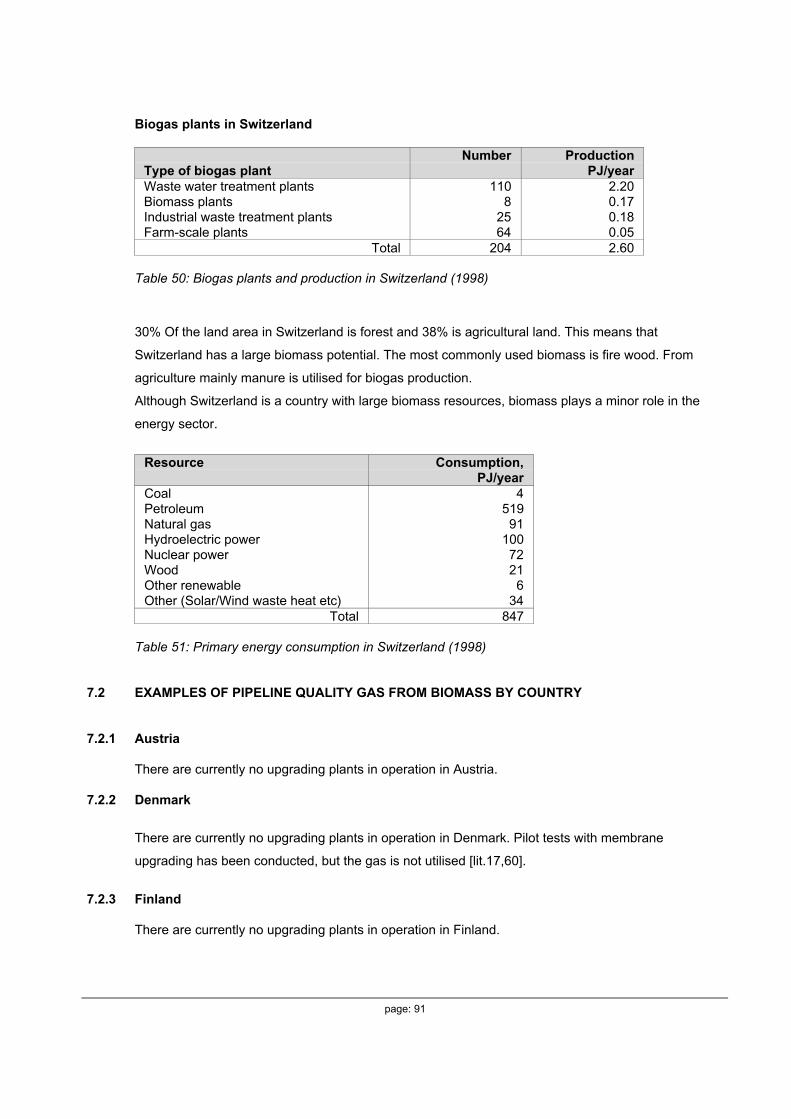
page: 91
Biogas plants in Switzerland
Type of biogas plantNumber Production
PJ/yearWaste water treatment plants 110 2.20Biomass plants 8 0.17Industrial waste treatment plants 25 0.18Farm-scale plants 64 0.05
Total 204 2.60
Table 50: Biogas plants and production in Switzerland (1998)
30% Of the land area in Switzerland is forest and 38% is agricultural land. This means that
Switzerland has a large biomass potential. The most commonly used biomass is fire wood. From
agriculture mainly manure is utilised for biogas production.
Although Switzerland is a country with large biomass resources, biomass plays a minor role in the
energy sector.
Resource Consumption,PJ/year
Coal 4Petroleum 519Natural gas 91Hydroelectric power 100Nuclear power 72Wood 21Other renewable 6Other (Solar/Wind waste heat etc) 34
Total 847
Table 51: Primary energy consumption in Switzerland (1998)
7.2 EXAMPLES OF PIPELINE QUALITY GAS FROM BIOMASS BY COUNTRY
7.2.1 Austria
There are currently no upgrading plants in operation in Austria.
7.2.2 Denmark
There are currently no upgrading plants in operation in Denmark. Pilot tests with membrane
upgrading has been conducted, but the gas is not utilised [lit.17,60].
7.2.3 Finland
There are currently no upgrading plants in operation in Finland.

page: 92
7.2.4 France
There are currently no examples of introduction of upgraded biogas to the natural gas grid. The
upgrading plants in France are shown in table 52.
Location Feedstock andtechnology
Capacitym3/h
Status Utilisation of upgradedgas
Chambéry Sewage sludge:Water scrubbing
30 Not in operationanymore
Vehicle fuel
Lille Sewage sludge:Water scrubbing
100 In operation since1995
Vehicle fuel (buses)
Tours Landfill gas:Water scrubbing
200 In operation since1994
Vehicle fuel
Montech Landfill gas 500 Established in 1998.Not in operation*)
Injection in natural gasgrid
*): The French authorities have not authorised injection because of possible contamination (VOC).
Table 52: Upgrading of biogas in France [lit.13,54]
7.2.5 Germany
The history of biogas technology in Germany started with production of biogas in sewage treatment
plants. From the middle of the 1930’s to the middle of the 1960’s biogas in many large sewage
treatment plants was upgraded and used as ‘bio-natural gas’ as fuel in car engines. Peak
production of upgraded biogas for fuel and injection into the natural gas pipeline grid was reached
during the second world war and after 1950. Under those conditions, a high viability for upgraded
biogas was achieved. Important water associations were Emschergenossenschaft, Ruhrverband,
Wupperverband, Niersverband [lit.61,62]. The Niersverband, for example, produced up to 6.7 million
m3 biogas per year up to 1955 for vehicle fuel and as CNG in cylinders sold to households.
After a break of about 20 years, two sewage treatment plants constructed upgrading plants/gas
separation plants for feeding the upgraded biogas into the respective natural gas grid. In Stuttgart-
Muhlhausen, biogas was upgraded to H-gas, in Viersen to L-gas. "One of the upgrading
requirements was that many consumers got access to the biogas energy. Thus it was ensured that
on an annual average an even and high share of the excess gas could be recovered“ [lit.63].
In the central sewage plant at Stuttgart-Muhlhausen a EU demonstration project on energy saving
and alternative energy sources was conducted. It was the first upgrading plant in the world using
MEA (Monoethanolamine) for absorption of CO2 and H2S. The capacity was 500 m3 crude biogas
per hour, investment was 0.77 M€, amortisation about 10 years. The gas was sold for 0.21 €/m3.
This plant successfully operated from 1984 to the end of 1999.

page: 93
The second plant using water as absorbent operated from 1982 to the end of 1998 and was located
in the sewage treatment plant of the Niersverband in Viersen near Moenchengladbach with 700,000
inhabitant equivalents. This plant, a pilot plant sponsored by the former BMFT (German Federal
Ministry of Research and Technology), had a capacity of 450 m3 crude biogas per hour. CO2 was
absorbed in water at a pressure of 10 bar. The methane content of the upgraded biogas was about
91%, the H2S-content < 5 mg/m_, the Wobbe index Wo 45,39 MJ/m_, the dewpoint - 5 °C at 1 bar.
The gas was injected into the natural gas grid of Willich municipality, which served 30,000
inhabitants with 16.5 million m3 natural gas per year.
There are currently no examples of introduction of upgraded biogas to the natural gas grid.
7.2.6 The Netherlands
There are five locations where gas from biomass is added to the gas grid (table 53). This addition
was quite successful at natural gas prices near 25 €ct/m3 in the years 1986 - 1990. As a
consequence of lowering gas prices, new projects became less attractive. With the introduction of
the green electricity concept in 1998 it became more profitable to convert the biomass to green
electricity. Currently it is by far more profitable to produce green electricity than to produce a gas
from biomass that only replaces natural gas.
CapacityLocation• Operator
Feedstock and technology
m3/houtput
Status
landfill gas: input 1400 m3/h on line 1986gas from biomass: input 560 m3/h on line 1994sewage gas: input 40 m3/h also used for electricity
generation
Tilburg• SMB• Essent
carbon dioxide removal with water wash 1200 on line 1986Nuenen• Carbiogas• Essent
landfill gas:carbon dioxide removal with pressureswing absorption
3000 in production since 1986
Wijster• VAM• Essent
landfill gas:carbon dioxide removal with pressureswing absorption
4000 in production since 1986
Vasse• COGAS
landfill gas:carbon dioxide removal with membraneseparation
300 Producing 1992 - 1998
Wolvega• Essent
landfill gas:carbon dioxide removal with membraneseparation
1800 Producing since 1993
Table 53: Survey of the locations in the Netherlands where biogas is added to the grid
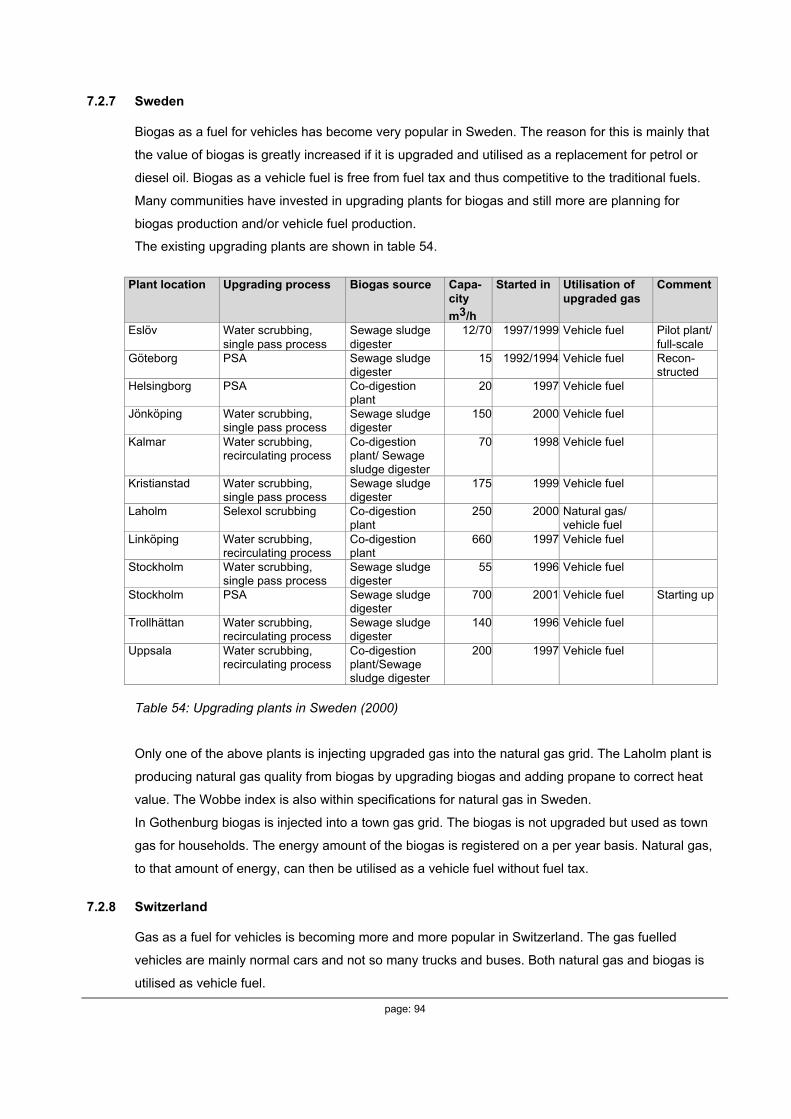
page: 94
7.2.7 Sweden
Biogas as a fuel for vehicles has become very popular in Sweden. The reason for this is mainly that
the value of biogas is greatly increased if it is upgraded and utilised as a replacement for petrol or
diesel oil. Biogas as a vehicle fuel is free from fuel tax and thus competitive to the traditional fuels.
Many communities have invested in upgrading plants for biogas and still more are planning for
biogas production and/or vehicle fuel production.
The existing upgrading plants are shown in table 54.
Plant location Upgrading process Biogas source Capa-city
m3/h
Started in Utilisation ofupgraded gas
Comment
Eslöv Water scrubbing,single pass process
Sewage sludgedigester
12/70 1997/1999 Vehicle fuel Pilot plant/full-scale
Göteborg PSA Sewage sludgedigester
15 1992/1994 Vehicle fuel Recon-structed
Helsingborg PSA Co-digestionplant
20 1997 Vehicle fuel
Jönköping Water scrubbing,single pass process
Sewage sludgedigester
150 2000 Vehicle fuel
Kalmar Water scrubbing,recirculating process
Co-digestionplant/ Sewagesludge digester
70 1998 Vehicle fuel
Kristianstad Water scrubbing,single pass process
Sewage sludgedigester
175 1999 Vehicle fuel
Laholm Selexol scrubbing Co-digestionplant
250 2000 Natural gas/vehicle fuel
Linköping Water scrubbing,recirculating process
Co-digestionplant
660 1997 Vehicle fuel
Stockholm Water scrubbing,single pass process
Sewage sludgedigester
55 1996 Vehicle fuel
Stockholm PSA Sewage sludgedigester
700 2001 Vehicle fuel Starting up
Trollhättan Water scrubbing,recirculating process
Sewage sludgedigester
140 1996 Vehicle fuel
Uppsala Water scrubbing,recirculating process
Co-digestionplant/Sewagesludge digester
200 1997 Vehicle fuel
Table 54: Upgrading plants in Sweden (2000)
Only one of the above plants is injecting upgraded gas into the natural gas grid. The Laholm plant is
producing natural gas quality from biogas by upgrading biogas and adding propane to correct heat
value. The Wobbe index is also within specifications for natural gas in Sweden.
In Gothenburg biogas is injected into a town gas grid. The biogas is not upgraded but used as town
gas for households. The energy amount of the biogas is registered on a per year basis. Natural gas,
to that amount of energy, can then be utilised as a vehicle fuel without fuel tax.
7.2.8 Switzerland
Gas as a fuel for vehicles is becoming more and more popular in Switzerland. The gas fuelled
vehicles are mainly normal cars and not so many trucks and buses. Both natural gas and biogas is
utilised as vehicle fuel.
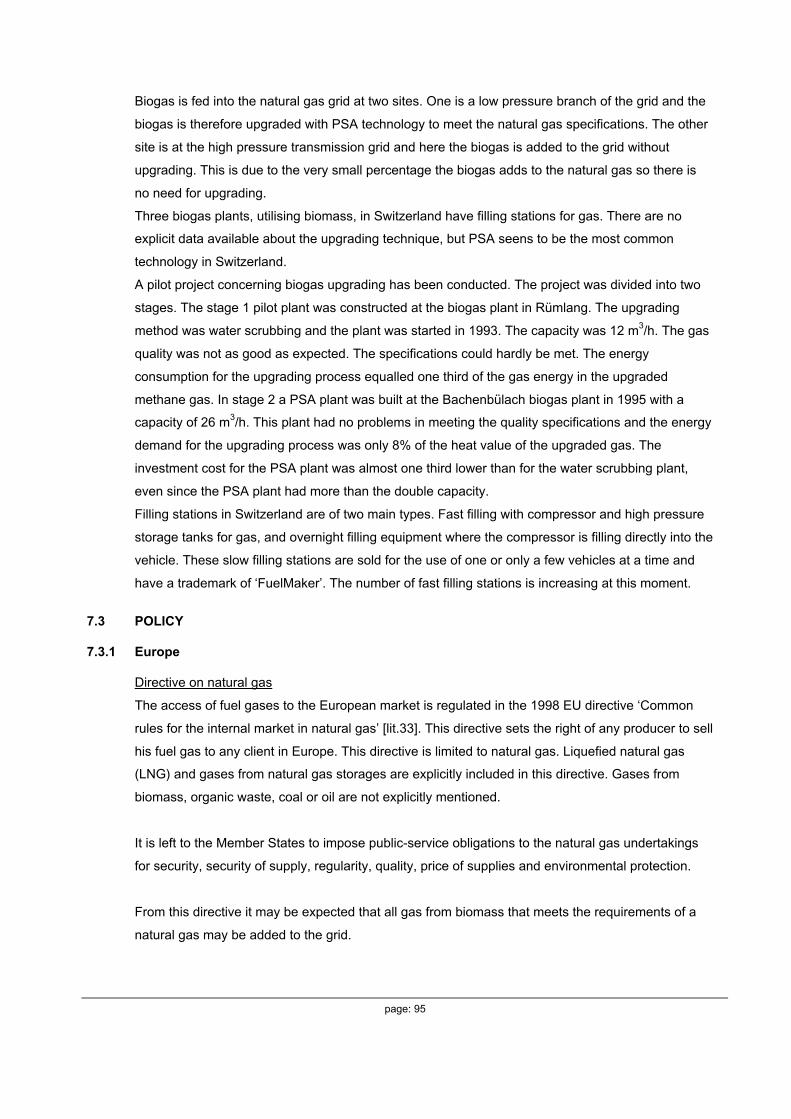
page: 95
Biogas is fed into the natural gas grid at two sites. One is a low pressure branch of the grid and the
biogas is therefore upgraded with PSA technology to meet the natural gas specifications. The other
site is at the high pressure transmission grid and here the biogas is added to the grid without
upgrading. This is due to the very small percentage the biogas adds to the natural gas so there is
no need for upgrading.
Three biogas plants, utilising biomass, in Switzerland have filling stations for gas. There are no
explicit data available about the upgrading technique, but PSA seens to be the most common
technology in Switzerland.
A pilot project concerning biogas upgrading has been conducted. The project was divided into two
stages. The stage 1 pilot plant was constructed at the biogas plant in Rümlang. The upgrading
method was water scrubbing and the plant was started in 1993. The capacity was 12 m3/h. The gas
quality was not as good as expected. The specifications could hardly be met. The energy
consumption for the upgrading process equalled one third of the gas energy in the upgraded
methane gas. In stage 2 a PSA plant was built at the Bachenbülach biogas plant in 1995 with a
capacity of 26 m3/h. This plant had no problems in meeting the quality specifications and the energy
demand for the upgrading process was only 8% of the heat value of the upgraded gas. The
investment cost for the PSA plant was almost one third lower than for the water scrubbing plant,
even since the PSA plant had more than the double capacity.
Filling stations in Switzerland are of two main types. Fast filling with compressor and high pressure
storage tanks for gas, and overnight filling equipment where the compressor is filling directly into the
vehicle. These slow filling stations are sold for the use of one or only a few vehicles at a time and
have a trademark of ‘FuelMaker’. The number of fast filling stations is increasing at this moment.
7.3 POLICY
7.3.1 Europe
Directive on natural gas
The access of fuel gases to the European market is regulated in the 1998 EU directive ‘Common
rules for the internal market in natural gas’ [lit.33]. This directive sets the right of any producer to sell
his fuel gas to any client in Europe. This directive is limited to natural gas. Liquefied natural gas
(LNG) and gases from natural gas storages are explicitly included in this directive. Gases from
biomass, organic waste, coal or oil are not explicitly mentioned.
It is left to the Member States to impose public-service obligations to the natural gas undertakings
for security, security of supply, regularity, quality, price of supplies and environmental protection.
From this directive it may be expected that all gas from biomass that meets the requirements of a
natural gas may be added to the grid.

page: 96
Policy on renewable energy
The general energy policy of the EU is described in the ‘White Paper’ accepted in 1997 [lit.1]. This
document underlines the importance of renewable energy for Europe. In the ‘Green Paper’ an
ambitious program is developed on the large-scale exploitation of renewable energy. In this paper
biomass is the most important source of renewable energy [lit.6].
7.3.2 Austria
Renewable energy sources have been a long-term priority of Austria's energy, subsidy and research
policies, and receive added support from the high level of environmental consciousness of the
Austrian people. The Austrian Government is convinced that its policy of intensified utilization of
renewables has been successful, and will continue its endeavour to promote further development of
this group of energy sources. Austria chooses not to employ nuclear energy within its borders.
The Federal Government sees promotion of renewables (particularly biomass) as the best way of
meeting CO2 reduction targets. According to the 1993 Energy Plan, an additional 30 to 40 PJ could
be mobilized if effective measures are implemented. The Electricity Supply and Organization Act
provides, among other things, for an obligation on operators of distribution networks to purchase
electricity generated from solar energy, wind, biomass, biogas, landfill gas, digester gas, and
geothermal energy. Furthermore, these energy sources are to reach a share of 3% of total
electricity supplied to end-users by 2005.
The Austrian Government has set up a major action program to support companies switching their
heating systems to biomass of supplying energy from biomass to third parties. The Technical
Universities of Vienna and Graz are working on pilot systems for the gasification of biomass. At the
same time, studies are being conducted to explore new applications for biomass-fired combined
heat and power plants and to study the necessary framework conditions.
A new fluid bed process for the gasification of biomass has been developed that will allow the
production of high-grade product gas. Through the use of steam as a gasification agent it has been
possible to reduce the tar content of the gas compared to using conventional techniques. This
technology is an option for combined heat and power generation from biomass, mainly in
installations of 5 MW or more. In order to provide a suitable technology for small power plants (200
kW to 1 MW), researchers at Graz Technical University are developing a solid bed gasifier.
An energy tax on gas (€ 0.0435/m3 plus 20% VAT) and electricity (€ 0.0073/kWh plus 20% VAT)
was introduced in 1996. This tax applies to small-scale as well as industrial users. Approximately
12% of the tax revenue is made available to the Federal Provinces for implementation of energy
saving and environmental protection measures, including measures for the promotion of renewable
energy sources.

page: 97
Locally (in a federal state) there has been buy-back guaranties on electricity produced from
renewable sources. The most favored energy source has been wind power, but co-generation from
biomass as well as biogas has been within the programme. This promotion has decreased and
since 1996 there is no reliable information concerning any promotion. A drawback could even be
that the electricity tax applies to electricity from biomass as well as from fossil fuels. The feed-in
tariff for electricity from biomass is in the interval 0.025 - 0.055 €/kWh with an average of 0.038
€/kWh.
Austria has a strong interest in energy development in neighbouring Central/Eastern European
countries, and has established special funds to assist them, such as the ‘Austrian Environmental
Assistance Abroad’ and ‘Assistance to the Newly Independent Central and Eastern European
Countries’. These funds provide financial support for projects aimed at improving environmental and
energy conditions in these countries. The emphasis of these activities lies on renewable energy
sources and on rational energy use. Cross border co-operation with neighbouring countries in the
field of renewable energy sources is also provided by the INTERREG program.
Considerable progress has been achieved in the use of biogas technology in Austria.The total
number of biogas installations in Austria 1997 was 196. Additional installations are being planned,
especially in the field of landfill gas recovery, which is continually gaining importance. Besides
several smaller installations, the gas from Vienna's largest landfill at Rautenweg has been
recovered for energy production since 1991. This plant, with an electric power capacity of 8 MW, is
currently the largest in Europe.
The advantages of biogas utilization in agriculture are numerous; it represents a renewable energy
source, an environmentally sound way for organic waste disposal and organic fertilizer production,
and significantly reduces bad smells. Biogas is typically utilized in combined heat and power
installations, whose excess power is fed into the grid. Substances such as vegetable and other food
residues or oil are occasionally added. A fund has been set up to subsidize the installation of biogas
systems by agricultural operators. There is no information available on the mechanisms of this fund.
Some sources indicate that it is a general fund that can subsidise projects that meet the
requirements and apply for funding.
7.3.3 Denmark
The Danish energy policy will contribute to the sustainable development of Danish society. Its
energy sector will continue to be economically and technologically efficient, a flourishing sector that
forms part of the dynamic development of Danish society. The policy plans for rational management
of the resources to be given a central role. Internationally, Denmark will contribute to a development
in which actions for better use of resources and reducing environmental impact are given steadily
growing importance.
page: 98
Danish energy policy is to contribute to ensuring Denmark a pioneering role in global sustainable
development.
The Danish energy policy is, among others, based on the following documents:
• The Brundtland Report
• The Kyoto Protocol
• UN Climate Convention
The Danish energy policy is described in the documents:
• Energi 21 (Energy 21) [lit.51]. Energy 21 is the plan of the Danish government for sustainable
development of energy in Denmark in an international context. In Energy 21, which was
published in April 1996, the Danish Government maintains the national target of reducing CO2
emissions by 20% in 2005, in comparison with the 1988 level.
• Opfølgning på Energi 21 (Follow-up on Energy 21) [lit.52]. In this report the status for meeting
the targets of Energy 21 is described and new initiatives to fulfil these are outlined.
The government is maintaining the obligation so as to stabilise, by 2000, total Danish CO2
emissions into the atmosphere at a level below that of 1990 and, by 2005, to have reduced them by
20% from their 1988 levels. For the transport sector, the government continues to maintain its 1990
target of a further reduction of 25% by 2030.
Denmark has one of the highest per capital rates of CO2 emissions in the world on account of the
high proportional use of coal in electricity production. On the other hand, Danish households and
industry use energy quite efficiently in comparison with other highly-developed industrial countries.
Possibilities of reducing CO2 emissions in Denmark exist through fuel substitution in electricity
production.
Denmark is willing to accept the reduction targets that follow from the conclusions of the
International Panel on Climate Change. Should this be decided, Denmark and other highly-
developed industrial countries with high CO2 emissions would strive to reduce them to half their
1990 levels by 2030. Initiatives in the field of biomass are directed, firstly, towards conversion from
heat production plants only to combined heat and power units, secondly towards increased
exploitation of straw, biogas, and landfill gas, and thirdly towards reduction of the costs of producing
biomass for energy purposes.
Consequently the government intends to:
• Promote decentralised development of heat and power production based on biomass by:
- promoting the use of gas from all relevant landfills for power production before 2005,
- promoting the introduction of biomass before 2005 in some 350 block heating units with
page: 99
heating requirements above 250 kW which are located outside district heating and natural
gas distribution zones and areas,
- ensuring that the establishment of new individual natural gas supplies in minor communities
shall be dropped in favour of switching to biomass based district heating or CHP.
• Contact the parties to the biomass agreement with a view to changing it in ways that can lead
to:
- making it possible within the framework of the agreement to replace its very exact quantities
of straw and wood chips with a more flexible mix of straw and wood chips. This will provide
a flexibility that can reduce total costs while simultaneously introducing an element of
competition which can reduce the fuel prices.
- permitting a general opening for the use of biomass in natural gas areas, in order to ensure
the possibilities of further development of biomass CHP after 2000.
• Implement a demonstration and development programme for energy crops designed to
contribute to the evaluation of the long-term consequences of increasing the Danish biomass
resources by energy crop production, in terms of finance, energy and environment, nature and
landscape, and commerce.
• Carry out a limited experimental programme with a view to assessing the basis for the
permanent production and utilisation of biofuels.
Taxation and incentives
Green taxes
In 1995, the government passed collective legislation for trades and industries, the so-called Energy
Package, as an instrument for reducing CO2 emissions, and for contributing to fulfilment of the
national CO2 targets. The package includes energy, CO2 and SO2 taxes on energy consumption,
subsidies for energy-efficiency measures, entry into agreements for energy-intensive companies,
reduction in taxation of labour, and subsidies to the self-employed. The energy and CO2 taxes are
dependent upon energy use, while the SO2 tax is independent of energy use. In the private sector,
energy use is categorized as heavy process, light process and space heating. CO2 taxes depend
upon CO2 emissions on combustion, as the total tax for all fuels corresponds to € 13.4 per ton of
CO2 emission. However, the CO2 tax calculation rate on electricity is fixed and does not fluctuate as
a result of changes in fuel consumption in the production of electricity. It is possible for energy-
intensive companies to enter agreements on energy efficiency and thereby reduce their CO2 taxes.
CO2 taxes will therefore vary significantly, depending upon whether or not an agreement has been
entered, see table 55. Households are taxed with the full CO2 tax of € 13.4 per ton of CO2 emission.
Energy taxes on fuel consumption for space heating in trade and industry are gradually increased
until 2002 as indicated in table 56.
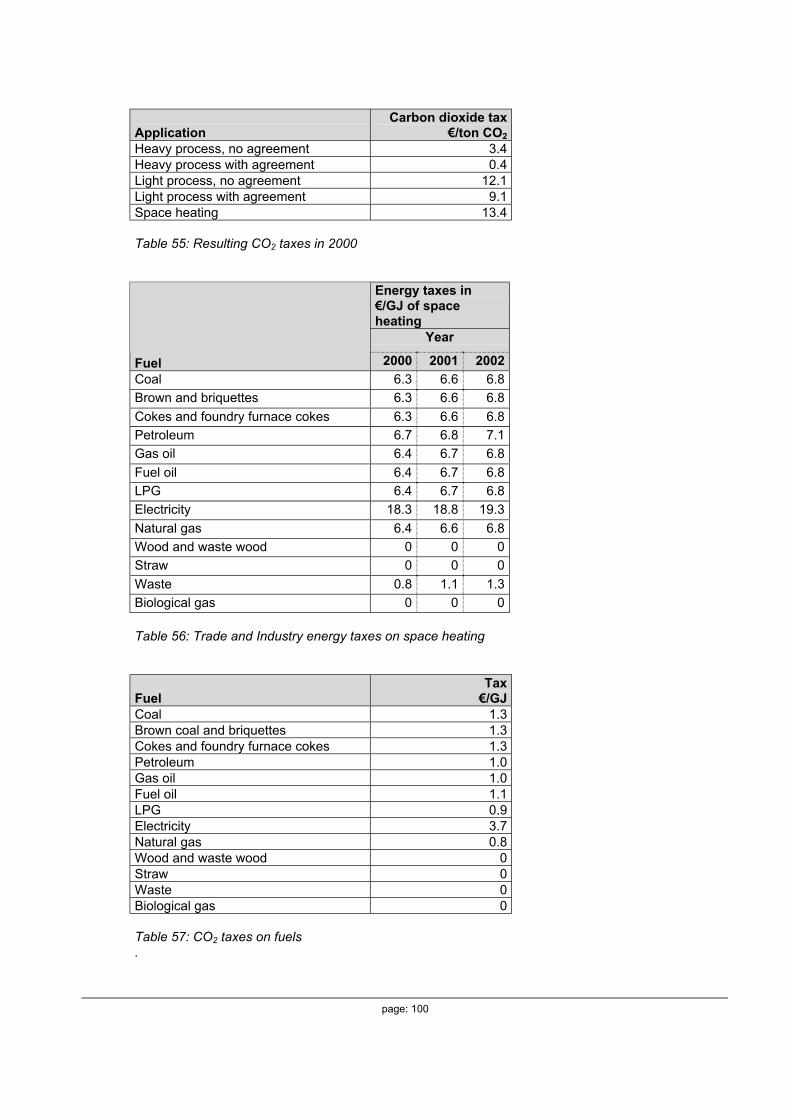
page: 100
ApplicationCarbon dioxide tax
€/ton CO2
Heavy process, no agreement 3.4Heavy process with agreement 0.4Light process, no agreement 12.1Light process with agreement 9.1Space heating 13.4
Table 55: Resulting CO2 taxes in 2000
Energy taxes in€/GJ of spaceheating
Year
Fuel 2000 2001 2002
Coal 6.3 6.6 6.8
Brown and briquettes 6.3 6.6 6.8
Cokes and foundry furnace cokes 6.3 6.6 6.8
Petroleum 6.7 6.8 7.1
Gas oil 6.4 6.7 6.8
Fuel oil 6.4 6.7 6.8
LPG 6.4 6.7 6.8
Electricity 18.3 18.8 19.3
Natural gas 6.4 6.6 6.8
Wood and waste wood 0 0 0
Straw 0 0 0
Waste 0.8 1.1 1.3
Biological gas 0 0 0
Table 56: Trade and Industry energy taxes on space heating
FuelTax
€/GJCoal 1.3Brown coal and briquettes 1.3Cokes and foundry furnace cokes 1.3Petroleum 1.0Gas oil 1.0Fuel oil 1.1LPG 0.9Electricity 3.7Natural gas 0.8Wood and waste wood 0Straw 0Waste 0Biological gas 0
Table 57: CO2 taxes on fuels.

page: 101
There is a sulphur tax on all fuel consumption of 1.3 €/kg sulphur dioxide, see table 57. Fuels with a
sulphur content of less than 0.05% are tax-exempt.
Tradable green certificates in Denmark
In Denmark a system of tradable green certificates is planned to support the growth of renewable
electricity. It should take effect in 2002. The Danish government wants to use this system to double
the proportion of electricity generated from renewable sources to 20% in 2003. This system
replaces the current direct subsidies to renewable energy producers. The benefit of green certificate
trading above that of state subsidies and fixed prices is that they give producers an incentive to
reduce their production costs. The current plans were announced in May 2000. The government
pledged to open a central exchange for trading in renewable green energy certificates. This plan
has now been approved under EU state rules.
Financial support
The government supports biogas plants financially with up to 30% of the investment, with a maxium
of € 130,000. Domestic biomass heating systems are supported with 18 - 21% of the investment in
areas without distribution networks for natural gas and district heating.
Electricity Act of May 31, 1996
The Electricity Act provides a major economic incentive for electricity generated by renewable
energy sources. This subsidy consists of two grants. The first (0.023 €/kWh) is a general incentive
to expand electricity produced from renewables. The other grant (0.013 €/kWh) serves to internalise
part of the external costs of fossil fuels.
If electricity from biomass systems is fed into the grid, the utilities pay on a basis of avoided costs.
Thus, the price depends on the time at which the electricity is supplied. The private producer
receives between 0.019 - 0.132 €/kWh from the utility. Added to this is a government subsidy
(reimbursement for energy or carbon tax) of 0.013 €/kWh and a government grant to encourage the
use of biomass of 0.023 €/kWh. This means that the price varies within a range of 0.055 - 0.168
€/kWh. Furthermore producers may be eligible for a 30% investment subsidy for biogas facilities.
Benefits:
Private and decentralised electricity producers get a support for renewable energy (wind, hydro &
biomass) of 0,024 €/kWh, besides 0.014 €/kWh paid from carbon dioxide tax. Total subsidy (above
the market price for electricity) amounts to 0.037 €/kWh.

page: 102
CHP Fund
The CHP Fund is an incentive for the use of CHP in biomass-based district heating plants. The CHP
Fund is financed with energy tax resources. Most projects receive a support of 10 to 35% of the
project costs. The upper ceiling for support is 50% and applies to the most risky or development-
oriented projects.
The prospects for adding biogas to the natural gas grid in Denmark are low. Previous investigations
have shown that upgrading is economically unrealistic and the current development is focused on
utilisation in district heating or CHP.
7.3.4 Finland
Renewable energy consumption is quite high in Finland compared to other OECD countries.
Approximately 30% of energy demand in Finland is supplied by renewable energy. Such a high
percentage of renewable energy consumption has helped lead Finland to a strong position within
the renewable energy technology field.
The most important Finnish energy sources are wood, peat, and hydropower. Wood accounts for
approximately 19% of energy consumption (with 4% being for small-scale wood use), while peat
and hydro account for 7% and 3%, respectively.
Finland lacks many indigenous fuel sources and must, therefore, either import its energy (currently
70% of energy demand in Finland) or must rely on alternative sources of energy. Additionally,
Finland has been one of the highest consumers of energy per capital of the OECD countries, which
has been caused in part by the energy-intensive industries (e.g. forestry) that consume
approximately 50% of energy in Finland. Most biomass-based energy is produced within the forestry
industry. Additionally, the Kyoto agreement has stipulated that Finland and other participating
countries need to bring their CO2 emissions down to the 1990 level.
Such factors have led Finland to pursue many opportunities within the renewable energy field, in
order to diversify its sources for energy and to bring down CO2 emissions. To address this need for
renewable sources of energy, much research and development has been performed on renewable
energy technologies.
Public funding has been a great catalyst for the development of the renewable energy technology
market in Finland and will be a factor impacting the future development of the renewable energy
technology market. Major programs were launched in 1993 and in 1998 to address this issue.
Finland's energy technology exports exceed its energy technology imports. Because of this public
emphasis, the advanced technology has been developed.
The Finnish industrial energy policy is based on voluntary means with the exception of the energy
tax. Finland was the first IEA member to impose a CO2 tax unilaterally. The tax was introduced in
1990 and it applies to fossil fuels, including motor fuels. The 1992 tax rates were doubled in 1993.
The Finnish tax system is preferential of indigenous fuels, as indigenous fuels and imported gas are
exempted from the general turnover tax. The two big energy-intensive industrial sectors in Finland,
page: 103
i.e. paper and metal production have a high priority in the energy policy. These industrial sectors are
supported by big research and development programmes. Furthermore, the large companies have
a possibility to conclude agreements with the government on energy management and are hereby
excepted from the CO2 tax. The small- and medium-sized enterprises are mainly influenced by
energy auditing activities. The Finnish energy policy concentrates on distribution of information,
energy auditing, and creation of markets for energy-efficient products and processes.
There is no actual national program on biogas, but the association ‘Biogas Centre’ is promoting the
use of biogas. The University of Joensuu is doing some research on anaerobic digestion. Feasibility
studies concerning establishment of new centralised to plants are going on, but no decision has
been made so far. Support on R&D and demonstration programmes can be obtained.
Organic waste is landfilled and four of the sites are now equipped for landfill gas collection. The
practice of landfill gas collection is expected to increase in the near future, while the development of
co-digestion will be slower. In order to promote biogas development, environmental aspects are to
be taken into consideration.
No promotion taxes or funds have been found to support biogas production. The feed-in tariff for
electricity produced from renewable energy sources only apply to wind power.
The main barriers for implementation of biogas technologies are: the current Finnish legislation that
allows cheaper ways of treating manure, relatively low price levels for electricity and fuels compared
with other European countries and the high costs of biogas caused by the relatively dispersed
location of the farms. The public opinion is favourable to landfill gas collection, while centralised
waste treatment in large plants is considered less attractive, because of traffic and odour problems.
Farm-scale biogas in systems will probably develop [lit.64].
7.3.5 France
There are some ongoing biogas projects (based on slurry), studies and pilot plants in South-West
France (Brittany). The French government has called for offers for power plants fuelled with landfill
gas (without upgrading). Five projects with a total capacity of approximately 15 MW have been
selected.
At the upgrading plant at Montech, they seek to find a solution to the obstacles for injection of
upgraded gas to the natural gas grid.
page: 104
Taxation and incentives
Feed-in tariffs
The French state-owned utility EDF has the obligation to purchase from independent power
producers. The tariff is based on the avoided cost for EDF. The tariff is currently about 0.046 €/kWh.
This tariff is mainly used for independent small producers of hydropower (more than 14 PJ/year).
Avoided costs for CHP from biomass or municipal waste have currently a mean value of 0.060
€/kWh due to firm power advantage.
Bois-énergie et le developpement local
Subsidy for local wood-fired biomass plants, for example for district heating. Biomass projects are
eligible for subsidies of up to 30% of the investment cost.
TIPP
The ‘Taxe Interieur sur les Produits Pétroliers’ is a taxation of fossil fuels. Non fossil fuels, like bio-
fuels are partly exempted.
1) Detaxation
Detaxation amounts to € 0.35 per litre of Bio-ester incorporated in diesel or domestic fuel and € 0.50
per litre of ethanol derived fuels incorporated in unleaded super gasoline.
2) Taxation
Applied TIPP rate (11 January 1998):
- € 1.63 per litre of Bio-ester
- € 8.27 per litre of ethanol
7.3.6 Germany
In April 2000 a law on preference of renewable energy (Gesetz für den Vorrang Erneuerbarer
Energien, EEG) came into force [lit.65,66]. The law addresses aspects related to supply of
electricity produced from biomass to the power grid. The objective of the law is to enable a
sustainable development of the energy supply and to increase the contribution of renewable energy
supply to power production in accordance with the goals of The European Union and Germany to at
least double the share of renewable energy of the total energy consumption by 2010. The
compensation ranges from 0.09 - 0.10 €/kWh depending on installed power.
This law also considers injection of upgraded biogas:
"The scope of application of the Act also covers biogas which is generated elsewhere and fed into
the gas network when biogas is used for electricity generation, providing that proof is furnished of
the origin of this gas and providing that there are calculations which prove that the energy content of

page: 105
the gas quantity used is equal to the energy content of the biogas quantity fed into the network."
In 2000 the German Biogas Association established a working group on biogas introduction to the
natural gas grid. The purpose is to describe the technical possibilities for introduction of biogas and
to prepare regulations of fixed fees for the introduced gas [lit.57]. The German Biogas Association
has proposed to make a parallel law for introduction of upgraded biogas to the natural gas grid, to
compensate the injected upgraded biogas or the transport through the grid, to deduct the mineral oil
taxes from biogas etc.
A shift to natural gas in the heat as well as in the power market is expected, however, injection of
upgraded biogas is not considered at all in a most recent climate study unlike other renewables,
such as solar heat or combustion of biomass [lit.67].
The cabinett has decided on July 26, 2000 to reduce CO2-emissions until 2005 as compared to
1990 by about 18 - 20%, corresponding to a total absolute reduction of 180 - 200 million ton [lit.68].
The actual deficit of some 50 - 70 million ton has to be shared by private households and in
buildings 18 - 25 million ton, by power suppliers and industry 20 - 25 million ton and by traffic 15 -
20 million ton.
Taxation and incentives
Stromeinspeisungsgesetz
The federal act concerning the feeding of green electricity into the national grid defines regulations
for purchases of systems with an installed capacity of less than 5 MW.
The federal act concerning the feeding of green electricity into the national grid that came into force
on January 1st 1991 defines regulations for systems with an installed capacity of less than 5 MW.
This regulation provides feed-in tariffs for small hydros, landfill gas and biomass electricity, which is
fired with wood waste from the industry (installations up to 5 MW). Wind and solar energy are not
included in the regulation as far as the capacity is concerned. The energy utilities are obliged to
purchase electricity produced from renewables within their respective supply areas, at prices which
are fixed at the national level and apply throughout the year. The price is set on the basis of the
average revenue (without countervailing tariff and sales tax) during the two previous years. The
value for 1995, as published in the official federal statistics, is the starting point for the 1997
calculations and amounts to 0.096 €/kWh.
The rate for electricity from hydro and biomass systems with an output of less than 500 kW totals at
least 80% of the average revenue (currently 0.077 €/kWh), for those with an output of more than
500 kW the feed-in tariff is at least 65% of average revenue (0.063 €/kWh).

page: 106
Subsidies and funding
There are several regional and national programmes that provide subsidies or cheap loans for
investments in biomass technology for energy production:
• ERP-Umwelt und Energiesparprogram
• DtA-Umweltprogramm (Deutsche Ausgleichbank)
• Umweltschutz-Bürgschaftsprogramm
• DtA-Umweltprogramm mit Zinzuschuss des BMU
• KfW-Umweltprogramm für Unternehmen
• Nutzung erneuerbare Energiequellen
• Agrarinvestionsförderungsprogramm
• Demonstrationsvorhaben
• Agrarinvestitionsförderungsprogramm, Baden-Württemberg
• Investionen im Regionalprogramm
• Technologie-Einführungsprojekt Holz- und Biomasseheizungen in Bayern
• REN-Programm
• Agrarinvestionsförderungsprogramm, Brandenburg
• Energieeinsparung/Erneuerbare Energiequellen
• Hessisches Energiegesetz
• Erneuerbare Energien, Mecklenburg-Vorpommern
• Erneuerbare Energien, Niedersachsen
• REN-Programm Nordrhein-Westfalen
• Erneuerbare Energien, Reinland-Pfalz
• Saarländisches Zukunftsenergieprogramm
• Vorhaben des Immisions- und Klimaschutzes, Programmteil B
• Gewinnung von Deponie- und Klärgas
• Rationelle und Umweltfreundliche Energieverwendung und Nutzung von erneuerbaren Energien
• Massnahmen zur Emissionssenkung
7.3.6 The Netherlands
The energy policy of the Netherlands aims at lowering the energy intensity of the society in the most
cost-effective way. Secondary to this is the use of renewable energy sources. The long-term
perspective is to lower the dependency on external energy sources, lowering the economic and
social cost of the energy supply and a growing sustainability of the society. Biomass plays an
important role in this policy.
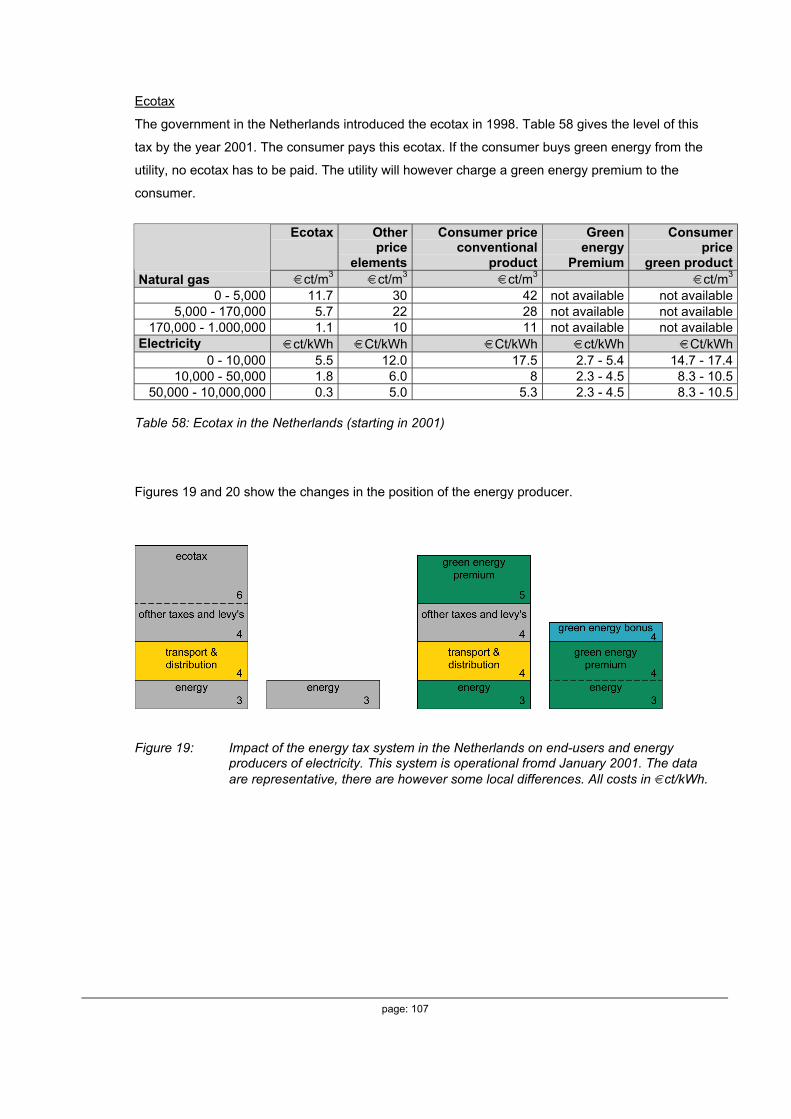
page: 107
Ecotax
The government in the Netherlands introduced the ecotax in 1998. Table 58 gives the level of this
tax by the year 2001. The consumer pays this ecotax. If the consumer buys green energy from the
utility, no ecotax has to be paid. The utility will however charge a green energy premium to the
consumer.
Ecotax Otherprice
elements
Consumer priceconventional
product
Greenenergy
Premium
Consumerprice
green productNatural gas €ct/m3 €ct/m3 €ct/m3 €ct/m3
0 - 5,000 11.7 30 42 not available not available5,000 - 170,000 5.7 22 28 not available not available
170,000 - 1.000,000 1.1 10 11 not available not availableElectricity €ct/kWh €Ct/kWh €Ct/kWh €ct/kWh €Ct/kWh
0 - 10,000 5.5 12.0 17.5 2.7 - 5.4 14.7 - 17.410,000 - 50,000 1.8 6.0 8 2.3 - 4.5 8.3 - 10.5
50,000 - 10,000,000 0.3 5.0 5.3 2.3 - 4.5 8.3 - 10.5
Table 58: Ecotax in the Netherlands (starting in 2001)
Figures 19 and 20 show the changes in the position of the energy producer.
Figure 19: Impact of the energy tax system in the Netherlands on end-users and energyproducers of electricity. This system is operational fromd January 2001. The dataare representative, there are however some local differences. All costs in €ct/kWh.

page: 108
Figure 20: Impact of the energy tax system in the Netherlands on end-users and energyproducers of gas. Up to now sustainable gas is not marketed by the energycompanies. The data are representative, there are however some local differences.All costs in €ct/m3.
Liberalisation focussed on end-user position
The government in the Netherlands uses the tax system to sustain the ‘greening’ of the society. In
this policy the power of decission is moved to the end-user. Taxing makes the use of energy
expensive. Three taxes are levied to the consumer: value added tax (‘BTW’), fuel tax
(‘Brandstoffenbelasting’) and ecotax (‘Regulerende energiebelasting’).
The end-user gains the largest benefits by not using energy. Secondary to this, the user will pay a
lower tax by using sustainable energy. In this case the user will be exempted from the ecotax, and
above this the producer will receive a bonus for producing sustainble energy.
Current price and tax levels balance the end-user prices for sustainable and not sustainable energy.
The second largest energy company (Essent) is expected to offer to the residential end-users by
January 2001 ‘green’ electricity at a lower price than conventional electricity. The background to this
is probably that Essent makes more profit on green energy than on conventional energy.
Figure 21 shows the main structure of the gas infrastructure sector in the Netherlands. Essentially
the following parties are of importance in the liberal market gas supply:

page: 109
• trading company (tradco)
• arranges the delivery of gas to the end-user
• receives payments from the end-user
• pays taxes to the government
• pays the producer, transco and disco
• end-user
• receives gas from the disco (or transco, or producer)
• pays the tradco
• distribution company (disco)
• arranges the delivery of gas to the end-user
• receives gas from the transco
• delivers gas to the end-user
• transport company (transco)
• is paid by the tradco
• receives gas from the producer (or other transco, or disco)
• producer
• is paid by the tradco
• delivers gas to the transco (or disco, or end-user)
• government taxes the end-user via the tradco for:
• BTW (VAT)
• Regulerende emergiebelasting (ecotax)
• Brandstoffenbelasting (fuel tax)
Figure 21: Schematic representation liberalised gas market in the Netherlands

page: 110
Targets
Parallel with the target on sustainable energy a target on reduction of greenhouse gas emissions is
formulated. The emission of greenhouse gases has to be reduced by 6% in 2012 latest compared to
the 1990 level. In the Netherlands situation this also means a reduction of the carbon dioxide
emissions by 6%.
The government follows three lines in forcing the development in the desired direction:
• incentives for research and development,
• tax regulation which favours sustainable energy over fossil energy and
• ‘Voluntary’ agreements with energy companies and end-users on reduction of the energy
consumption.
In 1999 the government proposed the ‘Gaswet’ (law on gas) including the possibility for the
government to force the use of sustainably produced gas. Introducing green certificates
representing an amount of green energy will do the enforcement. The government will bill energy
companies that do not have enough certificates.
The progress report ‘Duurzame energie in uitvoering, Voortgangsrapportage 1999’ gives the most
recent update on sustainable energy policy in the Netherlands. This report pays also attention to the
limited availability of biomass in the Netherlands. Already at this moment nearly all domestic
sources of biomass and organic wastes are utilised for energy generation.
Activities by energy companies
All main energy companies in the Netherlands, ESSENT, NUON and ENECO, apply, or are going to
apply, biomass or organic waste gasification in their energy supply. In most cases the produced gas
is converted to green electricity.
Notwithstanding the positive experience with adding gas from biomass and waste to the gas grid
electrification is the most used technology. Incentives to do this are the higher price of energy sold
as electricity compared to natural gas and the low investment and easy management for the
generators. An important aspect is that the generator can be moved at low cost from a depleted
landfill to a new landfill or any other application.
Some large IGCC biomass projects are planned, but the low availability of biomass is a serious
problem. There is an overcapacity of AVI’s (Afval Verwerkings Installaties: Installations to burn
municipal and industrial waste) taking nearly all biomass and organic waste from the market.
The energy efficiency of the AVI is low (about 35%) but the organic material is also nearly
indispensable in the combustion of the municipal waste.
Prospects
page: 111
The current prospect for adding gas from biomass to the gas grid is rather low. In 2000 only 0.1% of
the gas is from renewable sources, versus 3.2% for renewable electricity. Relatively high prices for
electricity, the low cost of the electrification units and the limited availability of biomass and organic
waste obstruct the addition of gas from biomass to the gas grid. In the long term Gastec expects a
better prospect for sustainable gas options.
Key elements in this development are:
• demonstration of lower cost technologies for production of gas from biomass and waste
• the higher energy efficiency of the gas grid route
• the higher flexibility of the gas grid route
• large-scale gasification of biomass, either in third countries or of imported biomass.
7.3.7 Sweden
The Swedish energy sector is experiencing a period of restructuring and deregulation. The
comprehensive development of the energy market include fields such as transmission technology,
gas power generation, biofuels and renewable energy, and environmental know-how.
Oil, hydro power, and nuclear power are the main sources of energy in Sweden. Sweden has no
commercially exploitable oil, gas or coal reserves; therefore, Sweden imports 70% of its energy raw
material needs. Most of the imports are in the form of oil, 65% of which comes from the North Sea.
Significant changes have occurred in the Swedish energy sector since 1970. Most importantly, the
proportion of the country's energy supplied by oil has fallen substantially, from 77% in 1970 to 45%
in 1996. In contrast, the proportion of the country's total energy supply accounted for by electricity
has risen from 14% to 30% over the period.
The area of energy conservation will gain in importance. The conflicting environmental goals - the
phasing out of nuclear power, the Parliament's decision to restrict further development of rivers for
the generation of hydroelectric power, and its commitment to prohibit increases in CO2 emissions
has created an energy policy dilemma. Replacing the reactors by natural gas or other fossil fuels
would mean a significant increase in Sweden's CO2 emissions.
Biofuels have come to play an increasingly important role in the Swedish energy system since the
1970s. Research is being conducted for the future use of biofuels, which looks more promising than
wind or solar power. Since 1991 a total of € 118 million has been allocated for the support of
biofuel-based combined heat and power. In 1996, use of biofuels, peat etc. amounted to about 300
PJ. The use of wood fuels within district heating has trippled since 1991 and in 1996 totalled 80 PJ.
11 PJ of biofuels were used for electricity production in 1996.
page: 112
Sweden has no actual program dedicated to the support of biogas production. In June 1997 the
Government's energy policy bill, ‘For a Sustainable Energy Supply’, was adopted by the Riksdag.
The energy policy objective remained unchanged, i.e. that in the short and long terms it secures the
availability of electricity and other energy sources under conditions competitive with the surrounding
world. An extensive program to facilitate the realignment to an ecologically and economically
sustainable energy system has been instituted. The program encompasses support for measures to
reduce electricity consumption and to increase the supply of electricity from renewable energy
sources and encourage energy research. In excess of € 1 billion has been allocated for a 5 - 7 year
period.
Over the past decade higher taxes on energy have become an increasingly important control
instrument in energy policy in addition to their purely fiscal function. In 1990/91 environmental
surcharges were imposed on fossil fuels and VAT (25%) was applied to energy. An environmental
tax is levied on carbon dioxide, sulphur and nitrogen oxide. In addition, all fuels are subject to an
energy tax. The tax rate varies depending on the user group.
All fuels used for electricity production are however exempted from the energy and carbon dioxide
taxes. Instead, the tax is collected at the consumer level. The production of electricity in so-called
combined heat and power plants using fossil fuel is subject to the energy tax but exempted from the
carbon dioxide tax. Since 1991 all fuels, except biofuels and peat, are subject to a carbon dioxide
tax. From and including 1 July 1997 industry is required to pay 50% of the general carbon dioxide
tax which is approximately € 42 per ton of carbon dioxide. Biofuels, including biogas are totally
exempt from taxation, except VAT, for all users. Biogas is thus relieved from the vehicle fuel tax.
The overall objectives of energy research are to develop the level of scientific and technical
research and expertise within the universities, university colleges and the business sector to
promote the development and realignment of the energy system. During the period 1975 - 1993
support to energy research and development amounted to 5% of the State's research and
development funding. For the budget year 1994/95 the share was just over 2%.
Power and heat research aims to promote a sturdy energy system with an environmentally sound,
sustainable, secure and efficient supply and application of energy. Research is conducted in fields
such as wind power, electricity production technology, district heating and solar power.
Research concerning bio-energy is extremely comprehensive and involves, e.g., the cultivation of
fast growing energy forests, study of the effects on land due to more intensive forestry, the recycling
of ash to forest land and alternative motor vehicle fuels.
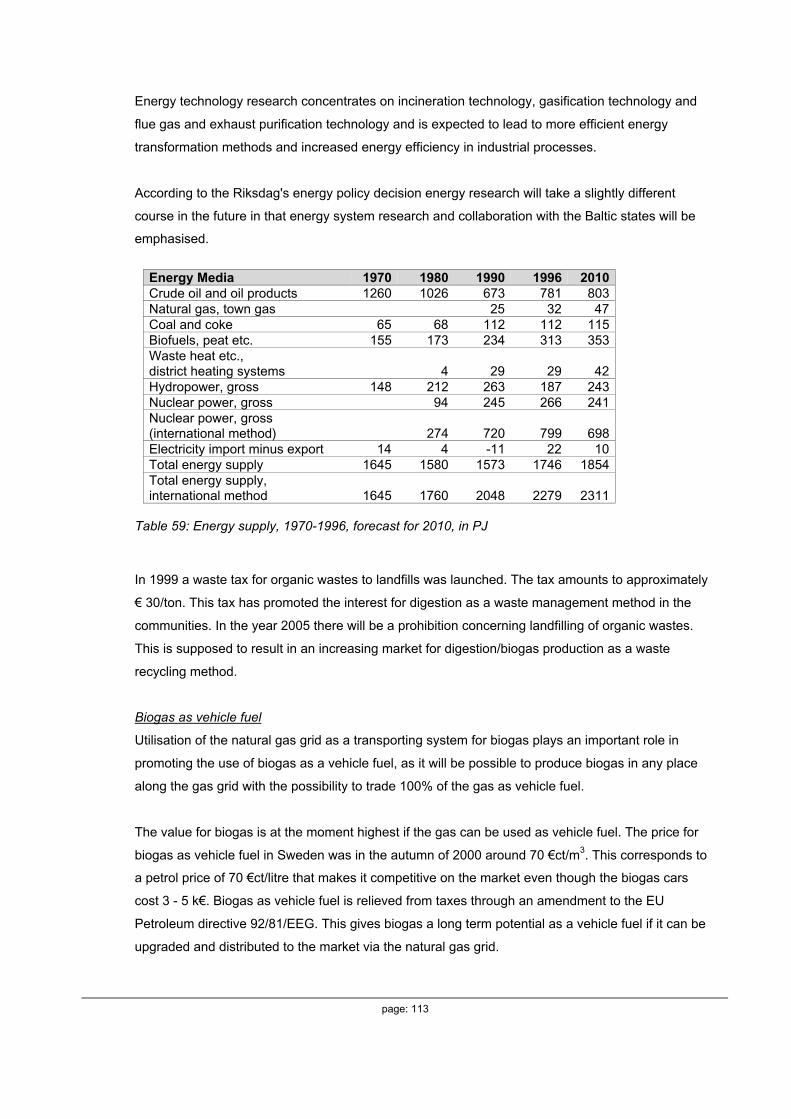
page: 113
Energy technology research concentrates on incineration technology, gasification technology and
flue gas and exhaust purification technology and is expected to lead to more efficient energy
transformation methods and increased energy efficiency in industrial processes.
According to the Riksdag's energy policy decision energy research will take a slightly different
course in the future in that energy system research and collaboration with the Baltic states will be
emphasised.
Energy Media 1970 1980 1990 1996 2010Crude oil and oil products 1260 1026 673 781 803Natural gas, town gas 25 32 47Coal and coke 65 68 112 112 115Biofuels, peat etc. 155 173 234 313 353Waste heat etc.,district heating systems 4 29 29 42Hydropower, gross 148 212 263 187 243Nuclear power, gross 94 245 266 241Nuclear power, gross(international method) 274 720 799 698Electricity import minus export 14 4 -11 22 10Total energy supply 1645 1580 1573 1746 1854Total energy supply,international method 1645 1760 2048 2279 2311
Table 59: Energy supply, 1970-1996, forecast for 2010, in PJ
In 1999 a waste tax for organic wastes to landfills was launched. The tax amounts to approximately
€ 30/ton. This tax has promoted the interest for digestion as a waste management method in the
communities. In the year 2005 there will be a prohibition concerning landfilling of organic wastes.
This is supposed to result in an increasing market for digestion/biogas production as a waste
recycling method.
Biogas as vehicle fuel
Utilisation of the natural gas grid as a transporting system for biogas plays an important role in
promoting the use of biogas as a vehicle fuel, as it will be possible to produce biogas in any place
along the gas grid with the possibility to trade 100% of the gas as vehicle fuel.
The value for biogas is at the moment highest if the gas can be used as vehicle fuel. The price for
biogas as vehicle fuel in Sweden was in the autumn of 2000 around 70 €ct/m3. This corresponds to
a petrol price of 70 €ct/litre that makes it competitive on the market even though the biogas cars
cost 3 - 5 k€. Biogas as vehicle fuel is relieved from taxes through an amendment to the EU
Petroleum directive 92/81/EEG. This gives biogas a long term potential as a vehicle fuel if it can be
upgraded and distributed to the market via the natural gas grid.
page: 114
Swedish energy taxes
The Swedish energy taxes are divided into three parts, an energy tax, a CO2-tax and a sulphur tax.
The energy tax is different for different types of fuels. The CO2-tax is based on the carbon content in
the fuel and the sulphur tax is also based on the sulphur content in the fuel. Biofuels and biogas is
relieved from all forms of tax (except VAT).
Tax
ProductUnit Energy Carbon
dioxideSulphur Total
Biogas/Biofuel 0 0 0 0Diesel 1 €/m3 214 121 0 335Petrol €/m3 415 99 0 514Fuel oil No1 €/m3 85 121 6 212Natural gas €/1000m3 28 91 0 119
Table 60: Energy taxes in Sweden. The use of electricity is taxed in Sweden. The tax variesbetween zero for the industry and 2 €ct/kWh for domestic consumption.
7.3.8 Switzerland
Renewable energy is one of the ‘hottest’ domestic political issues in Switzerland. Energy
consumption as well as energy production has been identified as the main source of air pollution.
This is significant as air pollution happens to be the ‘problem child’ of the otherwise rather
successful Swiss pollution control program. A particularly sensitive aspect is the replacement of the
country's five nuclear power plants which needs to be completed within the next 10-15 years.
Nuclear power covers 39% of the Swiss consumption of electric energy and there is no viable
alternative in sight. Energy prices are under growing pressure due to the market liberalization.
Although moving more slowly than in most other European countries, the liberalization process is
advancing at a steady pace. The resulting lower energy prices are hardly encouraging for making
the switch to high cost renewable energy from ‘clean sources’. The Swiss approach is different from
most of its European neighbors as the law does not include a quota for renewable energy (such as
Spain e.g.) or a legal requirement to accept renewable energy such as in Germany
(Ruecknahmegesetz). The goal is to be reached by a mix of financial incentives and subsidies.
Partly inspired by the German example, the Swiss Parliament is haggling over the final touches of
what is described as an ecological tax law reform. The goal is to tax ‘wasteful use of energy’ as well
as energy produced by means which are classified as ‘environmentally unfriendly’. The resulting
financial pressure is expected to further investments in relevant equipment and technologies. The
new revenues which will be generated will be recycled back into the economy to promote the use of
renewable energy, energy efficiency and relevant R&D. Some 350 - 470 M€ will become available
annually as a result. Some of these funds will flow into the follow-up program of ‘Energy 2000’.
‘Energy 2000’, which is about to be concluded, was launched by the Government in 1991 to further
renewable energies, energy efficiency and R&D. According to a June 1999 report, some 62% of the
goals in the heating sector and about 88% of the targets in the field of electrical power had been

page: 115
reached by that time. The availability of funds triggered a number of interesting R&D programs
which, in turn, are producing promising results. As funding will increase in the future, R&D is
expected to grow considerably. The follow-up program of ‘Energy 2000’ provides a generous annual
270 - 295 M€ for a period of 10 years. Experts feel that the new private sector investments which
will be triggered will more than match this amount. 13
Swiss renewable energy programs are focussing on biomass (wood, plants etc.), wind generated
energy, photovoltaic and solar energy, heat pumps (making use of geothermal energy etc.) as well
as sources of energy resulting from bacteriological processes such as fermentation (sewage
treatment plants, fermentation vessels etc.).
13 U.S. Department of Commerce - National Trade Data Bank, November 3, 2000

page: 116
8 CONCLUSIONS AND RECOMMENDATIONS
Conclusions
• The production and upgrading of biomass to biogas, suitable for addition to the gas grid, is a
proven technology. Several areas, such as control and analysis systems and cost reduction,
need further development.
• The production of pipeline quality gas from biomass via thermal processes, combines
essentially two proven technologies: syngas production from biomass and syngas conversion to
methane.
• The introduction of biogas into separate town gas grids has been proven to be successful.
• Production, upgrading to natural gas quality and addition to the gas grid leads to a very high
utilisation rate of energy from biomass.
• Taxes form a marketing instrument to promote biogas.
• Delivery of biogas off-spec requires a gas quality tracking system and close communication
between the upgrading plant and the grid owner.
The following roadblocks for introduction of biogas to the gas grid were identified
• Missing regulation and legislation of access rights can inhibit biogas introduction.
• The biogas production site should be located near a gas pipeline and a widely distributed
natural gas grid is recommended.
• Electricity production out of biomass is in some countries more profitable than production of
biogas, due to the existing tax instruments.
• The tax instruments are not unified in the EU countries.
Recommendations
• Standardisation for the quality aspects and access rights within Europe for adding biogas to the
gas grid.
• A wide band gas quality policy on new gas appliances
• Stimulation of demonstration and implementation projects at various scale sizes where an
increased value of biogas and a higher usage rate can be realised.

page: 117
9 REFERENCES
1 European Commission: Energy for the future: Renewable sources of energy - White Paper
for a community Strategy and Action Plan, COM (97) 599 final, Brussels 1997.
2 D.O. Hall, J.I. House: Biomass energy development and carbon dioxide mitigation options,
Division of Life Sciences, King's College, Londen.
3 J. Badin, J. Kirschner, R. McGuckin (1999): Biomass Energy - A fuel switching strategy to
reduce net carbon emissions and enhance asset utilisation, ID#99/58, United BioEnergy
Commercialisation Association.
4 D.L. Klass (1999): An introduction to biomass energy research - a renewable resource,
Biomass Energy Research Association.
5 Infocentrum duurzame energie (1999): Kerngegevens bio-energie in Nederland 1999,
Informatiecentrum Duurzame Energie.
6 EC (1996): Green Paper: Renewable sources of energy, publication COM(96) 576 final.
7 IGU (1999), Gasification: tomorrow's energy plants in a carbon-constrained world.
8 Polman E.A., Rens A.M. van: Inventarisatie van gasvormige energiedragers in Europa,
GAVE rapport 9903, NOVEM, Utrecht, 1999.
9 Myken, A.N.: Known technologies for biogas upgrading (Danish version). Danish Gas
Technology Centre a/s. Hoersholm, June 1994.
10 Lindboe, H.H. et al.: Progress Report on the Economy of Centralised Biogas Plants. Danish
Energy Agency. Copenhagen, February 1995.
11 Danish Bioenergy (Danish version). Special edition on biogas, June 1999.
12 Larsen, L.M., Jensen-Holm, C.: Gasrensning – Totalrensning af biogas. Danmarks
Ingeniørakademi. Lyngby, July 1987.
13 Wellinger, A., Lindberg, A.: Biogas upgrading and utilisation. IEA Bioenergy, Task 24:
Energy from biological conversion of organic waste.

page: 118
14 Upgrading Landfill Gas to Natural Gas Quality in the Netherlands. CADDET, renewable
energy. Technical brochure No. 32. CADDET, Harwell, UK.
15 Hagen, M.H., Wever, J.: Gas at Distribution Quality from Pig Manure Biogas. Gastec.
Apeldoorn, April 1994.
16 Sirkar, K.K. et al.: Liquid membrane purification of biogas. The New York State Energy
Research and Development Authority. March 1991.
17 Eriksen, K., Jensby, T., Norddahl, B.: The upgrading of biogas to be distributed through the
natural gas network – environmental benefits, technology and economy. 1998 International
Gas Reseach Conference. San Diego, 8-11 November 1998.
18 Walsh, J.L. et al.: Handbook on biogas utilisation. Environment, Health and Safety Division,
Georgia Tech Research Institute. Atlanta, February 1988.
19 Ullmann’s Encyclopedia of Industrial Chemistry, Sixth Edition, 1999 (electronic release).
20 Middelkoop B. van, Nisselrooy P. van: Methaniseringsinstallatie, Gastec,1999 (confidential).
21 Laat J.C. de, Stokman J.: Energie uit synthese gas, Gastec 1999.
22 DVGW: Arbeitsblatt G 260 - Gasbeschaffenheit. , DVGW, Bonn, 2000.
23 DVGW: Arbeitsblatt G 261 - Prüfung der Gasbeschaffenheit. ZfGW-Verlag, Frankfurt, 1985.
24 DVGW: Arbeitsblatt G 262 - Nutzung von Deponie-, Klär und Biobassen, ZfGW-Verlag,
Frankfurt, 1991
25 ISO 13868 Natural gas - Quality designation.
26 ISO 13443 Natural gas - Standard reference conditions
27 ISO 15403 Natural gas - Designation of the quality of natural gas for use as a compressed
fuel for vehicles
28 IGU: Variable Gas Quality in Domestic and Commercial use. 21 World Gas Conference,
Nice, 2000.

page: 119
29 EN 437: Test gases - Test pressures - Appliance categories, 1993.
30 ÖVGW: Mitteilung G 33 - Deponiegas, ÖVGW Wien, 1992.
31 Heinrich h., Wegener R.: Classification methods for the knock resistance of gaseous fuels -
an attempt towards unification, 199 ASME ICE Fall Technical Conference, Ann Arbor, 1999.
32 ISO/FDIS 15403: Natural gas - Designation of the quality of natural gas for use as a
compressed fuel for vehicles, Geneva, 2000.
33 European Union: “Directive 98/30/EG”, The official newspaper of the European Union
21.7.1998.
34 ISO/DIS 14532.2 Natural Gas - Terminology.
35 EC/PLE, Study on Interoperability of Gas Networks in EU Countries, Final Report,
24.06.1999.
36 Swedish standard 155438: Biogas as fuel for high-speed Otto engines.
37 Jean Claude Weber, Biogaseinspeisung ins öffentilche Erdgasnetz, GWA2/98.
38 ISO 6976:”Natural gas - Calculation of calorific values, density, relative density and Wobbe
index from composition”.
39 ISO 6974: “Natural gas - Determination of composition with defined uncertainty by gas
chromatography”.
40 ISO 6975: “Natural gas - Extended analysis”.
41 ISO 6326: “Natural gas - Determination of sulphur compounds”.
42 ISO 10723: ‘Natural gas - Performance evaluation for on-line analytical systems”.
43 DVGW G 492: “Anlagen für die Gasmengenmessung”.
44 DVGW G 685: “Gasabrechnung”.
45 ISO 15970: “Natural gas - Measurement op properties - Volumetric properties”.
page: 120
46 ISO 15971: “Natural gas - Measurement op properties - Combustion properties”.
47 ISO 15972: “Natural gas - Measurement op properties - Single components and
condensation properties”.
48 E.V.A - the Austrian Energy Agency, 1998.
49 Energy in Europe. 1999 - Annual Energy Review. Directorate-General for Energy. European
Commission. January 2000.
50 Særnummer af Dansk Bioenergi. ISSN 0908-0260. Risskov: Biopress, June 1999.
51 Energy 21. Danish Energy Agency. Copenhagen, April 1996.
52 Follow-up on Energy 21 - Status of Energy Planning June 1999. Danish Energy Agency.
Copenhagen, July 1999.
53 Slurry tank gastight covering generalization with valorization of the biogas produced in
France and Catalonia. Altener contract no. XVII/4.1030/Z/98-402. Labège: Eden, July 2000.
54 Information from ”Association Eden”. Labege, August 2000.
55 Tentscher, W. Information on biogas upgrading in Germany. September 2000.
56 Tentscher, W.: Der Landwirt als Produzent von Grünem Gas im Netzverbund – Neue
Perspektiven für die Landwirtschaft. Der Landwirt als Energiewirt, II. Internationale
EUROSOLAR-Konferenz, im Rahmen der Grünen Woche Berlin. Berlin, January 14-15,
2000.
57 Fachverband Biogas e.V. Freising, Germany. (www.boxer99.de/biogas.htm)
58 EWAB Marsroutes 2020, NOVEM, August 2000.
59 Derde Energienota ("Third minute in Energy") Ministry of Economic affairs.
60 du Preez, J. et al.: Opgradering af biogas til naturgaskvalitet ved hjaelp af
lavtryksmembraner. Slutrapport. Odense: Bioscan A/S, July 2000.
page: 121
61 Kugel, G., Lohmann, J.: Bio-Erdgas-L vom Gruppenklärwerk I des Niersverbandes. Gwf-
gas/erdgas 124 (1983) 379-385
62 Lohmann, J.H.: Waste Management & Research (1984).
63 Weyer, H., Schwerfer, H.J. Kommunalwirtschaft (1983).
64 Jens Bo Holm-Nielsen, MSc. & Teodorita Al Seadi, Msc. South Jutland University Centre,
Bioenergy Department.
65 Press release of 03.07.00 of Fachverbandes Biogas: Biogaskonsens notwendig.
66 Gezetz für den Vorrang Erneuerbarer Energien (Erneuerbare-Energien-Gesetz -EEG).
67 Klimaschutz durch Nutzung erneuerbarer Energien. Studie im Auftrag des
Bundesministeriums für Umwelt, Naturschutz und Reaktorsicherheit und des
Umweltbundesamtes, Berlin (UFOPLAN-Vorhaben 298 97 340) -Bonn, Münster, Stuttgart,
Wuppertal, 31. Oktober 1999.
68 Kabinett treibt globale Klimavorsorge voran, Die Säulen des nationalen
Klimaschutzprogramm stehen.

page: 122
APPENDIX 1: DEFINITIONS, ABBREVIATIONS, AND UNITS
Definitions
Biogas Combustible gas obtained from a biological process
Biomass Any organic material obtained from biological processes
Digested manure Biomass leaving the digestion tank
Syngas In this report: gas directly obtained from a biomass or organic waste by pyrolysis orthermal gasification. Syngas can also be produceded from fossil energy sources ascoal or hydrocarbons.
AbbreviationsPSA Pressure Swing Adsorption: in this report a process to remove carbon dioxide from
raw biogas to adjust the Wobbe-index to specification.
CHP Combined Heat and Power production
IGCC Integrated Gasification Combined Cycle
€ 1 Euro
k€ 1,000 Euro = kilo Euro
M€ 1,000,000 Euro = mega Euro
c€ 0.01 Euro = Euro cent
Conventions on units
m3 Througout this report: normal cubic meter
concentration Mole procentage, mole fractions or ppm’s, unless otherwise indicated. All volume
percentages are considered like mole percentages
bar Pressure above atmospheric in bar (gauge pressure)
mbar Pressure in mbar

page: 123
APPENDIX 2: EXAMPLES OF PROCESSES FOR PRODUCTION OF SYNGAS FROM BIOMASS ANDORGANIC WASTE
Fixed bed
• Bioneer
• Eisenmann fixed bed
• Lurgi-MPG
• PRME
• Prometheus
Fluidised bed
• BTS fluid bed
• Eisenmann fluid bed
• Foster-Wheeler
• Lurgi fluid bed
• Pyroflow
• SELTEC
• Stork
• TPS
Pyrolysis
• Batelle/Ferco
• Brightstar
• EVN
• Gibros
• Noell
• Thermoselect
• Thermogenics
Hydrogenation
• ECN
This appendix summarises the description of some thermal gasification processes as far as readily
available. Some descriptions are rather complete, others are rather limited due to a lack of relevant
published information.

page: 124
fixed bed gasification: BIONEER
Process name: BIONEER
Manufacturer Foster Wheeler Energia Oy
Origin: Finland
Capacity: 5 MWth
Description: Updraft fixed-bed
• pressure Atmospheric
• reactants Air
Status: 10 plants successful in operation since 1982
Efficiency: 95 - 97%
fixed bed gasification: EISENMANN
Process name: Eisenmann rotary drum gasification
Description: rotary drum gasifier
• pressure atmospheric
• temperature 400 - 450 °C
• reactants none
This process uses a rotary drum for the gasification biomass or other organic materials. In this reactor the
biomass is converted into lean gas. The energy for drying, heating and endothermic gasification is provided
by a hot gas recirculation system. A part of the required energy is obtained from the reaction of the organic
material reacts with the oxygen entrained with the biomass.
A fan extracts the process gas from the reactor. The dust particles entrained from the reactor with the
exhaust process gas are separated out by a cyclone. A part of the exhaust process gas is transferred
directly to the combustion chamber, while the remaining is heated to max. 650 °C by a gas burner in a gas
heater and then returned to the gasification reactor. This recirculation system is also used at start up to heat
the plant to the required operating temperature.
The inclination and speed of the drum reactor can be varied. The level, dwell time and circulation of the
material in the reactor are controlled via the inclination, speed, shape and arrangement of the guide vanes.
Material and process air flow concurrently through the reactor.
The temperature of the exhaust gas from the reactor and of the return gas is measured and controlled
continuously. The temperature in the reactor is set to a value between 400 and 450 °C. The rotating drum
reactor is installed in a static housing with external insulation.
Generated gas is used mainly in a spark-ignition gas engine for generating electricity. The exhaust gas will
pass a heat exchanger and the recovered heat will be used for drying the biomass feed.
page: 125
fixed bed gasification: LURGI-MPG
Process name: Lurgi Multi Purpose Gasification
Manufacturer Lurgi
Origin: Germany
Capacity: typically 150,000 tons/year
Description: fixed bed gasifier
• pressure 1200 - 1450 °C
• temperature 30 - 75 bar
• reactants oxygen and steam
Status: demonstrated for coal and refinery residues
Efficiency not reported
The MPG gasification is carried out at temperatures of 1200 - 1450 °C and pressures of between 30 and 75
bar. The feedstock enters the refractory-lined reactor through a top-mounted, specially designed burner.
Oxygen is mixed with steam as a moderator prior to being fed to the burner.
Reactor configurations
Soot and metals ashes are removed from the raw syngas by means of wash water. The resulting soot slurry
is routed to slurry treatment. After separation of the ash-soot, the greater part of this water is recycled as
return water to the washing units. The excess water is routed to waste water treatment. The gasification unit
typically consists of three main components: the reactor, the syngas cooling section and the carbon
handling system complemented by the Metals Ash Recovery System (MARS).
To provide maximum feedstock and product flexibility, Lurgi offers two variants for the syngas cooling
section, the boiler and the quench configuration. The boiler configuration is suitable for feedstocks with low
concentrations of contaminants, generates considerable amounts of high-pressure steam and offers highest
energy efficiency. The quench configuration is required when the feedstock contamination is above the
boiler's. This configuration allows feedstocks like coke/coal slurries and wastes, offers highest flexibility at
lowest investment cost.
Quench configuration
In the quench configuration, the hot raw gas from the reactor is shock-cooled, ‘quenched’, with water which
is injected into a quench nozzle. The gas is cooled almost instantaneously to steam saturation temperature
and leaves the quench separator sideways. When processing high-ash feedstocks, the molten slag forming
flows down the reactor wall into the quench nozzle where it is blast-cooled to form glassy spheres which are
withdrawn via the slag hopper. This glassy slag carries most of the heavy metals and water-insolubles. It is
non-leachable and can be easily disposed of (e.g. in road construction).
The remaining ash and soot particles are removed from the gas in the venturi scrubber downstream of the
quench. Further cooling occurs in a medium-pressure steam boiler, which generates steam at 15 to 30 bars.
page: 126
Final cooling is accomplished by means of cooling water in a gas cooler from where the gas is routed to the
desulfurisation unit (e.g. Rectisol unit). The soot slurry forming in the venturi scrubber is collected together
with the condensates and sent to the metals ash recovery system.
Boiler configuration
In the boiler configuration the hot raw gas enters directly a high-pressure steam boiler. The 100 to 140 bar
steam generated can be used to power a steam turbine or in an IGCC power plant.
Removal of the ash-soot particles from the raw gas is accomplished in a two-stage water wash. The latter
consists of a wash quench with a soot separator followed by a packed tower, the ash-soot scrubber. After
leaving the scrubber at a temperature of about 40 °C, the gas can be desulfurised.
Metals Ash Recovery System (MARS)
The soot slurry from the gasification unit (in both the quench and boiler configuration) is routed to the Metals
Ash Recovery System (MARS). The slurry is filtered leaving a filter cake with residual moisture of about 80
wt.% and a clear water filtrate, which is partly recycled as quench or scrubbing water. The filter cake is
subjected to controlled combustion in a multiple-hearth furnace. This type of furnace allows the combustion
of the soot to take place under conditions where the vanadium oxides (of refinery residues) neither melt nor
corrode. The product is an approx. 75 wt.% vanadium concentrate (containing also the nickel and iron from
the crude) which can be sold to metal reclaimers. The process is autothermal in principle, the heat of
combustion being sufficient to evaporate the moisture content of the filter cake.
Depending on the feedstock composition, the oxidant and the actual gasification temperature, the raw
syngas (H2, CO) contains H2O, CO2, CH4, H2S, N2, NH3, HCN and Ar in various concentrations.
A 150,000 ton/year plant is located in Germany and operated by Schwarze Pumpe. Possible feedstocks are
sewage sludge, household rubbish, plastic and wood. Products of the plant are methanol, electricity and
steam.
fixed bed gasification: PRME-GASIFIER
Process name: PRME
Manufacturer PRM Energy Systems, Inc.
Capacity: 1000 tons/day municipal waste
Description:
• pressure atmospheric
• temperature 600 – 1300 ºC
• reactants air or oxygen
Homepage http://www.prmenergy.com
The PRME technology is designed as an air blown atmospheric gasifier, which operates under slightly
page: 127
negative pressure. Depending upon the feed stock, the air blown system produces a syngas containing a
low calorific value of 3.7 to 7.5 MJ/m3. A higher calorific value can be reached with the use of oxygen
instead of air.
A complete PRME biomass gasification system includes a fuel metering bin, the reactor/gasifier, the
combustion tube and chamber, the gasifier cooling water system, water cooled ash discharge conveyors,
multi-zoned combustion air supply, rotary feeders and instrumentation required to provide automatic control
over the process. The entire gasification/combustion process, from feed to ash discharge, is controlled
manually or by computer.
The PRME gasifier is basically a vertical cylindrical steel shell, reduced in diameter in the upper portion and
lined with a refractory capable of withstanding temperatures as high as 1560 ºC in a reducing atmosphere.
The cross sectional area of the upper portion of the gasifier is reduced to provide the turbulence required to
insure proper mixing of the product gas and the combustion air introduced into the combustion tubes in this
area of the gasifier.
Fuel is metered to the gasifier from the fuel metering bin. This bin is equipped with an input conveyor and an
output conveyor that delivers fuel to the gasifier. The speed of the output conveyor is automatically adjusted
by the automatic control system to maintain a pre-set temperature in the first stage gasification zone.
Discharge from the output conveyor is directed through an impact weigh metering device that provides
precise indication and control of the fuel feed rate.
Fuel is introduced to the gasifier by a water-cooled screw conveyor that discharges into the drying and
heating zone of the gasifier. The gasification process is controlled by the proportioned application of
gasification and combustion air in a manner that supports efficient gasification.
Residence time in the gasifier is varied by a residence control system that is adjusted to achieve a target
carbon content of the ash residue. In the gasification zone of the gasifier, approximately 10 to 12% of the
stoichiometric air requirement is admitted into the gasification air distribution area. The application of
gasification air is multi-zoned and is controlled to maintain the proper temperature required to volatilise the
biomass and allow partial combustion of the fixed carbon. Temperatures in this zone is controlled between
600 oC and 1300 oC, depending on the particular biomass fuel and the required ash quality. A low
gasification airflow rate (< 0.1m/s) through the gasification zone, coupled with a low feed stock entrypoint
and continuous ash discharge minimises the amount of particulate matter entrained in the gasifier exhaust.
Combustion of the gases starts in the combustion tube assembly where the temperature of the gases is
increased to promote thermal cracking of tars and hydrocarbons that were liberated during gasification.
Partial combustion of gases in the combustion tube assembly, the use of mechanical bed agitation and
precise control of the zoning of gasification air produces a clean, low energy content gas that can be burned
in the combustion tube and chamber for drying applications or in the radiant section of the boiler. The
gasification rate is controlled by demand from the dryer or boiler. The boiler exhaust is clean and may be

page: 128
used for direct drying applications, including food grains. Alternatively, when biomass destruction without
energy recovery is desired, the clean gases may be diverted to the atmosphere via the combustion tube
vent.
A 1,000 tons/day (800 tons/day dry) oxygen fed system designed to gasify processed municipal solid waste
containing 10% or 20% moisture and a calorific value of 18 MJ/kg will produce the following clean syngas
with a composition as given in table 61.
Quality Value UnitRDF with10%Moisture
RDF with20%Moisture
Components• Carbon monoxide• Hydrogen• Carbon dioxide• Nitrogen and argon• Water
344219
23
2943-22
23
%%%%%
Calorific value 9.7 9.3 MJ/m3
Table 61: Syngas composition and properties from the PRME process
Two plants are on the program:
• Tulsa, Oklahoma Demonstration plant
• A 3.5 MW Biomass Fired Engine Generator system utilising olive residues as feed stock is scheduled
for start-up in August 2000.
Data on costs are available for the 1,000 ton/day (800 tons/day dry) oxygen fed system designed to gasify
processed municipal solid waste. This system consists of two Model KC-320 gasifiers, each 19 M€ and one
450 TPD Oxygen system at 11 M€. This 50 M€ budget comprises a turnkey plant for the production of
electricity from municipal waste.

page: 129
fixed bed gasification: Prometheus
Process name: Prometheus
Manufacturer ProCone GmbH
Capacity: 0.2 - 5 MWe
Description:
• pressure atmospheric (sligtly below atmospheric to avoid atmopheric emissions)
• temperature multistage gasification:
• drying 200 oC
• gasification 650 oC
• oxidation 1600 oC
• reduction 800 oC
• feed old and fresh wood waste
• reactants air
Status: mature projects
Application combined power and heat generation
Information: personal communication
Efficiency 84% of the energy in the biogas is transferred to the syngas
Quality Unit ValueComponents• Carbon monoxide• Hydrogen• Methane• Carbon dioxide• Nitrogen• Water
%%%%%%
14 – 2410 – 22
0- 68 – 16
balance8 – 10
Calorific value MJ/m3 4 - 6
Table 62: Syngas composition and properties of the Prometheus process
fluidised bed gasification: BTS fluidised bed
Process description pressurised fluidised bed
Manufacturer BTS
Reaction temperature about 750 °C
Reaction pressure about 4 bar
Reactants steam, flue gases
Clean up cyclone, downdraft evaporator, dust filter, quench cooler

page: 130
fluidised bed gasification: EISENMANN FLUIDISED BED
Process description pressurised fluidised bed
Manufacturer Eisenmann
Reaction temperature about 750°C
Reaction pressure about 4 bar
Reactants steam, flue gases
Clean up cyclone, downdraft evaporator, dust filter, quench cooler
Properties syngas
Hydrogen 20%
Calorific value medium heating value
Eisenmann offers the gasification of organic materials and biomass using a pressurised fluidised bed. In the
reactor, at a temperature of about 750 °C and a pressure of about 4 bars, biomass is converted to syngas
using steam. After leaving the gasifier, the heat in the syngas is used to generate steam for the gasification
process. After this heat exchange the syngas is cleaned and cooled further down by using a cyclone, a
downdraft evaporator, a dust filter and a quench cooler.
A part of the generated gas is taken away from the gasifier and passed through in a hot gas dust filter. In a
jet compressor this gas flow will be compressed by using generated steam and will be incinerated in a
combustion chamber. The flue gas generated by the incineration will be fed into the gasifier and will be used
there as rotational flow gas, as reactant and as heat supply in the gasification process.
In this gasification process, the heat for gasification is generated outside of the gasification reactor and will
be transmitted in an indirect way to the starting material. This generates a syngas with a medium calorific
value and a relatively high portion of hydrogen of approximately 20%.
fluidised bed gasification: FOSTER WHEELER
Process name: FW CFB Foster Wheeler circulating fluidised bed gasification
Capacity: 17 - 60 MWth
Description: atmospheric fluidised bed gasifier
• feed biomass with 20 - 60% moisture
• pressure atmospheric
• temperature 800 - 1000 °C
• reactant air
Status: commercial
Efficiency: 99.8%
page: 131
Nearly two hundred Foster Wheeler combustion and gasification systems are in operation. Recently a FW
CFB was delivered to the Lathi plant in Finland. The FW CFB process is used to deliver heat and
combustible gases to a power plant. The FW CFB performs partly as a gasifier and partly as a combustor.
The syngas has a calorific value of only 2 MJ/m3. The conversion of carbon to fuel gases and heat reaches
however an efficiency of 99.8%.
fluidised bed gasification: LURGI FLUID BED
Process description circulating fluidised bed
Manufacturer Lurgi
Reaction temperature about 750 °C
Reaction pressure atmospheric
Reactants air
Clean up two sequencing cyclones, cooling, bag house filter, two stage scrubbing
In an international consortium Lurgi is installing an 8000 kg/hour gasifier near Pisa (Italy). This gasifier is a
part of a biomass fired Integrated Gasification Combined Cycle (IGCC) plant. The total energy energy
efficiency of the plant is 32%. Expecting about 40 - 50% efficiency for a 10 MWe combined cycle plant, the
gasification efficiency is about 80 - 70%. The ‘first of a kind’ cost of this installation are 2300 €/kWe. Later
plants can be built at a substantially lower cost.
Quality Value UnitComponents• Carbon monoxide• Hydrogen• Methane• Other hydrocarbons• Carbon dioxide• Nitrogen and argon• Water
2217
42
1341
1
%%%%%%%
Calorific value 7 MJ/m3
Table 63: Syngas properties from the Lurgi fluidised bed process
A Lurgi CFB-gasifier system including cleaning will cost about 50 M€ for 100 MWth input.
fluidised bed gasification: PYROFLOW
process name: Pyroflow also known as Ahlstrom Pyropower
Manufacturer FOSTER WHEELER ENERGIE OY
Origin: Finland
description: atmospheric, circulation fluidised-bed gasifier
capacity: 15 - 35 MWth
number: 5 plants in operation since 1981
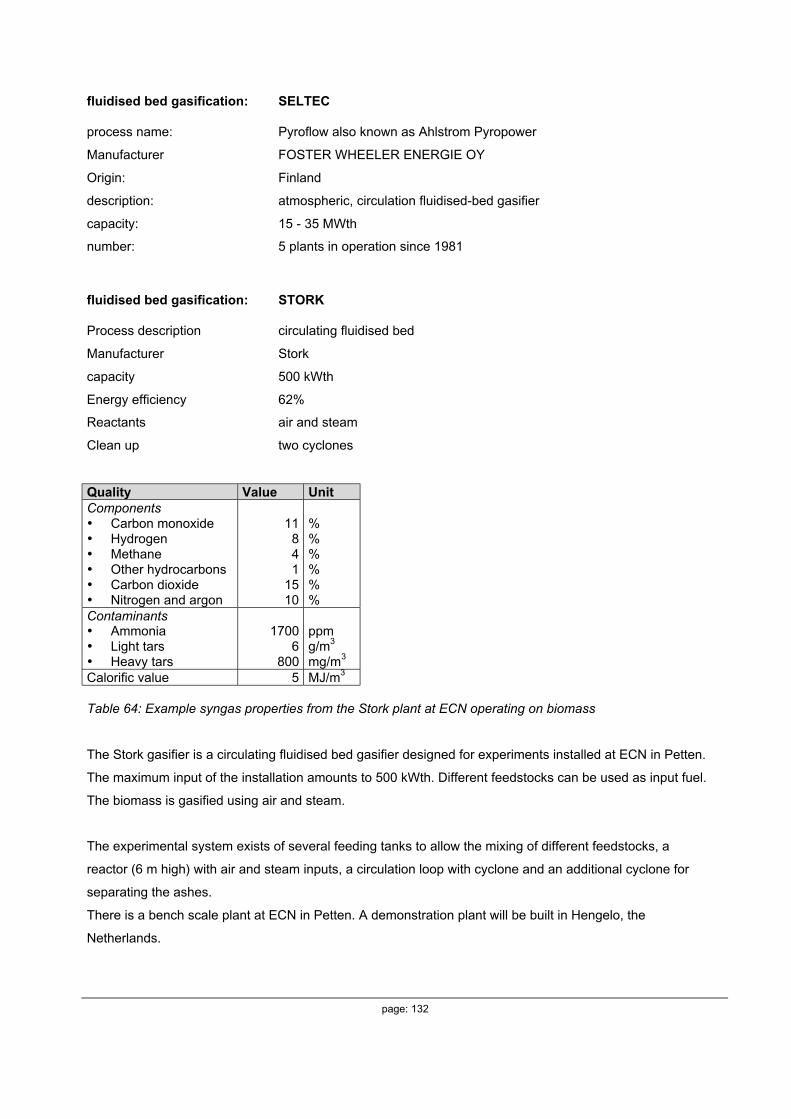
page: 132
fluidised bed gasification: SELTEC
process name: Pyroflow also known as Ahlstrom Pyropower
Manufacturer FOSTER WHEELER ENERGIE OY
Origin: Finland
description: atmospheric, circulation fluidised-bed gasifier
capacity: 15 - 35 MWth
number: 5 plants in operation since 1981
fluidised bed gasification: STORK
Process description circulating fluidised bed
Manufacturer Stork
capacity 500 kWth
Energy efficiency 62%
Reactants air and steam
Clean up two cyclones
Quality Value UnitComponents• Carbon monoxide• Hydrogen• Methane• Other hydrocarbons• Carbon dioxide• Nitrogen and argon
11841
1510
%%%%%%
Contaminants• Ammonia• Light tars• Heavy tars
17006
800
ppmg/m3
mg/m3
Calorific value 5 MJ/m3
Table 64: Example syngas properties from the Stork plant at ECN operating on biomass
The Stork gasifier is a circulating fluidised bed gasifier designed for experiments installed at ECN in Petten.
The maximum input of the installation amounts to 500 kWth. Different feedstocks can be used as input fuel.
The biomass is gasified using air and steam.
The experimental system exists of several feeding tanks to allow the mixing of different feedstocks, a
reactor (6 m high) with air and steam inputs, a circulation loop with cyclone and an additional cyclone for
separating the ashes.
There is a bench scale plant at ECN in Petten. A demonstration plant will be built in Hengelo, the
Netherlands.
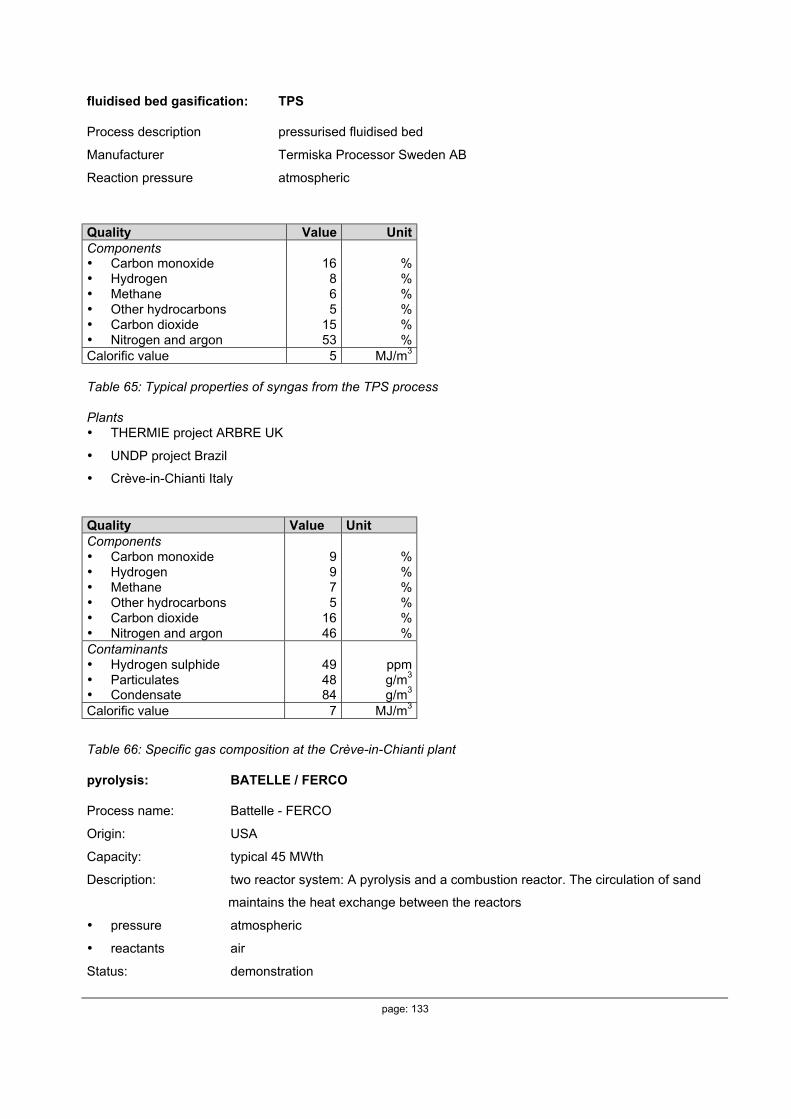
page: 133
fluidised bed gasification: TPS
Process description pressurised fluidised bed
Manufacturer Termiska Processor Sweden AB
Reaction pressure atmospheric
Quality Value UnitComponents• Carbon monoxide• Hydrogen• Methane• Other hydrocarbons• Carbon dioxide• Nitrogen and argon
16865
15 53
%%%%%%
Calorific value 5 MJ/m3
Table 65: Typical properties of syngas from the TPS process
Plants• THERMIE project ARBRE UK
• UNDP project Brazil
• Crève-in-Chianti Italy
Quality Value UnitComponents• Carbon monoxide• Hydrogen• Methane• Other hydrocarbons• Carbon dioxide• Nitrogen and argon
9975
16 46
%%%%%%
Contaminants• Hydrogen sulphide• Particulates• Condensate
494884
ppmg/m3
g/m3
Calorific value 7 MJ/m3
Table 66: Specific gas composition at the Crève-in-Chianti plant
pyrolysis: BATELLE / FERCO
Process name: Battelle - FERCO
Origin: USA
Capacity: typical 45 MWth
Description: two reactor system: A pyrolysis and a combustion reactor. The circulation of sand
maintains the heat exchange between the reactors
• pressure atmospheric
• reactants air
Status: demonstration
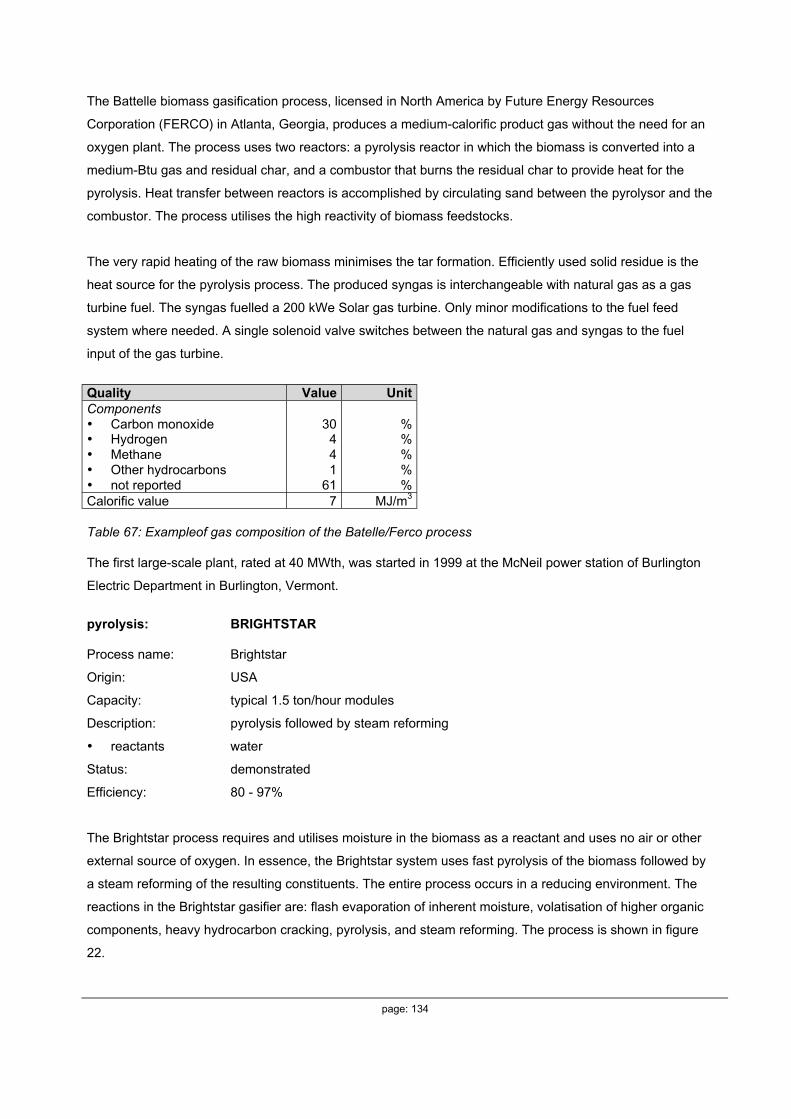
page: 134
The Battelle biomass gasification process, licensed in North America by Future Energy Resources
Corporation (FERCO) in Atlanta, Georgia, produces a medium-calorific product gas without the need for an
oxygen plant. The process uses two reactors: a pyrolysis reactor in which the biomass is converted into a
medium-Btu gas and residual char, and a combustor that burns the residual char to provide heat for the
pyrolysis. Heat transfer between reactors is accomplished by circulating sand between the pyrolysor and the
combustor. The process utilises the high reactivity of biomass feedstocks.
The very rapid heating of the raw biomass minimises the tar formation. Efficiently used solid residue is the
heat source for the pyrolysis process. The produced syngas is interchangeable with natural gas as a gas
turbine fuel. The syngas fuelled a 200 kWe Solar gas turbine. Only minor modifications to the fuel feed
system where needed. A single solenoid valve switches between the natural gas and syngas to the fuel
input of the gas turbine.
Quality Value UnitComponents• Carbon monoxide• Hydrogen• Methane• Other hydrocarbons• not reported
30441
61
%%%%%
Calorific value 7 MJ/m3
Table 67: Exampleof gas composition of the Batelle/Ferco process
The first large-scale plant, rated at 40 MWth, was started in 1999 at the McNeil power station of Burlington
Electric Department in Burlington, Vermont.
pyrolysis: BRIGHTSTAR
Process name: Brightstar
Origin: USA
Capacity: typical 1.5 ton/hour modules
Description: pyrolysis followed by steam reforming
• reactants water
Status: demonstrated
Efficiency: 80 - 97%
The Brightstar process requires and utilises moisture in the biomass as a reactant and uses no air or other
external source of oxygen. In essence, the Brightstar system uses fast pyrolysis of the biomass followed by
a steam reforming of the resulting constituents. The entire process occurs in a reducing environment. The
reactions in the Brightstar gasifier are: flash evaporation of inherent moisture, volatisation of higher organic
components, heavy hydrocarbon cracking, pyrolysis, and steam reforming. The process is shown in figure
22.

page: 135
The process achieves a 97% conversion of biomass carbon to useful syngas without producing troublesome
tars, oils, or other contaminating effluents. The process is robust in its ability to handle feedstocks with
varying degrees of inherent moisture, ranging from dry wood (in which case moisture is actually added to
the feedstock) to organic sludge with moisture contents of over 60%. In traditional gasification systems any
moisture in the feedstock results in an energy efficiency penalty. This process utilises a part of the moisture
to produce hydrogen and other combustible gases. At 40% moisture in the feedstock, the system achieves
an efficiency of about 80%.
Figure 22: Process Flow Diagram of the Brightstar process Feed System
Depending on the size, consistency and nature of the biomass, the material is often routed through a
hammer-mill or tub grinder/classifier before entering the plant’s metering bin located above the feed system.
The material is fed by gravity into the metering bin where it enters a screw feed system. The material is then
conveyed through a proprietary sealing mechanism that serves as the pressure seal on the front end of the
system, keeping air out of the reformer and keeping syngas from backing up into the feed system. The
material received from the screw feeder is then conveyed with recycled compressed syngas into the primary
heat exchanger.
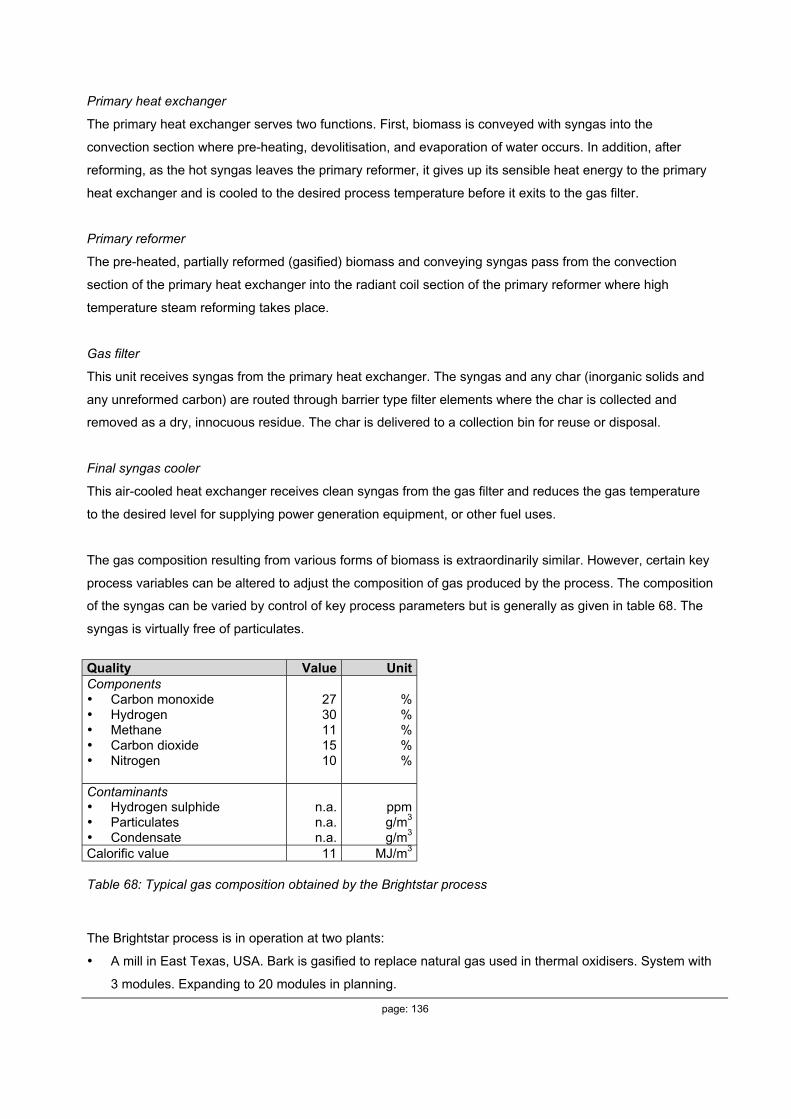
page: 136
Primary heat exchanger
The primary heat exchanger serves two functions. First, biomass is conveyed with syngas into the
convection section where pre-heating, devolitisation, and evaporation of water occurs. In addition, after
reforming, as the hot syngas leaves the primary reformer, it gives up its sensible heat energy to the primary
heat exchanger and is cooled to the desired process temperature before it exits to the gas filter.
Primary reformer
The pre-heated, partially reformed (gasified) biomass and conveying syngas pass from the convection
section of the primary heat exchanger into the radiant coil section of the primary reformer where high
temperature steam reforming takes place.
Gas filter
This unit receives syngas from the primary heat exchanger. The syngas and any char (inorganic solids and
any unreformed carbon) are routed through barrier type filter elements where the char is collected and
removed as a dry, innocuous residue. The char is delivered to a collection bin for reuse or disposal.
Final syngas cooler
This air-cooled heat exchanger receives clean syngas from the gas filter and reduces the gas temperature
to the desired level for supplying power generation equipment, or other fuel uses.
The gas composition resulting from various forms of biomass is extraordinarily similar. However, certain key
process variables can be altered to adjust the composition of gas produced by the process. The composition
of the syngas can be varied by control of key process parameters but is generally as given in table 68. The
syngas is virtually free of particulates.
Quality Value UnitComponents• Carbon monoxide• Hydrogen• Methane• Carbon dioxide• Nitrogen
2730111510
%%%%%
Contaminants• Hydrogen sulphide• Particulates• Condensate
n.a.n.a.n.a.
ppmg/m3
g/m3
Calorific value 11 MJ/m3
Table 68: Typical gas composition obtained by the Brightstar process
The Brightstar process is in operation at two plants:
• A mill in East Texas, USA. Bark is gasified to replace natural gas used in thermal oxidisers. System with
3 modules. Expanding to 20 modules in planning.

page: 137
• Whytes Gully Landfill, Australia. Urban green waste and municipal solid waste and pulp are gasified.
The produced syngas is used to generate electricity.
pyrolysis: EVN-PYROLYSIS GASIFIER
Process name: EVN pyrolysor/gasifier
Description: pyrolysis reactor, ash removal cyclone, cooler, water scrubber and gas dryer
Quality Value UnitComponents• Carbon monoxide• Hydrogen• Methane• Not reported
1820
557
%%%%
Table 69: Gas properties arising from the EVN pyrolysor / gasifier process
pyrolysis: GIBROS PEC
Process name: GIBROS PEC
Capacity: 17,000 - 34,000 m3/h
Description: pyrolysis followed by gasification of organic residuals
Pyrolysis
• pressure atmospheric
• temperature 500 - 550 oC
• reactants natural gas or cleaned syngas
Gasification
• pressure atmospheric
• temperature 1200 oC
• reactants pure oxygen and steam
Ash melting
• pressure atmospheric
• temperature1 600-2000 oC
• reactants natural gas
Status: commercial
The Gibros PEC system is developed for the gasification of different kinds of waste, like sewage sludge,
tires, chemical waste, plastics etc. The minimal energy input is 12 MJ/kg. After a mechanical preparation the
waste is dried to 95% dry material. The pyrolysis at a temperature of 500 to 550 oC with energy input from
natural gas or cleaned syngas. The pyrolysis products are gasified with oxygen at temperature of 1200 ºC.
In the cleaning of the syngas, acid components are removed with NaOH or Ca(OH)2. Heating and filtering
remove metal-oxides. Hydrogen sulphide is catalytically removed. Then the syngas is passed through an
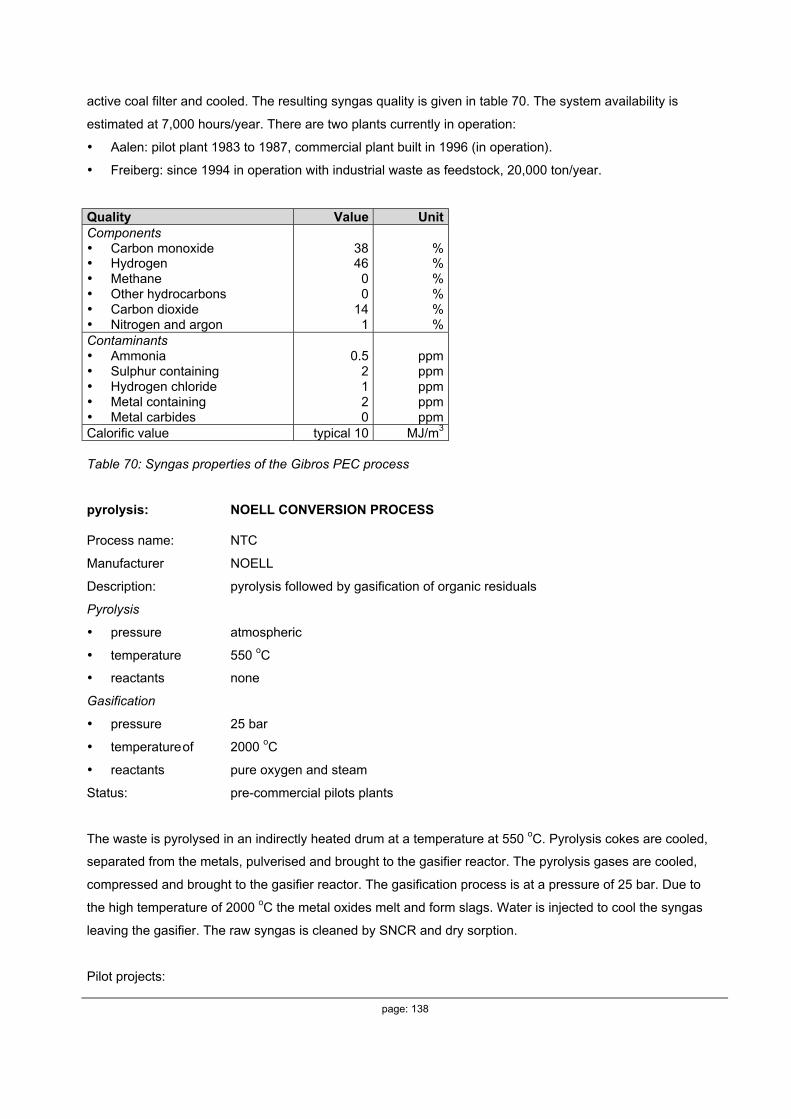
page: 138
active coal filter and cooled. The resulting syngas quality is given in table 70. The system availability is
estimated at 7,000 hours/year. There are two plants currently in operation:
• Aalen: pilot plant 1983 to 1987, commercial plant built in 1996 (in operation).
• Freiberg: since 1994 in operation with industrial waste as feedstock, 20,000 ton/year.
Quality Value UnitComponents• Carbon monoxide• Hydrogen• Methane• Other hydrocarbons• Carbon dioxide• Nitrogen and argon
3846
00
141
%%%%%%
Contaminants• Ammonia• Sulphur containing• Hydrogen chloride• Metal containing• Metal carbides
0.52120
ppmppmppmppmppm
Calorific value typical 10 MJ/m3
Table 70: Syngas properties of the Gibros PEC process
pyrolysis: NOELL CONVERSION PROCESS
Process name: NTC
Manufacturer NOELL
Description: pyrolysis followed by gasification of organic residuals
Pyrolysis
• pressure atmospheric
• temperature 550 oC
• reactants none
Gasification
• pressure 25 bar
• temperatureof 2000 oC
• reactants pure oxygen and steam
Status: pre-commercial pilots plants
The waste is pyrolysed in an indirectly heated drum at a temperature at 550 oC. Pyrolysis cokes are cooled,
separated from the metals, pulverised and brought to the gasifier reactor. The pyrolysis gases are cooled,
compressed and brought to the gasifier reactor. The gasification process is at a pressure of 25 bar. Due to
the high temperature of 2000 oC the metal oxides melt and form slags. Water is injected to cool the syngas
leaving the gasifier. The raw syngas is cleaned by SNCR and dry sorption.
Pilot projects:

page: 139
• Freiburg
• Lausitz
• Salzgitter
pyrolysis: THERMOSELECT
Process name: Thermoselect
Description: pyrolysis followed by gasification of organic residuals
Pyrolysis
• pressure atmospheric
• temperature 800 oC
• reactants none
Gasification
• pressure atmospheric
• temperature 1200 oC
• reactants pure oxygen and steam
Ash melting
• pressure atmospheric
• temperature 1600 – 2000 oC
• reactants natural gas
Status: commercial
In the first step of the Thermoselect process the waste is compressed in order to increase density and to
exclude air and fluids. In the pyrolysis the solid waste is heated from 100 - 200 oC at the beginning of the
pyrolysis channel to 800 oC at the end of the channel. The pyrolysis cokes and gases are gasified in a high
temperature reactor. The hot syngas leaving the gasifier is ‘shock cooled’ and solid mass particles and acids
are removed. The cooled syngas is further cooled by excluding water damp and cleaned through an active
coal filter.
The inorganic components like metals (ashes) are melted with the use of natural gas.
Plants in operation at:
• Fondoce (Italy): pilot plant 32,000 ton/year. Stopped in 1998.
• Karlsruhe (Germany), commercial plant with 225,000 ton/year.
Plants in construction or planning at:
• Ansbach (Germany)
• Berlin (Germany)
• Hanau (Germany)
• Tessin (Switzerland)
page: 140
• Kärnten (Austria)
pyrolysis: THERMOGENICS
Process name: Thermogenics
Capacity: 0.3 - 6 MWth
Feed any solid organic material
Product low calorific syngas
Waste no gaseous waste
The Thermogenics gasifier is able to produce a low calorific syngas to run standard internal combustion
engines driving electric generators or as fuel for steam or hot water boilers. Because of this capability and
because the gasifier can operate between 0.3 - 6 MWth, the conversion of a wide range of solid wastes to
energy becomes practical and economically viable. The process is environmentally sound since there are
no waste gases vented to the atmosphere. The ability to operate over a wide capacity range and with many
different feedstocks makes the production of energy possible for rural areas in underdeveloped countries
not served by a national power grid.
The Thermogenics gasifier can handle almost any solid or semi-solid organic feedstock, which by itself or in
combination has a heating value of 2,800 kcal per kg or more. Feedstocks that have been tested or
considered include: sorted municipal and commercial waste, shredded paper, wood waste, dewatered
sewage sludge, scrap tires, agricultural waste, paint sludge, oil field wastes and hydrocarbon contaminated
soils.
Depending on the nature of the feedstock, either low-calorific gas for energy production (electricity or steam)
can be produced or a range of by-products such as carbon black, diesel fuel and asphalt materials (from
tires); ammonia (from many feedstocks); liquefied gases such as hydrogen, nitrogen, carbon dioxide (from
many feedstocks) and various other compounds.
A schematic overview of the process is shown in figure 23.
Three models are commercially available: the 103, 104 and 106 systems. Global performance is shown in
table 71 for wood waste as biomass.
Higher performance can be reached with feedstocks like shredded plastics and shredded tires.
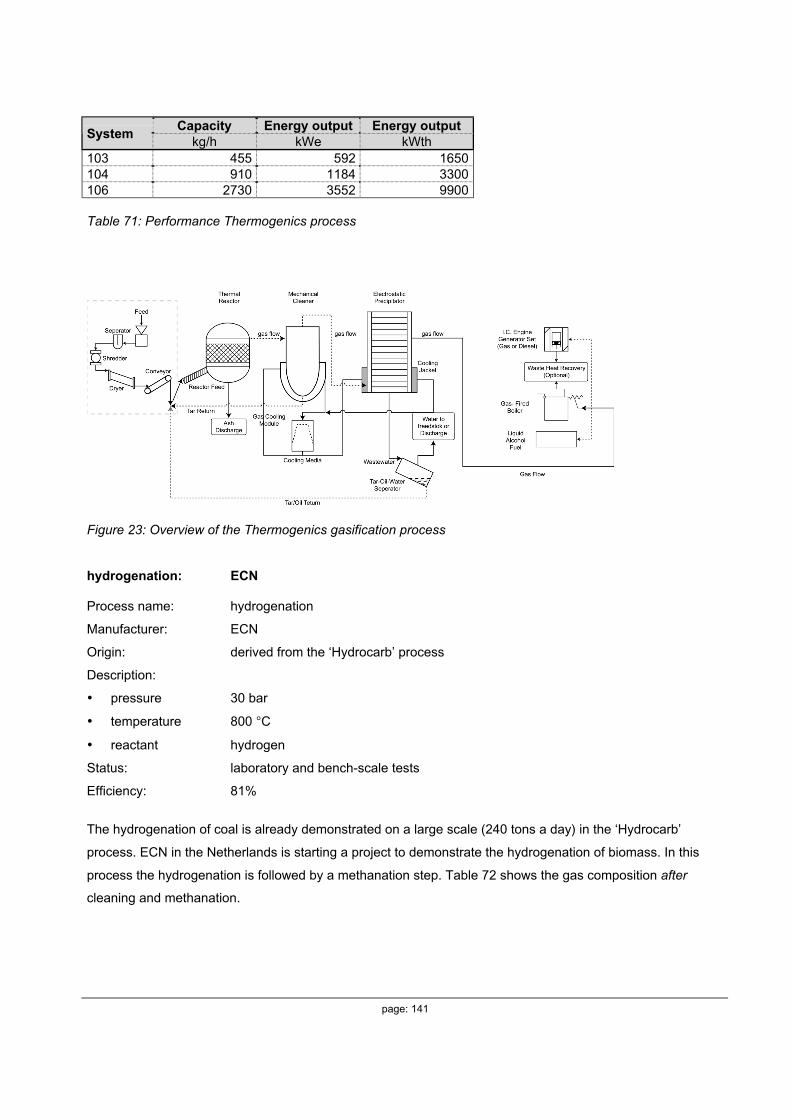
page: 141
Capacity Energy output Energy outputSystem
kg/h kWe kWth103 455 592 1650104 910 1184 3300106 2730 3552 9900
Table 71: Performance Thermogenics process
Figure 23: Overview of the Thermogenics gasification process
hydrogenation: ECN
Process name: hydrogenation
Manufacturer: ECN
Origin: derived from the ‘Hydrocarb’ process
Description:
• pressure 30 bar
• temperature 800 °C
• reactant hydrogen
Status: laboratory and bench-scale tests
Efficiency: 81%
The hydrogenation of coal is already demonstrated on a large scale (240 tons a day) in the ‘Hydrocarb’
process. ECN in the Netherlands is starting a project to demonstrate the hydrogenation of biomass. In this
process the hydrogenation is followed by a methanation step. Table 72 shows the gas composition after
cleaning and methanation.

page: 142
Quality Value UnitComponents• Carbon monoxide• Hydrogen• Methane• Other hydrocarbons• Carbon dioxide• Nitrogen and argon
081
9091
%%%%%%
Combustion propertiesCalorific valueWobbe index
3944
MJ/m3
MJ/m3
Table 72: Product gas ECN-hydrogenation after cleaning and methanation

SE-205 09 MALMÖ TEL 040-24 43 10 FAX 040-24 43 14Hemsida www.sgc.se epost [email protected]