additional mathematics project work 2013 selangord20uo2axdbh83k.cloudfront.net/20130702/46ef... ·...
TRANSCRIPT
ADDITIONAL
MATHEMATICS
PROJECT WORK
2013
SELANGOR
Name: Patricia Mui Bao Chyi
Class: 5 SC 3
School: SMK Taman Tasik
Teacher: Puan Roiamah bt. Basri

ADDITIONAL
MATHEMATICS
PROJECT WORK
2013
SELANGOR
(PROJECT WORK
1/2013)
PART 1 The History of Logarithms
Predecessors The Babylonians sometime in 2000–1600 BC may have invented the quarter square
multiplication algorithm to multiply two numbers using only addition, subtraction and a
table of squares. However it could not be used for division without an additional table of
reciprocals. Large tables of quarter squares were used to simplify the accurate
multiplication of large numbers from 1817 onwards until this was superseded by the use
of computers.
Michael Stifel published Arithmetica Integra in Nuremberg in 1544, which contains a
table of integers and powers of 2 that has been considered an early version of a
logarithmic table.
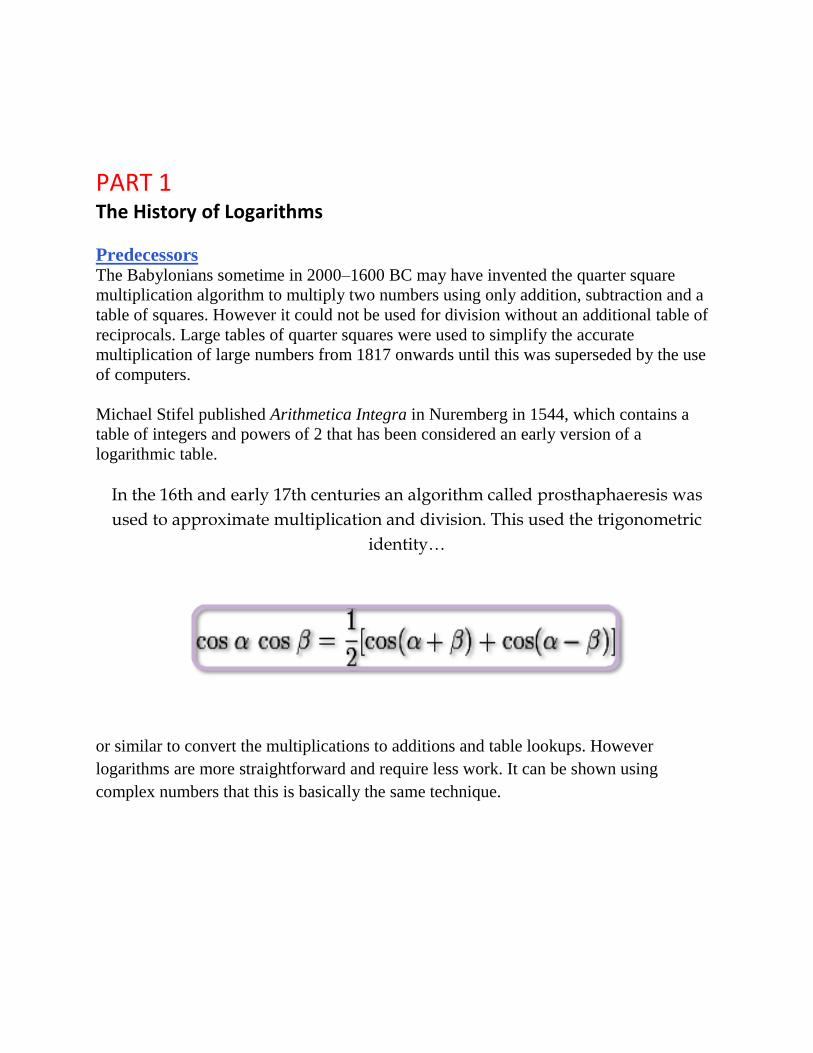
In the 16th and early 17th centuries an algorithm called prosthaphaeresis was
used to approximate multiplication and division. This used the trigonometric
identity…
or similar to convert the multiplications to additions and table lookups. However
logarithms are more straightforward and require less work. It can be shown using
complex numbers that this is basically the same technique.

From Napier to Euler
John Napier (1550–1617), the inventor of logarithms
The method of logarithms was publicly propounded by John Napier in 1614, in a book
titled Mirifici Logarithmorum Canonis Descriptio (Description of the Wonderful Rule of
Logarithms). Joost Bürgi independently invented logarithms but published six years after
Napier.
Johannes Kepler, who used logarithm tables extensively to compile his Ephemeris and
therefore dedicated it to Napier, remarked:
...the accent in calculation led Justus Byrgius [Joost Bürgi] on the way to these very logarithms many years
before Napier's system appeared; but ...instead of rearing up his child for the public benefit he deserted it in
the birth.
—Johannes Kepler, Rudolphine Tables (1627)
By repeated subtractions Napier calculated (1 − 10−7
)L for L ranging from 1 to 100. The
result for L=100 is approximately 0.99999 = 1 − 10−5
. Napier then calculated the products
of these numbers with 107(1 − 10
−5)
L for L from 1 to 50, and did similarly with 0.9998 ≈
(1 − 10−5
)20
and 0.9 ≈ 0.99520
. These computations, which occupied 20 years, allowed
him to give, for any number N from 5 to 10 million, the number L that solves the equation
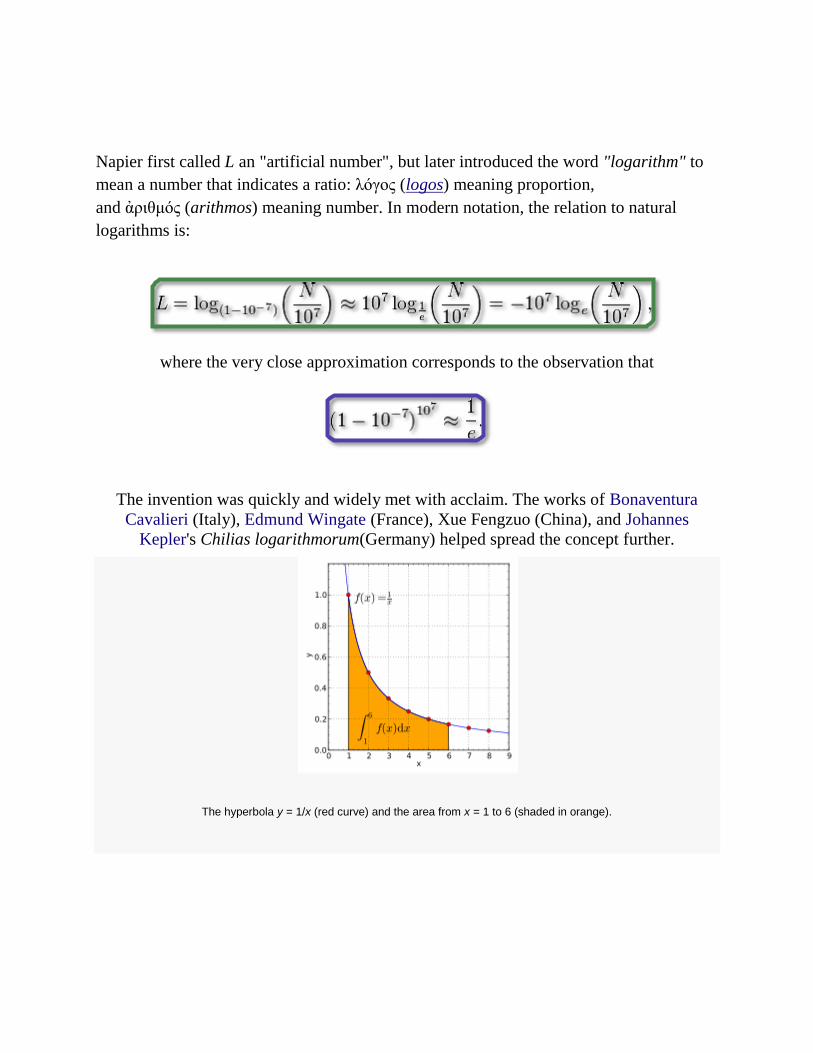
Napier first called L an "artificial number", but later introduced the word "logarithm" to
mean a number that indicates a ratio: λόγος (logos) meaning proportion,
and ἀριθμός (arithmos) meaning number. In modern notation, the relation to natural
logarithms is:
where the very close approximation corresponds to the observation that
The invention was quickly and widely met with acclaim. The works of Bonaventura
Cavalieri (Italy), Edmund Wingate (France), Xue Fengzuo (China), and Johannes
Kepler's Chilias logarithmorum(Germany) helped spread the concept further.
The hyperbola y = 1/x (red curve) and the area from x = 1 to 6 (shaded in orange).
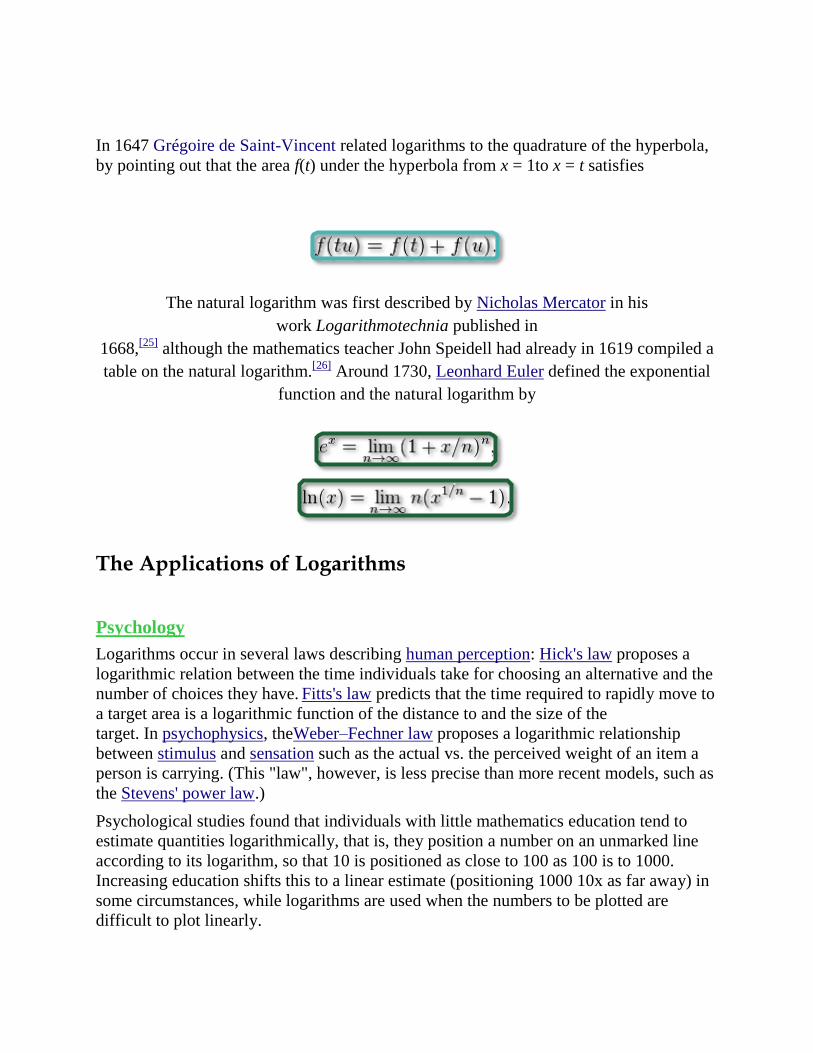
In 1647 Grégoire de Saint-Vincent related logarithms to the quadrature of the hyperbola,
by pointing out that the area f(t) under the hyperbola from x = 1to x = t satisfies
The natural logarithm was first described by Nicholas Mercator in his
work Logarithmotechnia published in
1668,[25]
although the mathematics teacher John Speidell had already in 1619 compiled a
table on the natural logarithm.[26]
Around 1730, Leonhard Euler defined the exponential
function and the natural logarithm by
The Applications of Logarithms
Psychology
Logarithms occur in several laws describing human perception: Hick's law proposes a
logarithmic relation between the time individuals take for choosing an alternative and the
number of choices they have. Fitts's law predicts that the time required to rapidly move to
a target area is a logarithmic function of the distance to and the size of the
target. In psychophysics, theWeber–Fechner law proposes a logarithmic relationship
between stimulus and sensation such as the actual vs. the perceived weight of an item a
person is carrying. (This "law", however, is less precise than more recent models, such as
the Stevens' power law.)
Psychological studies found that individuals with little mathematics education tend to
estimate quantities logarithmically, that is, they position a number on an unmarked line
according to its logarithm, so that 10 is positioned as close to 100 as 100 is to 1000.
Increasing education shifts this to a linear estimate (positioning 1000 10x as far away) in
some circumstances, while logarithms are used when the numbers to be plotted are
difficult to plot linearly.

Music
Four different octaves shown on a linear scale, then shown on a logarithmic scale (as the ear hears them).
Logarithms are related to musical tones and intervals. In equal temperament, the
frequency ratio depends only on the interval between two tones, not on the specific
frequency, or pitch, of the individual tones. For example, the note A has a frequency of
440 Hz and B-flat has a frequency of 466 Hz. The interval between A and B-flat is
a semitone, as is the one between B-flat and B(frequency 493 Hz). Accordingly, the
frequency ratios agree:
Therefore, logarithms can be used to describe the intervals: an interval is measured in
semitones by taking the base-21/12
logarithm of the frequency ratio, while the base-
21/1200
logarithm of the frequency ratio expresses the interval in cents, hundredths of a
semitone. The latter is used for finer encoding, as it is needed for non-equal
temperaments.
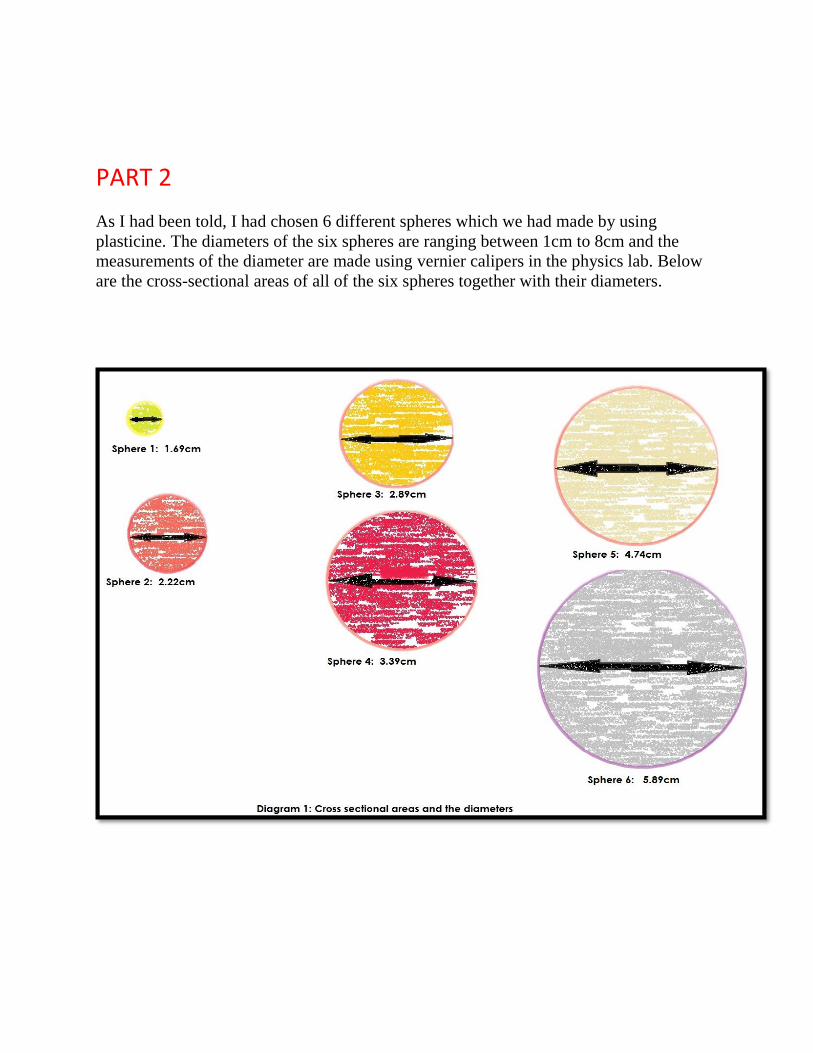
PART 2
As I had been told, I had chosen 6 different spheres which we had made by using
plasticine. The diameters of the six spheres are ranging between 1cm to 8cm and the
measurements of the diameter are made using vernier calipers in the physics lab. Below
are the cross-sectional areas of all of the six spheres together with their diameters.
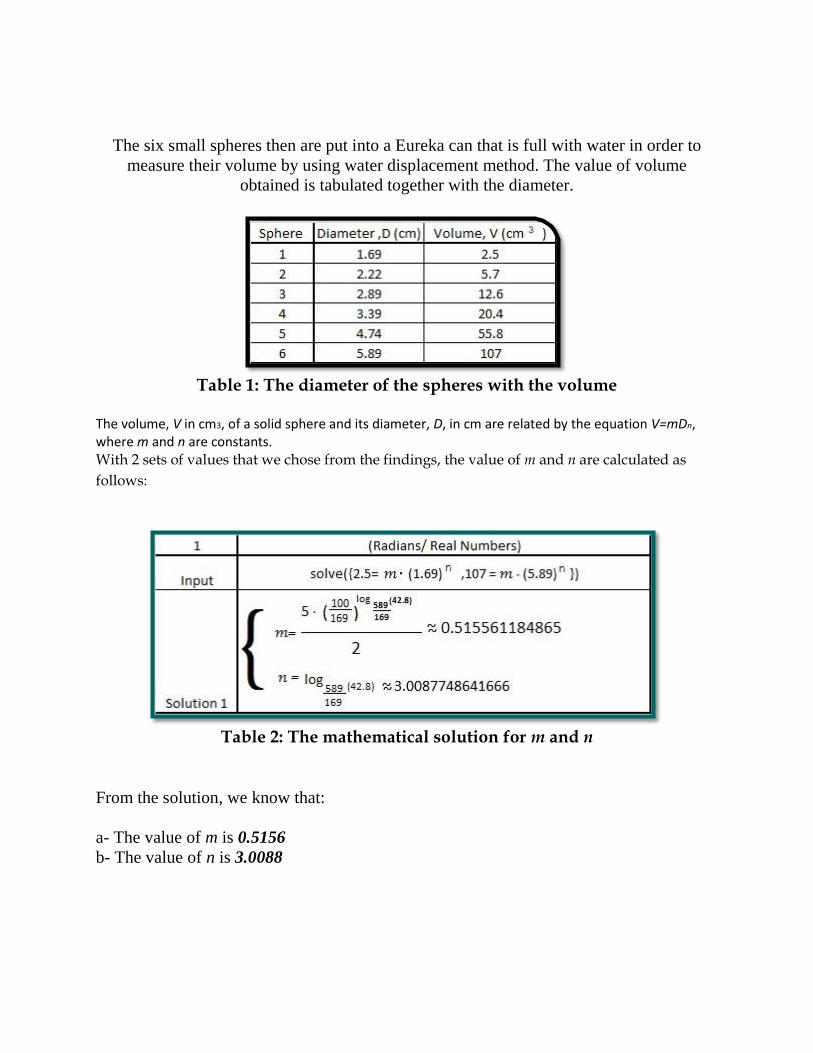
The six small spheres then are put into a Eureka can that is full with water in order to
measure their volume by using water displacement method. The value of volume
obtained is tabulated together with the diameter.
Table 1: The diameter of the spheres with the volume
The volume, V in cm3, of a solid sphere and its diameter, D, in cm are related by the equation V=mDn, where m and n are constants. With 2 sets of values that we chose from the findings, the value of m and n are calculated as
follows:
Table 2: The mathematical solution for m and n
From the solution, we know that:
a- The value of m is 0.5156
b- The value of n is 3.0088
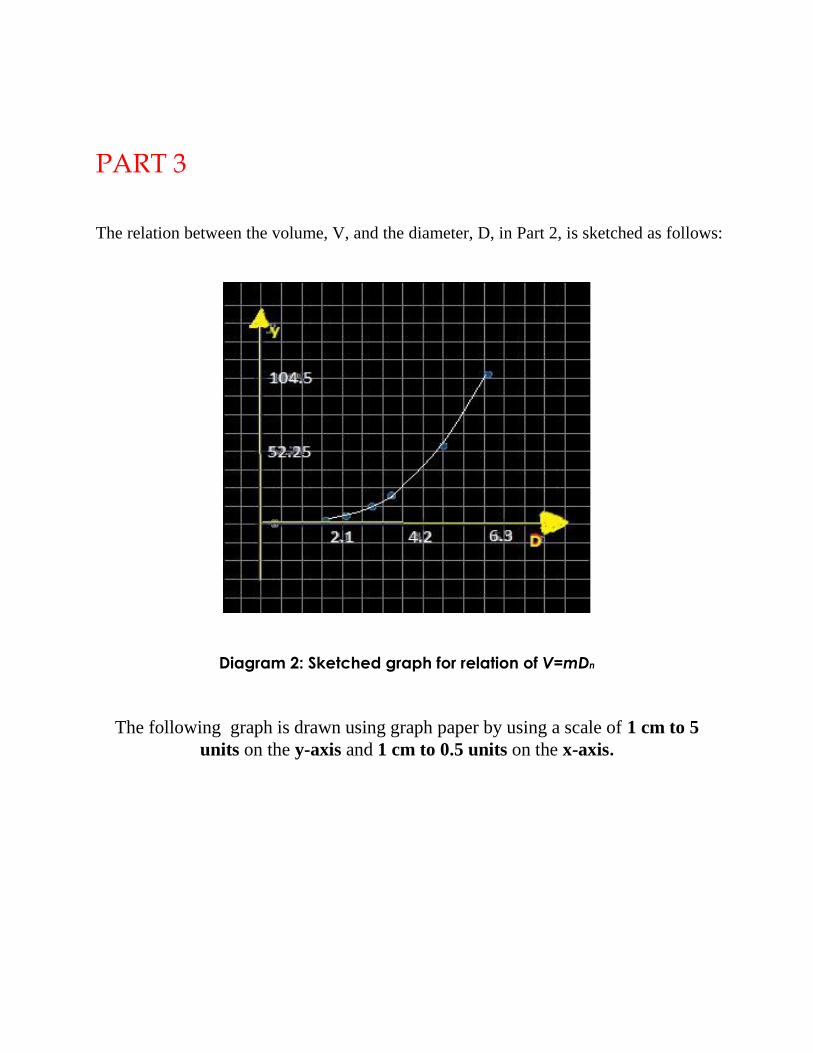
PART 3
The relation between the volume, V, and the diameter, D, in Part 2, is sketched as follows:
Diagram 2: Sketched graph for relation of V=mDn
The following graph is drawn using graph paper by using a scale of 1 cm to 5
units on the y-axis and 1 cm to 0.5 units on the x-axis.
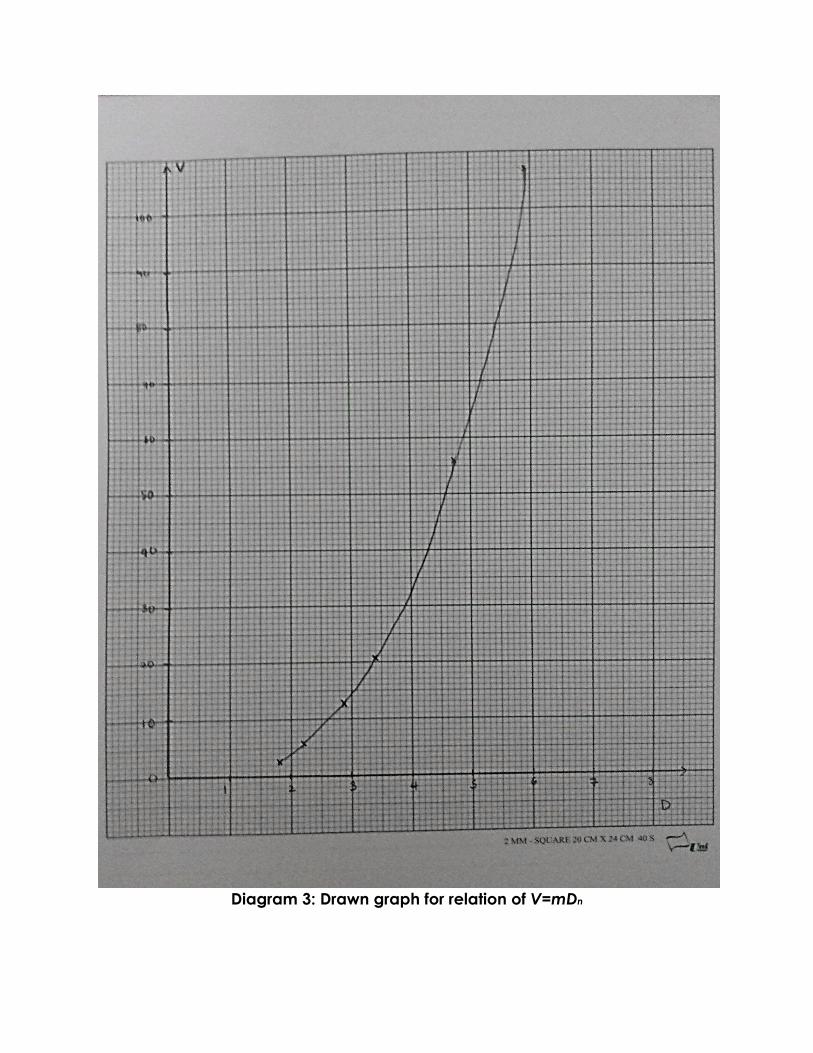
Diagram 3: Drawn graph for relation of V=mDn

From the both sketched and drawn graphs, we know that the value of m and n are not
easily obtained from the graphs due to the non-linear relation. We would reduce the
equation V=mDn to a linear form by adding log10 to the both side of the equation so
that it could be easier for us to draw a line of best fit and determine the values of m and n.
Now, we could plot a graph with the line of best fit using the new equation that is derived
from the equation V=mDn which is log10 V= n log10 D + log10 m
Table 3: Values of log10 D with log10 V
The graph is sketched using Microsoft Mathematics (2010):
Diagram 4: Sketched graph for relation of log10 V= n log10 D + log10 m
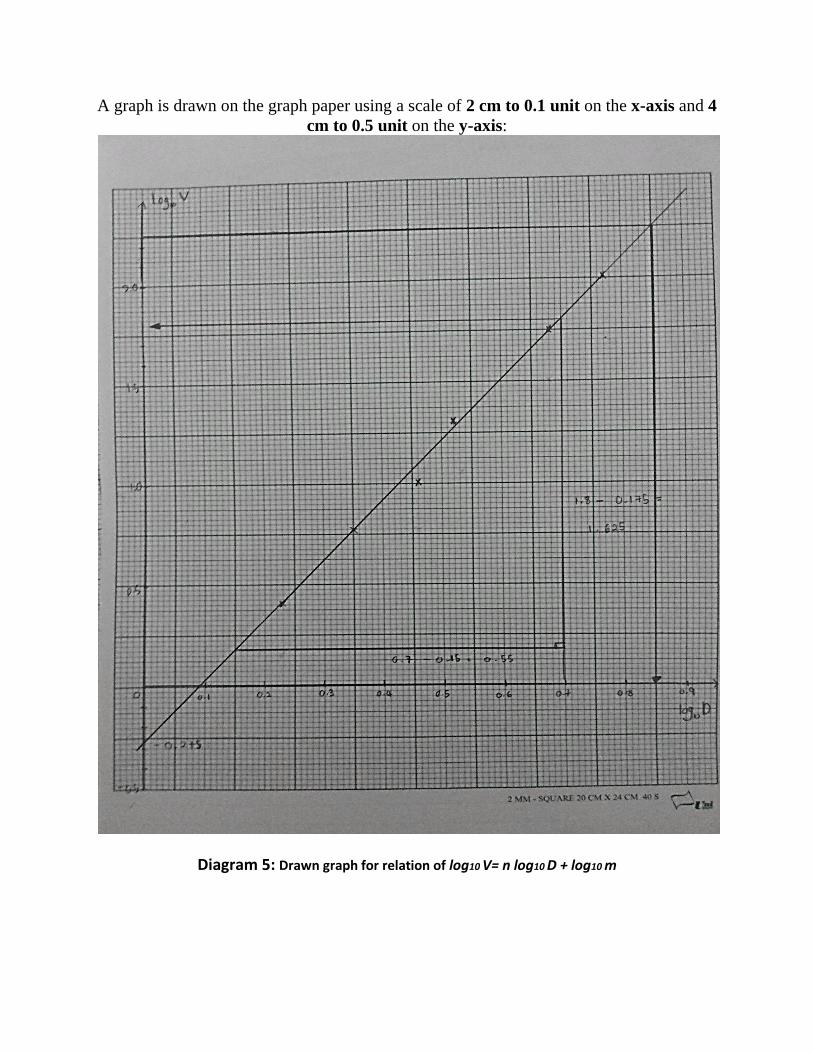
A graph is drawn on the graph paper using a scale of 2 cm to 0.1 unit on the x-axis and 4
cm to 0.5 unit on the y-axis:
Diagram 5: Drawn graph for relation of log10 V= n log10 D + log10 m
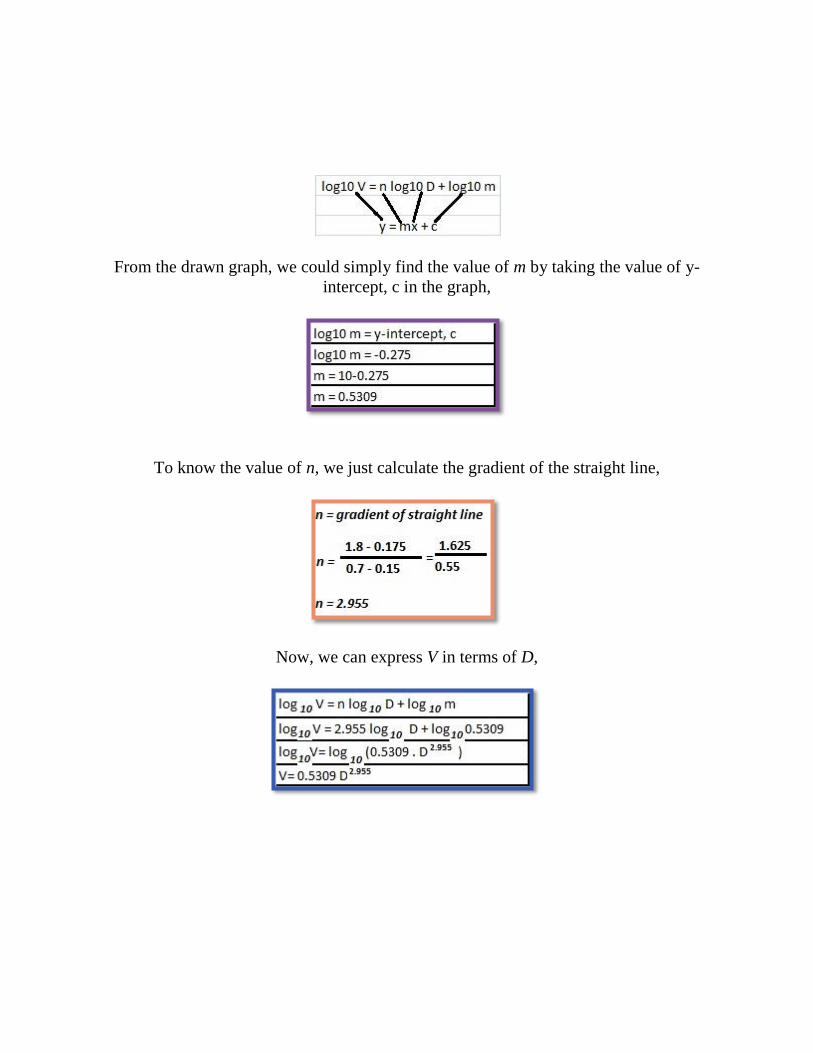
From the drawn graph, we could simply find the value of m by taking the value of y-
intercept, c in the graph,
To know the value of n, we just calculate the gradient of the straight line,
Now, we can express V in terms of D,
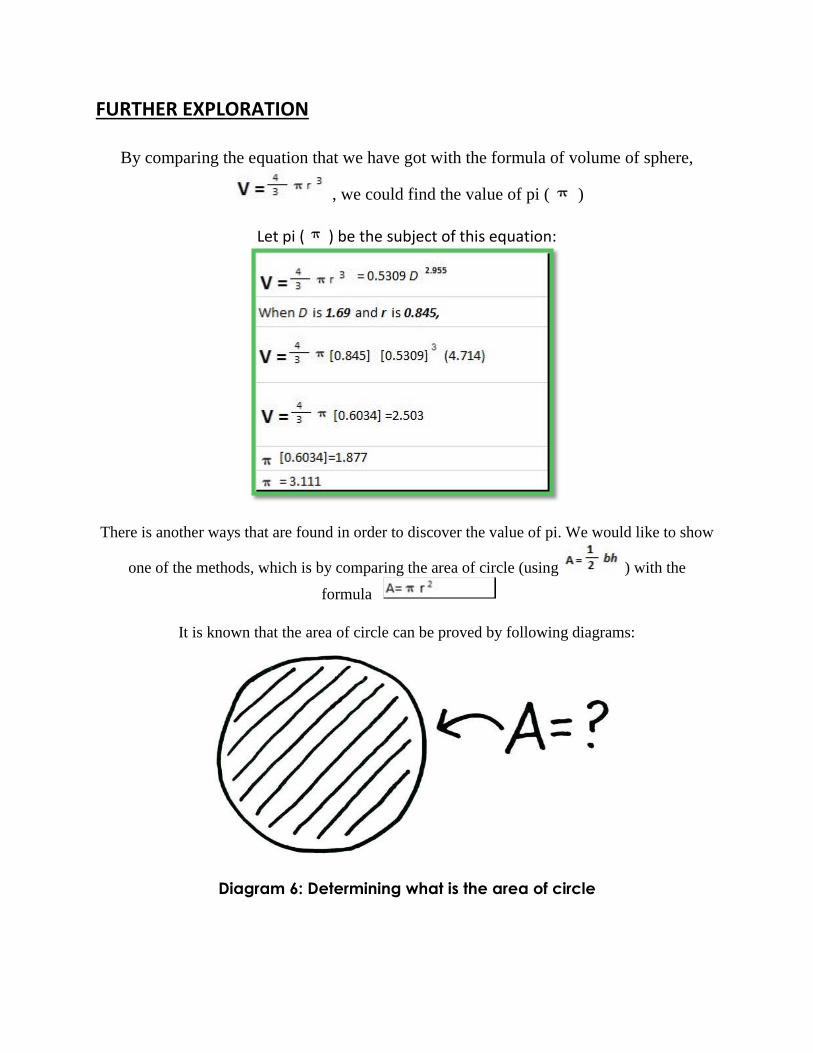
FURTHER EXPLORATION
By comparing the equation that we have got with the formula of volume of sphere,
, we could find the value of pi ( )
Let pi ( ) be the subject of this equation:
There is another ways that are found in order to discover the value of pi. We would like to show
one of the methods, which is by comparing the area of circle (using ) with the
formula
It is known that the area of circle can be proved by following diagrams:
Diagram 6: Determining what is the area of circle
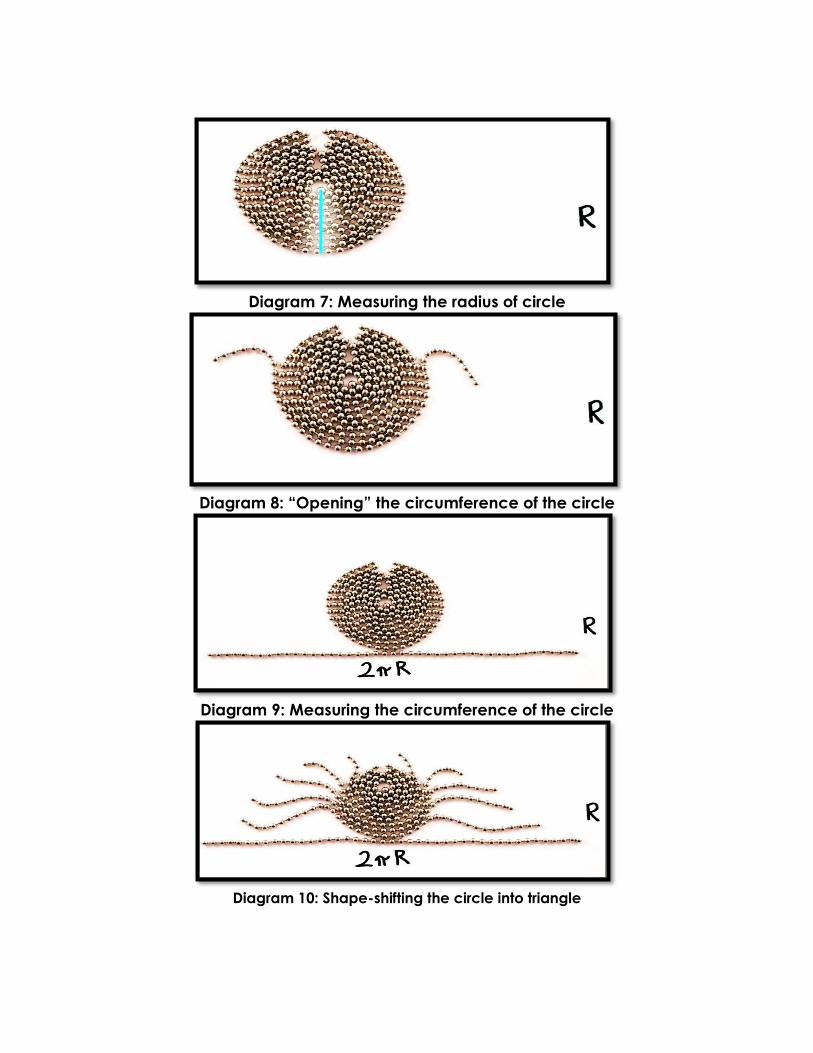
Diagram 7: Measuring the radius of circle
Diagram 8: “Opening” the circumference of the circle
Diagram 9: Measuring the circumference of the circle
Diagram 10: Shape-shifting the circle into triangle
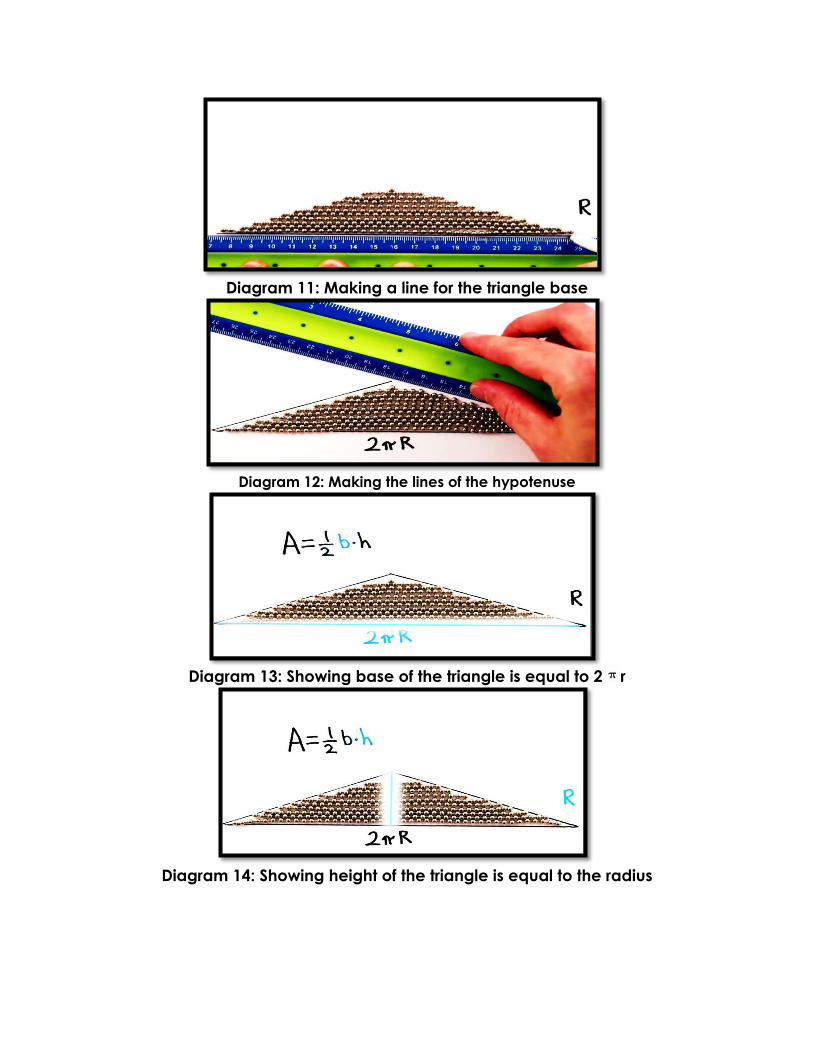
Diagram 11: Making a line for the triangle base
Diagram 12: Making the lines of the hypotenuse
Diagram 13: Showing base of the triangle is equal to 2 r
Diagram 14: Showing height of the triangle is equal to the radius
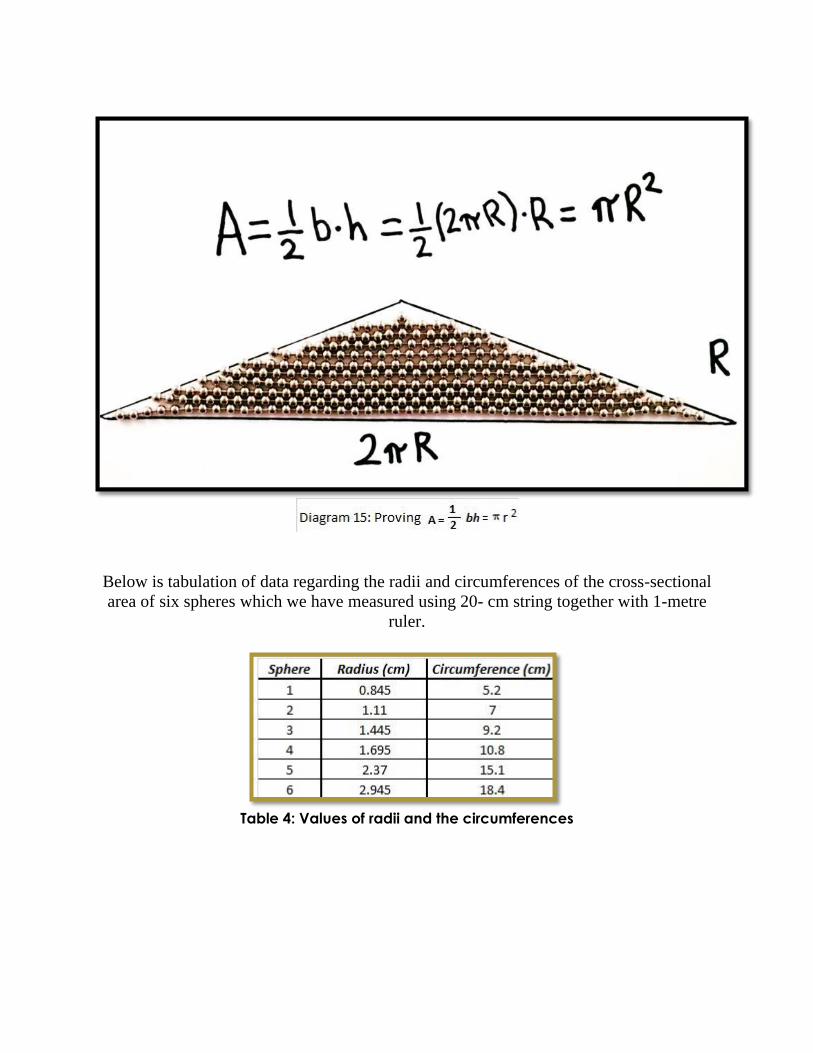
Below is tabulation of data regarding the radii and circumferences of the cross-sectional
area of six spheres which we have measured using 20- cm string together with 1-metre
ruler.
Table 4: Values of radii and the circumferences
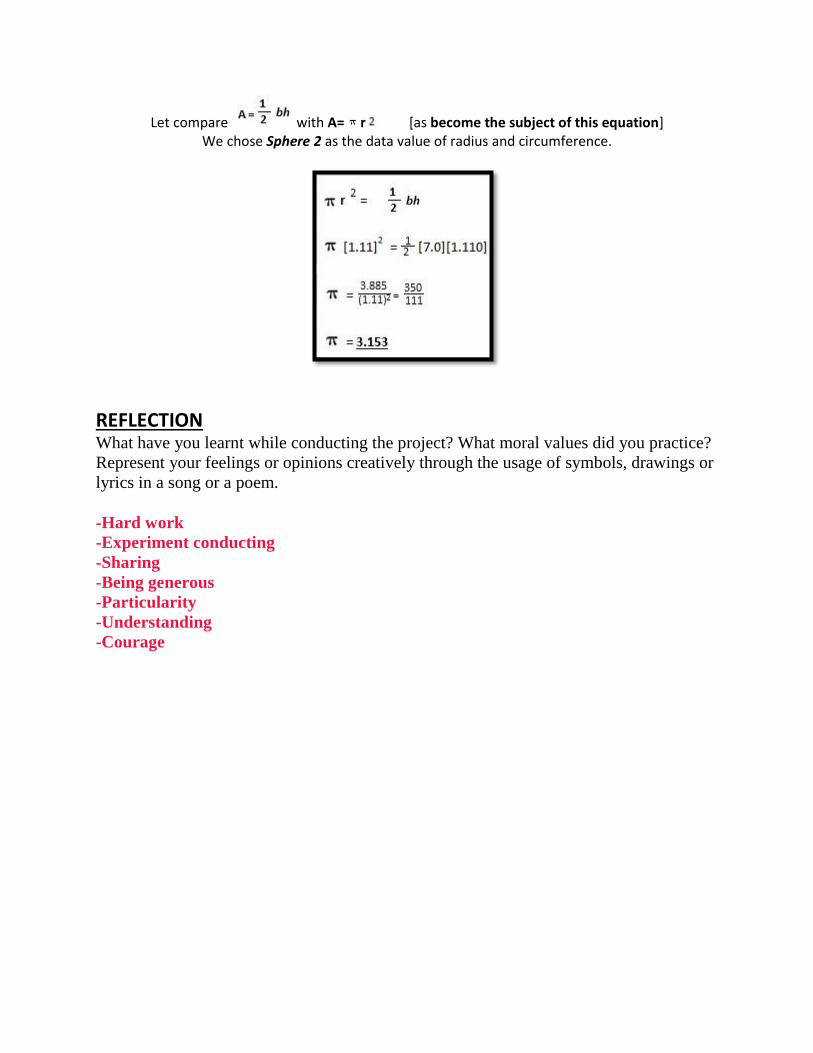
Let compare with A= r [as become the subject of this equation] We chose Sphere 2 as the data value of radius and circumference.
REFLECTION What have you learnt while conducting the project? What moral values did you practice?
Represent your feelings or opinions creatively through the usage of symbols, drawings or
lyrics in a song or a poem.
-Hard work
-Experiment conducting
-Sharing
-Being generous
-Particularity
-Understanding
-Courage

ADDITIONAL
MATHEMATICS
PROJECT WORK
2013
SELANGOR
(PROJECT WORK
2/2013)
PART 1
a) (i) Price index
An index number expressing the level of a group of commodity prices relative to the level of the
prices of the same commodities during an arbitrarily chosen base period and used to indicate
changes in the level of prices from one period to another.
(ii) Weightage
The assignment of a quota (as of members of a legislature) to a particular segment of the
population as a special favor or concession in a proportion above that allowable on a strictly
numerical basis.
(iii) Composite index
A grouping of equities, indexes or other factors combined in a standardized way, providing a useful
statistical measure of overall market or sector performance over time.
b) Ways to represent weightage : 1) Pie Chart
2) Bar Garph
3)Line Graph
4) Histogram
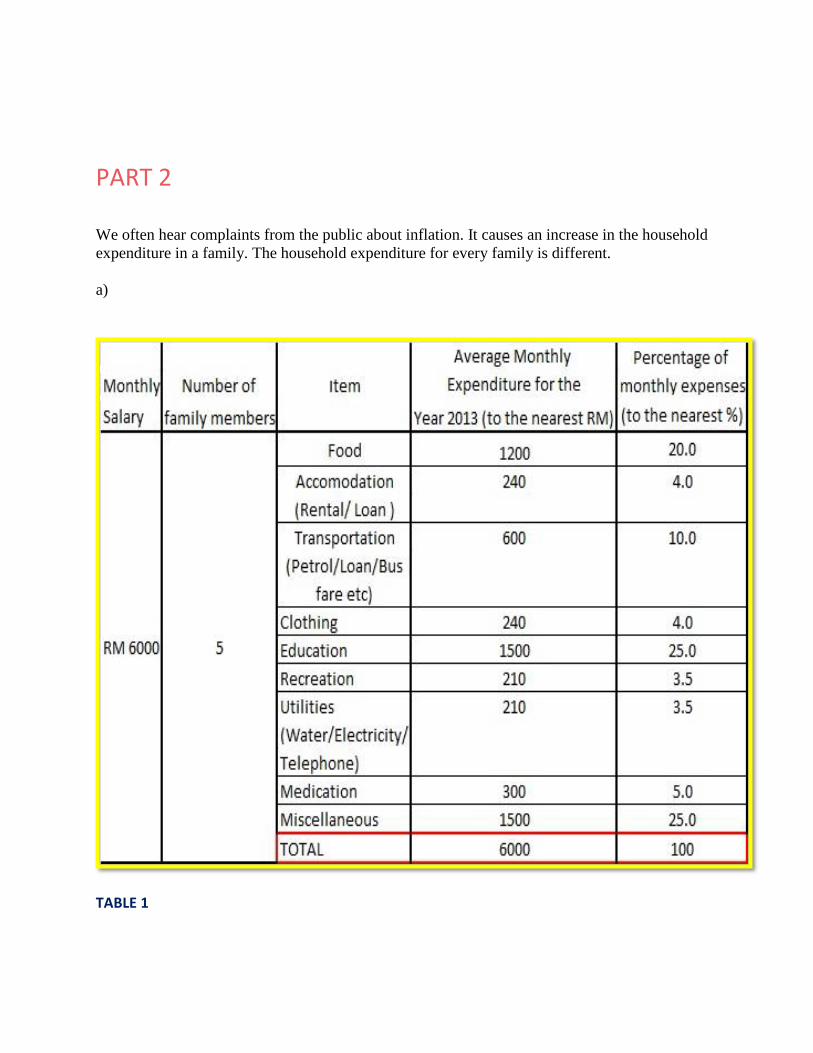
PART 2 We often hear complaints from the public about inflation. It causes an increase in the household
expenditure in a family. The household expenditure for every family is different.
a)
TABLE 1
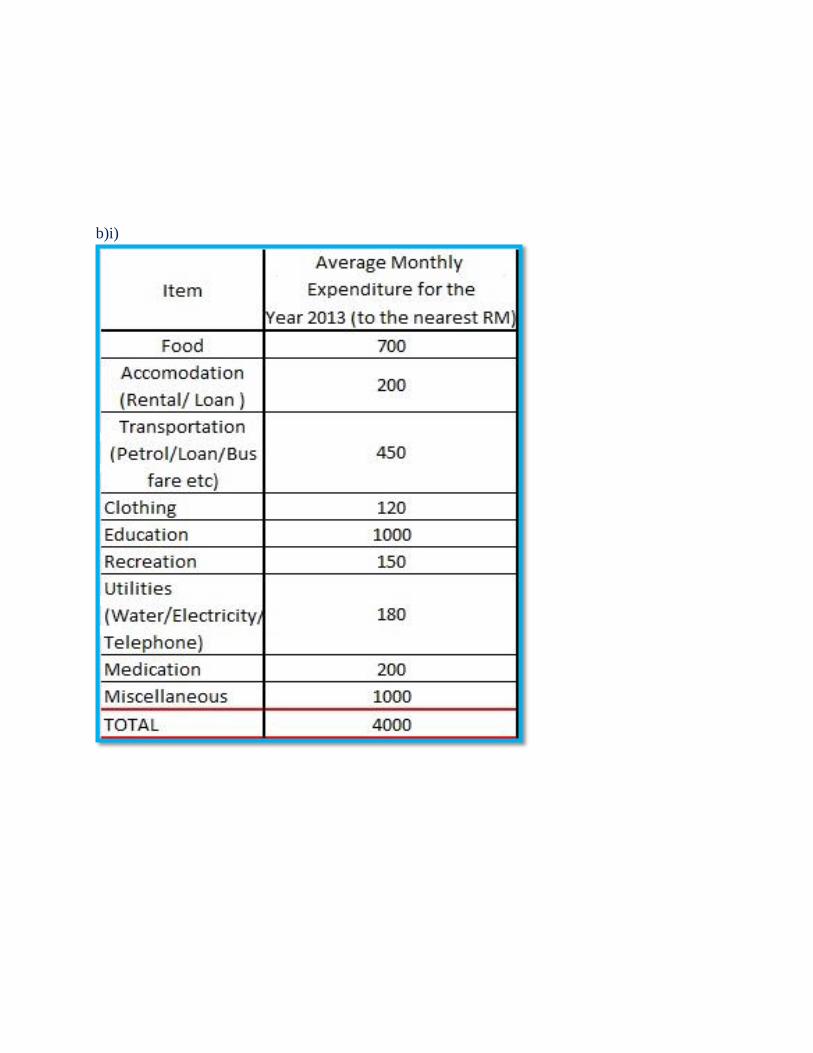
b)i)
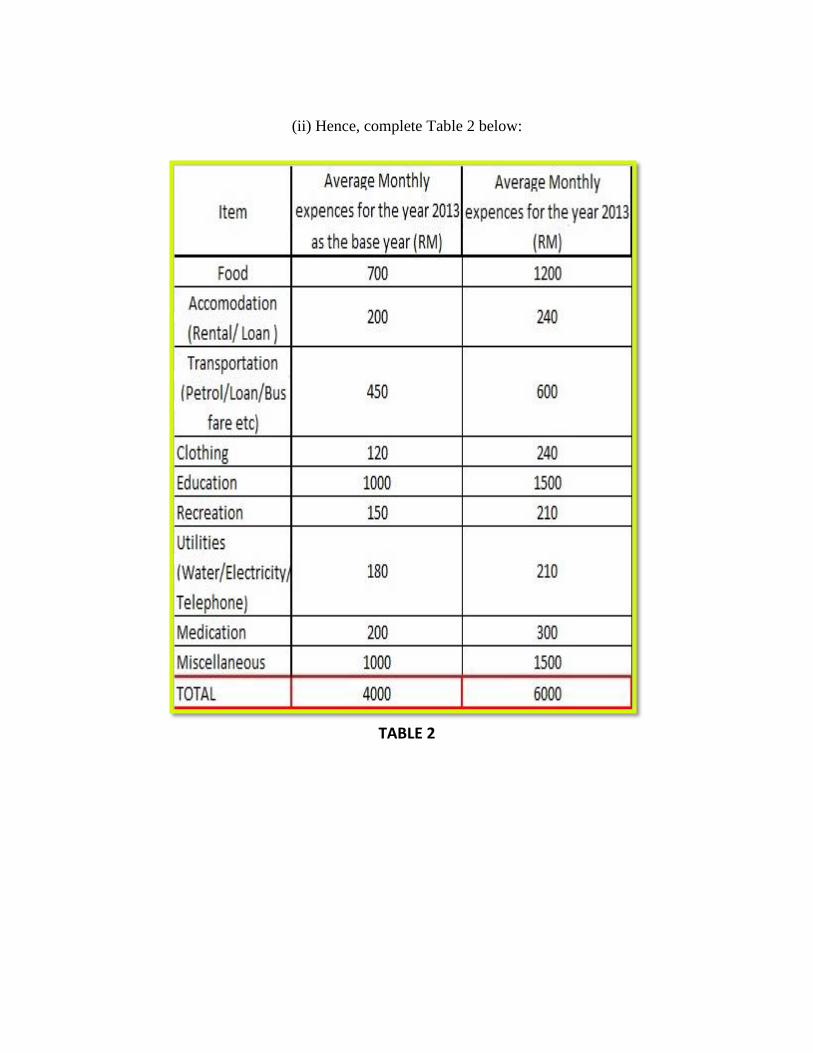
(ii) Hence, complete Table 2 below:
TABLE 2
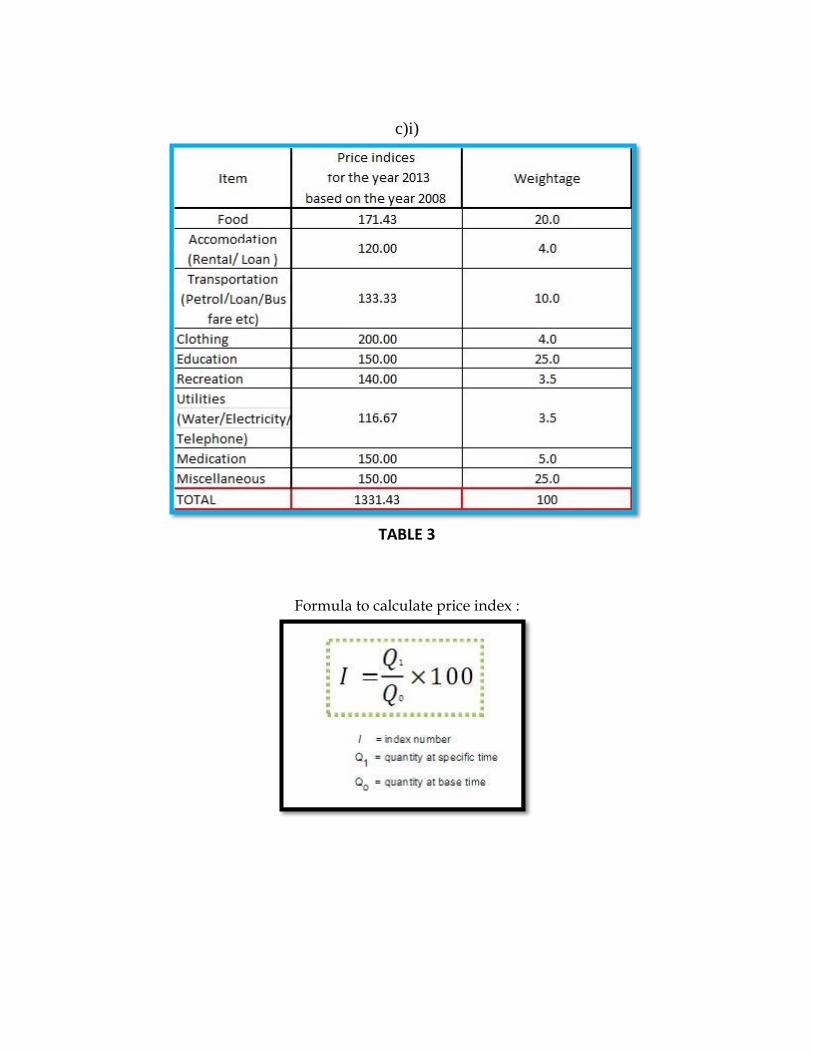
c)i)
TABLE 3
Formula to calculate price index :

ii)
Formula to calculate composite index :
d)
Based on the findings, I found that the average expenses for current year is higher than the base
year 2008. We spent a total of RM1200 for food in 2013 compared to only RM700 in 2008.
Other expenses such as accommodation, utilities, transportation, clothing, education, recreation,
and medications also increase compared to the year 2008. This is due to the high inflation rate in
2008. After the year 2008, daily expenses for our family had increased due to the increasing of
the prices of raw materials.
PART 3
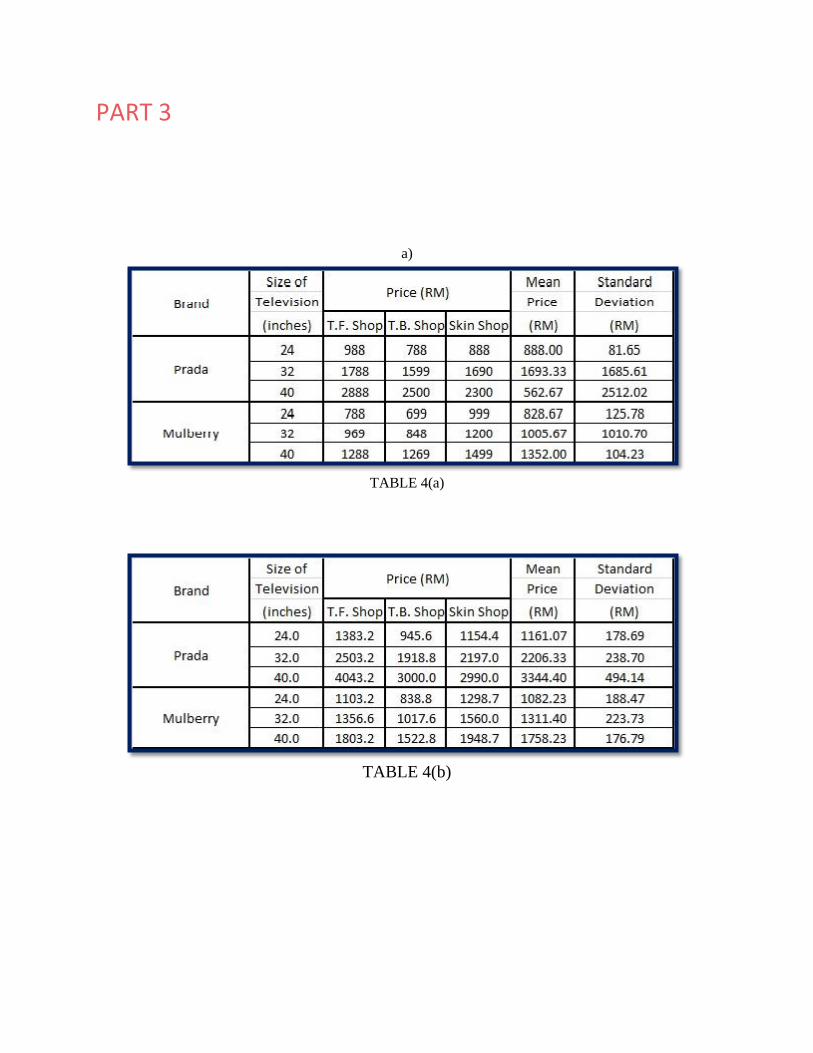
a)
TABLE 4(a)
TABLE 4(b)

The mean and standard deviation of the data can be calculated using formula :
b)
I want to buy a size 32 inch TS television. This is because there are only five members in my
family and only requires medium-sized television for our living room. I choose this brand
because I am confident of its quality as our family has long been using this brand for other
electrical appliances in our home. Although the brand Prada is more expensive than the brand
Mulberry, our family still can afford to buy it. I plan to buy from T.B.Shop because they offer 2
years of warranty. In addition, they also offer the lowest price of televisions compared to the
other two shops.
c)
If I am one of the panel for the award, I would prefer T.B.Shop because the mean price of all
types of television for both brands is the lowest compared to the other two shops. Standard
deviation for the telivisons at the shop is also the lowest. It shows that the prices of television
offered by T.B.Shop is reasonable and affordable.
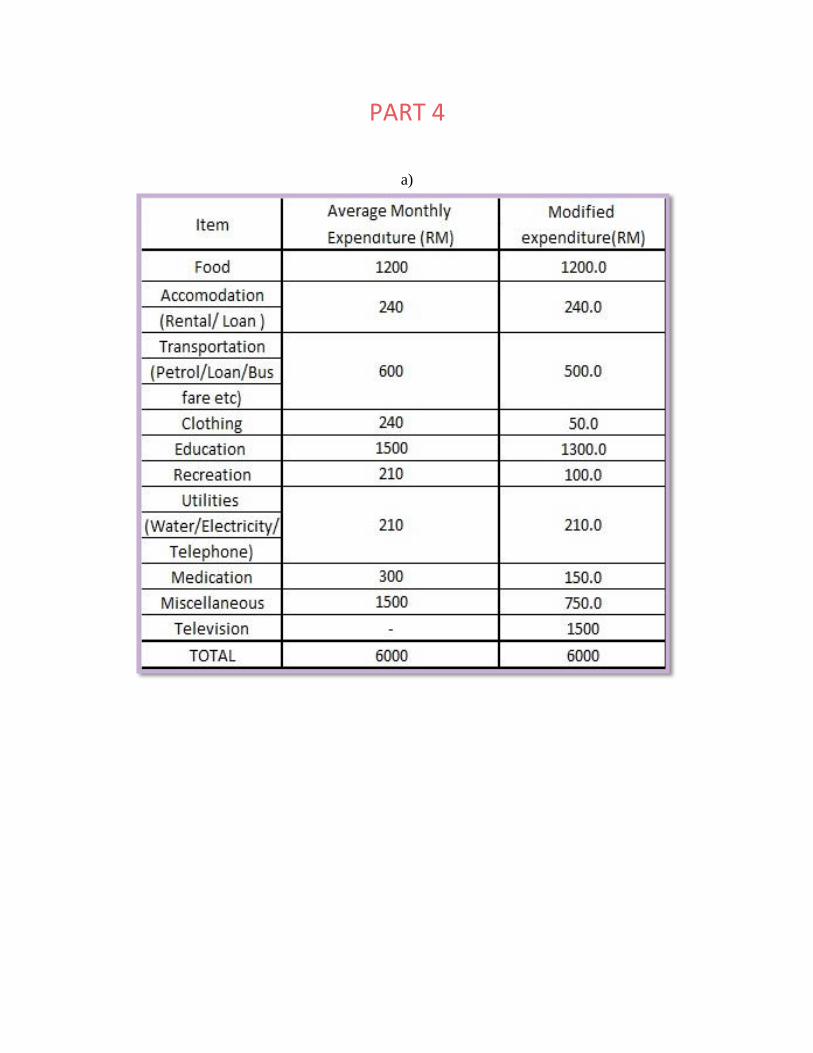
PART 4
a)
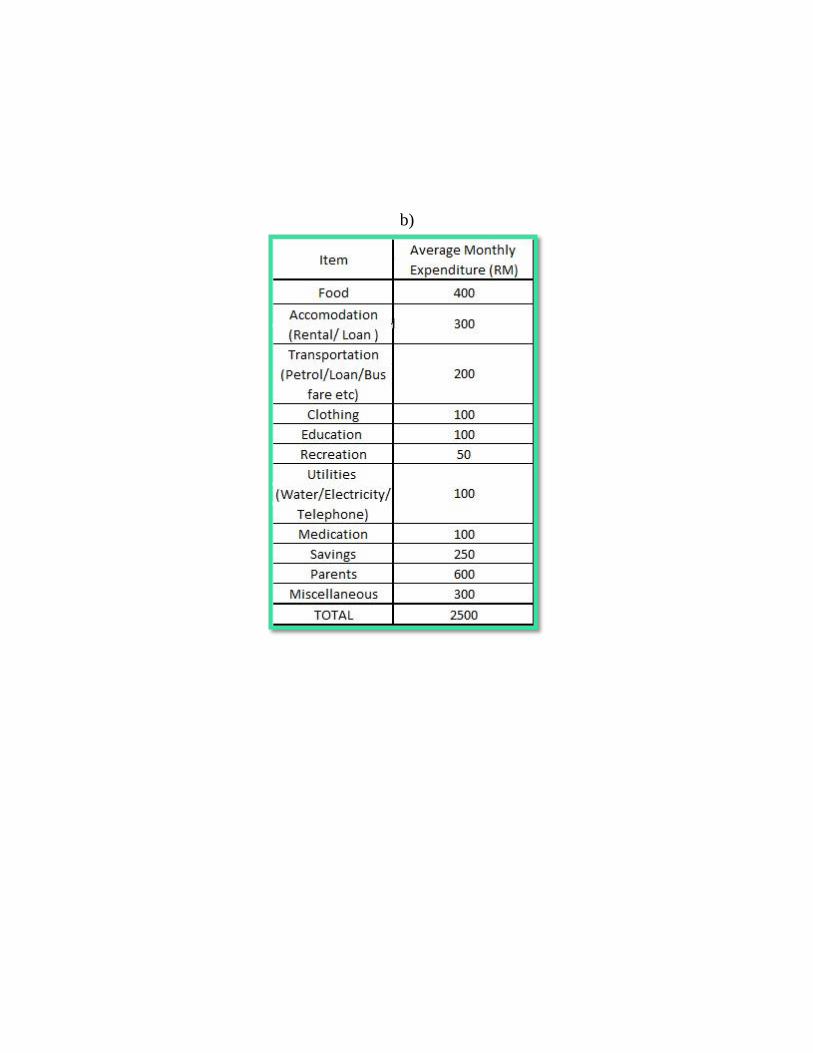
b)