members.bombaychamber.commembers.bombaychamber.com/uploads/document/146/bombay_cha… · address by...
TRANSCRIPT


Information
Membership Position 27
Published and Printed by Vikas Gadre, Bombay Chamber of Commerce and IndustryAdmin. Office: The Ruby, 4th Floor N.W., 29, Senapati Bapat Marg, (Tulsi Pipe Road), Dadar (W), Mumbai 400 028 • Tel.: 61200200
Regd. Office: Mackinnon Mackenzie Building, 3rd Floor, Ballard Estate, Mumbai 400 001 Tel.: (91-22) 4910 0200 • Fax: 4910 0213 • E-mail: [email protected] • www.bombaychamber.com
Contents
On the Cover - The 10th Biennial Conference-Agricorp 2015 ”Risk Mitigation in Agriculture” (L to R)1. Address by Chief Guest Mr. Ajay Vir Jakhar, Chairman, Bharat Krishak Samaj,
(Farmer's Forum India), New Delhi.2. Lightening of Lamp by Mr. Ajay Vir Jakhar.3. Key Note Addrtess by Mr. Samir Shah, MD & CEO, National Commodity & Derivatives
Exchange Ltd. (NCDEX).4. Mr. Vikas Gadre, Director General, Bombay Chamber, Dr. B. Venkateswarlu, Hon'ble
Vice-Chancellor, Vasantrao Nail Marathwada Krishi Vidyapeeth, Parbhani, Mr. Ajay Vir Jakhar, Chairman, Bhart Krishak Samaj, (Former's Forum India), New Delhi, Mr. Samir Shah, MD & CEO, National Commodity and Derivaties Exchange Ltd. (NCDEX), Mr. Anil B. Jain, MD & CEO, Jain Irrigation Systems Ltd.
5. Mr. V.L. Chopra, Dr. V.L. Chopra, Ex-Secretary to Govt. of India (DARE) and Ex-Director General, ICAR.
6. Mr. Subhas More, Farm Representative, Shirole Khurd District, Maharashtra, Mr. Manoj Rawat, Head Agriculture, Ratnakar Bank Ltd, Mr. Raj Benahalkar, Chief Strategy & Risk Officer, Strategy & Risk Management, NCDEX, Mr. Raul Rebello, SVP & Head, Rural Lending, Axis Bank Ltd., Mr. H.R. Dave - Deputy MD, NABARD, Mr. M.S. Annigeri "Advisor-Business Strategy". NCML, Mr. Abhijit Maitra, President, Agri-Business, Product Management, Yes Bank Ltd., Mr. Gurinder Singh Sehmbey, Chief Executive Officer, StarAgri Finance Ltd., Mr. Sriram Vinjamuri, Deputy Vice President, Axis Bank Ltd., Mr. Gopal Krishan Kansal, Chief General Manager - Rural Business, State Bank of India, Mr. P.G. Ganesh, Senior Director & Head -Food & Agri Researchy, Rabobank International.
Economy Overview 6
Bombay Chamber Managing Committee 2015-16
• Managing Commitee, 2015-16 4
Special Feature
The 10th Biennial Conference-AgriCorp 2015 “Risk Mitigation in Agriculture” 10
Chamber Activities
• Seminar on Legal Aspects of Restrictive and Negative Covenants & Termination without Enquiry for Low Performance, Absenteeism and Abandonment (For Workmen & Non-Workmen) 22
• Round Table Meeting on Road Safety 22
• Workshop on Performance Management Conversations 23
• Workshop on BrandMe 24
• Financial Intellect for Business 25
Interview
9th Biennial Conference on Ports Shipping Logistics 2016; Principal Commissioner of Income Tax and Former Chairman, JNPT – Mr. N.N. Kumar, Conference Chairman 13
Country Focus
Malaysia 17
Editors : Vikas Gadre Dr. Sugeeta Upadhyay
Printed at : Uchitha Graphic Printers Pvt. Ltd.

BomBay ChamBer review: January-FeBruary 2016 4

5 BomBay ChamBer review: January-FeBruary 2016

BomBay ChamBer review: January-FeBruary 2016 6
Economy Overview
Monthly EConoMIC oVERVIEW
Index of Industrial Production
The General Index for the month of September 2015 stands at 178.0, which is 3.6% higher as compared to the level in the month of September 2014. The cumulative growth for the period April-September 2015-16 over the corresponding period of the previous year stands at 4.0%.
The Indices of Industrial Production for the Mining, Manufacturing and Electricity sectors for the month of September 2015 stand at 118.8, 186.7 and 195.7 respectively, with the corresponding growth rates of 3.0%, 2.6% and 11.4% as compared to September 2014 . The cumulative growth in the three sectors during April-September 2015-16 over the corresponding period of 2014-15 has been 1.5%, 4.2% and 4.5% respectively.
The Indices of Industrial Production for the Mining, Manufacturing and Electricity sectors for the month of September 2015 stand at 118.8, 186.7 and 195.7 respectively, with the corresponding growth rates of 3.0%, 2.6% and 11.4% as compared to September 2014. The cumulative growth in the three sectors during April-September 2015-16 over the corresponding period of 2014-15 has been 1.5%, 4.2% and 4.5% respectively.
In terms of industries, eleven (11) out of the twenty two (22) industry groups (as per I NIC-2004) in the manufacturing sector have shown positive growth during the month of September 2015 as compared to the corresponding month of the previous year . The industry group ‘Furniture; manufacturing n.e.c.’ has shown the highest positive growth of 69.9%, followed by 21.6% in ‘Electrical machinery & apparatus n.e.c.’ and 9.8% in ‘Chemicals and chemical products’. On the other hand, the industry group ‘Publishing, printing & reproduction of recorded media’ has shown the highest negative growth of (-) 13.3%, followed by (-) 12.8% in ‘Wearing apparel; dressing and 1 dyeing of fur’ and (-) 12.8% in ‘Medical, precision & optical instruments, watches and clocks’.
As per Use-based classification, the growth rates in September 2015 over September 2014 are 4.0% in Basic goods, 10.5% in Capital goods and 2.1% in Intermediate goods . The Consumer durables and Consumer non-durables have recorded growth of 8.4% and (-) 4.6% respectively, with the overall growth in Consumer goods being 0.6%.
Growth Over the Corresponding Period of Previous YearBase:2004-05=100
Classification September* April-September2014-15 2015-16* 2014-15 2015-16*
General 2.6 3.6 2.9 4.0Mining 0.1 3.0 1.7 1.5Manufacturing 2.7 2.6 2.2 4.2Electricity 3.9 11.4 10.4 4.5Basic Goods 5.0 4.0 7.8 4.4Capital Goods 12.3 10.5 6.0 7.9Intermediate Goods 2.0 2.1 2.3 2.0Consumer Goods -4.0 0.6 -4.2 2.4Consumer Durables -11.1 8.4 -12.5 7.6Consumer Non-Durables 1.3 -4.6 1.9 0.9
Source: Ministry of Statistics and Programme Implementation.
* Indices for Sep 2015 are Quick Estimates.
NOTE: Indices for the months of Jun ‘15 and Aug ‘15 incorporate updated production data.
Index of Eight Core Industries
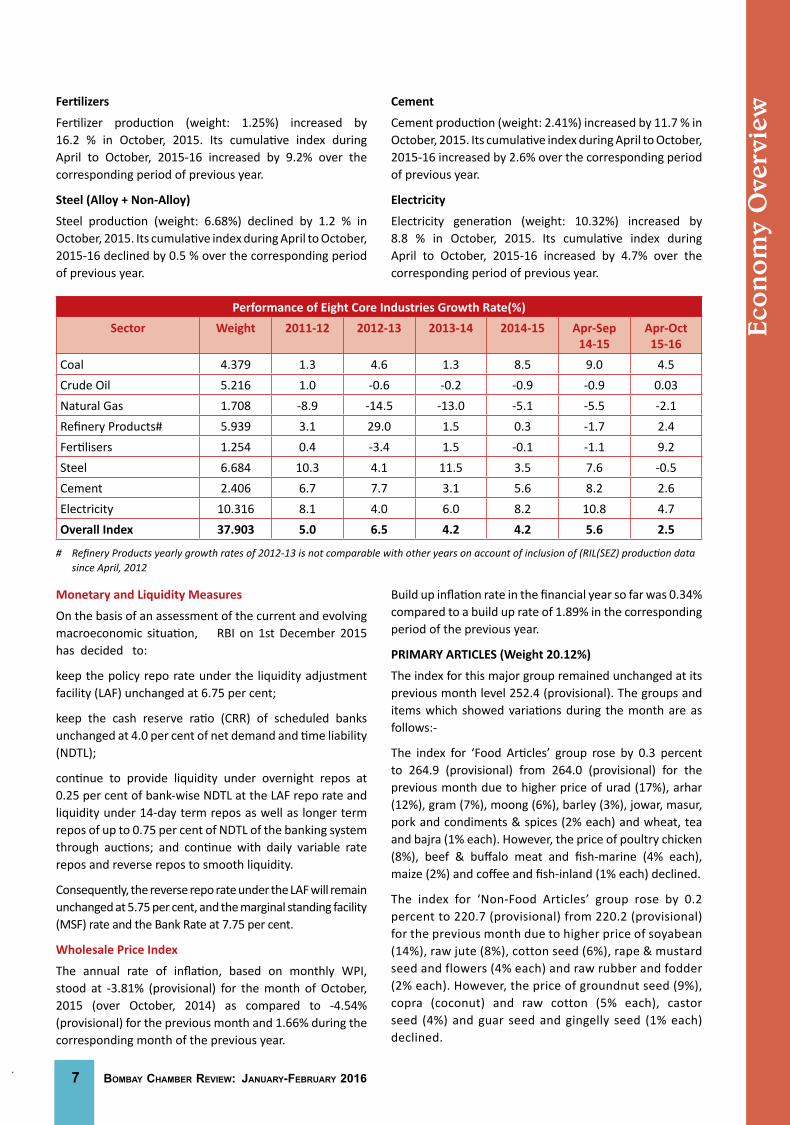
The Eight Core Industries comprise nearly 38 % of the weight of items included in the Index of Industrial Production (IIP). The combined Index of Eight Core Industries stands at 175.4 in October, 2015, which was 3.2 % higher compared to the index of October, 2014. Its cumulative growth during April to October, 2015-16 was 2.5 %.
Coal
Coal production (weight: 4.38 %) increased by 6.3 % in October, 2015 over October, 2014. Its cumulative index during April to October, 2015-16 increased by 4.5 % over corresponding period of previous year.
Crude Oil
The Natural Gas production (weight: 1.71 %) declined by 1.8 % in October, 2015. Its cumulative index during April to October, 2015-16 declined by 2.1 % over the corresponding period of previous year.
Natural Gas
The Natural Gas production (weight: 1.71 %) declined by 1.8 % in October, 2015. Its cumulative index during April to October, 2015-16 declined by 2.1 % over the corresponding period of previous year.
Refinery Products (93% of Crude Throughput)
Petroleum Refinery production (weight: 5.94%) declined by 4.4 % in October, 2015. Its cumulative index during April to October, 2015-16 increased by 2.4 % over the corresponding period of previous year.
7 BomBay ChamBer review: January-FeBruary 2016
Eco
nom
y O
verv
iewFertilizers
Fertilizer production (weight: 1.25%) increased by 16.2 % in October, 2015. Its cumulative index during April to October, 2015-16 increased by 9.2% over the corresponding period of previous year.
Steel (Alloy + Non-Alloy)
Steel production (weight: 6.68%) declined by 1.2 % in October, 2015. Its cumulative index during April to October, 2015-16 declined by 0.5 % over the corresponding period of previous year.
Cement
Cement production (weight: 2.41%) increased by 11.7 % in October, 2015. Its cumulative index during April to October, 2015-16 increased by 2.6% over the corresponding period of previous year.
Electricity
Electricity generation (weight: 10.32%) increased by 8.8 % in October, 2015. Its cumulative index during April to October, 2015-16 increased by 4.7% over the corresponding period of previous year.
Performance of Eight Core Industries Growth Rate(%)Sector Weight 2011-12 2012-13 2013-14 2014-15 Apr-Sep
14-15Apr-Oct 15-16
Coal 4.379 1.3 4.6 1.3 8.5 9.0 4.5Crude Oil 5.216 1.0 -0.6 -0.2 -0.9 -0.9 0.03Natural Gas 1.708 -8.9 -14.5 -13.0 -5.1 -5.5 -2.1Refinery Products# 5.939 3.1 29.0 1.5 0.3 -1.7 2.4Fertilisers 1.254 0.4 -3.4 1.5 -0.1 -1.1 9.2Steel 6.684 10.3 4.1 11.5 3.5 7.6 -0.5Cement 2.406 6.7 7.7 3.1 5.6 8.2 2.6Electricity 10.316 8.1 4.0 6.0 8.2 10.8 4.7Overall Index 37.903 5.0 6.5 4.2 4.2 5.6 2.5
# Refinery Products yearly growth rates of 2012-13 is not comparable with other years on account of inclusion of (RIL(SEZ) production data since April, 2012
Monetary and Liquidity Measures
On the basis of an assessment of the current and evolving macroeconomic situation, RBI on 1st December 2015 has decided to:
keep the policy repo rate under the liquidity adjustment facility (LAF) unchanged at 6.75 per cent;
keep the cash reserve ratio (CRR) of scheduled banks unchanged at 4.0 per cent of net demand and time liability (NDTL);
continue to provide liquidity under overnight repos at 0.25 per cent of bank-wise NDTL at the LAF repo rate and liquidity under 14-day term repos as well as longer term repos of up to 0.75 per cent of NDTL of the banking system through auctions; and continue with daily variable rate repos and reverse repos to smooth liquidity.
Consequently, the reverse repo rate under the LAF will remain unchanged at 5.75 per cent, and the marginal standing facility (MSF) rate and the Bank Rate at 7.75 per cent.
Wholesale Price Index
The annual rate of inflation, based on monthly WPI, stood at -3.81% (provisional) for the month of October, 2015 (over October, 2014) as compared to -4.54% (provisional) for the previous month and 1.66% during the corresponding month of the previous year.
Build up inflation rate in the financial year so far was 0.34% compared to a build up rate of 1.89% in the corresponding period of the previous year.
PRIMARY ARTICLES (Weight 20.12%)
The index for this major group remained unchanged at its previous month level 252.4 (provisional). The groups and items which showed variations during the month are as follows:-
The index for ‘Food Articles’ group rose by 0.3 percent to 264.9 (provisional) from 264.0 (provisional) for the previous month due to higher price of urad (17%), arhar (12%), gram (7%), moong (6%), barley (3%), jowar, masur, pork and condiments & spices (2% each) and wheat, tea and bajra (1% each). However, the price of poultry chicken (8%), beef & buffalo meat and fish-marine (4% each), maize (2%) and coffee and fish-inland (1% each) declined.
The index for ‘Non-Food Articles’ group rose by 0.2 percent to 220.7 (provisional) from 220.2 (provisional) for the previous month due to higher price of soyabean (14%), raw jute (8%), cotton seed (6%), rape & mustard seed and flowers (4% each) and raw rubber and fodder (2% each). However, the price of groundnut seed (9%), copra (coconut) and raw cotton (5% each), castor seed (4%) and guar seed and gingelly seed (1% each) declined.

BomBay ChamBer review: January-FeBruary 2016 8
Economy Overview
The index for ‘Minerals’ group declined by 5.0 percent to 222.5 (provisional) from 234.1 (provisional) for the previous month due to lower price of iron ore (10%), zinc concentrate (6%), crude petroleum (5%) and manganese ore (1%). However, the price of copper ore (3%) and sillimanite (2%) moved up.
FUEL & POWER (Weight 14.91%)
The index for this major group rose by 0.5 percent to 176.4 (provisional) from 175.6 (provisional) for the previous month due to higher price of aviation turbine fuel (7%) and high speed diesel (1%). However, the price of bitumen (7%), furnace oil (2%) and LPG (1%) declined.
MANUFACTURED PRODUCTS (Weight 64.97%)
The index for this major group remained unchanged at its previous month’s level of 153.3 (provisional). The groups and items for which the index showed variations during the month are as follows:-
The index for ‘Food Products’ group rose by 0.8 percent to 174.3 (provisional) from 173.0 (provisional) for the previous month due to higher price of sooji (rawa) and soyabean oil (4% each), khandsari and oil cakes (3% each), mustard & rapeseed oil, gola (cattle feed), rice bran oil and cotton seed oil (2% each) and groundnut oil, maida, sunflower oil, mixed spices, sugar, wheat flour (atta), tea dust (blended) and gur (1% each). However, the price of tea dust (unblended) (4%) and bakery products, gingelly oil and tea leaf (unblended) (1% each) declined.
The index for ‘Textiles’ group declined by 0.5 percent to 139.4 (provisional) from 140.1 (provisional) for the previous month due to lower price of tyre cord fabric (3%) and cotton yarn, man made fibre, jute sacking bag and man made fabric (1% each). However, the price of gunny and hessian cloth (2%) and jute sacking cloth (1%) moved up.
The index for ‘Wood & Wood Products’ group rose by 0.1 percent to 194.4 (provisional) from 194.2 (provisional) for the previous month due to higher price of processed wood (2%).
The index for ‘Paper & Paper Products’ group rose by 0.2 percent to 155.2 (provisional) from 154.9 (provisional) for the previous month due to higher price of paper pulp (2%) and kraft paper & bags and corrugated sheet boxes (1% each). However, the price of paper cartons/boxes (2%) and newsprint (1%) declined.
The index for ‘Leather & Leather Products’ group declined by 0.1 percent to 145.3 (provisional) from 145.4 (provisional) for the previous month due to lower price of foot wear/ safety boot (1%). However, the prices of crome tanned leather, leather chappals/ sandals and leather handbags / wallets (1% each) moved up.
The index for ‘Rubber & Plastic Products’ group declined by 0.7 percent to 147.0 (provisional) from 148.0 (provisional) for the previous month due to lower price of rubber products and plastic products (1% each).
The index for ‘Non-Metallic Mineral Products’ group rose by 0.6 percent to 178.1 (provisional) from 177.0 (provisional) for the previous month due to higher price of marbles (18%). However, the price of polished granite (2%) and glass bottles & bottleware (1%) declined.
The index for ‘Basic Metals, Alloys & Metal Products’ group declined by 0.5 percent to 154.1 (provisional) from 154.9 (provisional) for the previous month due to lower price of pencil ingots (5%), angles, metal containers, iron castings, rebars and joist & beams (2% each) and steel: pipes & tubes, rounds, wire rods, billets, ferro manganese, steel castings, iron & steel wire, melting scrap, aluminium, nuts/bolts/screw/ washers, gp/gc sheets, steel rods and plates (1% each). However, the price of pressure cooker (6%), silver (2%) and HRC, sheets, CRC and gold & gold ornaments (1% each) moved up.
The index for ‘Transport, Equipment & Parts’ group declined by 0.1 percent to 137.7 (provisional) from 137.8 (provisional) for the previous month due to lower price of railway brake gear and motor cycle / scooter / moped (1% each). However, the price of railway axle & wheel (2%) and auto rickshaw / tempo / matador (1%) moved up.
S. no.
Period /Commodities
Weight WPIOctober,15
Inflation(Year on year)
2014-15 2015-161 All Commodities 100.00 176.7 1.66 -3.812 Primary articles 20.11 252.4 0.76 -0.363 Food articles 14.33 264.9 2.74 2.444 Cereals 3.37 234.8 3.11 -0.255 Vegetables 1.73 304.0 -19.37 2.566 Non- food articles 4.25 220.7 -1.41 5.107 Fuel & Power 14.91 176.4 0.48 -16.328. Manufactured
Products64.97 153.3 2.50 -1.67
Source: Office of the Economic advisor, Ministry of Commerce & Industry, Govt of India. (Base Year: 2004-05=100)
Foreign Trade
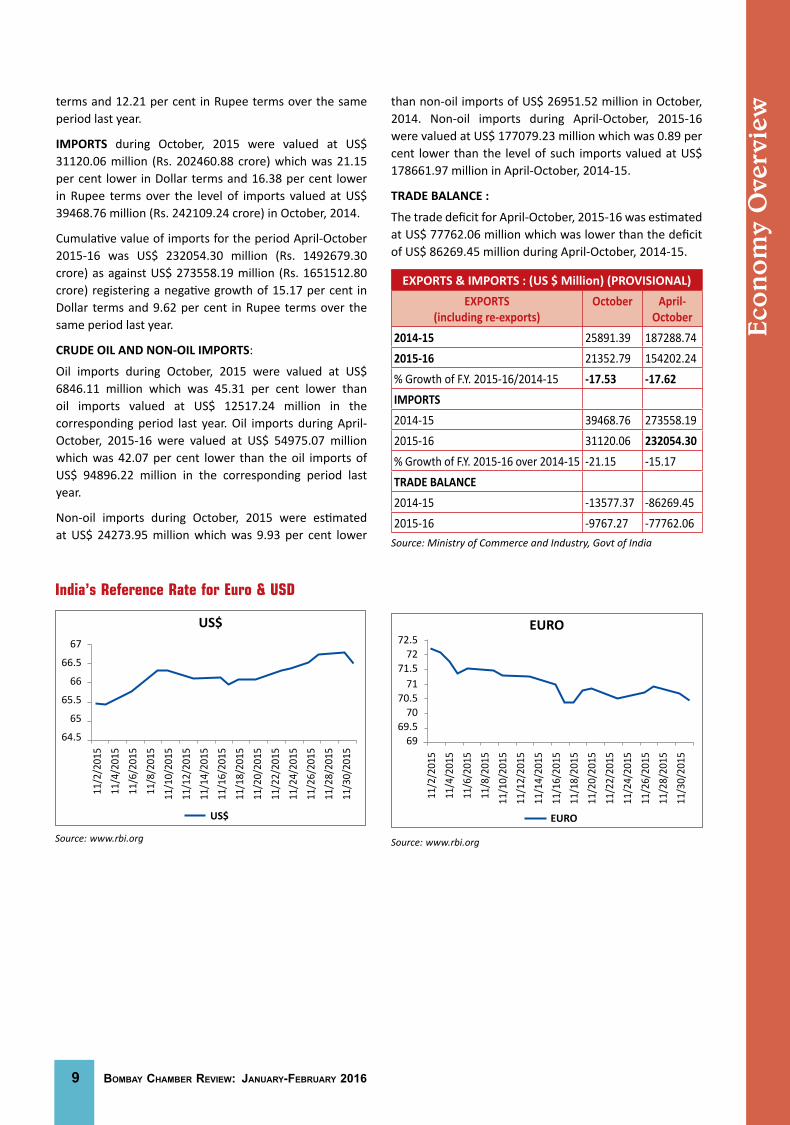
EXPORTS (including re-exports) during October, 2015 were valued at US$ 21352.79 million (Rs. 138916.98 crore) which was 17.53 per cent lower in Dollar terms (12.53 per cent lower in Rupee terms) than the level of US$ 25891.39 million (Rs. 158822.95 crore) during October, 2014.
Cumulative value of exports for the period April-October 2015-16 was US$ 154292.24 million (Rs. 992503.57 crore) as against US$ 187288.74 million (Rs. 1130539.38 crore) registering a negative growth of 17.62 per cent in Dollar
9 BomBay ChamBer review: January-FeBruary 2016
terms and 12.21 per cent in Rupee terms over the same period last year.
IMPORTS during October, 2015 were valued at US$ 31120.06 million (Rs. 202460.88 crore) which was 21.15 per cent lower in Dollar terms and 16.38 per cent lower in Rupee terms over the level of imports valued at US$ 39468.76 million (Rs. 242109.24 crore) in October, 2014.
Cumulative value of imports for the period April-October 2015-16 was US$ 232054.30 million (Rs. 1492679.30 crore) as against US$ 273558.19 million (Rs. 1651512.80 crore) registering a negative growth of 15.17 per cent in Dollar terms and 9.62 per cent in Rupee terms over the same period last year.
CRUDE OIL AND NON-OIL IMPORTS:
Oil imports during October, 2015 were valued at US$ 6846.11 million which was 45.31 per cent lower than oil imports valued at US$ 12517.24 million in the corresponding period last year. Oil imports during April-October, 2015-16 were valued at US$ 54975.07 million which was 42.07 per cent lower than the oil imports of US$ 94896.22 million in the corresponding period last year.
Non-oil imports during October, 2015 were estimated at US$ 24273.95 million which was 9.93 per cent lower
than non-oil imports of US$ 26951.52 million in October, 2014. Non-oil imports during April-October, 2015-16 were valued at US$ 177079.23 million which was 0.89 per cent lower than the level of such imports valued at US$ 178661.97 million in April-October, 2014-15.
TRADE BALANCE :
The trade deficit for April-October, 2015-16 was estimated at US$ 77762.06 million which was lower than the deficit of US$ 86269.45 million during April-October, 2014-15.
EXPORTS & IMPORTS : (US $ Million) (PROVISIONAL)EXPORTS
(including re-exports)October April-
October2014-15 25891.39 187288.742015-16 21352.79 154202.24% Growth of F.Y. 2015-16/2014-15 -17.53 -17.62IMPORTS2014-15 39468.76 273558.192015-16 31120.06 232054.30% Growth of F.Y. 2015-16 over 2014-15 -21.15 -15.17TRADE BALANCE2014-15 -13577.37 -86269.452015-16 -9767.27 -77762.06
Source: Ministry of Commerce and Industry, Govt of India
India’s Reference Rate for Euro & USD
Source: www.rbi.org
67
66.5
66
65.5
65
64.5
11/2
/201
511
/4/2
015
11/6
/201
511
/8/2
015
11/1
0/20
1511
/12/
2015
11/1
4/20
1511
/16/
2015
11/1
8/20
1511
/20/
2015
11/2
2/20
1511
/24/
2015
11/2
6/20
1511
/28/
2015
11/3
0/20
15
US$
US$
Source: www.rbi.org
72.572
71.571
70.570
69.569
11/2
/201
511
/4/2
015
11/6
/201
511
/8/2
015
11/1
0/20
1511
/12/
2015
11/1
4/20
1511
/16/
2015
11/1
8/20
1511
/20/
2015
11/2
2/20
1511
/24/
2015
11/2
6/20
1511
/28/
2015
11/3
0/20
15
EURO
EURO
Eco
nom
y O
verv
iew

BomBay ChamBer review: January-FeBruary 2016 10
the 10th Biennial Conference-AgriCorp 2015 “Risk Mitigation in Agriculture”
Bankers, agriculture experts and business leaders mingled with farmers and innovators at AgriCorp 2015, the two day conference on “Risk Mitigation in Agriculture” organised by Bombay Chamber of Commerce & Industry on November 3 and 4. It was the 10th biennial conference organised by the Chamber, which is a 180-year-old body noted for its service to trade, industry and the people of India.
The conference saw engaging discussions around the key theme of risk mitigation and touched on contemporary issues like farmer distress and suicides, the issues concerning marginal holdings, the need for modern day warehousing solutions, the role of technology and the need for financial solutions to reach out to small farmers.
“We have 120 million farmers and they form the largest army of private entrepreneurs. They take risks every season on factors mostly outside their control like climatic conditions, water availability, the amount of rainfall, plant and animal pests and diseases. And unlike most of other producers of goods and services, these farmers have the least control on the management of their business,” said Mr. Anil Jain, the Conference Chairman and MD&CEO of Jain Irrigation systems Limited.
Mr. Jain and several other speakers called for special attention to policy formulation with a focus on risk mitigation, particularly for small farmers. Speakers stressed that the India growth story would be imperilled if the agriculture sector was not supported and if risk mitigation was not given priority attention in a sector particularly prone to uncertainty on multiple counts.
“We can go for bigger exports, launch the ‘Make in India’ campaign and seek many other routes to faster growth but if we do not focus on the farmer community and mitigate risks, will we have a future at all?” Mr. Jain asked.
Among the suggestions that came up at the conference was the need for the government to lead a data revolution and analytics to enable better predictability and policy action, and support for innovations that can be adopted by the small farmer with the potential to revolutionise the holding capacity of farmers, like solar powered small-sized cold chain solutions, Drip irrigation, cheap poly houses, market access, innovative financial solutions tailored to the needs of farmers. Transportation, road infrastructure and much improved storage facilities were also discussed.
Mr.Vikas Gadre, the Director General of the Chamber, later said all the suggestions would be collated and presented to the appropriate authorities to help in policy formulation. He said the Chamber would be at the forefront of
discussions on the agriculture sector and risk mitigation strategies, and would meet with the Agriculture Minister and Agriculture Secretary in this regard.
A special 65 page souvenir was released at the conference with messages from Union Agriculture Minister Radha Mohan Singh, Maharashtra Chief Minister Devendra Fadnavis, Maharashtra Agriculture Minister Eknath Khadase, Maharashtra Additional Chief Secretary (Agri. and Mktg.) and industry leaders. SPJIMR, a top ranked B-School was the knowledge partner for the conference.
Several agriculture related corporates, Senior Officials of the Central and State Government and other organizations including Financial Institutions, NGOs, FPOs(Farmer’s Produce Organization) and Small & Marginal Entrepreneurs(SME’s) participated in the Conference. n
Special Feature

11 BomBay ChamBer review: January-FeBruary 2016
Spec
ial
Feat
ureOPINION OF ThE KEY DELEGATES
Mr. Anil JAinChairmanAgriculture & Food Processing Committee &AgriCorp-2015, Bombay Chamber of Commerce & IndustryMD & CEO, Jain Irrigation Systems Limited
Setting the theme: We have 120 million farmers. They are private entrepreneurs…the largest such community anywhere in the world. They take risks every season, every year on factors mostly outside their control like climatic conditions, water, rain, diseases. And unlike most of other producers of goods and services, these farmers have the least control on the management of their business.
“We can go for bigger exports, launch the ‘Make in India’ campaign and seek many other routes to faster growth but if we do not focus on the farmer community and mitigate risks, will we have a future at all?” Anil Jain asked.
He asked the conference to focus on mitigating risks for the small farmer, who forms the bulk of the farm community in our country, and to ensure that we have value creation rather than value destruction, which often happens when the farmer produces more and cannot store it.
We see many solutions, like cluster farming, water management, and better seeds, market linkages, single window type of solutions, extension and training but we lack an integrated and coordinated policy.
MR. VENKATEShWARLUGuest of honour: AgriCorp- 2015 Vice-Chancellor Vasantrao Naik Marathwada Krishi Vidyapeeth Parbhani (Maharashtra)
The three risk primary risks are climate risk, price risk and quality risk. While price and quality can be managed, climate risk remains the biggest and difficult which cannot to be controlled. Average temperature has been rising and it should be a matter of concern that tropical countries like ours will be the worst affected. The impact on small farmers will be crucial. In this context, he cited an interesting statistic: If you produce paddy, for every unit of water consumed, you get two to three rupees; for fish, you’ll make Rs.15 and for steel, it is Rs.35. Managing water should be our number 1 priority.
MR. SAMIR ShAhKey Note Speaker MD & CEO, National Commodity and Derivatives Exchange Ltd (NCDEX)
Stress in the industry is reaching alarming levels. Take the case of pulses: prices have gone through the roof. Could we not have forecasted this situation? So what are the mechanism we must have for forecasting and buffer stock management, which we have in rice and wheat but not in pulses?
MR. AJAY VIR JAKhARChief Guest: AgriCorp-2015Chairman, Bharat Krishak Samaj
India suffers on integrity of data and hence we need a data revolution. Government should act as a catalyst and lead a data revolution, open it up for use and not act as a guardian of that information. The data should be shared for meaningful analysis, policies and on ground implementation. This will also help us in understanding some of our current metrics: for an example, every time I have a tractor breakdown today, I contribute to the rise of the GDP. The question he left unasked: So does that mean growth for me, the country’s GDP, the Agriculture sector or….
De-risking is not merely about working with high technology. A simple solution like deworming cattle can increase milk production by 20%.
Some flavor of the discussions:
This was a theme the conference returned to again and again. On Day 1, entrepreneurs from IIT Kharagpur showed us how affordable cold chain solutions could be taken right to the doorstep of the farmers, using solar and secondary back up power, solutions that meet individual needs, are affordable and can potentially revolutionize the markets.
We heard from Dr. Nikam, the ex-Dean of Bombay Veterinary College, how the so-called “loose housing system” with open space and bamboo fencing can work as an exciting innovation, providing a stress free environment for animals, animals can move around, low labour requirement, low capital, better utilization of feed, exercise that keeps animal healthy and higher production by 5-10%. Costs: 25,000 versus 20 lakhs that is for traditional brick and mortar housing.
Similarly, Day 2 saw farmers speak up form among the audience and on stage, highlighting that what we need is an ecosystem where farmers can interact with intermediaries who can speak to them in their language, help and guide them on various aspects in the local area and implement the various solutions and technologies on offer. The last mile gap, the handshake at the local level is a critical step. Interestingly, none of the farmers in the audience said they had used warehousing facilities.
As such, the focus remained on farmers, particularly small and marginal farmers, as Mr. Anil Jain had suggested during the inaugural.
Warehousing remains an area of growth. But we are a long way from a system where warehouses are available within reach and receipts are negotiable. Gurinder Singh of Star Agriculture Finance pointed out that in terms of Agriculture warehousing credit gap and growth, the potential remains 100 thousand crore whereas the

BomBay ChamBer review: January-FeBruary 2016 12
system now achieves only 45 thousand crore. He said we need more players needed in collateral finance, which is showing a CAGR of 20%.
At the end of the day, the farmer must be made into a quasi-trader – till we can’t do that, we can’t help the farmer.
An interesting question was posed: We have heard so much about farmer suicides (the question came up again and again on both days)...but have we ear heard of a trader committing suicide? This is only because the trader can hold his good, get finance against them, and sort and release the goods in the market at an appropriate time, so that it fetches a good price. If the farmer can be similarly empowered, we may address a lot of the concerns that the farmers face.
We often discussed infrastructure. But as Dr. K.V. Lavekar pointed out, we often talk of infrastructure in terms of storage, cold chains, market access and such like, we often do not realise that infrastructure also means basic infra like roads, because when it comes to perishables, the farmer must take it to the nearest market and he needs roads to get there.
This only highlights that linkages are never simple and investments must be from the bottom up, and there is the argument that there is little point in a setting up high cost and advanced technology investments when the basics are lacking.
At the other end, we learn how the Adani group is setting up modern day silo storage. We produce 150 million tonnes of vegetables, 50 million tonnes of fruits, but a large quantity, 18%, are losses in fruits and vegetables against 8-10% losses in food grains.
The argument was for a change from a “conventional” supply chain (farm to mandi to transit to storage to despatch) to bulk handling – from arm to storage to dispatch. China had open storage as late as 1998, and has completely changed now to modern day silos. So can India.
The large theme that emerged was that we are on the cusp of a big change. There is a firing up of private sector energy in the Agriculture sector and the government is moving from the role of doer to an enabler and the focus is on risk mitigation.
Common Concerns, Issues and Challenges
Doable Solutions provided during Two day Conference organized by BCCI
Nov 3rd & 4th, 2015
1. Farmer demographic data needs to be aligned
2. Land fragmentation is a concern
3. Illiteracy, ignorance. Farmers are not well informed about modern high precision technology
4. Banking and finance: easy credit accessibility required to micro and small farmers
5. Storage and warehousing is lacking
6. Absence of market linkages
7. Inaccessibility of markets to the farmers; hence not getting right price on produce
8. High risks owing to conventional method of harvesting and farming
9. Poor water management
Solutions:
1. Banking and micro finance: easy, innovative and tailored schemes for the farm sector required.
2. External support bodies: banking, microfinance institutions (NBFC), insurance, private and corporate, Agriculture research – should collaborate towards risk mitigation. and engage and provide easy outreach to farmers in terms of imparting knowledge, credit accessibility, insurance policies and pay outs.
3. Research should be meaningful, usable and farmer friendly and cost effective.
4. Solutions should be such that they can reach the village level rather than expecting farmer to travel long distances to access solutions.
5. Emphasis should be more on produce and yield of the farmer, less on asset collateral.
6. Integrated participation of farmers in Agriculture extension and linkages.
7. Infra: Besides warehouses, we also need some basics like roads to reach warehouses.
8. As warehouses become more prevalent, they should be cost effective for the farmer.
9. Risk mitigation requires participation from all stakeholders with equal responsibilities in order to safeguard interests of farmers, whether its value, price, return on investments or human lives.
10. To make a robust distress relieving mechanism to combat critical situations, particularly in times of high stress.
CONCLUSION:
In the end, the best risk mitigation solution is to keep talking of the risks we face and discussing them in conferences such as the one we had here today. As we gather to discuss and deliberate, we can better understand the problems and so provide workable and effective solutions. We need a feedback system. The time has come when we can wait no more to give due attention to the concerns of the Agriculture Sector. As India pushes for faster growth, the realisation must be there that not pushing farm growth will mean derailing the entire GDP of the country. The need is to accelerate the momentum so that we are able to seize the opportunity of growth that stares at us.
Special Feature

13 BomBay ChamBer review: January-FeBruary 2016
With India posed for a big take off in manufacturing through the ‘Make in India’ initiative of Hon’ble Prime Minister Shri Narendra Modi, focus is riveted on the support role ports play in boosting the country’s competitiveness on the global stage.
The strong relationship between manufacturing and logistics infrastructure is widely accepted. While growth in manufacturing stimulates the requirement for support infrastructure for movement of raw materials and finished goods within domestic territories and international territories, the availability of such infrastructure at competitive rates promotes manufacturing sectors and improves global competitiveness of any country.
An efficient maritime sector, including shipping, port and its logistics chain, that can reduce cost of transportation of raw materials as well as finished goods, which, in turn, contributes directly to development of an efficient and competitive manufacturing sector. In fact, inadequate maritime infrastructure is a major bottleneck that adversely impacts the efficiency of movement of cargo in India and, thereby, jeopardises the dream of ’Make in India.
The sector is suffering from infrastructure-related constraints and logistic-centric inefficiencies. Currently, the government is the major player in the port and
logistics sector. However, there is a critical need for further investment in technology and capacity building, which will require active participation by the private sector. To facilitate and encourage this participation, the government must urgently evolve smooth regulatory and investment policies for private players.
The lessons from PPP failures at many major ports due to unreasonable risk transfers should nudge the government to go for more efficient contracting that allows a more equitable sharing of risks. Further, tariff regulation is not required for container terminals at major ports particularly in the western region where there is enough capacity for the market forces to determine the rates.
The current regulatory regime, it is argued, benefits foreign shipping lines because there is no mechanism to ensure that the benefits of lower rates ordered by TAMP are passed on by the lines to the trade (exporters/importers). The trade has often pointed out this anomaly in the regulatory structure. On the other hand, terminal operators have been highlighting the fallacy of tariff regulation in a business to business set-up like ports where the trade/users are not directly involved unlike electricity and telecom sectors. This has led to an uneven level playing field between major and non-major ports, triggering debate about the need for TAMP. This issue need to be settled at the earliest to give a much needed momentum to the attractiveness of projects at major ports.
Private players will be hesitant to come and bid for PPP projects at major ports because he knows that his operations will be limited/stifled by the tariff regulations. It will be detrimental to the success of PPP projects at major ports. So, there should be level-playing field between major ports and non-major ports (those owned by the state governments) who are free from such tariff regulations.
The government intends to make the country’s automotive industry the engine of its “Make in India” campaign. The automotive industry can be termed as the mother of the manufacturing sector in an economy, as its fortunes directly impact the fortunes of several related manufacturing industries. The Indian automotive industry (both vehicles and auto components) has the potential to scale up exports to the extent of 35% - 40% of its overall output over the next ten years and become one of the major automotive export hubs of the world, according to the Automotive Mission Plan 2016-26, a road map for the industry, unveiled by the government in September.
Are Indian Ports Ready to Play Support Role for “Make in India”?
Mr. n.n. Kumar, Conference Chairman – 9th Biennial Conference on Ports Shipping logistics 2016;
Principal Commissioner of Income tax and Former Chairman – JnPt
Interview
Inte
rvie
w

“Structwel has all the engineering services under one roof,which is the greatest advantage we offer to our clients.”

An ISO 9001 : 2008 certified company

BomBay ChamBer review: January-FeBruary 2016 16
The National Democratic Alliance (NDA) government expects the passenger vehicles (PV) market to triple to 9.4 million units by 2026 from 3.2 million now if the economy grows at an average rate of 5.8% a year, says the Plan. If the economy grows at an average yearly pace of 7.5%, the size of the PV market is forecast to rise to 13.4 million units, making it the world’s second largest, behind only China. Based on the same premise, the commercial vehicle industry is expected to grow to 2 million and 3.9 million units, respectively, from 700,000 at the end of 2014-15. The two-wheeler market is likely to grow to 50.6 million and 55.5 million from 18.5 million units currently.
The government reckons that the rapid growth of the automotive industry in the coming decade will involve a big increase in the movement of physical goods (raw materials, components, assemblies and finished vehicles) both within the country and outside. This will call for a big step up in the logistics infrastructure including setting up dedicated facilities such as berths, parking yards and faster clearance for automotive exports at JNPT, Mumbai, Chennai and Mundra ports as well as building last mile connectivity to these ports. Among other initiatives needed are the introduction of flexi-deck auto wagons for movement of vehicles from factories to the ports and policy on coastal shipping and inland waterways to facilitate auto logistics within the country.
The shipping ministry under the guidance of Shri Nitin Gadkari has started lending a helping hand to the sector.
In August 2015, the government lifted curbs on foreign registered, specialized car-carrying ships to operate in Indian waters for five years in a bid to help shift movement of such cargo from roads and railways.
In March 2015, the shipping ministry flagged off a scheme that gives incentives to cargo owners, consignors and consignees when they transport certain identified bulk commodities, containerized cargo or automobiles on Indian vessels on local routes. The scheme also covers transportation of vehicles wherein cargo owners shall be eligible for incentives of Rs.300 per two-wheeler vehicle, Rs.600 per three-wheeler vehicle and Rs.3,000 for other vehicles. These commodities have been identified on the basis of their low levels of transportation through coastal and inland waterways. Some of the world’s top automobile carriers are eyeing the Indian market to ship cars and trucks.
However, auto makers say that the scheme for incentivizing modal shift will take off for automobiles only if the government removed the stipulation to use Indian registered ships for coastal shipment. The government has allowed foreign registered car carriers to ply on local routes only because such specialized Indian registered ships are not available with Indian fleet owners. Hence, the condition to use Indian registered ships for coastal movement of cars needs amendment to make the scheme a success.
While many ports are giving discounts/rebates in vessel related charges to ships including car carriers lifting cars meant for exports, some such as Kamarajar Port have started offering rebates in cargo related charge also to promote coastal shipment of automobiles.
In October 2015, Kamarajar Port Ltd (formerly Ennore Port Ltd) approved a proposal for handling automobiles through coastal movement between KPL and other Indian ports on trial basis till March 31, 2016 with a promotional offer of 50 per cent concession on wharfage charges. The aim is to boost coastal shipping. The scheme deserves a longer time-span.
However, there are constraints. The cargo related charges for export cars are calculated on an ad valorem basis depending on the value of the cars. Original equipment manufacturers (OEMs) have argued that levying cargo related charges on ad valorem basis for coastal shipments will not help in making the switch from road to sea.
Cargo related charges have to be levied as fixed charges on a per unit basis in order to make it viable for the modal shift from road to sea. This will make it easier for the OEMs to calculate the cost difference between road and coastal shipment.
For instance, the cost of transporting a car from Chennai to Ahmedabad by road works out to ₹11,500 but if the same car is moved by a ship, then the cost rises to ₹14,500.
Lack incentives and duty on bunker oils makes coastal shipping of automobiles uneconomical. If a ₹3,000 incentive per car is provided and bunker oils are given duty-free, then coastal shipping will become viable, according to automobile carriers.
These issues should engage the attention of the government.
Finally, a word on dredging. With the shipping ministry telling major ports to deepen their channels to accommodate capsize ships, time has come for these ports to look at innovative methods of dredging such as the annuity method used in highways and the guaranteed depth model to deepen the channels. There are many instances of dredging contracts at major ports ending up with serious disputes and arbitrations because of lacuna in the EPC model followed for such works.
To conclude, there is huge scope for augmenting the port capacity in itself and improving the efficiency of ports in terms of turn-around time of ships. If the turn-around time is fast, costs goes down; but if it is slow, lot of costs gets added to it. Quick clearance of customs and other documentation is also equally important. So, there is softer side to it and a hard infrastructure side to it. Both, expansion of capacity as well as modernisation/up-gradation should go hand in hand. n
Inte
rvie
w
Interview

17 BomBay ChamBer review: January-FeBruary 2016
Inte
rvie
w MAlAySIA1. Facts and Figures
Capital Kuala Lumpur
Population 30.78 mil (2015 est.)
Land Area 330,252 sq km
Climate Tropical Rainforest
Form of Government Constitutional Monarchy
GDP US$328 bil.(2015 est.)
GDP Growth 4.8%(2015 est.)
GDP Per Capita US$10,654( 2015 est.)
Unemployment rate 3%( 2015 est.)
Inflation 2.5% (June 2015)
Currency Ringgit Malaysia (RM)US$1=RM4.215 (7 December 2015)
2. Malaysia Map
NCER : NORThERN CORRIDOR ECONOMIC REGION (17,816 sq km)Investment Opportunities : Agriculture, Manufacturing,
Tourism, Logistics and Education & Human capital
SDC : SABAh DEVELOPMENT CORRIDOR (73,997 sq km)Investment Opportunities :- Tourism, Logistics, Agriculture
& Manufacturing
ECER : EAST COAST ECONOMIC REGION(66,736 sq km)Investment Opportunities :- Tourism, Oil, Gas
& Petrochemical, Manufacturing, Agriculture & Education
SCORE: SARAWAK CORRIDOR OF RENEWABLE ENERGY ( 70,709sq km)Investment Opportunities :- Oil-based products, Palm-oil, Marine
Engineering, Aluminium, Glass, Timber-based products, Steel, Aquaculture & Tourism
IRDA : ISKANDAR MALAYSIA ( 2,217 sq km) Investment Opportunities :- Tourism, Education, healthcare,
Logistics, Creative industries & Financial advisory and consulting services
Cou
ntr
y Fo
cus
Country Focus

BomBay ChamBer review: January-FeBruary 2016 18
3. Trade In term of trade, Malaysia is among the top trading
nations in the world. In 2014 Malaysia was the: • 25th Largest Trading Nation in the world; • 23rd Biggest Exporter; • 26th Biggest Importer; • 29th in World Commerce-Services Trade; and • 31st Biggest Exporter of Services.
Being one of the top trading nations of the world, Malaysia’s achievements have been largely due to a systematic and determined approach to develop world-class infrastructure, innovative and sound banking and financial systems and logistics to rival the world’s best and provides a conducive environment for businesses to thrive. Currently there are over 4,000 international companies from more than 50 countries that have made Malaysia their offshore base.
Supported by stronger than expected export growth, Malaysia’s total trade in 2014 continued on an upward trend, expanding by 5.8% to reach RM1.45 trillion(USD 442.77billion), compared with RM1.36 trillion (USD 434.22billion) in 2013.
Major trading partners that contributed to the growth in trade were:
i. ASEAN, growing by RM14.54 billion (USD 4.44 billion) or 3.9%;
ii. the European Union (EU), RM8.35 billion (USD 2.55 billion) or ↑6.2%;
iii. the United States of America (USA), RM8.01 billion (USD 2.45 billion) or ↑7.4%;
iv. Australia, RM7.48 billion (USD 2.28 billion) or ↑16.4%;
v. Hong Kong, RM6.05 billion (USD 1.85 billion) or ↑14.5%;
vi. Taiwan, RM5.94 billion (USD 1.81 billion)or ↑11.2%; and
vii. the People’s Republic of China (PRC), RM4.54 billion (USD 1.39 billion) or ↑2.2%.
Exports in 2014 rose by 6.4% or RM46.14 billion (USD 14.09 billion) to RM766.13 billion (USD 234.08 billion), surpassing the forecast export growth of 6% in the 2014/2015 Economic Report.
Imports increased by 5.3% or RM34.32 billion (USD 10.48 billion) to RM683.02 billion (USD 208.68 billion). The growth impetus of exports had resulted in a trade surplus of RM83.11 billion (USD 25.39 billion), representing Malaysia’s achievement of 17th consecutive years of trade surplus. The trade surplus in 2014 registered a double-digit growth of 16.6%, a remarkable achievement compared with negative growth in 2012 (-22.8%) and 2013 (-25.7%).
Major contributors to this performance included:- • Strong uptake by almost all ASEAN countries;
• Expansion in exports spurred by higher demand for manufactured products, in particular electrical and electronic (E&E) products, and steady demand for commodities;
• Recovery in key markets such as the USA and Japan; • With the exception of commodities export such
as palm oil and rubber, other exports to the PRC continued to be sustained. Higher export were recorded for E&E products (↑RM2.81 billion)/(USD858 million), petroleum products (↑RM685.2 million)/(USD 209.35 million), transport equipment (↑RM242.6 million)/(USD 74.12 million) and optical and scientific equipment (↑RM299.5 million)/(USD 91.51 million);
• Greater demand from emerging markets such as countries in Africa, Central Asia and South Asia; and
• Supporting manufactured exports which made up 76.7% of total exports, imports of intermediate goods increased by 7.6%.
Trade with the FTA partner countries registered a growth of 3.9% to RM906.6 billion (USD 277 billion) with exports expanding 4.7% to RM491.35 billion (USD 150.12 billion) and imports growing at 2.9% toRM415.25 billion(USD 126.87 billion). Expansion in exports to the FTA partner countries were contributedby higher exports of liquefied natural gas (LNG), petroleum products, E&E products,crude petroleum as well as chemicals. FTA countries contributed 64.1% of Malaysia’stotal exports in 2014. It is estimated that close to 49% of exports to FTA partnercountries were through preferential access.
4. Bilateral Trade with India In general, India is a very important market and
has always been Malaysia’s biggest trading partner in South Asia. Malaysia-India bilateral trade has increased by more than three-fold for the past 10 years. From 2004 to 2014, the average trade growth was 14.6 per cent. With the implementation of the MICECA, bilateral trade has grown tremendously by 17.97 per cent from 2011 to 2014.
Despite tough external environment, Malaysia’s trade with India expanded by 3.5 per cent to USD 13.84 billion from USD 13.37 billion in 2013 boosted by a better exports performance, making India as Malaysia’s 11th largest trading partner and accounted for 3.12 per cent of Malaysia’s total trade.
Malaysia’s exports to India grew to USD 9.76 billion in 2014 on the back of higher exports of palm oil; crude petroleum; electrical and electronic products; and chemicals and chemical products. Other products that registered increases were furniture, textiles, clothing and footwear as well as processed food.
India was Malaysia’s 8th biggest export destination and also currently the biggest importer of Malaysian palm oil.
Country Focus

19 BomBay ChamBer review: January-FeBruary 2016
Cou
ntr
y Fo
cus5. Important Policies (main)
i. Economic Transformation Programme (ETP) The Economic Transformation Programme (ETP)
was formulated as part of Malaysia’s National Transformation Programme. Launched on 25 September 2010, ETP’s goal is to elevate the country to developed-nation status by 2020, targeting GNI per capita of US$15,000. This will be achieved by attracting US$444 billion in investments which will, in turn, create 3.3 million new jobs. The ETP’s targets for 2020 will be achieved through the implementation of 12 National Key Economic Areas (NKEAs), representing economic sectors which account for significant contributions to GNI. The 12 NKEAs as follows:
i. Oil, Gas & Energy Oil, Gas and Energy ii. Palm OilPalm Oil & Rubber iii. Financial Services Financial Services iv. TourismTourism v. Business ServicesBusiness Services vi. Electronics &ElectricalElectronics& Electrical vii. Wholesale &RetailWholesale& Retail viii. EducationEducation ix. HealthcareHealthcare x. Communications Content &Infrastructure
Communications Content and Infrastructure xi. AgricultureAgriculture xii. Greater Kuala LumpurGreater Kuala Lumpur/
Klang Valley
ii. 11th Malaysia Plan (RMK-11) The 11th Malaysia Plan, 2016-2020, is the final
leg in the journey towards realising Vision 2020. Launched in 1991, Vision 2020 envisions Malaysia as a fully developed country along all dimensions - economically, politically, socially, spiritually, psychologically, and culturally - by the year 2020.
The eleventh economic plan for Malaysia identifies six “Strategic Thrusts”, key points along which the economic policies will focus to ensure Malaysia reaches its goal of becoming a high-income country by 2020. The key target for the whole plan is for Malaysia to reach the advanced economy status, that is to say a national income per capita above USD 15,000.
Malaysia economic plan 2016-2020: six strategic thrusts:
The Malaysian government also identified six “Game Changers”, innovativeapproaches that will change the trajectory for the country’s economic growth andenable it to reach its economic goals:
• Unlocking the potential of productivity • Uplifting the B40 households (bottom 40%
household income group) towards a middle-class society
• Enabling industry-led Technical and Vocational Education and Training (TVET)
• Embarking on green growth • Translating innovation to wealth • Investing in competitive cities
6. Investment Opportunities The leading sources of foreign investments for the
first nine months of 2015 were Hong Kong, Japan, USA, Singapore and China. These five countries jointly accounted for 70.3% of total foreign investments approved in the manufacturing sector for January - September 2015. For the first nine months of this year, Malaysia’s realised private investments (measured in terms of Gross Fixed Capital Formation -- GFCF -- in current prices) amounted to RM159.4 billion, 8.4% higher than the RM147.0 billion recorded in the same period in 2014. With this performance, Malaysia is well positioned to reach the average of RM162 billion per annum estimated for the 10th Malaysian Plan period.
In 2014, Malaysia’s total investments last year reached a new high of RM235.9 billion, up 8% from RM219.4 billion in 2013. These investments underscore Malaysia’s transformation into a high-income economy, with several quality projects in advanced technologies and manufacturing services featuring prominently among the year’s biggest projects. Of the total investments approved, RM171.3 billion or 72.6% were domestic direct investments (DDI), while RM64.6 billion or 27.4% were foreign direct investments (FDI). The services sector contributed 63.4% or RM149.6 billion of approved total investments. This was spread out over 5,059 projects. As in previous years, the real estate sub-sector continued to dominate services investments, accounting for RM88.5 billion or 59.2%, whilst utilities attracted RM9 billion or 6% of investments and distributive trade at RM8.7 billion at 5.8% of investments.
At present, there are over 100 Indian companies operating in Malaysia. Reliance Industries Ltd (RIL), Tata Consultancy Services (TCS) and Tech Mahindra are some of the Indian giants with presence in Malaysia. RIL for example has invested millions of dollars in Malaysia. The world’s largest polyester plant they own is in Malaysia, not in India. Even Indian public sector undertakings have an impressive track record in Malaysia, with HMT, EIL, BHEL, IRCON and IOC having been actively engaged with the Malaysian industrial sector since the 1970s. For instance, IRCON International Ltd.has been actively engaged in the development of railways in Malaysia since 1988. Some of its prominent achievements include supplying locomotives on hire and maintenance basis to KTM Berhad (Malaysian Railway) since July 1993 and for being awarded with the Seremban – Gemas Railway Double Tracking Project worth over US $ 1 billion.

BomBay ChamBer review: January-FeBruary 2016 20
i. Tax structure for foreign investors In Malaysia, tax incentives, both direct and
indirect, are provided for in the Promotion of Investments Act 1986, Income Tax Act 1967, Customs Act 1967, Sales Tax Act 1972, Excise Act 1976 and Free Zones Act 1990. These Acts cover investments in the manufacturing, agriculture, tourism (including hotel) and approved services sectors as well as R&D, training and environmental protection activities. The direct tax incentives grant partial or total relief from income tax payment for a specified period, while indirect tax incentives are in the form of exemptions from import duty, sales tax and excise duty.
Repatriation of Profits Malaysia continues to maintain a liberal foreign
exchange administration (FEA) policy which is mainly prudential measures to support the overall macroeconomic objective of maintaining monetary and financial stability while safeguarding the balance of payments position. The FEA policies have been progressively liberalised to enhance competitiveness of the economy and to achieve greater efficiency in the conduct of trade and investments.
There are no FEA restrictions and the Malaysian markets are easily accessible by global investors. There is free mobility of inflow and outflow of capital for investments in Malaysia. Non-residents are free to invest in any form of ringgit assets either as direct or portfolio investments. They are also free to remit out divestment proceeds, profits, dividends or any income arising from these investments in Malaysia. There are no restrictions for the non-residents to convert foreign currency to ringgit or vice versa, with licensed onshore banks, for the purchase of ringgit assets or for repatriation of funds arising from these ringgit investments. Non-residents are also allowed to undertake the settlement of ringgit investments through appointed overseas banks which are within the same banking group of banks with presence in Malaysia.
7. Business Promotion i. Trade fairs and Conferences Business people may surf the below links to get
access to the major International Trade Exhibition & Conference in Malaysia, either organised by MATRADE or the ones that get endorsed by MATRADE:
a. Organised by MATRADE http://www.matrade.gov.my/en/foreign-
buyers/trade-events/held-in-malaysia/organised-by-matrade
b. Endorsed by MATRADE http://www.matrade.gov.my/en/foreign-
buyers/trade-events/held-in-malaysia/endorsed-by-matrade
8. Tourism information i. Tourist Attraction “Malaysia, Truly Asia”, the famous tourism slogan
of Malaysia is no longer new to most of the Indians as well as travellers worldwide. India in fact is one of the biggest sources of tourists to Malaysia. Some of the favourite places that the Indians normally visit in Malaysia are Kuala Lumpur city centre, Genting Highlands, Penang, Langkawi Island, East Malaysia (Sabah & Sarawak) and etc.
Some of the major achievements made by the Malaysian tourism industry include the winning of ‘Best Family Destination’ award at the Lonely Planet Travel Awards 2014 held in Mumbai last year and as well as the ‘Best Destination for Food & Drink (International)’ award for the same event in 2013.
ii. Airline facilities Three major airlines of Malaysia namely Malaysia
Airline (MAS), Air Asia and Malindo Air fly to India daily. Around 170 flights connect India and Malaysia every week. The destinations’ as follows:
a. Malaysia Airlines flies to Bengaluru, Chennai, Delhi, Hyderabad and Mumbai.
b. Air Asia flies to Bengaluru, Chennai, Delhi, Goa, Hyderabad, Kochi, Kolkata and Tiruchirapalli.
c. Malindo Air flies to Kochi, Delhi, Mumbai, Trichy, Visakhapatnam, Trivandrum and Amritsar.
iii. Visa requirements – Business and Tourist Visa Indian citizen requires visa to visit Malaysia.
Application can be submitted through our authorized travel agencies or directly to VFS Global (http://www.vfsglobal.com/malaysia/india/), the authorised visa processing agency.
Under normal condition / application, Indian passport holder will be issued Multiple Entry Visa (MEV) with a minimum period 3 months or maximum till 12 months, depends on the processing procedure and requirement. The allowance of stay is up to 30 days for each entry to Malaysia. The allowance of stay is totally the discretion of immigration officer at the entry point. Indian tourist can enter the country till the day of visa expiry date provided the passport remains valid for not less than 6 months. Malaysian visa is remaining valid if the passport remains valid (according to the passport number). Therefore if your old passport gets cancelled and you are issued with new passport, you are required to apply for Malaysian visa.
While for the Indian business travellers, nowadays Malaysia does not issue any business visa. If the trip is only for business meeting, discussion, negotiation etc., as long as the visit is not engaging any employment (paid or unpaid) you may enter the country by using tourist visa.
9. Others i. Important websites & addresses Surf http://www.matrade.gov.my/en/links
Country Focus

21 BomBay ChamBer review: January-FeBruary 2016
The event was well attended by professionals of the major tour operators and members of Travel Agents Association of India.
A well-known tourist gateway “Grotte De Han” located near Brussels. One of our touristic jewels, 3 stars in the green Michelin guide, a touristic attraction enchanting youngsters and elders: The Domain of the Caves of Han and its Natural Reserve (ranked n°1 in 2015 in Belgium).
The little village of Han-sur-Lesse at the gateway to the Ardennes and one hour by road from Brussels is home to one of the most famous caves on our continent, the Cave of Han. The Cave of Han, which is exceptional in terms of the beauty of its concretions and the immensity of its chambers and fashioned by the river Lesse that flows through it from one side to the other, has welcomed almost 20 million visitors for over 250 years.
Major Attractions: Wild Life reserves, The Playground, Prehisto Han ,Han Yeseryear, The Cave of Lorette.
This seminar was organised within the framework of a multi-sector AWEX-BIE trade delegation that visited India from 22 November to 27 November 2015. The cities covered were Delhi, Chennai and Mumbai.
A list of all the companies that participated in the mission can be found here http://www.awex.in/multi-sector-trade-mission-wallonia-november-2015.
UPCOMING EVENTS
Glass Mission February 2016 - Dates to announced shortly
Cement Mission March 2016 - Dates to announced shortly
For updates please visit our website - http://www.awex.in/
TRADE ENQUIRY Carlor Engineering is a Belgian based company looking for a distributor in India, Carlor is the market leader in electric engine and drinking trough heaters, specialises in designing and manufacturing engine block heaters. For more details you can go through http://www.carlor.com
Looking for distributors especially for products below -• Control panel for power generator such as
Woodward, Deep Sea and Comap. • Monitoring control or protection of industrial engines,
such as Murphy• Oil/diesel filtration systems, such as Parker and
Donaldson• Distributors of the above mentioned brands are also
welcome
Belgium Consulate"Grotte de han” - Seminar and B2B meeting were organised in Mumbai
at AWEX Office on 26th & 27th November 2015.
Cou
ntr
y Fo
cus

BomBay ChamBer review: January-FeBruary 2016 22
SUStaInabIlIty CommIttEE
Round table Meeting on Road Safety15 october, 2015
Rationale
More than 1.2 million people die in road traffic crashes every year. As many as 50 million people are injured or disabled by road traffic crashes every year. The road safety scenario is needs to be improved. To improve the Safety on Road, Government of India has added road safety as one of the areas where Corporate Social Responsibility
(CSR) fund can be spent and utilised. Bombay Chamber has conducted seminar on Road Safety for the industry to understand various components and how industry can address the same.
Bombay Chamber has planned a Conference on ‘Safety Excellence in City Offices and Transport on Road’ in the
Chamber Activities
HRm CommIttEE
Seminar on legal Aspects of Restrictive and negative Covenants & termination without
Enquiry for low Performance, Absenteeism and Abandonment (For Workmen & non-Workmen)
12 September, 2015
Laucy D'Souza Addressing the Participants.
Seminar on Legal Aspects of Restrictive and Negative Covenants & Termination without Enquiry for Low Performance, Absenteeism and Abandonment (For Workmen & Non-Workmen) was held on Saturday, November 28, 2015 at hotel Vivanta by Taj – President, Mumbai.
The session on Restrictive & Negative Covenants was a repeat of the session that was held on September 12, 2015 on Restrictive Covenants, as there were many requests from the participants of 12th September. Hence, this seminar was held again along with an additional subject on Termination without Enquiry.
The speaker Lancy D’souza spoke about Restrictive & Negative Covenants during the period of contract (Dual employment, business, profession) and post Employment (Non Disclosure of Confidential Information, Non Compete, Non-Solicitation). Specific bonds of service, non-disclosure of confidential information, protection of trade secrets,
non-compete, non-solicitation and garden Leave were the highlighted points of the session. Speaker mentioned The ARTICLE 19(1)g that states “All citizens shall have the right to practice any profession, or to carry on any occupation, trade or business.” The speaker advised on few clauses that could be incorporated in the contract of employment.
Lancy then covered the subject of Absenteeism by explaining the meaning and definition in legal terms. The standing order says “Habitual absence without leave or absence without leave for more than 10 consecutive days or over staying the sanctioned leave without sufficient grounds or proper or satisfactory explanation – liable to lose lien on employment.” He explained the essentials of attendance management and various acts to deal with continued ill health, continued and or recurring absenteeism, indefinite absenteeism (abandonment) and Legal Considerations (ESI & Disabilities Act). Important case laws and observations of Supreme Court were discussed.
While discussing about Termination Lancy stated about legal classifications of employees i.e. work men & non workmen and implications for the employer. He shared some basic points of termination of services without enquiry. Some case laws on termination for loss of confidence, poor performance and unsatisfactory performance were discussed. The speaker educated about the legal requirements of the local shops & establishments acts.
Each session was followed by a half an hour Q&A session and was very well appreciated by total 80 participants present. n
23 BomBay ChamBer review: January-FeBruary 2016
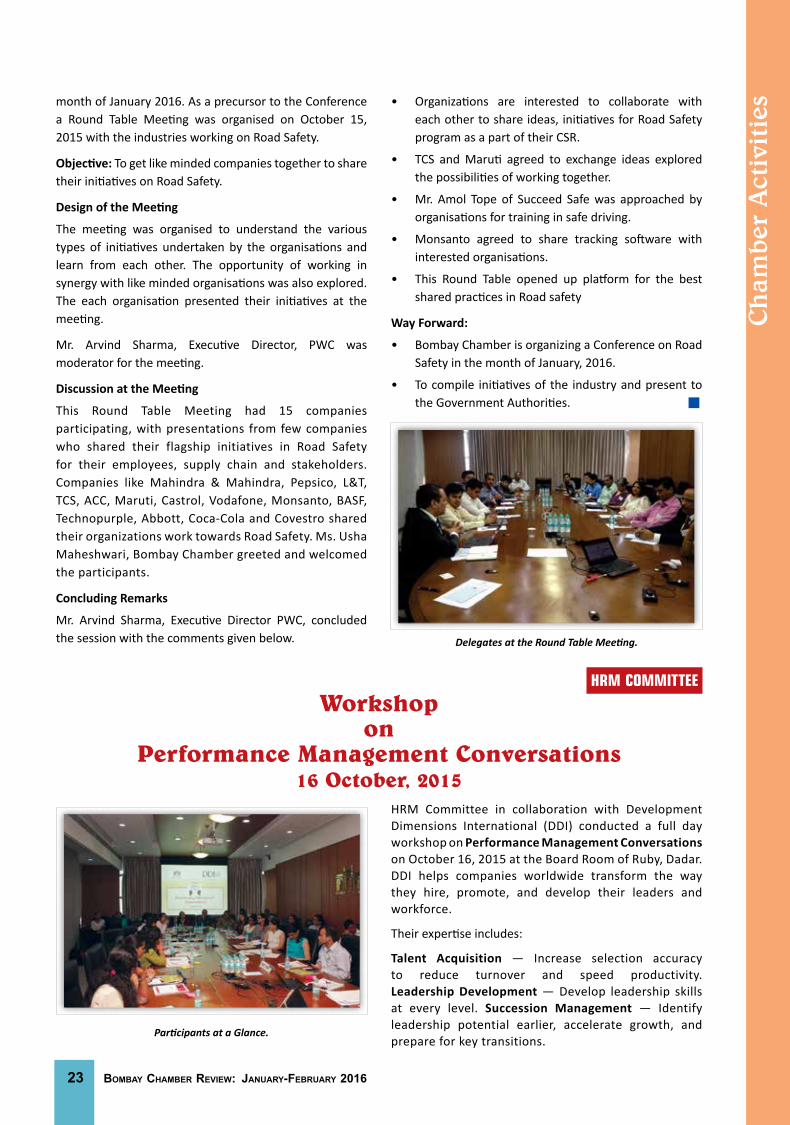
Delegates at the Round Table Meeting.
Ch
ambe
r A
ctiv
itie
s
HRm CommIttEE
Workshop on
Performance Management Conversations16 october, 2015
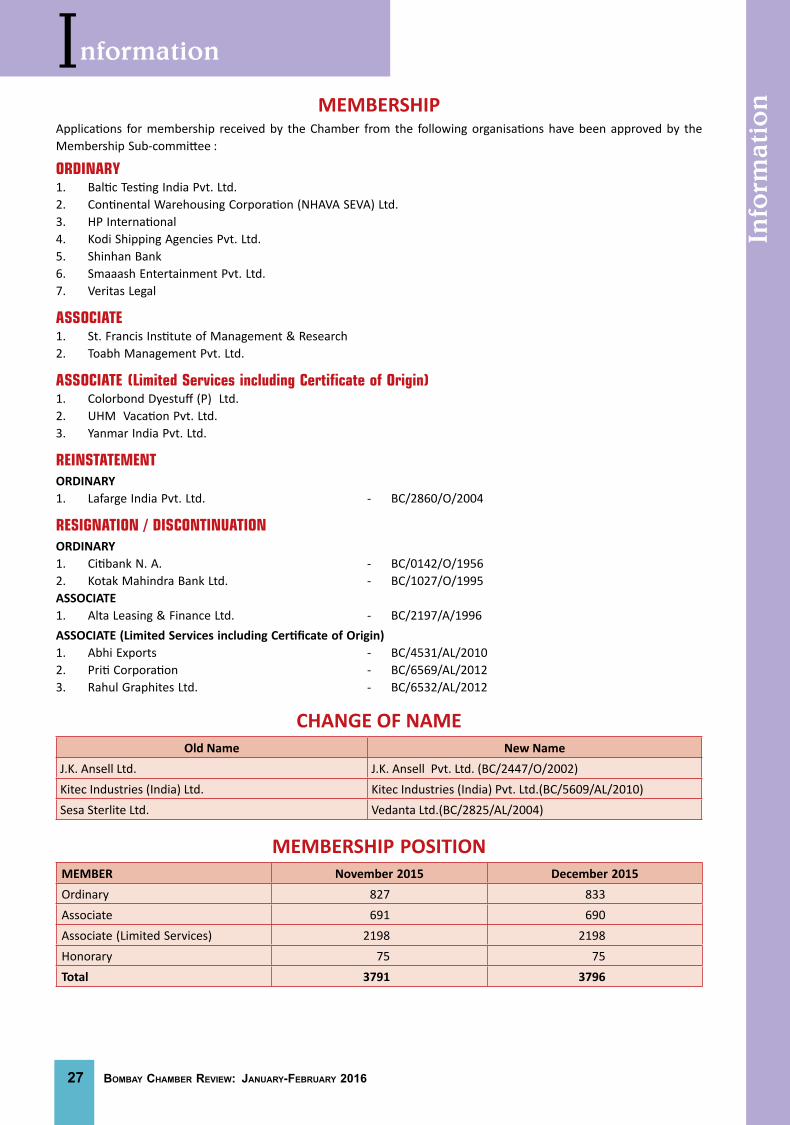
HRM Committee in collaboration with Development Dimensions International (DDI) conducted a full day workshop on Performance Management Conversations on October 16, 2015 at the Board Room of Ruby, Dadar. DDI helps companies worldwide transform the way they hire, promote, and develop their leaders and workforce.
Their expertise includes:
Talent Acquisition — Increase selection accuracy to reduce turnover and speed productivity. Leadership Development — Develop leadership skills at every level. Succession Management — Identify leadership potential earlier, accelerate growth, and prepare for key transitions.
month of January 2016. As a precursor to the Conference a Round Table Meeting was organised on October 15, 2015 with the industries working on Road Safety.
Objective: To get like minded companies together to share their initiatives on Road Safety.
Design of the Meeting
The meeting was organised to understand the various types of initiatives undertaken by the organisations and learn from each other. The opportunity of working in synergy with like minded organisations was also explored. The each organisation presented their initiatives at the meeting.
Mr. Arvind Sharma, Executive Director, PWC was moderator for the meeting.
Discussion at the Meeting
This Round Table Meeting had 15 companies participating, with presentations from few companies who shared their flagship initiatives in Road Safety for their employees, supply chain and stakeholders. Companies like Mahindra & Mahindra, Pepsico, L&T, TCS, ACC, Maruti, Castrol, Vodafone, Monsanto, BASF, Technopurple, Abbott, Coca-Cola and Covestro shared their organizations work towards Road Safety. Ms. Usha Maheshwari, Bombay Chamber greeted and welcomed the participants.
Concluding Remarks
Mr. Arvind Sharma, Executive Director PWC, concluded the session with the comments given below.
• Organizations are interested to collaborate with each other to share ideas, initiatives for Road Safety program as a part of their CSR.
• TCS and Maruti agreed to exchange ideas explored the possibilities of working together.
• Mr. Amol Tope of Succeed Safe was approached by organisations for training in safe driving.
• Monsanto agreed to share tracking software with interested organisations.
• This Round Table opened up platform for the best shared practices in Road safety
Way Forward:
• Bombay Chamber is organizing a Conference on Road Safety in the month of January, 2016.
• To compile initiatives of the industry and present to the Government Authorities. n
Participants at a Glance.

BomBay ChamBer review: January-FeBruary 2016 24
Chamber Activities
HRm CommIttEE
Workshopon
BrandMe26 november, 2015
The Bombay Chamber of Commerce and Industry jointly with Personna Edutech has conducted an Empowering Workshop to Enhance Skill Sets “BrandMe” for the benefit of the employees of member organizations.
The objective of the Workshop were how adapt to changes and situations quickly, gather relevant information and solve problems, to enhance ability to think and make quick decisions, to develop lateral thinking and creative problem solving techniques, to deal with issues by making quality choices, to analyse
information creatively and enhance creative problem solving ability.
The following topics were covered:
Discovering Self ● Creating Brand Me ● Integrity ● Amp up your Attitude ● Vision & Value Creation ● Social Presence ● Raising your standards ● Expectation of Self ● How to create networks, etc.
The workshop enabled participants to explore positive ways to improve their self-confidence, instill self-awareness and enhance their self-worth, through inner and outer confidence and communicate and handle life’s challenges. At the end of the workshop participants gained a strong attitude of purpose, forge, a deeper connection with others and also a strong sense of confidence.
The Speakers were: Ms. Sushma Gaikwad and Ms. Punya Raheja of Personna Edutech.
The feedback received was very encouraging and overwhelming. n
Speakers Reena Desai, Senior Consultant DDI and Rohit Shenoy, Strategic Accounts Manager, DDI equipped the participants on how their organizations can increase their ability to coach and provide feedback to their teams on an ongoing basis rather than twice a year conversation during performance appraisals.
This was an interactive workshop which included few skill practice sessions for participants to sharpen their newly learnt skills on driving conversations as a leader.
Workshop agenda included:
• Performance Management concepts.
• Challenges of Performance Management in organizations today.
• DDI’s point of view and best practices from few industries.
• How & why setting expectation at the onset is required.
• Ongoing Tracking and Feedback.
• Maximizing Performance Conversations - Case Study & Skill Practice.
Some feedback from participants was:
“This was just upto the mark.”
“Session was good, need more details on procedures to follow some great practices”.
“Make it a 2 day workshop and include more skill practice”. n
Participants at a Glance.

25 BomBay ChamBer review: January-FeBruary 2016
bankIng, FInanCE & EConomIC aFFaIRS CommIttEE
Financial Intellect for Business27 november, 2015
Banking, Finance & Economic Affairs, Expert Committee of Bombay Chamber of Commerce and Industry, conceptualized and organized an exclusive Practical Training Session on Financial Intellect on the core theme line ‘Balance Sheet & Components. Financial competency or acumen is a prerequisite to enter or leverage a business; besides it is counted as a fundamental requisite while taking ‘Business and Commercial decisions’.
The committee periodically organizes training sessions either in combination of two or three related subject /streams 1) Banking, 2) Finance & 3) Economic Affairs, such sessions and deliberations extend learning opportunities, it also proves beneficial to both; ‘business and individual’.
Speaker Mr. Anuraag Gupta, Chief Investment Officer at Profound Consulting who has been a part of the Wealth Management industry for more than a decade, and has been managing multiple portfolios, devotes his time imparting Financial understanding and training with a common mission to simplify the complexities of Finance and Investments from fundamentals to advance.
The session commenced with the welcome address presented by Ms. Sanskrity Sharan, Deputy Director, Bombay Chamber followed by a daylong compact session followed by Business Networking Luncheon. The speaker ensured that post session participants after attending the practical training could successfully interpret his own Financial Statements, calculate relevant ratios, do ratio analysis which is how to draw conclusion on profitability, Liquidity, efficiency and Leverage and forecast better.
During the concluding session ‘Role & Significance of a CA in an Enterprise’ the Speaker CA Rushabh Patel, Founder Rushabha Patel & Associates, Chartered Accountants briefly addressed and shared with the participants on how a Client meets his business processes with the help of CA who helps optimize profit based on a focused and utility oriented legal compliance.
The Practical Session was especially conceptualized to address on pertinent aspects of ‘Balance Sheets and Components’ and further deliberations during the session elaborated on analysis and evaluation of the business growth, accordingly how an enterprise develops its requisite business strategy, while understand cross functional synergy in business operations.
Speakers volunteered to be approached post session for further guidance and counselling. Bombay Chamber wishes to convey through this message to please contact us with your queries to the concerned official, Banking, Finance & Economic Affairs Expert Committee, at the Secretariat of Bombay Chamber of Commerce & Industry.
The exclusive session was concluded with Vote of thanks by Sanskrity Sharan, Reporting officer to the Banking, Finance & Economic Affairs Expert Committee. n
Ch
ambe
r A
ctiv
itie
s
A Glimpse of the Event.

27 BomBay ChamBer review: January-FeBruary 2016
MEMBERShIPApplications for membership received by the Chamber from the following organisations have been approved by the Membership Sub-committee :
oRDInaRy 1. Baltic Testing India Pvt. Ltd.2. Continental Warehousing Corporation (NHAVA SEVA) Ltd.3. HP International4. Kodi Shipping Agencies Pvt. Ltd.5. Shinhan Bank6. Smaaash Entertainment Pvt. Ltd.7. Veritas Legal
aSSoCIatE1. St. Francis Institute of Management & Research2. Toabh Management Pvt. Ltd.
ASSOCIATE (Limited Services including Certificate of Origin)1. Colorbond Dyestuff (P) Ltd.2. UHM Vacation Pvt. Ltd.3. Yanmar India Pvt. Ltd.
REInStatEmEnt ORDINARY1. Lafarge India Pvt. Ltd. - BC/2860/O/2004
RESIgnatIon / DISContInUatIon ORDINARY1. Citibank N. A. - BC/0142/O/19562. Kotak Mahindra Bank Ltd. - BC/1027/O/1995ASSOCIATE1. Alta Leasing & Finance Ltd. - BC/2197/A/1996ASSOCIATE (Limited Services including Certificate of Origin)1. Abhi Exports - BC/4531/AL/20102. Priti Corporation - BC/6569/AL/20123. Rahul Graphites Ltd. - BC/6532/AL/2012
ChANGE OF NAMEOld Name New Name
J.K. Ansell Ltd. J.K. Ansell Pvt. Ltd. (BC/2447/O/2002)Kitec Industries (India) Ltd. Kitec Industries (India) Pvt. Ltd.(BC/5609/AL/2010)Sesa Sterlite Ltd. Vedanta Ltd.(BC/2825/AL/2004)
MEMBERShIP POSITIONMEMBER November 2015 December 2015Ordinary 827 833Associate 691 690Associate (Limited Services) 2198 2198Honorary 75 75Total 3791 3796
Info
rmat
ion
Information


Advertisement Rates for the Bombay Chamber ReviewSize of Publication : 8.25” x 11.75” (A/4)
Size of advertisement : 7” x 11”
Advt. material requirement : Soft copy - PDF or CDR Format
Particulars Members Single Insertion (`)
Non Members Single Insertion (`)
Back Cover 25,000 30,000
Centre Spread 27,000 34,000
Inside Front / Back Covers 20,000 24,000
Special Position (Facing Content / Facing Back Inside Cover & Right Hand Position)
18,000 21,000
Full Page 15,000 18,000
Half Page 10,000 12,000
Quarter Page 7,000 9,000
For more information please contact :[email protected] / [email protected];
Tel. : 022-6130 0209 / 6120 0217
