addressing emission transfers: carbon tariffs vs. clean ... · addressing emission transfers:...
TRANSCRIPT

Addressing emission transfers: carbon tariffs vs. clean-development
financing
Marco Springmann
Department of Economics, University of Oldenburg, Ammerländer Heerstraße 114-118, D-
26129 Oldenburg, Germany
Abstract
Net emission transfers via international trade from developing to developed countries have
increased fourfold in the last two decades. As consumption demand in developed countries is
one of the main driving forces of emission transfers, several proposals have been made to
assign the responsibility for those emissions to the beneficiary, i.e. to the consumer. Such
definitions of emission responsibility extend the reach of domestic climate policies across
national borders and make carbon-border adjustments (via carbon tariffs) and clean-
development financing in the emission-exporting developing countries a natural part of
consumption-based accounts.
This study analyzes the effects of clean-development financing and carbon tariffs on
energy-intensive emission transfers. The clean-development policy describes the offsetting of
emission transfers of Annex I countries by funding abatement measures in the emission-
exporting developing countries. The policy scenarios are implemented into an energy-
economic model of the global economy. A general-equilibrium modeling approach
combining output subsidies with domestic emissions taxes is used to represent the effects of
clean-development investments in a sectorally consistent way.
Results indicate that carbon tariffs are effective in reducing emission transfers to
Annex I countries, but they are ineffective in reducing emissions in general. At the same
time, they lead to reductions in global consumption and GDP levels and an unequal
burdening of Annex I and non-Annex I countries. In contrast, the clean-development policy
does not lead to reductions in emission transfers, but its investments in clean development
significantly reduce emissions in non-Annex I countries. Those emission reductions come at
little expense to Annex I countries with only minor economic impacts. Accounting for
emission transfers and connecting them to emission-offset responsibilities could be a
promising policy that would have environmental benefits without being a burden
economically when contained to a limited number of sectors.

1. Introduction
Net emission transfers via international trade from developing to developed countries have
increased fourfold in the last two decades – from 0.4 GtCO2 in 1990 to 1.6 GtCO2 in 2008
(Peters et al., 2011). Consumption demand in developing countries is one of the main driving
forces of those emission transfers (Hertwich and Peters, 2009; Davis and Caldeira, 2010).
Therefore, several proposals have been made to assign the responsibility for those emissions
to the beneficiary, i.e. to the consumer (Rose, 1990; Proops et al., 1993; Munksgaard and
Pedersen, 2001; Ferng, 2003).
Consumption-based emission responsibilities extend the reach of domestic climate policies
across national borders. This makes carbon-border adjustments (via carbon tariffs) and clean-
development financing in emission-exporting (developing) countries a natural part of
consumption-based accounts (Peters, 2008; Peters and Hertwich, 2008). Carbon tariffs
indirectly places a cost of carbon on trading partner and thereby extends the domestic CO2-
price signal. In contrast, clean-development investments in trade-connected countries extend
domestic mitigation efforts and therefore constitute, in political terms, a "carrot" rather than a
"stick" (Dröge and Kemfert, 2005).
Past analyses paint a mixed picture of carbon tariffs and a more positive one of clean-
development investments. Carbon-tariff policies have been found to be partially successful in
reducing carbon leakage, i.e., the climate-policy-induced shift of production and/or
consumption to countries without climate policies, but to result in only modest reductions of
global emissions (e.g., Burniaux et al., 2010; Winchester et al., 2011; Böhringer et al., 2011).
On the other hand, clean-development investments, e.g., through the Clean Development
Mechanism (CDM) under the United Nations Framework Convention on Climate Change
(UNFCCC), can achieve emission reductions in developing countries more cost-effectively
than those would be achieved in developed countries (Anger et al., 2007) and, in addition, are
being associated with lower carbon-leakage rates (Alexeeva-Talebi et al., 2008).
However, past assessments especially of carbon tariffs have so far focused mainly on the
impact on carbon leakage instead of on emission transfers. While carbon leakage denotes the

climate-policy-induced shift of production and/or consumption away from countries
implementing climate policies to countries without climate policies (Felder and Rutherford,
1993), emission transfers are seen as being based on preexisting policies and socioeconomic
factors unrelated to climate policies (Peters et al., 2011) and are sometimes described as weak
carbon leakage (Rothman, 1998; Peters and Hertwich, 2008; Davis and Caldeira, 2010).
However, climate policies that affect trade patterns, such as carbon tariffs do, are likely to
have a significant impact on emission transfers, which so far was left unstudied.
This study fills this gap by analyzing the effects of carbon tariffs, trade restriction, and clean-
development investments on emission transfers. In general terms, the study is intended to
highlight the connection of international climate policies with consumption-based emissions
responsibilities and the emissions embodied in trade, and to clarify the relative environmental
and economic trade-offs between the different policy options. For that purpose, we use an
energy-economic model of the global economy. The model provides a comprehensive and
microeconomically consistent representation of price-dependent market interactions, which
allows us to analyse the policy-induced adjustment effects on regional production,
consumption, and CO2 emissions (see, e.g., Böhringer et al., 2011).
The study interprets emission transfers to developed (Annex I) countries as emission
responsibilities of those countries due to their consumption demands. The clean-
development-investment scenario is therefore constructed such that emission transfers are
offset with investments in clean development in the emission-transferring developing
countries. Instead of focusing on all emission transfers embodied in trade, this study
concentrates on the energy-intensive sector (including refined-oil production) which
constitutes a significant part of emission transfer, as well as 40% of all emissions embodied
in the production of traded products (Peters et al., 2011). The focus on the energy-intensive
sector increases the political and practical feasibility of the policies studied due to a narrow
focus with finite demands on measuring and monitoring of emission flows.1
The study is structured as follows. Section 2 describes the energy-economic model used in
the study. Section 3 details the model scenarios implemented in the model. Section 4 presents
the model results in terms of environmental and economic impacts. Section 5 concludes. 1 The same focus has been adapted in past assessments of carbon tariffs for the same reasons and for competitiveness concerns of domestic energy-intensive industries.

2. Model description
This paper utilizes an energy-economic model of the global economy. It is based on the
GTAP8inGAMS package (see Rutherford, 2010, for a description of GTAP7inGAMS) which
is extended by an explicit representation of the energy sector and a carbon market in line with
Rutherford and Paltsev (2000) and Böhringer et al. (2011). A detailed description of the basic
framework and its energy extension can be found in the references above and in Appendix 1.
In short, the model is a computable general equilibrium model based on optimizing behaviour
of economic agents. Consumers maximize welfare subject to budget constraints and
producers combine intermediate inputs and primary factors at least cost to produce output.
Energy resources are included as primary factors whose use is associated with the emission of
carbon dioxide (CO2).
The energy-economic model is calibrated to the database version 8 of the Global Trade
Analysis Project (GTAP). This database represents global production and trade for 129
countries/regions, 57 commodities and 5 primary factors for the benchmark years 2004 and
2007 (Narayanan et al., 2012). This study uses the benchmark data for the year 2007. The
data include information on bilateral trade, intermediate demand, direct and indirect taxes on
imports and exports, as well as CO2 emissions from the combustion of fossil fuels.
Elasticities of substitution across energy inputs and between energy and other inputs which
are not represented in the database are adopted from Böhringer et al. (2011).2
For this study, the full GTAP database is aggregated such that it enables a comprehensive
regional analysis of emission transfers and policies that aim at addressing those transfers. The
broad regional blocks of interest are industrialized Annex I countries who have agreed to
binding emissions reduction targets under the UNFCCC and developing non-Annex I
countries who have not agreed to binding emissions reductions but who have stated the
requirement of clean-development financing to undertake mitigation and adaptation
measures. This paper uses an aggregation that explicitly resolves 4 Annex I and 7 non-Annex
I countries/regions which are listed in Table 1.
2 The GTAP consortium states that in order to construct a consistent global data set for a given year base, significant adjustments have been made to ensure that national input-output tables match external macroeconomic, trade, protection, and energy data (Narayanan and Walmsley, 2008, Chapters 7-8). While this ensures overall consistency, it also poses limits to accuracy, in particular of sectoral national details, which the reader should be aware of.

With respect to commodities, the model's aggregation includes five energy commodities
(coal, natural gas, crude oil, refined oil, and electricity) and further differentiates between
energy-intensive goods, transport services, and a composite of all other goods. The
representation of transport services enables the calculation of total emissions embodied in
trade (and therefore of emission transfers), while the differentiation between energy-intensive
goods and all other goods allows for levying carbon tariffs only on the former as envisioned
by most current policy proposals in the EU and US (van Asselt and Brewer, 2010; Monjon
and Quirion, 2010).3
Table 1 Model regions
Annex I
EUR Europe (EU27 + EFTA) JPN Japan
USA United States RA1 Rest of Annex I
non-Annex I
CHN China and Hong Kong ASI Rest of Asia
CSM Central and South America MES The Middle East
EEU Rest of Eastern Europe AFR Africa
ROW Rest of the World
3. Model scenarios
This study assesses the effects of four policy scenarios. Those are a carbon-tariff scenario, a
general scenario with no trade in energy-intensive goods, a clean-development scenario, and
a scenario which adjusts Annex I countries’ domestic emissions targets for emission transfers.
The effect of those scenarios is assessed relative to a cap-and-trade reference (REF) scenario
in which Annex I countries reduce their CO2 emissions by 10% below their 2007-levels.4 The
emissions reductions are implemented as an overall cap, which allows for trading among 3 Energy-intensive goods include iron and steel; chemicals, including plastics and petrochemical products; non-ferrous metals, including copper and aluminium; non-metallic minerals, including cement; and refined oil products. 4 The magnitude of emission reductions is in line with emission-reduction pledges submitted to United Nations Framework Convention on Climate Change (UNFCCC) during the 15th Conference of the Parties (COP 15) in Copenhagen in 2009 (see, e.g., Levin and Bradley, 2010).

Annex I countries. This leads to the formation of a uniform carbon price in Annex I countries
and therefore eases the subsequent analysis of carbon tariffs by removing carbon price
heterogeneities.
The carbon-tariff scenario (BCA) models the implementation of carbon tariffs by Annex I
countries on energy-intensive imports (including refined oil products) from non-Annex I
countries. The tariff level is determined endogenously in proportion to the carbon content of
imports and the price of carbon in Annex I countries. The carbon content of imports consists
of all direct and indirect emissions used for producing the goods in the country of origin plus
the transportation services needed for exporting them to Annex I countries. Indirect emissions
include the carbon contents of all imported and domestic intermediate inputs. The carbon
contents are computed by a recursive diagonalization algorithm described by Böhringer et al.
(2011).
Two alternative carbon-tariff specifications are considered in the sensitivity analysis. Those
include the recycling of revenues to the exporting country (BCR) and the coupling of those
revenues to clean-development finance (BCM). Those scenarios are intended to investigate
the possibility of alleviating the detrimental impacts of carbon tariffs on developing countries
without abandoning the instrument of carbon tariffs.
The no-trade scenario (RSTR) goes beyond inhibiting trade via carbon tariffs and
implements more general trade restriction on energy-intensive goods. The restrictions are
implemented as import tariffs of 1000% in both the Annex I countries and the non-Annex I
countries. The Armington trade specification does not allow for a complete restriction of
trade (Balistreri and Rutherford, 2011), so that this scenario can be considered illustrative in
character. While this scenario illustrates the economic effects of inhibiting trade, it can also
be seen as highlighting the gains of trade in energy-intensive goods as a counter-negative.
The clean-development scenario (CDF) allows Annex I countries to offset their consumption-
based emissions responsibilities vis-à-vis non-Annex I countries by financing clean-
development projects in those countries. We use a new, microeconomically consistent
modelling framework to represent clean-development investments in non-Annex I countries
as a combination of sectoral output subsidies and emissions taxes (Böhringer et al., 2013).
The emissions taxes induce the adoption of more energy-efficient and more expensive

production technologies, while the output subsidies compensate the representative firm for
the increase in production costs. We focus on clean-development investments in the
electricity sector, which is in line with the sectoral distribution of projects under the Clean
Development Mechanism (CDM) of the Kyoto Protocol (Gillenwater and Seres, 2011). The
magnitude of clean-development investments is iterated until the bilateral net emissions
embodied in energy-intensive imports to each Annex I countries are offset.
However, two modifications are considered for small-island states (ROW) and the Middle
East (MES). Due to their geographical location, small-island states export a proportion of
embodied emissions which amounts to about three quarters of their territorial emissions.
There are no sufficient abatement options available to offset such a degree of emission
transfers. We therefore cap clean-development investments for small-island states to its
minimum value in all CDF scenarios. This has no significant effect on the results as the
emissions from small-island states are negligible. For the Middle East, substitution
possibilities to cleaner electricity production are limited due to the region’s high reliance on
fossil fuels. The sensitivity analysis therefore considers constraining the emission offsets
from the Middle East to half of its emission transfers.
Finally, the domestic-adjustment scenario (DOM) adjusts Annex I countries’ emissions-
reduction targets for energy-intensive emission transfers from non-Annex I countries. The
emissions embodied in net imports from a specific non-Annex country are subtracted from
the importing Annex I country’s emissions target. This results in more stringent targets for
countries with net imports of embodied emissions. The embodied emissions are netted
between the trading partners in Annex I and non-Annex I countries, but not across non-Annex
I countries, i.e., net bilateral imports of embodied emissions from one non-Annex I country
are not offset by net bilateral exports of embodied emissions to another non-Annex I country.
4. Results
The following presents the policy scenarios’ environmental and economic impacts. This
section first shows the emission transfers in the reference scenario as those serve as inputs in
the other policy scenarios considered. Then the policy scenarios’ effects on those emission

transfers, but also on carbon leakage and regional emissions are assessed. Finally, the
economic impacts are analyzed in terms of changes in GDP.
4.1. Emissions transfers
Figure 1. Emission transfers via trade in energy-intensive goods between Annex I
countries and non-Annex I countries. Regional abbreviations are listed in Table 1.
The net emission transfers from non-Annex I to Annex I countries amount to 1640 MtCO2 in
the reference cap-and-trade scenario,5 295 MtCO2 (18%) of which are embodied in the trade
of energy-intensive goods.6 Figure 1 details the regional distribution of the emission transfers
embodied in energy-intensive goods. Europe imports a large portion of embodied EIT
emissions (65%) which primarily stem from China and other Asian countries. The other large
importers of embodied EIT emissions, USA (29%) and Japan (8%), show similar tendencies,
but also export a portion of embodied EIT emissions to non-Annex I countries in Central and
South America and Asia. The aggregate of other Annex I countries (Russia, Ukraine,
Australia, New Zealand, among others) export slightly more embodied emissions to non-
Annex I countries than they import. Taking into account the gross flows of embodied
emissions (i.e., without netting positive and negative contributions across countries) increases
5 The benchmark values are 1513 MtCO2 and 228 MtCO2 for emissions-intensive sectors, respectively. Those agree with Peters et al. (2011). 6 Other significant emission transfers are embodied in crude-oil products and transport services with about 100 MtCO2 (6%) each. However, most emission transfers (1100 MtCO2, 66%) are embodied in the aggregate of all other goods.
-50.00
0.00
50.00
100.00
150.00
200.00
EUR USA JPN RA1
Em
issi
on tr
ansf
ers (
MtC
O2)
ROW
CSM
MES
EEU
AFR
ASI
CHN

the EIT emission transfers by 17% to 346 MtCO2. Since the focus in this study is on the
bilateral emission responsibilities of Annex I countries vis-à-vis specific non-Annex I
countries, it will be those gross flows that are focused on in the following.
4.2. Environmental impacts
Figure 2 shows the change in emission transfers in the four model scenarios. The carbon-
tariff scenario (BCA) reduces emission transfers to Annex I countries by 14% and the no-
trade scenario (RSTR) by 93%. In contrast, emission transfers increase (by 3%) in the
domestic-adjustment scenario (DOM), and they remain unchanged in the clean-development
scenario (CDF) which instead offsets those emissions.
Figure 2. Change in emission transfers relative to the cap-and-trade reference
scenario. Emission transfers in the reference scenario are displayed in Figure 1.
Table 2 lists the effects on carbon leakage and CO2 emissions for the four model scenarios.
The clean-development scenario and the domestic-adjustment scenario result in similar global
emissions reductions of about 1%. Those are achieved through emissions reductions in
Annex I countries in the domestic-adjustment scenario, and through sponsored emissions
reductions in non-Annex I countries in the clean-development scenario. Carbon leakage is
therefore reduced significantly only in the clean-development scenario. The carbon-tariff
scenario and the no-trade scenario result in negligible emissions reductions of 0.1%. Thus,
-300
-250
-200
-150
-100
-50
0
50
BCA CAP CDF rstr
Cha
nge
in e
miss
ion
tran
sfer
s (M
tCO
2)

while carbon tariffs and full trade restrictions of energy-intensive goods reduce emission
transfers to Annex I countries, they do not address the actual concern of emission reductions.7
Table 2. Change in regional emissions and carbon leakage. The basis for comparison
is the reference scenario in which Annex I countries reduce their emissions by 10%
with respect to their 2007-levels, while non-Annex I countries increase their
emissions by 1.47%; the associated carbon leakage to non-Annex I counties is 13.3%.
Item Model scenarios
BCA DOM CDF RSTR
Carbon leakage (%) -1.83 -0.32 -25.51 -0.94
Annex I emissions (%) 0.00 -2.50 0.00 0.00
Non-Annex I emissions (%) -0.20 0.32 -2.81 -0.10
Global emissions (%) -0.10 -1.16 -1.34 -0.05
4.3. Economic impacts
Figure 3 details the economic effects of the four model scenarios. It shows the changes in
GDP relative to the cap-and-trade reference scenario. Changes in the equivalent variation of
income show similar qualitative trends and are listed in Table A3 in the appendix. Because
the benefits associated with lower CO2 emissions are not monetized in this study, the focus
here lays solely on the economic costs.
The carbon-tariff scenario is associated with an unequal distribution of economic burden.
GDP in the tariff-implementing Annex I countries increases slightly, in particular due to the
influx of tariff revenues which amount to USD 7.8 billion in total. On the other hand, non-
Annex I countries experience significant GDP losses due to the new tariff barrier. Recycling
the tariff revenues can alleviate part of those losses, but a negative net impact remains.
Global GDP losses increase, because the losses in non-Annex I countries are up to an order of
magnitude larger than the gains in Annex I countries.
7 Instead, the production of all other goods increases in the carbon-tariff scenario, and domestic production of energy-intensive goods replaces imports in the no-trade scenario, see Tables A1 and A2 in the appendix.

Figure 2. Economic impacts in terms of changes in gross domestic product (GDP).
The basis for comparison is the reference scenario which implements a cap-and-trade
system in Annex I countries (see Table A9 for the GDP impacts of the reference
scenario).
In the domestic-adjustment scenario all additional emissions reductions are shouldered by
Annex I countries. As a result, the domestic CO2 price increases by 33% to 27 USD/tCO2
from 21 USD/tCO2 in the reference scenario. Higher CO2 prices in Annex I countries
increase domestic prices and reduces consumption. This also affects non-Annex I countries
through increased export prices and reduced import demand, especially of carbon-intensive
fossil fuels (see Tables A4 and A5 in the appendix). Consequently, both Annex I and non-
Annex I countries experience GDP losses and global GDP decreases below the reference
level.
The clean-development scenario causes no significant changes in regional and global GDP
levels and is therefore associated with the least negative GDP impacts of the scenarios
considered. Its impact on non-Annex I countries is slightly positive, while its impact on
Annex I countries is slightly negative. Table 3 lists the scenario’s clean-development
investments. Total investments amount to USD 2 billion. In line with the distribution of
emission transfers, Europe is the largest investor, followed by the USA and Japan. The
Middle East receives more than half of all investments due to the high abatement costs in its
electricity sector. Other significant investments go to China, and countries in Eastern Europe
and Central and South America. Constraining the emissions offsets from the Middle East to
-1.2
-1.0
-0.8
-0.6
-0.4
-0.2
0.0
0.2
BCA DOM CDF RSTRC
hang
e in
GD
P (%
)
AN1
NA1
Global

half of its emission transfers reduces the total clean-development investments to USD 1.2
billion (see Table A6 in the appendix).
The economic effects of the no-trade scenario contrast with those of the other scenarios.
Implementing mutual trade restrictions on energy-intensive goods leads to high welfare
losses in all regions. Global GDP losses are 10 to 20 times larger than in the domestic-
adjustment and carbon-tariff scenarios, respectively.
Table 3. Clean-development investments needed to offset emission transfers
embodied in the energy-intensive goods imported by Annex I countries from non-
Annex I countries (in million USD). Clean-development investments are capped for
small-island states (ROW) due to physical constraints on abatement.
non-Annex
I regions
Annex I regions
EUR USA JPN RA1 Total
MES 565 237 367 0 1,170
CHN 183 133 29 31 376
EEU 158 37 16 19 230
CSM 104 0 0 0 104
AFR 49 22 12 1 84
ASI 25 13 2 1 42
ROW 11 5 2 3 21
Total 1,094 447 429 56 2,026
4.4. Sensitivity analysis
The sensitivity analysis extends the main scenarios’ analysis in two ways. First, it considers
two alternative carbon-tariff specifications, one in which the carbon-tariff revenues are
recycled back to the exporting non-Annex I countries as lump-sum transfers that are used to
maximize consumption (BCR); and one in which carbon-tariff revenues are recycled back as
clean-development investments (BCM) (see Springmann, 2013, for an analysis of this policy
with a simpler method). Second, the sensitivity analysis extends the main scenarios’ focus on
emission transfers in the EIT sectors to the total emission transfers summed over all sectors.

Table 4 lists the effects of the alternative scenario specifications. The BCR scenario leads to
similar global welfare impacts as the standard BCA scenario, but it alleviates part of the
negative GDP impacts from non-Annex I countries. While consumption levels may increase
above their reference levels in non-Annex I countries, their GDP levels are still 24% below
the reference values. The BCM scenario yields less relative GDP and consumption gains for
non-Annex I countries than the BCR scenario. However, as a result of using carbon-tariff
revenues for clean-development investments (about USD 7.8 billion), it increases global
emissions reductions from 0.1% in the BCA scenario to 3.4%. Thus, the difference in
emissions levels complicates a strict economic welfare comparison (as the benefits of
emissions abatement are not valued in this study).
Table 4. Economic and environmental impacts for alternative carbon-tariff scenarios
(BCR, BCM) and for scenario with full sectoral coverage of emission transfers (_f).
The basis for comparison is the reference scenario which implements a cap-and-trade
system in Annex I countries.8
Item Region Model scenarios
BCA BCR BCM BCA_f CAP_f CDF_f
GDP (%)
AN1 0.018 -0.013 -0.019 0.076 -0.311 -0.181
NA1 -0.213 -0.119 -0.155 -0.789 -0.817 0.341
Global -0.043 -0.041 -0.055 -0.154 -0.446 -0.042
Emissions (%)
AN1 0.000 0.000 0.000 0.000 -12.393 0.000
NA1 -0.202 -0.176 -7.083 -0.268 1.662 -13.464
Global -0.096 -0.084 -3.368 -0.127 -5.711 -6.401
Extending the policies’ sectoral coverage from the EIT sectors to all sectors has the following
impacts. First, the higher tariff levels in the carbon-tariff scenarios lead to greater GDP losses
in non-Annex I countries and, with the exception of the standard carbon-tariff scenario with
full coverage, also to greater GDP losses in Annex I countries. Global GDP losses increase
by 41-65% compared to the BCA scenario with EIT coverage. Second, emissions reductions
8 The offsets from the Middle East are constrained to half of its emission transfers as substitution possibilities to cleaner electricity production are limited due to the region’s high reliance on fossil fuels. Clean-development investments in small-island states (ROW) are capped at their minimum value due to physical constraints on abatement (see Section 3).

roughly double in the BCM, CAP, and CDF scenarios with full sectoral coverage. GDP
losses in the full CAP scenario increase threefold for Annex I countries and twofold for non-
Annex I countries. In the full CDF scenario, GDP losses in Annex I countries increase
twofold, but they decrease in non-Annex I countries. Global GDP losses remain lower in the
full CDF scenario than in the BCA and CAP scenarios with EIT coverage. In sum,
broadening the policy’s coverage of emission transfers from the energy-intensive ones to all
emission transfers preserves the relative impacts vis-à-vis the alternative policy options.
Clean-development investments increase to about USD 50 billion (see Table A7 in the
appendix).
While the numerical results presented above hold strictly only for a specific set of parameters,
a comprehensive sensitivity analysis indicates that the relative and directional effects of the
model scenarios considered are robust with respect to changes in key model parameters, such
as the fossil-fuel supply elasticities, trade elasticities, and emissions-reduction targets (see
Tables A8-A14 in the appendix).
5. Conclusion
This study focused on emission transfers embodied in the trade of energy-intensive goods
between non-Annex I and Annex I countries. It interpreted the emission transfers to Annex I
countries as consumption responsibilities and therefore assessed four policy options for
Annex I countries that could address those transfers. Those were a standard carbon-tariff
policy in which Annex-I countries implement carbon tariffs on energy-intensive imports from
non-Annex I countries; a domestic-adjustment policy in which Annex I countries increase the
stringency of their emissions reduction targets in proportion to the net imports of embodied
emissions from non-Annex I countries; a clean-development policy in which Annex I
countries offset the emission transfers from non-Annex I countries by investing in clean-
development projects in those countries; and, finally, a no-trade policy which completely
restricts the trade in energy-intensive goods between Annex I and non-Annex I countries. An
energy-economic model of the global economy formed the basis for the analysis.
While both the carbon-tariff and the no-trade policies are effective in reducing emission

transfers to Annex I countries, they are ineffective in reducing emissions in general. At the
same time, they lead to reductions in global consumption and GDP levels and an unequal
burdening of Annex I and non-Annex I countries – the carbon-tariff policies place a
considerable economic burden on non-Annex I countries, while the no-trade policy has a
negative economic effect for both Annex I and non-Annex I countries. Similarly, adjusting
domestic emissions targets for emission transfers could entail GDP losses for both the
adjusting and the non-adjusting regions. In contrast, the clean-development policy does not
lead to reductions in emission transfers, but its investments in clean development
significantly reduce emissions in non-Annex I countries. Those emission reductions come at
little expense to Annex I countries and therefore have only minor economic impacts.
These results suggest that addressing emission responsibilities through trade restrictions (as
in the carbon-tariff and no-trade scenarios) is ill-focused and could lead to potentially
significant economic losses for both Annex I and non-Annex I countries and even to higher
emissions in some cases. The increase in emission transfers from non-Annex I to Annex I
countries as found by Peters et al. (2011) is therefore not necessarily a reason for concern, but
a sign for an increased integration of the global economy. Reducing emission transfers would
therefore head in the wrong way. Instead, a more positive approach of accounting for
emission transfers and connecting them to emission-offset responsibilities (as exemplified by
the clean-development scenario) could be a promising policy that would have environmental
benefits without being a burden economically (at least not when focusing on the energy-
intensive sectors).
The political institutions for such offsets already exist in the form of the Clean Development
Mechanism (CDM) under the UNFCCC. However, while the CDM offsets national emission
responsibilities, an offset scheme based on consumption responsibilities as contemplated here
would be connected to offsets of emission transfers or emissions embodied in trade to Annex-
I countries. Unlike for the CDM, there would be a clear definition of emission reductions that
would need to be achieved and those emission reductions would not be bound to projects, but
could be also be achieved through sectoral approaches or National Appropriate Mitigation
Actions (NAMAs) if financing contributions can be separated.9
9 For such a policy, the need for accurately measuring and monitoring of emissions embodied in trade becomes an important aspect which would need to be improved. However, the academic field active in estimating
However, there are several critical issues with connecting clean-development financing to
emission transfers. First, trade-active countries, such as China, would receive a high
proportion of financing, while least-developed countries with low export volumes would
receive very little. Second, some non-Annex I countries could be incentivised to increase the
carbon content of their traded goods for receiving more investments. The first issue could be
addressed by channelling part of the investments through a global climate fund, such as the
Green Climate Fund established by the Cancun Agreements, and the second could be dealt
with by agreeing on specific reference years or periods.
While there may be further issues with broadening the policy from the emissions embodied in
energy-intensive goods to all goods, such a broadening could also present an opportunity as
the consumption and offset responsibilities of Annex I countries may provide another
rationale for climate financing of the order currently discussed – in the Copenhagen Accord
(2009), Annex I countries have pledges to mobilize USD 100 billion of annual climate
finance for non-Annex I countries by 2020, the exact modalities of which remain to be
determined.
Acknowledgements I thank Christoph Böhringer and Thomas F. Rutherford for their methodological input. The
study was supported by a doctoral grant from the AXA Research Fund which is gratefully
acknowledged.
References
Armington, P.S., 1969, A Theory of Demand for Products Distinguished by Place of
Production, International Monetary Fund Staff Papers 16(1), 159-176.
Alexeeva-Talebi, V., Anger, N. and Löschel, A., 2010, Alleviating Adverse Implications of
emissions embodied in trade via multi-regional input-output analysis has been growing rapidly (see, e.g., Wiedmann et al., 2011), so that further improvements seem likely.

EU Climate Policy on Competitiveness: The Case for Border Tax Adjustments or the Clean
Development Mechanism?, ZEW Discussion Paper No. 08-095.
Anger, N., Böhringer, C. and Moslener, U., 2007, Macroeconomic impacts of the CDM: the
role of investment barriers and regulations, Climate Policy 7, 500-517.
Van Asselt, H. and Brewer, T., 2010, Addressing competitiveness and leakage concerns in
climate policy: An analysis of border adjustment measures in the US and the EU, Energy
Policy 38(1), 42–51.
Balistreri, E.J., Rutherford, T.F., 2011. Computing general equilibrium theories of
monopolistic competition and heterogeneous firms. Handbook of Computable General
Equilibrium Modeling.
Böhringer, C., Carbone, J.C. and Rutherford, T.F., 2011, Embodied Carbon Tariffs, NBER
Working Paper 17376.
Böhringer, C., Rutherford, T. F., and Springmann, M., 2013, Clean-development
investments: an incentive-compatible CGE modelling framework. Oldenburg Discussion
Papers in Economics V-354-13, University of Oldenburg.
Burniaux, J.M., Chateau, J. and Duval, R., 2010, Is there a Case for Carbon-Based Border
Tax Adjustment?: An Applied General Equilibrium Analysis, OECD, Paris, France.
Davis, S.J., Caldeira, K., 2010, Consumption-based accounting of CO2 emissions,
Proceedings of the National Academy of Sciences of the USA 107, 5687–5692.
Dröge, S. and Kemfert, C., 2005, Trade Policy to Control Climate Change: Does the Stick
Beat the Carrot?, Vierteljahrshefte zur Wirtschaftsforschung 74(2), 235–248.
Felder, S. and Rutherford, T. F., 1993, Unilateral CO2 reductions and carbon leakage: the
consequences of international trade in oil and basic materials. Journal of Environmental
Economics and Management 25, 162-176.

Ferng, J.J., 2001, Using composition of land multiplier to estimate ecological footprints
associated with production activity, Ecological Economics 37, 159-172.
Hertwich, E.G., Peters, G.P., 2009, Carbon footprint of nations: a global, trade-linked
analysis, Environmental Science and Technology 43, 6414–6420.
Levin, K. and Bradley, R., 2010, Comparability of Annex I emission reduction pledges,
World Resources Institute Working Paper.
Monjon, S. and Quirion, P., 2010, How to design a border adjustment for the European Union
Emissions Trading System?, Energy Policy 38(9), 5199–5207.
Munksgaard, J., Pedersen, K.A., 2001, CO2 accounts for open economies: producer or
consumer responsibility, Energy Policy 29, 327-334.
Narayanan, B., Aguiar, A., and McDougall, R. (eds.), 2012, Global Trade, Assistance, and
Production: The GTAP 8 Data Base. Center for Global Trade Analysis, Purdue University.
Peters, G.P., 2008. From production-based to consumption-based national emissions
inventories, Ecological Economics 65, 13-23.
Peters, G.P. and Hertwich, E.G., 2008, CO2 embodied in international trade with implications
for global climate policy. Environmental Science & Technology 42(5), 1401–1407.
Peters, G.P., Minx, J.C., Weber, C.L., and Edenhofer, O., 2011, Growth in emission transfers
via international trade from 1990 to 2008, Proceedings of the National Academy of Sciences
108(21), 8903-8.
Proops, J.L.R., Faber, M., Wagenhals, G., 1993, Reducing CO2 Emissions: A Comparative
Input-output-Study for Germany and the UK, Springer, New York.
Rose, A., 1990. Reducing conflict in global warming policy: the potential of equity as a
unifying principle, Energy Policy 18, 927-935.

Rothman, D.S., 1998, Environmental Kuznets Curves—Real progress or passing the buck? A
case for consumption-based approaches, Ecological Economics 25, 177–194.
Rutherford, T.F. and Paltsev, S.V., 2000, GTAP-Energy in GAMS: The dataset and static
model, Working Paper 00-02, University of Colorado at Boulder.
Springmann, M., 2013, Carbon tariffs for financing clean development, Climate Policy 13,
20–42.
Winchester, N., Paltsev, S. and Reilly, J.M., 2011, Will Border Carbon Adjustments Work?,
The BE Journal of Economic Analysis & Policy 11(1), Article 7.
Wiedmann, T., Wilting, H.C., Lenzen, M., Lutter, S. and Palm, V., 2011, Quo Vadis MRIO?
Methodological, data and institutional requirenments for multi-region input-output analysis,
Ecological Economics 70, 1937-1945.
Appendix
A.1. CGE model description
The basic energy-economic model includes five energy goods (crude oil (CRU), refined oil
(OIL), coal (COL), gas (GAS), and electricity (ELE)) and three aggregated commodities
(energy-intensive goods (EIT), transport services (TRN), all other goods (AOG)). Those are
produced with inputs of intermediate goods and primary factors (skilled labour, unskilled
labour, capital, resources, and land). Secondary energy inputs (refined oil, electricity) are
produced with constant returns to scale, whereas primary energy goods (crude oil, natural
gas, and coal) exhibit decreasing returns to scale with resource input. Capital and labour are
intersectorally mobile, but crude oil, natural gas and coal resources are sector-specific.
The production of energy and other goods is described by nested constant-elasticity-of-
substitution (CES) cost functions which characterize substitution possibilities between inputs
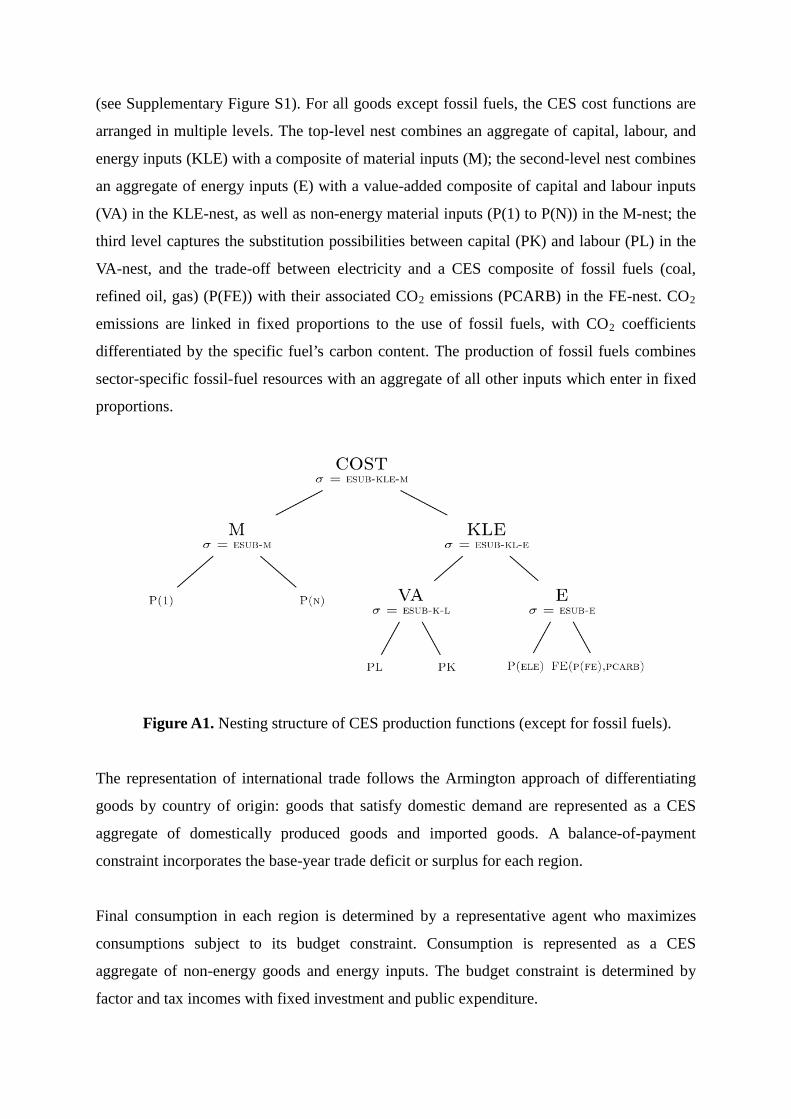
(see Supplementary Figure S1). For all goods except fossil fuels, the CES cost functions are
arranged in multiple levels. The top-level nest combines an aggregate of capital, labour, and
energy inputs (KLE) with a composite of material inputs (M); the second-level nest combines
an aggregate of energy inputs (E) with a value-added composite of capital and labour inputs
(VA) in the KLE-nest, as well as non-energy material inputs (P(1) to P(N)) in the M-nest; the
third level captures the substitution possibilities between capital (PK) and labour (PL) in the
VA-nest, and the trade-off between electricity and a CES composite of fossil fuels (coal,
refined oil, gas) (P(FE)) with their associated CO2 emissions (PCARB) in the FE-nest. CO2
emissions are linked in fixed proportions to the use of fossil fuels, with CO2 coefficients
differentiated by the specific fuel’s carbon content. The production of fossil fuels combines
sector-specific fossil-fuel resources with an aggregate of all other inputs which enter in fixed
proportions.
Figure A1. Nesting structure of CES production functions (except for fossil fuels).
The representation of international trade follows the Armington approach of differentiating
goods by country of origin: goods that satisfy domestic demand are represented as a CES
aggregate of domestically produced goods and imported goods. A balance-of-payment
constraint incorporates the base-year trade deficit or surplus for each region.
Final consumption in each region is determined by a representative agent who maximizes
consumptions subject to its budget constraint. Consumption is represented as a CES
aggregate of non-energy goods and energy inputs. The budget constraint is determined by
factor and tax incomes with fixed investment and public expenditure.

A.2. Additional model results
Table A1. Changes in the exports, imports, and output of the aggregate of all other
goods (AOG) in Annex I (AN1) and non-Annex I (NA1) countries and globally for
the four model scenarios. The carbon-tariff scenario is denoted by BCA, the domestic-
adjustment scenario by DOM, the clean-development scenario by CDF, and the no-
trade scenario by RSTR. The basis for comparison is the reference scenario which
implements a cap-and-trade system in Annex I countries.
Item Region Model scenarios
BCA DOM CDF RSTR
AOG exports (%)
AN1 -0.433 -0.052 0.078 1.511
NA1 0.619 -0.113 -0.105 -2.664
Total 0.036 -0.079 -0.004 -0.351
AOG imports (%)
AN1 0.286 -0.077 -0.051 -0.908
NA1 -0.347 -0.083 0.069 0.501
Total 0.036 -0.079 -0.004 -0.351
AOG output (%)
AN1 -0.033 -0.027 0.003 -0.151
NA1 0.078 -0.024 -0.018 -1.347
Total -0.004 -0.026 -0.003 -0.467

Table A2. Changes in the exports, imports, and output of energy-intensive goods
(EIT) in Annex I (AN1) and non-Annex I (NA1) countries and globally for the four
model scenarios. The carbon-tariff scenario is denoted by BCA, the domestic-
adjustment scenario by DOM, the clean-development scenario by CDF, and the no-
trade scenario by RSTR. The basis for comparison is the reference scenario which
implements a cap-and-trade system in Annex I countries.
Item Region Model scenarios
BCA DOM CDF RSTR
EIT exports
(%)
AN1 0.573 -0.884 -0.031 -30.666
NA1 -4.788 1.046 0.046 -24.300
Total -1.432 -0.163 -0.002 -28.285
EIT imports
(%)
AN1 -2.041 0.074 0.014 -23.657
NA1 -0.707 -0.444 -0.022 -33.788
Total -1.432 -0.163 -0.002 -28.285
EIT output (%)
AN1 0.551 -0.343 -0.014 -1.620
NA1 -0.863 0.351 0.017 7.269
Total -0.026 -0.060 -0.001 2.004
Table A3. Changes in the equivalent variation of income (EV) in Annex I (AN1) and
non-Annex I (NA1) countries and globally for the four model scenarios. The carbon-
tariff scenario is denoted by BCA, the domestic-adjustment scenario by DOM, the
clean-development scenario by CDF, and the no-trade scenario by RSTR. The basis
for comparison is the reference scenario which implements a cap-and-trade system in
Annex I countries.
Item Region Model scenarios
BCA DOM CDF RSTR
Change in EV (%) AN1 0.031 -0.046 -0.013 -0.614

NA1 -0.109 -0.082 0.007 -2.503
Global -0.002 -0.054 -0.008 -1.058
Table A4. Changes in the prices of energy-intensive (EIT) goods in Annex I (AN1)
and non-Annex I (NA1) countries and globally for the four model scenarios. The
carbon-tariff scenario is denoted by BCA, the domestic-adjustment scenario by DOM,
the clean-development scenario by CDF, and the no-trade scenario by RSTR. The
basis for comparison is the reference scenario which implements a cap-and-trade
system in Annex I countries.
Item Region Model scenarios
BCA DOM CDF RSTR
Change in EIT
prices (%)
AN1 0.067 0.194 -0.009 0.824
NA1 -0.198 -0.153 -0.008 1.900
Global -0.102 -0.027 -0.008 1.508
Table A5. Changes in fossil-fuel imports (crude oil, coal, gas) in Annex I (AN1) and
non-Annex I (NA1) countries and globally for the four model scenarios. The carbon-
tariff scenario is denoted by BCA, the domestic-adjustment scenario by DOM, the
clean-development scenario by CDF, and the no-trade scenario by RSTR. The basis
for comparison is the reference scenario which implements a cap-and-trade system in
Annex I countries.
Item Region Model scenarios
BCA DOM CDF RSTR
Imports of crude oil
(%)
AN1 0.538 -0.859 -0.134 2.935
NA1 -0.561 0.475 -0.053 -1.586
Global 0.155 -0.394 -0.106 1.359
Imports of coal (%)
AN1 0.155 -3.689 1.091 2.053
NA1 -0.697 2.371 -8.122 1.410
Global -0.124 -1.705 -1.925 1.843

Imports of gas (%)
AN1 0.483 -0.503 0.837 -1.208
NA1 -1.107 0.934 -0.986 6.202
Global 0.274 -0.314 0.597 -0.233
Table A6. Clean-development investments needed to offset emission transfers
embodied in the energy-intensive goods imported by Annex I countries from non-
Annex I countries (in million USD), with offsets from the Middle East constrained to
half of its energy-intensive emission transfers. Clean-development investments are
capped for small-island states (ROW) due to physical constraints on abatement (see
Section 3).
non-Annex I
regions
Annex I regions
EUR USA JPN RA1 Total
MES 141 59 92 0 292
CHN 183 133 29 31 376
EEU 158 37 16 19 230
CSM 104 0 0 0 104
AFR 49 22 12 1 84
ASI 25 13 2 1 42
ROW 11 5 2 3 21
Total 670 269 153 56 1,148

Table A7. Clean-development investments needed to offset emission transfers
embodied in all goods imported by Annex I countries from non-Annex I countries (in
million USD). The offsets from the Middle East are constrained to half of its emission
transfers as substitution possibilities to cleaner electricity production are limited due
to the region’s high reliance on fossil fuels. Clean-development investments in small-
island states (ROW) are capped at their minimum value due to physical constraints on
abatement (see Section 3).
non-Annex
I regions
Annex I regions
EUR USA JPN RA1 Total
MES 2,220 931 1,443 0 4,593
CHN 7,613 5,552 1,205 1,289 15,659
EEU 11,639 3,246 1,224 3,934 20,044
CSM 2,432 2,716 165 115 5,428
AFR 1,281 584 157 66 2,088
ASI 2,650 1,388 196 150 4,385
ROW 194 109 54 60 418
Total 28,027 14,526 4,445 5,615 52,614

Table A8. Changes in the environmental and economic impacts in the reference and
policy scenarios with respect to the no-policy baseline. The table serves as basis for
comparison for the sensitivity analyses presented in the Tables A9-A14.
Item Region Model scenarios
REF BCA DOM CDF RSTR
EIT emission transfers (%) AN1 29.353 11.407 33.449 29.636 -90.478
Carbon leakage (%) NA1 13.287 11.457 12.970 -12.223 12.343
Emissions (%)
AN1 -10.000 -10.000 -12.501 -10.000 -10.000
NA1 1.466 1.264 1.789 -1.349 1.362
Global -4.549 -4.645 -5.707 -5.887 -4.598
Change in GDP (%)
AN1 -0.092 -0.074 -0.134 -0.104 -0.928
NA1 -0.488 -0.701 -0.626 -0.469 -1.585
Global -0.197 -0.241 -0.265 -0.201 -1.103
Change in EV (%)
AN1 -0.065 -0.034 -0.111 -0.078 -0.679
NA1 -0.292 -0.402 -0.375 -0.285 -2.796
Global -0.119 -0.121 -0.173 -0.127 -1.177

Table A9. Changes in the environmental and economic impacts of the reference and
policy scenarios with respect to the no-policy baseline, with Annex I countries’
emissions-reduction target halved from 10% below 2007-levels to 5%.
Item Region Model scenarios
REF BCA DOM CDF RSTR
EIT emission transfers (%) AN1 22.248 14.202 25.568 22.562 -90.389
Carbon leakage (%) NA1 14.191 12.579 13.779 -34.967 13.586
Emissions (%)
AN1 -5.000 -5.000 -7.423 -5.000 -5.000
NA1 0.783 0.694 1.129 -1.929 0.749
Global -2.251 -2.293 -3.357 -3.540 -2.266
Change in GDP (%)
AN1 -0.024 -0.016 -0.046 -0.034 -0.880
NA1 -0.230 -0.325 -0.347 -0.213 -1.255
Global -0.079 -0.098 -0.126 -0.081 -0.980
Change in EV (%)
AN1 -0.011 0.003 -0.032 -0.023 -0.643
NA1 -0.141 -0.190 -0.213 -0.137 -2.652
Global -0.042 -0.042 -0.075 -0.049 -1.116

Table A10. Changes in the environmental and economic impacts of the reference and
policy scenarios with respect to the no-policy baseline, with Annex I countries’
emissions-reduction target doubled from 10% below 2007-levels to 20%.
Item Region Model scenarios
REF BCA DOM CDF RSTR
EIT emission transfers (%) AN1 48.353 1.201 54.914 48.619 -90.744
Carbon leakage (%) NA1 12.685 10.271 12.690 -0.827 10.836
Emissions (%)
AN1 -20.000 -20.000 -22.707 -20.000 -20.000
NA1 2.799 2.266 3.179 -0.183 2.391
Global -9.160 -9.414 -10.400 -10.578 -9.354
Change in GDP (%)
AN1 -0.363 -0.325 -0.453 -0.375 -1.168
NA1 -1.163 -1.723 -1.369 -1.141 -2.444
Global -0.575 -0.696 -0.697 -0.578 -1.507
Change in EV (%)
AN1 -0.329 -0.255 -0.451 -0.343 -0.905
NA1 -0.675 -0.961 -0.799 -0.666 -3.149
Global -0.410 -0.421 -0.533 -0.419 -1.433

Table A11. Changes in the environmental and economic impacts of the reference and
policy scenarios with respect to the no-policy baseline, with the Armington-trade
elasticities halved. The Armington elasticities determine the substitution potential between
imported goods, and between domestic goods and imported ones. Lower Armington
elasticities decrease the trade responsiveness to price changes.
Item Region Model scenarios
REF BCA DOM CDF RSTR
EIT emission transfers (%) AN1 23.893 14.724 26.232 23.889 -90.379
Carbon leakage (%) NA1 9.818 8.686 9.556 -14.859 -2.310
Emissions (%)
AN1 -10.000 -10.000 -12.444 -10.000 -10.000
NA1 1.083 0.958 1.312 -1.639 -0.255
Global -4.731 -4.790 -5.904 -6.025 -5.367
Change in GDP (%)
AN1 -0.007 0.017 -0.009 -0.022 -2.214
NA1 -0.741 -0.979 -0.937 -0.705 -2.787
Global -0.202 -0.247 -0.256 -0.203 -2.366
Change in EV (%)
AN1 -0.026 0.006 -0.059 -0.040 -1.575
NA1 -0.406 -0.515 -0.520 -0.392 -5.685
Global -0.115 -0.116 -0.168 -0.122 -2.542

Table A12. Changes in the environmental and economic impacts of the reference and
policy scenarios with respect to the no-policy baseline, with the Armington-trade
elasticities doubled. The Armington elasticities determine the substitution potential between
imported goods, and between domestic goods and imported ones. Higher Armington
elasticities increase the trade responsiveness to price changes.
Item Region Model scenarios
REF BCA DOM CDF RSTR
EIT emission transfers (%) AN1 40.530 6.300 48.330 41.271 21.341
Carbon leakage (%) NA1 18.481 15.291 18.151 -7.907 20.409
Emissions (%)
AN1 -10.000 -10.000 -12.619 -10.000 -10.000
NA1 2.039 1.687 2.527 -0.872 2.252
Global -4.276 -4.443 -5.418 -5.660 -4.175
Change in GDP (%)
AN1 -0.130 -0.112 -0.192 -0.140 -0.483
NA1 -0.360 -0.570 -0.469 -0.350 -1.111
Global -0.191 -0.234 -0.265 -0.196 -0.650
Change in EV (%)
AN1 -0.090 -0.055 -0.146 -0.103 -0.351
NA1 -0.230 -0.359 -0.294 -0.227 -1.725
Global -0.123 -0.126 -0.181 -0.132 -0.674

Table A13. Changes in the environmental and economic impacts of the reference and
policy scenarios with respect to the no-policy baseline, with the fossil-fuel supply
elasticities halved. The fossil-fuel supply elasticities determine the responsiveness of
the fossil-fuel supply to demand reductions. Lower fossil-fuel supply elasticities reduce
the responsiveness of the fossil-fuel supply to demand reductions.
Item Region Model scenarios
REF BCA DOM CDF RSTR
EIT emission transfers (%) AN1 30.275 11.383 34.511 31.151 -90.484
Carbon leakage (%) NA1 18.914 17.139 17.961 -17.931 16.127
Emissions (%)
AN1 -10.000 -10.000 -12.512 -10.000 -10.000
NA1 2.087 1.891 2.479 -1.978 1.779
Global -4.253 -4.347 -5.384 -6.186 -4.400
Change in GDP (%)
AN1 -0.067 -0.048 -0.103 -0.085 -0.929
NA1 -0.521 -0.746 -0.664 -0.493 -1.606
Global -0.188 -0.233 -0.252 -0.193 -1.109
Change in EV (%)
AN1 -0.047 -0.013 -0.088 -0.067 -0.680
NA1 -0.333 -0.449 -0.424 -0.322 -2.805
Global -0.114 -0.116 -0.167 -0.127 -1.180

Table A14. Changes in the environmental and economic impacts of the reference and
policy scenarios with respect to the no-policy baseline, with the fossil-fuel supply
elasticities doubled. The fossil-fuel supply elasticities determine the responsiveness of
the fossil-fuel supply to demand reductions. Higher fossil-fuel supply elasticities increase
the responsiveness of the fossil-fuel supply to demand reductions.
Item Region Model scenarios
REF BCA DOM CDF RSTR
EIT emission transfers (%) AN1 28.491 11.525 32.433 28.725 -90.475
Carbon leakage (%) NA1 8.856 7.004 8.897 -27.463 9.629
Emissions (%)
AN1 -10.000 -10.000 -12.491 -10.000 -10.000
NA1 0.977 0.773 1.226 -3.030 1.062
Global -4.781 -4.878 -5.969 -6.686 -4.740
Change in GDP (%)
AN1 -0.116 -0.101 -0.164 -0.129 -0.928
NA1 -0.453 -0.653 -0.585 -0.432 -1.565
Global -0.206 -0.247 -0.276 -0.210 -1.097
Change in EV (%)
AN1 -0.083 -0.054 -0.132 -0.099 -0.678
NA1 -0.252 -0.354 -0.326 -0.246 -2.785
Global -0.123 -0.125 -0.178 -0.133 -1.173