addressing the energy challenge: resource resilience · addressing the energy challenge: resource...
TRANSCRIPT
Managed by UT-Battellefor the Department of Energy
Addressing The Energy Challenge:Resource Resilience
Presented to:PACOM
Dana ChristensenAssociate Laboratory Director
Energy and Engineering Sciences
July 16, 2008

2 Managed by UT-Battellefor the Department of Energy PACOM_07/16/08_Christensen
Regional Profile: Southeast Asia • Energy has been the driver of Asia’s record growth,
stability and development since WW II• Many diverse cultures with strong cultural heritage • Fastest growing energy consumer region in the
world
– Five of the Top Ten Energy Users-Japan, China, Taiwan, South Korea, India
– Four of Top Ten US Export Partners-China, Taiwan, Japan, South Korea
– Four of the Top Ten US Import Partners-Japan, China, Taiwan, South Korea
– Five of the Top Ten Highest Populations-China, India, Indonesia, Bangladesh, Russia, Japan

3 Managed by UT-Battellefor the Department of Energy PACOM_07/16/08_ChristensenEnergyR&D_0807
Energy• The world’s largest industry
• The number one challengefacing humanity
• A principal driver for global stability– Climate change– National security– Economic competitiveness– Quality of life
3 Managed by UT-Battellefor the Department of Energy EnergyR&D_0807
• Compels nation-state behavior
• Creates Environmental concerns
• Stresses Trade Relationships
• There will be an “Energy Trip-wire”

4 Managed by UT-Battellefor the Department of Energy PACOM_07/16/08_Christensen
Resource Resilience
• Balance the resource equation:Environment / Energy / Water / Waste– Tailored to the target (country, region, etc.)
• Guam as a microcosm of the Resource Resilience Challenge– Native Population– Seaport Functions– Airport and Tourism– Ecological Balance– PACOM Plans (Marine, Air Force, Navy, Army)

5 Managed by UT-Battellefor the Department of Energy PACOM_07/16/08_Christensen
General Geography• Population: 175,877
• Elevation: sea level to 406 m
• Economy: US military spending and tourism from Asia
• Area 541.3 sq. km– Approximately 3 times the size of
Washington, D.C.
Population of D.C = 588,292
http://www.guamindustryforum.com/publications/GuamIndustryForum-II-Infrastructure.pdf
Population GrowthPopulation Growth
6 Managed by UT-Battellefor the Department of Energy PACOM_07/16/08_Christensen
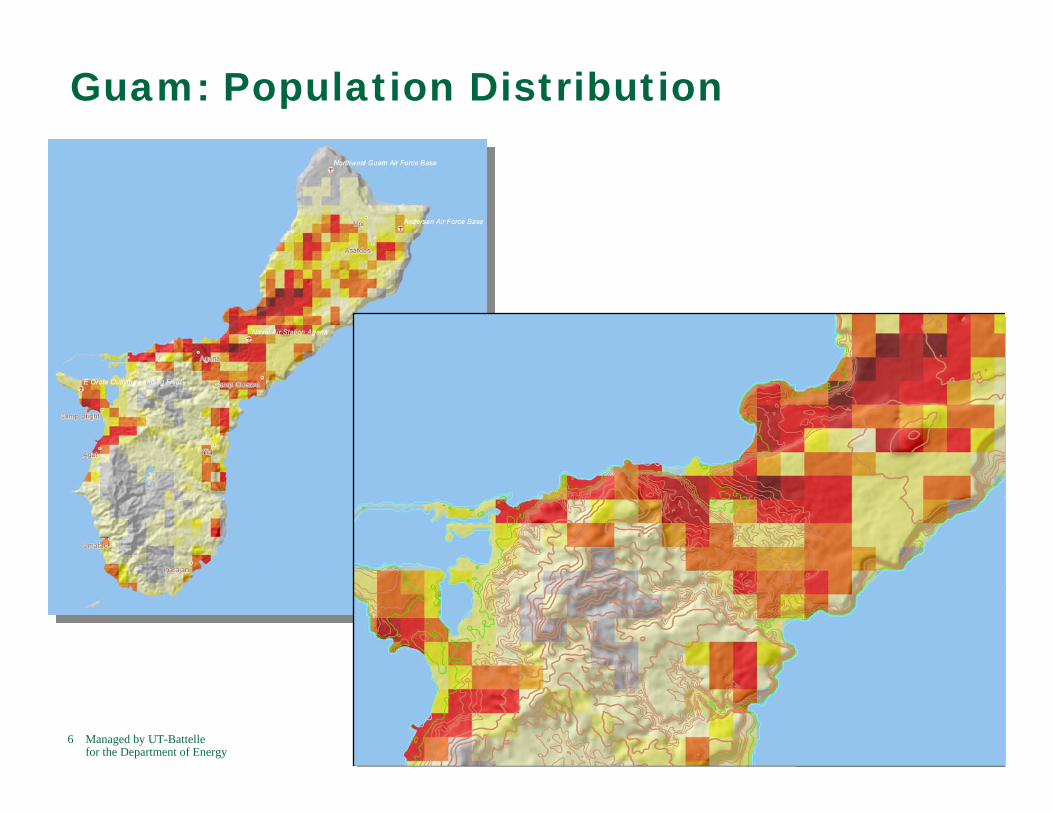
Guam: Population Distribution
Source: LandScan Global
7 Managed by UT-Battellefor the Department of Energy PACOM_07/16/08_Christensen
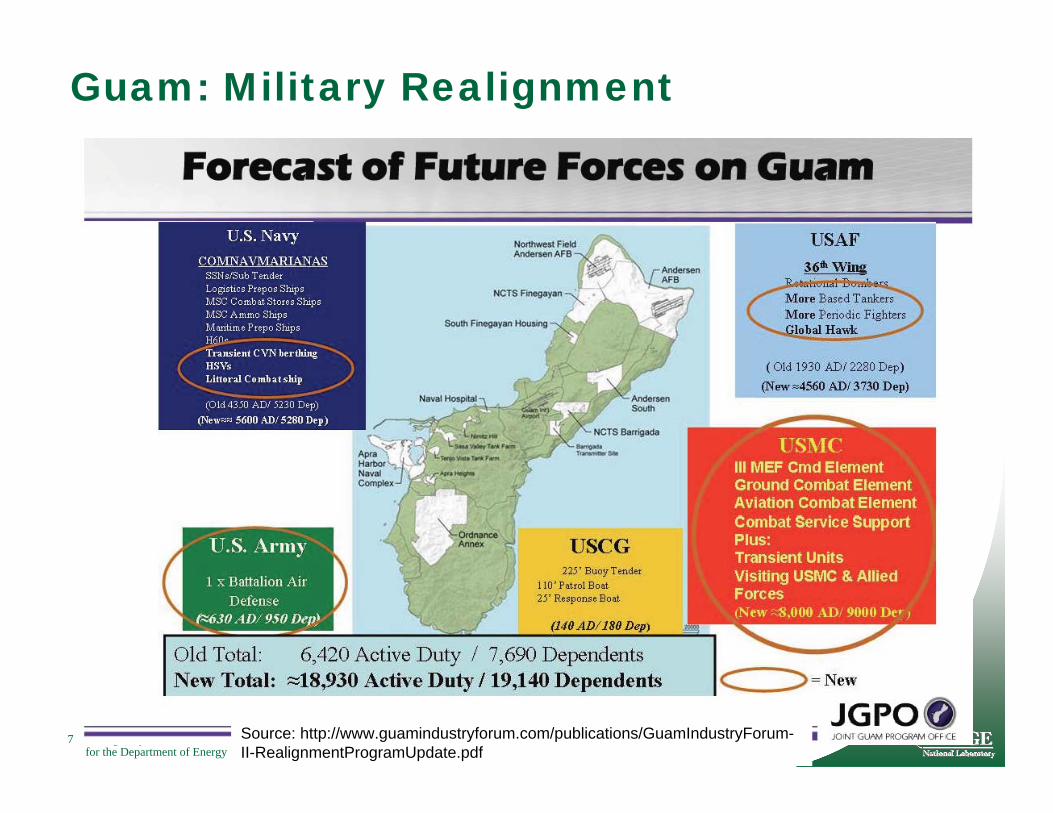
Guam: Military Realignment
Source: http://www.guamindustryforum.com/publications/GuamIndustryForum-II-RealignmentProgramUpdate.pdf

8 Managed by UT-Battellefor the Department of Energy PACOM_07/16/08_Christensen
Energy Opportunity Options across the PACOM AOR
• Think long term-ten to fifty years
• Technology assessment
• Systems thinking and interaction
• Capitalize on technology futures – Renewable energy
(hydro, solar, wind, bio)– Energy Efficiency
(zero energy homes, electric transportation)– Base Load
(Oil ? – Nuclear) – Distribution
(Grid)

9 Managed by UT-Battellefor the Department of Energy PACOM_07/16/08_Christensen
Guam Military HousingTyphoon Resistant Construction
• Concrete masonry construction– Well sealed walls, windows and
doors– Homes typically have:
• Low natural ventilation rate (e.g. < 0.1 ACH, leakage < 1 ft2)
• Negative shell pressure relative to outdoors (e.g. (-) 2 - 4 Pascals)
– As a result:• Moisture control problems leading
to mold/mildew• Poor indoor air quality• High indoor radon levels • Efficient construction but energy
efficiency opportunities exist

10 Managed by UT-Battellefor the Department of Energy PACOM_07/16/08_Christensen
Building EnvelopeWindows, Walls, Floors
Building Systems(“whole-systems”)Design toolsSystem IntegrationOn-Site Power
SystemsBuilding Integrated PhotovoltaicsFuel Cells
Building EquipmentSpace conditioningLightsAppliancesBIPV, PEM-FC
Opportunities for improved efficiency in buildings are enormous.
Buildings consist of a complex system of interacting components facing variable input conditions Materials Intensity
11 Managed by UT-Battellefor the Department of Energy PACOM_07/16/08_Christensen
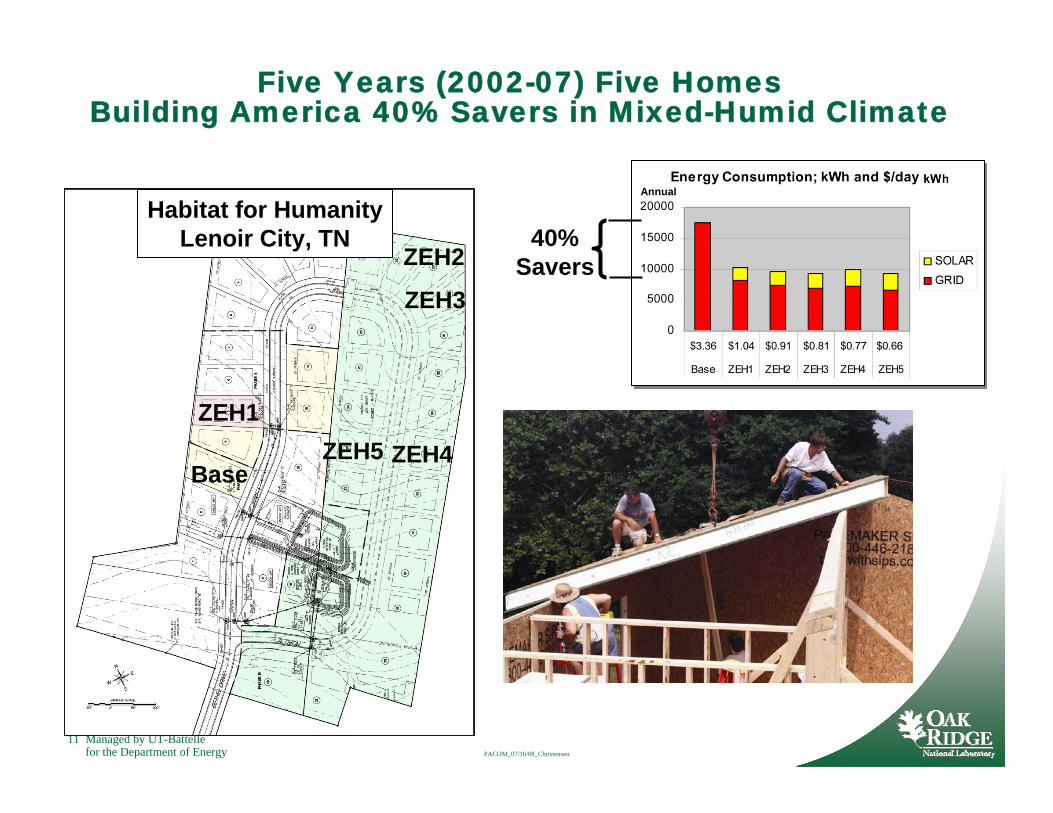
Five Years (2002-07) Five HomesBuilding America 40% Savers in Mixed-Humid Climate
ZEH1
ZEH2
ZEH3
ZEH4ZEH5Base
Habitat for HumanityLenoir City, TN 40%
Savers
Annual

12 Managed by UT-Battellefor the Department of Energy PACOM_07/16/08_Christensen
Ground-source IHP:Saves 50%on H, C, WH, D
Air-source IHP:Saves 50% on H, C,WH, D in mild areas
Appliances, suites,whole-home E-mgmt
ZEHcore wall and SIPssave energy and cost
Partner TBD
Buildings: Partner to develop deep-savings components to enable zero-energy,demand-responsive buildings
Whole-houseenergy savings:
70% use;80% peak periods
Integration of emerging technologies from
partners
Heat pump water heater:50% energy savings
Zero-energy homes shown (zero-energy buildings similar)
Whole-house energy savings:
40% use;40% peak periods
Integrationof today’s
technology
Partner Sensitive
13 Managed by UT-Battellefor the Department of Energy PACOM_07/16/08_Christensen 13
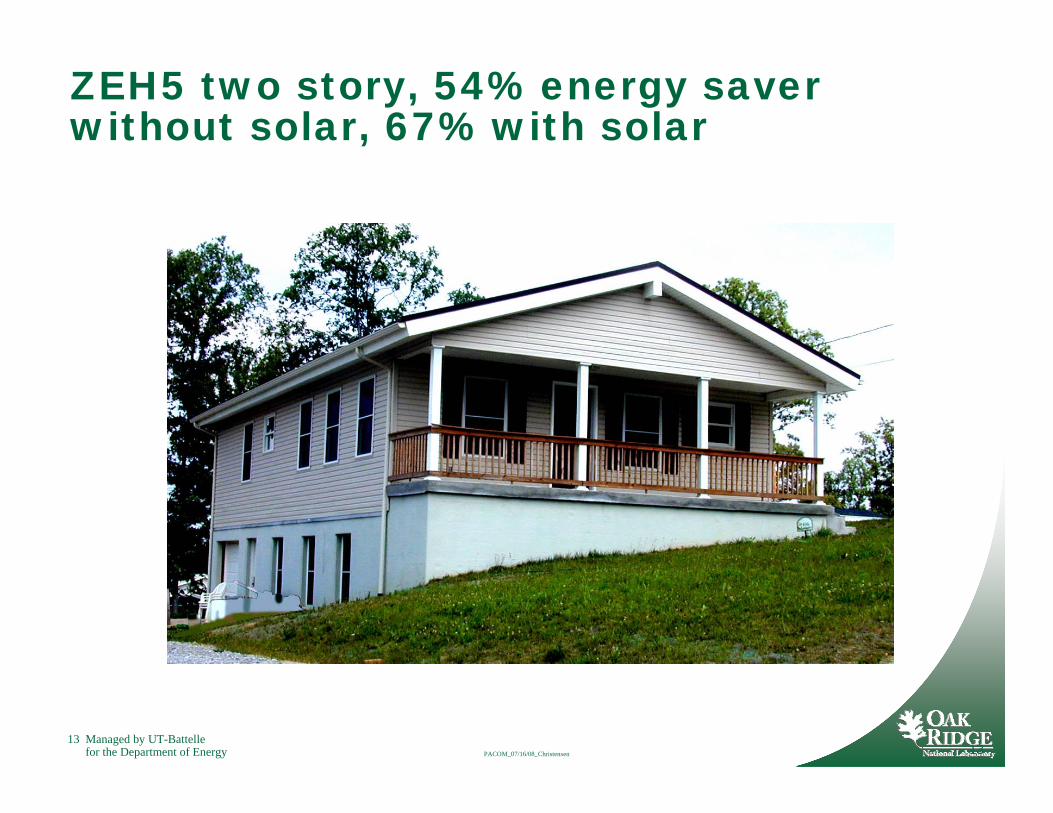
ZEH5 two story, 54% energy saver without solar, 67% with solar

14 Managed by UT-Battellefor the Department of Energy PACOM_07/16/08_Christensen
• Cool roofs– Georgia elementary school:
Energy savings of $14,500 per year– Converting 2,366 Tennessee K–12 schools
would save $19M per year
• Ground source heat pumps– All Sumner County schools
are using geothermal technology– Converting 2,366 Tennessee K–12 schools
would save $122M per year
• These and other upgrades can be readily deployed in commercial buildings
– Projects routinely save 20% – Payback from savings: 10 to 15 years– Total savings in Tennessee could exceed
$500M per year
Deploy proven technologies in schools and commercial buildings
15 Managed by UT-Battellefor the Department of Energy PACOM_07/16/08_Christensen
ORNL has conducted Radon Measurement and Mitigation Projects for the DoD in the Asia-Pacific Region since 1995
• > 20,000 Radon measurements and > 1,000 Radon mitigations in residential and nonresidential buildings located in:
• Hawaii• Guam• South Korea• Mainland Japan, and• Okinawa
16 Managed by UT-Battellefor the Department of Energy PACOM_07/16/08_Christensen
ORNL Federal Energy Management Program Team Have Experience in Supporting Island Needs• Combined Heating, Cooling, and Power Assessments:
– Hawaii: Fort Shafter (03), Schofield Barracks (03), Marine base (05 & 06)
– Dominican Republic: US Embassy (03)– St. Thomas: GSA Airport (03)– Puerto Rico: Fort Buchanan (03), Roosevelt Roads Naval Station
(03), GSA federal buildings in San Juan and Hato Ray (02)
• Energy Security Planning technical assistance to Fort Buchanan, Puerto Rico (04)
• Energy Services Performance Contracting technical assistance:– Fort Buchanan Puerto Rico (03)– GSA Postal Service and Courthouse (04)
17 Managed by UT-Battellefor the Department of Energy PACOM_07/16/08_Christensen
Sustainability Considerations for Islands
• Islands have finite resources that present unique engineering challenges:– Specifically limited
• land, • energy and potable water sources, • waste disposal options, and• on-island technical and logistical support• environmental impacts
• Therefore, not all emerging technologies will be suitable for island applications
18 Managed by UT-Battellefor the Department of Energy PACOM_07/16/08_Christensen
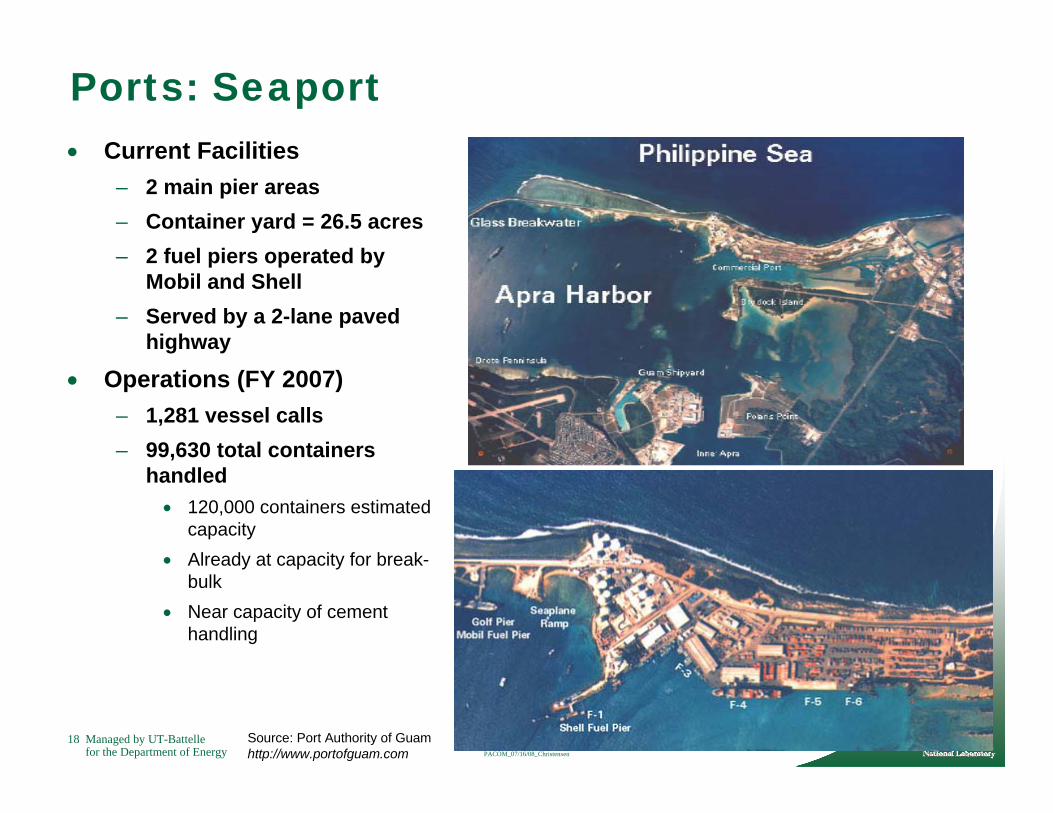
Ports: Seaport
Source: Port Authority of Guamhttp://www.portofguam.com
• Current Facilities– 2 main pier areas – Container yard = 26.5 acres– 2 fuel piers operated by
Mobil and Shell– Served by a 2-lane paved
highway
• Operations (FY 2007)– 1,281 vessel calls– 99,630 total containers
handled • 120,000 containers estimated
capacity• Already at capacity for break-
bulk• Near capacity of cement
handling

19 Managed by UT-Battellefor the Department of Energy PACOM_07/16/08_Christensen
Guam Ports: Seaport (cont.)
As a result of DoD build-up, the port forecasts increasing demand at the port, peaking in 2015 before beginning a decline. They also anticipate more than double demand for break-bulk goods (i.e..-construction materials) and bulk cement.Source: 2007 Guam Industry Forum (http://www.guamindustryforum.com).

20 Managed by UT-Battellefor the Department of Energy PACOM_07/16/08_Christensen
Guam Seaport ExpansionComparison of North American Ports for Current and Forecasted Activities
87,786147,569Kahului, HI35.
99,630165,429Apra (Guam)34.
104,292191,070Wilmington, NC33.
…………
142,176284,352Wilmington, DE24
206,800372,240Apra (Guam)
264,626407,625Altamira (Mex.)23
…………
3,072,9497,316,465Long Beach, CA2.
4,638,7338,355,039Los Angeles, CA1.
Containers HandledTEUsPort Name,
State2007 Rank
Source: American Association of Port Authorities (AAPA), 2007;Forecasted containers from the Port Authority of Guam. Forecasted TEUs = 80% makeup of 40 ft. containers, 20% from 20 ft. containersat peak volume of containers in 2015.
38.5 acresApproximately 110 acres
Storage/Handling Area
2,875 ft.2,952 ft.Wharf Length
Guam (after expansion)Altamira
Forecast
Apra, GuamApra, Guam
Altamira, MexicoAltamira, Mexico

21 Managed by UT-Battellefor the Department of Energy PACOM_07/16/08_Christensen
Guam Commercial Airport Expansion
815,130McGhee Tyson, TN (TYS)93
………
1,416,354Guam Intl. (GUM)79
……
2,522,123Buffalo Niagara Intl., NY (BUF)
2,832,708Guam Intl. (GUM)
2,971,953Jacksonville Intl., FL (JAX)58
………
8,973,410Reagan National, VA (DCA)27
………
36,825,097Chicago O’Hare, IL (ORD)2.
41,352,038Atlanta, GA (ATL)1.
EnplanementsAirport, State (Code)2006 Rank
Source FAA Passenger Boarding and All-Cargo Data, 2006 (http://www.faa.gov/)Forecasted enplanement assumes double the current boarding.
Comparison of North American Airports for Recent and Forecasted Activities
Guam
Jacksonville
• Jacksonville International Airport (JAX)
– 2 runways (10,000 and 7,701 feet)– 23 gates– More parking and terminal area than
currently at GUM
Forecast
22 Managed by UT-Battellefor the Department of Energy PACOM_07/16/08_Christensen
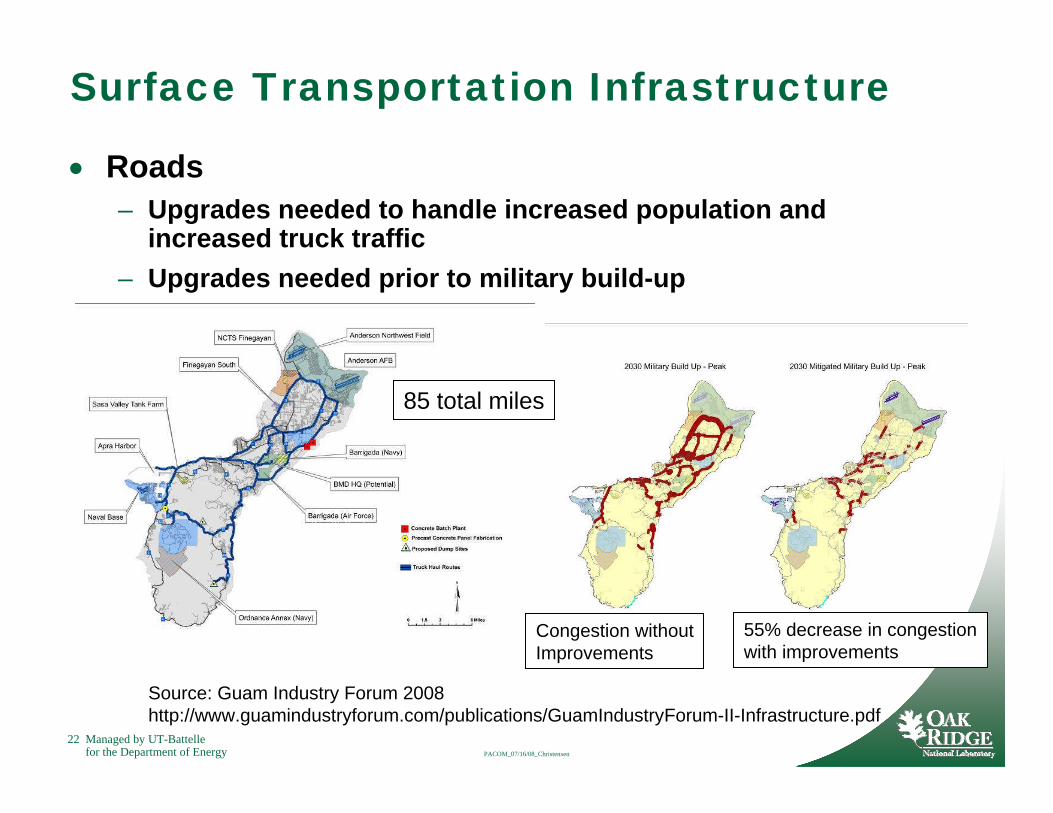
Surface Transportation Infrastructure
• Roads– Upgrades needed to handle increased population and
increased truck traffic– Upgrades needed prior to military build-up
Source: Guam Industry Forum 2008http://www.guamindustryforum.com/publications/GuamIndustryForum-II-Infrastructure.pdf
85 total miles
Congestion withoutImprovements
55% decrease in congestionwith improvements

23 Managed by UT-Battellefor the Department of Energy PACOM_07/16/08_ChristensenEnergyR&D_0807
Nanocompositemembranes
Oil shale
High-efficiencyclean combustion
Alternative energy
sources
Efficient vehicle
technology
Transportation logistics, planning,
and analysis
Non-petroleum fuels
Intelligent transportation systems
Scientificdiscovery
Modelingand simulation
Adaptivedecision tools
Graphical informationsystems
Advanced materials Electrification
• 100 mpgee automobiles• Drive-by-wire• Adaptive control• Intelligent safety features
Technologyinnovation
Transportation: Developing multifaceted solutions
• Renewable energy• Improved mobility• Transportation security• National competitiveness

24 Managed by UT-Battellefor the Department of Energy PACOM_07/16/08_ChristensenEnergyR&D_0807
ORNL employee transportation: One vision
“Plugging in” for integration and innovation
– Direct solar charging– Off-peak charging– Smart metering– Energy storage for the grid– User incentives/convenience
The U.S. grid has significantexcess capacity (off-peak)

25 Managed by UT-Battellefor the Department of Energy PACOM_07/16/08_Christensen
Energy Demand Forecast
• Energy– 552.2 MW gross
generation capacity– 29 substations– 663 miles of
transmission/distribution lines
– 100% Petroleum based– Currently exploring
alternative energy and conservation strategies• Wind farm (20 MW)• Seawater-cooled air
conditioning for major hotels
http://www.guampowerauthority.com Source: “Presentation to Standard & Poors” Guam Power Authority June 6, 2007

26 Managed by UT-Battellefor the Department of Energy PACOM_07/16/08_ChristensenEnergyR&D_0807
“Promoting the growth of clean, carbon-free nuclear powerto meet the growing electricity demand that enhances energy securitywhile promoting non-proliferation is a must in the U.S. and internationally.”
– George W. Bush
Exportable,right-sized
nuclearreactor
Fuel lease concept
Safe and secure expansionof nuclear power
• Advanced proliferation-resistant reprocessing
• Advanced burner reactors for waste transmutation
• Advanced safeguard technologies
• Reliable fuel services
• Small exportable reactors
27 Managed by UT-Battellefor the Department of Energy PACOM_07/16/08_Christensen
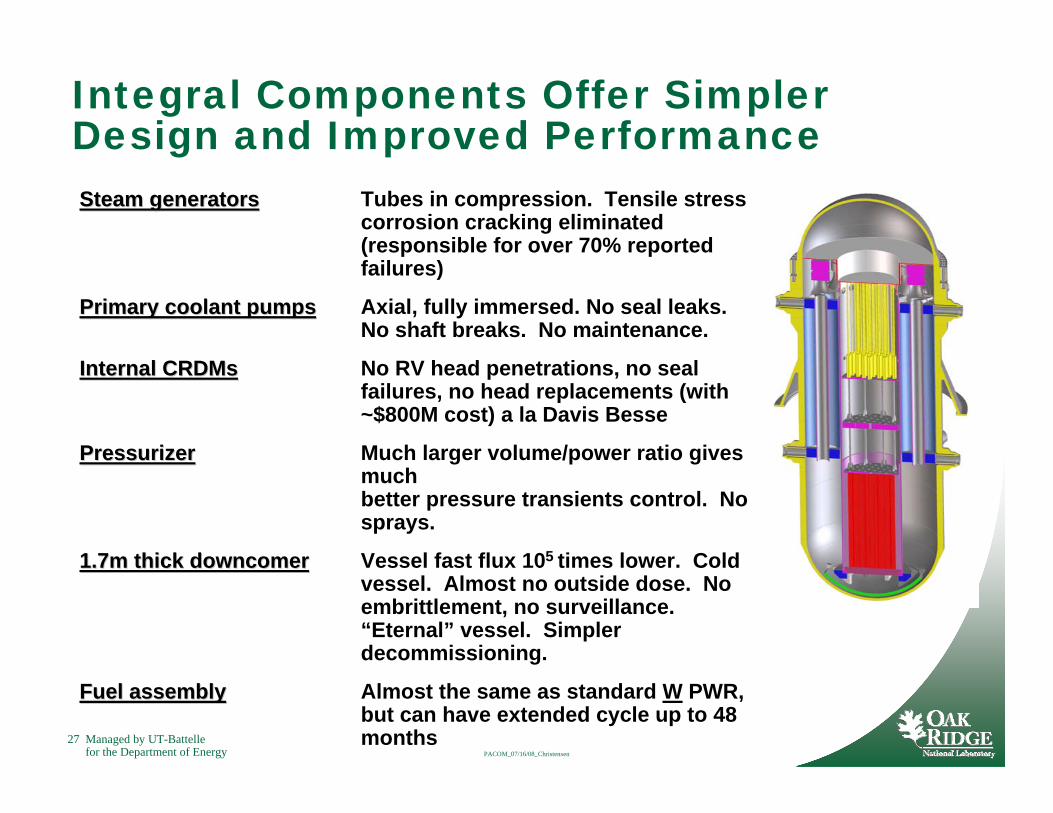
Integral Components Offer Simpler Design and Improved PerformanceSteam generatorsSteam generators Tubes in compression. Tensile stress
corrosion cracking eliminated (responsible for over 70% reported failures)
Primary coolant pumpsPrimary coolant pumps Axial, fully immersed. No seal leaks. No shaft breaks. No maintenance.
Internal CRDMsInternal CRDMs No RV head penetrations, no seal failures, no head replacements (with ~$800M cost) a la Davis Besse
PressurizerPressurizer Much larger volume/power ratio gives much better pressure transients control. No sprays.
1.7m thick downcomer1.7m thick downcomer Vessel fast flux 105 times lower. Cold vessel. Almost no outside dose. No embrittlement, no surveillance. “Eternal” vessel. Simpler decommissioning.
Fuel assemblyFuel assembly Almost the same as standard W PWR, but can have extended cycle up to 48 months

28 Managed by UT-Battellefor the Department of Energy PACOM_07/16/08_Christensen
IRIS – International Reactor Innovative and Secure• Advanced integral light water reactor• 1,000 MWt (~335 MWe) per module• Innovative, simple design• Enhanced Safety-by-Design™• International development team• Anticipated competitive economics• Cogeneration potential (desalination,
district heating, process heat) • Modular installation to match demand
growth• NRC pre-application underway• Design Certification testing program
underway• Interest expressed by several countries• Projected deployment target: 2015 to 2017
Multiple twin-units(2 twin-units: 1340 MWe)

29 Managed by UT-Battellefor the Department of Energy PACOM_07/16/08_Christensen
VERDE Visualizing Energy Resources
Dynamically on Earth
Electric grid analysisand situational awareness
• Major power outages overthe past decade have resulted from a lack of wide-area situational understanding
• ORNL and TVAare developing tools to:
– Monitor real-time statusof the electric grid
– Assess interdependenceswith critical energy infrastructure
– Assist in coordinationof federal response to natural disasters or major events
– Visualization and prediction

30 Managed by UT-Battellefor the Department of Energy PACOM_07/16/08_Christensen
31 Managed by UT-Battellefor the Department of Energy PACOM_07/16/08_Christensen
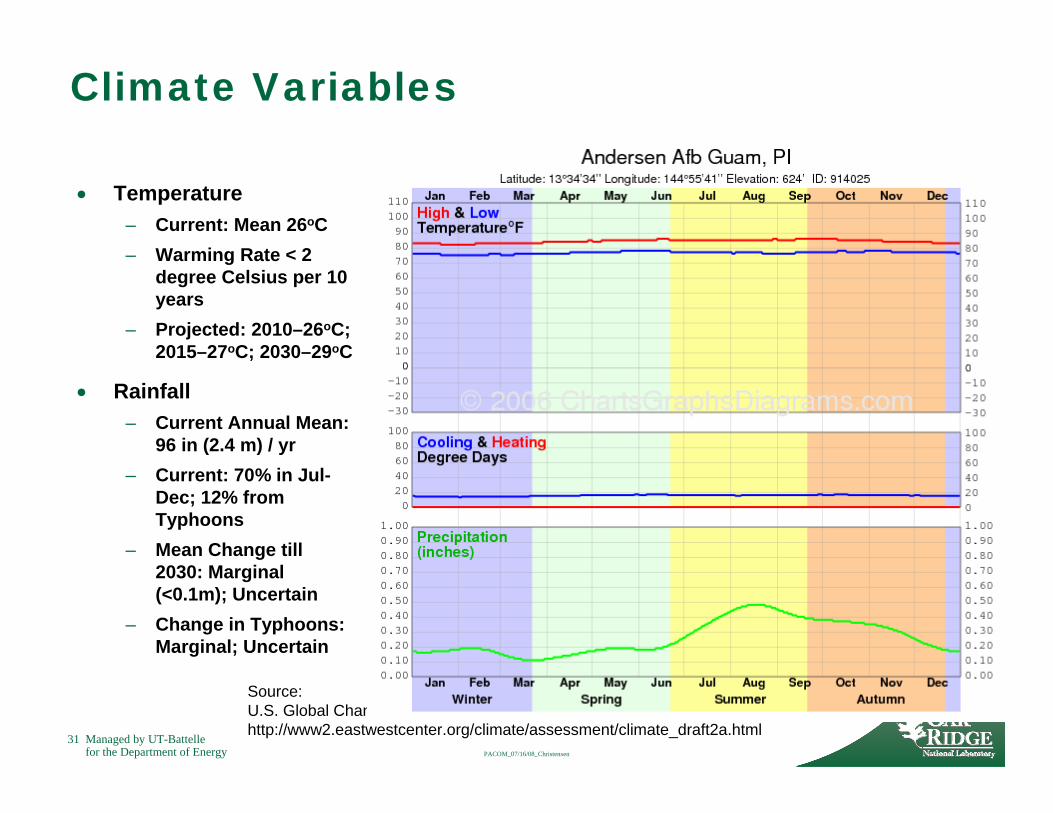
Climate Variables
• Temperature– Current: Mean 26oC– Warming Rate < 2
degree Celsius per 10 years
– Projected: 2010–26oC; 2015–27oC; 2030–29oC
• Rainfall– Current Annual Mean:
96 in (2.4 m) / yr– Current: 70% in Jul-
Dec; 12% from Typhoons
– Mean Change till 2030: Marginal (<0.1m); Uncertain
– Change in Typhoons: Marginal; Uncertain
Source:U.S. Global Change Research Program: The Pacific Assessmenthttp://www2.eastwestcenter.org/climate/assessment/climate_draft2a.html
Source:U.S. Geological Survey (USGS)http://pubs.usgs.gov/wri/wri034126/
32 Managed by UT-Battellefor the Department of Energy PACOM_07/16/08_Christensen
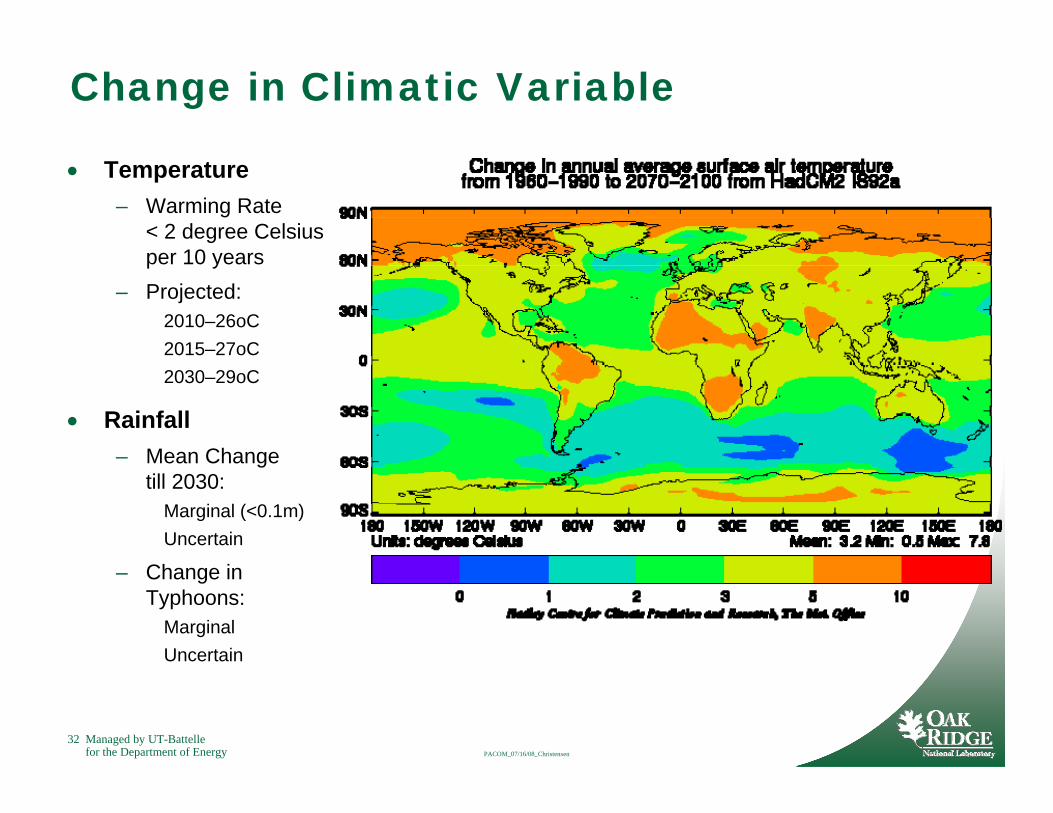
Change in Climatic Variable
• Temperature– Warming Rate
< 2 degree Celsius per 10 years
– Projected: 2010–26oC2015–27oC2030–29oC
• Rainfall– Mean Change
till 2030:Marginal (<0.1m)Uncertain
– Change in Typhoons:
MarginalUncertain

33 Managed by UT-Battellefor the Department of Energy PACOM_07/16/08_Christensen
Present Sea LevelPresent Sea LevelSea Level Rise 2100 (estimated maximum) ~.9 mSea Level Rise 2100 (estimated maximum) ~.9 mSea Level Rise 2100 Plus High TideSea Level Rise 2100 Plus High Tide
Impact of Sea Level Rise in 2100

34 Managed by UT-Battellefor the Department of Energy PACOM_07/16/08_Christensen
Present Sea LevelPresent Sea LevelSea Level Rise 2100 Sea Level Rise 2100 (estimated maximum) ~.9 m(estimated maximum) ~.9 m
Sea Level Rise 2100 Plus High TideSea Level Rise 2100 Plus High Tide
Impact of Sea Level Rise in 2100

35 Managed by UT-Battellefor the Department of Energy PACOM_07/16/08_Christensen
Tsunami
• A 10 m surge can potentially have drastic impact on population and key critical infrastructure such as port operation.

36 Managed by UT-Battellefor the Department of Energy PACOM_07/16/08_Christensen
Surface Water Infrastructure
• Water– 80% drinking water from
ground water– North: 180 wells – South: Surface runoff
• Surface water runoff over weathered volcanic rock
• Occurs locally only after intense rain (high permeability)
– Possibility of future rainfall collection
USGS Hydrologic Resources of Guam (2003)http://pubs.usgs.gov/wri/wri034126/
Water and Environment Research Institute of Western Pacific, Univ. of Guamhttp://www.weirguam.org
37 Managed by UT-Battellefor the Department of Energy PACOM_07/16/08_Christensen
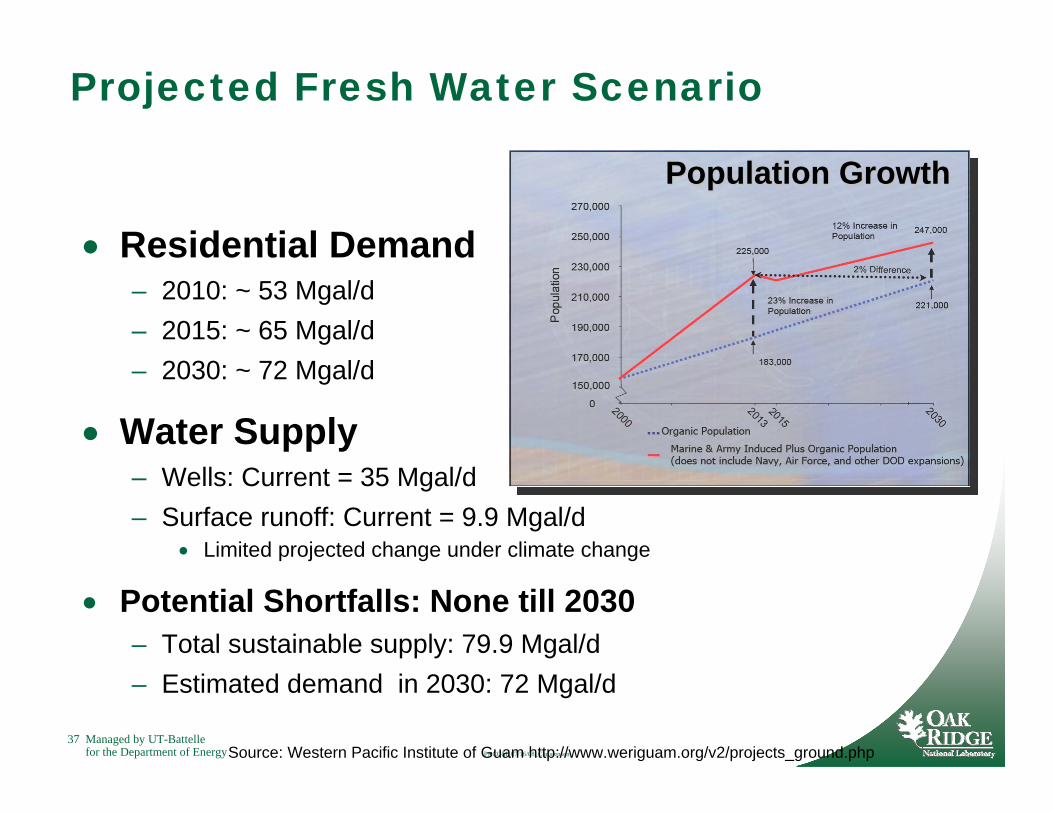
Projected Fresh Water Scenario
• Residential Demand– 2010: ~ 53 Mgal/d – 2015: ~ 65 Mgal/d– 2030: ~ 72 Mgal/d
• Water Supply– Wells: Current = 35 Mgal/d– Surface runoff: Current = 9.9 Mgal/d
• Limited projected change under climate change
• Potential Shortfalls: None till 2030 – Total sustainable supply: 79.9 Mgal/d– Estimated demand in 2030: 72 Mgal/d
Source: Western Pacific Institute of Guam http://www.weriguam.org/v2/projects_ground.php
Population GrowthPopulation Growth
38 Managed by UT-Battellefor the Department of Energy PACOM_07/16/08_Christensen
Resource Resilience:Considerations for Islands
• Sustainable solutions, in addition to being cost effective must be low maintenance and require minimal support from the mainland. With proper planning and training this is readily achievable.
• Some existing emerging technologies for energy generation (PV) and conservation (super insulation) are promising, but are untested in an island setting. Applied research and engineering is needed to identify the problems before wide-scale implementation.
• Other critical technologies essential for island sustainability still require significant research and development (e.g. desalinization, waste processing and disposal).
• Sustainable base-load electricity is essential.
39 Managed by UT-Battellefor the Department of Energy PACOM_07/16/08_Christensen
Conclusions
• Energy Issues will significantly impact our global relationships
• Systems analyses will better guide our decisions (
• Islands represent “golden” opportunities as test-beds for integrated thinking
• Picking energy winners is premature
Resource Resilience requires balancing the resource equation
Environment / Energy / Water / Waste