addressing urban poverty - the smeru · pdf fileaddressing urban poverty ... perencanaan tata...
TRANSCRIPT

FINAL REPORT
ADDRESSING URBAN POVERTY Increasing Learning on Urban Poverty Reduction in Kota Surakarta and Kota Makassar, Indonesia
The SMERU Research Institute
DECEMBER 2011
Supported by:
*This document has been approved for online preview but has not been through the copyediting and proofreading process which may lead to differences between this version and the final version. Please cite this document as "draft".

FINAL RESEARCH REPORT
ADDRESSING URBAN POVERTY
Increasing Learning on Urban Poverty Reduction in Kota Surakarta and Kota Makassar,
Indonesia
The SMERU Research Institute Jakarta
December 2011

The SMERU Research Institute i
RESEARCH TEAM
Research Advisor
Asep Suryahadi
SMERU Research Team
Rizki Fillaili (Team Leader)
R.Justin Sodo
Prio Sambodho
Rachma Indah Nurbani
Herry Widjanarko
Kartawijaya
Abdul Ghofur
Rika Kumala Dewi
Mona Sintia
Ratri Indah Septiana
Regional Researchers
Kota Surakarta Kota Makassar
Isnaini, Suardi Bakri,
Rohmatulloh, A.Muh. Syarief Hidayat,
Histiraludin, Bustam,
Wahyuning, Rikawati,
Tuti Widyaningrum, Edi Hariadi,
Ardian Pratomo, Nur Rahmah
Denny Paulus -

The SMERU Research Institute ii
ABSTRACT
With the growing intensity of urban problems, most notably poverty, it is imperative to identify the range of related aspects that help or hinder urban poverty reduction efforts. One emerging aspect is the role of city spatial planning in urban poverty reduction efforts. With the support from Ford Foundation, The SMERU Research Institute conducted a study to understand the connection between city spatial planning and urban poverty: how city spatial planning addresses urban poverty issues and the extent to which this planning is inclusive of the issues being experienced in the study areas. It is hoped that in the future, with an improved understanding of this connection, city spatial planning can be more pro-poor and supportive of urban poverty reduction efforts. This study covered two selected cities, Kota Surakarta and Kota Makassar. Both cities are well known for their innovation in inventing and implementing local programs that aim to reduce poverty and other social problems. The study implemented the Sustainable Livelihood Approach (SLA) as its analytical framework and conducted the Participatory Poverty Assessment (PPA) as its data collection method. The study revealed two important findings: first, that the characteristics of poverty and poverty dynamics have spatial relevance. Results of the PPA show that during the last ten years, poor people in the inner city have been enjoying welfare improvement due to urban economic agglomeration. In relation to the spatial aspect of poverty, the urban poor are facing illegal settlement problems, clean water and sanitation, and unsustainable urban economy. The second finding is that the current city spatial planning in both of the studied cities pays only limited attention to spatial poverty problems, which is reflected in several of their major planning documents. Moreover, poverty reduction efforts in these two cities are still dominated by programmatic approaches and have not taken into account aspects of urban spatial poverty. Key words: urban spatial poverty, city spatial planning, urban poverty reduction

The SMERU Research Institute iii
LIST OF CONTENTS RESEARCH TEAM i
ABSTRACT ii
LIST OF CONTENTS iii
LIST OF TABLES iv
LIST OF FIGURES iv
LIST OF ABBREVIATION v
I. INTRODUCTION 1 1.1 Background 1 1.2 Objectives and Methodology 2 1.3 Structure of the Report 6
II. A GENERAL DESCRIPTION OF THE REGION AND THE COMMUNITY’S LIVELIHOOD ASSETS CONDITION 7 2.1 Kota Surakarta 7
2.1.1 General Conditions and Poverty Trend 7 2.1.2 The Dynamics of People’s Livelihood Asset and Spatial Dimension of Urban
Poverty: Result of Participatory Poverty Assessment 9 2.2 Kota Makassar 20
2.2.1 General Conditions and Poverty Trend 20 2.2.2 Dynamics of People's Livelihood Assets and Spatial Dimensions of Urban Poverty:
Result of Participatory Poverty Assessment 24 2.3 Vulnerability Factors 29
2.3.1 Types, Levels, and Causes of Vulnerability 30 2.3.2 Vulnerable Groups 31 2.3.3 Impacts of Vulnerability to Livelihood Assets 31 2.3.4 Vulnerability in Spatial Dimension 32 2.3.5 Adaptive Strategy in Facing Vulnerability 32
III. THE INSTITUTIONAL FRAMEWORK OF POVERTY REDUCTION AND CITY SPATIAL PLANNING 33 3.1 Regional Development Planning Process 33 3.2 City Spatial Planning Process 36 3.3 Analysis of Development and Spatial Planning Documents 38 3.4 Mapping of the Main Actors and Their Roles in Poverty Reduction and City Spatial Planning 41 3.5 Current Institutional Challenges 46
IV. EFFECTS OF PROGRAMS AND POLICIES ON PEOPLE’S LIVELIHOOD STRATEGIES 48 4.1 Programs and Policies Related To Conditions of People’s Livelihood 48 4.2 Programs and Policies Related to Spatial Dimension of Poverty 51
V. WAY FORWARD: TOWARDS A MORE PRO POOR CITY SPATIAL PLANNING 57 5.1 Institutional challenges 57 5.2 Spatial Vulnerability 57 5.3 Recommendations for Way Forward 58 5.4 Future Challenges 58
LIST OF REFERENCES 60
APPENDIX 1. Detailed Research Activities 62 APPENDIX 2. Profile of Kelurahan PPA in Kota Surakarta and Kota Makassar 64 APPENDIX 3. Who Are the Poor? 66 APPENDIX 4. Stakeholder Mapping of Kota Surakarta Power and Interest on Poverty
Mainstreaming in City Spatial Planning Stakeholder Mapping of Kota Makassar Power and Interest on Poverty Mainstreaming in City Spatial Planning 75
APPENDIX 5. SOAR Results – Kota Surakarta 80

The SMERU Research Institute iv
LIST OF TABLES
Table 1. Number and Percentage of Indonesia’s Poor Population 1
Table 2. Poverty Level in Kota Surakarta, 2005 – 2009 9
Table 3. Welfare Trend in PPA Kelurahan in Surakarta, 2006 and 2011 10
Table 4. Issues of Spatial Poverty in Kota Surakarta 18
Table 5. Poverty Level in Kota Makassar, 2005 - 2009 21
Table 7. Issues of Spatial Poverty in Kota Makassar 22
Table 6. Welfare Trend in PPA Kelurahan in Makassar, 2006 - 2011 24
Table 8. Analysis of Planning Documents of Kota Makassar 39
Table 9. Analysis of Planning Documents of Kota Surakarta 40
Table 10. Mapping of Main Actors: Roles and Potential of Involvement in Mainstreaming Poverty and City Spatial Planning 43
Table 11. Grouping of SOAR Results 52
LIST OF FIGURES
Figure 1. Locations of Three PPA Kelurahan in Kota Surakarta 3
Figure 2. Locations of Three PPA Kelurahan in Kota Makassar 4
Figure 3. Sustainable Livelihood Framework 5
Figure 4. SOAR Framework 6
Figure 5 Population Growth of Kota Surakarta: Migration Vs Births 7
Figure 6. Major Income Sources of Kota Surakarta Population 8
Figure 7 Overlay Map: Number of Households in Slum Areas in Kota Surakarta 11
Figure 8. Social Map of Kelurahan Sangkrah, Kota Surakarta 12
Figure 9 Map of Distribution of Migrants in Kota Surakarta in 2009 13
Figure 10. Livelihood Asset Condition of Kelurahan PPA in Kota Surakarta 16
Figure 11. Major Income Sources of Kota Makassar Population 21
Figure 12. Overlay Map: Number of Families in Slum Areas in Kota Makassar 25
Figure 13. Social Map in Kelurahan Barabaraya Utara, Kota Makassar 26
Figure 14. Livelihood Assets Condition of Kelurahan PPA in Makassar 29
Figure 15. Priorities of Problems of People’s Livelihood 48
Figure 16. Distribution of Health Assistance Beneficiaries (PKMS Gold) in Kota Surakarta 50
Figure 17. Frequency of SOAR Capital Aspects 53
Figure 18. Stakeholders Perception on Strength of Surakarta and Makassar 54
Figure 19. Stakeholders Perception on Opportunities of Surakarta and Makassar 55
Figure 20. Stakeholders Perception on Aspirations of Surakarta and Makassar 55
Figure 21. Stakeholders Perception on Results of Surakarta and Makassar 56
Figure 22. Stakeholders Perception on Strategies of Surakarta and Makassar 56

The SMERU Research Institute v
LIST OF ABBREVIATION
Analisis Kemiskinan Partisipatoris (AKP) Participatory Poverty Assessment (PPA)
Badan Agency or (sometimes) Board, a technical supporting institution of government
Badan Koordinasi Penataan Ruang Nasional (BKPRN)
National Space Planning Coordination Board
Badan Koordinasi Perencanaan Ruang Daerah (BKPRD)
Regional Planning Coordination Board (in provincial/district level)
Badan Lingkungan Hidup (BLH) Regional Environment Agency (in provincial/ district level)
Badan Pemberdayaan Masyarakat (BPM) Provincial/District Community Empowerment Agency
Badan Perencanaan Pembangunan Daerah (Bappeda)
Provincial/District Regional Development Planning Agency
Badan Pertanahan Nasional (BPN) National Land Agency
Badan Pusat Statistik (BPS) Central Statistics Agency
Bank Indonesia (BI) Bank of Indonesia
BPMKS (Bantuan Pendidikan Masyarakat Kota Surakarta)
Education Assistance for citizen of Kota Surakarta
Dewan Perwakilan Rakyat Daerah (DPRD) Regional legislative/representative council (in provincial/district level)
Dinas Autonomous agency offices under the governor or mayor/regent
Dinas Kelautan, Perikanan, Pertanian, dan Peternakan
Sea, Fishery, Farming and Animal Husbandry Office (in provincial/district level)
Dinas Pekerjaan Umum (Dinas PU) Public Works Office (in provincial/district level)
Dinas Perhubungan (Dishub)) Transportation Office (in provincial/district level)
Dinas Tata Ruang dan Bangunan (DTRB) Building and Spatial Planning Office (in provincial/district level)
Jaminan Kesehatan Masyarakat (Jamkesmas) Community health insurance program (run by Ministry of Health targeted for the poor)
JICA Japan International Cooperation Agency
Kantor Bank Indonesia (KBI) Regional Office of the Bank of Indonesia
Kawasan Industri Makassar (KIMA) Makassar Industrial Estate
Kecamatan Sub-district level administration
Kelompok Kerja (Pokja) Working Group
Kelompok Kerja Air Minum dan Penyehatan Lingkungan (Pokja AMPL)
Water Supply and Sanitation Working Group
Kelurahan Village level administration
Kota City/Urban District (district level administration)
Lembaga Swadaya Masyarakat (LSM) Non Government Organization (NGO)
Makassar Dalam Angka Makassar in Figures (statistics)
Mandi Cuci Kakus (MCK) Public sanitation facilities

The SMERU Research Institute vi
Musyawarah Rencana Pembangunan (Musrenbang)
Development Planning Deliberation Forum
Pemeliharaan Kesehatan Masyarakat Surakarta (PKMS)
Surakarta Public Health Service (health care program for citizen of the city of Surakarta)
Penyediaan Air Minum dan Sanitasi Berbasis Masyarakat (PAMSIMAS)
Water Supply and Sanitation For Low Income Communities
Perencanaan Jangka Menengah Program Penanggulangan Kemiskinan (PJM Pronangkis)
Medium Term Planning of Poverty Alleviation Program
Perencanaan Kota Urban Planning (spatial and non-spatial aspect)
Perencanaan Tata Ruang /Penataan Ruang Spatial Planning
Perusahaan Daerah Air Minum (PDAM) Local government-owned water company
Pos Pelayanan Terpadu (Posyandu) Integrated health service post (at community level)
Program Nasional Pemberdayaan Masyarakat (PNPM)
National Program for Community Empowerment
Pusat Kesehatan Mayarakat (Puskesmas) Community Health Center (at sub-district level)
Rencana Kerja Pemerintah Daerah (RKPD) Local Government Annual Work Program
Rencana Pembangunan Jangka Menengah (RPJM) Medium Term Development Program
Rencana Pembangunan Perumahan dan Permukiman Daerah (RP4D)
Housing and Settlement Development Plan
Rencana Strategis (Renstra) Medium Term Strategic Plan
Rencana Tata Ruang Wilayah (RTRW) Spatial Planning
Rukun Tetangga (RT) Local administration consisting of several household (neighborhood units)
Rukun Warga (RW) Local administration consisting of several RT (Community unit)
Rumah Tidak layak Huni (RTLH) Uninhabitable houses
Satuan Kerja Perangkat Daerah (SKPD) Local government working unit (in provincial/ district level)
Satuan Polisi Pamong Praja (Satpol PP) Public order police
Statistik Daerah Kota Surakarta Statistics Summary of of the City of Surakarta
Tim Koordinasi Penanggulangan Kemiskinan Daerah (TKPKD)
Regional Coordinating Team for Poverty Reduction (in provincial/district level)

The SMERU Research Institute 1
I. INTRODUCTION
1.1 Background By 2009, for the first time in world history, more than half of the world’s population lives in the urban areas. It is estimated that this number will continue to rise to 70 percent by 2050. In nominal terms, this means that in 2050 there will be 6.3 billion people (out of the world’s population of 9.1 billion people) living in the urban areas (United Nations, 2010). The distribution of urban population is uneven in all areas of the world. As the most populous region in the world, Asia has the highest concentration of urban population (reaching 50.25% of the world total urban population, or around 1.8 billion people), followed by Europe (15.52% or 531 million people), Latin America/Caribbean (around 13.5% or 462 million people), Africa (11.6% or around 399 million people), and Oceania (0.73% or 25 million people) (United Nation, 2010). According to Imura, the high concentration of Asians living in the cities is the consequence of high foreign direct investment (FDI), which triggers industrialization in the areas (Imura et.all,2005) The industrialization in turns triggers the growth of urban population via two means: 1) urbanization or the movement of people from rural areas to urban areas due to the increase of job availability in the cities, and 2) the expansion of urban areas as the result of redevelopment of rural areas caused by the arrival of industries.
Table 1. Number and Percentage of Indonesia’s Poor Population
Number of Poor People(Million) Percentage of Poor People
Year Urban Rural
Urban & Rural
Urban Rural Urban &
Rural
1996 9.42 24.59 34.01 13.39 19.78 17.47
1998 17.60 31.90 49.50 21.92 25.72 24.23
1999 15.64 32.33 47.97 19.41 26.03 23.43
2000 12.30 26.40 38.70 14.60 22.38 19.14
2001 8.60 29.30 37.90 9.76 24.84 18.41
2002 13.30 25.10 38.40 14.46 21.10 18.20
2003 12.20 25.10 37.30 13.57 20.23 17.42
2004 11.40 24.80 36.10 12.13 20.11 16.66
2005 12.40 22.70 35.10 11.37 19.51 15.97
2006 14.49 24.81 39.30 13.47 21.81 17.75
2007 13.56 23.61 37.17 12.52 20.37 16.58
2008 12.77 22.19 34.96 11.65 18.93 15.42
2009 11.91 20.62 32.53 10.72 17.35 14.15
2010 11.10 19.93 31.02 9.87 16.56 13.33
2011 11.05 18.97 30.02 9.23 15.72 12.49
Source: BPS Official Release (Multiyear)
Among the countries in Asia, Indonesia has a high level of urbanization. Between 1961 and 1995, the proportion of Indonesia’s urban population has increased more than four times (Birch and Wachter, 2011). The proportion is estimated to continue to increase, reaching 68.3% in 2025. This rapid increase of urban population in Indonesia brings consequences to the quality of life of the urban population, especially on the issue of housing availability, electricity and water, public transportation and job (Cochrane: 2010). If these needs are not

The SMERU Research Institute 2
dealt adequately, problems such as emergence and growth of slum areas, growing number of urban poor, social issues and environmental damage will closely follow. Based on poverty data issued by Indonesia’s Central Bureau of Statistics (BPS), the number of Indonesian poor continues to decline every year, both in rural and urban areas. Yet, the threat of the declining quality of life remains an important issue to address, especially in big urban areas in Indonesia, where most Indonesian population will live in the near future. The urban population will also faced vulnerability due to high population growth and density, such as access to safe drinking water and sanitation. Recent MDG’s Report shows that the proportion of households that have access to safe drinking water in urban area has declined from 50,58% (1993) to 49,82% (2009); while this number increase from 31,6% (1993) to 45,72% (2009) (Bappenas, 2010: 9-12) This condition poses new challenges to management of urban area. With the growing intensity of urban problems, most notably poverty, it is imperative to identify the range of related aspects that help or hinder urban poverty reduction efforts. One emerging aspect is the role of city spatial planning in urban poverty reduction efforts. With the support from Ford Foundation, The SMERU Research Institute conducted a study to understand the connection between city spatial planning and urban poverty: how city spatial planning addresses urban poverty issues and the extent to which this planning is inclusive of the issues being experienced in the study areas. This study covered two selected cities, Kota Surakarta and Kota Makassar. Both cities are well known for their innovation in inventing and implementing local programs that aim to reduce poverty and other social problems. Kota Surakarta is well known to have a strong leadership, successful social protection programs in education and health sector, and a strong partnership between the government and non-government organizations in the effort to improve people’s welfare and to make Surakarta a livable ‘green’ city. The city government of Makassar is known for its vision to make the city as the ‘gate’ to Eastern Indonesia, concentrating on infrastructures development and the economy, while still taking into account the livelihood of the poor, through its “Program Makassar Bebas”1 among others. However, the success in economic development and social safety program in both cities trigger the high migration to both cities. With the new understanding on city spatial planning and urban poverty reduction efforts in these two cities, it is hoped that future city spatial planning can be designed to be more pro poor and supportive to urban poverty reduction efforts.
1.2 Objectives and Methodology The objectives of the study are three folds:
1. To develop comprehensive urban poverty profile and livelihood of the poor in selected areas using Participatory Poverty Analysis (PPA) method.
2. To provide institutional framework of city spatial planning and urban poverty reduction efforts including stakeholder mapping of the key institutions in both areas.
1Program Makassar Bebas or also known as 5 gratis program, is a local initiative by the government of Makassar that claims to provide free services “from birth until death”. It is conceived by the incumbent mayor during his election campaign that promises comprehensive social protection program for all resident of Makassar. Currently, this program is the flagship poverty reduction program that includes free basic health services, free family card registration, free school bus, free funeral services and free legal assistance for the poor.

The SMERU Research Institute 3
3. To provide SOAR (Strength, Opportunities, Aspirations and Results) analysis of the key stakeholders at the city level, in relation to city spatial planning and urban poverty reduction effort.
Methodology The study was conducted in Kota Surakarta and Kota Makassar during 2011 and consists of three phases (details activities of each visit are outlined in Appendix 1):
o Phase 1. Public Consultation I: comprised of Key Actors Mapping (January-February 2011)
o Phase 2. Field Research: Participatory Poverty Assessment in six selected communities (March-April 2011)
o Phases 3. Public Consultation II: Participatory Workshop and Dissemination of Research Findings (November, 2011).
In each city, three kelurahan2 were selected in three kecamatan3 as the locations of the study. The selection was based on spatial characteristics and typology of people’s livelihood. The selection of study locations was not meant to represent the whole city population; nevertheless it tries to capture the major characteristics of livelihood and spatial concentration of the poor.
Figure 1. Locations of Three PPA Kelurahan in Kota Surakarta
2A Kelurahan is a village administrative level located in urban area.
3A Kecamatan is kelurahan administrative level
Kelurahan Mojosongo Spatial Characteristic: peri urban Livelihood Typology of the poor : Informal workers, scavenger Spatial issues: New development and relocation destination area
Kelurahan Kemlayan Spatial Characteristic: Inner city Livelihood Typology of the poor : Informal worker, Street peddler, parking service, Spatial issues: magersari, ‘night market’ development plan
Kelurahan Sangkrah Spatial Characteristic: Bengawan Solo river banks Livelihood Typology of the poor : Informal workers, scavenger Spatial issues: Poverty concentration areas, vulnerable to flood, relocation program area.
Kota Surakarta, Central Java

The SMERU Research Institute 4
In order to understand the livelihood condition and spatial characteristic of the urban poor and to see the connection between city spatial planning and poverty reduction efforts, the study applies Sustainable Livelihood (SLA) framework developed by Department for International Development (DFID. It serves as an analytical framework that focuses on a series of livelihood assets owned and used by the people, including poor people, as the livelihood strategy in reaching sustainable livelihood (DFID, Oktober 2001). The framework focuses on the strength and opportunity that the poor have on their livelihood systems rather than on their problems and needs. It allows us to understand the context in which the assets of poor can be devalued, decreased or damaged. It can also be used to understand how structural arrangements and processes (institutional conditions), including the process of urban development and spatial planning, influences the sustainability of urban poor livelihood. The Sustainable livelihood will then be achieved with the improvement of people’s welfare without neglecting the condition of the environment On this note, the application of Sustainable Livelihood framework in this study can provide better and more comprehensive understanding of people’s livelihood by combining realities in macro and micro levels..
Figure 2. Locations of Three PPA Kelurahan in Kota Makassar
Kelurahan Tallo Spatial Characteristic: Coastal area Livelihood Typology of the poor : Informal sector worker and fisher Spatial issues: Future area development plan, coastal and river degradation
Kelurahan Daya, Spatial characteristic: peri urban Livelihood Typology of the poor : formal and informal sector workers Spatial issues: new economic center and migrant destination, urban sprawl and growth of slums and illegal settlements.
Kelurahan Bara Baraya Utara, Spatial characteristic: Inner city Livelihood Typology of the poor : Informal sector worker (Informal labor, street peddler and rickshaw driver) Spatial issues: High density inner city slum, illegal settlements and land supply shortage
City of Makassar, South Sulawesi

The SMERU Research Institute 5
To capture the livelihood of the poor and its spatial characteristic at the community level, this study implemented Participatory Poverty Assessment (PPA) as data collection method. It includes participatory discussions with various community members, from community leaders, program implementers and most importantly with the group of poor people, women and men in each kelurahan. The discussions cover issues on the assets conditions of the poor, welfare trends, vulnerability factors, coping strategies and institutional aspects, including various types of social protection programs and policies that support or hamper their efforts to achieve sustainable livelihood. To understand the process of development planning including spatial planning, and to gain the perception of various stakeholders at the city level on the issues of urban poverty, a series of in-depth interviews and city level group discussions was conducted. This discussion also aims to identify the strength, opportunities and aspirations of these stakeholders using SOAR (Strengths, Opportunities, Aspirations, Results) method as an analytical tools. This is a strengths-based approach, (Stavros, Cooperrider, Kelly, 2005), that uses the principle of Appreciative Inquiry (AI) to gain insights and interests of the stakeholders, and puts an emphasis on positive factors rather than weaknesses and threat dominant in SWOT approach. Weaknesses and threats detected in SWOT analysis are turned into opportunities in SOAR analysis, making SOAR analysis potentially more productive to inform future actions and plans. It can also be used to asses the capacity of the entire stakeholder and institutional arrangement on spatial dimensions of poverty.
Figure 3. Sustainable Livelihood Framework

The SMERU Research Institute 6
Figure 4. SOAR Framework
1.3 Structure of the Report The report consists of five chapters. Chapter I provides the background of the study and the explanation of the methodology. Chapter II discusses the main findings and analysis on the poverty condition and livelihood of the poor, its spatial characteristics and vulnerability factors. Chapter III explains the institutional framework of city governance related to development planning, including spatial planning, and overty reduction efforts. It includes review of key planning documents and key stakeholders mapping in relation to the issues of city spatial planning and poverty reduction effort. Chapter IV discusses the impact of policy and programs on the livelihood strategies of the poor and stakeholder perceptions on city spatial planning and poverty condition in the region (SOAR result). Chapter V concludes by discussing future opportunities and challenges of poverty mainstreaming in wider city spatial planning.

The SMERU Research Institute 7
II. A GENERAL DESCRIPTION OF THE REGION AND THE COMMUNITY’S LIVELIHOOD ASSETS CONDITION
This chapter provides general socio economic condition of the region, and results of Participatory Poverty Assessment (PPA) in Kota Surakarta and Kota Makassar on the dynamic of livelihood assets of the poor, spatial characteristics of poverty, and vulnerability factors. The general description also provides the result of the analysis from secondary data.
2.1 Kota Surakarta 2.1.1 General Conditions and Poverty Trend For the last few years, Kota Surakarta is known for its achievement in efforts to improve the quality of life of its people. Among the achievements is the success of the city government in managing the informal sectors; relocating the street vendors (Pedagang Kaki Lima) into several trade concentrated zone, revitalizing the traditional market, and providing additional social protection programs in education and health sector for the poor. Kota Surakarta also has been awarded as Kota Layak Anak (Child Friendly City) by Ministry of Women Empowerment in collaboration with UNICEF. At the moment, beside maintaining the good performances, the government is trying to pursue its vision to be the place of Cultural Heritage of Java and to be an Eco Cultural City. By 2010, population of Surakarta has reached 500,642 people (Central Bureau of Statistics, Population Census 2010), making it as one of big city in Indonesia. The growth of population is around 0.83% per year from 2000 to 2009, which is below the national growth (1.31%) and above the average of Central Java Province (0.39%) 4 . Related to the condition of the population, data shows that between 2005 and 2008, most of the growth came from births. Yet, since 2007, the net migration ratio (in migration minus out-migration) has started to show a positive trend. In 2009, there was a significant increase of in-migration. This year, the increasing number of migration has reached more than 100%, compared to that of 2008. (‘Surakarta dalam Angka’, 2009).
Figure 5 Population Growth of Kota Surakarta: Migration Vs Births
4Indonesian Population Projection

The SMERU Research Institute 8
The existing various social protection programs for the poor provided by city government, such in education sector through Bantuan Pendidikan Masyarakat Kota Surakarta (BPMKS) and in health sector trough Pemeliharaan Kesehatan Masyarakat Surakarta (PKMS)—are seen as one of the pull factor for the massive in-migration. BPMKS provides additional school fee assistance on top of BOS (School Operational Assistance provided by the central government). While with the gold health card provided by PKMS program, poor people could have access to free health care service so much so that it also covered hemodialysis. Meanwhile for PKMS Silver card holder – that is a group of near poor, are entitled to have free health care facilities up to Rp2 Million per person per year. This condition symbolize the paradox of urban poverty, that if the city improves the life of the urban poor by improving public services including providing social protection programs, then that city will attract more people to come. From the economic structure of the city, the biggest contribution for regional gross domestic products (PBRD) comes from trade, hotel and restaurant sector (39.44%) with trade being the biggest subsector contributor. The second biggest contributor is processing industry (37.85%), with the biggest subsector is food, drinks and tobacco (‘Surakarta dalam Angka, 2009). Figure below provides additional information on the spatial distribution of the major income sources of the population. From the map below, we can see that most of the citizen that reside in northern part of the city work in service sector, whilst those who live in southern part work in wholesales, retails and restaurants sectors.
Figure 6. Major Income Sources of Kota Surakarta Population

The SMERU Research Institute 9
Currently, Surakarta has the highest population density in Central Java province that reaches 11,996.41 people/km2 (‘Jawa Tengah dalam Angka, 2010). Within city, the southern part is denser than the northern part, and the highest density rate is found in Kecamatan Serengan. This high population density becomes one of the challenged faced by the city governments, as it has direct connection with the condition of poverty. The poverty trend in Surakarta has been fluctuating in the last five years. In 2006 and 2008, there was an increase in the number of poor people. This may be the impact of the increase in the price of basic necessities triggered by government policy that reduced gasoline subsidy in 2005 and in 2008. In 2009, the proportion of poor people declined to 14.99%, even though it was still higher compare to that of in 2005. There is also a widening gap in income distribution; that shown an increase since 2007. One possible explanation is that this may be related to the high influx of in-migration.
Table 2. Poverty Level in Kota Surakarta, 2005 – 2009
Year Number of Poor
People (in Thousands) Percentage of Poor
People (Percent) Poverty Line
(IDR/person/month)
2005 69.10 13.34 169,956
2006 77.60 15.21 210,909
2007 69.80 13.64 196,959
2008 83.40 16.13 236,751
2009 78.00 14.99 286,158
Source: BPS (multiyears)
The result of poverty survey conducted by Solo Kota Kita—an NGO based in Surakarta— complements the poverty profile of the city. The study shows the spatial distribution of poverty; that areas with the highest proportion of poverty are located in the southern part of the city. They are, among others; exist in high density areas such as in Kecamatan Serengan and along the riverside of Bengawan Solo such in Kecamatan Pasar Kliwon. 2.1.2 The Dynamics of People’s Livelihood Asset and Spatial Dimension of Urban
Poverty: Result of Participatory Poverty Assessment To complement macro level picture of urban poverty with micro realities this study implemented PPA at kelurahan level. The PPA activities were conducted in three kelurahan, that were selected based on the typology of livelihood and spatial characteristics of the poor. The locations are in inner city (Kelurahan Kemlayan), in the peri-urban/new development area(Kelurahan Mojosongo), and along the river bank of Sungai Bengawan Solo (Kelurahan Sangkrah). (See Appendix 2. Profile of Kelurahan PPA in Surakarta). The results of PPA were then analyzed to provide explanation about livelihood condition of the general urban population as well as the poor, the poor’s assets condition and vulnerability factors. Below is the summary of PPA results. Poverty Profile: Proportion of The Urban Poor and Welfare Trend The result of discussions with community member, male and female, shows that trend of people’s welfare in the three kelurahan PPA has spatial relevance: the trends depends on the location of the kelurahan. The kelurahan that is located in the inner city (Kelurahan Kemlayan) and the one located in the peri urban (Kelurahan Mojosongo) experienced welfare improvement. While kelurahan that located along the riverside of

The SMERU Research Institute 10
Bengawan Solo (Kelurahan Sangkrah) experienced declining welfare condition. The fact that there is change in welfare condition in each kelurahan was emerged during the discussion of Wealth Ranking with representatives from the community. The change is evident from the change in proportion of various welfare groups in the community for the last ten years5.The participants of the discussion then identified characteristics of each of the group. In general – in three kelurahan - the characteristics were based on types of occupation, income, asset ownership, level of education, health condition and others (See Appendix 3 for detail characteristics of poor group). According to PPA results, the proportion of poor people in Kelurahan Sangkrah is higher compare to the other two kelurahan, and this number has been increased in the last five years, thus the community is experiencing declining welfare condition. The PPA result further revealed that this was happened because of the poor became more vulnerable that hampered them to maintain their welfare condition. Those vulnerability factors are external to the poor households, that is the price spike of basic necessities, high cost of education maintenance for children, usually during new academic year, and threat of flood from Bengawan Solo River and other small river running in the middle of the city. These factors made poor’s people unable to accumulate assets and find it hard to fulfill their needs. Even though their income is increased in nominal term, but it could not compensate the rise in price of goods and other basic necessities. The climate condition which becomes more unpredictable now, also makes them facing bigger threat of flood. Flood brings about destruction and loss of asset for the poor living along the river banks. They lose their home, productive asset and others, and they also face difficulty in accumulating new assets. When there is flood, they also cannot work normally.
Table 3 Welfare Trend in PPA Kelurahan in Surakarta, 2006 and 2011
Kelurahan Kemlayan
(Inner city)
Mojosongo (Peri-Urban New Development Area)
Sangkrah
(River banks)
Welfare Group/
Year
Very Rich
RIch Medium Poor Very Poor
Rich Medium Poor Rich Medium Poor
2006 6% 17% 33% 32% 12% 15% 60% 25% 9% 45% 46%
2011 6% 20% 33% 31% 10% 30% 50% 20% 9% 40% 51%
Welfare Trend
Improving Improving Declining
The improvement of welfare condition in inner city (Kelurahan Kemlayan) is accounted for urban economic agglomeration. Kemlayan is a centre of economic activities of Kota Surakarta. There located various economic institutions; banks, shopping centre, modern market, textile industries etc. This condition opens up economic opportunity for Kemlayan people. Unfortunately, only the rich and medium group could tap the most benefit from this opportunity. Whilst for the poor, their welfare level has only slightly improved. Most of them are still working in informal sector, becoming street vendors, selling food to shop attendants, or working as parking attendants in the shopping centre. Opportunities for them to have more permanent job for example as shop attendants are also limited, as it is mostly occupied by migrants.
5 The names of the groups are: the very rich/rich, the middle/medium group and the poor/very poor group. There might be similarities of differences regarding the number and name of the group for each kelurahan.

The SMERU Research Institute 11
In Kelurahan Mojosongo, the arrival of new middle income groups to the area has changed the structure of welfare condition. There is more medium welfare group now than five years ago. The new medium group mostly works as civil servants or private employees, and live in new housing complexes. This condition has opened up economic opportunity for the poor, although they are still working in the informal sector. Distribution of Poor People The spatial distribution of poor people either in city level or in kelurahan level shows similar pattern. From the spatial mapping at city level, we can see that poor people are living scattered thought-out the city, with pockets of poverty found in several locations, such as in the inner city or along the rivers banks.
Figure 7 Overlay Map: Number of Households in Slum Areas in Kota Surakarta

The SMERU Research Institute 12
In kelurahan level, the spatial distribution of the urban poor shows similar pattern; some of the poor people are living in regular settlement along with other welfare group, but at the same time, there are also concentrations of the poor in certain areas. In the three PPA kelurahan, poor people concentrated in areas such as on illegal land (owned by the government), on an empty unused land (owned by private), or along the rivers. As seen in social mapping result of PPA in Kelurahan Sangkrah, the poor people (in red dot) are concentrated on several areas: along the river and on the land owned by PT.KAI. Generally, they choose to settle there as they have no means to access more permanent or livable settlement in other locations. The distance from their places of work also becomes their consideration. This map also shows that the poor are very prone to flood and eviction due to their house location.
Figure 8. Social Map of Kelurahan Sangkrah, Kota Surakarta
Characteristics of Migrants As migration is one of the phenomenon that makes up urban character, understanding of its characteristics is essential to further understand the condition and dynamic of poverty. Unfortunately, data related to this is unavailable widely at the city level, and is limited to the number of new in-migrants in each kelurahan. The PPA method tries to further reveal the characteristics of migrants in the three PPA kelurahan. From the exercises, the common characteristics of the migrants are:

The SMERU Research Institute 13
� Most of them are coming from the areas around the former Karisidenan of Surakarta. A small portion of them come from farther areas, even from out of the country.
� Usually, they come to look for work, to find a place to live or to continue education. For instance, migrants in Kelurahan Kemlayan are jobseekers/workers in stores located in the kelurahan, or school students or dance school students as Kelurahan Kemlayan is also the center of culture and the center of the development of traditional art and culture.
� The length of stay of these migrants varies. Some have been in the kelurahan for only a number of weeks or months; some have been there for years.
� Most migrants are living in the new development area in Banjarsari district, especially in Kelurahan Mojosongo and Kadipiro, as there is still vast amount of space in the area. In these two kelurahan, the migrants are dominated by middle-level groups (civil servants, entrepreneurs, and others); they come from the surrounding areas, such as Sukoharjo and Boyolali, and looking for a new settlement area.
Figure 9 Map of Distribution of Migrants in Kota Surakarta in 2009
� Migrants that are living in other areas, such as in the inner the city and along the rivers side,
such as in Kecamatan Serengan and Kecamatan Pasar Kliwon, usually are low income group that look for job in informal sectors, such as becoming food sellers, peddlers and construction workers.

The SMERU Research Institute 14
� Most migrants live scattered in the kelurahan. The condition of their home depends on the condition of their welfare: Some have their own house, while some others live in rented houses or in rented rooms.
Characteristics and Dynamics of The Livelihood Assets of The Urban Poor The welfare condition of the general community and the poor can be seen from the conditions of livelihood assets or capital that they possess. In Sustainable Livelihood Framework, livelihood assets are comprised of five types of assets (pentagonal assets) that is: human capital, natural capital, economic/financial capital, physical/infrastructures capital and social capital. The following sections describe the characteristics and the condition of livelihood assets of the poor, compare to asset owned by general population. Each asset is related to one another and cannot stand by itself. It also discusses the capabilities and limitations of those assets in. The better and stronger the asset conditions, will better help the poor in reducing vulnerabilities and achieving sustainable livelihood. Human Capital The result of the discussions in three Participatory Poverty Analysis (PPA) kelurahan show that the condition of human capital, especially the education level of the poor is still low, compared to that of the general population. Most poor people only finish elementary school and drop out from junior high schools, and most of them face difficulty in paying for their children’s education after elementary schools. Even though various types of education assistance, either from the central government with programs, such as School Operational Assistance (BOS), or from Surakarta government via Surakarta People’s Education Assistance (BPMKS) program, can help parents pay for their children’s education and make the education level of children today better than that of the previous generation, there are still school expenses which the poor have problem paying for, such as expenses for books, Student Worksheet (LKS), transportation and other expenses especially in the beginning of the school year. These expenses in certain period even become the source of vulnerability for the poor. The PPA result also reveals that besides the low level of education, the poor also lack of skills. The combination of these two conditions drives the poor people to mostly work in informal sectors, identified by their uncertainty and fluctuating income. They work either as peddlers, construction workers and others, or they do any odd jobs they can get. Yet, within the last five years, health condition and service, especially for poor people, show a sign of improvement. This is due to among others the health assistance given by Surakarta administration, trough PKMS program, targeting at the poor and near poor. The program adds to the central government-sponsored social protection program for healthca re (Jamkesmas). But, similar to education, the urban poor still need to pay for expenses for healthcare which the programs do not cover, such as transportation cost to reach the hospital or clinic, and care for patients after they are released from the hospital. To fulfill theses needs, the poor usually borrow money from their neighbors or from mobile cooperatives or even loan shark. Sometimes this also becomes a source of vulnerability to them. Natural Capital The result of PPA reveals that spatial dimension—in this case the location of the kelurahan—plays a role in the condition of natural capital of the people, especially the poor. The conditions of the natural resources in Kelurahan Kemlayan which is located

The SMERU Research Institute 15
in the inner city, and the location of Kelurahan Sangkrah, which lies next to the river, tend to be limited. Yet, natural resources in Kelurahan Mojosongo, which is located in the peri urban, are somewhat better than those of the previously mentioned kelurahan. The location of Kelurahan Kemlayan in inner city, which is also the center of the city’s economy, lends to its having limited natural resources in terms of space for dwelling, work facilities, public spaces and green open space. In this kelurahan, especially in the neighborhood council (RW) with high concentration of poor people, we can find very small houses huddled in narrow alleys. Most people living in this areas bear the status of ’magersari’, living on someone else’s property and making their place of living a place of/a facility for supporting their work. The natural resources in Kelurahan Sangkrah, located very close from the edge of the river, are slightly better than those in Kemlayan kelurahan. Despite the bigger area of kelurahan, its location by Bengawan Solo River makes the people living there prone to flood. And the high density, especially due to the arrival of new migrant, makes space for living even more limited. This result in houses built very close to the water or even above the river. The river is also affected by the high amount of waste from households and factory unceremoniously dumped into the river. In Kelurahan Mojosongo, which is located in the peri urban and is a new development area, there is still wide open space. The available space is for new housing complexes inhabited by civil servants and other middle level groups from Surakarta and nearby towns, is used for final garbage disposal site (TPA Putri Cempo), and is used as relocation place for victims of Bengawan Solo flood disaster. The urban population in the kelurahan holds only limited ownership of land, which is the area of their houses which is generally very small. Economic and Financial Capital Generally, the economic and financial resources/assets owned by the urban poor in the three PPA kelurahan are more limited than those owned by general population. As mentioned above, the limited levels of education and skills are the major factor which hinders urban poor from securing a job in any of the formal sectors, or a job with steady and adequate income to fulfill daily needs. Jobs in informal sectors usually are peddlers, becak (pedicab) drivers, ojek (motorcycle taxi) drivers, construction workers, handymen, scavengers and others. On the other hand, the livelihood of more prosperous groups in the society, or middle- and high-income people, are among others civil servants, private employees, entrepreneurs, big-scale traders and various professional occupations. The results of PPA in the three kelurahan show that there are similarities in the types of livelihood usually taken by the urban poor, despite some differences. There is a concentration of several types of jobs based on the location of the kelurahan. Many of the poor people in Kelurahan Kemlayan, especially the men, work as parking attendance at markets or shopping centers which are found along the main street cutting across the kelurahan. And, the women usually open street stalls selling food in front of the shopping centers. In kelurahan Sangkrah, as the location is close to several markets and center of wholesale clothes, many of the people, especially the women from the poor families, work as sliwir workers, sewing workers, screen printing workers, and small peddlers/traders. Many poor people living along the river banks or along the dam work as scavengers. Similar type of job is also the choice of urban poor in Kelurahan Mojosongo. The existence of final garbage disposal site makes scavenging the major livelihood for most of the poor. The wide available area also makes it possible for the people to run a small handicraft business, such as birdcage handicraft and home industries producing fermented soybean cake or tofu.

The SMERU Research Institute 16
The poor people have a very limited access to financial assistance for working capital. Generally, the poor faced difficulty when trying to gain access to formal financial institutions, such as bank. They can only go to the cooperatives or plecit bank/loan sharks/mobile bank as the requirements are easy and they don’t ask for collateral. The unavailable of collateral shows that the poor cannot accumulate asset, in the form of house, bank savings, certified land or others. This is due to, among others, their limited income. Physical and Infrastructures Capital The results of PPA in the three kelurahan show that there has been improvement in the condition of physical and infrastructures condition within the last five years; however, the poor still have only limited access especially to clean water and electricity. The improvement is evident in the household level with the condition of the houses being better than that in the past, and with the rising number of permanent-type houses. The improvement is also happen in the community level. For example, the conditions of the roads and the street lighting are improving, and the number of public toilet is increasing. The conditions of several public facilities, such as schools and health service facilities (Public Health Centers and neighborhood health centers), are also improving. Yet, the condition of the neighborhoods where there is a high concentration of poor people is still not well managed, shabby, and is often flooded. Besides, the poor still have limited access to electricity. Most of them still ‘hitch’ electricity from their neighbors. Clean water facilities also have not reached the homes of the poor communities. Usually they make us of the public hydrants to get clean water. Social Capital Social capital is the strongest asset owned by the poor community. The people in the three PPA kelurahan said that there is a strong social bonding among the neighbors, and people help each other in times of need. The level of trust among them is also high. In Kelurahan Kemlayan, the spirit of gotong royong or mutual aid is still alive. Blok Konco or friendship groups, built for years, also still exist. In Kelurahan Sangkrah, conflicts and fights which used to happen among the young adults have stopped happening. Only in Kelurahan Mojosongo does the social capital face a challenge. The condition of social capital tends to be not as good as it was five years ago. This is, especially, related to the high number of new migrants in the area.
Kelurahan Mojosongo Kelurahan Kemlayan Kelurahan Sangkrah
Figure 10. Livelihood Asset Condition of Kelurahan PPA in Kota Surakarta

The SMERU Research Institute 17
The strength of social capital in urban areas is influenced among others by spatial proximity. The densely populated and physically cramped housing area of the poor community, leading to limited private space and public space, plays a role in creating ‘social closeness.’ Nevertheless, we need to take into account the characteristic of social capital owned by this poor community. Is it a bonding social capital which functions more as a social safety net in difficult times? Or, is it a social capital which functions as a ’linking social capital’, which can help them to free themselves from the trap of poverty? Spatial Dimension of Poverty Besides the condition of the livelihood of poor people, the result of PPA also reveals several poverty issues that have spatial dimensions. There are specific issues emerged from certain location, that is in inner city, in peri-urban and along the river side, but there are also general spatial issue that become issues at the city level. Spatial poverty issues at the city level comprise of: (1) providing and managing urban settlement, especially for the poor, including settlement in slum and illegal areas, (2) making sure the availability of clean water provision of sanitation and clean water facilities for the poor, (3) garbage collection and management system at kelurahan and city level, (4) risk management of potential eviction and relocation, (5) economic integration of poor people into more sustainable economic sector in the city (6) disaster management for flood and fire. Seen deeper, the spatial dimension of poverty issues are very much related to the condition of people’s livelihood assets. The spatial dimension of poverty are actually reflect the condition of the livelihood assets owned by the poor, which are still limited and needs to be strengthened. Issues of settlement, eviction, sanitation and clean drinking water, and garbage and disaster management are issues that are related to the condition of natural capital owned by the poor. The issues of economic integration reflect the problem of the limitation in the economic and financial capital of the poor. The matrix below shows the range of spatial dimension issues of poverty at the city level and kelurahan level.

The SMERU Research Institute 18
Table 4. Issues of Spatial Poverty in Kota Surakarta
Kelurahan Level City Level
Mojosongo Kelurahan Sangkrah Kelurahan Kemlayan Kelurahan
Issues in The City Level: 1. Providing and Managing
settlement especially for the poor a. in inner city, in peri-urban b. In illegal settlements and
slum areas
- Development of middle-level housing complexes,
attracting migrants from inside of and outside of Surakarta.
- Relocation destination for people affected by Bengawan Solo river rehabilitation program.
- Southern part of kelurahan (poor people settlement): very densely populated, slum and and prone to fire.
- There are flood-prone settlements, especially
along the rivers � inhabited by poor people (many rivers end in this area)
- Poor people also live in groups on a land owned by PT.KAI. They have no certificate, but they hold staying permit from PT.KAI � unable to accumulate assets
- Many poor people live on someone
else’s house or land (magersari). - The condition of settlement and
neighborhood in magersari area: very dense and dirty
- There is only limited land for settlement, productive activities, (at homes) and public space/open green open
2. Availability of clean water facility and sanitation infrastructure n in slum areas
- Quality of water from water company (PAM) is quite low (colored with rust residue)
- Sanitation somewhat bad around garbage landfills and some of the market area
- There has been an outbreak of dengue fever in 2010.
- The location of the very densely populated slum areas makes it difficult to install clean water and sanitation facility, so that it needs communal action to settle the matter.
- Limited clean water and sanitation facility, still relying on public facilities.
- Some still ‘hitch’ electricity from their neighbors.
3. Garbage collection and management
a. Garbage management at community/kelurahan level
b. Garbage management at the city level
- Final waste disposal site for all Surakarta area (TPA Putri Cempo).
- Become the place to earn livelihood for scavengers, and for livestock grazing ground.
- Many scavengers’ heap scraps on the settlement area intensifying possibility of dengue fever outbreak in the wet season.
- Liquid waste disposal through rivers from the city has the potential of creating health-related risks.
4. Risk management of potential eviction and relocation of poor people related to: o Problem of land ownership o Future spatial plan for area
development (new settlement, center of economic activities etc.)
- Destination for relocation, yet the local people never been included in the planning process, and no special working group for its management � Some relocated settlers mingle with local people; potential of social gap, security problems and conflicts.
- There has not been any establishment of new neighborhood association/council (RT/RW) in the relocation area; relocated settlers cannot immediately get their new ID cards/family cards � Indicating no readiness to accept relocated settlers
- The result is that relocated settlers don’t have full access to development programs in the kelurahan level, e.g. Rice For The Poor (Raskin) program.
- Some relocated settlers live on a basin area in RW 29, which is prone to become inundation area.
- Relocation process in the areas along the rivers and in the areas where government is building a new dam faces problem in funding and negotiation between the people and the city administration.
- There is a plan of turning areas along Bengawan Solo River into open green space.
- There is a possibility that the poor who ‘magersari’ will be asked to move by landowners/house owners. Some give compensation; some do not.

The SMERU Research Institute 19
Kelurahan Level City Level
Mojosongo Kelurahan Sangkrah Kelurahan Kemlayan Kelurahan
5. Economic integration for poor people into more sustainable urban economy
- The location of the kelurahan which is quite far from the center of the city makes relocated settlers who previously work in informal sector in inner city have to bear high transportation cost.
- There is no new livelihood available in the kelurahan for relocated settlers Relocation process did not consider people’s livelihood condition
- Sangkrah is located near to center of trade, such as Pasar Gede and Pasar Klewer. This makes it easier for poor people to get access to economy.
- The problem lies in the work pattern. They still rely on doing odd jobs, or working as informal construction workers � Limited income, difficulty in accumulating assets.
- The plan of the city administration to open ‘night market’ around the area where poor people make a living
o Possibility of eviction o Loss of place/location of work o Tougher competition
- Providing permanent job fields for the locals
6. Disaster management (flood and fire)
- Development of housing complex for middle-level groups of the people in the north area of the city was not followed by the construction of good drainage system, causing flood in the south area, which is mostly inhabited by low-level groups/poor people.
- With the construction of a new dam (in 1980’s), there have been less areas suffering from flood, but those, who are, are in the worse condition
- Frequency of flood increases, causing damage to assets and making them lose working time.
- There are three floodgates, which are part of the city’s drainage and flood control system.
- Flood in the densely populated and slum areas.

The SMERU Research Institute 20
2.2 Kota Makassar 2.2.1 General Conditions and Poverty Trend The city of Makassar holds development vision and slogan, which are closely related to its position as the metropolis in East Indonesia. With its position, Makassar aims at becoming the ’Center Point of Indonesia’, as the center of business and trade in eastern Indonesia, and becoming economic ’hub’ and center of the development of maritime economy. The vision of the development of Makassar is also integrated with that of Mamminasata region, including in developing roads and transportation facilities, in providing clean water, in developing drainage and IPAL system, TPA, and other regional development plans. In this respect Makassar becomes the center of business with the surrounding regencies acting as buffer areas.6 Based on 2010 Census, the population of Makassar is 1,339,374 people. The city of Makassar has the highest population density in South Sulawesi Province (7,620 people/km2). In the city level, the highest density can be found in the middle of the city—that is in Kecamatan Makassar, and in several kecamatan located at the city periphery (suburb) and close to the shore. The names of the kecamatan are Mariso and Bontoala (Makassar dalam Angka, 2009). Similar with Surakarta, Makassar experiences a rapid population growth in the years 2009 and 2010. From 2007 until 2009, the average rate of population growth was 1.49; however, in the years of 2009 and 2010 the number jumped to 5.27. The jump was most likely the result of improvement in population calculation system. Another possible explanation is the significant volume of migrants coming to Makassar. Unfortunately there is no data to support this, either in the city level or in the provincial level. From the economic structure of the city, most of Makassar's regional gross domestic income (PDRB) comes from trade, hotel and restaurant/hospitality sectors (29.56%), and processing industry (21.18%). Yet, most of the workforce works in farming, forestry, hunting and fishing (58%). Other sectors which absorb a big amount of workforce are transportation, warehouses and communication (23%). Seen from the structure of the workforce, 58.50% of the workforces are in formal sectors, and 41.50% work in informal sectors.
As a metropolis, one of problems faced by the city is poverty. In the last five years the number of poor people in Makassar has been fluctuating, with the highest recorded in 2006 (Table 4) The high number of poor people in that year was caused presumably by gasoline price hike of 2005, which was followed by price hike of several basic needs. After showing a decline in 2007 and in 2008, the number of poor once again rose in 2009 even though the figure was still below that in 2006. This might be due to the global financial crisis of 2008-2009, which affected export and import sector. The rising number of poor people was accompanied by the widening gap in the income distribution as shown in the increasing number of gini coefficient from 0.31 (2008) to 0.42 (2009).
6Mamminasata region consists of Maros district (industrial, housing, research and development areas), Gowa district (education, horticulture and housing areas), Takalar district(sector development area), Makassar city (center of business)
The SMERU Research Institute 21
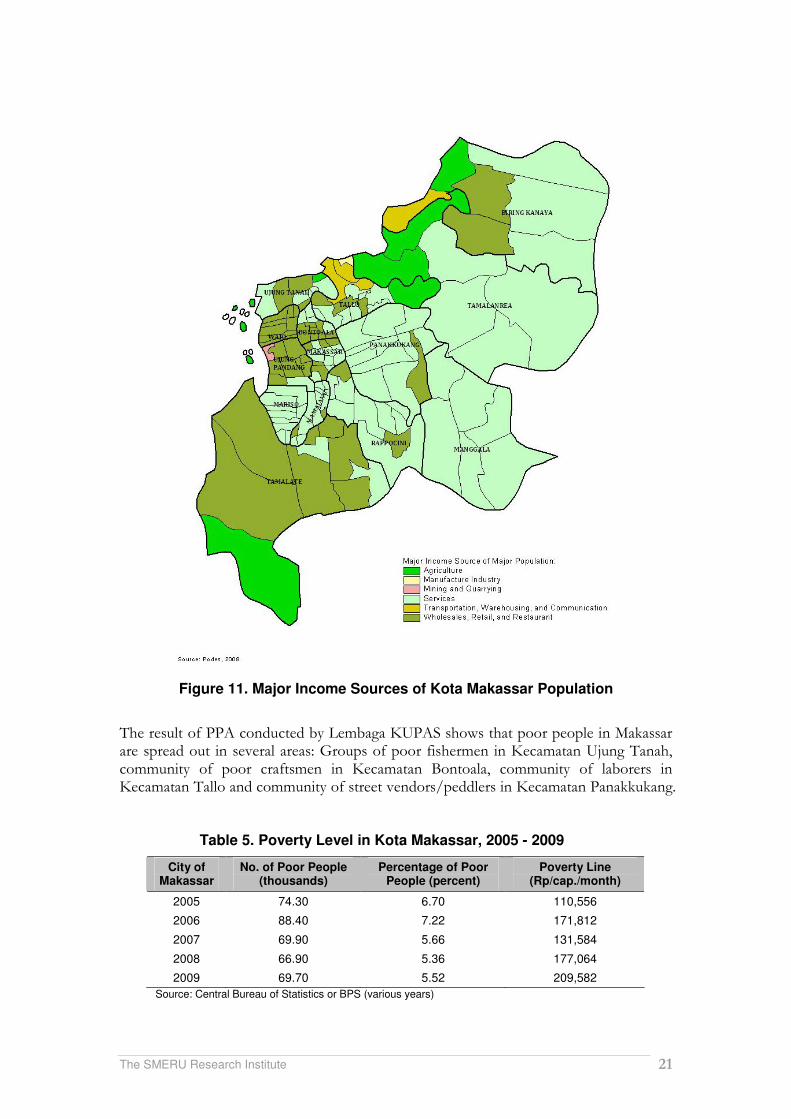
Figure 11. Major Income Sources of Kota Makassar Population
The result of PPA conducted by Lembaga KUPAS shows that poor people in Makassar are spread out in several areas: Groups of poor fishermen in Kecamatan Ujung Tanah, community of poor craftsmen in Kecamatan Bontoala, community of laborers in Kecamatan Tallo and community of street vendors/peddlers in Kecamatan Panakkukang.
Table 5. Poverty Level in Kota Makassar, 2005 - 2009
City of Makassar
No. of Poor People (thousands)
Percentage of Poor People (percent)
Poverty Line (Rp/cap./month)
2005 74.30 6.70 110,556
2006 88.40 7.22 171,812
2007 69.90 5.66 131,584
2008 66.90 5.36 177,064
2009 69.70 5.52 209,582
Source: Central Bureau of Statistics or BPS (various years)

The SMERU Research Institute 22
Table 7. Issues of Spatial Poverty in Kota Makassar
Kelurahan Level City level
Kelurahan Daya Kelurahan Tallo Kelurahan Barabaraya Utara
1. Issues on urban settlement management and availability.
o City policies on providing and managing settlement for poor resident in inner city and peri urban areas.
o Slum and illegal settlements management and policies
o Risk management and disasters mitigation policy for high risk settlements (densely populated areas, flooding prone areas along canal banks and swamp and settlements along the coastline.)
- Illegal swamp transformation into
settlements areas. - As new economic centers growth area
in Makassar (Daya Trade Center and Makassar Industrial Area), Daya will become prime migrant destination for both Makassar resident and migrant form surrounding districts. This condition calls for more comprehensive settlement planning to anticipate influx of new migrant and to avoid, new slum and illegal settlement growth and uncontrollable sprawling. Current illegal settlement area on top of swamp is vulnerable to flood and irregular garbage collection, posing significant health risk.
- Illegal above sea settlements
which vulnerable to natural disasters, extreme weather and evictions.
- Significant fire hazard in a densely populated areas,
- Illegal slum settlements on ex
animal slaughtering site and amusement park. Both areas owned by local private business.
- Fire and natural disasters risk management and mitigation plan in densely populated areas.
2. Availability of clean water and sanitation infrastructure and services in inner city and peri urban slum areas.
- Lack of access to clean water and sanitation infrastructure as a result of settlement illegal status.
- Increase in flood frequency and duration, leading to the loss of assets, opportunity to work and health shocks.
- Lack of access to clean water for public sanitation infrastructure, such as public toilet, leading to the pervasive practice of open defecation to sea.
- Significant health risk as a result of open defecation to sea. During the tide, the sea water containing waste can rise and settled in the populated areas along the coastline.
- Lack of access to clean water and waste management system.
- Presence of significant number of small chicken slaughtering business in the areas without special sanitation system, posing significant environmental and health risk.

The SMERU Research Institute 23
Kelurahan Level City level
Kelurahan Daya Kelurahan Tallo Kelurahan Barabaraya Utara
3. Garbage collection and Management systems a. Community level waste and garbage
management b. City level waste and garbage
management.
- Uncontrolled garbage dumping in unused land, posing significant health risk during rainy seasons and in the case of flooding.
- Industrial and household pollution in the river and coastal areas, decreasing fish catch coastal marine ecosystem.
- Lack to non existent garbage collection and disposal system in several coastal area settlements, leading to garbage accumulation beneath the stilted houses, posing very significant health risk.
- Disposal of animal remains in the middle of illegal settlements area, posing very high health hazard.
- No garbage collection and disposal systems in illegal settlements.
4. Risk of settlement eviction and relocation related to : o Settlement Land ownership status
(private or public ownership) o Future area development plan
- Problems of poor people access to various social assistance program in relocation area.
- Future urban area development plan designate Tallo area as harbor areas, this brings questions on how this plan will affect Tallo’s livelihood which still dominated by fishing activities.
- Threat of evictions by city government and the private land owner.
5. Economic integration of the poor into more sustainable urban economic activity
- Issues on access to formal employment and sustainable economic activities for poor people
- Degradation of coastal and river condition that no longer can sustain fishermen livelihood, while at the same time, having limited options to switch livelihood as a result of low education and absence of alternative skills.
- Issues on the access of the poor to permanent and sustainable jobs at the new economic centers.

The SMERU Research Institute 24
2.2.2 Dynamics of People's Livelihood Assets and Spatial Dimensions of Urban Poverty: Result of Participatory Poverty Assessment
To provide a complete picture of the condition of poverty in the city level, activities of PPA in Makassar was conducted in three kelurahans. These kelurahans were chosen for the same reasons as those chosen for PPA in Surakarta: Their locations in the inner city (Kelurahan Barabaraya Utara); at the edge of the city or in the suburb, which is a new development area (Daya kelurahan); and along the rivers/close to the shore (Tallo kelurahan) (See Appendix 2. Profile of PPA Kelurahans in Makassar). Below are some of the results. Welfare Trend and Proportion of The Urban Poor The welfare condition in the three PPA kelurahan shows that there has been an improvement within the last five years. In 2011, the proportion of groups of poor people in the three kelurahan decreases, with the biggest recorded in Kelurahan Barabaraya Utara, located in the inner city. In Kelurahan Daya, there has only been a slight decrease in the proportion of poor group. In Keluharan Tallo, the proportion of its very poor group of people has even remained constant, thus show stagnancy in welfare trend.
Table 6. Welfare Trend in PPA Kelurahan in Makassar, 2006 - 2011
Kelurahan Barabaraya Utara Daya Tallo
Group/ Year
Rich Medium Poor Rich Medium Rich Rich Medium Poor Very Poor
2006 10% 20% 70% 10% 55% 35% 6% 20% 46% 28%
2011 15% 30% 55% 20% 50% 30% 6% 23% 43% 28%
Welfare tendency
Improving Improving, except medium
group Stagnant
The change in the condition of welfare in the three PPA kelurahans shows a similar pattern with that in Surakarta. The improvement of the welfare of the poor people in Kelurahan Kelurahan Barabaraya Utarais closely related to its position in the inner city. Its close location to the center of economy and the intensity of infrastructure development provide ample job fields for the poor in the kelurahan, although most still work in informal sectors. They work as odd job laborers, pedicab drivers, street food vendors or others. At the same time the welfare condition of poor people in Kelurahan Tallo, where the poor mostly work as fishermen or day laborers and rely on natural resources, i.e. the sea and the rivers, does not show much improvement. On the contrary, they face vulnerability factor as their catch decreases due to the environmental damage in the coastal area and of Tallo River. In Kelurahan Daya, the existence of KIMA industrial compound and the migrants who work in the industry have helped create new job fields, especially for the local people. Besides working as laborers or doing other types of informal works, they provide services to the new migrants, such as renting rooms or selling foods. Distribution of Poor People The distribution of poor people in Makassar shows the same pattern as that in Surakarta. In the city level, the poor live spread out and also concentrated on certain areas, such as

The SMERU Research Institute 25
in the middle of the city, along the river/close to the ocean or on illegal lands, and also based on the typology of the livelihood.
Figure 12. Overlay Map: Number of Families in Slum Areas in Kota Makassar
In kelurahan level, there are also concentrations of poor people. As seen in the social map of Kelurahan Barabaraya Utara, there are concentrations of poor people in two main areas: In RW 1 which in the past was a recreation park with status of land which is still unclear until now; and in RW 4 which in the past was where a slaughterhouse was located. Now the ground is still used to dump waste from animal slaughter. Both areas are inhabited by low-income migrants from areas around Makassar. Many scavengers live in RW 1, and many people working in informal sectors, such as pedicab drivers, street food vendors, live in RW 4. In Kelurahan Tallo we can find similar pattern of settlement. Poor people live in close space along Tallo River. Mostly they are new comers who generally come from regions such as Maros, Takalar, Jeneponto, and others. In the beginning, they rent a house or live with their relatives until they can get their own house or live in stilt house above the seawater.

The SMERU Research Institute 26
Figure 13. Social Map in Kelurahan Barabaraya Utara, Kota Makassar
Characteristics of Migrants Makassar has become the destination for people migrating from other regions for quite a long time. This can be seen from the many number of settlers living in Makassar since tens of years ago. They came from different regions, from those closer by, such as Bone, Toraja, Jeneponto, Takalar, Maros, Gowa, to those on other islands, such as from Flores (East Nusa Tenggara) and from Java. Usually they come to find a better life. In the three PPA kelurahan, most migrant work in informal sectors. They work as street vendors, start their own home industry or work as construction workers. But, there are also migrant who work in formal sectors, such as those in Kelurahan Daya. These migrants work as factory workers, either as full-time workers or contract workers. Similar to those in Surakarta, the migrant usually live spread out in a certain kelurahan, living in a rented house of a rented room. Characteristics and Dynamics of The Livelihood Assets of The Urban Poor The following is the summary of the result of PPA concerning the dynamics of the livelihood assets of poor people in the three kelurahan. Human Capital The condition of human capital of poor people related to level of education is generally low. In Tallo, kelurahan data shows that most of Tallo residents have elementary school education, with the highest being senior high school. In Kelurahan Daya, the education level of local or native residents is lower than that of the new comers. In

The SMERU Research Institute 27
Kelurahan Barabaraya Utara, even though at present the education level of poor people, especially children and teenagers, are better than that of the previous generation, with many of them finish elementary school and junior high school, there is a concern about their inability to continue their education to higher level, senior high school and university. In these three kelurahan, the main problem is transportation cost as the locations of senior high schools are usually in other kecamatan. The low education level makes poor people cannot get access to jobs in formal sector which usually require certain levels of education. For health condition, as described by female groups in the three PPA kelurahan, the present condition is better. Improvement is also felt in public health service. Now, when a person is sick, he or she can go to a neighborhood health center or a public health center, using healthcare assistance from central government through Jamkesmas (Public Health Insurance), and also from local government through Jamkesda (Regional Health Insurance). Despite this, in several areas, such as in Kelurahan Daya, the sanitary condition in the neighborhood is bad, especially in poor neighborhood. This makes an outbreak of certain diseases, such as diarrhea, often occurs. Natural Capital The condition and availability of natural resources to support the livelihood of the poor in the three PPA kelurahan tend to be low. In Kelurahan Barabaraya Utara, this is located in the middle of the city, faces problem of limited land for settlement and for working, while the number of people continues to rise. The result is that residents who have home industries do their activities inside their homes or in the yard. The condition, up to a point, disrupts people’s lives in the area, especially their health aspect as this relates to waste from those industries, such as waste from chicken slaughter, chemical waste and others. In Kelurahan Daya, the wide open land should be a good asset for poor people, but unfortunately within the last few years there has been quite an extensive change in land use, from farm/plantation to trade centers. This directly brings negative impact to poor people because many of them still work as farmers. In Kelurahan Tallo, on the other hand, has the most limited natural resources, and the area is now facing very big vulnerability factors. From the observation and from the result of PPA, at present the conditions of Tallo River and the coastal area are more and more damaged, especially due to pollution from waste from industries from factories located at the headstream of Tallo River. The condition very much affects the livelihood of poor people as most of them rely on their livelihood from the river and the sea. Besides having limited access to land, poor people also have only limited access to legal space for residence. Generally poor people still live with their parents, with their relatives or in a rented house/room, with unclear land ownership status resulting in their inability to own certificate of the land they live on. Without ownership right to the land, they cannot do any renovation to their dwelling places. Many of them still live in shanty houses with tin roof. This leads to the condition of the settlement becoming shabby and untended. Areas with high concentration of poor people are also prone to flood and fire. Economic and Financial Capital In the three PPA kelurahan, the main livelihood of the poor people is in informal sectors, with job characterizations different for each location. In Kelurahan Barabaraya Utara, many poor people work as street vendors, construction workers and pedicab drivers in the middle of the city. The poor people in Kelurahan Tallo work as

The SMERU Research Institute 28
fishermen, fishing workers and workers for other odd jobs. In Kelurahan Daya, many of the poor people here work in KIMA industry by becoming daily laborers, based workers or motorcycle taxi drivers. With the income from these jobs, they cannot fully provide for their family, especially in the middle of the rising cost of basic needs. Usually, poor people need to allocate more working time and get more of their family members to work, the females and sometimes even the children/teens, to make ends meet. And, uncertain climate condition and frequency of rainfalls which cannot be determined make several jobs vulnerable to bringing them less income. When it rains, construction workers, street vendors, pedicab or motorcycle taxi drivers cannot work. The rising number of new migrants into the areas also makes the competition become stiffer amongst workers. With this condition, it is very difficult for poor people to accumulate their assets, either land, house or production materials. Access to sources of capital in the community level is also limited. Despite the running funding program provided by PNPM, poor people still cannot reach it and they cannot use it to help make ends meet. The result is that many of them rely on informal financial resources, such as mobile banks or moneylenders, as their source of capital, or to get financial help in case of emergency. Physical and Infrastructure Capital Physical and infrastructure conditions in the three PPA kelurahan tend to show improvements. Through infrastructure development programs, at present almost all roads in the kelurahan—main roads or alleyways—already use paving blocks. Yet, the problem lies in the maintenance. In Kelurahan Daya, the roads have begun to show damages as they are often flooded. In Kelurahan Tallo, the roads also face the potential of quickly getting damaged because many big heavy trucks often pass by these roads. In Kelurahan Barabaraya Utara, the problem is in street lights, which are only a few. The lights are needed to help curb the number of crimes. Physical and infrastructure facilities in the areas with high concentration of poor people are still very limited. The main problem is the minimum clean water and private sanitation facilities. Many people still use public facilities. In several areas, there are no private electrical connections; many of the houses still ‘hitch’ electricity from their neighbors. This helps result in the condition of the settlement becoming shabby and be prone to flood. The city administration work together with the private sectors to upgrade the condition of the neighborhoods, yet the upgrading drive somehow has never reached areas with high concentration of poor people due to problems in the residence status and land ownership. Social Capital Just like in Surakarta, social capital is the strongest asset from the five livelihood assets owned by the poor people. One underlying factor is local culture in which people still hold on to the tradition of “Sipakatau”—feeling of mutual respect—as the discussion held in Kelurahan Daya revealed. Despite the difference of ethnicities of the people living in one area, they still practice mutual aid (gotong royong) and help each other in the events such as deaths, wedding or others. Yet, as revealed from discussion held in Kelurahan Barabaraya Utara, the poor people in certain times, such as when a member of

The SMERU Research Institute 29
a family falls ill, loses a job, needs to borrow money, still lack social connection; they still deem these internal problems of every household. The decreasing number of conflicts in the society also strengthens the social connection, for example in Kelurahan Barabaraya Utara which was the hotbed for security-threatening conflicts, especially between teenagers. At present, the condition is much better due to a better security system, better understanding of the people about the need to maintain security and peace in the community, and the availability of jobs for youngsters/people who before were out of job.
Kelurahan Daya Kelurahan Barabaraya Utara Kelurahan Tallo
Figure 14. Livelihood Assets Condition of Kelurahan PPA in Makassar Issues Spatial Dimension of Poverty In Makassar, several issues of spatial poverty in the city level and in kelurahan level bear similarity with those in Surakarta. They are the issues of managing and providing settlements in inner city and in the peri urban, especially for poor people. They link to issues of eviction, clean water and sanitation, and economic integration of poor people to sustainable city economy. The underlying difference with the issues found in Surakarta is about waste/garbage management. In Makassar, waste management becomes a pretty dominant issue either in the city level or in the community level.
2.3 Vulnerability Factors Basically, the context of vulnerability refers to the situation accompanying shock, trends, and seasonality. It is a condition when a change in the livelihood of the people tends to be negative and can negatively affect the livelihood of an individual, a household, or even a city. In Surakarta and Makassar, the common vulnerability factor in the society refers to a situation when people face difficulties or fail in fulfilling their needs due to the unavailability of or dwindling resources. Or it is a situation when they can only obtain less income, or even when they do not have any source of income as the result of a catastrophe, climate-caused occurrences or predictable events which they fail to anticipate.

The SMERU Research Institute 30
2.3.1. Types, Levels, and Causes of Vulnerability Shock is an occurrence which cannot be predicted and which dramatically affects the condition of livelihood. A clear example is a natural disaster a plague in macro level, or in micro level, a family's breadwinner passing away or losing his or her job. Within the context of Surakarta and Makassar, we can see examples of vulnerability as the result of a shock in Kelurahan Sangkrah(Surakarta) and in Kelurahan Tallo(Makassar). In Kelurahan Sangkrahin Surakarta the heavy shock was the big flood of Bengawan Solo River (2006-2007). The big flood drowned houses along the river up to the roofs. In the individual level, the flood caused the loss of livelihood assets which the people have been collecting. In the community level, the flood made the people miss work, school, made them suffer from skin diseases and respiratory problems, while those who are safe from the disaster contributed their assets to help ease the burden of the victims. In the city level, flood disaster drove the city administration to issue the policy of relocating people who live on the river basins or along Bengawan Solo River. In the relocation process, people could choose from staying within Surakarta area or moving out of the city area. For Surakarta area, the relocation was focused on Mojosongo, which is a part of development area in the north. The big relocation process in Kelurahan Mojosongoalso influenced the livelihood of people who have been living in Mojosongo. For people of Tallo kelurahan, an occurrence which could be considered a shock was tornado attacks that happen in the period of January until March. In the wet season, there the coastal area of Makassar often sees occurrence of tornado. People of Kelurahan Tallowho live near the coast usually suffer the most from this, with their houses usually damaged. In family level they have to have money to renovate their houses. For the community, at least in the kelurahan level, tornado disaster force to work together to rebuild or to donate some of their assets. In the city level, there is no regulation or effective action to address this problem. For a micro-level shock in a family level, and whose impacts are usually very much felt, either in Makassar or in Surakarta, refers to unexpected event such as losing job (for laborers) and eviction (for those living on lands owned by other parties). Lay off for a breadwinner forces the family to try to survive any way they can. As for eviction, even though there has not been any occurrence yet, people agree that it will bring manifold impacts. Trends refer to changes which happen gradually, are predictable and will bring about negative impacts should people fail to anticipate them. Trends of changes that happen in Makassar and in Solo, which are related to general vulnerability, refer to rapid population growth, increasingly denser settlement, rising prices of basic needs, and degradation of natural resources which act as people’s supporting factors. Population growth caused by migration/urbanization leads to stiffer competition for securing jobs, either in formal sector or in informal sector. The highly populated area of settlement makes it more difficult to maintain security and also leads to problems related to health. The rising prices make it difficult for the people to fulfill their needs. And, the degradation of natural resources, especially in Tallo kelurahan, where most of the people work as fishermen, makes it difficult for these people to do their work. In the family level, these trends usually result in their life becoming ever more difficult as they have difficulty in fulfilling their basic needs. In the community level, the trends lead to more difficulty in managing the environment or the neighborhood. In the city level, these trends result in the emergence of slum areas in the city, which force the city administration to prepare special types of intervention.

The SMERU Research Institute 31
Seasonality, in the perspective of the people, is divided into two. They are seasonality driven by nature, and seasonality following culture. Nature-driven seasonality refers to season changes. Culturally-driven seasonality refers to certain times or period people agree on as holidays, season celebration, and other regular festivities or events. The idea of seasonality is changes that happen in certain period or times and are predictable. Yet, despite their predictability, they bring impacts to the livelihood of the people. In Makassar and in Surakarta, seasonality due to nature which brings about vulnerability is during the wet season. In wet season some people must switch work or even cannot work at all. This happens to certain types of sellers, laborers and fishermen. In wet season settlements located in swamp area in Makassar are flooded periodically. The examples of vulnerability related to cultural or regular/tradition-based seasonality are when people need to spend more money for fulfilling their needs during festive or holiday season. Season celebration is also included as vulnerability factor due to the same reason. Regular or periodic activities being part of vulnerability factor refer to extra cost people have to prepare, e.g. at the beginning of a new semester for families with school-age children. People in Makassar and in Solo agree that the cost of education is high and is increasing each year. 2.3.2. Vulnerable Groups Generally, all groups in the society are susceptible to changes in a form shock, trends, and seasonality. Both in Makassar and in Surakarta, groups of people who are considered the most susceptible are the poor, especially those working in informal sector. Furthermore, within the poor groups, mothers are considered the most vulnerable. The main reason is that they are the ones who usually need to manage the fulfillment of the family’s needs so that when some items of needs are not available, they are the ones who have to come up with the solution. The solution may be that they cut corners, they find work to add to family’s income, or they are forced to borrow money from any party to fulfill those needs. 2.3.3. Impacts of Vulnerability to Livelihood Assets For vulnerability within the context of a shock, as in the flood disaster in Surakarta, the impact is destructive. The big flood caused the victims to lose their assets, and damages to the infrastructures require some of them to begin their lives anew. The policy of the city administration of relocating those who suffer the most from the flood help them regain their lives back; however, in the context of psychology and access, we can say that they must start from scratch. A slight difference in Makassar is that due to the tornado, the people must put their lives back in order as they lost their livelihood assets. Vulnerability in the context of trends and seasonality is their weakening effects. For the people in Makassar and in Surakarta, various vulnerability conditions force the poor people to continuously live in debts, and sources of financial supports become more limited and are weakening. In term of human resources, the poor also cannot improve themselves as the high cost of education hinder them from sending their children to higher level of education. And, the worsening condition of the environment brings about bad sanitation. The effect is that they are susceptible to bad health and to catching diseases. Another impact is, as described by respondents, their failure in fulfilling their needs affects their psychological state: They are prone to depression and are easier to get ill.

The SMERU Research Institute 32
2.3.4. Vulnerability in Spatial Dimension In spatial context, problems faced by those who were susceptible to flood along Bengawan Solo River have been resolved with the relocation program launched by Surakarta administration. Yet, in the relocation area these people face problems of adapting to the new environment. Those who relocated in groups still have administrative problems, and they lose their access to government’s programs which before they have already registered to and had access to. This is because the administrative uncertainty, e.g. Raskin (Rice for the Poor) program. Furthermore, due to differences in life pattern, at present there is an indication of the birth of seeds of conflict between relocated settlers and the locals in Mojosongo kelurahan. The conflict has not yet manifested but if it is not handled as early as possible, this can grow into a latent threat. For people of Kelurahan Tallo in Makassar, who work as fishermen, they face tough condition as the natural resources which they depend on continue to deplete. In the future, they also will face difficulty if they are forced to quickly switch to a different way of making a living. Another spatial dimension is the fact that, both in Surakarta and in Makassar, there are still many people who live illegally on lands belonging to other parties. In Surakarta, those who live on other people’s lands are referred to as magersari. For these people the threat of eviction will always be there if the city administration cannot come up with specific solution to these problems. In several areas in Makassar, for example, we can already see conflicts which still cannot be solved. 2.3.5. Adaptive Strategy in Facing Vulnerability In facing vulnerability factors poor people in Surakarta and in Makassar adopt ways to survive the situations. Even though the events or occurrences happen repeatedly, their adaptive strategy continues to weaken as their resources become more limited. To face the vulnerability factors, the strategy employed by the people usually is relying on local resources, for example, borrowing money from plecit bank (daily bank). In several cases, their adaptive pattern is seen as extreme, for example, by not fulfilling the necessary needs for education or by cutting corners which in the long run weakening their resistance more to vulnerability factors which they must face regularly.

The SMERU Research Institute 33
III. THE INSTITUTIONAL FRAMEWORK OF POVERTY REDUCTION AND CITY SPATIAL PLANNING
Within the framework of Sustainable Livelihood analyses, the conditions of the poor’s livelihood assets, livelihood strategies and poverty reduction efforts are very much influenced by the structure and the process in those particular localities. These structure and process are referring to the conditions of the institutions, especially those related to city spatial planning and poverty reduction efforts. This chapter will focus on discussing the institutional arrangement and conditions in the cities of Surakarta and Makassar, including the process of urban spatial and development planning, institutional structures, stakeholder mapping of the main actors, and existing poverty reduction programs.
3.1 Regional Development Planning Process Directions of Regional Development The economic structure of both Makassar and Surakarta are dominated by service sectors; however, they have differing visions on the future development trajectories. This is evident from the interviews with key main stakeholder, including the Mayor and City Secretary. Surakarta has a vision of establishing itself as a green and cultured city, whereas Makassar has a vision of becoming a world class city based on local wisdom. The vision of the city of Surakarta is influenced by the rich cultural heritage the region is have , while the vision of the city of Makassar is influenced by its position as the center of economy and the gateway to Eastern Indonesia, with population three times that of Surakarta. These visions affect the direction of the city development. Surakarta in its development planning pays much focus on managing public spaces, such as city walk and night culinary tourism (galabo), whereas Makassar focuses on the development of the city’s economic infrastructures, following the vision of making Makassar a Centerpoint of Indonesia. The focus on economy is also evident in the number of shopping centers, shop houses complexes, and minimarkets which can be found in many places in Makassar. This is markedly different from the condition in Surakarta, where the mayor of Surakarta explicitly expressed his disagreement on the expansion of modern marketplaces, such as malls and minimarkets, in order to protect the existence of traditional markets.
Development Process In general, the development processes in both Surakarta and Makassar already complied to Law No. 25 2004 on National Development Planning System (SPPN). The formulation of the initial plan, the development planning discussion (Musrenbang), the formulation of the final plan, and the decision-making process of the development planning in both cities have also complied to the Regulation of Government of Indonesia No. 8/2008. The output of this planning process is Medium-term Regional Development Plan (RPJMD), Local Government Work Plan (RKPD), Strategic Plan (Renstra) and Working Plan of Regional Apparatus Work Unit (Renja SKPD).

The SMERU Research Institute 34
Formally, the musrenbang process in the formulation of RPJPD, RPJMD and RKPD, has provide significant space for government, private sectors, NGOs, academia and the people involvement. To strengthen this process, the government of Surakarta has issued Mayoral Regulation No. 27–A/2010 about the technical details on the process of development planning, including managing the involvement of non-government interest parties in musrenbang, either in sub-district level, district level or town/city level. In both cities, several non-government bodies, such as NGOs working on the field of budget and transparency advocacy, poverty, and women empowerment has focused its initiatives on monitoring and assisting public participation in the musrembang process.. Poverty Reduction Institutions Poverty reduction institutions in the regional level are specifically handled by Regional Poverty Reduction Team (TKPKD). The team has a cross agency and non governmental membership and established based on Presidential Regulation No. 13/2009 and Presidential Regulation No. 15/2010 on Coordination and Acceleration of Poverty Reduction, and Interior Minister Regulation No. 42/2010 on Provincial and Regency/Mayoralty Poverty Reduction Coordinating Team. The establishment of TKPKD team was intended to conduct planning, coordination, monitoring, evaluation and control of all the planning and implementation of poverty reduction program in the regions by formulating Regional Poverty Reduction Strategy (SPKD) document. TKPKD in Surakarta was established in 2010 based on Mayor Decree No. 412.6.05/72A/1/2010 on the Establishment of TKPK. In Makassar the team was established in 2009 based on Mayor Regulation No. 11/2009 on TKPK of the city of Makassar, and Mayor Decree No. 400/157/Kep/II/2009 on Work Group (Pokja) and Secretariat. The institutional structure of TKPKD, especially the position of the leader/chairperson and executing agency underwent several changes following changes that happened in the central government. In the beginning, the team leader was Head of the Region (Mayor), with the head of executing officer held by Head of Community Empowerment Board. Following the institutional change of TKPK in the national level, at present the head of the team in the regional level is Deputy Mayor, with Bappeda as the main Executing agency. In Surakarta and Makassar, the change in institutional structure forced the governing body and the members to make some adjustments and settle some coordination problems, which took some time. At the beginning of the establishment, TKPKD in both cities already formulated Regional Poverty Reduction Strategy (SPKD) documents, with different qualities of content. In Surakarta, based on the interview with one of the NGO working on the poverty issues, the first SPKD document was issued in 2007. The draft was formulated by one of the universities in the city. However, the document was considered not more than a formality: There was no participatory poverty assessment (PPA) and the content of the document did not exactly represent the conditions of the urban poor. Currently, TKPKD Surakarta is in the process of formulating and updating the SPKD using the result of PPA the team was conducting in one sub-district, including analysis on spatial issues of poverty. Besides SPKD, TKPKD in Surakarta also plans to formulate sub-district level RPJM. The result will contain analysis of poverty condition based on the sectoral and spatial issues and condition in sub district level. In Makassar, TKPKD has produced SPKD document for 2005-2009 period. At present, the new executing

The SMERU Research Institute 35
officer—the Social division of Bappeda—is in the process of updating the document, in collaboration with other TKPKD members including local NGO’s such as KUPAS and Yasmip. The poverty reduction in both cities has also been supported by the implementation of National Program for Community Empowerment (PNPM). The program produces several documents for poverty reduction measures in the sub-district level—Medium-term Planning for Poverty Reduction Program (PJM Pronangkis). The document contains poverty data, to the level of by name by address, and poverty reduction programs plan based on poverty analysis in the sub-district level. So far, PJM Pronangkis document is the one that accommodates most elements of spatial isses on its poverty analysis and program planning. At present, the government of Surakarta and Makassar are trying to synchronize various planning processes in the community level, as well as synchronizing PJM Pronangkis within the musrenbang planning system. The effort gets support in the form of the establishment of community independent coordinating forums. The forums aim at integrating and synchronizing the available planning documents with the implementation of musrembang. One of these is Forum Komunikasi Badan Keswadayaan Masyarakat (FK-BKM) or Community Enterprises Communication Forum from sub-district level to city level in Makassar. The forum tries to coordinate musrembang with PJM Pronangkis PNPM. There is also an informal forum known as Komunitas Belajar Perkotaan (KBP) or Urban Schooling Community. The forum is a place for government and non-government stakeholders, which especially discuss issues of poverty reduction in the city level. Generally, the integration processes between PJM-Pronangkis with musrembang process in the city level have not been optimum as FK-BKM is not yet well-consolidated in this city. Community Participation in Planning Process At the community level, wider public involvement in both cities in the development planning process is seen as still limited. This is despite the fact that National Development Planning System, as managed in Law No.25/2004, places the people’s participation as one of the important elements in the development planning accommodated through musrenbang mechanism. The limited participation of the public in musrenbang process is because they tend to become skeptical and less interested in the process and because there is domination of the elites. The public feels that they do not see the result of musrenbang realized, and that the process in Musrenbang is a mere formality. People’s inputs and suggestions are not followed through by related government bodies or agency as they usually already has their own program outline which tends to be a mere routine and rigid. This condition is evident in Surakarta and in Makassar. This is condition is very ironic as Surakarta is known as one of the early pioneers in participatory approaches practices, through the adoption of Participatory Planning System since 2001 and has won “Participatory Award’ from LogoLink, an international network for participatory planning initiative (Sugiartoto, 2003, p.202) In both cities, there have been efforts from NGOs to strengthen the role of Musrenbang and to improve the participation of the wider public in planning process and implementation. In this case, NGOs try to act as catalyst between the

The SMERU Research Institute 36
people and the government. In Surakarta, one of the efforts from NGOs is establishing Musrenbang monitoring team. One of the local NGO’s,, Solo Kota Kita attempts to improve planning process in the musrenbang at sub-district level by providing data and information on the social economic conditions, characteristics of poverty and the spatial issues of poverty through the sub-district with mini atlas program. The objective is to make sure that people’s needs revealed in musrenbang forum are based on real conditions. In Makassar, the NGO—KUPAS—came up with the initiative to compile database of poverty per sub-district. This database then uploaded to the web and can be accessed via Internet. KUPAS also is setting up a website which displays the result of musrenbang proposals to spread the information to the public and to monitor the result of musrenbang. Despite weaknesses and problems in the implementation, the musrenbang planning mechanism is still considered a potential and strategic means of getting people to participate in development planning process. Despite the low quality of the implementation, musrenbang legal and formal standings in national development planning system, provide the best avenue for nongovernmental actors participation and potentially able to influence government’s programs and policies, especially in physical development in sub-district level.
TKPKD in both cities is a strategic forum for the process of planning and poverty reduction, even though there are still problems of authority and coordination amongst elements, especially between NGO groups and SKPD. Even though TKPKD and SPKD in both cities still face challenges to produce real and significant contributions, the study in both cities shows that TKPKD forum has enable more intensive relation and communication between the stakeholders, either from NGOs or from other extra governmental stakeholders. In turn, this has enables greater role of NGO’s and other non government stakeholder to contribute on the TKPKD initiatives, especially in the formulation of SPKD.
3.2 City Spatial Planning Process By law, development plan (National and regional) and Spatial zoning plan must refer to and complement each other. In Law No.26/2007 on Spatial Planning, it is mentioned that the formulation of spatial zoning plan (RTRW) either in national or in regional level must take into account Long-term Development Plan (RPJP). On the other hand, Ordinance on RTRW must function as guideline for the formulation and the implementation of development activities, which are ’spatial’ in nature7. This way, it was hoped that the synergy between the spatial planning and the development programs, can produce more effective programs. However, the interconnection in the two cities is still superficial at best. For example, the housing rehabilitation policy in RPJMD document does not include priority areas in which the program can concentrate its resources to produce bigger outcome. According to Law of Spatial Planning, the definition of spatial planning is a system which comprises process of spatial planning, space utilization, and space management and control of space utilization. The product of the planning process is spatial zoning plan
7eBulletin, “The Interconnection between National Development Planning and Spatial Planning’ by Deddy Koespramoedyo, MSc. Director of Spatial Zoning and Land, Bappenas. March – April 2008 edition

The SMERU Research Institute 37
(RTRW), which hierarchically consists of National RTRW, provincial RTRW, and regency/city RTRW. The government formulates and implements the product of RTRW according to its authority. Based on the instruction for national spatial planning, in city level, the formal institution authorized to coordinate the formulation of RTRW is Regional Spatial Zoning Coordinating Body (BKPRD). BKPRD for Makassar is headed by Regional Secretary, with the mayor and his deputy acting as PICs. Bappeda which is the coordinator in regional development planning acts as the secretary of BKPRD. Departments and divisions involved in BKPRD, among others, are Spatial Zoning and Building service; Public Work service; Regional Environment service; Maritime, Fishery, Agriculture and Animal Husbandry service; Transportation service; National Land Agency; PT. Telkom; Regional Water Company (PDAM); Police Civil Services; and experts. According to the main tasks and functions, Bappeda, and the office of Spatial Zoning and Building have a significant role in city spatial planning. In BKPRD, Head of Physical and Infrastructures of Bappeda functions as the head of Working Group for Spatial Planning, while Head of Building Control Body of Spatial and Building services severs as Head of Working Group for Spatial Utilization and Utilization Control service. In Surakarta, forum BKPRD forum is seen as not be as active as BKPRD in Makassar. From the interviews with several concerned parties, the problem lies in collecting the concerned heads of services. This makes the services usually send different staff to each coordinating meeting; thus, making the forum unable to work well. One of the activities of BKPRD forum is conducting coordinating meetings to discuss urban spatial zoning, from building constructions to cable excavation. Yet, in several discussions with related services involved in BKPRD, it is revealed that there has been a lack of coordination and spread of information either intra services or inter services. There has not been even one service involved in BKPRD which comprehensively masters the RTRW grand design, including its structures, functions and positions to one region and the next. The involvement of each party is limited to its main tasks and functions. Related to this, the role of experts in formulating RTRW in Makassar or in Surakarta becomes quite big. Experts are assumed to be the party most knowledgeable about the RTRW grand design. From the existing structure of BKPRD, especially that in Makassar, no sosial service or department assigned to handle social issues becomes member of BKPRD. There is no involvement of social office/service either in planning stage or in formulating spatial zoning. Parties from Bappeda, which are involved, do not come from sub-division which handles social issues. Social agency/service is involved ad hoc only when it is necessary or when there is a problem in a certain construction or development project, such as when a conflict arises. This reflects the direction of urban spatial development, which focuses more on regional physical development. This also shows that there is a lack of planning based on social economic conditions of the people, and a lack of advanced impact analysis from the spatial development on the livelihood of the people, especially the poor. In terms of planning document, in both cities, RTRW documents are still in the form of draft of regional policy (Raperda). Raperda RTRTW of the city of Surakarta has a period of 20 years, from 2010 to 2030. In Makassar, Raperda RTRW is for the period of 2010 until 2030. There has been a problem in establishing the draft into a ready policy, and it is under a discussion in the provincial level. The problem especially is

The SMERU Research Institute 38
related to the inability of the city administration, as stated in the draft, to provide 30% of the city area for open green space, as mandated by Spatial Zoning Law. As the draft cannot become ready policy yet, at present, Surakarta administration still refers to Surakarta General Plan for Urban Spatial (RUTRK), for the period of 1993 until 2013.
3.3 Analysis of Development and Spatial Planning Documents To assess the mainstreaming of poverty issues, including spatial dimensions of poverty and livelihood of the poor, within development planning in both cities, this study collect and analyze several strategic key documents on development planning, poverty alleviation, and spatial planning. The documents are Regional Medium-term Development Planning (RPJMD) as the main planning document for city development within the next five years; Regional Poverty Reduction Strategies (SPKD), which contains regional poverty reduction plans formulated by local TKPKD team; Regional Development and Expansion of Housing and Settlement Plans (RP4D), as the guideline for city wide settlement planning; and RTRW as the main document for urban spatial development and zoning plan. Besides RP4D, the other three documents are written by regional administration/city administration, whereas RP4D was formulated by People’s Housing Ministry as technical assistance project to local government for city wide settlement master plan.
To see how far the documents have been able to accommodate livelihood and spatial elements of poverty, the analysis will assess whether the documents already contained comprehensive poverty data and can readily answer these questions: The number of poor (basic poverty information), the locations of the poor (aspect of spatial poverty), and who is the poor, including their profession and the characteristic of poverty they facing (livelihood analysis). The analysis will then be use to elaborate the gap between poverty data and development planning and asses the potential of the documents in mainstreaming livelihood and spatial issues of poverty in the future.

The SMERU Research Institute 39
Table 8. Analysis of Planning Documents of Kota Makassar
Data and Information the Condition of Livelihood
and Spatial Poverty Name of
Document Approaches
Number of Poor People
Locations of the Poor Neighborhood
(Spatial Poverty Issue)
Characteristics of the Livelihood of Poor People
Assessment of Mainstreaming of Livelihood and Spatial Poverty
RPJMD 2009-2014
High focus on social safety program for the poor. Clear aim for poverty reduction , yet no exact target expressed.
No data of poverty in city level nor in district level
Policies directed at rehabilitation of slum areas; However, no data on distribution and number of pockets of slum areas
No data on livelihood and occupations of poor people in Makassar.
Serves as reference for development plans. Contain strategies and policies on social protection, albeit generally. Does not include spatial element and livelihood in the strategies and policies outlined.
SPKD 2005-2010 (Expired)
Focus on right based approach in poverty reduction, including the process and result of PPA in its poverty analysis.
Contain data of poverty in city and district levels
There is awareness on the spatial aspects of poverty :
• Poverty analysis in poor settlement in coastal areas, and its vulnerability aspects.
• Focus on rehabilitation of slum areas in high risk fishing villages.
Contain analysis of livelihood of poor people:
• Analysis on vulnerability of fishermen, indigenous groups, migrant groups and women.
• Contain result of PPA, showing the general characteristics of Makassar poor.
Parent document on poverty reduction effort, containing poverty analysis based on characteristics of poor people. Yet, the analysis has not been accommodated in poverty reduction policies and programs, which up until now are still spatially less sensitive. .
RP4D 2007
Focus on settlement and supporting infrastructures planning, putting rehabilitation of slum and low income settlement areas as priority.
Contain poverty data in district level and data on the number of houses in slum areas based on Village Potentials Survey (Podes) 2003 and SPAR 2003
Provide comprehensive analysis on the profiles of slum areas
• Access to supporting infrastructures, including number of houses needed.
• Description of locations of the poor and their vulnerability (on the islands and eastern region, and along Tallo River, which is prone to flood.)
• Contain mapping of slum areas in Makassar
Contain livelihood analysis of poor people in formulating strategies for area rehabilitation, especially in rehabilitation of slums in coastal areas. The plan already considers access to the sea for fishers and vulnerability aspects threatening the fishermen families.
Document is written by consultant as a form of technical assistance to local government from People’s Housing Ministry. The document includes many elements of spatial poverty in formulating settlement development strategies. This is a strategic planning document, yet it is rarely mentioned by interest groups in the city level and its status of implementation is not clear
Raperda RTRW 2010
Plan of Spatial structures, patterns and strategic areas. It also include policies and strategies for urban area development.
Does not include poverty data.
Contain policies and strategies for slum areas rehabilitation
• Include poverty as one of the approaches to planning,
• However, the document does not show pockets of poverty and slum areas, nor does it show strategies which focus on poverty reduction.
Allocating areas for informal economic activities informal, 3% of each development area. No explanation on how the spatial planning will affect the livelihood of people of Makassar, especially the poor.
Very technical and macro. Does not include analysis or description of poverty in Makassar. Requires more analysis on how plans in the document can affect people’s livelihood.

The SMERU Research Institute 40
Table 9. Analysis of Planning Documents of Kota Surakarta
Data and Information of Livelihood and Spatial Poverty Name of
Document Approaches
Number of Poor People Locations of the Poor Neighborhood
(Spatial Poverty Issue) Characteristics of the
Livelihood of Poor People
Assessment of Mainstreaming of Livelihood and Spatial Poverty
RPJMD 2010-2015
Five-year Development Planning with priorities in education, health, availability of food, infrastructure improvement to support poverty reduction efforts. Poverty is also the core of urban strategic issue analysis
Contain poverty data in city level and Subosukowonsraten area. Contain other social indicator data (health, education and people living with social problem)
• Contain data of uninhabitable houses and discussion on land issues which affect the poor.
• Analysis on housing issues, including for low income groups.
• Missions contain revitalization of uninhabitable houses and rehabilitating street peddlers.
• Economic development policy which focuses on revitalizing traditional markets, informal economy and street peddlers, and micro-economy improvement.
• Social protection for the poor via better access to education and health.
RPJM Solo already includes many analyses on poverty and makes poverty one of the priorities in development. Yet, the programs have not effectively accommodated spatial poverty and livelihood data and still limited as general social protection programs.
Draft SPKD
Using right based approach
Contain data of poverty in city level and Subosukowonsraten areas. Contain data of other social indicators (health, education and PMKS)
• Contain description of areas which are pockets of poverty and its vulnerability due to spatial conditions. Does not include clear area identifications and the distribution of the poor.
• Propose for formulation of sub-district level RPJM
Contain discussion of occupations which are susceptible to poverty and its vulnerability conditions.
Still in the process of completion, yet NGOs contribution enables more comprehensive poverty analysis in the document. Action plans aiming at formulation of kelurahan level RPJM can be seen as a way to create plan that is more sensitive to spatial aspect of poverty.
RP4D 2004
Document for acceleration of housing and settlement development strategies formulation in Solo
Does not contain poverty data. Contains data of public facilities and housing in district level (Data from the year 2001)
• Contain data and map of poor sub-districts in the north and east of Surakarta.
• Map of disadvantaged and high-risk areas (along the river)
Does not contain analysis on the livelihood of the poor.
As a technical assistance document, RP4D is already very specific in analyzing settlements. Even though it contains only a little analysis on poverty, action plans and strategies in the document already touch many aspects of spatial poverty.
Raperda RTRW 2010
There is a statement that poverty is the result of unfair spatial allocation, and marginalization of susceptible groups.
Does not contain poverty data, but poverty is a strategic factor in formulating strategies and policies in RTRW document.
Focus on poverty reduction and poor settlement along the river as areas with high livelihood vulnerability.
Does not include livelihood analysis and characteristics of poverty in Solo.
Very technical and macro. Does not include discussion on conditions of poverty. However, it clearly states that poverty reduction is one of the priorities in spatial planning in Surakarta.

The SMERU Research Institute 41
Analysis and issues of poverty, especially spatial and livelihood poverty analysis, has been included in the SPKD of both cities, but they are not clearly defined or reflected in the subsequent strategies and action plans. This is evident in SPKD Makassar where action plans and the output of poverty reduction programs are relatively the same as RPJMD, and many social protection programs, especially in housing rehabilitation and infrastructure development are not spatially-sensitive. Clearer analysis reflection can be seen in SPKD Surakarta, which directs the development of RPJM in sub-district level so that the poverty reduction program are more sensitive to spatial and livelihood aspects. Spatial aspects of poverty reduction programs in the planning documents of both cities are still weak and do not have development strategies based on poverty spatial data. While, poverty alleviation programs in the RPJMD documents in both cities already quote the indicative budget ceiling and target recipients, there is no information on target areas, especially in the infrastructures development program for slum areas, and for Uninhabitable Housing program (RTLH). Integrating spatial data using mapping and GIS in the planning documents can help maximize the planning and the implementation of poverty reduction programs in both cities. Surakarta and Makassar already have RP4D documents, which specifically formulate programs to rehabilitate slum areas; however, up until now, the implementation is not yet clear. The document was written by Housing Ministry in 2004 for Solo and in 2007 for Makassar, as a form of technical assistance for the city administration. The documents are relatively more comprehensive and they accommodate spatial issues in the planning. But, from interviews with the concerned parties, the document was only rarely mentioned and did not always come up in the discussion about poverty in both cities even though they are reference documents. There are still significant gap on the concrete utilization of poverty data on development documents and its subsequent development planning. The above table shows while social protection and poverty reduction has been stated explicitly on the documents, there are still significant lack of data and concrete plan to utilize the data to improve the targeting and effectiveness of those social protection programs. The same goes with the infrastructure and housing upgrading which still done partially and house to house basis, not in the scale of comprehensive settlement planning level.
3.4 Mapping of the Main Actors and Their Roles in Poverty Reduction and City Spatial Planning
In addition to conducting mapping and analysis of the result of the planning documents, this study also conduct stakeholder mapping of the main actors who have a significant role in poverty reduction efforts and city spatial planning. The mapping was conducted by interviewing the source person from each organization that has been identified beforehand. The organization interviewed in this mapping came from both the government and non-government entities. The main objective of the interviews is to understand their current roles and position in spatial and poverty reduction planning, suggestions on institutional improvement and potential involvement of these actors in mainstreaming poverty reduction efforts within city spatial planning in the future. The result of the interview is presented in the matrix form as shown

The SMERU Research Institute 42
below and contained stakeholder mapping for both Surakarta and Makassar. The merging of information is due to the consideration that the main actors in both cities are relatively similar, while additional explanation is provided should there be any difference in condition and roles of the actors in any of the city. For detailed stakeholder information each cities, please refer to appendix.
The mapping shows that the non government actors has plays more significant role on poverty reduction efforts.. In both cities, the collaboration between the government and the non-government organizations, has contribute to vibrant discussion and relation on the field of poverty reduction. The city governments also increasingly acknowledge the role of private sectors contribution through CSR and have acknowledged the needs for better CSR management systems within the local government. This is especially true in Surakarta, where the city administration is formulating ordinance on the roles and the contribution of private sectors in poverty reduction efforts through Corporate Social Responsibility programs. At present, the actor/institution with central roles in the planning process, including the coordination effort in poverty reduction efforts is Bappeda. The centrality of Bappeda in programs planning is still considerably dominant in both cities, including the formulation of RTRW document. In both cities, Bappeda become the vocal point of planning and therefore a strategic starting point for any capacity building or other technical assistance program in poverty mainstreaming and pro poor urban planning.
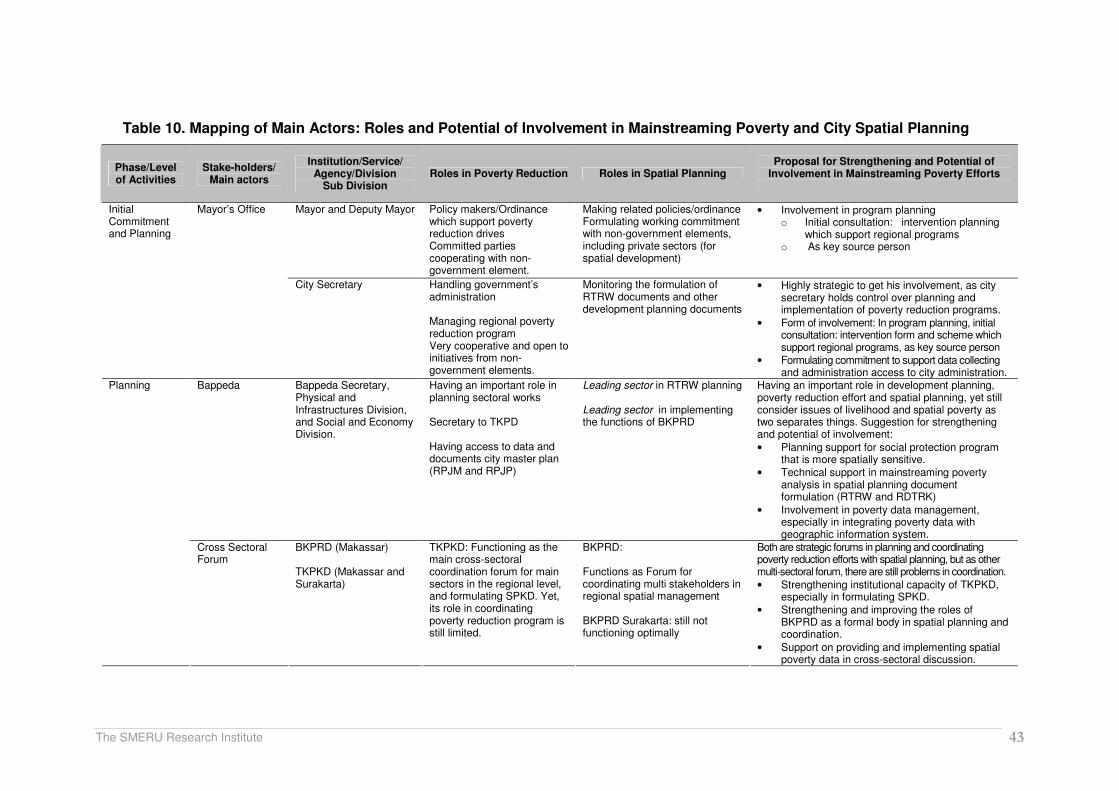
The SMERU Research Institute 43
Table 10. Mapping of Main Actors: Roles and Potential of Involvement in Mainstreaming Poverty and City Spatial Planning
Phase/Level of Activities
Stake-holders/ Main actors
Institution/Service/ Agency/Division
Sub Division Roles in Poverty Reduction Roles in Spatial Planning
Proposal for Strengthening and Potential of Involvement in Mainstreaming Poverty Efforts
Mayor and Deputy Mayor Policy makers/Ordinance which support poverty reduction drives Committed parties cooperating with non-government element.
Making related policies/ordinance Formulating working commitment with non-government elements, including private sectors (for spatial development)
• Involvement in program planning o Initial consultation: intervention planning
which support regional programs o As key source person
Initial Commitment and Planning
Mayor’s Office
City Secretary Handling government’s administration Managing regional poverty reduction program Very cooperative and open to initiatives from non-government elements.
Monitoring the formulation of RTRW documents and other development planning documents
• Highly strategic to get his involvement, as city secretary holds control over planning and implementation of poverty reduction programs.
• Form of involvement: In program planning, initial consultation: intervention form and scheme which support regional programs, as key source person
• Formulating commitment to support data collecting and administration access to city administration.
Bappeda Bappeda Secretary, Physical and Infrastructures Division, and Social and Economy Division.
Having an important role in planning sectoral works Secretary to TKPD Having access to data and documents city master plan (RPJM and RPJP)
Leading sector in RTRW planning Leading sector in implementing the functions of BKPRD
Having an important role in development planning, poverty reduction effort and spatial planning, yet still consider issues of livelihood and spatial poverty as two separates things. Suggestion for strengthening and potential of involvement:
• Planning support for social protection program that is more spatially sensitive.
• Technical support in mainstreaming poverty analysis in spatial planning document formulation (RTRW and RDTRK)
• Involvement in poverty data management, especially in integrating poverty data with geographic information system.
Planning
Cross Sectoral Forum
BKPRD (Makassar) TKPKD (Makassar and Surakarta)
TKPKD: Functioning as the main cross-sectoral coordination forum for main sectors in the regional level, and formulating SPKD. Yet, its role in coordinating poverty reduction program is still limited.
BKPRD: Functions as Forum for coordinating multi stakeholders in regional spatial management BKPRD Surakarta: still not functioning optimally
Both are strategic forums in planning and coordinating poverty reduction efforts with spatial planning, but as other multi-sectoral forum, there are still problems in coordination.
• Strengthening institutional capacity of TKPKD, especially in formulating SPKD.
• Strengthening and improving the roles of BKPRD as a formal body in spatial planning and coordination.
• Support on providing and implementing spatial poverty data in cross-sectoral discussion.

The SMERU Research Institute 44
Phase/Level of Activities
Stake-holders/ Main actors
Institution/Service/ Agency/Division
Sub Division Roles in Poverty Reduction Roles in Spatial Planning
Proposal for Strengthening and Potential of Involvement in Mainstreaming Poverty Efforts
Social Agency, People empowerment agency (Bappermas/BPM), Health and Education Agency
Implementation and management of poverty reduction programs
No direct connection. Strengthening efforts:
• Strengthening the institutional capacity in program implementation.
• Technical Support in providing and managing spatial poverty data (Poverty data synchronized with GIS)
• Support in the use of spatial poverty data for better targeting of social protection programs based on sectors.
Public Work Service and Regional Water Company (PDAM)
Executing infrastructure development programs. Gate keeper for donor programs and the central government Having limited perspective about poverty
Involved only in the implementation process of the available plans
Strengthening efforts:
• Support in using spatial poverty data to allocate program priorities, especially programs from donors and central government.
• Strengthening the capacity for mainstreaming the issues of spatial poverty in the implementation of infrastructure programs.
Urban Spatial Agency Having no direct connection Involved in technical spatial monitoring and controlling, yet limited role in planning.
Strengthening efforts:
• Strengthening roles in controlling and monitoring, especially those related to land-use change and certification in low income and slum areas.
• Strengthening capacity in employing spatial poverty information in its land monitoring and control functions.
Implementation Sectoral Department
Market Agency (Surakarta)
Managing the revitalization and construction of traditional markets, including management of street peddlers.
Determining location for new markets development and its supporting infrastructures
• Dissemination of spatial poverty information and strengthening the capacity for more pro poor traditional market management.
• The use of spatial poverty information in revitalization and development plan of traditional markets.
Solo Kota Kita (Surakarta)
Providing spatial-based data of social-economic conditions at kelurahan level Partner of city administration in TKPKD Forum Involved in formulating SPKD
Integrating social-economic data with map information in the form of mini atlas for sub-district level.
• Support on strengthening the organizational capacity in formulating sub-district level of RPJM.
• Initiate and support advocacy in the issue of spatial poverty mainstreaming in local poverty reduction effort.
Planning & Implementation (Non-government Institutions)
NGOs
KUPAS (Kota Makassar)
Formulating local poverty indicators for Makassar Members of TKPKD
No direct connection • Support and strengthening organizational capacity in understanding the connection between spatial poverty issues and spatial planning.
• Initiate and support advocacy in the issue of spatial poverty mainstreaming in local poverty reduction effort.

The SMERU Research Institute 45
Phase/Level of Activities
Stake-holders/ Main actors
Institution/Service/ Agency/Division
Sub Division Roles in Poverty Reduction Roles in Spatial Planning
Proposal for Strengthening and Potential of Involvement in Mainstreaming Poverty Efforts
Development Program
Central Program PNPM Providing data/information of the social-economic conditions in the sub-district level (Independent Mapping/Pemetaan Swadaya – by name by address) Formulating sub-district level poverty reduction plan (PJM Pronangkis)
PJM pronangkis is the most spatially sensitive poverty reduction document. However, PNPM program still largely focuses on infrastructure development, not on spatial planning in settlement level.
• Consultation in program implementation
• Data and plan synchronization with PJM Pronangkis document.

The SMERU Research Institute 46
3.5 Current Institutional Challenges In the research, we also discovered several challenges, either in planning process or in mainstreaming of spatial issues of poverty, and poverty reduction efforts. They are: Oftentimes, within the elite of the regional government, the coordination process and functions still challenged. Formally, the city administration has taken various coordination efforts, either inter-sectors or cross-sectors. However, overlapping programs still happen, either between the central government and the local government or between departments within the local government (between SKPD’s). Problems related to coordination are caused by, among others, still significant ego-sectoral tendency and lack of synergy between policy and management program due to the lack of clear legal certainty. The problems are lack of integration amongst programs, money follow function principle for performance-based budgeting which does not consider regional real needs, very big routine expenditure allocation compared to development expenditure, pragmatic planning which does not consider real conditions, differences in data between SKPDs, “half-hearted decentralization” which does not give enough room for the regions (seen from the big amount of composition of de-concentration funds through institutions in the regions compared to decentralization funds), and too many coordination activities with the central government (Jakarta). There is still a tendency for SKPDs to see poverty reduction efforts as sectors issue. This is due to the existence of strict main tasks and functions so that oftentimes members of SKPD face difficulty in relating their roles in poverty reduction efforts, exclusively connecting poverty issues to particular SKPDs and not seeing their roles as related to the issue. For example, Urban Spatial Agency in both cities still sees that poverty reduction is the sole responsibility of Bappeda. From the main tasks and functions of Urban Spatial Agency, which is related to land management and land use, their role in poverty reduction is particulary important and indispensable, yet they cannot explicitly explain how their role can affect the livelihood of the poor people and what are their contribution. There is also no clear understanding on how RTRW can be pro poor people or how spatial planning can contribute to poverty reduction efforts.
Spatial planning proves is a process with ‘top – down’ approach and is technocratic, that regional spatial planning in a certain region must refer to regional spatial plan above it, or provincial or national level. This makes the approach in city spatial planning is still limited to zoning for area use, and control of land use done by conceptualizing limited main tasks and functions. From the interview with officials in SKPD in Makassar and in Surakarta, it was learnt that the relationship between area planning and poverty reduction efforts is still unknown to many SKPD members, so that they find it hard to make the connection between their main tasks and functions with poverty reduction efforts. This condition brings with it the potential of what an expert in spatial planning refers to as “spidology”, where city spatial planning is limited to technocratic planning which does not look at social issues, such as strategic poverty in city spatial planning
There are still rampant cases of misappropriation and violation in the implementation of urban planning regulation. Oftentimes contractors and developers alter the plan already approved by BPN. This occasionally results in deviation with the result of environmental impact analysis document. Another misappropriation

The SMERU Research Institute 47
which often happens is land speculation practices because it is relatively easy to obtain spatial planning documents. In several development areas in Makassar, many speculators buy lands belonging to the local resident, sometimes by paying them to go for hajj pilgrimage to Mecca and put the appropriated land for market speculation. These practices often lead to the loss of assets by the local residents and exacerbate poverty in those areas. BPN stated that this, along with the lack of effective prevention and punishment mechanism, causes the development of urban area often fall out of their control. The approaches to poverty reduction in Surakarta and in Makassar still focus too much on pragmatic and budget approaches, and have not directly touched city spatial planning. Respondents from the government and other stakeholders, such as NGOs, more often refer to poverty alleviation programs, such as ‘5 Gratis’ in Makassar, and PKMS and BPMKS in Solo. Slum area and poor house rehabilitation drives are still in program level and not in long term strategic or conceptual planning.

The SMERU Research Institute 48
IV. EFFECTS OF PROGRAMS AND POLICIES ON PEOPLE’S LIVELIHOOD STRATEGIES
The poor’s efforts to reach sustainable livelihood—through welfare improvement and less vulnerability factors, are very much determined and influenced by the livelihood strategies they employ. In the sustainable livelihood analysis framework, these livelihood strategies are influenced by condition of their livelihood assets and programs and policies related to poverty reduction. Departing from here, this chapter will discuss the problems faced by the poor in relation to the condition of assets ownership, livelihood strategies they employ and how current programs and policies affect their livelihood strategies. Perceptions of stakeholders are also reviewed to see the tendency toward the development of planning programs and policies based on their understanding of spatial and poverty issues. The SOAR approach as a tool for stakeholders analysis was use qualitatively to dig up the main strengths or advantages which are owned by Kota Surakarta and Kota Makassar perceived by stakeholders in effort to reduce poverty that takes into account the spatial dimension, as well as elaborate on the various opportunities that have the potential to be developed to enhance these efforts. Identify strengths and opportunities will determine the aspirations of the condition that they want to achieve in the future with measurable results. The result of SOAR exercise will be discussed in the last part of this chapter.
4.1 Programs and Policies Related To Conditions of People’s Livelihood
The main problem faced by poor people, either in Surakarta or in Makassar, is their limited economic/financial condition, as shown in Graph 4.1 below. These include economic/financial deprivation, such as lack of income, lack of financial capital for economic activity, limited job opportunity, and high price of basic needs. This economic/financial difficulty is felt consistently across the groups, males, females, and youths. This condition mainly caused by the nature of informal sector in which most of the poor work that have high uncertainty, unpredictability of income and high vulnerability. High market competition and unpredictable weather can also add to this income vulnerability, as many of the informal works such as street peddler and clothing factory depends on good weather.
Figure 15. Priorities of Problems of People’s Livelihood
Econimic/
Financial
64%
Human
Capital
29%
Social
Capital
7%
Surakarta
Economic/
Financial
52%
Human
Capital
38%
Natural
Capital
10%
Makassar

The SMERU Research Institute 49
To overcome these problems, the most common strategy employed by the poor is by looking for extra income through finding side job, which unfortunately still revolves around informal sector, and increase their working hours. Almost all members of the family use the same strategies. In the number of cases, the children can also help their parents working. For females, they generally take jobs which do not require high expertise or high level of education, such as becoming street peddlers or laundry workers. They also try to save their income by cutting household expenses, and in emergency pawn their belonging, such as electronics and jewelry or borrow money. PPA in all locations reveals that the poor mostly still borrow money from informal financial institutions, such as moneylenders, mobile bank and titil bank. Efforts to provide financial service by government or other parties from formal institutions are still failing to reach and fulfill the poor financial needs, especially in a timely manner. There are several formal financial institutions, like cooperatives, savings and loans institutions managed by NGO, revolving fund aid from a certain program or direct cash assistance from the government, however, it is still operate in a limited scale, either from the amount of funds or from the number of beneficiaries. Often times, those program requires certain criteria and requirements from the potential borrowers, such as collateral, fees, ID card and others, which many poor find hard to meet, especially if the poor has just moved to the area. The most significant factor for the financial assistance for the poor is the timing. With high uncertainty in their income generation and high vulnerability, the poor will always chose higher interest but easier procedure of informal financial service over lengthy procedure of formal financial institutions. The low quality of human capital is also a major problem for the poor. As mentioned in Chapter II, this condition mainly refers to the low level of formal education and lack of productive skills among the poor, especially the youth. In response to this, currently there are various social protection programs on education sectors, both from central and local government. These programs include national level programs by central government; BOS (School Operational Assistance) programs and local government initiatives, in this case BPMKS in Surakarta and 5 Gratis in Makassar. However, while many PPA discussion members in both cities have mentioned the benefit of those programs, especially in helping them with paying school fees, they still required to allocate significant amount of money for routine school expenses, such as books and transportation, especially during the beginning of a new school year. In all the PPA locations, the poor consistently reported that these beginning of school year expenses has been a very big financial burden and puts them as one of their most significant vulnerability factors. These conditions shows that current education assistance programs, such as those mentioned above have not been able to address and reduce this vulnerability factors effectively. To overcome the lack of skills problem, the poor still mostly relied on personal initiatives and efforts. Among teenage dropouts, they actively learn new skills from their friends, or work with the skills they already own. While there are significant number of them who expressed interest on enrolling on a training course sponsored by the government; they often faced with limited number of seats, lack of information concerning the course/training program and the uncertainty on the continuation of the program, such as the absence on follow up on access to capital or assistance to find job opportunities. Still related to human resources, the government social protection program that was regarded as most helpful in Surakarta is PKMS program. The program was initiated by

The SMERU Research Institute 50
Mayor Jokowi in 2009. The program provides health services for the poor, in a tiered service system funded by regional budgets (APBD). For the very poor, the government provides PKMS Gold which bears the cost of treatment in general hospital, ranging from maternity to dialysis. For people who belong to the group of vulnerable or almost poor, the government provides PKMS Silver which bear hospital fee up to IDR 2 million per person per year. The effectiveness of PKMS in Surakarta and similar program in Makassar is because the programs manage to lessen the effect of health shocks, thus reducing their vulnerability. However, money is not the only vulnerability factors in health shocks for the urban poor. The transactional and opportunity cost of sickness, especially for the kids, sometimes outweigh the cost of the medical service itself. These costs include high cost of transport, extra expenses while waiting in the hospital and the lost working day. The last is especially true, as most of the urban poor earn their income daily, the lost working day can be detrimental to their livelihood. On this, current social protection program in both cities still fails to address these vulnerabilities.
Figure 16. Distribution of Health Assistance Beneficiaries (PKMS Gold) in Kota Surakarta
The recent internal evaluation conducted by Health Agency of the city of Surakarta reveals that the programs still need improvements in several areas. The first is on the administrative requirement for getting Gold card that needs to be more selective. The officials argue that these measure is necessary to mitigate current condition where people from the surrounding districts migrating into Surakarta, out of interest to the program, straining the program budget. The second one is related to the efforts of changing people’s mindset about heath by not only rely on the programs for curative steps, but also on preventive measures, by practicing health and hygiene behavior.
From here, the study found that in terms of livelihood strategy, the poor still mostly rely on self troubleshooting activities by relying on available assets and potential with the
Penerim
a

The SMERU Research Institute 51
support from their surroundings. Current social protection program in both health and education in both cities has managed to lessen the impact of shocks, but the scope of the program is still unable to comprehensively protect the livelihood of the poor. Moreover, with complex multidimensional deprivation faced by the urban poor in two cities, there are still many vulnerability factors that left unaddressed, especially the one related to spatial condition and issues, such as security of land and assets, natural disasters, and garbage management. This will be discussed in the subsequent section. In the future, social protection programs and policies for poverty reduction should taking into account the livelihood strategy of the poor in their design in order to be able to cater the real need of the poor and more effective in providing protection to their livelihood.
4.2 Programs and Policies Related to Spatial Dimension of Poverty Referring to the discussion in Chapter II about spatial poverty, this part will focus on several issues of spatial poverty, efforts made by the city administrations in handling spatial poverty in the city level and how far its effects have been for the people. One of major issues of spatial poverty in Surakarta and in Makassar is the issue of management of low income settlement in the inner city and peri urban area. The result of PPA reveals that the poor, both local and migrant, mostly live in highly populated, illegal slum areas and spread across many low income pockets in the inner city and peri urban area. The location is very dependent on the proximity to the place of work and other economic opportunities. This settlement pattern can be seen as part of their adaptive strategy to be able to access the urban economic potential and their way of minimizing the transportation time and expenses. However, this condition makes them vulnerable to eviction should the administration have any development plan in the area. On this issue, the governments of both cities have made several efforts to provide access to decent settlement for poor people. Some of these programs are RTLH (Inhabitable House Rehabilitation) program, PLBK (Community Based Neighborhood Revitalization) program, housing program from People’s Housing Ministry (central government), PNPM-ND (Neighborhood Development), and others. There are also efforts made by private sectors in managing the community, such as those in Surakarta. Even so, in the community level, the benefit of the programs is not equally felt. This is because the programs still cover limited areas, and some of these programs require the participants/recipients to own the land, which mostly not the case. Another spatial poverty issue is availability of water and sanitation services, especially in low income settlement areas, and the management of garbage and waste water, either in sub-district level or in city level. These issues are interconnected and very much influenced the livelihood of the poor. The lack of sanitation and clean water access make the poor prone to flood and diseases as a result of unhygienic surroundings. In Makassar, there are programs which specifically address the problems of water and sanitation. Some of them are SLBM (Community Based Environment Sanitation), USRI (Urban Sanitation and Rural Infrastructure), Pamsimas and Care Kota (Care for the City). Each of these programs covers its respective work area. In this case, the city administration through Bappeda has been trying to synchronize the programs so that they can reach as many people as and as wide area as possible. The city of Makassar already has ordinance for garbage/waste management, in a form of multi tiered garbage management with Kelurahan, Kecamatan to the city/town level temporary garbage collection point before being sent to regional landfill as final dumping site. Yet, in the community level there are

The SMERU Research Institute 52
still no operational garbage management systems, with many people still dump their garbage on empty lands and increasing accumulation of garbage due to irregular schedule of garbage collection, and river and sea pollution by garbage. With the addition of pollution from industries and factory, these pretty much will severely impact on the degradation of natural resources. Besides access to infrastructure and social protection programs, economic integration of the poor in various areas in the city into sustainable city economy is also one key issue on spatial dimension of poverty. This issue especially related to area development plan and implementation of spatial planning policy in both cities. In Surakarta, the city administration’s plan to create ‘Night Market’ along the city’s major roads has potential to increase the vulnerability of the poor who work in the areas. In Makassar, future plans to develop seaport area in Tallo sub-district may increase the livelihood vulnerability for the fishers around the area as they will lose their source of income, as the development will heavily affect the marine ecosystem in which they relied for their income generation activities. Therefore, there is a need for further systematic study to see how specific future spatial plan will affect the livelihood of urban poor in those particular areas.
4.3. Stakeholder’s Perception in Relation to Issue of Spatial Poverty Stakeholder’s perception on the issues of spatial urban poverty was obtained through participatory workshop that used SOAR method.. The analytical process of SOAR components was conducted together with the workshop participants that were coming from various institutions, government, non government and also community’s representatives from PPA’s locations. During the workshop, the participants were asked to give their opinion on the aspect of Strength, Opportunities, Aspirations and Results that their respective city has, especially in accordance with poverty issue and urban planning. The results, then grouped into seven aspects of capital: i) political capital, ii) cultural capital, iii) human capital, iv) economic capital, v) infrastructural capital, vi) natural capital, and vii) social capital. Below is the description of each component.
Table 11. Grouping of SOAR Results
Aspects Kota Surakarta Kota Makassar
Political Capital
Leadership, policy, program, good governance, branding, ability to use
powering support of political or economic position to enhance livelihood
Leadership, vision, mission, program, policy, regulation, partnership, good
governance
Cultural Capital Identity, culture, custom, behavior Identity, culture, custom, behavior
Human Capital Education, health, creativity Education, life skill, health, attitude
and behavior
Economic Capital Industry, handicraft, trade, banking,
market, investment
Economic development, accelerated development & economic gateway, center of Eastern Indonesia Region,
employment, poverty reduction
Infrastructural Capital
Public facility, city structuring Spatial, infrastructure, slum area
Natural capital Structuring slum area, public space,
geographic, regional transit Geographic
Social Capital Trust between citizens, community mutual assistance (gotong royong)
Participation, gotong royong, community organization, caring

The SMERU Research Institute 53
In both cities, political capital (owned/exercised by the stakeholders – not by the people) emerged as a dominant aspect both in poverty reduction and urban planning in most of SOAR components; that is in strength, aspiration and strategies to achieve aspiration, except for opportunities component. In Kota Surakarta., the biggest opportunity lies in the economic capital. While in Kota Makassar, the biggest opportunity for poverty reduction lies in political capital. The difference between the two cities also evident in the component of measurable results. Here, stakeholder Kota Makassar placed ‘economic capital’ as their biggest intended result, whilst stakeholder in Kota Surakarta put theirs in ‘political capital’. Figure 17 below presents the intensity of each component using frequency.
Figure 17. Frequency of SOAR Capital Aspects
Strengths Stakeholders in the two cities perceive that the strength of the city is on political capital. Among component of political capital, the most mentioned one is on strong leadership that holds strong vision. The vision then translated into policies, programs, regulation that could be felt by the community, especially on poverty related issues such as poverty reduction. Policies and programs that are aimed to reduce poverty are considered beneficial to the community, especially in health and education sector. As for poverty reduction institution such as TKPD, even though it is a strong organization, but not fully developed yet. In Kota Surakarta, cultural capital also considered as one of its strength. It is based on the strong cultural foundation of the city and its citizen that further influence one of the vision of Kota Surakarta, that is to be a heritage city. From this, it is hoped that it can promote and support economic sector especially trough trade. In Kota Makassar, social capital and economic capital were felt to be giving enough positive influence especially in the direction of regional development. The roles of civil society’s actors are very active; there is strong sense of togetherness that could support economic activities in the region along with Makassar’s position as economic landmark of Eastern Indonesia. City’s strength in terms of spatial issues is not so evident, mostly is still on policy level and on planning document. In Kota Surakarta, even though now there is ‘best practices

The SMERU Research Institute 54
policy’ in terms of managing street vendors (PKL), but unfortunately there is no concerted and subsequent effort to systematically monitor and evaluate the impact of that policy especially on the livelihood of the targeted workers.
Figure 18. Stakeholders Perception on Strength of Surakarta and Makassar
Opportunities According to the stakeholders, the main opportunity for Kota Surakarta is in economic capital; whilst for Kota Makassar is in political capital. In this sense, good governance is considered as a means to achieve development goals and vision of the region. It is also important to improve the performance of program in order to be more pro poor in the future. Opportunities for Kota Surakarta mostly based on economic capital, that is on trade sector and home industry with specific focus on strengthening people’s economy. This basis is supported by geographic location of Surakarta; that opens up opportunity for the city to become trade centre with strength in cultural values, to make collaboration with people from outside and to attract tourist in the region. The opportunity toward more pro poor urban planning is not strongly came up in both cities. In Makassar, the opportunity is only limited to the existence of poverty reduction program, whilst the issue of spatial dimension and urban planning has not intensively discussed. In Surakarta, although quite well known for its achievement in managing street vendor, but further impact on worker’s welfare still need to be looked at.

The SMERU Research Institute 55
Figure 19. Stakeholders Perception on Opportunities of Surakarta and Makassar
Aspirations Both cities are aspiring to have stronger political and economic capital in the future. Stakeholders in Kota Surakarta stressed that policies and program in the future should be more pro poor, whilst participants in Makassar are aiming to have better life in the future especially for the poor. Both cities are also aspiring to have a reduction in poverty rate and to have welfare improvement. One of the obvious indicators is through the disappearance of beggars and street musician.
Aspiration related to spatial planning also mentioned by the stakeholders, in terms of more manageable city infrastructures, free-congestion transportation system, garbage management and flood control.
Figure 20. Stakeholders Perception on Aspirations of Surakarta and Makassar

The SMERU Research Institute 56
Results For stakeholders, the intended and measurable results mostly are for improvement in welfare condition and in reduction of poverty. To be specific, the results are on the availability of pro poor policies, fulfillment of basic need such as on education, health, housing, transportation, etc. Whilst, again, result for the betterment of urban planning is not so evident.
Figure 21. Stakeholders Perception on Results of Surakarta and Makassar
Strategies
Strategies to achieve the above results as mentioned by the stakeholders are centered on political capital that is around strong leadership, good governance, good coordination among government and non government, committed public servant, community participation, and supportive regulation. In principal, those strategies are not new; in fact those are the existing strategies currently applied by the city governments. The challenge is now on how to make sure that it is implemented accordingly to bring about intended results.
Figure 22. Stakeholders Perception on Strategies of Surakarta and Makassar

The SMERU Research Institute 57
V. WAY FORWARD: TOWARDS A MORE PRO POOR CITY SPATIAL PLANNING
5.1 Institutional challenges For many key stakeholders in the City of Surakarta and Makassar, the interconnection between poverty reduction and city spatial planning mechanism and management is something that they are yet familiar with. The stakeholder and institutional mapping shows that there are still strong conception among the government agency that poverty reduction effort is a sectoral issue, and fail to see their role in the effort. Another significant institutional challenge is the relative absence of poverty analysis in the key planning document, especially the one related to livelihood and spatial elements of poverty. Combined with limited budget and cross sector agency coordination issues, the subsequent poverty reduction programs are still heavily dominated by programmatic approach rather than comprehensive spatial based planning to address poverty. In addition to these institutional challenges, this study also finds that there is still lack of concrete and practical references on the concept of pro poor city planning that makes city spatial planning approach on poverty reduction efforts suffer from lack of emphasis compared to programmatic based poverty alleviation. The institutional arrangement for poverty reduction has provided a wider avenue for participation and engagement for non governmental actors. Despite, challenges in coordination and still limited hard result, the multi stakeholder forum of TKPKD has enable more intensive discussion and enable the NGO’s and other non government actors to have more significant contribution on the formulation of local poverty reduction strategy paper (SPKD). In both cities, key NGO’s has been able to create innovative initiatives to support the formulation of SKPD, including introducing spatial analysis of poverty through the use of poverty map mini atlas. However, other participatory institution, Musrenbang; has not fared well. Still limited participation of wider public, local elite domination and inability of the government agencies to responds to community proposals has created apathy among the public and limit the effectiveness of Musrenbang as key participatory planning system.
5.2 Spatial Vulnerability The participatory poverty assessment of this study has revealed that spatial characteristic plays a significant role in shaping and influencing vulnerability factors and livelihood strategy of the poor. The spatial location of the poor is mainly based on the availability of access the urban economic activities. This study found that the urban poor communities that are closest to the urban economic centers are experiencing a livelihood improvement. However, these economic access can also be undermined by other spatial characteristic that can increase livelihood vulnerability such as disaster prone areas.

The SMERU Research Institute 58
5.3 Recommendations for Way Forward • Future urban poverty programs should be based on spatial condition and livelihood analysis to increase programs effectiveness in reducing the vulnerability of the poor. The poverty reduction efforts in both cities have not adequately touch the spatial dimensions of poverty, and therefore have not been able to provide comprehensive livelihood protection for the poor, especially the one who lives in high risk areas.
• There should be more comprehensive poverty data management. This especially the one that is already integrated to spatial information system such as poverty map and vulnerability map. This information is vital to enhance the effectiveness and resource allocation efficiency of future poverty reduction efforts.
• Poverty analysis should be integrated to current urban spatial plan master document (RTRW). More systematic study should be done to assess and to some level predict the impact of future development to the livelihood of the poor.
• Current social protection program scheme should take account of actual livelihood condition of the poor to better address the vulnerability factors. The fact that the highest cost of being sick is not the medical service itself but the opportunity and the transaction cost have to be taken into account in the future program scheme.
• Increasing poor access to more sustainable financial institutions is imperative to reduce vulnerability factors of the poor in the long run. One of the biggest vulnerability factors for the poor is unsustainable debts. Therefore, the future social protection programs should focus on how to provide the poor money in timely and sustainable manner.
• There should be more comprehensive evaluation and assessment system for pre and post program. The studies found that there are still lacks of information on outcome of programs that have been implemented in both cities. For example, there have been no follow up study on whether street peddler relocation into traditional market in Solo and street vendor along the Losari beach in Makassar has improve their livelihood.
• There is a need for revitalization of participatory planning systems and institutional strengthening of TKPKD. Despite all the challenges and shortcomings, this institution is very strategic and has a lot of potential for greater poverty mainstreaming and more effective poverty reduction programs.
5.4 Future Challenges The main challenge is to inform key city spatial planning and decision makers about the poverty problem in the area. While poverty always seen as key problem, there are still relatively less is known about it. Therefore, there is urgent need to build strong connection between urban poverty and city spatial planning, in order to have more sound poverty reduction effort.

The SMERU Research Institute 59
Build concrete and practical references on the concept of pro poor city spatial planning. The lack of clear and operational guidelines on pro poor city planning has created an urgent need for a more comprehensive and readily applicable guideline for the local government on how to mainstream poverty issues in urban planning and how to create a more pro poor urban planning. Follow closely the implementation of the spatial and regional planning document (RTRW) and its impact on poverty conditions and poverty reduction efforts. Regardless of the fact that the current plan was made without taking into account poverty issues, the central position of the plans makes it an important document to followed and analyzed.

The SMERU Research Institute 60
LIST OF REFERENCES United Nation (2010) “World Urbanization Prospects: The 2009 Revision” [online]
<http://esa.un.org/unpd/wup/Documents/WUP2009_Highlights_Final.pdf> [1 Desember 2011].
Imura, Hidefumi, et al. "Urban Environmental Issues and Trends in Asia--An
Overview." International Review for Environmental Strategies 5.2 (2005): 357-381. Academic Search Premier. EBSCO. Web. 3 Nov. 2010.
Birch, Euginie L. and Susan M. Wachter (2011) Population and Development Review Vol.
37, Issue 3. [online] <http://www.google.co.id/url?sa=t&rct=j&q=global%20 urbanization%20birch%20wachter&source=web&cd=5&ved=0CDoQFjAE&url=http%3A%2F%2Fcis.uchicago.edu%2Foutreach%2Fsummerinstitute%2F2011%2Fdocuments%2Fsti2011-clark-world_urbanization.pdf&ei=d-LeTrW9BsLZr QfD 8aXpCA&usg=AFQjCNEEQtl59Rm8HWDJ_gjhyZrEB-8RSg&sig2=551 SqsWdz37 irinvHFF-7A&cad=rja> (6 December 2011)
Badan Pusat Statistik (2006—2011) Berita Resmi Statistik: Profil Kemiskinan di
Indonesia [online] <http://www.bps.go.id/aboutus.php?nl=1&news= 1&kategori=1&kl=1> (18 Juli 2009)
Badan Pusat Statistik (2007) Data dan Informasi Kemiskinan 2005—2006 Buku 2:
Kabupaten/Kota. Jakarta: BPS. Badan Pusat Statistik (2008) Data dan Informasi Kemiskinan Tahun 2007 Buku 2:
Kabupaten/Kota. Jakarta: BPS. Badan Pusat Statistik (2009) Data dan Informasi Kemiskinan Tahun 2008 Buku 2:
Kabupaten/Kota. Jakarta: BPS. Badan Pusat Statistik (2009) PDRB Sektoral Kab/Kota di Indonesia Tahun 2009. Badan Pusat Statistik (2006—2010) Kota Surakarta Dalam Angka. Surakarta: BPS. Laporan MDG, Bappenas, 2010 Cooperrider, Whitney, and Stavros (2003). Appreciative Inquiry Handbook: The First in a
Series of AI Workbooks for Leaders of Change, Lakeshore Communications, Cleveland, OH.
Jacqueline Stavros, David Cooperrider & D. Lynn Kelley (2003). Strategic Inquiry �
Appreciative Intent: Inspiration to SOAR A New Framework for Strategic Planning Pari Baumann and Subir Sinha, Linking Development with Democratic Process in India:
Political Capital and Sustainable Livelihood Analysis (ODI, Natural Resource Perspective, Number 68, June 2001)

The SMERU Research Institute 61
Summner, Andy and Rich Mallet, Snakes and Ladders, Buffers and Passports: Rethinking Poverty, Vulnerability and Wellbeing, Institute of Development Studies, Sussex, Working Paper number 83, August 2011

The SMERU Research Institute 62
APPENDIX 1.
Detailed Research Activities
Kota Surakarta Phase 1: Public Consultation 1: Key Stakeholders Mapping
� Time of Visit: 24 – 31 January 2011 � Activities:
1.In-depth interviews with key stakeholders
• City Governments (Mayor, Vice-Mayor, Regional Secretary, Regional Development Planning Board, Central Bureau of Statistics, Local Government Offices, Regional Coordinating Team for Poverty Reduction)
• NGOs (Pattiro, Gita Pertiwi, Konsorsium NGO, Surakarta Kota Kita)
• Academicians • Central Bank of Indonesia
2. Secondary Data Collection
• Publications from Central Bureau of Statistics (social-economy indicators)
• Data on Beneficiaries of Social Protection of health care and education services
• Local regulations, etc • Planning Documents: mid-term and long-term regional
development plan, Urban Planning and Urban Land Used,
3. Field visit • Kelurahan Sangkrah: one of the poor area in City of Surakarta
Phase 2: Participatory Workshop and the conduct of Participatory Poverty Assessment in three selected kelurahan
� Time of Visit : 5-14 April 2011 � Activities:
o Participatory Workshop (6 April 2011) o PPA in three kelurahan (7-14 April 2011): FGD, In-depth interviews,
observation
Phase 3: Public Consultation 2: Verification of Issues, GIS Mapping and Disseminations Workshop
o Time of Visit: 15- 19 Oktober 2011 o Activities:
o Verification and GIS Mapping: 15 – 19 October o Disemination and SOAR Workshop: 18 October 2011

The SMERU Research Institute 63
Kota Makassar Phase 1: Public Consultation 1: Key Stakeholders Mapping
� Time of Visit: 8 -18 February 2011 � Activities:
1.In-depth interviews with key stakeholders
• City Governments (Regional Secretary, Regional Development Planning Board, Central Bureau of Statistics, Local Government Offices, DPRD, BKPRD)
• NGOs (KUPAS, YASMIP, FIKORNOP) • Academicians • PNPM • Central Bank of Indonesia
2. Secondary Data Collection
• Publications from Central Bureau of Statistics (social-economy indicators)
• Data on Beneficiaries of Social Protection of health care and education services
• Local regulations, etc • Planning Documents: mid-term and long-term regional
development plan, Urban Planning and Urban Land Used,
3. Field visit • Kecamatan Mariso: one of the poor area in City of Makassar
Phase 2: Participatory Workshop and the conduct of Participatory Poverty Assessment in three selected kelurahan
� Time of Visit : 20-29 March 2011 � Activities:
o Participatory Workshop (23 March 2011) o PPA in three kelurahan (23 – 29 March 2011). FGD, In-depth interviews
Phase 3: Verification of Issues, GIS Mapping and Disseminations Workshop
o Time of Visit: 27 October – 2 November 2011 o Activities:
o Verification and GIS Mapping: 27 October – 2 November 2011 o Disemination and SOAR Workshop: 1 November 2011

The SMERU Research Institute 64
APPENDIX 2.
Profile of Kelurahan PPA in Kota Surakarta and Kota Makassar
Kelurahan PPA in Kota Surakarta
Kel. Kemlayan
(Kecamatan Serengan)
Kel. Sangkrah (Kecamatan Pasar
Kliwon)
Kel. Mojosongo (Kecamatan Jebres)
Livelihood Typology
Informal workers, street food vendors, pedicab driver, parking service
Informal workers, hawkers, scavengers, casual labors
Low-end Formal Industrial Workers (permanent, contract, daily paid workers), craftsmen, scavengers
Location Inner City Along the river bank of Bengawan Surakarta
Peri-urban (northern part of the City of Surakarta)
Area (Km2) 0,452 Km
2 0,532 Km
2 (35 RW
and 180 RT)
Population (Total) 3.902 11.193 people 42.545 (March 2011)
Men 1.863 21.232
Women 2.039 21.313
Number of Households
1.171HH Around 3.000 HH 11.733
Specific Issues Trade centre of Surakarta
- One of the ’old town’ in the area
- Limited public space
- Issue of Magersari (people living in other’s people or government land)
Concentration of poor people
- Very vulnerable to frequent flooding: from the big and small river
- Case of relocation (area of origin)
Less developed area compare to southern part of the city
- Future spatial planning: to be a new developed middle class settlement
- Coexist with informal settlement usually lived by the poor
- Location of garbage dump site
- Relocation destination area
- There is concentration of the poor in several RW

The SMERU Research Institute 65
Kelurahan PPA in Kota Makassar
Kel. Barabaraya Utara
(Kecamatan Makassar)
Kel. Tallo (Kecamatan Tallo)
Kel. Daya
(Kecamatan Biringkanaya)
Livelihood Typology Predominantly: informal sector workers (casual workers, street food vendors, pedicab driver, etc)
Predominantly: Fish persons, informal sectors workers related to fishing activities: casual labor, etc
Mix of formal and informal sector workers (at industrial site)
Location Inner city Along the river, Tallo Peri-urban
Area (Km2) 0,61 Km
2 0,625 Km
2
Population (Total) 5.823 people 8.004 people 13.595 (BPS, 2010)
Men 2.888 3.974 people 6271 (46%)
Women 2.965 4.030 people 7324 (54%
Number of Households 1364 1.508 3171
Specific Issues Concentration of poor people
- Location of ’slum’ area (in several RW)
- A lot of migrants
Urban community with more rural characteristics (fishing community)
- Future spatial plan: port area development and river transportation
The biggest industrial site in City of Makassar (KIMA)
- Trade (wholesaler) centre
- Land conversion: from swamp area into industrial site

The SMERU Research Institute 66
APPENDIX 3.
Who Are the Poor?
Characteristics of the Poor in Three Kelurahan in Kota Makassar
Characteristics Kelurahan Daya
(Poor)
Kelurahan Bara Baraya Utara
(Poor)
Kelurahan Tallo
(Poor & Very Poor)
Occupation
- Casual workers
- Construction workers
- Motorcycle driver (ojek)
- Street vendors
- Casual workers (daily paid laborer)
- Construction workers
- Pedicab drivers
- Motorcycle drivers
- Scavangers (Payabo)
- Household maid
- Wash person (female)
- Street food vendor
- Other services
Poor Group:
- Non-permanent /irregular job
- Small scale fish persons
- Construction workers
- Casual workers Very Poor:
- Non-permanent jon
- Fish labour (do not own boat)
- Scavangers
Income
- less than Rp40,000 per day
- Below Rp 1-2 million per month
Poor
- Rp25.000 per day Very Poor
- Rp100rb/bulan (sangat miskin)
Asset Ownership (House, etc)
- Renting house
- Have motorcycle (buy in credit)
- Do not have other valuable assets
- Renting house, condition: corrugated roof, bamboo wall, dirt floor
- Have motorcycle (buy in credit)
Poor:
- Housing condition: dirt floor, bambool wall, roof made from Nipah leafs
- Do not own access to electricity (using neighbour’s connection)
- Do not have savings
- Own a wooden boat (kantinting 5,5 PK)
- Have simple net and fishing rod
- Have a bicycle Very poor:
- Size of houses is very small
- Do not own vehicle or electronic devices
- Do not have saving
- Have debts at local stalls
Land ownership
- Conflict over land; claim between children and their parents
- Do not have land sertificate (only rincik)
- - Do not have land ownership
Education - Unable to continue high schools, particularly Senior High School or higher
- SD-SMP (elementary – junior high school)
- Finish elementary school
- Drop outs (could not afford to send children to school)
- Chidren do not go to schol

The SMERU Research Institute 67
Characteristics Kelurahan Daya
(Poor)
Kelurahan Bara Baraya Utara
(Poor)
Kelurahan Tallo
(Poor & Very Poor)
Health
- Able to access to Puskesmas only.
- Going to Puskesmas and Posyandu (community health centre) to have medical treatment
- Private midwives
- Traditional healer
Poor
- Going to Puskesmas and Posyandu (community health centre) to have medical treatment
- Self medication: buying cheap medicine at local store
Very poor:
- Very vulnerable to disease/sickness
Sanitation and Clean Water
- Dug wells
- Artesian wells (manual)
- - Do not own latrine
- Helicopter latrine
Life Style/Clothes/Hobby
- Only able to purchase the used clothes ( baju cakar as locally called)
- Buy clothes at the traditional market
- Playing card, chess
- Buy clothes once a year
Eating Pattern - Still three times a day, but without any side dish
- Ony have one type of side dish
- Irregular eating pattern
Poor Eating twice a day Very Poor:
- Eating irregulary
Social Interaction
- - Helping each other -
Area of Origin - Jeneponto, Takalar, Maros (Makassar)
- Pinrang, Bone
- NTT
- Sinjai
- Jeneponto
- Flores
- Toraja
- Migrants
Number of children
- More than 3 children - - 5 to 6 children

The SMERU Research Institute 68
Characteristics of the Poor in Three Kelurahan in Kota Surakarta
Characteristics Kelurahan Mojosongo
(Poor) Kelurahan Kemlayan (Poor & Very Poor)
Kelurahan Sangkrah (Poor)
Income - Less than Rp30.000 Poor: - Rp 500.000 –
Rp1.000.000 per month Very Poor: - Less than Rp 500.000
per month
- Irregular income - Around Rp15.000 per
day - Wage of Construction
workers: Rp 50.000 per day
- Wage of construction assistance: Rp30.000 per day
Occupation - Street vendor - Casual labor - Pedicab driver - Scavengers - Farmers - Do not own business
Poor: - Casual workers - Mechanics - Parking services - Pedicab driver - Small food vendor - Employer at small
garment industries Very Poor: - Unemployed most the
time. - Casual workers - Helpers (depend on the
needs)
- Irregular job - Scavangers - Street singers - Scavangers - Pedicab drivers - Small food vendor - Casual workers - Construction workers - Beggars
Education - Low education level (junior high school)
Poor: - SD, SMP Very poor: - Mostly do not go to
school - Some are enrolling in
non formal education package
- SD to SMP (unfinished)
Assets Ownership
- Own simple permanent house; inherited from the parents: floor from dirt
- Renting house - Magersari (living in
other’s people or government land)
- Do not own land sertificate
- Source of Clean water: using collectively
- Do not own direct connection to electricity (using neighbour connection)
Poor: - Living in small size
house - Magersari - Using public toilets Very Poor: - Similar to that of poor
group, some are even worse, do not own house at all
Do not have savings
- Own a bicycle - Using public toilets - Do not own direct
connection to electricity (using neighbour connection)

The SMERU Research Institute 69
Characteristics Kelurahan Mojosongo
(Poor) Kelurahan Kemlayan (Poor & Very Poor)
Kelurahan Sangkrah (Poor)
Health - Going to Puskesmas - Using Health Card
(Jamkesmas) and PMKS gold (provided by city governments)
Poor: - Using PKMS Gold Very Poor: Jamkesmas
-
Source of capital/financial assistance
- Middlemen (with exhorbitant rate of interest)
- Local cooperatives
- Loan shark -
Eating Pattern
- Eat once or twice a day - Shop in street vendors
or traditional market
- - Eat with less nutritios food
Life Style - No plan for recreation at all
- Do not allocation for recreation
-
Number of children
- Most admitted that those with more than 3 children are the aged parent group. The poor young families tend to have less than three children
- - More than 3 children

The SMERU Research Institute 70
APPENDIX 4
Stakeholder Mapping of Kota Surakarta Power and Interest on Poverty Mainstreaming in City Spatial Planning
Stakeholders Department /
Section
Key Organizational Role on Spatial Planning and
poverty (actual)
Initiative / projects
Knowledge and Perspective on the Issues
Main Fears and Interest
Interest on the Mainstreaming
Power on the Mainstreaming
Major office
Major ● Poverty Reduction management programs
● managing street vendors
● Kampung Improvement
● City Walk
● Health (POM) and Education (BPMKS) assistance
● revitalization of traditional market
● One Stop Service (Business processing and administrative matter)
● Holding a vision: Surakarta as cultural and pro-poor city
● Focused on 'big' programs seen through "collective management" (Kampong Improvement)
● Limiting the development of modern market (shopping mall)
● Revitalizing traditional market
● Managing street vendors
(+) image of a solo as a cultural city and a city that has good governance.
High, PKL structuring programs and traditional markets already reflect an understanding of spatial planning poverty,
High the mayor is a visionary and hands on in making policies and programs.
Deputy Mayor ● Poverty reduction management programs
● Main role: Various opens up the opportunity for program implementation
● Very much involved in risk management and political issues during poverty reduction program implementation
(+) Implementation of local government programs.
Local Government Secretary
● Management of Poverty Reduction program
● Having experiences working with donors
● Seeing poverty as an impact of urbanization
● Seeing lack of coordination in poverty reduction effort
(+) Implementation of local government programs.

The SMERU Research Institute 71
Stakeholders Department /
Section
Key Organizational Role on Spatial Planning and
poverty (actual)
Initiative / projects
Knowledge and Perspective on the Issues
Main Fears and Interest
Interest on the Mainstreaming
Power on the Mainstreaming
Among SKPD, having many programs unclear
Regional Development Planning Agency (Bappeda)
Secretary,
● Planning Coordinator and management of poverty reduction programs
● PKMS
● BPMKS
● PKH
● of PNPM
● TKPKD
● Raskin
● Rehabilitation of slum settlement Danukusuman
● Having difficulty in coordinating poverty reduction program, the central govt to bypass Bappeda in program implementation
● Working on poverty databases in ' menu 'form to accommodate the program from CSR
● Having collaboration with TKPKD to strengthen musrembang and formulating SPKD
Medium, Seeing poverty as a strategic target but not yet have a strategy of spatial issues related to poverty
High
Physical and Infrastructure
● Planning and controlling the implementation of infrastructure projects
● Involved in Relocation process of people along the river side of solo
● Coordinator of BKPRD
● Land ownership as main cause of poverty
● Do not have regulations in place about tenant
● Do not see Their main tasks and functions directly related with poverty reduction
Low, has the technical capacity, but see poverty as the other sectors leading field
High
TKPKD Local Coordination Team For Poverty Reduction.
● Formulating SPKD
● Monitoring the implementation of poverty reduction programs
● SPKD Formulating
● Problems of coordination with other government agencies
● Unclear authority and technical operation of TKPKD – hamper Their performance,
High SPKD being designed is accommodating a spatial analysis of poverty issues.
Medium, a strategic forum, but have not worked in full.
BKPRD
Bappeda Physic and Infrastructure as Secretary
● Multi agency coordination forum on urban spatial management.
● Infrastructure Development projects
● Discussion forum for formulation RTRW progress.
● Technical discussion
● Have not operated normally yet, each agency is busy.
● (+) Stipulation of RTRW and implementation of physical infrastructure.
Low, not focusing on the issue of poverty
Medium, potential as a forum to help mainstreaming in the planning but has no authority.
Bappermas People's Empowerment Agency
● Leading sector in poverty reduction;housing improvement
● Child friendly city
● Relocation of people along the river banks
● The alleviation of poverty is often constrained by the lack of poverty data integrated and used by all SKPD.
Medium, Leading sectors in poverty reduction programs, but do not yet have planning strategies
High, has the authority and technical capacity in the implementation of

The SMERU Research Institute 72
Stakeholders Department /
Section
Key Organizational Role on Spatial Planning and
poverty (actual)
Initiative / projects
Knowledge and Perspective on the Issues
Main Fears and Interest
Interest on the Mainstreaming
Power on the Mainstreaming
● RTLH
● Relocation of street vendors
● P2MBG (gender-based community empowerement)
● A main constraint of Relocations is land ownership.
● The main problem of slum upgrading program is waiting for funds from the central
that accommodate spatial issues of poverty.
poverty alleviation program.
PU / Public Worksagency
● Technical planningin infrastructure development, housing, drainage, sanitation and clean watersystem
● SLBM(community-based environment sanitation)
● Seeing the management of city government is currently effective (residential program Danukusuman)
● Rusunawa programs that exist today have not been effective because the mechanism of the rent burden the poor.
● municipal government should have greater authority in the planning and management of sanitation program
● Existing RTRW is still too abstract and not enough detail in planning the direction of urban development.
Medium,
Medium,have the technical capacity, but still follow the plan of the Bappeda and Mayors.
Urban Spatial Agency
● Controlling land utilization
● The issuer of building permit (IMB)
● Giving technical recommendation on building and infrastructure development According to RTRW
● Issuing building permit (IMB)
● The main challenge in alleviating poverty in the Solo is the coordination among SKPD
● Existing programs such RTLH improvement only improvements in housing condition, not on environment conditions.
● Focusing on aspects of the provision of space and land ownership for the poor.
Medium, see the link between main task and function with poverty reduction efforts, but there is no clear strategy.
Medium has oversight authority of space, but do not have planning role.
Social Agency ● Handling street children and neglected people
● Skill training and upgrading of
● Focuses on giving social assistance to vulnerable
Medium, has main task and function close to poverty alleviation, but has
Medium, has oversight authority of space, but has no role

The SMERU Research Institute 73
Stakeholders Department /
Section
Key Organizational Role on Spatial Planning and
poverty (actual)
Initiative / projects
Knowledge and Perspective on the Issues
Main Fears and Interest
Interest on the Mainstreaming
Power on the Mainstreaming
● Working in accordance with Ministry of Social Affairs and Ministry of Manpower
● Health Care Service
● Job Fair
● Social Institution
groups.
not been associated with spatial issues.
in planning.
Market Agency ● Managing and
developing traditional market
● Renovating traditional market
● Relocating street vendors into traditional market
● development and empowerment of traditional markets become one of the main vision of the mayor
● Budget allocation is large enough, for the renovation market. Of the 42, only 11-13 markets are renovated.
● Consideration of access and promotion has been taken into account in establishing new markets which were located at opposite ends of town
● There are no studies or monitoring of street vendors who see a change in income after relocated to the market.
● There are some problematic cases because the development of markets or stalls is not adequate so that vendors do not want to move.
Low, though very influential on the livelihoods of the poor, cannot see its role in poverty reduction
High, has the potential and direct role in poverty reduction, especially related to issues of spatial location sought for the poor.
Non-Governmental
Academician
State University Lecturer (Dept.of Sociology)
● Observant of poverty policies in Solo
● Involved in Various projects with donors on City Planning
● City Development Strategy
● There is often a lack of coordination between the mayors with SKPD. SKPD deemed unable to balance the mayor's vision
● is very visionary mayor but has not been able to strengthen the performance of SKPD
● Poverty in Surakarta: many
High, Having extensive experience and knowledge about poverty and problems in the government, but do not yet have a strategy regarding the issue of spatial poverty.
Low, outside the structure.

The SMERU Research Institute 74
Stakeholders Department /
Section
Key Organizational Role on Spatial Planning and
poverty (actual)
Initiative / projects
Knowledge and Perspective on the Issues
Main Fears and Interest
Interest on the Mainstreaming
Power on the Mainstreaming
northern areas a little more development.
● Starts to have synergies between programs such as PNPM with DPK.
● Problem of poverty in Surakarta mainly due to the urbanization of residents with low human capital
Solo Kota Kita (NGO)
● partner in Government TKPKD
● Involved in formulation of SPKD and RPJM Kel
● Strengthening Musrembang
● City Wide analysis Poverty
● Poverty Mapping at Kelurahan
● SPKD and RPKM Kelurahan
● Viewing municipal government poverty alleviation effort has not accommodated spatial aspects of poverty.
● Focusing in strengthening and mentoring musrembang using a mini atlas
● Engage with the UN habitat in the city wide poverty profile.
● Currently preparing SPKD and plans to assemble RPJM Kelurahan.
High, has a strong understanding of spatial issues of poverty and have the initiative that lead to mainstreaming the issue of spatial poverty.
High, involved in TKPKD and formulating SPKD. NGOs are the most involved with city government and have powerful resource.
Consortium Solo
Secretary and members of the consortium (Gita Pertiwi NGO)
● members and partners in local government TKPKD
● communication between the NGO Forum
● Advocacy in Poverty alleviation field.
● TKPKD
● Strengthening Musrembang
● Advocacy through talk show host on radio
● Bappeda deemed not to proceed with the relevant information related to SKPD
● TKPKD Forum has not been effective because the government often occur rotational position
● many policies that tend to be a ‘light houses’ program
● Coordination SKPD in poverty programs is still weak.
Medium, poverty is the central issue within organization, but still on discourse and program-oriented, with no specific spatial issues yet
Low, no significant output.

The SMERU Research Institute 75
Stakeholder Mapping of Kota Makassar Power and Interest on Poverty Mainstreaming in City Spatial Planning
Stakeholders Department/
Section
Key Organizational Role on Spatial Planning and
poverty (actual)
Initiative/ projects
Knowledge and Perspective on the Issue
Main interest and fears
Interest on the Mainstreaming
Power on the Mainstreaming
Mayor office Local government Secretary.
• Poverty programs management
• Coordination with extra government stakeholders (NGO’s, Donors)
• Makassar 5 Gratis
• Experience in engaging with donors and NGOs
• Open to suggestions and partnership with nongovernmental stakeholders.
• High concern on the lagging implementation of Mamminasata plan.
• (+) Managing Governemnt realtions with other non governemt stakeholders.
• (+)Increase Makassar reputation as city with innovative and pro poor policies.
High, Sees poverty as strategic issues for the city.
Medium, Have high oversight authority, but no direct control on implementation.
Physical and Infrastructures Division
• Leading sector on Spatial planning document (RTRW)
• BKPRD and AMPL Taskforce coordinating secretary.
• Coordinating agency on infrastructure development and liaison function with PNPM Program.
• AMPL Taskforce.
• RTRW Formulation
• Street peddler relocation and management program.
• High knowledge on the interconnection between poverty and spatial planning but no clear strategy on the implementation.
• Have no monitoring system in place to assess the outcome of spatial development effect to the poor.
• Sees Problem on the regulation enforcement, the poor mentality of the public, and especially the poor and inter agency ego on coordination.
• (+) Spatial planning for good city image.
• (-) Public perception that the city spatial planning is not pro poor and failed to address poverty issues.
Medium, have clear understanding on the interconnection between poverty and spatial planning, but no idea on the implementation.
High, have authority and direct control over city spatial planning and implementation.
Regional Development Planning Agency (Bappeda)
Social and Economy Division.
• Leading sector in city social protection program implementation
• Little to no role on city spatial planning
• Coordinating agency for Makassar Bebas program.
• Makassar 5 Gratis
• PKH
• Emphasize the poverty issues as a result of migrant and argues that majority of the poor is not local Makassar resident.
• Sees the needs of more comprehensive action plan to address urbanization, especially from surrounding districts into Makassar.
• Have no clear awareness on the interconnection between poverty and spatial planning.
• (+) good perception on the implementation of city social protection program, especially Makassar 5 gratis program.
• (-) negative image on city social protection program and ability to address poverty.
High sees poverty as top issues on agency mission list, but no clear idea on how to incorporate spatial issues on poverty to current poverty reduction initiative.
High, have clear role and management oversight authority and direct control on the planning and design of social protection programs.

The SMERU Research Institute 76
Stakeholders Department/
Section
Key Organizational Role on Spatial Planning and
poverty (actual)
Initiative/ projects
Knowledge and Perspective on the Issue
Main interest and fears
Interest on the Mainstreaming
Power on the Mainstreaming
Local Coordination Team For Poverty Reduction. (TKPKD)
NGO YKPM
• Secretary of TKPKD
• SKPD Formulation
• Government policy Watchdog
• Poverty issues advocate and activist in Makassar.
• SPKD
• Have not touch much on spatial issues of poverty, mainly on program implementation and budget.
• Sees main poverty problem on policy implementation, corruption and collusion between the government and private sectors.
• The government has not take accounts of the poor on many major policies, especially the one that involves private investment.
• (+)a clearer and stronger authority of TKPKD
• (-) TKPKD become Irrelevant.
High, but no clear action plan and strategies on the mainstreaming of spatial issues on poverty
Low, have no clear mandate and still have coordination issues.
BKPRD
Headed by the head of Physical and Infrastructures Division in Bappeda Office
• Multi agency coordination forum on urban spatial management.
• Coordination forum for physical and infrastructure projects implementation
• Discussion forum for RTRW formulation progress.
• Activities limited to Technical discussion and coordination of ongoing physical projects (i.e. coordination for cable installation by PLN)
• No role on spatial planning
• The smooth implementation of physical infrastructure projects.
Low, no focus poverty
Medium, have a potential as a discussion and coordination forum in poverty mainstreaming.
People’s Empowerment Agency (BPM)
• Leading sector on SPKD formulation
• Key manager of poverty data
• Coordinating agency for poverty reduction programs in Makassar
• Key member in TKPKD
• SPKD
• Makassar 5 gratis
• PKH
• Programmatic rather than area wide planning focus on poverty reduction effort.
• focus on labor intensive programs for poverty reduction
• Has questioned the validity and accuracy of BPS poverty data and current poverty data used for social protection programs.
• Emphasize the poverty issues as a result of urbanization and argues that majority of the poor is not local Makassar resident.
• (+) Successful implementation and image of Makassar 5 Gratis program.
• (-) negative view and perception on Makassar 5 gratis program.
High, poverty as main task and function of the agency.
High, main holder of poverty data and coordinating agency on Makassar 5 Gratis program.

The SMERU Research Institute 77
Stakeholders Department/
Section
Key Organizational Role on Spatial Planning and
poverty (actual)
Initiative/ projects
Knowledge and Perspective on the Issue
Main interest and fears
Interest on the Mainstreaming
Power on the Mainstreaming
PU / Public Works agency
• Leading sector on the implementation of physical infrastructure programs.
• Main technical planner on physical infrastructure development project.
• Intensive relation with donor and central government agency (main liaison point and “gate keeper”)
• Member of BKPRD and AMPL Taskforce.
• Pamsimas
• Swash
• NUSSP
• PNPM Mandiri
• AMPL
• Have City wide Infrastructure Development Plan from technical assistance project form central government but has not been implemented.
• Have high technical capacity on planning but limited role in spatial planning and poverty reduction.
• (+)Implementation of physical projects.
Medium, Several personnel within the agency have sees the interconnection between poverty and city spatial planning, but has not become the main perception of the agency.
High, Leading sectors of many physical infrastructure program implementation and high technical knowhow and capacity.
Member of Local Parliament
Member of PDK Fraction
• Oversight and budgeting function
• Regulation and law legislation.
• Budgeting and policy oversight.
• Constituents visit
• Lack of comprehensive budget planning on poverty reduction programs.
• Public housing programs still challenged by design and oversight issues.
• A main urban spatial issue in Makassar is the lack of enforcement and lack of public spaces.
• (+)Increase in electability
• (-)Bad image
High, high awareness on the interconnection between poverty reduction and spatial planning
Medium, have oversight capacity but have limited role on direct control and implementation of the programs.
Urban Spatial Agency
• Technical Executing agency of City spatial planning that have been formulated by Bappeda.
• The issuer of building permit (IMB)
• No role on city spatial planning.
• Free Building permit for the poor program
• Member of BKPRD forum.
• Sees no direct connection between its main task and function with poverty reduction
• Have contribution through free building permit issuance program for the poor who wants to upgrade their house.
• Sees main problem on the lack of enforcement and corruption.
Low, does not see any connection with poverty reduction.
Medium, Have technical knowhow and capacity on urban spatial issues, but no direct role on spatial planning.
City Level National Land Agency (City BPN)
• Issuance of Land Certificate.
• Monitoring and oversight on building permit.
• Free Land titling and certification program
• Land Consolidation program.
• High awareness on city spatial planning and poverty connection.
• Have informally produced citywide slum area mapping.
• On land titling and certification
Medium, high awareness on the interconnection between poverty reduction and spatial planning,
Low, no control over planning, but potential role on land certification for the poor.

The SMERU Research Institute 78
Stakeholders Department/
Section
Key Organizational Role on Spatial Planning and
poverty (actual)
Initiative/ projects
Knowledge and Perspective on the Issue
Main interest and fears
Interest on the Mainstreaming
Power on the Mainstreaming
for the poor to be used as assets and capital.
• Sees the problem on inter agency coordination
• Main problem on poverty is the illegality of their land.
but no clear plan on the implementation.
Social Services Agency
• Social protection programs on street kids, destitute, and other persons who live with social disability.
• Assistance for Productive economic activities
• Inhabitable house rehabilitation program.
• small business group
• PKH
• Focusing on empowerment and provide social assistance for the destitute mostly by providing micro loan for business.
• One of leading sectors in the implementation of Makassar 5 gratis program.
• (+) Successful implementation and image of Makassar 5 Gratis program.
• (-) negative view and perception on Makassar 5 gratis program.
High, high awareness and interest on poverty issues, but low awareness on spatial issues of poverty.
Medium, Have direct control over implementation of social protection programs, but limited role on program planning.
Market Agency
• Traditional market
management
• Management traditional market and street peddlers.
• Sees traditional market revitalization and development as strategic to poverty reduction.
• (-)Expansion of modern market
• (-) negative views on traditional market, especially on cleanliness and safety.
Low, does not see any direct connection
Medium, no authority over planning, but potential role on more pro poor market management.
Lembaga Non Pemerintah
Kupas
• advocating Pro poor budgeting
• Musrembang monitoring and assistance.
• Local poverty indicator formulation.
• Member of TKPKD
• Supported by Ford foundation
• Musrembang on line database
• Makassar / Website on poverty data in Makassar.
• Local poverty indicators survey
• TKPKD
• Focusing on the use of information technology to support musrembang implementation.
• Sees government commitment on poverty reduction mainly from the budget allocated for social protection programs.
• Have MOU on the budget information access with city government.
• (+)Increase exposure in city and national level.
• (-)sees as not independent
High, have high interest on poverty mapping and comprehensive poverty data.
High, High capacity and good relation with city government. Have high influence in city level.

The SMERU Research Institute 79
Stakeholders Department/
Section
Key Organizational Role on Spatial Planning and
poverty (actual)
Initiative/ projects
Knowledge and Perspective on the Issue
Main interest and fears
Interest on the Mainstreaming
Power on the Mainstreaming
Provincial level
• Program management on Provincial level.
• Core PNPM Program management.
• Sees PNPM implementation in urban areas difficult.
• PJM Pronangkis produced by the program has not been synchronized with city development planning
• (+) More significant PNPM Role on development planning.
• (-) sees as irrelevant and insignificant.
High, PJM Pronangkis is the most spatially sensitive poverty reduction plan document.
Medium, Have independent funding from central government but have limited role on city wide spatial planning.
PNPM Program
City Level management
• Program management on City level.
• urban PNPM Program
• ND (neighborhood development program) in 8 kelurahan
• Sees poverty as a result of urbanization
• Conflict between BKM and LPM
• Sees ND program has focused on settlement wide planning program, but sees potential problem on how it will coordinate with city development plan.
• (+)Significant PNPM Role on development planning.
• (-) sees as irrelevant and insignificant.
High, PJM Pronangkis is the most spatially sensitive poverty reduction plan
Medium, Have independent funding from central government but have limited role on city wide spatial planning.
Yasmib • Advocating Pro poor
budgeting
• Political contract with mayor
• MOU Access to budget and agency work plan information.
• Sees current program planning and budgeting have no clear target on poverty reduction.
• Involved in the development of flat in mariso.
• (+)Increase exposure and influence in city and national level.
(-)sees as not independent
Medium, more focused on advocating pro poor budget and monitoring.
Low, not a member of TKPKD
Fikornop
• Inter NGO Communication forum in Makassar
• Information sharing and capacity building network.
• Advocacy work based on SMERU poverty map.
• Musrembang institutional strengthening
• Sees, poverty reduction still mostly sector affairs, no comprehensive approach/
• Musrembang is still overly technocratic system, no actual political empowerment for the poor
• Many NGO’s has no information on Spatial issues of Poverty. For example vary little NOG does advocacy work to make RTRW draft more pro poor.
• (+)Increase exposure and influence in city and national level.
(-)sees as not independent
Medium, More focus on budget and monitoring
Low, Not a member of TKPKD, but has potential as one of the early NGO network in Makasasr.
PDAM Kota Makassar / Local Clean Water Company
• Clean water services
• Water and sanitation Infrastructure development
• Member of AMPL Working Group
• Pamsimas
• Swash Care
• Water distribution by water tank truck.
• AMPL Task Force
• Sees connection between spatial development and poverty
• focus on profit, so it will need extra investment to develop infrastructure in low income area
• (-) financial losses.
• (+) Profit
Medium, aware on the connection and have high experience in collaboration with donor.
High, have high technical capacity and knowhow. Leading sector in water infrastructure development and service.

The SMERU Research Institute 80
APPENDIX 5
SOAR Results – Kota Surakarta
Aspects Strengths Opportunities Aspirations Results Strategies
Political Capital
Leadership ● Currently Surakarta has a visionary leadership
● Visionary Mayor
● Reliable continuous leadership
Policy, programs, good governance, branding
● Branding strategy: friendly city of PKL Solo, Solo transportation management city
● Existence of government policies for the implementation of small business for the poor
● policies that support poverty reduction -> TKPK
● Many assistance programs such as BPMKS, PKMS, etc
● Conducive conditions, implementation of the municipal government programs do not cause anxiety, such as market relocation, control of street vendors, etc.
● City Government is always kept its promises
● Assistance for school fee
● Structuring PKL (street vendors)
● TKPKD
● Establishment of bureaucratic systems and policies that work and efficient
● Better serve the basic needs of citizens
● A lot of ad hoc teams based on issue, such as TKPKD, Tim CSR, consumer disputes, etc.
● Education programs
● Program grant
● SKPD programs
● PNPM / DPK
● Bilateral cooperation on political, economic, social,& culture
● International events
● Solo Green City (its range is not very wide but enough)
● MICE city
● data base issues in society (KK)
● Community participation integration -> implementation at the city level ->SKPD
● Programming exist and can be made regulation
● program for each child has a birth certificate
● free traffic jam, and traffic management
● (The existence of cooperation (collaboration) among local governments close to the of Surakarta
● City organized and structured
● Solo can receive PLBK Environmental Program
● Free education
● Each village can have Rp 1M assistance
● Education Policy is not becoming a burden
● free education
● free health care service
● Child Friendly City
● Solo as of a prosperous city for all layers
● Solo a city of peace, security, and comfort:
● pro-people policies standard of living for the better, HR increased, better public health service (PKMS)
● The fulfillment of basic rights of citizens Solo (education, health, housing, transportation, etc.)
● Cheap Education
● cheap Health service
● Solo prosperous
● Solo become example of other cities
● City a model(example for other city, green city, leadership identity)
● cooperation between adjacent local government
● partnership between stakeholders was further enhanced
● synergy bureaucracy, NGOs, CSR, CBOs
● Ad hoc forming teams based on city issues (collaboration bureaucracy and society)
● Each party shall be responsible to the agency
● Committed public servants, trustworthy, honest, disciplined, orderly, and have positive character
● Promoting good governance, and community participation in development (ex. HR , public satisfaction index)
● Encourage the database (by name by address), collaborative / multi-intervention programs

The SMERU Research Institute 81
Aspects Strengths Opportunities Aspirations Results Strategies
● Car free day program
● Vision: small & medium entrepreneur (SME)
● Friendly City for Investors
● Guarantee health care service
● programs SKPD transparent
● innovative bureaucracy
● eco-friendly city
● education pro-people
● health education pro-people
across SKPD, good planning regulations and sufficient budget allocations.
● Transparency, Planning and Budgeting
● implementation monitoring and evaluation mechanism
● cooperation between governments and public
● transparency in every activity ( planning budgeting -> result)
Cultural Capital
Identity, culture, custom, behavior
● has a distinctive cultural
● culinary center
● Having a high trade mark
● Have a strong characteristic that can be used as icons to be developed
● Having the potential of cultural assets (palace Kasunanan and Mangkunegaran)
● Has assets of the historical (cultural center for the economy)
● Train Travel Jaladara
● Kraton
● Solo Cultural City of
● Cultural tourism
● Batik
● Culture Cities
● can bring new tourism: culinary and cultural tours
● Many tourists go to Solo
● the Regional tourist
● batik as selling points and cultural heritage
● Realization of Solo as city with Javanese character
● City with strong Jawa identity
● City with strong character
● Tourist destinations
● Safe, comfortable and sustainable city
● eco-cultural city
● City of cultural references
● that many tourists come to Solo
● Solo become tourist destinations
● Branding: imaging and promotion
● national and international events Reproduce
Human Capital
Education, health, creativity
● Level of education is good enough
● Formed critical society full with creative ideas
● people safe and healthy ● life expectancy increased
● No outbreaks of disease
● pro-people policies: education and health services

The SMERU Research Institute 82
Aspects Strengths Opportunities Aspirations Results Strategies
Economic Capital
Industry, handicraft, trade, banking, market, investment
● Home Business
● Trading
● Have batik (craftsmen, Klewer market, PGS)
● Solo as a business center. Open for increased cooperation with other parties
● open for business investment
● Solo become "magnet" for the district around (ex residency) -> center for people shopping district around
● the domestic and international markets
● Banking
● Clothing Industry
● Handicraft
● Home Industry
● Many traditional market
● economy sector Strengthening
● Property
● Trade
● high-PAD
● Emerging economically productive activities in the society.
● The emergence of new businesses
● Center for services trade
● Solo city trade
● trade center
● Loss of singers and beggars
● Significant poverty reduction and welfare improvement for the citizens Solo significant
● More jobs and more worthy of
● increasing the welfare of society
● free from unemployment
● PAD Solo i increase
● affordable cost of living
● per capita income higher
● MSE High
● Can buy anything on the Solo
● live 24-hourSolo
● Encourage the local economy: capital, training
● policies to attract investors
Infrastructure Capital
Public facility, city structuring
● There are many public facilities (stadium, hospitals, railways etc)
● Adisumarmo Airport ● City infrastructure is arranged with comfortable
● Building public sports center
● sustainable development and infrastructure development: drainage, road, landfill, traditional markets, the public sphere
Natural capital
Structuring slum areas, public space, geographic, regional transit
● having better arrangement in certain areas. Example: the arrangement of street vendors, environmental cleanliness, arrangement of the traditional markets,
● multiply the park on the river banks
● waste collection from the river

The SMERU Research Institute 83
Aspects Strengths Opportunities Aspirations Results Strategies
etc.
● a lot of public space
● having strategic geographical position
● Regional transit
Social Capital
Trust the between citizens, community mutual aid (mutual aid)
● Trust between citizens
● Mutual cooperation among the residents
● is relatively easy to organize
SOAR Results – Kota Makassar
Aspects Strengths Opportunities Aspiration Result Strategy
Political Capital
Leadership ● Commitment of Makassar mayor
Vision, Mission ● Door for eastern Indonesia ● industrial city and tourist city
● Makassar to be world city
● Citizen of Makassar: became an honest society just and prosperous
● Safe, convenient, and prosperous
● city with good behavior people
● just and prosperous peaceful and prosperous
● Makassar become more orderly world city organized and planned
Program: ● Program Iasmo Bebas
● Free Education
● BOS Program funds
● Free medical services
● Free Facility
● poverty reduction program
● policies that are pro-poor
● program/ Aid / Funds from the central govt, prov and NGO.
● independent community
● The city is free from Demo
● Ruly city
● Worldwide metropolis
● modern city
● better targeting programs to poor communities
● program Harmonization
Policy, Regulation
● Regulation on Iasmo
● Local wisdom/ regulation Spatial Planning
● Alleviating poverty: a top priority
● criteria of poor people should be clear
● pro poor and sustainable
● socialization of programs KUR, hygiene movement shared by all agencies on an

The SMERU Research Institute 84
Aspects Strengths Opportunities Aspiration Result Strategy
● Legal aspects (rules/ regulations) Local Living (local wisdom)
● strategic spatial policy
public policy
ongoing basis
● pro poor policies and pro poor budget
● community development
● Give the fishing do not give the fish and make a project labor-intensive to be able to absorb much energy
● good government policy in the community and honest government
Partnership ● Partner from press ● Cooperation with donor countries
● the participation from entrepreneurs and business
● cooperation between government and non government
Good governance ● Government Concern
● TKPKD
● Participatory Planning
● There is commitment from the municipal government and there is regulation on allocation
● Supervision and the seriousness of the government's
● support from central government
● community-based development should not be half hearted
● fulfillment of minimum service standards
● government concern about poverty the
● more leverage for public service
● bureaucratic reformation-expanding space of continuous public participation and increased private participation (outsiders)
● Optimizing all the rules
● Good government policy to Citizens
● All apparatus must be honest
● clean and transparent government
● participation of all elements of society and government
● intensive assistance in the community
● good policy, honest government, free of corruption
● widespread community involvement and transparency
● government programs is

The SMERU Research Institute 85
Aspects Strengths Opportunities Aspiration Result Strategy
transparent
● The policy/ good intentions all levels of society / government
● building information systems and public service
● community empowerment
● Involvement of NGO, businessmen, politicians and the governments of donor countries
● strengthening the regulation
Cultural Capital
Identity, culture,
custom, behavior ● Budaya Siri ● Tourism
● religious tourist town
● Clean Cultural
Human Capital
Education, life
skills, health,
attitude and
behavior
● skills ● population
● Increased education
● Quality of education increased
● Change in mind set
● Changes in behavior and attitudes
● healthy and productive community
● illiteracy declined
● Provide free education until college
● Increasing intelligence, emotional and spiritual
● Increasing human capital
Economic Capital
Economic
development,
accelerated
economic
development &
gateway, the
center of Eastern
Indonesia Region,
employment,
poverty reduction
● Acceleration of economic development
● industrial city in east indonesia
● Poverty
● employment
● Economic Growth
● the construction of city
● employment growth
● the economic center of Eastern Indonesia
● Prospect of high construction and growing industry
● assistance from the private sector for small businesses capital CSR
● city's economic development
● high economic growth rate
● advanced and prosperous societies
● no longer poor
● 5 year forward urban poor decreased 10%
● free from the poor people
● Free from beggar
● poverty reduction
● poverty rate decreases and becomes prosperous community
● met the basic needs
● the poor economy improves
● more people accessing banks
● Poverty reduced by 5%
● reduced rate of poverty
● number of poor reduced able to fulfill of basic needs
● Communities prosperous, could access l education and health
● economy rolling

The SMERU Research Institute 86
Aspects Strengths Opportunities Aspiration Result Strategy
● People’s Welfare
● Economics Equity
Infrastructure Capital
Spatial,
Infrastructure,
area
● Spatial ● Free Slum-traffic, flooding, and waste
● spatial planning is consistent with RTRW
● Infrastructure still have to be developed
● facilities and infrastructure for community fulfilled
● cleanliness of the city must be improved
● slum improvement
Natural Capital
Geographic ● strategic location ● natural resources
Social Capital
Participation,
Mutual
cooperation,
Community
Organization,
Caring
● Active Role of organizations
● Mutual respects
● Togetherness
● Sense of ownership
● Mutual cooperation
● more advanced level of enthusiasm
● Support from the local community
● more concerned to the poor
● more care to the poor
● social organization