adiology fiber tract–based atlas of human white...
TRANSCRIPT

Setsu Wakana, MDHangyi Jiang, PhDLidia M. Nagae-Poetscher,
MDPeter C. M. van Zijl, PhDSusumu Mori, PhD
Index terms:Brain, anatomy, 10.92Brain, MR, 10.121412, 10.121416,
10.121417Brain, white matter, 10.92Diffusion tensor, 10.121416Special Reports
Published online before print10.1148/radiol.2301021640
Radiology 2004; 230:77–87
Abbreviations:DT � diffusion tensorMPRAGE � magnetization-prepared
rapid gradient echoROI � region of interest3D � three-dimensional2D � two-dimensional
1 From the Department of Radiologyand Radiological Science, Johns Hop-kins University School of Medicine,217 Traylor Bldg, 720 Rutland Ave,Baltimore, MD 21205; and F. M. KirbyResearch Center for Functional BrainImaging, Kennedy Krieger Institute,Baltimore, Md. From the 2002 RSNAscientific assembly. Supported by Na-tional Institutes of Health grants RO1AG20012–01 and P41 RR15241–01.Received December 12, 2002; revisionrequested February 25, 2003; revisionreceived May 8; accepted August 21.Address correspondence to S.M.(e-mail: [email protected]).
Author contributions:Guarantor of integrity of entire study,S.M.; study concepts and design,S.M.; literature research, S.M., S.W.;clinical studies, S.W., S.M.; experi-mental studies, S.W., L.M.N.P.; dataacquisition, S.W., H.J.; data analysis/interpretation, S.W., H.J., L.M.N.P.;manuscript preparation, S.M., S.W.;manuscript definition of intellectualcontent, S.M., P.C.M.v.Z.; manuscriptediting, S.M., S.W.; manuscript revi-sion/review, S.M., S.W., P.C.M.v.Z.;manuscript final version approval, allauthors© RSNA, 2003
Fiber Tract–based Atlas ofHuman White MatterAnatomy1
Two- and three-dimensional (3D) white matter atlases were created on the basis ofhigh-spatial-resolution diffusion tensor magnetic resonance (MR) imaging and 3Dtract reconstruction. The 3D trajectories of 17 prominent white matter tracts couldbe reconstructed and depicted. Tracts were superimposed on coregistered anatomicMR images to parcel the white matter. These parcellation maps were then com-pared with coregistered diffusion tensor imaging color maps to assign visible struc-tures. The results showed (a) which anatomic structures can be identified ondiffusion tensor images and (b) where these anatomic units are located at eachsection level and orientation. The atlas may prove useful for educational and clinicalpurposes.© RSNA, 2003
Diffusion tensor (DT) imaging is a magnetic resonance (MR) imaging technique that canbe used to characterize the orientational properties of the diffusion process of watermolecules (1,2). Usually, the information is contracted to two types of parameters: diffu-sion anisotropy, which represents the amount of directionality, and orientation of the axisalong which water molecules move preferentially. Application of this technique to thebrain has been demonstrated to provide exceptional information on white matter archi-tecture (3–7). Because at present there are no other imaging modalities that can provideequivalent information, DT imaging is expected to become an important tool for the studyof brain anatomy and the diagnosis of various white matter abnormalities. Recent devel-opments in postprocessing algorithms for DT imaging also allow study of the three-dimensional (3D) configuration of major white matter tracts, for which good agreementwith postmortem anatomic studies has been reported (8–12).
Various types of DT imaging visualization schemes have been postulated. Orientation-based color coding (or, simply, color mapping) is a visualization approach in which theimage brightness represents diffusion anisotropy, while a red-green-blue color schemeindicates tract orientation, assuming that the preferential diffusion axis coincides with thefiber orientation (5,13). This color map presentation has already proved to be useful forseveral brain diseases (5,14–19), and, owing to the increased availability of MR unitsequipped with DT imaging capabilities, it is expected to become an important routinediagnostic method in the near future. This color map may pose some challenges toneuroradiologists, however, because the contrast and anatomic information it provides iscomplex and requires detailed knowledge of the 3D architecture of white matter. Inaddition, various intra–white matter structures that can be visualized on DT imaging colormaps have not yet been clearly assigned. The purpose of our study was to create two-dimensional (2D) and 3D white matter anatomic atlases based on high-spatial-resolutionDT imaging data.
IMAGING
Subjects
Data were acquired in four healthy volunteers (three men, one woman; age range, 21–29years). The subjects did not have any history of neurologic abnormality. Institutionalreview board approval was obtained for the study, and informed consent was obtainedfrom all subjects.
Special Report
77
Ra
dio
logy

Data Acquisition
A 1.5-T MR unit (Gyroscan NT; PhilipsMedical Systems, Best, the Netherlands)was used. DT imaging data were acquiredby using a single-shot echo-planar imag-ing sequence with the sensitivity-encod-ing, or SENSE, parallel-imaging scheme(reduction factor, 2.5) (20,21). The imag-ing matrix was 112 � 112, with a field ofview of 246 � 246 mm (nominal resolu-tion, 2.2 mm) zero filled to 256 � 256pixels. Transverse sections of 2.2-mmthickness were acquired parallel to theanterior commissure–posterior commis-sure line. A total of 55 sections coveredthe entire hemisphere and brainstemwithout gaps. Diffusion weighting wasencoded along 30 independent orienta-tions (22), and the b value was 700 mm2/sec. Five additional images with minimaldiffusion weighting (b � 33 mm2/sec)were also acquired. The acquisition timeper dataset was approximately 6 minutes.To enhance the signal-to-noise ratio, im-aging was repeated six times. Coregis-tered magnetization-prepared rapid gra-dient-echo (MPRAGE) images of the sameresolution were recorded for anatomicguidance.
Data Processing
The DT imaging datasets were trans-ferred to a workstation and processed byusing DtiMap (H. Jiang, S. Mori; JohnsHopkins University, mri.kennedykrieger.org). All diffusion-weighted images werevisually inspected by two authors (S.W.,S.M.) for apparent artifacts due to subjectmotion and instrument malfunction.Subsequently, the six independent ele-ments of the 3 � 3 diffusion tensor werecalculated by two authors (S.W., L.M.N.P.)for each pixel by using multivariate lin-ear fitting method. After diagonalization,three eigenvalues and three eigenvectorswere obtained (1). For the anisotropymap, fractional anisotropy was used. Theeigenvector associated with the largesteigenvalue was used as an indicator offiber orientation. On the DT imagingcolor maps, red, green, and blue colorswere assigned to right-left, anterior-pos-terior, and superior-inferior orientations,respectively (13).
Three-dimensional TractReconstruction
For the 3D tract reconstruction, the fi-ber assignment by means of continuoustracking, or FACT, method (8,23,24) wasused, with a fractional anisotropy thresh-old of 0.15 and an inner product thresh-
old of 0.75, which prohibited angleslarger than 41° during tracking. To recon-struct tracts of interest, we used a multi-ple–region-of-interest (ROI) approach(9,25–27), which exploits existing ana-tomic knowledge of tract trajectories.Tracking was performed from all pixelsinside the brain (“brute force” approach),and results that penetrated the manuallydefined ROIs were assigned to the specifictracts associated with the ROIs. Whenmultiple ROIs were used for a tract ofinterest, we used three types of opera-tions, AND, OR, and NOT (Fig 1), thechoice of which depended on the char-acteristic trajectory of each tract.
ROIs were placed by two authors (S.M.,S.W.), who followed previously describedprotocols for brainstem fibers and associ-ation fibers (25,26). Fibers connectingthe cortex and the brainstem (corticobul-bar tract and corticospinal tract) were re-constructed by placing a first ROI at thecerebral peduncle and another at the in-ternal capsule. Among these tracts, thecorticospinal tract was identified by plac-ing two ROIs at the pre- and postcentralgyri and the pyramidal tract in caudalportion of the pons.
To reconstruct thalamocortical con-nections, the entire 3D volume of thethalamus was defined as the first ROI.The second ROIs for the anterior and pos-terior thalamic radiations were definedby using coronal sections, as describedpreviously (26). For the superior thalamicradiation, the second ROI occupied the
entire hemisphere within a transversesection above the corpus callosum. Fibersin the limbic system tend to be narrowand tubular, and a single tracking resultsometimes failed to delineate the entirelength. These tracts could be delineatedby combining multiple two-ROI results.Specifically, the trajectories were dividedinto anterior, middle, and temporal re-gions and were reconstructed separatelyby using the two-ROI and AND opera-tions. These results were subsequentlycombined with the OR operation to de-pict the entire length.
Corticocortical connections throughthe corpus callosum were reconstructedby placing the first ROI in the corpuscallosum at a midsagittal level. The sec-ond ROI was placed in the corona ra-diata, which was defined on two coronalsections (one anterior to the genu of andthe other posterior to the splenium of thecorpus callosum) and on one transversesection superior to the body of the corpuscallosum. These three reconstruction re-sults (obtained by using the two ROIs withthe AND operation) were then combinedby using the OR operation to depict theentire corpus callosum. Additional recon-struction for temporotemporal lobe con-nections (tapetum) was achieved by plac-ing the second ROI in the temporal lobe.
The NOT operation was also used toremove a subset of projections from areconstruction result. An example is sep-aration of the inferior longitudinal andfronto-occipital fasciculi (26). The NOT
Figure 1. Diagram shows the three operations used in this study. A, AND and NOT operations.Two ROIs (green) are placed on anatomic landmarks. When the AND operation is used, tracts thatpenetrate both ROIs are selected. In this example, black and red tracts are selected, while bluetracts are removed. NOT operation is used to remove specific tracts that penetrate one or multipleROIs (orange). In this example, red tracts are removed. B, OR operation. Multiple tracking resultswhen multiple ROIs are combined. AND operation poses a strong constraint in tracking results byselecting only tracts with known trajectories. This is a conservative approach for which results arepotentially more accurate, with the disadvantage that it does not allow visualization of branchingpatterns between ROIs. The OR approach may be more susceptible to noise and partial volumeeffects.
78 � Radiology � January 2004 Wakana et al
Ra
dio
logy
operation was also used to remove “re-layed” projections often observed in thethalamus. For example, if the anteriorthalamic radiation is reconstructed by us-ing one ROI at the thalamus and the an-other at the frontal lobe, a small numberof projections that connect the frontallobe and thalamus penetrate the thala-mus and proceed to various brain regionssuch as the cortex, brainstem, and cere-bellum. Some of these trajectories havebeen reproducibly observed and may bereal connections, but they were removedbecause they apparently do not complywith the classical definition of the ante-rior thalamic radiation.
One of the most important limitationsof the tracking technique is that specific-ity may be lost for tracts that run parallelto (or are merged with) one another. Inthis situation, the tracking tends to retainthe topology: Tracts coming from theright side to a merging point stay at theright side, and tracts from the left sidestay at the left side (10). Because of thislimitation and the somewhat ad hocnature of ROI placement and the threeoperations for individual tracts, the 3Dreconstruction results shown in this re-port should be treated as an approxima-tion of tract configurations and loca-tions that belong to the same tract
systems rather than precise connectiv-ity maps. The reconstruction protocoldescribed here was applied to the DTimaging data from the four subjects,and tracts shown in this report could beidentified in all subjects.
Three-dimensional VolumeDefinition of Various AnatomicUnits
By using the coregistered MPRAGE im-ages, the ventricles, caudate nucleus, puta-men (including globus pallidus), thalamus,hippocampus (including amygdala), sub-stantia nigra, and deep cerebellar nucleiwere manually defined to demonstrate thespatial relationship with various whitematter tracts in three dimensions.
Three-dimensional Demonstration
The 3D depictions of trajectories ofwhite matter tracts and volumes of graymatter nuclei were generated by using soft-ware (Amira; TGS, San Diego, Calif), withtube-type tract representation adoptedfrom Zhang and Laidlaw (28) and Catani etal (27).
DEMONSTRATION OF WHITEMATTER TRACTS: 3DPRESENTATION
White matter tracts were classified intofive functional categories: (a) tracts in thebrainstem, (b) projection fibers (cortex–spi-nal cord, cortex-brainstem, and cortex-thalamus connections), (c) association fi-bers (cortex-cortex connections), (d) limbic
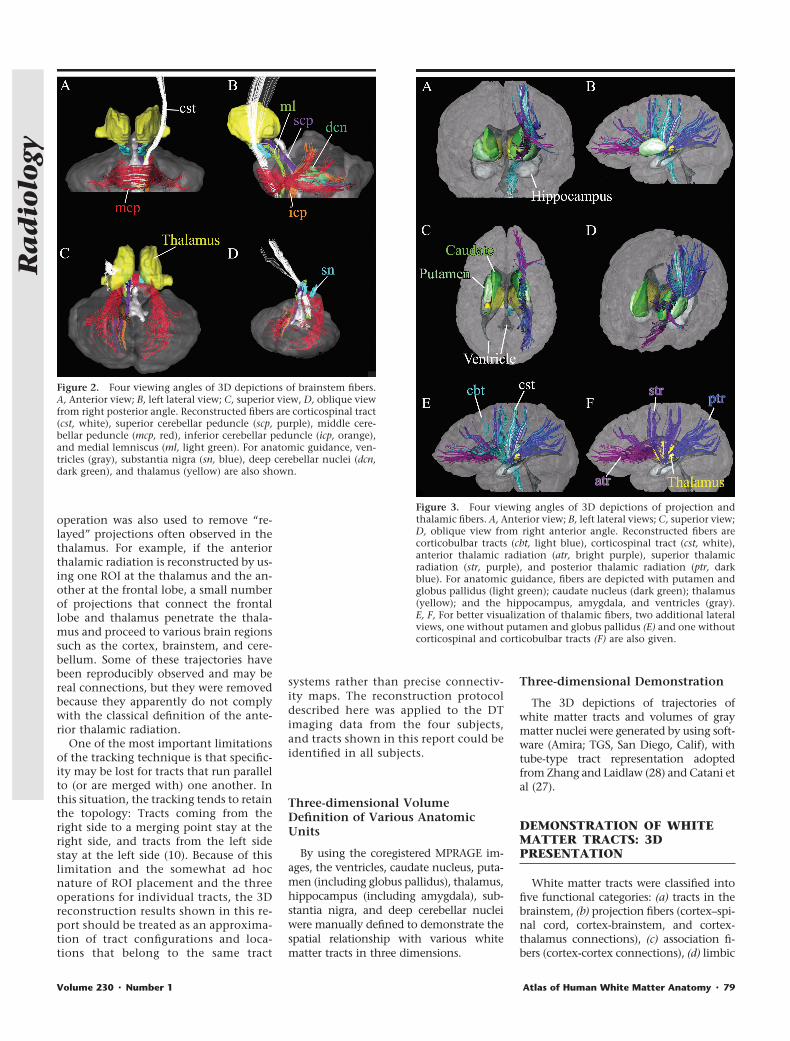
Figure 2. Four viewing angles of 3D depictions of brainstem fibers.A, Anterior view; B, left lateral view; C, superior view, D, oblique viewfrom right posterior angle. Reconstructed fibers are corticospinal tract(cst, white), superior cerebellar peduncle (scp, purple), middle cere-bellar peduncle (mcp, red), inferior cerebellar peduncle (icp, orange),and medial lemniscus (ml, light green). For anatomic guidance, ven-tricles (gray), substantia nigra (sn, blue), deep cerebellar nuclei (dcn,dark green), and thalamus (yellow) are also shown.
Figure 3. Four viewing angles of 3D depictions of projection andthalamic fibers. A, Anterior view; B, left lateral views; C, superior view;D, oblique view from right anterior angle. Reconstructed fibers arecorticobulbar tracts (cbt, light blue), corticospinal tract (cst, white),anterior thalamic radiation (atr, bright purple), superior thalamicradiation (str, purple), and posterior thalamic radiation (ptr, darkblue). For anatomic guidance, fibers are depicted with putamen andglobus pallidus (light green); caudate nucleus (dark green); thalamus(yellow); and the hippocampus, amygdala, and ventricles (gray).E, F, For better visualization of thalamic fibers, two additional lateralviews, one without putamen and globus pallidus (E) and one withoutcorticospinal and corticobulbar tracts (F) are also given.
Volume 230 � Number 1 Atlas of Human White Matter Anatomy � 79
Ra
dio
logy

system tracts, and (e) commissural fibers(right-left hemispheric connections).
Tracts in the Brainstem
The superior, middle, and inferior cer-ebellar peduncles; corticospinal tract;and medial lemniscus were reconstructedas shown in Figure 2 (25). For anatomicguidance, the ventricles, deep cerebellarnuclei, substantia nigra, and thalamusare also shown. (Note that colors as-signed here are not related to tract orien-tation, unlike in color maps.) One end ofthe superior cerebellar peduncle termi-nates at the deep cerebellar nuclei; theother, at the thalamus. Although major-ity of the superior cerebellar pedunclewas supposed to cross the midline at thedecussation of the superior cerebellar pe-duncle, the reconstructed trajectory re-mained in the same hemisphere. This isdue to the limitation of the fiber-tracking
technique, which tends to provide a“kissing” (��) solution when two fibershave a crossing (�) trajectory (10). Thetrajectory of the inferior cerebellar pe-duncle approached the superior cerebel-lar peduncle from the inferolateral sideand passed through the superior side to-ward the medial direction. The mediallemniscus traveled along the dorsal sideof the midbrain and pons and turnedsharply toward the ventral side of thebrainstem at the level of the medulla.These trajectories agree well with post-mortem anatomic descriptions of thesetracts (29,30).
Projection Fibers
Trajectories of the main projection fi-bers are shown in Figure 3. It can be seenthat the corticobulbar tract collects pro-jections from many areas of the cortex tothe brainstem. The projection from pre-
and postcentral gyri (corticospinal tract)reaches the pyramidal tract at the pons.The thalamic projections and relation-ships with the thalamus can be seenclearly in Figure 3, E and F, where theputamen (Fig 3, E) and corticobulbar andcorticospinal tracts (Fig 3, F) were re-moved. All thalamic radiations con-verged into the internal capsule, locatedbetween the putamen and the thalamus–caudate nucleus regions. Among othertypes of sensory connections betweenthe thalamus and cortex, the posteriorthalamic radiation includes the optic ra-diation. The corticobulbar and cortico-spinal tracts and the thalamic fibers allpenetrate the internal capsule, where thecortex-brainstem connection occupiesthe more lateral regions. This type ofpreservation of topology seen in the in-ternal capsule (ie, anterior part projectingto frontal lobe; posterior part, to occipitallobe; lateral part, to cortex; and medialpart, to thalamus) may be due in part tothe limitation of the tract-tracking tech-nique, which generally does not allowtracing of crossing (�) configurations.Therefore, although the 3D reconstruc-tion results can provide macroscopicviews of the tracts, they cannot be di-rectly interpreted in terms of detailedconnectivity information. It is notewor-
Figure 4. Four viewing angles of 3D depictions of association fibers.A, Anterior view; B, left lateral view; C, superior view; D, oblique viewfrom right anterior angle. Reconstructed fibers are superior longitu-dinal fasciculus (slf, yellow), inferior longitudinal fasciculus (ilf,brown), superior fronto-occipital fasciculus (sfo, beige), inferior fronto-occipital fasciculus (ifo, orange), and uncinate fasciculus (unc, red). E,F, Left lateral views without superior longitudinal fasciculus (E) andinferior longitudinal fasciculus (F).
Figure 5. Four viewing angles of 3D depictions of limbic systemfibers. A, Anterior view; B, left lateral view; C, superior view;D, oblique view from right anterior angle. Reconstructed fibers arecingulum (cg, dark green), fornix (fx, light green), and stria terminalis(st, yellow). For anatomic guidance, hippocampus and amygdala(purple) and ventricles (gray) are also shown.
80 � Radiology � January 2004 Wakana et al
Ra
dio
logy
thy, however, that the topologic preser-vation seen in the internal capsule actu-ally agrees well with what has been pos-tulated by neuroanatomists on the basisof postmortem results (30).
Association Fibers
There are numerous types of associa-tion fibers, according to reports of post-mortem anatomic studies (29–31). Theseinclude long-range, as well as short-range, cortical U fibers. In this study, wefocused on four well-documented associ-ation tracts, including the superior longi-tudinal fasciculus, inferior longitudinalfasciculus, inferior fronto-occipital fascic-ulus, and uncinate fasciculus (Fig 4). In aprevious study (26), we reported that awhite matter tract called the superiorfronto-occipital fasciculus could not beidentified with certainty by using thetract-reconstruction approach, althougha tract of substantial size can be recog-nized at the location where this fascicleshould be found. Catani et al (27) showedthat this tract actually projects to the fron-tal and parietal lobes, and our present re-sults confirm that finding.
Figure 4 clearly shows the 3D relation-ship of these association fibers. The supe-rior longitudinal fasciculus projects tomost lateral regions of the temporal lobewith a characteristic C-shaped trajectory.
Trajectories of the inferior longitudinaland inferior fronto-occipital fasciculi canbe more easily appreciated in Figure 4, Eand F, in which the superior and inferiorlongitudinal fasciculi were removed. It canbe seen the inferior longitudinal and infe-rior fronto-occipital fasciculi share most ofthe projections at the posterior temporaland occipital lobes, while the uncinate andinferior fronto-occipital fasciculi share theprojections at the frontal lobe. The supe-rior fronto-occipital fasciculus is unique inthat it is the only association fiber tractthat projects medially to the thalamus andalong the ventricle.
Limbic System Fibers
It was possible to reconstruct the cingu-lum, fornix, and stria terminalis trajecto-ries, which, together with the hippocam-pus and amygdala and the ventricles, areshown in Figure 5. The cingulum exten-sively collected projections from thenearby cingulate gyrus and extended intothe temporal lobe. The fornix could be eas-ily reconstructed at its body, which pro-jected into the hypothalamus, while thedifferentiation of fornix from stria termi-nalis in the temporal lobe was not clearwith the current imaging resolution (2.2mm). The cingulum travels along the ven-
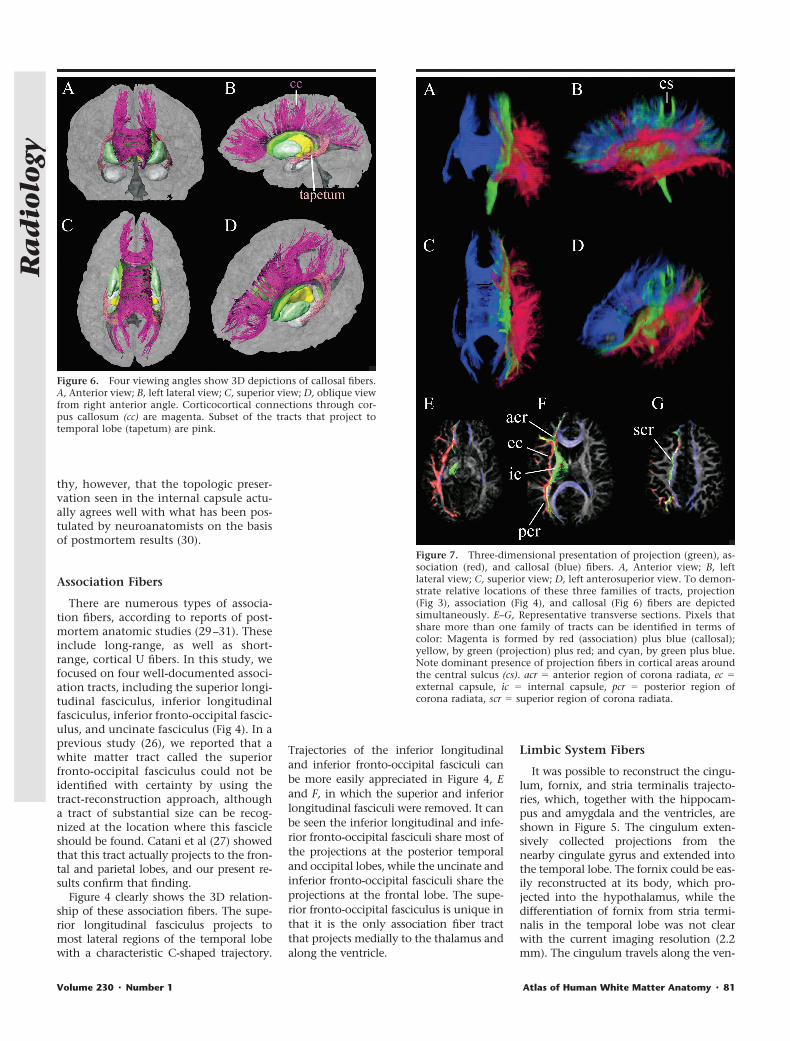
Figure 6. Four viewing angles show 3D depictions of callosal fibers.A, Anterior view; B, left lateral view; C, superior view; D, oblique viewfrom right anterior angle. Corticocortical connections through cor-pus callosum (cc) are magenta. Subset of the tracts that project totemporal lobe (tapetum) are pink.
Figure 7. Three-dimensional presentation of projection (green), as-sociation (red), and callosal (blue) fibers. A, Anterior view; B, leftlateral view; C, superior view; D, left anterosuperior view. To demon-strate relative locations of these three families of tracts, projection(Fig 3), association (Fig 4), and callosal (Fig 6) fibers are depictedsimultaneously. E–G, Representative transverse sections. Pixels thatshare more than one family of tracts can be identified in terms ofcolor: Magenta is formed by red (association) plus blue (callosal);yellow, by green (projection) plus red; and cyan, by green plus blue.Note dominant presence of projection fibers in cortical areas aroundthe central sulcus (cs). acr � anterior region of corona radiata, ec �external capsule, ic � internal capsule, pcr � posterior region ofcorona radiata, scr � superior region of corona radiata.
Volume 230 � Number 1 Atlas of Human White Matter Anatomy � 81
Ra
dio
logy
tral surface of the hippocampus, while thefornix and stria terminalis project alongthe dorsal surface.
Callosal Fibers
Results of callosal fiber reconstructionare shown in Figure 6. The massive array ofprojections forms the so-called callosal ra-diation, which connects the correspondingareas of opposite hemisphere. The projec-tions from the genu of the corpus callosumform the forceps minor; those from thesplenium form the forceps major. Thereare also strong projections from the sple-nium that sweep inferiorly along the lat-eral margin of the posterior horn of thelateral ventricle and project into the tem-poral lobes; these projections are knowncollectively as the tapetum.
Topologic Relationships amongProjection, Association, andCallosal Fibers
Unlike the fibers in the limbic system,which all travel along the ventricles andhippocampus, the spatial relationshipsbetween projection, association, and cal-losal fibers may be difficult to appreciate.In Figure 7, tracts that belong to projec-tion, association, and callosal fibers areassigned the colors green, red, and blue,respectively, and are depicted simulta-neously. It can be seen that the associa-tion fibers tend to occupy most lateralregions; and the callosal fibers, the me-dial regions. On 2D images, brain areaswhere these fibers overlap can be identi-fied by means of mixed colors such asyellow (green plus red), magenta (red
plus blue), and cyan (green plus blue).Note that the same pixel can be shared bydifferent tracts if vectors in two differentpixels point to the same pixel. Figure 7,E–G, indicates that the temporal lobe andexternal capsule are occupied by associa-tion fibers; the internal capsule, by pro-jection fibers; and the corona radiata, byall three families of fibers.
DEMONSTRATION OF WHITEMATTER TRACTS: 2DPRESENTATION
Figures 8–10 show a series of DT imagingcolor maps in transverse, coronal, andsagittal planes, respectively. CoregisteredMPRAGE images with color-coded whitematter tracts (hereafter, white matter par-
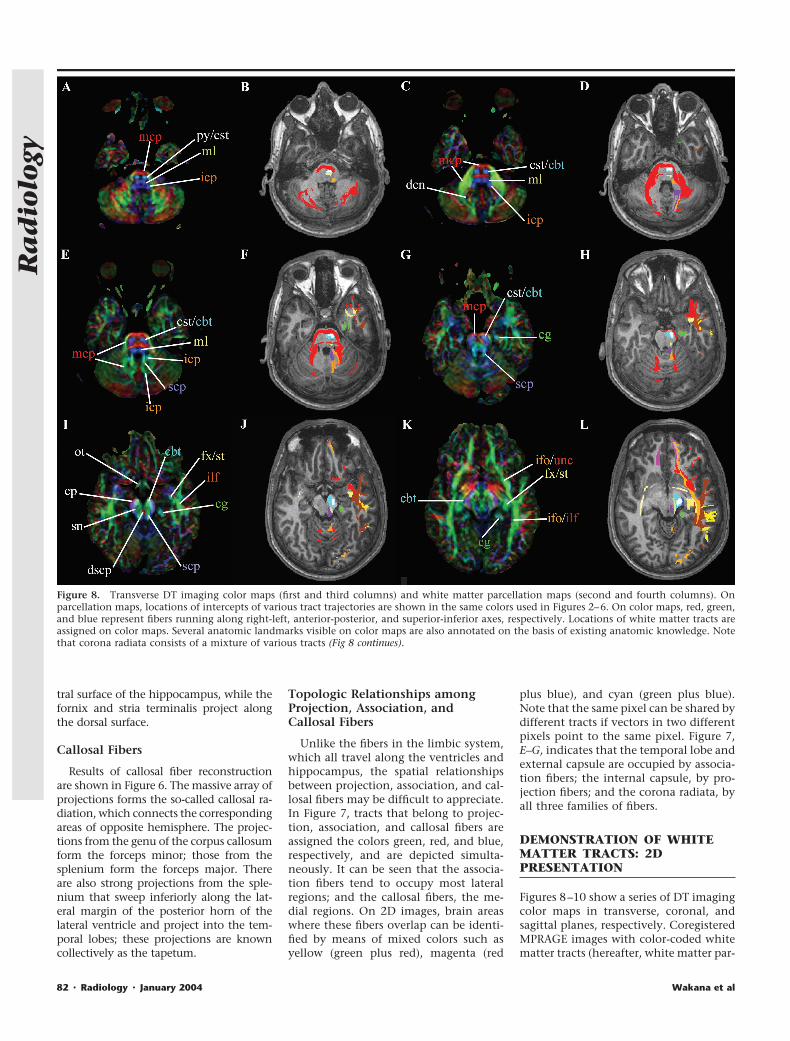
Figure 8. Transverse DT imaging color maps (first and third columns) and white matter parcellation maps (second and fourth columns). Onparcellation maps, locations of intercepts of various tract trajectories are shown in the same colors used in Figures 2–6. On color maps, red, green,and blue represent fibers running along right-left, anterior-posterior, and superior-inferior axes, respectively. Locations of white matter tracts areassigned on color maps. Several anatomic landmarks visible on color maps are also annotated on the basis of existing anatomic knowledge. Notethat corona radiata consists of a mixture of various tracts (Fig 8 continues).
82 � Radiology � January 2004 Wakana et al
Ra
dio
logy

cellation maps) are also shown for ana-tomic guidance. On the parcellationmap, the tract trajectories (identified byusing the 3D reconstruction) are super-imposed on the MPRAGE images, withthe same colors used in Figures 2–6. Bycomparing the two types of images, var-ious structures visible on the DT imagingcolor maps can be assigned.
Brainstem
Identification of the corticospinal tractand medial lemniscus on the color mapswas straightforward at the pons levels(Fig 8, C–F). At the caudal pons-medullalevel, the medial lemniscus became nar-rower and almost invisible at the de-cussation (lower level than that in Fig 8,
A and B). The relative locations of thesuperior and inferior cerebellar peduncleswere difficult to distinguish at certainlevels of the pons (eg, Fig 8, E and F), butside-by-side comparison with the 3D-based parcellation information helpedidentification at those section levels. Atthe midbrain level, a structure with right-left orientation could be always found atthe midline (red tracts on Fig 8, I and J).On the basis of information regardingthe trajectory of the superior cerebellarpeduncle, which leads to this midlinestructure, we determined that the structureis the decussation of the superior cerebellarpeduncle. In addition to the white mattertracts, the substantia nigra (Fig 8, I and J)and deep cerebellar nuclei (Fig 8, C and D)
could be identified. The superior cerebellarpeduncle terminated at the deep cerebellarnuclei, which agrees with the fact that neu-rons in the latter are the major sources ofaxons of the former.
Projection and Callosal Fibers
These fibers project along the superior-inferior axis for most of their courses, andtransverse sections are the best 2D depic-tions for investigation of their assign-ment (Fig 8). At the midbrain level (Fig 8,I–L), the corticobulbar and corticospinaltracts could be identified in the cerebralpeduncle; the corticospinal tract occu-pied the center portion of the cerebralpeduncle, as has been previously re-ported (25). At the transverse level of the
Figure 8 (continued). ac � anterior commissure, acr � anterior region of corona radiata, alic � anterior limb of internal capsule, cbt � corticobulbartract, cg � cingulum, cp � cerebral peduncle, cst � corticospinal tract, dscp � decussation of superior cerebellar peduncle (scp), fx � fornix, icp �inferior cerebellar peduncle, ifo � inferior fronto-occipital fasciculus, ilf � inferior longitudinal fasciculus, mcp � middle cerebellar peduncle, ml �medial lemniscus, ot � optic tract, pcr � posterior region of corona radiata, plic � posterior limb of internal capsule, py � pyramidal tract, scr �superior region of internal capsule, sfo � superior fronto-occipital fasciculus, slf � superior longitudinal fasciculus, sn � substantia nigra, st � striaterminalis, unc � uncinate fasciculus, � � short-range association fibers, �� � vertical occipital fasciculus.
Volume 230 � Number 1 Atlas of Human White Matter Anatomy � 83
Ra
dio
logy

internal capsule (Fig 8, M–P), the tha-lamic fibers (anterior, superior, and pos-terior thalamic radiations) joined the cor-ticobulbar and corticospinal tracts. Theanterior and posterior limbs of the inter-nal capsule contained the anterior andsuperior thalamic radiations, respec-tively, and the retrolenticular part con-tained a mixture of the posterior tha-lamic radiation and association tracts
(see Fig 11 for nomenclature of internalcapsule). The projection fibers extendedto the corona radiata (anterior and pos-terior regions of corona radiata could beidentified in Fig 8, M–R; superior region,in Fig 8, S–X), which consisted of a mix-ture of various association, projection,and callosal fibers, as also shown in Fig-ure 7. Three colors were assigned to dif-ferent regions of the thalamocortical
connections (see also Fig 3). Distributionsof these colors in the thalamus showedthat the anterior thalamic radiation is as-sociated with dorsomedial nuclei; the su-perior thalamic radiation, with ventrolat-eral nuclei; and the posterior thalamicradiation, with posterior nuclei (pulvi-nar) (Fig 11, A), which agrees well withpostmortem histologic findings (see Fig11, B) (30).
Figure 9. Coronal DT imaging color maps (first and third columns) and parcellation maps (second and fourth columns). See caption for Figure 8for color coding and abbreviations.
84 � Radiology � January 2004 Wakana et al
Ra
dio
logy

Association Fibers
These fibers travel along the anterior-posterior axis, and coronal sections (Fig9) are most suitable for the study of their2D locations. In the frontal lobe (Fig 9, Gand H), it can be clearly seen that manyassociation fibers (inferior fronto-occipi-tal, uncinate, and superior longitudinalfasciculi) project through the externalcapsule, while the projection fibers (cor-ticobulbar and thalamic fibers) penetratethe anterior limb of the internal capsule.In more anterior regions (eg, Fig 9, E andF, and more anterior sections), the asso-
ciation fibers merge with the projectionand thalamic fibers and further with cal-losal fibers in Figure 9, A and B, and moreanterior sections. The inferior fronto-oc-cipital and uncinate fasciculi have prom-inent projections to fronto-orbital corti-cal areas, which agrees with histologicfindings (29). Throughout the levels inFigure 9, G–L, the inferior fronto-occipi-tal fasciculus occupies the ventral area ofthe external capsule. The superior longi-tudinal fasciculus has a prominent pro-jection into the frontal cortex around thesylvian fissure (Fig 9, K–P), while the tem-
poral lobe is dominated by the inferiorlongitudinal fasciculus projection. It canbe seen in Figure 9, O and P, and moreposterior sections that the inferiorfronto-occipital and inferior longitudinalfasciculi start to merge and that projec-tion and thalamic fibers also join to formthe retrolenticular part of the internalcapsule and the posterior region of thecorona radiata, which can be identifiedon the color maps (green in Fig 9, Q–T) atthe area lateral to the ventricle. In Figure9, S and T, the superior longitudinal fas-ciculus makes a sharp turn toward thetemporal lobe. On the color map, thiscan be recognized as a change in color(from green to blue), which is locatedlateral to the posterior region of the co-rona radiata. In Figure 9, S and T, andFigure 8, O–R, it can be seen that thewhite matter lateral to the posterior hornof the lateral ventricle consists of threelayers of tracts: The superior longitudinalfasciculus is the most lateral, with a su-perior-inferior orientation; the posteriorregion of the corona radiata (posteriorthalamic radiation, corticobulbar tract,and inferior fronto-occipital and inferiorlongitudinal fasciculi), with an anterior-posterior orientation is in the middle;and the callosal projection to the tempo-ral lobe (tapetum) is the most medial.
Limbic Fibers
Because of the complex trajectories ofthe cingulum, fornix, and stria termina-lis, the 3D-tracking–based parcellationresults substantially aided in the iden-tification of these tracts on the colormap. The core of the cingulum below
Figure 10. Sagittal DT imaging color maps (first and third columns)and parcellation maps (second and fourth columns). See caption forFigure 8 for color coding and abbreviations.
Figure 11. Comparison between 2D tracking-based parcellation of thalamus (A) and histologicstudy results (B). Anterior thalamic radiation (atr) projects from anterior and medial regions of thethalamus; superior thalamic radiation (str), from the lateral region; and posterior thalamicradiation (ptr), from the posterior region (pulvinar). (B adapted and reprinted, with permission,from reference 32.)
Volume 230 � Number 1 Atlas of Human White Matter Anatomy � 85
Ra
dio
logy
the cingulate gyrus could be easily iden-tified on the color map due to the char-acteristic intense green color adjacentto the corpus callosum. Along itscourse, the cingulum collects promi-nent projections from the cingulate gy-rus, although it is possible that the cin-gulum may contain some fibers fromthe corpus callosum. Posterior to thesplenium of the corpus callosum (Figs8, O–R; Fig 9, S and T), the cingulumturns sharply (the color becomes blueon the color map) toward the temporallobe and travels along the ventral sur-face of the hippocampus (Fig 8, G–L; Fig9, K–T) until it reaches the amygdala.The projection in the temporal lobe canalso be appreciated in Figures 9, G–J,and 10, E–H.
The fornix originates in the hypotha-lamic area, and its anterior and poste-rior projections in the hypothalamuscan be identified on the color map (Fig8, M and N). The body of the fornix canbe easily identified in Figure 9, G–P.However, as the projection turned lat-erally (Fig 9, Q and R) and approachedthe hippocampus, the fornix–stria ter-minalis distinction became obscure atthe current image resolution. Figure 10,G–J, shows the projection of the fornixand stria terminalis along the dorsalsurface, while the cingulum travelsalong the ventral surface.
Short-Range Association Fibers
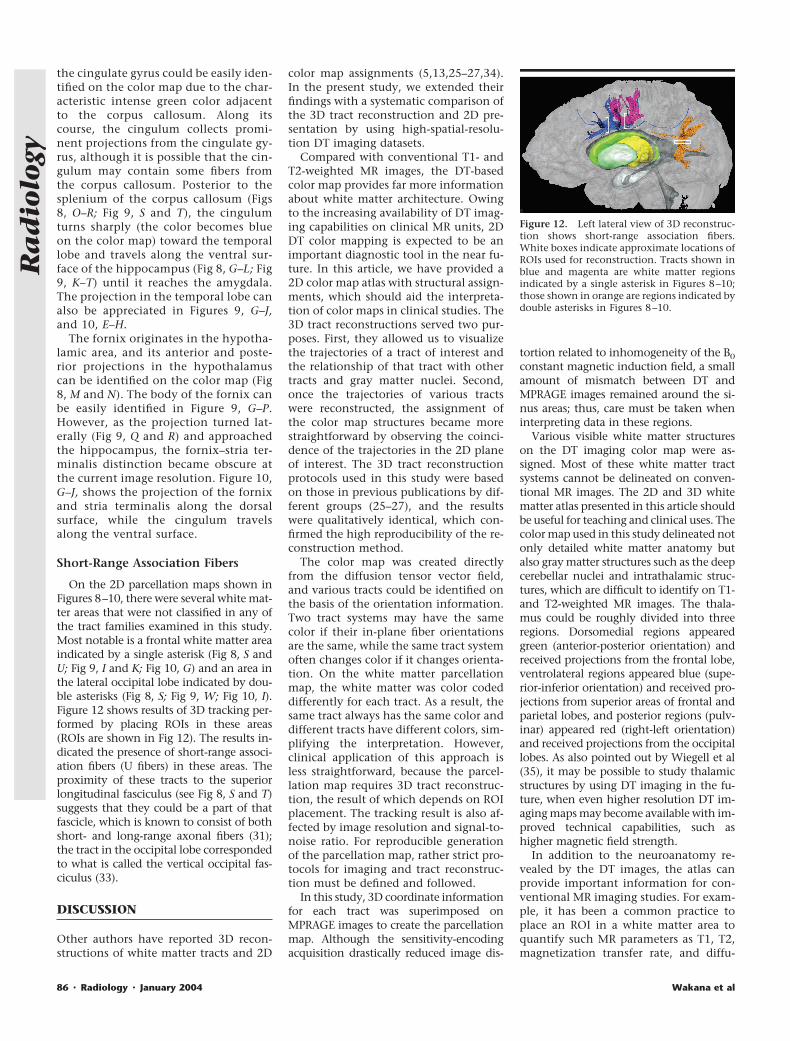
On the 2D parcellation maps shown inFigures 8–10, there were several white mat-ter areas that were not classified in any ofthe tract families examined in this study.Most notable is a frontal white matter areaindicated by a single asterisk (Fig 8, S andU; Fig 9, I and K; Fig 10, G) and an area inthe lateral occipital lobe indicated by dou-ble asterisks (Fig 8, S; Fig 9, W; Fig 10, I).Figure 12 shows results of 3D tracking per-formed by placing ROIs in these areas(ROIs are shown in Fig 12). The results in-dicated the presence of short-range associ-ation fibers (U fibers) in these areas. Theproximity of these tracts to the superiorlongitudinal fasciculus (see Fig 8, S and T)suggests that they could be a part of thatfascicle, which is known to consist of bothshort- and long-range axonal fibers (31);the tract in the occipital lobe correspondedto what is called the vertical occipital fas-ciculus (33).
DISCUSSION
Other authors have reported 3D recon-structions of white matter tracts and 2D
color map assignments (5,13,25–27,34).In the present study, we extended theirfindings with a systematic comparison ofthe 3D tract reconstruction and 2D pre-sentation by using high-spatial-resolu-tion DT imaging datasets.
Compared with conventional T1- andT2-weighted MR images, the DT-basedcolor map provides far more informationabout white matter architecture. Owingto the increasing availability of DT imag-ing capabilities on clinical MR units, 2DDT color mapping is expected to be animportant diagnostic tool in the near fu-ture. In this article, we have provided a2D color map atlas with structural assign-ments, which should aid the interpreta-tion of color maps in clinical studies. The3D tract reconstructions served two pur-poses. First, they allowed us to visualizethe trajectories of a tract of interest andthe relationship of that tract with othertracts and gray matter nuclei. Second,once the trajectories of various tractswere reconstructed, the assignment ofthe color map structures became morestraightforward by observing the coinci-dence of the trajectories in the 2D planeof interest. The 3D tract reconstructionprotocols used in this study were basedon those in previous publications by dif-ferent groups (25–27), and the resultswere qualitatively identical, which con-firmed the high reproducibility of the re-construction method.
The color map was created directlyfrom the diffusion tensor vector field,and various tracts could be identified onthe basis of the orientation information.Two tract systems may have the samecolor if their in-plane fiber orientationsare the same, while the same tract systemoften changes color if it changes orienta-tion. On the white matter parcellationmap, the white matter was color codeddifferently for each tract. As a result, thesame tract always has the same color anddifferent tracts have different colors, sim-plifying the interpretation. However,clinical application of this approach isless straightforward, because the parcel-lation map requires 3D tract reconstruc-tion, the result of which depends on ROIplacement. The tracking result is also af-fected by image resolution and signal-to-noise ratio. For reproducible generationof the parcellation map, rather strict pro-tocols for imaging and tract reconstruc-tion must be defined and followed.
In this study, 3D coordinate informationfor each tract was superimposed onMPRAGE images to create the parcellationmap. Although the sensitivity-encodingacquisition drastically reduced image dis-
tortion related to inhomogeneity of the B0
constant magnetic induction field, a smallamount of mismatch between DT andMPRAGE images remained around the si-nus areas; thus, care must be taken wheninterpreting data in these regions.
Various visible white matter structureson the DT imaging color map were as-signed. Most of these white matter tractsystems cannot be delineated on conven-tional MR images. The 2D and 3D whitematter atlas presented in this article shouldbe useful for teaching and clinical uses. Thecolor map used in this study delineated notonly detailed white matter anatomy butalso gray matter structures such as the deepcerebellar nuclei and intrathalamic struc-tures, which are difficult to identify on T1-and T2-weighted MR images. The thala-mus could be roughly divided into threeregions. Dorsomedial regions appearedgreen (anterior-posterior orientation) andreceived projections from the frontal lobe,ventrolateral regions appeared blue (supe-rior-inferior orientation) and received pro-jections from superior areas of frontal andparietal lobes, and posterior regions (pulv-inar) appeared red (right-left orientation)and received projections from the occipitallobes. As also pointed out by Wiegell et al(35), it may be possible to study thalamicstructures by using DT imaging in the fu-ture, when even higher resolution DT im-aging maps may become available with im-proved technical capabilities, such ashigher magnetic field strength.
In addition to the neuroanatomy re-vealed by the DT images, the atlas canprovide important information for con-ventional MR imaging studies. For exam-ple, it has been a common practice toplace an ROI in a white matter area toquantify such MR parameters as T1, T2,magnetization transfer rate, and diffu-
Figure 12. Left lateral view of 3D reconstruc-tion shows short-range association fibers.White boxes indicate approximate locations ofROIs used for reconstruction. Tracts shown inblue and magenta are white matter regionsindicated by a single asterisk in Figures 8–10;those shown in orange are regions indicated bydouble asterisks in Figures 8–10.
86 � Radiology � January 2004 Wakana et al
Ra
dio
logy

sion anisotropy. In this process, caremust be taken because some white matterareas consist of a mixture of various typesof tracts or because, in some areas, asmall amount of shift in ROI placementresults in measurement of very differentwhite matter tracts. The atlas can be usedas a guide for the ROI placement strategy.
Although the DT and 3D reconstructiontechniques provide exciting new informa-tion about neuroanatomy, the limitationsshould also be emphasized. One of themost important limitations stems fromthat fact that DT imaging reflects the aver-aged water diffusion property within apixel, which is an indirect indicator of theaxonal structures. In fact, Wedeen et al (36)have convincingly shown that use of thediffusion tensor calculation to delineatethe underlying axonal structures is oftenan oversimplification. In many cases, DTimaging results are biased by the dominantaxonal component. For example, it hasbeen reported (29,30) that callosal connec-tions should extend not only to corticalareas close to the midline but also to morelateral areas. Our results failed to showthese lateral projections, probably becauseof the massive projection fibers (corona ra-diata) located laterally to the callosal fibers.Similarly, branches of the projection fiberstoward lateral cortical areas could not beobserved, probably because of the largetract of association fibers running in theanterior-posterior orientation. Therefore,as mentioned earlier in this report, our at-lases should be considered as maps of thecore of the major white matter bundles,rather than as connectivity maps.
CONCLUSION
Various white matter tract systems werereconstructed by using high-spatial-resolu-tion DT MR data sets with the goal of un-derstanding 3D relationships between dif-ferent tracts and between tracts and graymatter structures. In order to appreciatethe detailed coordinates of the tracts ofinterest, the 3D trajectories were superim-posed on MPRAGE MR images and werecompared with 2D DT imaging color mapsat various section levels and orientations.On the basis of the comparison, the colormap structures were assigned, and a 2Dcolor map atlas was created. The atlas mayprove useful for teaching purposes and forfuture application of DT color mapping inclinical studies.
References1. Basser PJ, Mattiello J, Le Bihan D. MR
diffusion tensor spectroscopy and imag-ing. Biophys J 1994; 66:259–267.
2. Beaulieu C. The basis of anisotropic waterdiffusion in the nervous system: a technicalreview. NMR Biomed 2002; 15:435–455.
3. Moseley ME, Cohen Y, Kucharczyk J, et al.Diffusion-weighted MR imaging of aniso-tropic water diffusion in cat central nervoussystem. Radiology 1990; 176:439–445.
4. Pierpaoli C, Jezzard P, Basser PJ, et al. Dif-fusion tensor MR imaging of humanbrain. Radiology 1996; 201:637–648.
5. Makris N, Worth AJ, Sorensen AG, et al.Morphometry of in vivo human whitematter association pathways with diffu-sion weighted magnetic resonance imag-ing. Ann Neurol 1997; 42:951–962.
6. Beaulieu C, Allen PS. Determinants ofanisotropic water diffusion in nerves.Magn Reson Med 1994; 31:394–400.
7. Henkelman R, Stanisz G, Kim J, BronskillM. Anisotropy of NMR properties of tis-sues. Magn Reson Med 1994; 32:592–601.
8. Mori S, Crain BJ, Chacko VP, van Zijl PCM.Three dimensional tracking of axonal pro-jections in the brain by magnetic resonanceimaging. Ann Neurol 1999; 45:265–269.
9. Conturo TE, Lori NF, Cull TS, et al. Track-ing neuronal fiber pathways in the livinghuman brain. Proc Natl Acad Sci U S A1999; 96:10422–10427.
10. Basser PJ, Pajevic S, Pierpaoli C, et al. Invitro fiber tractography using DT-MRI data.Magn Reson Med 2000; 44:625–632.
11. Poupon C, Clark CA, Frouin V, et al. Regu-larization of diffusion-based directionmaps for the tracking of brain white matterfascicules. Neuroimage 2000; 12:184–195.
12. Jones DK, Simmons A, Williams SC, Hors-field MA. Non-invasive assessment of ax-onal fiber connectivity in the humanbrain via diffusion tensor MRI. Magn Re-son Med 1999; 42:37–41.
13. Pajevic S, Pierpaoli C. Color schemes torepresent the orientation of anisotropictissues from diffusion tensor data: appli-cation to white matter fiber tract map-ping in the human brain. Magn ResonMed 1999; 42:526–540.
14. Inglis BA, Neubauer D, Yang L, et al. Dif-fusion tensor MR imaging and compara-tive histology of glioma engrafted in therat spinal cord. AJNR Am J Neuroradiol1999; 20:713–716.
15. Huppi P, Maier S, Peled S, et al. Microstruc-tural development of human newborn ce-rebral white matter assessed in vivo by dif-fusion tensor magnetic resonance imaging.Pediatr Res 1998; 44:584–590.
16. Pierpaoli C, Barnett A, Pajevic S, et al.Water diffusion changes in wallerian de-generation and their dependence onwhite matter architecture. Neuroimage2001; 13:1174–1185.
17. Albayram S, Melhem ER, Mori S, et al.Holoprosencephaly in children: diffusiontensor MR imaging of white matter tractsof the brainstem—initial experience. Ra-diology 2002; 223:645–651.
18. Mori S, Fredericksen K, van Zijl PC, et al.Brain white matter anatomy of tumor pa-tients using diffusion tensor imaging.Ann Neurol 2002; 51:377–380.
19. Hoon AH Jr, Lawrie WT Jr, Melhem ER, etal. Diffusion tensor imaging of periven-tricular leukomalacia shows affected sen-sory cortex white matter pathways. Neu-rology 2002; 59:752–756.
20. Pruessmann KP, Weiger M, ScheideggerMB, Boesiger P. SENSE: sensitivity encod-
ing for fast MRI. Magn Reson Med 1999;42:952–962.
21. Bammer R, Auer M, Keeling SL, et al. Diffu-sion tensor imaging using single-shot SENSE-EPI. Magn Reson Med 2002; 48:128–136.
22. Jones DK, Horsfield MA, Simmons A. Op-timal strategies for measuring diffusion inanisotropic systems by magnetic reso-nance imaging. Magn Reson Med 1999;42:515–525.
23. Xue R, van Zijl PCM, Crain BJ, et al. Invivo three-dimensional reconstruction ofrat brain axonal projections by diffusiontensor imaging. Magn Reson Med 1999;42:1123–1127.
24. Mori S, Van Zijl PC. Fiber tracking: prin-ciples and strategies—a technical review.NMR Biomed 2002; 15:468–480.
25. Stieltjes B, Kaufmann WE, van Zijl PCM,et al. Diffusion tensor imaging and ax-onal tracking in the human brainstem.Neuroimage 2001; 14:723–735.
26. Mori S, Kaufmann WE, Davatzikos C, et al.Imaging cortical association tracts in humanbrain. Magn Reson Med 2002; 47:215–223.
27. Catani M, Howard RJ, Pajevic S, Jones DK.Virtual in vivo interactive dissection ofwhite matter fasciculi in the humanbrain. Neuroimage 2002; 17:77–94.
28. Zhang S, Laidlaw D. Elucidating neuralstructure in diffusion tensor MRI volumesusing streamtubes and streamsurfaces(abstr). In: Proceedings of the NinthMeeting of the International Society forMagnetic Resonance in Medicine. Berke-ley, Calif: International Society for Mag-netic Resonance in Medicine, 2001; 505.
29. Carpenter M. Human neuroanatomy. Bal-timore, Md: Williams & Wilkins, 1976.
30. Nieuwenhuys R, Voogd J, van Huijzen C.The human central nervous system. Ber-lin, Germany: Springer-Verlag, 1983.
31. Williams TH, Gluhbegovic N, Jew JY. Thehuman brain: dissections of the real brain.Virtual Hospital, University of Iowa. Avail-able at: www.vh.org/adult/provider/anatomy/BrainAnatomy/BrainAnatomy.html. AccessedOctober 15, 2003.
32. Nolte J, Angevine JB Jr. The human brainin photographs and diagrams. St Louis,Mo: Mosby, 2000.
33. Kahle W, Leonhardt H, Platzer, W. Tas-chenatlas der anatomie fur studium andpraxis in 3 banden. Stuttgart, Germany:Thieme, 1986.
34. Mori S, Kaufmann WK, Pearlson GD, et al. Invivo visualization of human neural pathwaysby MRI. Ann Neurol 2000; 47:412–414.
35. Wiegell MR, Larsson H, Wedeen V. Diffu-sion tensor MRI of the thalamus: differen-tiation of nuclei by their projections (ab-str). In: Proceedings of the SeventhMeeting of the International Society forMagnetic Resonance in Medicine. Berkeley,Calif: International Society for MagneticResonance in Medicine, 1999; 934.
36. Wedeen V, Reese TG, Tuch DS, et al. Map-ping fiber orientation spectra in cerebralwhite matter with Fourier-transform diffu-sion MRI (abstr). In: Proceedings of theEighth Meeting of the International Societyfor Magnetic Resonance in Medicine. Berke-ley, Calif: International Society for MagneticResonance in Medicine, 2000; 82.
Volume 230 � Number 1 Atlas of Human White Matter Anatomy � 87
Ra
dio
logy