adjoint inversion of global nox emissions with sciamachy no 2 changsub shim, qinbin li, daven henze,...
Post on 21-Dec-2015
218 views
TRANSCRIPT

Adjoint inversion of Global NOx emissions with SCIAMACHY NO2
Changsub Shim, Qinbin Li, Daven Henze, Aaron Changsub Shim, Qinbin Li, Daven Henze, Aaron van Donkellaar, Randall Martin, Kevin Bowman, van Donkellaar, Randall Martin, Kevin Bowman,
Monika Kopacz, and Annmarie ElderingMonika Kopacz, and Annmarie Eldering
4th GEOS-Chem User’s MeetingApr. 08, 2009
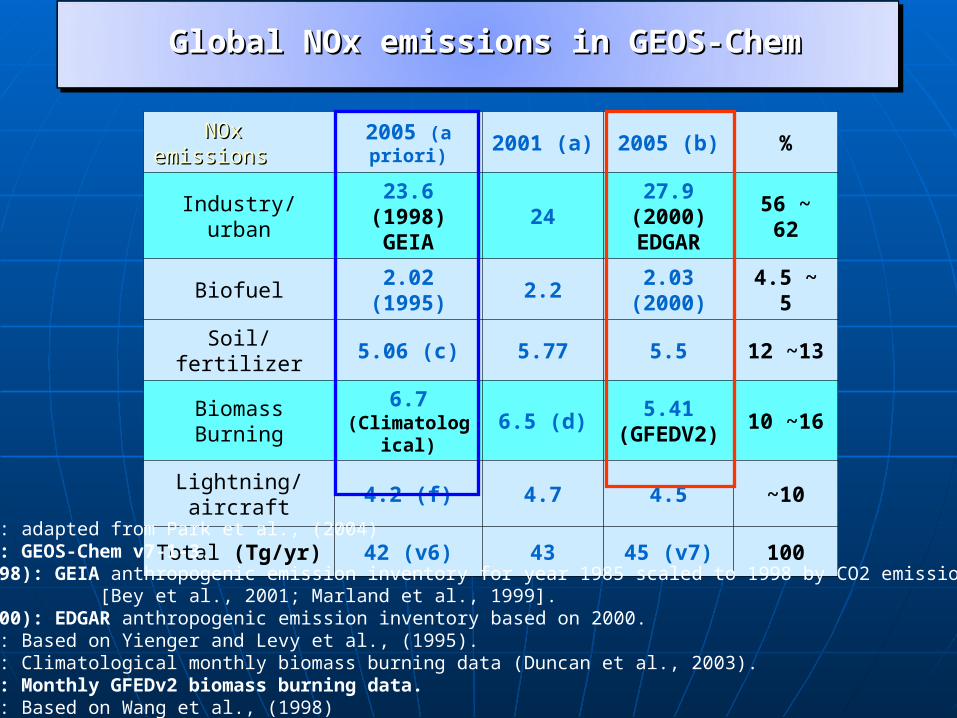
Global NOx emissions in GEOS-ChemGlobal NOx emissions in GEOS-Chem
NOx emissionsNOx emissions 2005 (a priori) 2001 (a) 2005 (b) %
Industry/urban23.6 (1998)
GEIA24
27.9 (2000)EDGAR
56 ~ 62
Biofuel 2.02 (1995) 2.2 2.03 (2000) 4.5 ~ 5
Soil/fertilizer 5.06 (c) 5.77 5.5 12 ~13
Biomass Burning
6.7 (Climatological
)6.5 (d)
5.41 (GFEDV2)
10 ~16
Lightning/aircraft
4.2 (f) 4.7 4.5 ~10
Total (Tg/yr) 42 (v6) 43 45 (v7) 100
(a): adapted from Park et al., (2004)(b): GEOS-Chem v7-1-3.(1998): GEIA anthropogenic emission inventory for year 1985 scaled to 1998 by CO2 emission trends [Bey et al., 2001; Marland et al., 1999].(2000): EDGAR anthropogenic emission inventory based on 2000.(c): Based on Yienger and Levy et al., (1995).(d): Climatological monthly biomass burning data (Duncan et al., 2003).(e): Monthly GFEDv2 biomass burning data. (f): Based on Wang et al., (1998)
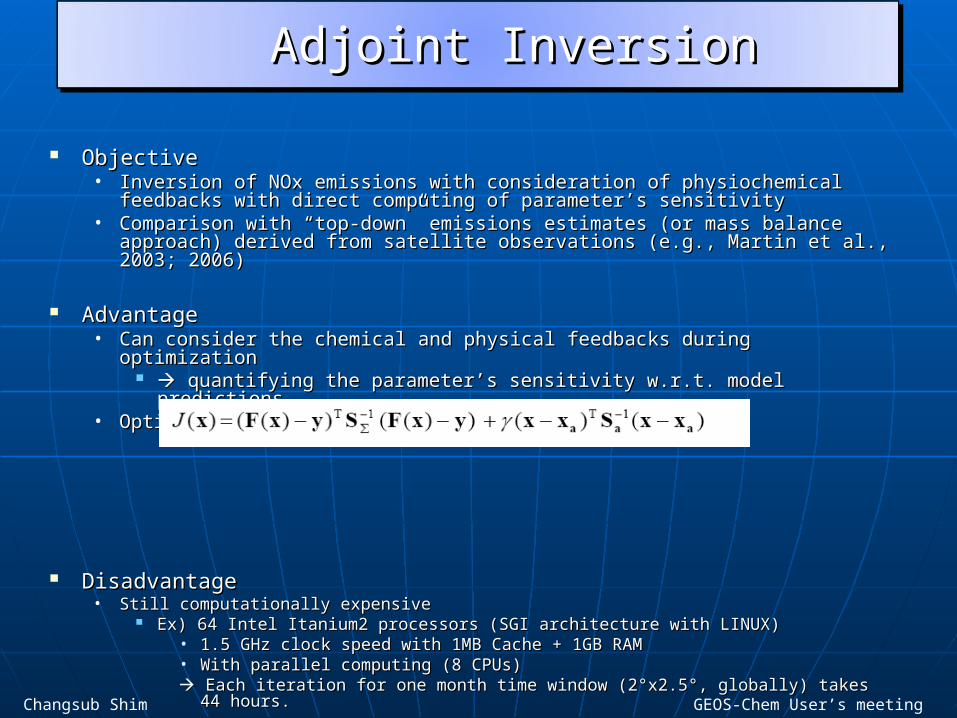
ObjectiveObjective• Inversion of NOx emissions with consideration of physiochemical feedbacks with Inversion of NOx emissions with consideration of physiochemical feedbacks with
direct computing of parameter’s sensitivity direct computing of parameter’s sensitivity • Comparison with “top-down” emissions estimates (or mass balance approach) Comparison with “top-down” emissions estimates (or mass balance approach)
derived from satellite observations (e.g., Martin et al., 2003; 2006)derived from satellite observations (e.g., Martin et al., 2003; 2006)
AdvantageAdvantage • Can consider the chemical and physical feedbacks during optimizationCan consider the chemical and physical feedbacks during optimization
quantifying the parameter’s sensitivity w.r.t. model predictionsquantifying the parameter’s sensitivity w.r.t. model predictions• Optimization controlOptimization control
Disadvantage Disadvantage • Still Still computationally expenscomputationally expensiveive
Ex) 64 Intel Itanium2 processors (SGI architecture with LINUX)Ex) 64 Intel Itanium2 processors (SGI architecture with LINUX)• 1.5 GHz clock speed with 1MB Cache + 1GB RAM1.5 GHz clock speed with 1MB Cache + 1GB RAM• With parallel computing (8 CPUs)With parallel computing (8 CPUs) Each iteration for one month time window (2°x2.5°, globally) takes 44 hours.Each iteration for one month time window (2°x2.5°, globally) takes 44 hours.
Adjoint InversionAdjoint Inversion
Changsub Shim GEOS-Chem User’s meeting

SCIAMACHY NOSCIAMACHY NO22 from Dalhousie Univ (reprocessed data), filtered from Dalhousie Univ (reprocessed data), filtered cloud fraction > 40%.cloud fraction > 40%.
Adjoint of GEOS-Chem v6-2-5 & GEOS-4 & full chemistry (by D. Adjoint of GEOS-Chem v6-2-5 & GEOS-4 & full chemistry (by D. Henze) with 2°x2.5° horizontal resolutionHenze) with 2°x2.5° horizontal resolution
Time window: one month (Nov. 2005)Time window: one month (Nov. 2005) a week x 4 a week x 4
Emissions (NOx)Emissions (NOx)• GEIA anthropogenic NOx emission (scaled to 1998)GEIA anthropogenic NOx emission (scaled to 1998)• Climatological Biomass Burning(Duncan et al., 2003)Climatological Biomass Burning(Duncan et al., 2003)• Biofuel emissions (Yevich et al., 2003)Biofuel emissions (Yevich et al., 2003)• Soil NOx (Yienger and Levy(1995) & Wang(1998))Soil NOx (Yienger and Levy(1995) & Wang(1998))• Lightning NOx (Cloud Top Height; Price and Rind(1998) & Lightning NOx (Cloud Top Height; Price and Rind(1998) &
Pickering (1998)): only consider the total emissions for opt.Pickering (1998)): only consider the total emissions for opt.
Data (Nov. 2005)Data (Nov. 2005)
Changsub Shim GEOS-Chem User’s meeting

N.AmN.Am E.U.E.U. AsiaAsia S.Am.S.Am. AfricaAfrica R.WR.W
Ind1Ind1 5050 5050 100100 100100 100100 100100
Ind2Ind2 5050 5050 100100 100100 100100 100100
LightLight 200200 200200 200200 200200 200200 300300
SoilSoil 150150 150150 150150 150150 150150 150150
BBBB 150150 150150 150150 150150 150150 150150
BFBF 100100 100100 100100 100100 100100 100100
State vector errors (%)
Observation error = e1 + e2 + e3* e1: retrieval error from SCIAMACHY* e2: representation error : ~0.7 of e1 (~4.0x10¹³ molec/cm2)* e3: model transport error (from Jones et al., 2003) ~0.8 of e1 (~4.5x10¹³ molec/cm2)
total obs. error is about factor of ~2.5 of instrumental (retrieval) error
Same quantity of errors were applied to mass-balance approach
Error SpecificationError Specification
Relative instrument errors (%)

IterationIteration Norm of grad.Norm of grad. Cost func. Cost func. ratioratio
11 3.405D+033.405D+03 11
22 1.857D+031.857D+03 0.900.90
33 7.530D+027.530D+02 0.730.73
44 3.180D+023.180D+02 0.620.62
55 1.485D+021.485D+02 0.520.52
66 1.112D+031.112D+03 0.460.46
77 1.948D+021.948D+02 0.4030.403
88 8.180D+018.180D+01 0.3970.397
Cost function from obs. Vs from a priori = ~10: 1
Now cost function reached ~ 0.40 of initial value after 7th iteration
Gradient
Inversion ResultsInversion Results
Cost Function
Initial (a priori) 8th iteration (a posteriori)
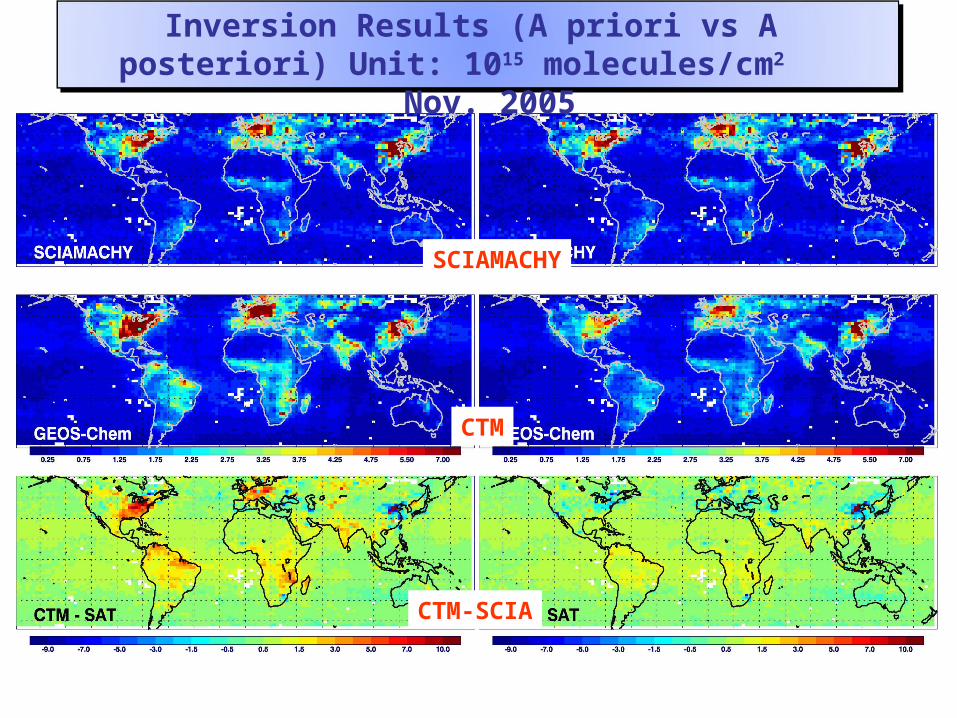
SCIA SCIA
SCIAMACHY
CTM
CTM-SCIA
Inversion Results (A priori vs A posteriori) Unit: 1015 molecules/cm2 Nov. 2005

Inversion Results : Inversion Results : NOx emissionsNOx emissions ratio ratio ( ( a posteriori / a prioria posteriori / a priori))

Unit: Gg N/ month
Total NOx emissions (by adjoint method, Total NOx emissions (by adjoint method, Nov 2005)Nov 2005)
•Large reductions in N. Ame, Europe, and India
•Moderate reductions in Africa and S. Ame
• China shows mixed features

N.AmN.Am E.U.E.U. E.AsiaE.Asia IndiaIndia S.AmeS.Ame AfricaAfrica Aus.Aus. R.W.R.W. Total
IND1IND1 430430
(209)(209)220220
(154)(154)384384
(342)(342)95.495.4
(50.)(50.)74.374.3
(58)(58)103103
(64)(64)12.612.6
(13.6)(13.6)165165
(123)(123)1484
(1013)
IND2IND2 176176
(85)(85)202202
(136)(136)7.57.5
3.63.600 00 14.514.5
(8.)(8.)9.79.7
(10.2)(10.2)3232
(18)(18)442
(261)
Light.Light. 21.821.8
(21.1)(21.1)1010
(10)(10)5.35.3
(5.2)(5.2)1.61.6
(1.4)(1.4)62.362.3
(40)(40)53.453.4
(36)(36)12.312.3
(12.4)(12.4)23.323.3
(21.4)(21.4)190
(147)
SoilSoil 33.433.4
(30)(30)15.415.4
(15.3)(15.3)11.811.8
(11.6)(11.6)34.134.1
(25.2)(25.2)98.898.8
(85)(85)142142
(115)(115)38.738.7
(39.2)(39.2)24.824.8
(24)(24)399
(345)
BBBB 5.85.8
(5.6)(5.6)5.15.1
(5.1)(5.1)22.322.3
(19.2)(19.2)3.73.7
(3.)(3.)126126
(77)(77)276276
(173)(173)94.294.2
(89.4)(89.4)4545
(42)(42)578
(413)
BFBF 7.57.5
(6.9)(6.9)18.518.5
(18.2)(18.2)51.851.8
(50.0)(50.0)33.333.3
(25)(25)14.614.6
(13.4)(13.4)31.531.5
(27.7)(27.7)0.660.66
(0.65)(0.65)2424
(23)(23)182
(164)
TotalTotal 682682
(364)(364)490490
(357)(357)535535
(481)(481)202202
(130)(130)391391
(286)(286)652652
(451)(451)169169
(166)(166)338338
(273)(273)3456
(2507)
Global NOx emissions are lower by ~28% (Nov 2005): Annual proj. (42 vs 31 Tg N/yr) N.Ame (~48%) and Europe (~30%) have significant reduction in industrial NOx emissions (2005 vs 1998) A posteriori BB emissions are well matched with GFEDv2 (global total)
A priori / A posteriori (unit: Gg N/ month; Nov 2005)A priori / A posteriori (unit: Gg N/ month; Nov 2005)
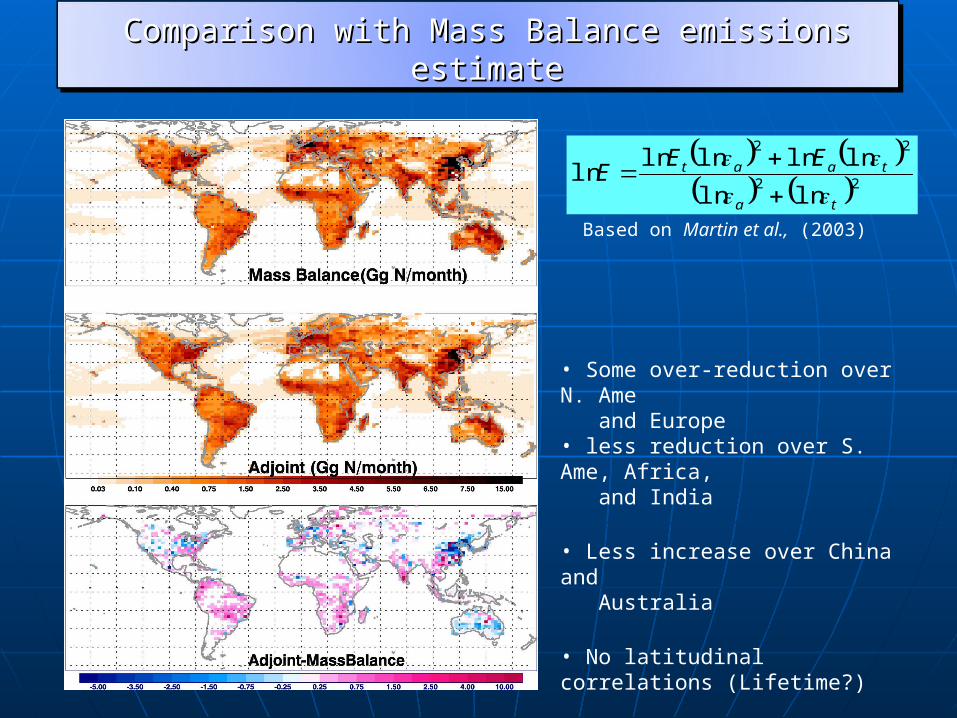
• Some over-reduction over N. Ame and Europe• less reduction over S. Ame, Africa, and India
• Less increase over China and Australia
• No latitudinal correlations (Lifetime?)
22
22
lnln
lnlnlnlnln
ta
taat EEE
Comparison with Mass Balance emissions estimateComparison with Mass Balance emissions estimate
Based on Martin et al., (2003)

a Prioria Priori Mass-Mass-BalanceBalance
AdjointAdjoint
N. Ame.N. Ame. 682682 424 (-38%)424 (-38%) 364 (-47%)364 (-47%)
EuropeEurope 490490 410 (-16%)410 (-16%) 357 (-27%) 357 (-27%)
E. AsiaE. Asia 535535 687 687 (+28%)(+28%) 481 (-10%)481 (-10%)
IndiaIndia 202202 126 (-38%)126 (-38%) 130 (-36%)130 (-36%)
S. Ame.S. Ame. 391391 249 (-36%)249 (-36%) 286 (-27%)286 (-27%)
AfricaAfrica 652652 458 (-30%)458 (-30%) 451 (-31%)451 (-31%)
Aus.Aus. 169169 237 237 (+40%)(+40%) 166 (-2%)166 (-2%)
GlobalGlobal 34563456 2877 (-19%)2877 (-19%) 2507 (-28%)2507 (-28%)
A priori / Mass-Balance / Adjoint A priori / Mass-Balance / Adjoint (unit: Gg N/ month; Nov 2005)(unit: Gg N/ month; Nov 2005)
Changsub Shim GEOS-Chem User’s meeting

SCIAMACHY NO2 columns (Nov 2005) from Dalhousie Univ
Previous version Reprocessed (currently used)
Previous - reprocessed
Reprocessed SCIAMACHY•Improved in solar measurements, and cloud fields for signal fitting and AMF calculation
(1015Molecules/cm2)

ConclusionsConclusions
According to the adjoint inversion, the N.Ame and European According to the adjoint inversion, the N.Ame and European anthropogenic NOx emissions are greatly reduced by 48% anthropogenic NOx emissions are greatly reduced by 48% and 30% (1998 vs 2005)and 30% (1998 vs 2005)
Large increase in Chinese industrial NOx emissions is Large increase in Chinese industrial NOx emissions is evident by SCIAMACHY, but the adjoint inversion does not evident by SCIAMACHY, but the adjoint inversion does not represent enough enhancements represent enough enhancements
Natural a priori NOx emissions overestimated (Nov. 2005) Natural a priori NOx emissions overestimated (Nov. 2005) and a posteriori biomass burning emission is closer to and a posteriori biomass burning emission is closer to GFEDv2 in global totalGFEDv2 in global total
More ..More .. Comparison with recent emissions inventory for specific Comparison with recent emissions inventory for specific
regions (EPA, EMEP, Streets, etc..) will be continued.regions (EPA, EMEP, Streets, etc..) will be continued.
Changsub Shim GEOS-Chem User’s meeting