administrative data research and analysis project (adra ... · administrative data research and...
TRANSCRIPT
Administrative Data Research and Analysis Project (ADRA)
Federal Agency Targeting Inspection (FEDTARG) Program Study
Final Report
Summit Consulting
Submitted to Chief Evaluation Office
U.S. Department of Labor Project Officer: Molly Irwin
Contract Number: DOLU139634581
CONTACT: Ed Dieterle, Ed.D.
Director of Program Evaluation 202.830.0856 Tel
AUTHORS: Shane Thompson, Ph.D.
Laura Hoesly Natalie Patten
September 2015
i
Table of Contents I. EXECUTIVE SUMMARY.................................................................................................................................................... 1
II. INTRODUCTION ................................................................................................................................................................ 3
III. BACKGROUND ................................................................................................................................................................... 4
Data Overview ......................................................................................................................................................................................... 4
FEDTARG Process .................................................................................................................................................................................. 4
IV. RESEARCH QUESTIONS .................................................................................................................................................. 9
V. RESULTS ........................................................................................................................................................................... 10
Activities of the FEDTARG Program ............................................................................................................................................. 10
Outputs of the FEDTARG Program ............................................................................................................................................... 16
Outcomes of the FEDTARG Program ............................................................................................................................................ 25
VI. CONCLUSIONS AND EXTENSIONS ............................................................................................................................ 27
VII. WORKS CITED ................................................................................................................................................................. 28
DEFINITIONS ............................................................................................................................................... 29
DATA .............................................................................................................................................................. 31
FECA Claims Data ................................................................................................................................................................................ 31
FEDTARG Inspection List Data ....................................................................................................................................................... 31
OSHA Inspection Results Data ........................................................................................................................................................ 31
Linking Datasets .................................................................................................................................................................................. 32
Data Limitations .................................................................................................................................................................................. 32
ADDITIONAL TABLES ............................................................................................................................... 34
COMMONLY CITED OSHA STANDARDS ANALYSIS ......................................................................... 37
METHODOLOGY .......................................................................................................................................... 40
Negative Binomial Regression ........................................................................................................................................................ 40
Logistic Regression.............................................................................................................................................................................. 41
Imputing Missing Values ................................................................................................................................................................... 42
Statistical Significance ...................................................................................................................................................................... 42

ii
List of Tables TABLE 1: KEY VARIABLES .............................................................................................................................................................. 4
TABLE 2: SUMMARY STATISTICS FOR CONTINUOUS VARIABLES ............................................................................................... 10
TABLE 3: WORKSITES AND EMPLOYMENT BY AGGREGATED DEPARTMENTS .......................................................................... 11
TABLE 4: FREQUENCY AND PERCENT OF WORKSITES INSPECTED BY DEPARTMENT .............................................................. 12
TABLE 5: NUMBER OF INSPECTIONS BY UNION STATUS ............................................................................................................ 14
TABLE 6: NUMBER OF LTCS BY WORKSITE CHARACTERISTICS, REGRESSION-ADJUSTED MEANS ......................................... 15
TABLE 7: AVERAGE NUMBER OF VIOLATIONS BY PROGRAM YEAR........................................................................................... 17
TABLE 8: NUMBER OF VIOLATIONS BY UNION STATUS, REGRESSION-ADJUSTED MEANS ...................................................... 19
TABLE 9: NUMBER OF VIOLATIONS BY DEPARTMENT, REGRESSION-ADJUSTED MEANS ........................................................ 20
TABLE 10: TOP FIVE OSHA STANDARDS VIOLATED, FEDTARG INSPECTIONS AND ALL INSPECTIONS .............................. 21
TABLE 11: PERCENT OF WORKSITES CITED FOR EACH VIOLATION TYPE DURING FEDTARG INSPECTIONS ...................... 22
TABLE 12: VIOLATION TYPE BY WORKSITE CHARACTERISTICS, REGRESSION-ADJUSTED MEANS ........................................ 24
TABLE 13: PRE- AND POST-INSPECTION LTCS ......................................................................................................................... 26
TABLE 14: AVERAGE MARGINAL EFFECT OF INSPECTIONS ON LTCS ....................................................................................... 26
TABLE 15: WORKSITES AND EMPLOYMENT BY DEPARTMENT (DISAGGREGATED) ................................................................ 34
TABLE 16: VIOLATIONS CITED BY WORKSITE CHARACTERISTICS, INCIDENCE RATE RATIOS ................................................ 35
TABLE 17: LTCS BY WORKSITE CHARACTERISTICS, INCIDENCE RATE RATIOS ...................................................................... 36
TABLE 18: PROBABILITY OF VIOLATING THE TOP FIVE FEDTARG STANDARDS, REGRESSION-ADJUSTED MEANS ........... 39
List of Figures FIGURE 1: THE THREE COMPONENTS OF THE FEDTARG ANALYSIS .......................................................................................... 3 FIGURE 2: OVERVIEW OF THE FEDTARG PROGRAM .................................................................................................................. 5 FIGURE 3: TOTAL NUMBER OF INSPECTIONS BY INDUSTRY ...................................................................................................... 13 FIGURE 4: NUMBER OF INSPECTIONS BY WORKSITE SIZE ......................................................................................................... 13 FIGURE 5: TOTAL NUMBER OF INSPECTIONS AND PERCENTAGE OF UNIQUE WORKSITES INSPECTED BY REGION ............... 14 FIGURE 6: NUMBER OF VIOLATIONS BY INDUSTRY, REGRESSION-ADJUSTED MEANS ............................................................. 17 FIGURE 7: NUMBER OF VIOLATIONS BY REGION, REGRESSION-ADJUSTED MEANS ................................................................. 18 FIGURE 8: NUMBER OF VIOLATIONS BY WORKSITE SIZE, REGRESSION-ADJUSTED MEANS.................................................... 19 FIGURE 9: PROCESS FOR GENERATING FEDTARG INSPECTIONS ............................................................................................. 31 FIGURE 10: DATA LINKING PROCESSES ...................................................................................................................................... 32
iii
Acronyms CEO: Chief Evaluation Office
DOL: Department of Labor
FECA: Federal Employees’ Compensation Act
FEDTARG: Federal Agency Targeting Inspection Program
FY: Fiscal Year
GAO: Government Accountability Office
LTC: Lost Time Case
OSHA: Occupational Safety and Health Administration
OWCP: Office of Workers’ Compensation Programs
1
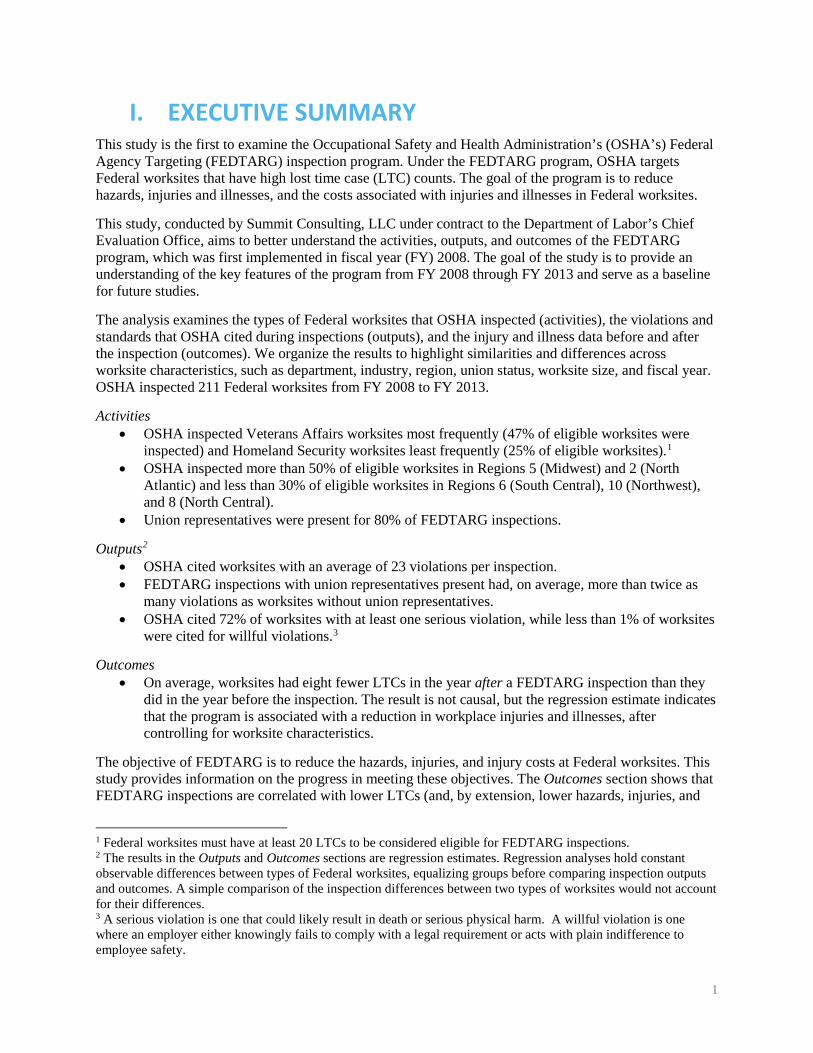
I. EXECUTIVE SUMMARY This study is the first to examine the Occupational Safety and Health Administration’s (OSHA’s) Federal Agency Targeting (FEDTARG) inspection program. Under the FEDTARG program, OSHA targets Federal worksites that have high lost time case (LTC) counts. The goal of the program is to reduce hazards, injuries and illnesses, and the costs associated with injuries and illnesses in Federal worksites.
This study, conducted by Summit Consulting, LLC under contract to the Department of Labor’s Chief Evaluation Office, aims to better understand the activities, outputs, and outcomes of the FEDTARG program, which was first implemented in fiscal year (FY) 2008. The goal of the study is to provide an understanding of the key features of the program from FY 2008 through FY 2013 and serve as a baseline for future studies.
The analysis examines the types of Federal worksites that OSHA inspected (activities), the violations and standards that OSHA cited during inspections (outputs), and the injury and illness data before and after the inspection (outcomes). We organize the results to highlight similarities and differences across worksite characteristics, such as department, industry, region, union status, worksite size, and fiscal year. OSHA inspected 211 Federal worksites from FY 2008 to FY 2013.
Activities • OSHA inspected Veterans Affairs worksites most frequently (47% of eligible worksites were
inspected) and Homeland Security worksites least frequently (25% of eligible worksites).1 • OSHA inspected more than 50% of eligible worksites in Regions 5 (Midwest) and 2 (North
Atlantic) and less than 30% of eligible worksites in Regions 6 (South Central), 10 (Northwest), and 8 (North Central).
• Union representatives were present for 80% of FEDTARG inspections.
Outputs2 • OSHA cited worksites with an average of 23 violations per inspection. • FEDTARG inspections with union representatives present had, on average, more than twice as
many violations as worksites without union representatives. • OSHA cited 72% of worksites with at least one serious violation, while less than 1% of worksites
were cited for willful violations.3
Outcomes • On average, worksites had eight fewer LTCs in the year after a FEDTARG inspection than they
did in the year before the inspection. The result is not causal, but the regression estimate indicates that the program is associated with a reduction in workplace injuries and illnesses, after controlling for worksite characteristics.
The objective of FEDTARG is to reduce the hazards, injuries, and injury costs at Federal worksites. This study provides information on the progress in meeting these objectives. The Outcomes section shows that FEDTARG inspections are correlated with lower LTCs (and, by extension, lower hazards, injuries, and
1 Federal worksites must have at least 20 LTCs to be considered eligible for FEDTARG inspections. 2 The results in the Outputs and Outcomes sections are regression estimates. Regression analyses hold constant observable differences between types of Federal worksites, equalizing groups before comparing inspection outputs and outcomes. A simple comparison of the inspection differences between two types of worksites would not account for their differences. 3 A serious violation is one that could likely result in death or serious physical harm. A willful violation is one where an employer either knowingly fails to comply with a legal requirement or acts with plain indifference to employee safety.

2
costs). Thus, OSHA’s allocation of inspection resources is critical. The Activities and Outputs sections may allow OSHA to assess their allocation of inspection resources, and whether that allocation indeed results in inspections of the most hazardous worksites.
OSHA is currently revising the implementation and targeting strategy of the FEDTARG program. This report is a resource FEDTARG stakeholders can use to consider how, where, and why program revisions could be implemented.

3
II. INTRODUCTION The Federal Agency Targeting Inspection (FEDTARG) program, housed in the Department of Labor’s (DOL’s) Occupational Safety and Health Administration (OSHA), targets, inspects, and evaluates Federal worksites for compliance with OSHA standards. The purpose of the program is to reduce hazards, injuries, and illnesses at the worksite, and to reduce Federal workers’ compensation costs associated with on-the-job injuries and illnesses. The FEDTARG program applies to worksites staffed by Federal employees or by contractors whose work is supervised by Federal agency personnel.
DOL Chief Evaluation Office contracted Summit Consulting (Summit) to conduct a study of the effectiveness of the FEDTARG program. Summit, with guidance from CEO and OSHA, designed the study to analyze the activities, outputs, and outcomes of the program. OSHA stakeholders can use the findings to assess whether FEDTARG inspection resources are allocated efficiently and how those resources might be distributed more effectively in the program going forward.
Our analysis provides an understanding of workplace safety in Federal worksites. The Activities section examines where FEDTARG inspections occur. The Outputs section identifies the violations that exist in Federal worksites and how they correlate to lost time cases. The Outcomes section examines lost time cases (LTCs) at Federal worksites in the years immediately before and after FEDTARG inspections. Figure 1 shows the three components of our analysis.
Figure 1: The Three Components of the FEDTARG Analysis
The implementation of the FEDTARG program and its data collection efforts are currently under revision. This analysis serves as a baseline for future analyses on the revised FEDTARG program and data.4
The remainder of this report is organized as follows: Section III provides program background, explains the FEDTARG process, and describes the data collection procedures. Section IV details the research questions, and Section V gives the results. Section VI summarizes the main findings and provides conclusions and extensions.
4 FEDTARG inspections are randomized over Federal worksites according to their LTC counts. The current FEDTARG data lack two necessary components to estimate the causal effects of the program: control worksites and sufficient sample size. Summit determined early in the study that an impact evaluation would be impossible given these limitations.
Activities
Inspections
Outputs
Violations
Outcomes
Injuries and Illnesses
Increased workplace safety and health

4
III. BACKGROUND In April 2006, the Government Accountability Office (GAO) surveyed OSHA compliance within 57 government agencies and subsequently reported its findings and recommendations in OSHA Could Improve Federal Agencies’ Safety Programs with a More Strategic Approach to Its Oversight.5 This comprehensive review concluded that (a) Federal workers’ injury and illness compensation claims cost U.S. taxpayers more than $1.5 billion in 2004, (b) these workers filed approximately 148,000 new claims in 2004, and (c) between FY 2000 and FY 2004, fewer than 1% of OSHA’s inspections were of Federal worksites. Based on their findings, GAO recommended that OSHA develop a targeted inspection program for Federal worksites based on injury and illness data, track violations disputed by Federal agencies, conduct evaluations of the largest and most hazardous agencies, and assess the effectiveness of Federal agencies’ safety programs in an annual report to the President.
As a result of the GAO’s report, OSHA established the FEDTARG program in FY 2008 to increase oversight and effectively target worksites for inspection. FEDTARG applies to workplaces staffed by Federal employees or by contractors whose work is supervised by Federal personnel. The goal of the program is to reduce hazards, injuries, and illnesses in Federal worksites, and ultimately to reduce Federal workers’ compensation costs associated with on-the-job injuries and illnesses.
Data Overview The FEDTARG data are comprised of multiple sources. The FEDTARG process begins with claims data that OWCP collects. These data include LTCs for Federal worksites, which determine eligibility for FEDTARG inspections. Next, OSHA compiles the list of sites that are eligible for FEDTARG inspections and randomizes worksites for inspections. Worksites that receive inspections have corresponding OSHA inspections results data, which include the count and types of violations, and the OSHA standards that inspectors cited. Further details on the data and its limitations can be found in Appendix B. The key variables are listed in Table 1.
Table 1: Key Variables
Variable Source Worksite Characteristics
5 Departments FEDTARG Inspection Lists Union Status OSHA Inspection Data 10 OSHA Regions FEDTARG Inspection Lists 3 Industry Groups OSHA Inspection Data 4 Categories (Quartiles) for Number of Employees OSHA Inspection Data
Outputs Number of Violations OSHA Inspection Data OSHA Standard OSHA Inspection Data Violation Type (Serious, willful, repeated, other-than-serious) OSHA Inspection Data
Outcomes Lost time cases (LTCs) FECA Case Management File Extracts
Note: The data sources are explained in detail in Appendix B.
FEDTARG Process Rather than targeting all Federal worksites to measure OSHA compliance, FEDTARG adopted a strategic and cost-effective approach by focusing its inspections on Federal worksites with high LTC counts. To 5 United States Government Accountability Office. "OSHA Could Improve Federal Agencies’ Safety Programs with a More Strategic Approach to Its Oversight." Washington, DC: United States Government Accountability Office, 2006. http://www.gao.gov/assets/250/249768.pdf

5
gather data about which worksites to target, FEDTARG followed a multi-step data collection, cleaning, and validating process. Figure 2 outlines the FEDTARG process, and the sections following Figure 2 detail information about each step of the process.
From FY 2008 through FY 2013, OSHA published its directives for implementing the FEDTARG program on its website.6 The directives describe the program, define key terms, outline scheduling and inspection procedures, and provide information on inspection coding. Directives also explain situations under which sites are ineligible for FEDTARG inspections.
Figure 2: Overview of the FEDTARG Program
FECA Claims Data Collection Federal employees injured or exposed to disease at work complete a claim form.7 OWCP compiles the information from these forms into a case management file which contains all of the Federal Employees’ Compensation Act (FECA) claims.8
Aggregating FECA Claims Data and Delivery to OSHA OWCP records LTCs in the FECA data when an individual misses work due to an occupational injury or illness following the date of injury. An establishment’s LTCs are a count of the number of cases (not days) where time is lost.9
OWCP records the data at the claim level. A chargeback code is a four-digit code that identifies the agency to which an establishment belongs. The chargeback codes have varying levels of specificity across departments. For example, the Department of Veteran Affairs has a unique chargeback code for each
6 https://www.osha.gov/dep/neps/nep-programs.html 7 The completeness and accuracy of the FECA data cannot be verified since OSHA’s worksite-level data (Form 300A) were not available for cross checks. Boden and Ozonoff (2008) assert that injuries and illnesses at work are underreported. We cannot control for the underreporting and acknowledge that the injury data used in the analysis may be underestimated. 8 OWCP Forms can be accessed here: http://www.dol.gov/owcp/dfec/regs/compliance/forms.htm 9 OSHA data from the private sector commonly use a measure called the DART rate, which stands for Days Away, Restricted, or Transfer. The DART rate is a count of injuries that led to days away from work, job restriction, or job transfer per 100 workers. OSHA did not collect injury and illness data from Federal worksites in the past and therefore used the FECA data from OWCP to obtain injury and illness counts. As such, LTC is used in this report, rather than DART.
OWCP collects FECA claims data
OWCP aggregates claims
and delivers to OSHA
OSHA determines eligibility for
inspection
OSHA selects sites for primary and secondary inspection lists
OSHA determines addresses of selected sites
OSHA conducts inspection cycles

6
office, while the Department of Transportation has codes that correspond to certain administrations within a department (e.g. the chargeback code “4086” corresponds to a specific Veterans Affairs hospital in Hines, Illinois; “2351” corresponds to the Department of Transportation Federal Highway Administration.)
Chargeback codes originate from the FECA data, which presents challenges when aggregating the data to the worksite level. The codes do not uniquely identify the establishment because multiple worksites with the same chargeback code could be located in the same zip code. As a result, some Federal worksites may be mistakenly added to or removed from the inspection list. Despite its limitations, this was the only feasible data aggregation option.
Determining Eligibility for Inspection FEDTARG directives restrict FEDTARG inspections to certain Federal agencies. Executive Departments are eligible (as identified in U.S. Code Title 5, Part 1, Chapter 1, §10110), or any employing unit, or authority of the Executive Branch of the Government. Additionally, to be eligible for FEDTARG inspections, worksites must have at least 20 LTCs in the previous year, with some exceptions:11
• Worksites that received a comprehensive safety inspection in the two years prior to the effective date of the current year’s FEDTARG program are ineligible.12, 13
• The U.S. Post Office, which OSHA inspects as a private entity in a different program, is ineligible.
• Participants of the Voluntary Protection Programs are ineligible.14 OSHA has 22 states and jurisdictions that are approved State Plan states. These states have developed their own job safety and health programs and regulations. Regardless of whether a state is a State or Federal Plan state, the Federal worksites within the state are eligible for FEDTARG inspections. Federal OSHA has jurisdiction over Federal employees and conducts all inspections of Federal agencies.
Site Selection OSHA program staff create two lists of worksites that are to receive inspections. First, they create the primary list of worksites that are to receive inspections and, if regional offices request more worksites to inspect, they create a secondary list. The procedures for creating the lists are outlined below.
Primary Inspection List OSHA creates the primary list using the following randomization procedure based on the number of LTCs that occur at the worksite:
• Worksites with 100+ LTCs: 100% chance of being selected for inspection • Worksites with 50-99 LTCs: 50% chance of being selected for inspection • Worksites with 20-49 LTCs: 10% chance of being selected for inspection
10 http://www.gpo.gov/fdsys/pkg/USCODE-2009-title5/html/USCODE-2009-title5-partI.htm 11 Directives state that these ineligible worksites should be deleted by the area offices after receiving the inspection lists from the national office. In some cases, the national office attempts to delete these sites prior to randomization. 12 This two-year ineligibility window is calculated using the previous inspection’s opening conference date. 13 The randomization procedure calls for all sites with 100 or more LTCs to be inspected. However, a site is not inspected if it has received an inspection within the two years prior, regardless of how many LTCs occur at the worksite. 14 The Voluntary Protection Programs recognize employers and workers who have implemented effective safety and health management systems and maintained injury and illness rates below national Bureau of Labor Statistics averages for their respective industries.
7
Secondary Inspection List OSHA creates secondary lists comprising a specific number of worksites requested by the regional offices. OSHA selects the sites using the following procedures:
• 60% from the 50-99 LTCs category • 40% from the 20-49 LTCs category
When there are fewer worksites remaining than the number requested by the regional offices, all remaining worksites are placed on secondary lists.
Determining Addresses Chargeback codes, which indicate the worksite’s department and zip code combinations, may not uniquely identify specific worksites. For cases where there are multiple worksites with the same chargeback code and zip code, program staff include one address or a few possible addresses on the inspection list.
In 2009, OSHA compiled a list of all Federal worksites to determine worksite addresses. OSHA also uses internet searches to locate worksites.15
Conducting Inspection Cycles Once OSHA finalizes the lists, it distributes them to the regional offices and area offices.16 Area offices exclude worksites that the agency inspected in the previous two years (determined by the opening inspection date) and worksites that are Voluntary Protection Programs participants.
OSHA inspects the primary and secondary worksites in separate cycles. Once an inspection cycle begins, OSHA inspects all worksites in the cycle (besides those excluded). Inspectors must complete the primary list inspections by the expiration of the program directive (i.e. the end of the fiscal year) and before opening the secondary inspection cycle.17
Inspection Reception and Response Unlike OSHA inspections conducted in the private sector, OSHA cannot impose monetary penalties for standards violations at Federal worksites. As such, the incentive to comply with OSHA standards and abate violations varies depending on the organization or agency.
OSHA reports inspections and the corresponding results through the agency’s chain of command. OSHA notifies the Designated Agency Safety and Health Official about the inspection if a press release is
15 The current OSHA rule on recordkeeping modernization, implemented in FY 2014, requires electronic submission of injury and illness data from OSHA Form 300 logs and establishment information from Federal worksites. This new rule should alleviate the difficulties associated with determining the addresses of worksites to be inspected. Occupational Safety and Health Administration. August 5, 2013. Regulations (Standards-29 CFR-1960.72). Retrieved from https://www.osha.gov/pls/oshaweb/owadisp.show_document?p_table=STANDARDS&p_id=11306. 16 OSHA has 10 Area Offices within each region. A map of the Regional and Area Offices can be accessed at: https://www.osha.gov/html/RAmap.html. 17 Although secondary inspections do not have to be completed by the expiration of the directive, if an area office begins any secondary inspections, it has to inspect all worksites on the secondary list prior to initiating worksite inspections under a successive FEDTARG year. This rule is intended to ensure that no worksites are unfairly targeted for inspections.

8
forthcoming, when a repeat or willful violation is cited, or when a significant case is issued.18 The Official is usually an Assistant Secretary or someone who acts on his or her behalf. Notifying the Safety and Health Official may cause embarrassment for the agency’s leadership if the results of the inspection are not favorable. Additionally, senior leadership from the agency may engage the leadership or management at the inspected facility to discuss the results.
In addition to notifying the Safety and Health Official with the results of an inspection, OSHA often issues press releases announcing the results. These press releases have the potential to garner public scrutiny, which provides further incentive to comply with OSHA standards.19
Internally, employers are required to post notices of violations at or near the place where each violation occurred. This helps employees identify where hazards exist and understand how they may be exposed to them. The notice remains posted near the violation for either three working days or until the hazard is abated, whichever is longer.
18 If an agency’s penalties from an inspection exceed $100,000 then the case is classified as a significant case, which results in additional scrutiny. (Though penalties cannot be imposed on Federal agencies, they are still calculated as if the site were a private sector site.) 19 OSHA regions have internal policies that determine whether press releases are published. These policies are usually based on monetary thresholds.
9
IV. RESEARCH QUESTIONS Summit developed FEDTARG research questions in collaboration with CEO and OSHA. The questions address the activities, outputs, and outcomes of the FEDTARG program, and provide information on the overall status and results of the program. The questions describe how the activities, outputs, and outcomes of the FEDTARG program ultimately relate to workplace safety.
Activities of the FEDTARG Program 1. Which departments are most commonly inspected through the FEDTARG program? 2. What are the characteristics of FEDTARG inspected worksites? 3. How do worksite characteristics correlate with LTC counts?
Outputs of the FEDTARG Program 4. How many violations are cited during FEDTARG inspections? 5. Which OSHA standards are most commonly cited? How do worksite characteristics correlate
with OSHA standards that are commonly cited? 6. Which violation types (willful, serious, repeated, other-than-serious) are most frequently cited
during FEDTARG inspections?20 7. How do worksite characteristics correlate with violation types?
Outcomes of the FEDTARG Program 8. How do post-FEDTARG-inspection LTCs compare to pre-inspection LTCs?
20 Willful violations occur when the employer either knowingly fails to comply with a legal requirement or acts with plain indifference to employee safety. Serious violations occur when the hazard could cause an accident or illness that would most likely result in death or serious physical harm. Repeated violations occur when the agency has been cited previously for the same or similar condition within the previous five years. Other-than-serious violations are violations that have a direct relationship to job safety and health but are not serious and probably would not cause death or serious physical harm.

10
V. RESULTS The results presented in this report provide a general description of the FEDTARG program. The relationships among activities, outputs, and outcomes of FEDTARG inspections are correlational, not causal. However, they are regression-adjusted relationships that control for worksite characteristics. Thus, changes in LTCs before and after FEDTARG inspections are changes that exist while holding all other worksite characteristics equal.
Regression analyses, compared to simple summary statistics, can account for the differences that exist among Federal worksites before comparing them. For example, unionized worksites are generally larger than non-unionized worksites. A simple comparison of the inspection differences between the two would not account for those size differences. Regression-adjusted comparisons hold size constant across groups, effectively equalizing the size of union and non-union worksites, before comparing inspection outputs. Appendix E describes the methodology and model specifications.
Table 2 displays the minimum, median, mean, and maximum for the continuous variables contained in the analysis dataset.21 To prepare for the analysis, Summit checked these variables for extreme values and outliers and found all values to be within plausible ranges.22
Table 2: Summary Statistics for Continuous Variables
Variable Min. Median Mean Max. Number of Employees 25 2,358 2,777 20,000 Number of Violations 0 10 23 529
Number of Serious Violations 0 5 13 110 Number of Repeat Violations 0 0 4 475 Number of Other-than-Serious Violations 0 1 7 400 Number of Willful Violations 0 0 <1 1
Lost Time Cases (LTCs),Year Before Inspection 20 50 67 316 Source: FEDTARG data (DOL Enforcement Database-OSHA Data, OPM), FY 2008-FY 2014.
Activities of the FEDTARG Program The first set of research questions covers the basic activities of the FEDTARG program. The characteristics of the inspected worksites inform program officers about the types of worksites that are affected by the program.
Summary of Findings We find that almost half of the eligible Veterans Affairs worksites (47%) received a FEDTARG inspection sometime between FY 2008 and FY 2013. All other departments had less than 33% of their eligible worksites inspected. Most of the worksites that OSHA inspects are in the public administration industry, which is unsurprising considering that the worksites are all Federal. The most FEDTARG inspections took place in Region 4 (49 inspections), while many regions had fewer than 10 inspections. 80% of worksites exercised their “walkaround” right by having union representatives accompany the inspector.
21 Categorical variables are examined in the “Activities of the FEDTARG Program” section. 22 Worksites with abnormally large numbers of violations, for example, have characteristics that explain the abnormality. In these cases, OSHA inspected multiple areas of the worksite several times and aggregated the inspections into one observation for one worksite.
11
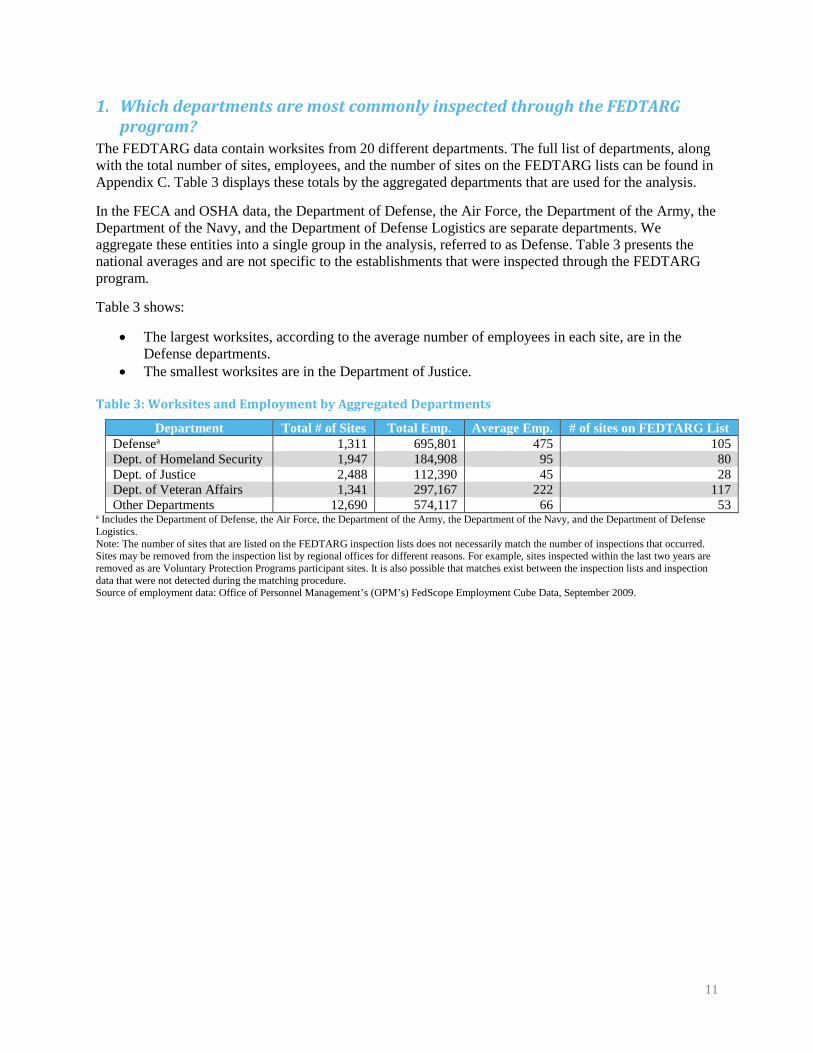
1. Which departments are most commonly inspected through the FEDTARG program?
The FEDTARG data contain worksites from 20 different departments. The full list of departments, along with the total number of sites, employees, and the number of sites on the FEDTARG lists can be found in Appendix C. Table 3 displays these totals by the aggregated departments that are used for the analysis.
In the FECA and OSHA data, the Department of Defense, the Air Force, the Department of the Army, the Department of the Navy, and the Department of Defense Logistics are separate departments. We aggregate these entities into a single group in the analysis, referred to as Defense. Table 3 presents the national averages and are not specific to the establishments that were inspected through the FEDTARG program.
Table 3 shows:
• The largest worksites, according to the average number of employees in each site, are in the Defense departments.
• The smallest worksites are in the Department of Justice.
Table 3: Worksites and Employment by Aggregated Departments
Department Total # of Sites Total Emp. Average Emp. # of sites on FEDTARG List Defensea 1,311 695,801 475 105 Dept. of Homeland Security 1,947 184,908 95 80 Dept. of Justice 2,488 112,390 45 28 Dept. of Veteran Affairs 1,341 297,167 222 117 Other Departments 12,690 574,117 66 53
a Includes the Department of Defense, the Air Force, the Department of the Army, the Department of the Navy, and the Department of Defense Logistics. Note: The number of sites that are listed on the FEDTARG inspection lists does not necessarily match the number of inspections that occurred. Sites may be removed from the inspection list by regional offices for different reasons. For example, sites inspected within the last two years are removed as are Voluntary Protection Programs participant sites. It is also possible that matches exist between the inspection lists and inspection data that were not detected during the matching procedure. Source of employment data: Office of Personnel Management’s (OPM’s) FedScope Employment Cube Data, September 2009.
12
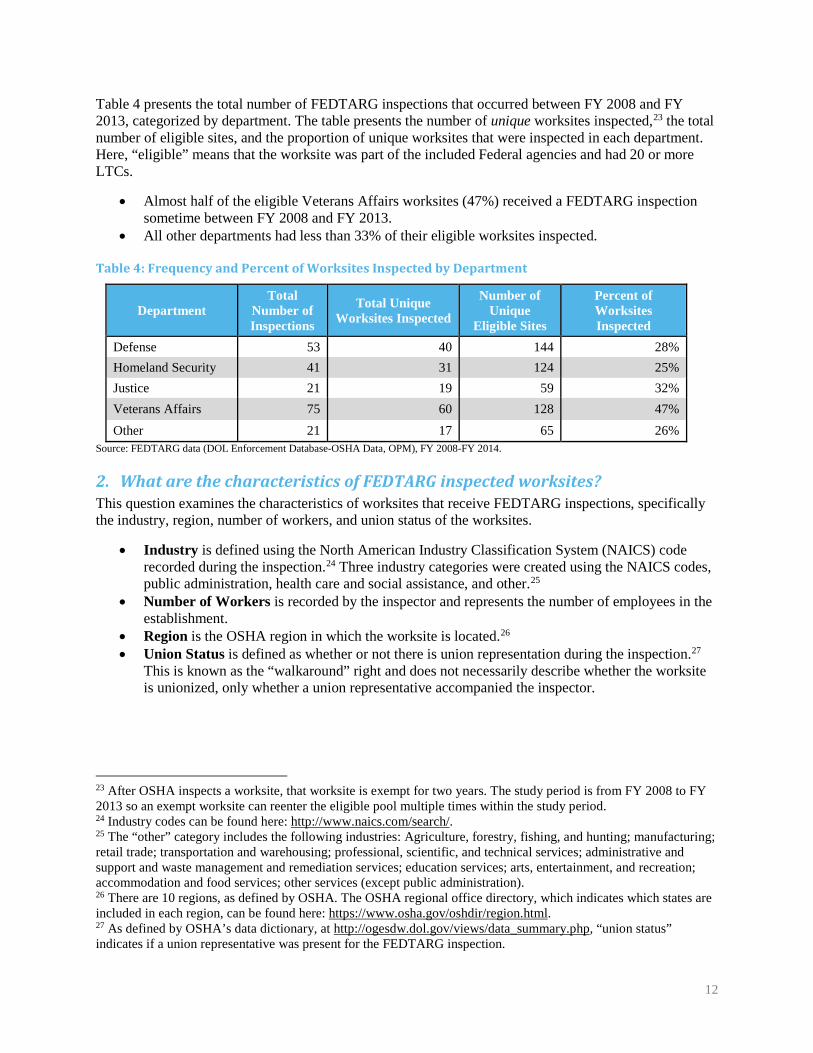
Table 4 presents the total number of FEDTARG inspections that occurred between FY 2008 and FY 2013, categorized by department. The table presents the number of unique worksites inspected,23 the total number of eligible sites, and the proportion of unique worksites that were inspected in each department. Here, “eligible” means that the worksite was part of the included Federal agencies and had 20 or more LTCs.
• Almost half of the eligible Veterans Affairs worksites (47%) received a FEDTARG inspection sometime between FY 2008 and FY 2013.
• All other departments had less than 33% of their eligible worksites inspected.
Table 4: Frequency and Percent of Worksites Inspected by Department
Department Total
Number of Inspections
Total Unique Worksites Inspected
Number of Unique
Eligible Sites
Percent of Worksites Inspected
Defense 53 40 144 28% Homeland Security 41 31 124 25% Justice 21 19 59 32% Veterans Affairs 75 60 128 47% Other 21 17 65 26%
Source: FEDTARG data (DOL Enforcement Database-OSHA Data, OPM), FY 2008-FY 2014.
2. What are the characteristics of FEDTARG inspected worksites? This question examines the characteristics of worksites that receive FEDTARG inspections, specifically the industry, region, number of workers, and union status of the worksites.
• Industry is defined using the North American Industry Classification System (NAICS) code recorded during the inspection.24 Three industry categories were created using the NAICS codes, public administration, health care and social assistance, and other.25
• Number of Workers is recorded by the inspector and represents the number of employees in the establishment.
• Region is the OSHA region in which the worksite is located.26 • Union Status is defined as whether or not there is union representation during the inspection.27
This is known as the “walkaround” right and does not necessarily describe whether the worksite is unionized, only whether a union representative accompanied the inspector.
23 After OSHA inspects a worksite, that worksite is exempt for two years. The study period is from FY 2008 to FY 2013 so an exempt worksite can reenter the eligible pool multiple times within the study period. 24 Industry codes can be found here: http://www.naics.com/search/. 25 The “other” category includes the following industries: Agriculture, forestry, fishing, and hunting; manufacturing; retail trade; transportation and warehousing; professional, scientific, and technical services; administrative and support and waste management and remediation services; education services; arts, entertainment, and recreation; accommodation and food services; other services (except public administration). 26 There are 10 regions, as defined by OSHA. The OSHA regional office directory, which indicates which states are included in each region, can be found here: https://www.osha.gov/oshdir/region.html. 27 As defined by OSHA’s data dictionary, at http://ogesdw.dol.gov/views/data_summary.php, “union status” indicates if a union representative was present for the FEDTARG inspection.
13
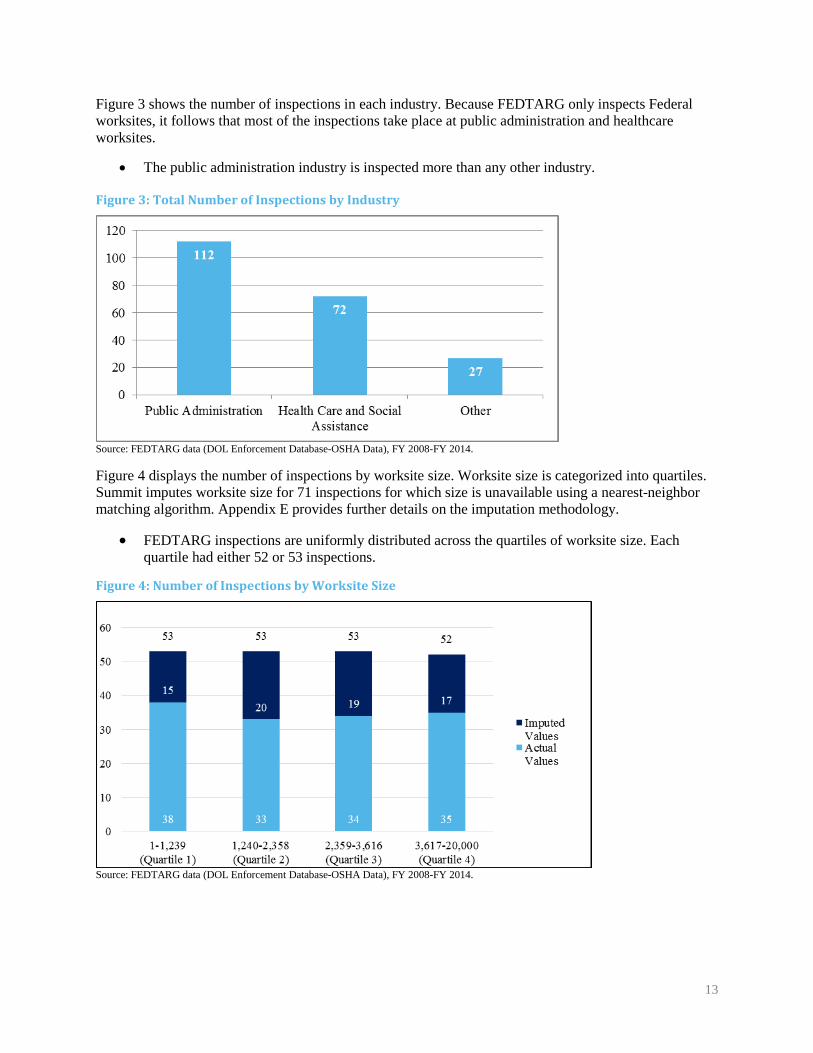
Figure 3 shows the number of inspections in each industry. Because FEDTARG only inspects Federal worksites, it follows that most of the inspections take place at public administration and healthcare worksites.
• The public administration industry is inspected more than any other industry.
Figure 3: Total Number of Inspections by Industry
Source: FEDTARG data (DOL Enforcement Database-OSHA Data), FY 2008-FY 2014.
Figure 4 displays the number of inspections by worksite size. Worksite size is categorized into quartiles. Summit imputes worksite size for 71 inspections for which size is unavailable using a nearest-neighbor matching algorithm. Appendix E provides further details on the imputation methodology.
• FEDTARG inspections are uniformly distributed across the quartiles of worksite size. Each quartile had either 52 or 53 inspections.
Figure 4: Number of Inspections by Worksite Size
Source: FEDTARG data (DOL Enforcement Database-OSHA Data), FY 2008-FY 2014.

14
Figure 5 shows a map of the 10 OSHA regions with the frequency of inspections in each region. We also report the proportion of inspections for unique eligible sites.
• Region 4 (Southeast) incurred the greatest number of FEDTARG inspections (49). • Several regions had fewer than 10 inspections. • OSHA inspected more than 50% of unique worksites in Region 2 (North Atlantic) and Region 5
(Midwest). OSHA inspected less than 20% of unique worksites in Region 10 (Northwest).
Figure 5: Total Number of Inspections and Percentage of Unique Worksites Inspected by Region
Source: FEDTARG data (DOL Enforcement Database-OSHA Data), FY 2008-FY 2014.
Table 5 displays the number of inspections by union status.
• 80% of the worksites inspected under the FEDTARG program had union representation during the inspection.28
Table 5: Number of Inspections by Union Status Union Status Number of Inspections Percent of Inspections
No 39 18% Yes 169 80% Missing 3 1% Total 211 100%
Source: FEDTARG data (DOL Enforcement Database-OSHA Data), FY 2008-FY 2014.
28 This variable represents whether the union exercised its right to have union representatives accompany the inspector during the inspection, known as the “walkaround” right. A “no” value in the union status variable indicates that no union representative was present during the inspection. It does not indicate whether the worksite is unionized.

15
3. How do worksite characteristics correlate with LTC counts? The number of LTCs a worksite has in a given year determines whether or not it will be eligible for a FEDTARG inspection in the following year. We use negative binomial regressions since the number of LTCs, the outcome variable, is a count variable. We provide methodological details in Appendix E.
• For categorical variables, we test LTC estimates for each value against the grand mean of LTCs for the category. A statistically significant estimate denotes an estimate that is statistically significantly different from the grand mean for that characteristic. For example, the grand mean of LTCs for all regions is 63. Worksites in Region 1 have 42 LTCs, which is statistically significantly different from the grand mean.
Table 6 presents the regression-adjusted mean number of LTCs for each categorical value while controlling for all other worksite characteristics.
• Worksites in Regions 1 (Northeast) and 7 (Central) have fewer LTCs than the average region. • Worksites in Region 6 (South Central) have more LTCs than the average region. • Larger worksites have more LTCs than smaller worksites. • Worksites in the Department of Homeland Security have the highest LTC counts.
Table 6: Number of LTCs by Worksite Characteristics, Regression-Adjusted Means
Worksite Characteristics LTCs Industry Mean=67 Public Administration 69 Health Care and Social Assistance 55 Other 78 Region Mean=63 Region 1 (Northeast) 42*** Region 2 (North Atlantic) 53 Region 3 (Mid Atlantic) 58 Region 4 (Southeast) 2 Region 5 (Midwest) 64 Region 6 (South Central) 101*** Region 7 (Central) 40*** Region 8 (North Central) 70 Region 9 (Southwest) 70 Region 10 (Northwest) 69 Union Status No 57 Yes 68 Worksite Size Mean=67 1 to 1,239 (Quartile 1) 54*** 1,240 to 2,358 (Quartile 2) 55*** 2,359 to 3,616 (Quartile 3) 79** 3,617 to 20,000 (Quartile 4) 81** Department Mean=64 Defense 68 Homeland Security 89** Justice 53 Other 54 Veterans Affairs 57
Source: FEDTARG data (DOL Enforcement Database-OSHA Data), FY 2008-FY 2014. Note: Negative binomial regression is used to estimate the number of LTCs. The model controls for industry, region, union status, year, department, number of employees, and whether or not the number of employees is missing. The estimates for categorical variables with more than two possible outcomes are compared to the grand mean of the category. For yes/no binary variables, the “no” value is the reference category. Statistical significance of the estimates (relative to the grand mean for categorical variables) is denoted by asterisks on the estimate (***p<0.01 **p<0.05 *p<0.10).
16
Outputs of the FEDTARG Program Summit analyzes the outputs of the FEDTARG program using a combination of summary statistics and regression analysis. We use logistic regression when the outcome variable is binary, such as whether or not a worksite was cited for a specific standard violation. We use negative binomial regression models to estimate count data, such as the number of violations. Regression results control for industry, region, worksite size, year, department, and union status.
We first summarize the major findings of the research questions in this section, and then present the results. Appendix E provides further details about the methodology.
Summary of Findings We find that the FEDTARG program effectively targets Federal worksites that violate OSHA standards. In every inspection year, OSHA inspectors have found, on average, at least 16 violations per inspection. Inspectors cite 72% of the worksites with at least one serious violation and 55% of worksites with at least one other-than-serious violation. Only 18% of FEDTARG inspections uncover no violations.
Federal worksites are unlikely to be cited for repeat violations and even less likely to incur willful violations. Worksites are cited for repeated violations in 17% of inspections. Willful violations are exceedingly rare, occurring in less than 1% percent of inspections.
We also find that the number of violations varies significantly by OSHA region, worksite size, and union status. FEDTARG inspections in Regions 2 (North Atlantic) and 3 (Mid-Atlantic) cite statistically significantly fewer violations than the overall region average. This may suggest that there is regional variation in the administration of the FEDTARG program.
OSHA cites the biggest worksites with the most violations, which may be expected. The largest quartile of worksites is cited for over 50 violations on average. All other quartiles have 21 or fewer.
Inspections in which a union representative accompanies the inspector are cited for far more violations, 27 on average, than unaccompanied inspections, 12 on average. Union representatives may serve to provide an extra set of eyes and greater worksite knowledge to OSHA inspections. Currently, OSHA encourages, but does not require, any worksite staff to accompany the inspector. This finding provides some evidence that a worksite representative, union or otherwise, may benefit OSHA’s inspection efforts.
17
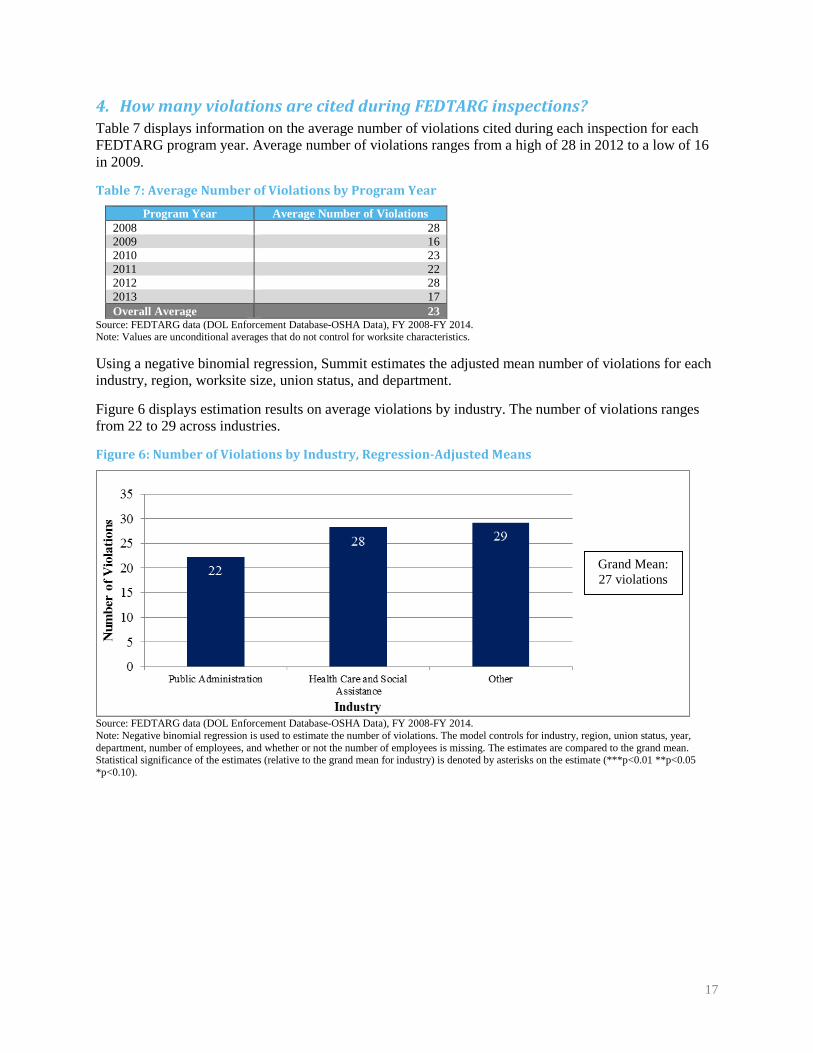
4. How many violations are cited during FEDTARG inspections? Table 7 displays information on the average number of violations cited during each inspection for each FEDTARG program year. Average number of violations ranges from a high of 28 in 2012 to a low of 16 in 2009.
Table 7: Average Number of Violations by Program Year
Program Year Average Number of Violations 2008 28 2009 16 2010 23 2011 22 2012 28 2013 17 Overall Average 23
Source: FEDTARG data (DOL Enforcement Database-OSHA Data), FY 2008-FY 2014. Note: Values are unconditional averages that do not control for worksite characteristics.
Using a negative binomial regression, Summit estimates the adjusted mean number of violations for each industry, region, worksite size, union status, and department.
Figure 6 displays estimation results on average violations by industry. The number of violations ranges from 22 to 29 across industries.
Figure 6: Number of Violations by Industry, Regression-Adjusted Means
Source: FEDTARG data (DOL Enforcement Database-OSHA Data), FY 2008-FY 2014. Note: Negative binomial regression is used to estimate the number of violations. The model controls for industry, region, union status, year, department, number of employees, and whether or not the number of employees is missing. The estimates are compared to the grand mean. Statistical significance of the estimates (relative to the grand mean for industry) is denoted by asterisks on the estimate (***p<0.01 **p<0.05 *p<0.10).
Grand Mean: 27 violations
18
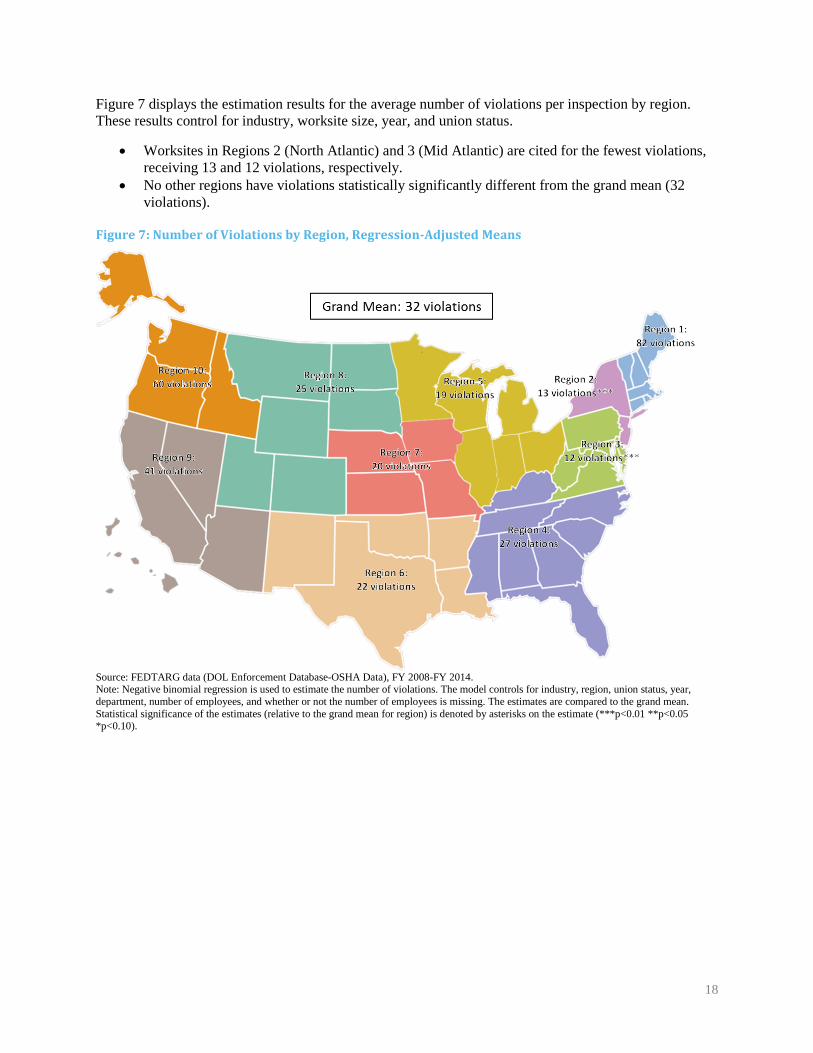
Figure 7 displays the estimation results for the average number of violations per inspection by region. These results control for industry, worksite size, year, and union status.
• Worksites in Regions 2 (North Atlantic) and 3 (Mid Atlantic) are cited for the fewest violations, receiving 13 and 12 violations, respectively.
• No other regions have violations statistically significantly different from the grand mean (32 violations).
Figure 7: Number of Violations by Region, Regression-Adjusted Means
Source: FEDTARG data (DOL Enforcement Database-OSHA Data), FY 2008-FY 2014. Note: Negative binomial regression is used to estimate the number of violations. The model controls for industry, region, union status, year, department, number of employees, and whether or not the number of employees is missing. The estimates are compared to the grand mean. Statistical significance of the estimates (relative to the grand mean for region) is denoted by asterisks on the estimate (***p<0.01 **p<0.05 *p<0.10).
19
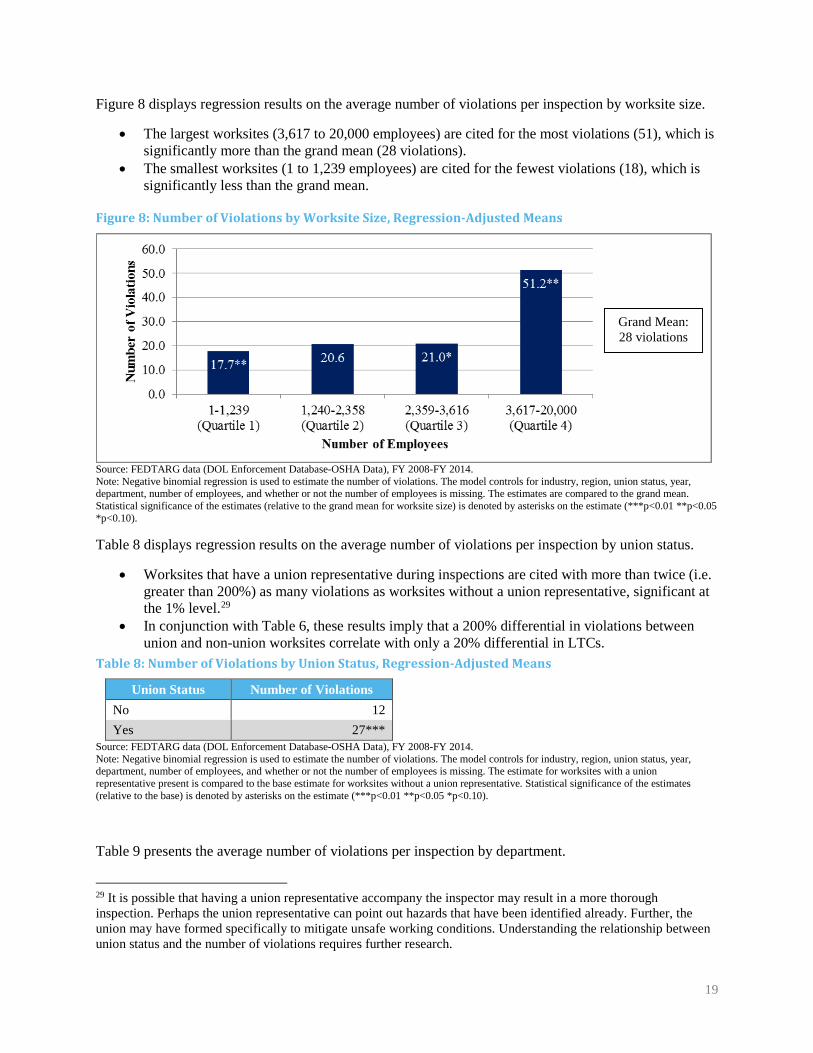
Figure 8 displays regression results on the average number of violations per inspection by worksite size.
• The largest worksites (3,617 to 20,000 employees) are cited for the most violations (51), which is significantly more than the grand mean (28 violations).
• The smallest worksites (1 to 1,239 employees) are cited for the fewest violations (18), which is significantly less than the grand mean.
Figure 8: Number of Violations by Worksite Size, Regression-Adjusted Means
Source: FEDTARG data (DOL Enforcement Database-OSHA Data), FY 2008-FY 2014. Note: Negative binomial regression is used to estimate the number of violations. The model controls for industry, region, union status, year, department, number of employees, and whether or not the number of employees is missing. The estimates are compared to the grand mean. Statistical significance of the estimates (relative to the grand mean for worksite size) is denoted by asterisks on the estimate (***p<0.01 **p<0.05 *p<0.10).
Table 8 displays regression results on the average number of violations per inspection by union status.
• Worksites that have a union representative during inspections are cited with more than twice (i.e. greater than 200%) as many violations as worksites without a union representative, significant at the 1% level.29
• In conjunction with Table 6, these results imply that a 200% differential in violations between union and non-union worksites correlate with only a 20% differential in LTCs.
Table 8: Number of Violations by Union Status, Regression-Adjusted Means
Union Status Number of Violations No 12 Yes 27***
Source: FEDTARG data (DOL Enforcement Database-OSHA Data), FY 2008-FY 2014. Note: Negative binomial regression is used to estimate the number of violations. The model controls for industry, region, union status, year, department, number of employees, and whether or not the number of employees is missing. The estimate for worksites with a union representative present is compared to the base estimate for worksites without a union representative. Statistical significance of the estimates (relative to the base) is denoted by asterisks on the estimate (***p<0.01 **p<0.05 *p<0.10).
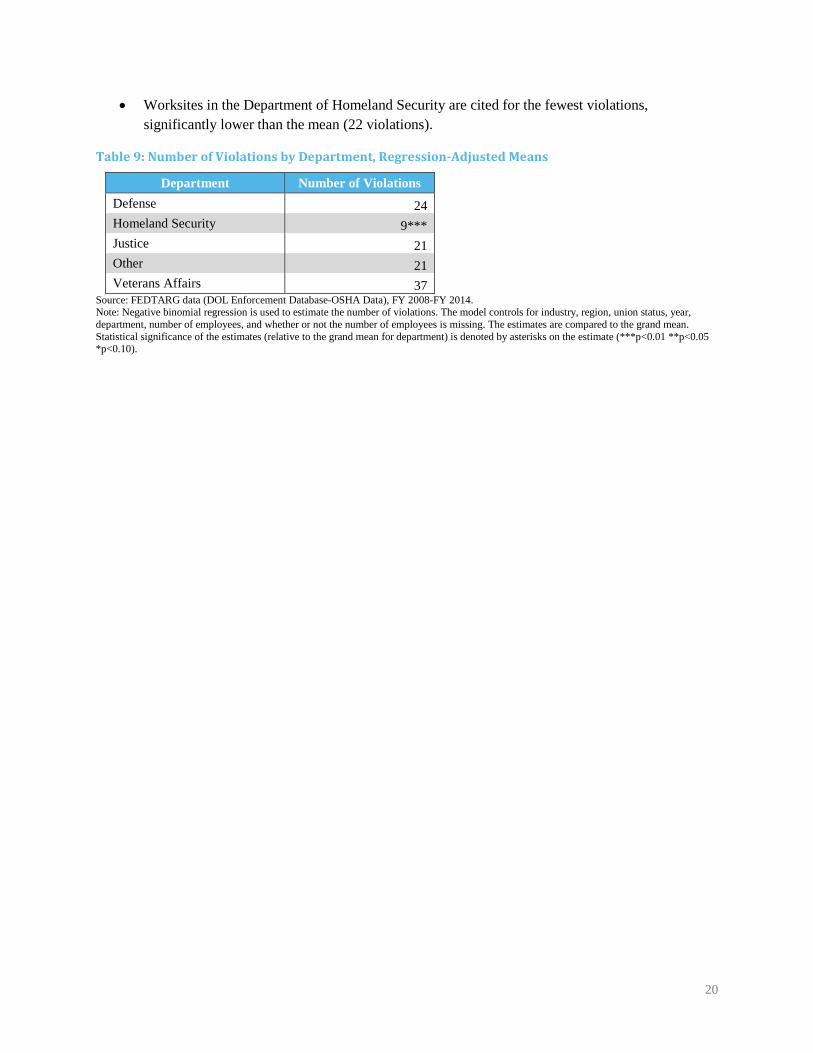
Table 9 presents the average number of violations per inspection by department.
29 It is possible that having a union representative accompany the inspector may result in a more thorough inspection. Perhaps the union representative can point out hazards that have been identified already. Further, the union may have formed specifically to mitigate unsafe working conditions. Understanding the relationship between union status and the number of violations requires further research.
Grand Mean: 28 violations
20
• Worksites in the Department of Homeland Security are cited for the fewest violations, significantly lower than the mean (22 violations).
Table 9: Number of Violations by Department, Regression-Adjusted Means
Department Number of Violations Defense 24 Homeland Security 9*** Justice 21 Other 21 Veterans Affairs 37
Source: FEDTARG data (DOL Enforcement Database-OSHA Data), FY 2008-FY 2014. Note: Negative binomial regression is used to estimate the number of violations. The model controls for industry, region, union status, year, department, number of employees, and whether or not the number of employees is missing. The estimates are compared to the grand mean. Statistical significance of the estimates (relative to the grand mean for department) is denoted by asterisks on the estimate (***p<0.01 **p<0.05 *p<0.10).
21
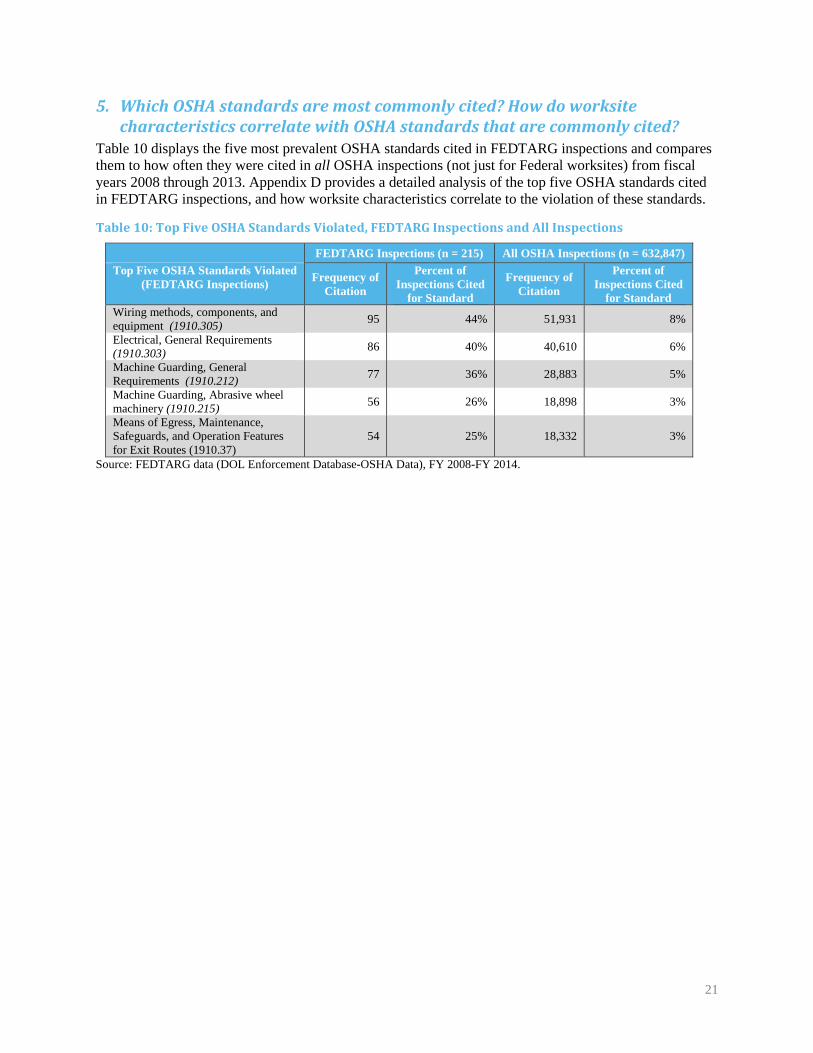
5. Which OSHA standards are most commonly cited? How do worksite characteristics correlate with OSHA standards that are commonly cited?
Table 10 displays the five most prevalent OSHA standards cited in FEDTARG inspections and compares them to how often they were cited in all OSHA inspections (not just for Federal worksites) from fiscal years 2008 through 2013. Appendix D provides a detailed analysis of the top five OSHA standards cited in FEDTARG inspections, and how worksite characteristics correlate to the violation of these standards.
Table 10: Top Five OSHA Standards Violated, FEDTARG Inspections and All Inspections
FEDTARG Inspections (n = 215) All OSHA Inspections (n = 632,847) Top Five OSHA Standards Violated
(FEDTARG Inspections) Frequency of Citation
Percent of Inspections Cited
for Standard
Frequency of Citation
Percent of Inspections Cited
for Standard Wiring methods, components, and equipment (1910.305) 95 44% 51,931 8%
Electrical, General Requirements (1910.303) 86 40% 40,610 6%
Machine Guarding, General Requirements (1910.212) 77 36% 28,883 5%
Machine Guarding, Abrasive wheel machinery (1910.215) 56 26% 18,898 3%
Means of Egress, Maintenance, Safeguards, and Operation Features for Exit Routes (1910.37)
54 25% 18,332 3%
Source: FEDTARG data (DOL Enforcement Database-OSHA Data), FY 2008-FY 2014.
22
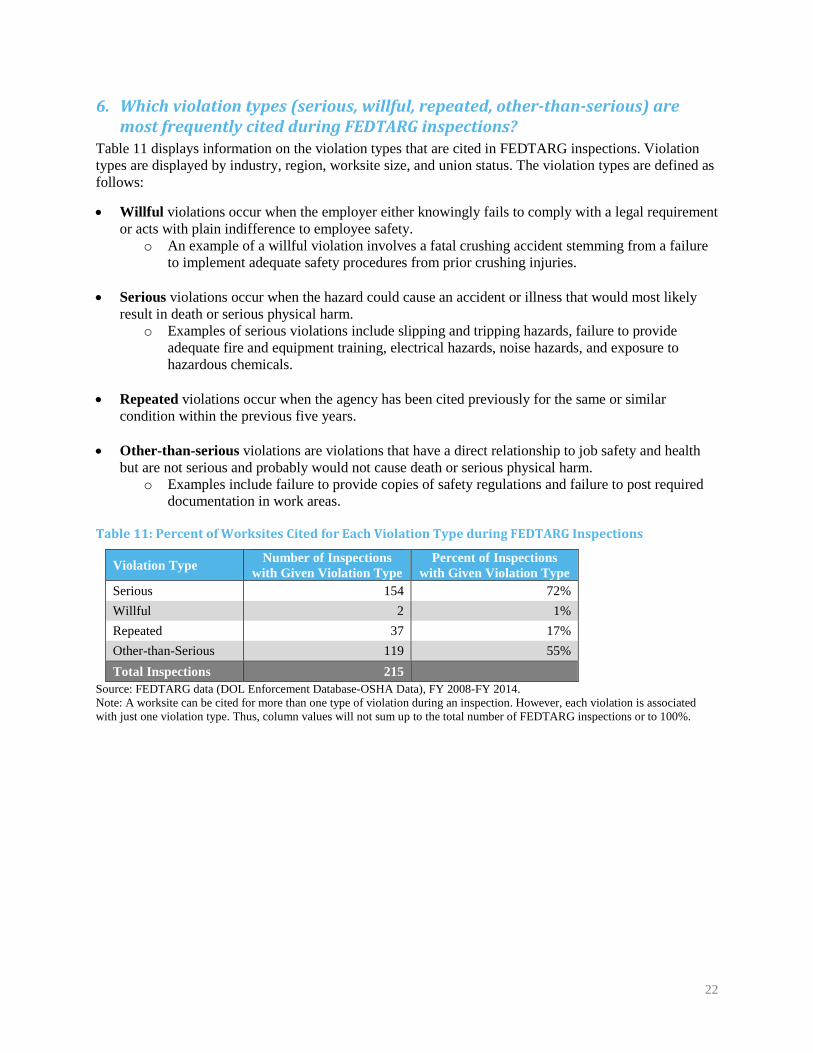
6. Which violation types (serious, willful, repeated, other-than-serious) are most frequently cited during FEDTARG inspections?
Table 11 displays information on the violation types that are cited in FEDTARG inspections. Violation types are displayed by industry, region, worksite size, and union status. The violation types are defined as follows:
• Willful violations occur when the employer either knowingly fails to comply with a legal requirement or acts with plain indifference to employee safety.
o An example of a willful violation involves a fatal crushing accident stemming from a failure to implement adequate safety procedures from prior crushing injuries.
• Serious violations occur when the hazard could cause an accident or illness that would most likely result in death or serious physical harm.
o Examples of serious violations include slipping and tripping hazards, failure to provide adequate fire and equipment training, electrical hazards, noise hazards, and exposure to hazardous chemicals.
• Repeated violations occur when the agency has been cited previously for the same or similar condition within the previous five years.
• Other-than-serious violations are violations that have a direct relationship to job safety and health but are not serious and probably would not cause death or serious physical harm.
o Examples include failure to provide copies of safety regulations and failure to post required documentation in work areas.
Table 11: Percent of Worksites Cited for Each Violation Type during FEDTARG Inspections
Violation Type Number of Inspections with Given Violation Type
Percent of Inspections with Given Violation Type
Serious 154 72% Willful 2 1% Repeated 37 17% Other-than-Serious 119 55% Total Inspections 215
Source: FEDTARG data (DOL Enforcement Database-OSHA Data), FY 2008-FY 2014. Note: A worksite can be cited for more than one type of violation during an inspection. However, each violation is associated with just one violation type. Thus, column values will not sum up to the total number of FEDTARG inspections or to 100%.

23
7. How do worksite characteristics correlate with violation types? Table 12 displays the regression-adjusted probabilities for each violation type. Each cell in the table indicates the probability of a given violation type, given certain worksite characteristics.
Serious Violations Worksites with the following characteristics are more likely to be cited for serious violations:
• Worksites in Regions 1 (Northeast) and 9 (Southwest) • Worksites with 3,617 to 20,000 employees (the largest worksites) • Worksites with 50-99 LTCs in the year prior to an inspection
Worksites with the following characteristics are less likely to be cited for serious violations:
• Worksites with 1 to 1,239 employees (the smallest worksites) • Worksites with 100+ LTCs in the year prior to an inspection
Repeated Violations Worksites with the following characteristics are more likely to be cited for repeated violations:
• Worksites in the Department of Veterans Affairs
Worksites with the following characteristics are less likely to be cited for repeated violations:
• Worksites in Region 6 (South Central)
Other-than-Serious Violations Worksites with the following characteristics are more likely to be cited for other-than-serious violations:
• Worksites in Regions 4 (Southeast) and 9 (Southwest) • Worksites in the Justice Department • Worksites with 20-49 LTCs in the year prior to the inspection
Worksites with the following characteristics are less likely to be cited for other-than-serious violations:
• Worksites in Regions 1 (Northeast) and 2 (North Atlantic) • Worksites with 50-99 LTCs in the year prior to the inspection

24
Table 12: Violation Type by Worksite Characteristics, Regression-Adjusted Means
Characteristics Serious Repeated Other-than-Serious Industry Mean=74% Mean=22% Mean=58% Public Administration 77% 23% 48% Health Care and Social Assistance 68% 16% 69% Other 77% 26% 58% Region Mean=72% Mean=19% Mean=54% Region 1 (Northeast) 90%** 25% 38%* Region 2 (North Atlantic) 60% 18% 39%* Region 3 (Mid Atlantic) 68% 19% 48% Region 4 (Southeast) 77% 27% 81%*** Region 5 (Midwest) 55% 25% 44% Region 6 (South Central) 67% 5%*** 39% Region 7 (Central) 79% 16% 54% Region 8 (North Central) 49% - 86% Region 9 (Southwest) 92%*** 14% 60%*** Region 10 (Northwest) 83% - 82% Worksite Size Mean=73% Mean=20% Mean=57% 1 to 1,239 (Quartile 1) 52%*** 21% 61% 1,240 to 2,358 (Quartile 2) 73% 19% 57% 2,359 to 3,616 (Quartile 3) 77% 17% 61% 3,617 to 20,000 (Quartile 4) 89%*** 21% 49% Union Rep Present No 66% 13% 55% Yes 77% 21% 57% Department Mean=73% Mean=16% Mean=59% Defense 72% 11% 51% Homeland Security 60% 14% 61% Justice 78% 8% 79%*** Other 67% 11% 52% Veterans Affairs 84% 33%** 53% LTC Groups Mean=72% Mean=20% Mean=55% 20-49 75% 19% 66%** 50-99 81%** 19% 41%*** 100+ 58%** 23% 57%
Source: FEDTARG data (DOL Enforcement Database-OSHA Data), FY 2008-FY 2014. Note: Logistic regression is used to estimate the probability of a worksite being cited for a given violation type. The model controls for industry, region, union status, year, department, number of employees, number of LTCs, and whether or not the number of employees is missing. The estimates for categorical variables with more than two possible outcomes are compared to the grand mean of the category. For yes/no binary variables, the “no” value is the reference category. Omitted values indicate that none of the worksites in the region were cited for that violation type. Statistical significance of the estimates (relative to the grand mean for categorical variables) is denoted by asterisks on the estimate (***p<0.01 **p<0.05 *p<0.10).
25
Outcomes of the FEDTARG Program This research question examines the relationship between FEDTARG inspections and LTCs. Summit analyzes LTC counts for inspected worksites in the year before and the year after an inspection. Before-and-after comparisons identify a relationship between, but not a causal effect of, FEDTARG inspections on LTCs. This regression-adjusted estimate identifies the average reduction in LTCs for after FEDTARG inspections, holding everything else equal.
We first summarize the major findings of the research question in this section, then we present the results. Appendix E provides further details about the methodology.
Summary of Findings FEDTARG inspections are associated with a reduction in LTCs in Federal worksites, and by extension, decreased injuries, illnesses, and costs. Regression equations estimate that Federal worksites inspected under FEDTARG have eight fewer LTCs in the year after an inspection than they had in the year before. The average number of LTCs for all worksites in the year before an inspection was 64, so an eight-LTC reduction represents a 13% reduction in LTCs.
The decrease in LTCs cannot be directly attributed to FEDTARG inspections because the data do not provide information on uninspected Federal worksites to construct a reliable control or comparison group. These results, however, are a promising indicator that the program is achieving some of its objectives. FEDTARG is associated with a reduction in workplace injuries and illnesses, controlling for worksite characteristics.
These findings, in combination with the findings in the Activities and Outputs sections, suggest that a) OSHA is targeting their efforts on worksites that are violating OSHA standards, and b) FEDTARG-inspected worksites exhibit better safety outcomes.
26
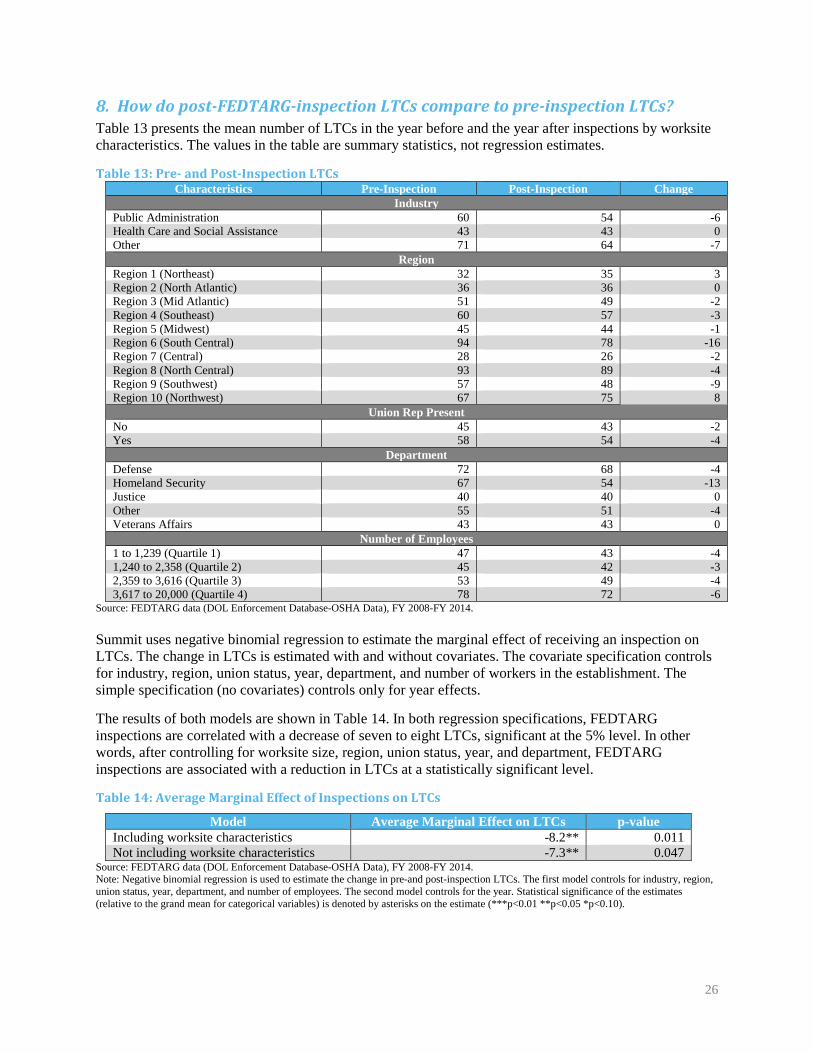
8. How do post-FEDTARG-inspection LTCs compare to pre-inspection LTCs? Table 13 presents the mean number of LTCs in the year before and the year after inspections by worksite characteristics. The values in the table are summary statistics, not regression estimates.
Table 13: Pre- and Post-Inspection LTCs Characteristics Pre-Inspection Post-Inspection Change
Industry Public Administration 60 54 -6 Health Care and Social Assistance 43 43 0 Other 71 64 -7
Region Region 1 (Northeast) 32 35 3 Region 2 (North Atlantic) 36 36 0 Region 3 (Mid Atlantic) 51 49 -2 Region 4 (Southeast) 60 57 -3 Region 5 (Midwest) 45 44 -1 Region 6 (South Central) 94 78 -16 Region 7 (Central) 28 26 -2 Region 8 (North Central) 93 89 -4 Region 9 (Southwest) 57 48 -9 Region 10 (Northwest) 67 75 8
Union Rep Present No 45 43 -2 Yes 58 54 -4
Department Defense 72 68 -4 Homeland Security 67 54 -13 Justice 40 40 0 Other 55 51 -4 Veterans Affairs 43 43 0
Number of Employees 1 to 1,239 (Quartile 1) 47 43 -4 1,240 to 2,358 (Quartile 2) 45 42 -3 2,359 to 3,616 (Quartile 3) 53 49 -4 3,617 to 20,000 (Quartile 4) 78 72 -6
Source: FEDTARG data (DOL Enforcement Database-OSHA Data), FY 2008-FY 2014. Summit uses negative binomial regression to estimate the marginal effect of receiving an inspection on LTCs. The change in LTCs is estimated with and without covariates. The covariate specification controls for industry, region, union status, year, department, and number of workers in the establishment. The simple specification (no covariates) controls only for year effects.
The results of both models are shown in Table 14. In both regression specifications, FEDTARG inspections are correlated with a decrease of seven to eight LTCs, significant at the 5% level. In other words, after controlling for worksite size, region, union status, year, and department, FEDTARG inspections are associated with a reduction in LTCs at a statistically significant level.
Table 14: Average Marginal Effect of Inspections on LTCs
Model Average Marginal Effect on LTCs p-value Including worksite characteristics -8.2** 0.011 Not including worksite characteristics -7.3** 0.047
Source: FEDTARG data (DOL Enforcement Database-OSHA Data), FY 2008-FY 2014. Note: Negative binomial regression is used to estimate the change in pre-and post-inspection LTCs. The first model controls for industry, region, union status, year, department, and number of employees. The second model controls for the year. Statistical significance of the estimates (relative to the grand mean for categorical variables) is denoted by asterisks on the estimate (***p<0.01 **p<0.05 *p<0.10).
27
VI. CONCLUSIONS AND EXTENSIONS This descriptive study, the first to investigate the FEDTARG program, presents findings on the types of worksites inspected, the results of the inspections, and the relationship between FEDTARG inspections and LTCs. The results cannot be interpreted as the causal effects of FEDTARG inspections, but are a promising indicator that the program is achieving some of its objectives. The most important finding of the study is that FEDTARG inspections are associated with a decrease in LTCs after an inspection. This result indicates that OSHA’s inspections may be having an impact on the number of injuries and illnesses at Federal worksites and their associated costs.
The activities and outputs of FEDTARG demonstrate that OSHA is targeting their efforts on worksites that are indeed violating OSHA standards. 72% of the worksites inspected were cited for a serious violation. Only 18% of inspections uncovered no violations. This suggests that targeting efforts are effective.
We also found that worksites where union representatives accompany inspectors are cited for more than twice as many violations as worksites without union accompaniment. This may be because unionized worksites are generally more dangerous or because inspectors are more thorough when they are accompanied by union representatives. The program and future research may wish to explore the benefit of having a worksite representative, union or otherwise, accompany all FEDTARG inspections.
This study provides a baseline for the first phase of the FEDTARG program. The randomization element of the targeting, coupled with increasing sample size over time, may allow researchers to estimate comprehensive causal impacts in a future FEDTARG study.

28
VII. WORKS CITED Boden, Leslie, and Al Ozonoff. "Reporting Works' Compensation Injuries in California: How Many Are Missed?" August 2008.
“FY 14 Congressional Budget Justification, Occupational Safety and Health Administration.” http://www.dol.gov/dol/budget/2014/PDF/CBJ-2014-V2-12.pdf.
Occupational Safety and Health Administration [OSHA]. Aug. 5, 2013. Regulations (Standards-29 CFR-1960.72). Retrieved from https://www.osha.gov/pls/oshaweb/owadisp.show_document?p_table=STANDARDS&p_id=11306.
"OSHA Could Improve Federal Agencies' Safety Programs with a More Strategic Approach to Its Oversight." United States Government Accountability Office, Apr. 2006.
Ruser, John. “Examining evidence on whether BLS undercounts workplace injuries and illnesses”, Monthly Labor Review, August 2008.

29
Definitions Term Definition
Area Office (AO) OSHA carries its enforcement actions out through its regional and area offices. Within each of OSHA’s 10 regional offices, there are multiple area offices. There are 90 area offices. Area offices implement the inspections.
Chargeback Code (CBC) Chargeback codes are four-digit codes that identify agencies. Some departments have distinct chargeback codes for each worksite, while others use one code for all worksites.
Department
The department of each establishment is defined using the chargeback code provided in the FECA data. In order to avoid small sample sizes, departments other than Defense, Homeland Security, Justice, and Veteran Affairs were aggregated into an “Other departments” category for this study.
Eligible for Inspection
Establishments that are eligible for inspections have the following characteristics: -Executive departments (as identified in U.S. Code Title 5, Par 1, Chapter 1, §101). -Establishments that reported 20 or more lost time cases in the prior fiscal year -Establishments that were not inspected within 24 months of the effective date of the FEDTARG directive -Establishments that were not participating in Voluntary Protection Programs
Industry
Industry is defined using the first two digits of the NAICS codes provided in the inspection data. The three categories used in the analysis were: public administration; health care and social assistance; and other. The other category contains various industries that had small sample sizes.
Lost-Time Cases (LTCs) A lost time case occurs whenever an individual misses work due to an occupational injury or illness beyond the date of the injury. This is recorded as an indicator variable and does not provide information on how many days of work were missed.
Number of Workers During inspections, inspectors record the number of employees in the establishment.
OSHA FEDTARG Inspection List Data
The FEDTARG inspection lists are generated using the LTC counts for each chargeback code/zip code combination. The lists specify which worksites will be inspected for that FEDTARG program year. The OSHA national office staff distribute the lists to the regional offices so that inspections can take place.
OSHA Inspections Results Data
The results of OSHA inspections come from data downloaded from DOL Enforcement Data website. The data include establishment information, inspection details, and violation details.
OSHA Region There are 10 regions, as defined by OSHA. The OSHA regional office directory, which indicates which states are included in each region, can be found here: https://www.osha.gov/oshdir/region.htm
OSHA Standard
OSHA standards require conditions, or the adoption or use of one or more practices, means, methods, operations, or processes, reasonably necessary or appropriate to provide safe or healthful employment and places of employment. During inspections, inspectors cite establishments for violations of these standards.
Other-than-Serious Violation
Inspectors code violations as other-than-serious when violations have a direct relationship to job safety and health but are not serious and probably would not cause death or serious physical harm.
FECA Case Management File (CMF)
The FECA Case Management File contains workers’ compensation claims filed by Federal employees who were injured or exposed to a disease at work.
Primary Inspection List
The primary inspection list is generated using the FECA data. Each regional primary inspection list includes: 100% of the establishments within the region’s jurisdiction reporting 100+ LTCs, 50% of the establishments reporting 50-99 LTCs and 10% of the establishments reporting 20-49 LTCs.
30
Term Definition
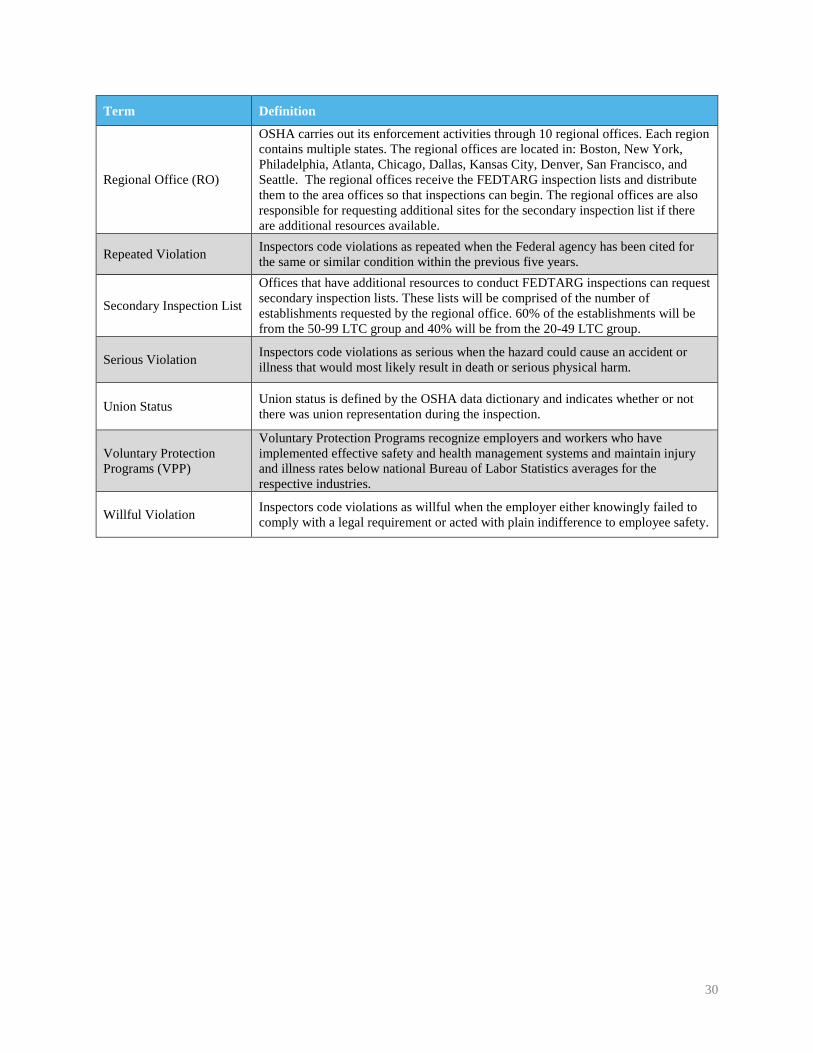
Regional Office (RO)
OSHA carries out its enforcement activities through 10 regional offices. Each region contains multiple states. The regional offices are located in: Boston, New York, Philadelphia, Atlanta, Chicago, Dallas, Kansas City, Denver, San Francisco, and Seattle. The regional offices receive the FEDTARG inspection lists and distribute them to the area offices so that inspections can begin. The regional offices are also responsible for requesting additional sites for the secondary inspection list if there are additional resources available.
Repeated Violation Inspectors code violations as repeated when the Federal agency has been cited for the same or similar condition within the previous five years.
Secondary Inspection List
Offices that have additional resources to conduct FEDTARG inspections can request secondary inspection lists. These lists will be comprised of the number of establishments requested by the regional office. 60% of the establishments will be from the 50-99 LTC group and 40% will be from the 20-49 LTC group.
Serious Violation Inspectors code violations as serious when the hazard could cause an accident or illness that would most likely result in death or serious physical harm.
Union Status Union status is defined by the OSHA data dictionary and indicates whether or not there was union representation during the inspection.
Voluntary Protection Programs (VPP)
Voluntary Protection Programs recognize employers and workers who have implemented effective safety and health management systems and maintain injury and illness rates below national Bureau of Labor Statistics averages for the respective industries.
Willful Violation Inspectors code violations as willful when the employer either knowingly failed to comply with a legal requirement or acted with plain indifference to employee safety.
31
Data Data from multiple sources are used to answer the research questions for this study. The FEDTARG process begins with the claims data that OWCP collects. Next, OSHA compiles the list of sites that are eligible for FEDTARG inspections and randomizes to select the sites that it will inspect. Sites that receive inspections have corresponding OSHA inspections results data, including the number and types of violations and the corresponding OSHA standards that inspectors cited.
Summit uses three data sets in this analysis:
• OWCP Case Management File Extracts (Claimant Data) • OSHA FEDTARG inspections lists • OSHA inspections data
FECA Claims Data OWCP provides the FECA claims data to OSHA each fiscal year. The datasets are the 4th quarter data, which contain all claims within each fiscal year, for FY 2008 to FY 2013.
The data contain the agency where the claim was filed, identified by a 4-digit chargeback code, and the location, identified by the zip code where the incident took place. For each agency and zip code combination, LTC counts are generated using the extent of injury field in the data, which indicates whether there was lost time in the case.
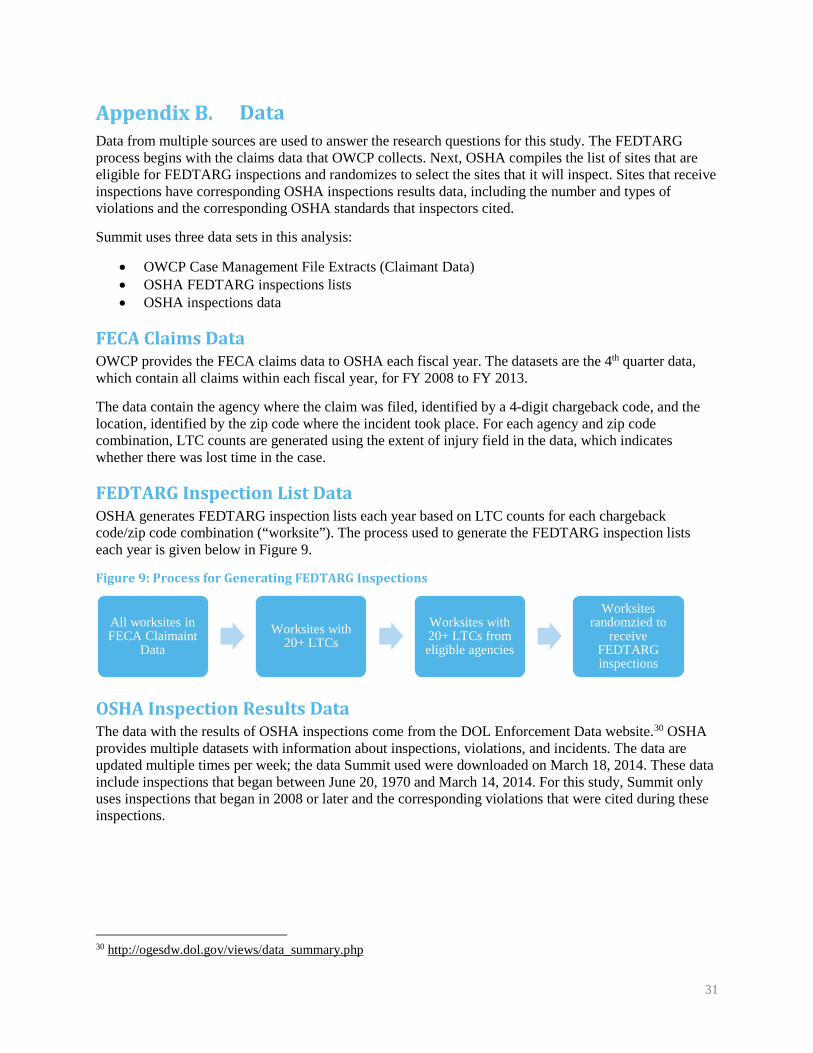
FEDTARG Inspection List Data OSHA generates FEDTARG inspection lists each year based on LTC counts for each chargeback code/zip code combination (“worksite”). The process used to generate the FEDTARG inspection lists each year is given below in Figure 9.
Figure 9: Process for Generating FEDTARG Inspections
OSHA Inspection Results Data The data with the results of OSHA inspections come from the DOL Enforcement Data website.30 OSHA provides multiple datasets with information about inspections, violations, and incidents. The data are updated multiple times per week; the data Summit used were downloaded on March 18, 2014. These data include inspections that began between June 20, 1970 and March 14, 2014. For this study, Summit only uses inspections that began in 2008 or later and the corresponding violations that were cited during these inspections.
30 http://ogesdw.dol.gov/views/data_summary.php
All worksites in FECA Claimaint
DataWorksites with
20+ LTCsWorksites with 20+ LTCs from eligible agencies
Worksites randomzied to
receive FEDTARG inspections

32
Linking Datasets The three datasets mentioned in the previous section are merged for this study. This dataset included the sites that are inspected, the characteristics of inspected sites, the number and types of violations received at each site, and the number and types of FECA claims made before and after the inspection took place.
A visual representation of how the datasets were linked is shown in Figure 10.
Figure 10: Data Linking Processes
The FEDTARG inspection lists are linked to the inspections data to determine which sites were inspected and what their outcomes were (number and types of violations, OSHA standards cited, etc.). The inspections data also provide site characteristics, such as the number of workers in the establishment and union status.
The zip code and FEDTARG year are used to link these two datasets. Some sites that are inspected through the FEDTARG program are missing the FEDTARG indicator due to coding errors. In order to match these cases, Summit uses a proxy FEDTARG flag. This flags each Federal worksite with a FEDTARG indicator corresponding to the fiscal year in which the inspection took place. The datasets are linked using both the FEDTARG indicator in the data and the proxy indicator. Summit examines the matches, using the site address, establishment name, and other relevant variables to determine where mismatches occur. Summit also uses the type and scope of the inspections to ensure that only comprehensive inspections are included.
Summit links the FECA data from all of the available years to the inspection lists and inspections data in order to determine post-inspection injury and illness rates at a given site. Inspections lists are linked to the inspections data and contain chargeback codes and zip codes for each observation. Inspections are linked to the FECA claims data using these fields.
Data Limitations There are important data limitations in this study. This section provides a brief overview of these limitations.
FECA Claims Data
Contains claims from all Federal employees for
each fiscal year
CBCZip
Fiscal Year
FEDTARG Inspection Lists
Contains establishments selected for inspection
CBCZip
Establishment NameFEDTARG Year
Site Address
OSHA Inspections Data
Contains inspection and violation details
ZipEstablishment Name
FEDTARG YearSite Address
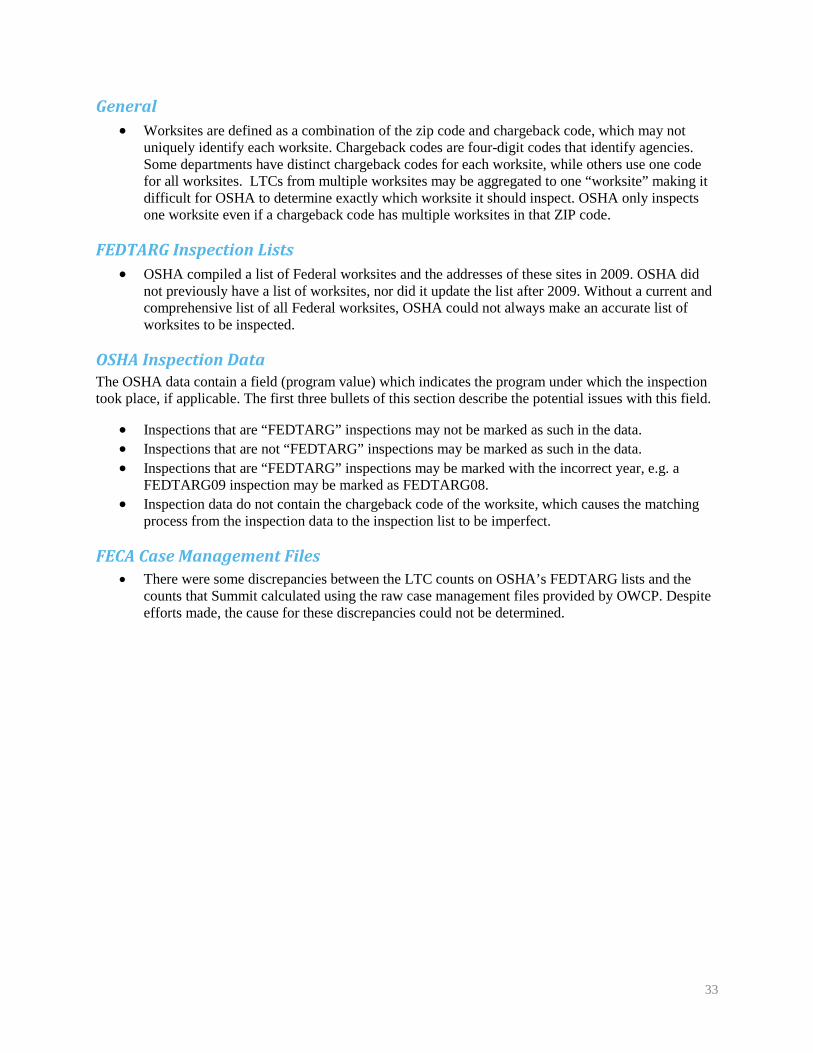
33
General • Worksites are defined as a combination of the zip code and chargeback code, which may not
uniquely identify each worksite. Chargeback codes are four-digit codes that identify agencies. Some departments have distinct chargeback codes for each worksite, while others use one code for all worksites. LTCs from multiple worksites may be aggregated to one “worksite” making it difficult for OSHA to determine exactly which worksite it should inspect. OSHA only inspects one worksite even if a chargeback code has multiple worksites in that ZIP code.
FEDTARG Inspection Lists • OSHA compiled a list of Federal worksites and the addresses of these sites in 2009. OSHA did
not previously have a list of worksites, nor did it update the list after 2009. Without a current and comprehensive list of all Federal worksites, OSHA could not always make an accurate list of worksites to be inspected.
OSHA Inspection Data The OSHA data contain a field (program value) which indicates the program under which the inspection took place, if applicable. The first three bullets of this section describe the potential issues with this field.
• Inspections that are “FEDTARG” inspections may not be marked as such in the data. • Inspections that are not “FEDTARG” inspections may be marked as such in the data. • Inspections that are “FEDTARG” inspections may be marked with the incorrect year, e.g. a
FEDTARG09 inspection may be marked as FEDTARG08. • Inspection data do not contain the chargeback code of the worksite, which causes the matching
process from the inspection data to the inspection list to be imperfect.
FECA Case Management Files • There were some discrepancies between the LTC counts on OSHA’s FEDTARG lists and the
counts that Summit calculated using the raw case management files provided by OWCP. Despite efforts made, the cause for these discrepancies could not be determined.
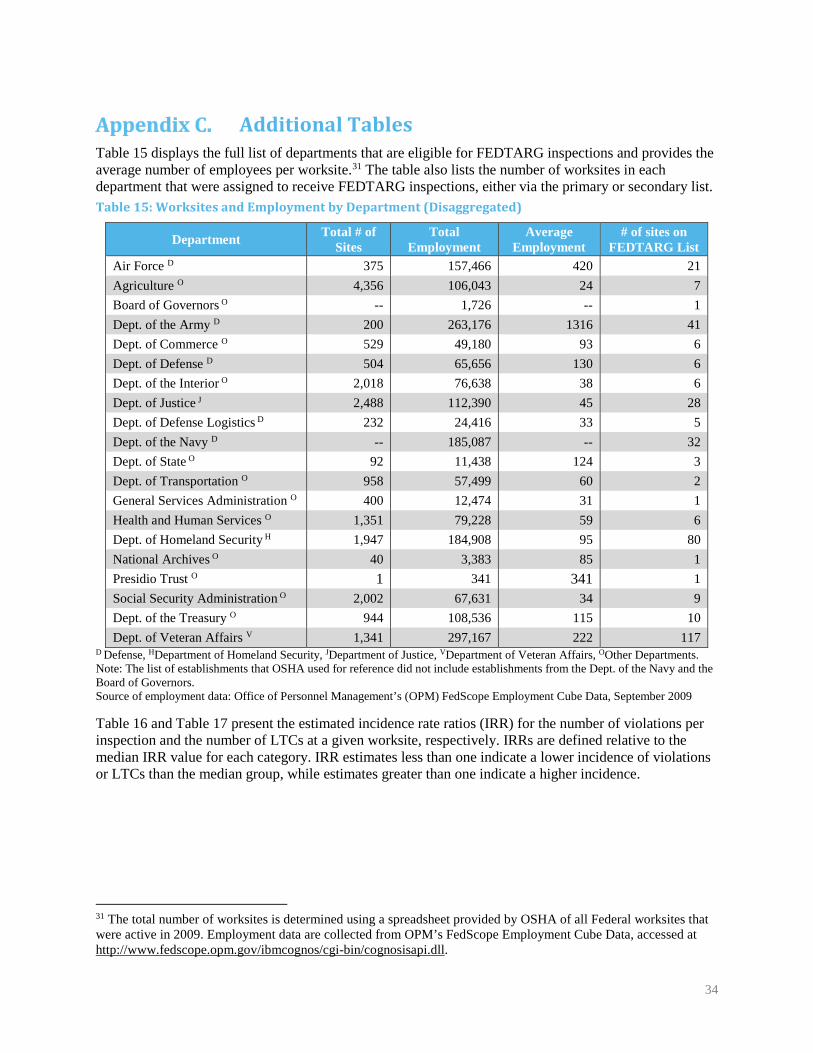
34
Additional Tables Table 15 displays the full list of departments that are eligible for FEDTARG inspections and provides the average number of employees per worksite.31 The table also lists the number of worksites in each department that were assigned to receive FEDTARG inspections, either via the primary or secondary list. Table 15: Worksites and Employment by Department (Disaggregated)
Department Total # of Sites
Total Employment
Average Employment
# of sites on FEDTARG List
Air Force D 375 157,466 420 21 Agriculture O 4,356 106,043 24 7 Board of Governors O -- 1,726 -- 1 Dept. of the Army D 200 263,176 1316 41 Dept. of Commerce O 529 49,180 93 6 Dept. of Defense D 504 65,656 130 6 Dept. of the Interior O 2,018 76,638 38 6 Dept. of Justice J 2,488 112,390 45 28 Dept. of Defense Logistics D 232 24,416 33 5 Dept. of the Navy D -- 185,087 -- 32 Dept. of State O 92 11,438 124 3 Dept. of Transportation O 958 57,499 60 2 General Services Administration O 400 12,474 31 1 Health and Human Services O 1,351 79,228 59 6 Dept. of Homeland Security H 1,947 184,908 95 80 National Archives O 40 3,383 85 1 Presidio Trust O 1 341 341 1 Social Security Administration O 2,002 67,631 34 9 Dept. of the Treasury O 944 108,536 115 10 Dept. of Veteran Affairs V 1,341 297,167 222 117
D Defense, HDepartment of Homeland Security, JDepartment of Justice, VDepartment of Veteran Affairs, OOther Departments. Note: The list of establishments that OSHA used for reference did not include establishments from the Dept. of the Navy and the Board of Governors. Source of employment data: Office of Personnel Management’s (OPM) FedScope Employment Cube Data, September 2009
Table 16 and Table 17 present the estimated incidence rate ratios (IRR) for the number of violations per inspection and the number of LTCs at a given worksite, respectively. IRRs are defined relative to the median IRR value for each category. IRR estimates less than one indicate a lower incidence of violations or LTCs than the median group, while estimates greater than one indicate a higher incidence.
31 The total number of worksites is determined using a spreadsheet provided by OSHA of all Federal worksites that were active in 2009. Employment data are collected from OPM’s FedScope Employment Cube Data, accessed at http://www.fedscope.opm.gov/ibmcognos/cgi-bin/cognosisapi.dll.
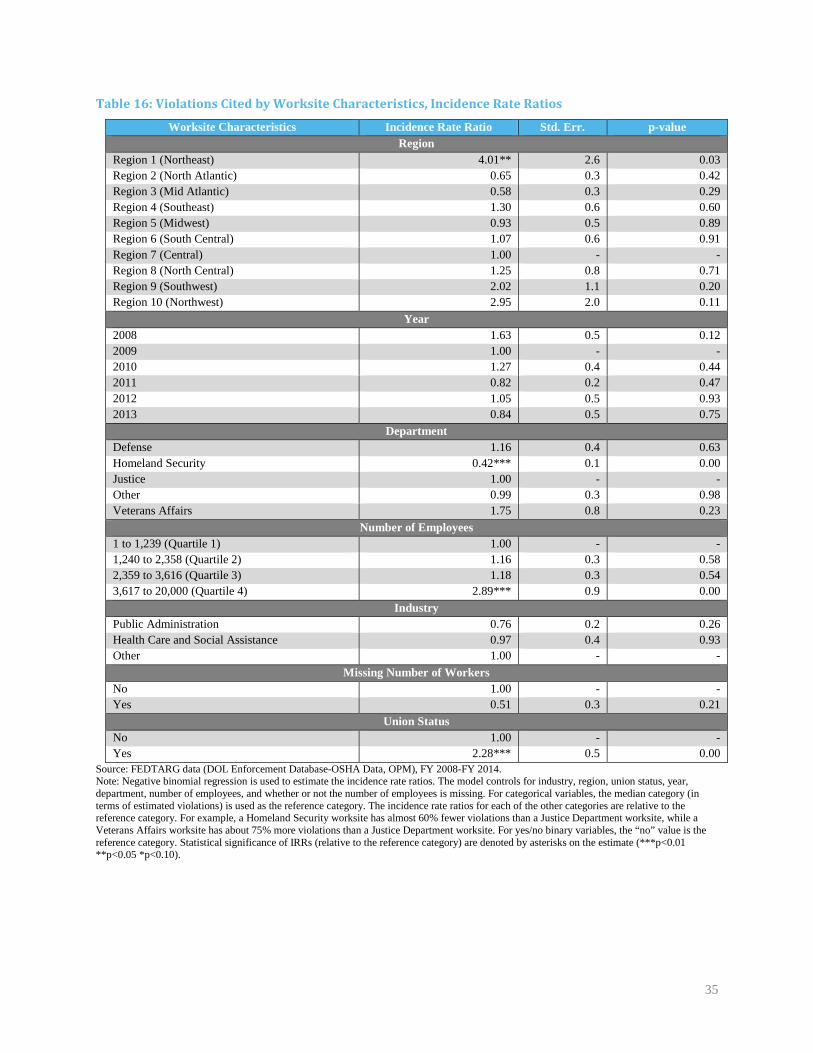
35
Table 16: Violations Cited by Worksite Characteristics, Incidence Rate Ratios
Worksite Characteristics Incidence Rate Ratio Std. Err. p-value Region
Region 1 (Northeast) 4.01** 2.6 0.03 Region 2 (North Atlantic) 0.65 0.3 0.42 Region 3 (Mid Atlantic) 0.58 0.3 0.29 Region 4 (Southeast) 1.30 0.6 0.60 Region 5 (Midwest) 0.93 0.5 0.89 Region 6 (South Central) 1.07 0.6 0.91 Region 7 (Central) 1.00 - - Region 8 (North Central) 1.25 0.8 0.71 Region 9 (Southwest) 2.02 1.1 0.20 Region 10 (Northwest) 2.95 2.0 0.11
Year 2008 1.63 0.5 0.12 2009 1.00 - - 2010 1.27 0.4 0.44 2011 0.82 0.2 0.47 2012 1.05 0.5 0.93 2013 0.84 0.5 0.75
Department Defense 1.16 0.4 0.63 Homeland Security 0.42*** 0.1 0.00 Justice 1.00 - - Other 0.99 0.3 0.98 Veterans Affairs 1.75 0.8 0.23
Number of Employees 1 to 1,239 (Quartile 1) 1.00 - - 1,240 to 2,358 (Quartile 2) 1.16 0.3 0.58 2,359 to 3,616 (Quartile 3) 1.18 0.3 0.54 3,617 to 20,000 (Quartile 4) 2.89*** 0.9 0.00
Industry Public Administration 0.76 0.2 0.26 Health Care and Social Assistance 0.97 0.4 0.93 Other 1.00 - -
Missing Number of Workers No 1.00 - - Yes 0.51 0.3 0.21
Union Status No 1.00 - - Yes 2.28*** 0.5 0.00
Source: FEDTARG data (DOL Enforcement Database-OSHA Data, OPM), FY 2008-FY 2014. Note: Negative binomial regression is used to estimate the incidence rate ratios. The model controls for industry, region, union status, year, department, number of employees, and whether or not the number of employees is missing. For categorical variables, the median category (in terms of estimated violations) is used as the reference category. The incidence rate ratios for each of the other categories are relative to the reference category. For example, a Homeland Security worksite has almost 60% fewer violations than a Justice Department worksite, while a Veterans Affairs worksite has about 75% more violations than a Justice Department worksite. For yes/no binary variables, the “no” value is the reference category. Statistical significance of IRRs (relative to the reference category) are denoted by asterisks on the estimate (***p<0.01 **p<0.05 *p<0.10).
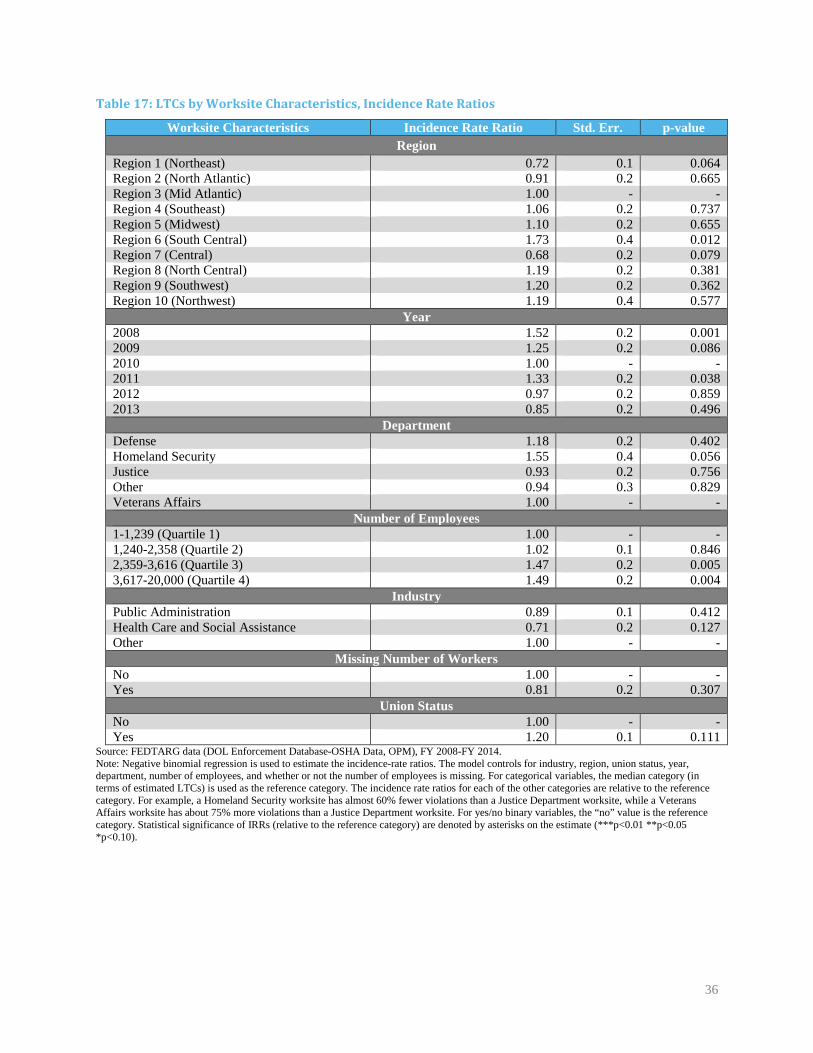
36
Table 17: LTCs by Worksite Characteristics, Incidence Rate Ratios
Worksite Characteristics Incidence Rate Ratio Std. Err. p-value Region
Region 1 (Northeast) 0.72 0.1 0.064 Region 2 (North Atlantic) 0.91 0.2 0.665 Region 3 (Mid Atlantic) 1.00 - - Region 4 (Southeast) 1.06 0.2 0.737 Region 5 (Midwest) 1.10 0.2 0.655 Region 6 (South Central) 1.73 0.4 0.012 Region 7 (Central) 0.68 0.2 0.079 Region 8 (North Central) 1.19 0.2 0.381 Region 9 (Southwest) 1.20 0.2 0.362 Region 10 (Northwest) 1.19 0.4 0.577
Year 2008 1.52 0.2 0.001 2009 1.25 0.2 0.086 2010 1.00 - - 2011 1.33 0.2 0.038 2012 0.97 0.2 0.859 2013 0.85 0.2 0.496
Department Defense 1.18 0.2 0.402 Homeland Security 1.55 0.4 0.056 Justice 0.93 0.2 0.756 Other 0.94 0.3 0.829 Veterans Affairs 1.00 - -
Number of Employees 1-1,239 (Quartile 1) 1.00 - - 1,240-2,358 (Quartile 2) 1.02 0.1 0.846 2,359-3,616 (Quartile 3) 1.47 0.2 0.005 3,617-20,000 (Quartile 4) 1.49 0.2 0.004
Industry Public Administration 0.89 0.1 0.412 Health Care and Social Assistance 0.71 0.2 0.127 Other 1.00 - -
Missing Number of Workers No 1.00 - - Yes 0.81 0.2 0.307
Union Status No 1.00 - - Yes 1.20 0.1 0.111
Source: FEDTARG data (DOL Enforcement Database-OSHA Data, OPM), FY 2008-FY 2014. Note: Negative binomial regression is used to estimate the incidence-rate ratios. The model controls for industry, region, union status, year, department, number of employees, and whether or not the number of employees is missing. For categorical variables, the median category (in terms of estimated LTCs) is used as the reference category. The incidence rate ratios for each of the other categories are relative to the reference category. For example, a Homeland Security worksite has almost 60% fewer violations than a Justice Department worksite, while a Veterans Affairs worksite has about 75% more violations than a Justice Department worksite. For yes/no binary variables, the “no” value is the reference category. Statistical significance of IRRs (relative to the reference category) are denoted by asterisks on the estimate (***p<0.01 **p<0.05 *p<0.10).
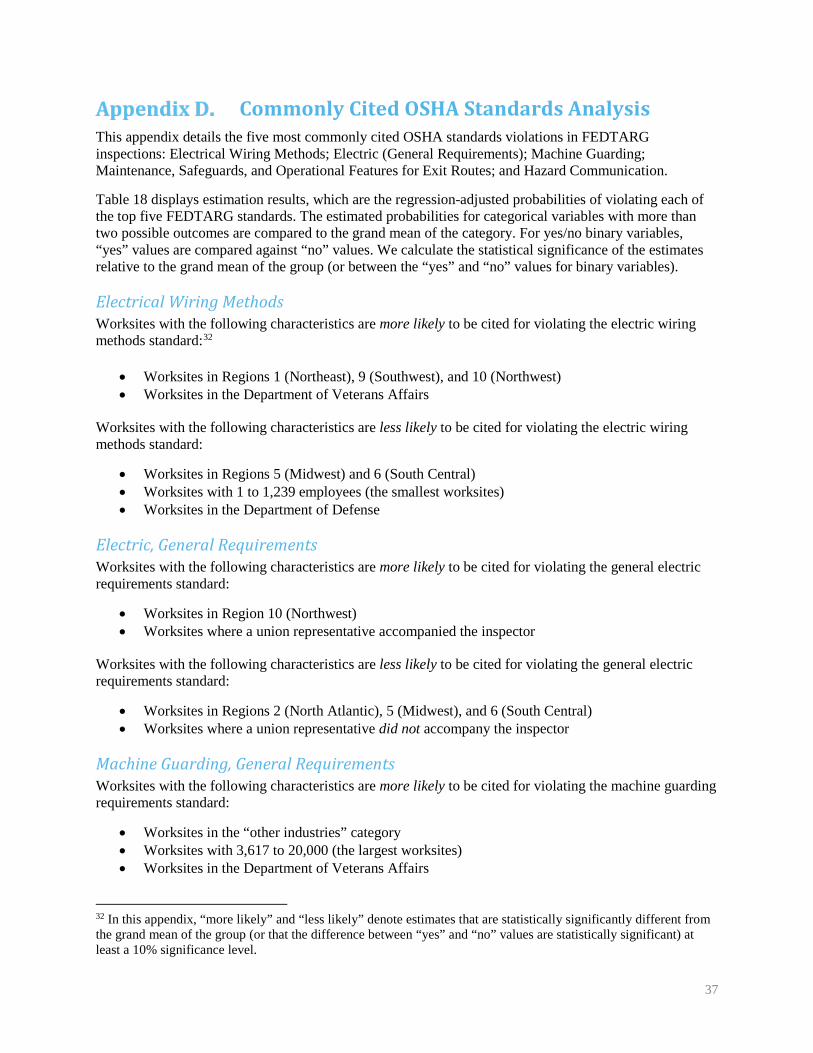
37
Commonly Cited OSHA Standards Analysis This appendix details the five most commonly cited OSHA standards violations in FEDTARG inspections: Electrical Wiring Methods; Electric (General Requirements); Machine Guarding; Maintenance, Safeguards, and Operational Features for Exit Routes; and Hazard Communication.
Table 18 displays estimation results, which are the regression-adjusted probabilities of violating each of the top five FEDTARG standards. The estimated probabilities for categorical variables with more than two possible outcomes are compared to the grand mean of the category. For yes/no binary variables, “yes” values are compared against “no” values. We calculate the statistical significance of the estimates relative to the grand mean of the group (or between the “yes” and “no” values for binary variables).
Electrical Wiring Methods Worksites with the following characteristics are more likely to be cited for violating the electric wiring methods standard:32
• Worksites in Regions 1 (Northeast), 9 (Southwest), and 10 (Northwest) • Worksites in the Department of Veterans Affairs
Worksites with the following characteristics are less likely to be cited for violating the electric wiring methods standard:
• Worksites in Regions 5 (Midwest) and 6 (South Central) • Worksites with 1 to 1,239 employees (the smallest worksites) • Worksites in the Department of Defense
Electric, General Requirements Worksites with the following characteristics are more likely to be cited for violating the general electric requirements standard:
• Worksites in Region 10 (Northwest) • Worksites where a union representative accompanied the inspector
Worksites with the following characteristics are less likely to be cited for violating the general electric requirements standard:
• Worksites in Regions 2 (North Atlantic), 5 (Midwest), and 6 (South Central) • Worksites where a union representative did not accompany the inspector
Machine Guarding, General Requirements Worksites with the following characteristics are more likely to be cited for violating the machine guarding requirements standard:
• Worksites in the “other industries” category • Worksites with 3,617 to 20,000 (the largest worksites) • Worksites in the Department of Veterans Affairs
32 In this appendix, “more likely” and “less likely” denote estimates that are statistically significantly different from the grand mean of the group (or that the difference between “yes” and “no” values are statistically significant) at least a 10% significance level.

38
Worksites with the following characteristics are less likely to be cited for violating the machine guarding requirements standard:
• Worksites in Regions 2 (North Atlantic) and 6 (South Central) • Worksites with 1 to 1,239 employees (the smallest worksites) • Worksites in the “other departments” category
Machine Guarding, Abrasive Wheel Machinery Worksites with the following characteristics are more likely to be cited for violating the abrasive wheel machinery requirements standard:
• Worksites in Region 4 (Southeast) • Worksites where a union representative accompanied the inspector
Worksites with the following characteristics are less likely to be cited for violating the abrasive wheel machinery requirements standard:
• Worksites 1 to 1,239 employees (the smallest worksites) • Worksites where a union representative did not accompany the inspector
Means of Egress, Maintenance, Safeguards, and Operation Features for Exit Routes Worksites with the following characteristics are more likely to be cited for violating the exit routes requirements standard:
• Worksites in Region 7 (Central)
Worksites with the following characteristics are less likely to be cited for violating the exit routes requirements standard:
• Worksites in the Public Administration industry • Worksites in Regions 5 (Midwest) and 6 (South Central)

39
Table 18: Probability of Violating the Top Five FEDTARG Standards, Regression-Adjusted Means
Characteristics Electrical
Wiring Methods
Electrical, General
Requirements
Machine Guarding
Machine Guarding, Abrasive
wheel machinery
Means of Egress,
Maintenance, Safeguards,
and Operation
Features for Exit Routes
Industry Mean=48% Mean=45% Mean=41% Mean=27% Mean=28% Public Administration 47% 37% 38% 28% 17%* Health Care and Social Assistance 40% 46% 31% 28% 40% Other 56% 52% 54%** 26% 27% Region Mean=47% Mean=46% Mean=37% Mean=24% Mean=29% Region 1 (Northeast) 75%** 60% 45% 15% 38% Region 2 (North Atlantic) 36% 14%*** 20%* 17% 23% Region 3 (Mid Atlantic) 40% 41% 34% 30% 20% Region 4 (Southeast) 52% 59%* 37% 41%** 33% Region 5 (Midwest) 30%** 26%*** 47% 16% 13%** Region 6 (South Central) 25%** 20%*** 22%* 13% 14%* Region 7 (Central) 43% 62% 32% 15% 60%** Region 8 (North Central) 24% - 37% - - Region 9 (Southwest) 63%** 52% 49% 32% 36% Region 10 (Northwest) 78%*** 76%** 47% 41% 22% Worksite Size Mean=46% Mean=42% Mean=37% Mean=27% Mean=27% 1-1,239 (Quartile 1) 35%* 35% 25%* 18%* 25% 1,240-2,358 (Quartile 2) 52% 47% 40% 34% 23% 2,359-3,616 (Quartile 3) 41% 41% 32% 24% 28% 3,617-20,000 (Quartile 4) 56% 46% 52%** 33% 30% Union Status Mean=43% Mean=33% Mean=36% Mean=23% Mean=24% No 39% 17%*** 35% 16%* 20% Yes 47% 48% 37% 30% 28% Department Mean=44% Mean=43% Mean=33% Mean=25% Mean=27% Defense 33%* 36% 33% 34% 30% Homeland Security 33% 33% 29% 21% 27% Justice 55% 52% 36% 19% 17% Other 36% 48% 18%** 20% 35% Veterans Affairs 61%* 47% 50%* 30% 24%
Source: FEDTARG data (DOL Enforcement Database-OSHA Data), FY 2008-FY 2014. Note: Logistic regression is used to estimate the probability of a worksite violating a certain standard. The model controls for industry, region, union status, year, department, number of employees, and whether or not the number of employees is missing. The estimates for categorical variables with more than two possible outcomes are compared to the grand mean of the category. For yes/no binary variables, the “no” value is the reference category. Omitted values indicate that none of the worksites in the region violated the given OSHA standard. Statistical significance of the estimates (relative to the grand mean for categorical variables) is denoted by asterisks on the estimate (***p<0.01 **p<0.05 *p<0.10).
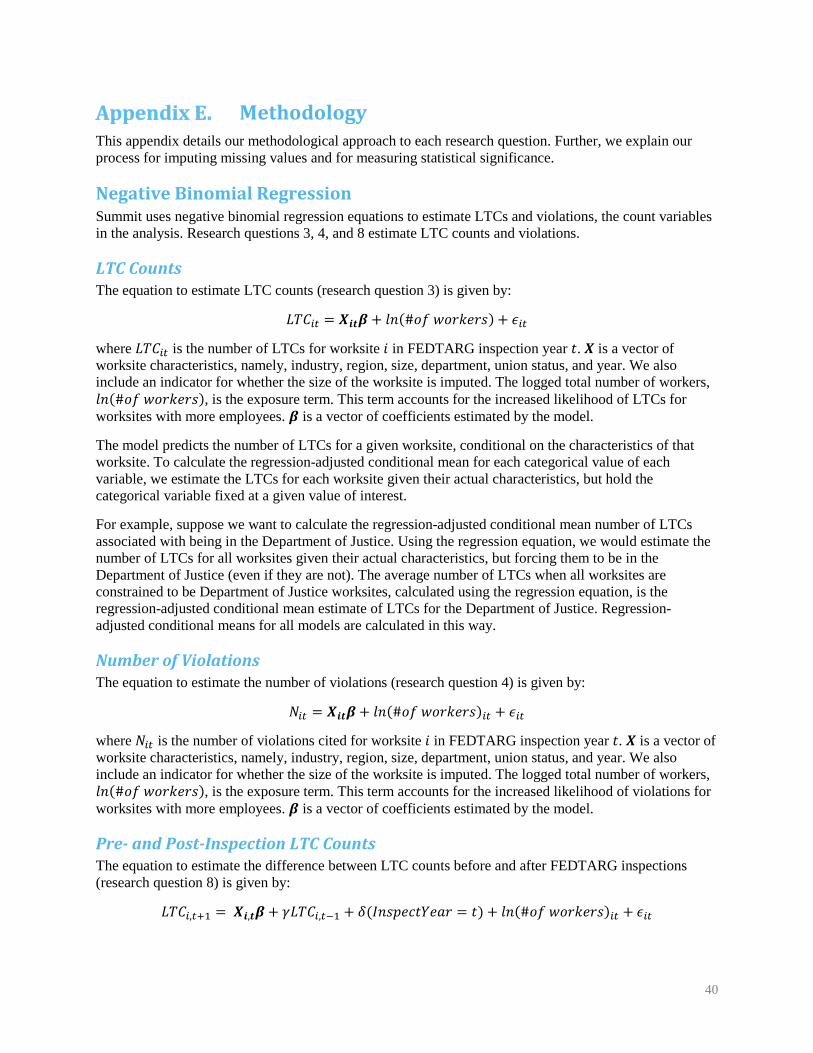
40
Methodology This appendix details our methodological approach to each research question. Further, we explain our process for imputing missing values and for measuring statistical significance.
Negative Binomial Regression Summit uses negative binomial regression equations to estimate LTCs and violations, the count variables in the analysis. Research questions 3, 4, and 8 estimate LTC counts and violations.
LTC Counts The equation to estimate LTC counts (research question 3) is given by:
𝐿𝐿𝐿𝐿𝐿𝐿𝑖𝑖𝑖𝑖 = 𝑿𝑿𝒊𝒊𝒊𝒊𝜷𝜷 + 𝑙𝑙𝑙𝑙(#𝑜𝑜𝑜𝑜 𝑤𝑤𝑜𝑜𝑤𝑤𝑤𝑤𝑤𝑤𝑤𝑤𝑤𝑤) + 𝜖𝜖𝑖𝑖𝑖𝑖
where 𝐿𝐿𝐿𝐿𝐿𝐿𝑖𝑖𝑖𝑖 is the number of LTCs for worksite 𝑖𝑖 in FEDTARG inspection year 𝑡𝑡. 𝑿𝑿 is a vector of worksite characteristics, namely, industry, region, size, department, union status, and year. We also include an indicator for whether the size of the worksite is imputed. The logged total number of workers, 𝑙𝑙𝑙𝑙(#𝑜𝑜𝑜𝑜 𝑤𝑤𝑜𝑜𝑤𝑤𝑤𝑤𝑤𝑤𝑤𝑤𝑤𝑤), is the exposure term. This term accounts for the increased likelihood of LTCs for worksites with more employees. 𝜷𝜷 is a vector of coefficients estimated by the model.
The model predicts the number of LTCs for a given worksite, conditional on the characteristics of that worksite. To calculate the regression-adjusted conditional mean for each categorical value of each variable, we estimate the LTCs for each worksite given their actual characteristics, but hold the categorical variable fixed at a given value of interest.
For example, suppose we want to calculate the regression-adjusted conditional mean number of LTCs associated with being in the Department of Justice. Using the regression equation, we would estimate the number of LTCs for all worksites given their actual characteristics, but forcing them to be in the Department of Justice (even if they are not). The average number of LTCs when all worksites are constrained to be Department of Justice worksites, calculated using the regression equation, is the regression-adjusted conditional mean estimate of LTCs for the Department of Justice. Regression-adjusted conditional means for all models are calculated in this way.
Number of Violations The equation to estimate the number of violations (research question 4) is given by:
𝑁𝑁𝑖𝑖𝑖𝑖 = 𝑿𝑿𝒊𝒊𝒊𝒊𝜷𝜷+ 𝑙𝑙𝑙𝑙(#𝑜𝑜𝑜𝑜 𝑤𝑤𝑜𝑜𝑤𝑤𝑤𝑤𝑤𝑤𝑤𝑤𝑤𝑤)𝑖𝑖𝑖𝑖 + 𝜖𝜖𝑖𝑖𝑖𝑖
where 𝑁𝑁𝑖𝑖𝑖𝑖 is the number of violations cited for worksite 𝑖𝑖 in FEDTARG inspection year 𝑡𝑡. 𝑿𝑿 is a vector of worksite characteristics, namely, industry, region, size, department, union status, and year. We also include an indicator for whether the size of the worksite is imputed. The logged total number of workers, 𝑙𝑙𝑙𝑙(#𝑜𝑜𝑜𝑜 𝑤𝑤𝑜𝑜𝑤𝑤𝑤𝑤𝑤𝑤𝑤𝑤𝑤𝑤), is the exposure term. This term accounts for the increased likelihood of violations for worksites with more employees. 𝜷𝜷 is a vector of coefficients estimated by the model.
Pre- and Post-Inspection LTC Counts The equation to estimate the difference between LTC counts before and after FEDTARG inspections (research question 8) is given by:
𝐿𝐿𝐿𝐿𝐿𝐿𝑖𝑖,𝑖𝑖+1 = 𝑿𝑿𝒊𝒊,𝒊𝒊𝜷𝜷+ 𝛾𝛾𝐿𝐿𝐿𝐿𝐿𝐿𝑖𝑖,𝑖𝑖−1 + 𝛿𝛿(𝐼𝐼𝑙𝑙𝑤𝑤𝐼𝐼𝑤𝑤𝐼𝐼𝑡𝑡𝐼𝐼𝑤𝑤𝐼𝐼𝑤𝑤 = 𝑡𝑡) + 𝑙𝑙𝑙𝑙(#𝑜𝑜𝑜𝑜 𝑤𝑤𝑜𝑜𝑤𝑤𝑤𝑤𝑤𝑤𝑤𝑤𝑤𝑤)𝑖𝑖𝑖𝑖 + 𝜖𝜖𝑖𝑖𝑖𝑖
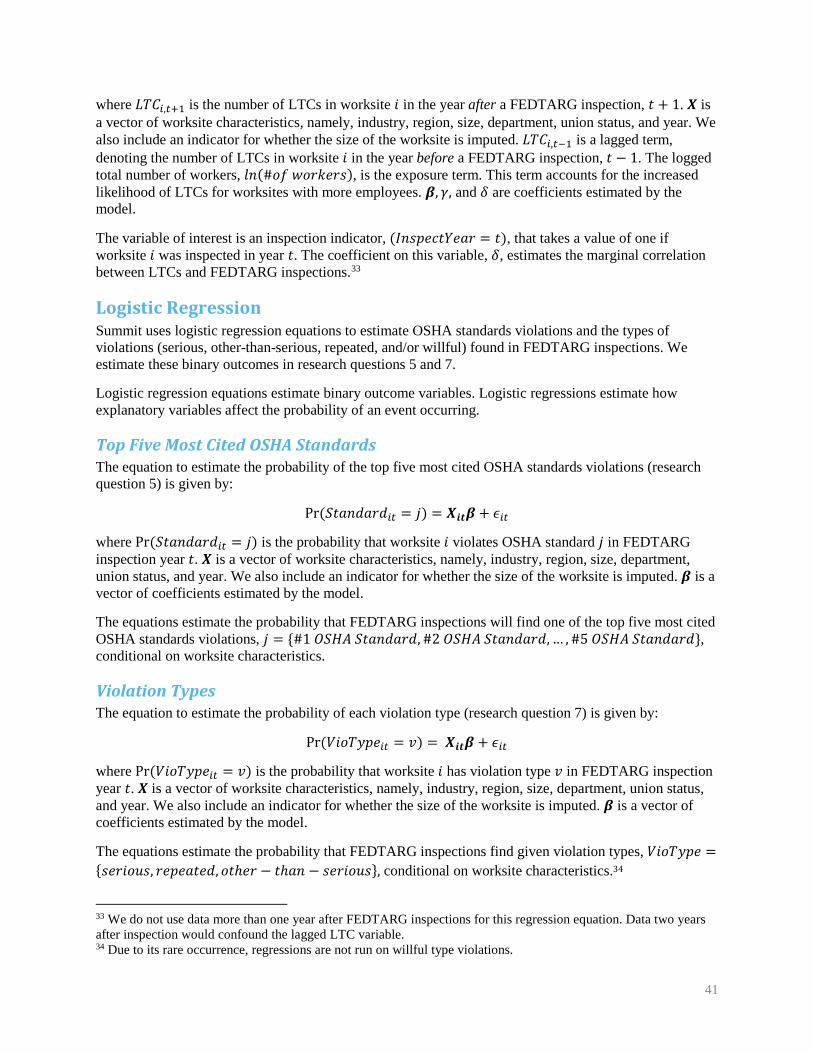
41
where 𝐿𝐿𝐿𝐿𝐿𝐿𝑖𝑖,𝑖𝑖+1 is the number of LTCs in worksite 𝑖𝑖 in the year after a FEDTARG inspection, 𝑡𝑡 + 1. 𝑿𝑿 is a vector of worksite characteristics, namely, industry, region, size, department, union status, and year. We also include an indicator for whether the size of the worksite is imputed. 𝐿𝐿𝐿𝐿𝐿𝐿𝑖𝑖,𝑖𝑖−1 is a lagged term, denoting the number of LTCs in worksite 𝑖𝑖 in the year before a FEDTARG inspection, 𝑡𝑡 − 1. The logged total number of workers, 𝑙𝑙𝑙𝑙(#𝑜𝑜𝑜𝑜 𝑤𝑤𝑜𝑜𝑤𝑤𝑤𝑤𝑤𝑤𝑤𝑤𝑤𝑤), is the exposure term. This term accounts for the increased likelihood of LTCs for worksites with more employees. 𝜷𝜷, 𝛾𝛾, and 𝛿𝛿 are coefficients estimated by the model.
The variable of interest is an inspection indicator, (𝐼𝐼𝑙𝑙𝑤𝑤𝐼𝐼𝑤𝑤𝐼𝐼𝑡𝑡𝐼𝐼𝑤𝑤𝐼𝐼𝑤𝑤 = 𝑡𝑡), that takes a value of one if worksite 𝑖𝑖 was inspected in year 𝑡𝑡. The coefficient on this variable, 𝛿𝛿, estimates the marginal correlation between LTCs and FEDTARG inspections.33
Logistic Regression Summit uses logistic regression equations to estimate OSHA standards violations and the types of violations (serious, other-than-serious, repeated, and/or willful) found in FEDTARG inspections. We estimate these binary outcomes in research questions 5 and 7.
Logistic regression equations estimate binary outcome variables. Logistic regressions estimate how explanatory variables affect the probability of an event occurring.
Top Five Most Cited OSHA Standards The equation to estimate the probability of the top five most cited OSHA standards violations (research question 5) is given by:
Pr (𝑆𝑆𝑡𝑡𝐼𝐼𝑙𝑙𝑆𝑆𝐼𝐼𝑤𝑤𝑆𝑆𝑖𝑖𝑖𝑖 = 𝑗𝑗) = 𝑿𝑿𝒊𝒊𝒊𝒊𝜷𝜷 + 𝜖𝜖𝑖𝑖𝑖𝑖
where Pr (𝑆𝑆𝑡𝑡𝐼𝐼𝑙𝑙𝑆𝑆𝐼𝐼𝑤𝑤𝑆𝑆𝑖𝑖𝑖𝑖 = 𝑗𝑗) is the probability that worksite 𝑖𝑖 violates OSHA standard 𝑗𝑗 in FEDTARG inspection year 𝑡𝑡. 𝑿𝑿 is a vector of worksite characteristics, namely, industry, region, size, department, union status, and year. We also include an indicator for whether the size of the worksite is imputed. 𝜷𝜷 is a vector of coefficients estimated by the model.
The equations estimate the probability that FEDTARG inspections will find one of the top five most cited OSHA standards violations, 𝑗𝑗 = {#1 𝑂𝑂𝑆𝑆𝑂𝑂𝑂𝑂 𝑆𝑆𝑡𝑡𝐼𝐼𝑙𝑙𝑆𝑆𝐼𝐼𝑤𝑤𝑆𝑆, #2 𝑂𝑂𝑆𝑆𝑂𝑂𝑂𝑂 𝑆𝑆𝑡𝑡𝐼𝐼𝑙𝑙𝑆𝑆𝐼𝐼𝑤𝑤𝑆𝑆, … , #5 𝑂𝑂𝑆𝑆𝑂𝑂𝑂𝑂 𝑆𝑆𝑡𝑡𝐼𝐼𝑙𝑙𝑆𝑆𝐼𝐼𝑤𝑤𝑆𝑆}, conditional on worksite characteristics.
Violation Types The equation to estimate the probability of each violation type (research question 7) is given by:
Pr (𝑉𝑉𝑖𝑖𝑜𝑜𝐿𝐿𝑉𝑉𝐼𝐼𝑤𝑤𝑖𝑖𝑖𝑖 = 𝑣𝑣) = 𝑿𝑿𝒊𝒊𝒊𝒊𝜷𝜷 + 𝜖𝜖𝑖𝑖𝑖𝑖
where Pr (𝑉𝑉𝑖𝑖𝑜𝑜𝐿𝐿𝑉𝑉𝐼𝐼𝑤𝑤𝑖𝑖𝑖𝑖 = 𝑣𝑣) is the probability that worksite 𝑖𝑖 has violation type 𝑣𝑣 in FEDTARG inspection year 𝑡𝑡. 𝑿𝑿 is a vector of worksite characteristics, namely, industry, region, size, department, union status, and year. We also include an indicator for whether the size of the worksite is imputed. 𝜷𝜷 is a vector of coefficients estimated by the model.
The equations estimate the probability that FEDTARG inspections find given violation types, 𝑉𝑉𝑖𝑖𝑜𝑜𝐿𝐿𝑉𝑉𝐼𝐼𝑤𝑤 ={𝑤𝑤𝑤𝑤𝑤𝑤𝑖𝑖𝑜𝑜𝑠𝑠𝑤𝑤, 𝑤𝑤𝑤𝑤𝐼𝐼𝑤𝑤𝐼𝐼𝑡𝑡𝑤𝑤𝑆𝑆, 𝑜𝑜𝑡𝑡ℎ𝑤𝑤𝑤𝑤 − 𝑡𝑡ℎ𝐼𝐼𝑙𝑙 − 𝑤𝑤𝑤𝑤𝑤𝑤𝑖𝑖𝑜𝑜𝑠𝑠𝑤𝑤}, conditional on worksite characteristics.34
33 We do not use data more than one year after FEDTARG inspections for this regression equation. Data two years after inspection would confound the lagged LTC variable. 34 Due to its rare occurrence, regressions are not run on willful type violations.
42
Imputing Missing Values There are 71 worksites that have missing data on the number of workers. Summit uses the predictive mean matching imputation method to impute the missing values. The five nearest neighbors, in terms of characteristics (department, union status, region, year, and industry), determine the imputed values. Missing values are imputed 20 separate times based on 20 separate draws of the five nearest neighbors. We use the average of the 20 imputations as the imputed value for the worksite size.
Statistical Significance All independent variables in the analysis are categorical. When we estimate the statistical significance of each categorical value, we estimate it relative to the grand mean of the entire category, not a single reference category. A statistically significant estimate denotes an estimate that is statistically significantly different from the grand mean for that characteristic. For example, the grand mean of LTCs for all regions is 63. Worksites in Region 1 have 42 LTCs, which is statistically significantly different from the grand mean at the 1% level.
For “yes/no” binary variables, statistical significance for the “yes” value is estimated relative to the “no” value of the variable.