adolescents, diets and nutrition
TRANSCRIPT


Disclaimer: This is a working document. It has been prepared to facilitate the exchange of knowledge and to stimulate
discussion. The statements in this publication are the views of the author(s) and do not necessarily refl ect the
policies or the views of UNICEF. The designations employed in this publication and the presentation of the material
do not imply on the part of the United Nations Children’s Fund (UNICEF) the expression of any opinion whatsoever
concerning the legal status of any country or area, or of its authorities or the delimitations of its frontiers. The text has
not been edited or fact-checked to offi cial publications standards and UNICEF accepts no responsibility for error.
Suggested citation: Sethi V, Lahiri A, Bhanot A, Kumar A, Chopra M, Mishra R, Alambusha R, Agrawal P, Johnston R and
de Wagt A. Adolescents, Diets and Nutrition: Growing well in a Changing World, The Comprehensive National Nutrition
Survey, Thematic Reports, Issue 1, 2019.
Adolescents, Diets and Nutrition
Growing Well in a Changing World
The CNNS Thematic Reports, Issue 1, 2019
Birth to Adolescence

Contents
Summary 1
Adolescents, Diets and Nutrition: Fast Facts 5
1 Introduction 9
2 Methods 11
3 Findings 15
3.1 How many adolescents suffer from visible forms of malnutrition? 15
3.2 How many adolescents suffer from anemia and micronutrient defi ciencies? 22
3.3 Risks for non-communicable diseases 37
3.4 Adolescents diets – are they healthy or unhealthy? 47
3.5 What are the physical activity patterns among adolescents? 91
3.6 What are the decision making patterns in adolescent girls? 97
3.7 What is the co-coverage of school-based nutrition services? 102
4 Opportunities 115
Maps 117
Annexure 1: Sociodemographic characteristics of analytical sample based on
which fi ndings are presented in this report 147
Annexure 2: Where do the poorest adolescents live in India (%) 149
Annexure 3: Nutrient rich sources (Top 10) and consequences of defi ciency/excess
among adolescents 150
Acknowledgements 156
References 157

1The CNNS Thematic Reports, Issue 1, 2019
Investing in the nutrition of the 1.2 billion
adolescents (10-19 years aged population)
will shape the world’s future. A fi fth of these
adolescents – 253 million – live in India.
Ensuring India’s adolescents are nourished
and growing well is critical to achieving India’s
demographic dividend.
Adolescents receive several health and
nutrition services in India. These include
biannual health check-ups, biannual
deworming, Weekly Iron Folic Acid
Supplementation (WIFS), counselling for
mental and reproductive health conditions.
Girls also receive menstrual hygiene services.
Longer duration of schooling is critical for
preventing early marriage and adolescent
pregnancy. In India, education is free and
compulsory till age of 14 years. School going
adolescents are also entitled to a mid-day
meal providing almost a third of energy and
protein requirements for 200 school-days in a
year in all government schools.
On 8 October 2019, the Ministry of Health and
Family Welfare, Government of India, released
the national report of the Comprehensive
National Nutrition Survey (CNNS) 2016-18
– birth to adolescence. The CNNS data-set
provides unparalleled new insights into all
types of macronutrient and micronutrient
malnutrition, dietary habits, life skill behaviours,
access to services (school, health and
nutrition) and physical activity throughout
adolescence 10-19 years and for both boys
and girls.
The CNNS survey data comes at an opportune
time, two years after the launch of the National
Nutrition Mission (POSHAN Abhiyaan) which
can provide valuable insights to support
healthy growth throughout childhood and
adolescence. Additionally, focusing on
Summary
adolescent girls, before they become mothers,
is critical to break India’s intergenerational
cycle of malnutrition. Schools are a cross-
sectoral platform to address good nutrition
– diets, services and behaviours. CNNS gives
important program insights on strengthening
nutrition in school premises.
Adolescents, Diets and Nutrition: Growing
well in a changing world, is the fi rst CNNS
thematic report based on unit-level data
analysis. It deep-dives in the CNNS data-
set to provide insights in lives of adolescents
in India in the 21st century. The analyses
provide national and state estimates on
adolescents 10-19 years (disaggregated by
boys and girls) for levels of malnutrition-
both its visible (thin, short and overweight/
obese) and hidden forms (anemia and six
micronutrient defi ciencies (iron, vitamin B12
,
folate, vitamin A, vitamin D and zinc)), risks for
non-communicable diseases, diets, physical
activity patterns, life style and beliefs and
access to services (health, social safety net
and nutrition) for early adolescents (10 to 14
years) and late adolescents (15 to 19 years).
Analytical sample on the basis of which
the fi ndings are presented include 35,856
adolescents 10-19 years (and a sub-set of
16,181 for biological samples).
Summary Findings
Every second Indian adolescent is either too
short or too thin or overweight/obese. Girls
are shorter than boys, but boys are thinner
than girls. Thinness is highest in 10-12 year
olds, with vast in-state variations among
10-14 year olds and 15-19 year olds
Every third adolescent girl and every fourth
adolescent boy 10-19 years is too short for
their age. More boys than girls are thin for
2 ADOLESCENTS, DIETS AND NUTRITION
their age in both 10-14 age group (32% boys,
23% girls) and 15-19 age group (26% boys,
14% girls). Highest prevalence of thinness is
seen between 10-12 years for both boys and
girls. In 10-14 age group, 1 in 2 short girls and
1 in 3 short boys, are also thin. At least, 5%
adolescents 10-14 years and 4% adolescents
15-19 years are overweight. In most states
of India at least 1 in 5 girls and boys are too
short for their age. Thinness in adolescence
is a problem of public health concern in most
Indian states. Twelve states have overweight/
obesity prevalence over 10% in 10-14 years
age group itself. Within states, there is variation
in prevalence of malnutrition between 10-14
year olds and 15-19 year olds. For example in
Bihar 18% girls are short in 15-19 years age
group, much higher than 36% in the 10-14
years age group. In Telangana this trend is
reverse with few shorter girls 10-14 years (17%)
compared to 44% short girls 15-19 years.
One in two adolescents suffer from at least
two of the six micronutrient defi ciencies
(iron, folate, vitamin B12
, vitamin D, vitamin
A and zinc)
Of the six micronutrient defi ciencies studied,
only 14% girls and 21% boys had none of the
six micronutrient defi ciencies. Over 50% of
the girls suffered from two of six micronutrient
defi ciencies. Out of the six micronutrient
defi ciencies studied, the most common
among adolescent girls is vitamin D defi ciency,
followed by folate and iron defi ciency. Among
adolescent boys, the highest burden is of folate
defi ciency, followed by vitamin B12
and zinc
defi ciency. Punjab is the only state to have
high proportions of adolescents affected by
fi ve different micronutrient defi ciencies (iron,
vitamin B12
, vitamin D, vitamin A and zinc).
Anemia affects 40% adolescent girls and 18%
boys. Co-existence of anemia and thinness is
higher among girls and 15-19 year olds
Anemia affects 32% girls 10-14 years and 48%
girls 15-19 years. Among boys 10-19 years,
~20% are anemic. Co-existence of anemia
and thinness among girls is twice more than
boys in early adolescence (10-14 years) and
four times higher in late adolescence (15-19
years). Among girls 10-14 years, anemia is a
severe public health problem in eight states
(Jharkhand, Tripura, West Bengal, Assam,
Chhattisgarh, Gujarat, Telangana and Uttar
Pradesh). Among 10-14 year old boys, anemia
is a severe public health problem in one state-
West Bengal. Among 15-19 year olds, anemia
is a severe public health problem in 19 states
in girls. There is no state in India where anemia
is a severe public health problem among boys
15-19 years.
Diabetes and cardiovascular diseases risk
and hypertension among adolescents is
increasing. At least 1 in 2 adolescents
affected by at least one of these risks.
1 in 10 adolescent girls and boys 10-14 years
and 2 out of 10 adolescents 15-19 years are at
risk of diabetes on the basis of HbA1c levels.
One in 4 (26%) boys 10-14 years have low
good cholesterol (low HDL cholesterol). The
proportion of adolescent boys 15-19 years
with low HDL cholesterol levels increases
to 39% indicating increasing risks in the
transition from early to late adolescence in
boys. Among girls 10-19 years, 1 in every 4
adolescents have low HDL cholesterol. A small
proportion (5%) adolescent boys and girls
suffer from hypertension, based on systolic
and diastolic blood pressure. Among girls,
proportion with hypertension is highest (8%)
at 11 years and 18 years. Among boys, highest
proportion is noted at 19 years (7%). One in 2
adolescents have at least one of the three non-
communicable disease risks (high HbA1c, high
diastolic/systolic blood pressure and low HDL
cholesterol levels). At least two such risks are
seen in 1 in 3 adolescents. None of the states
have zero risk for diabetes and heart disease
among adolescents 10-14 years of age.
Girls suffer more: They have multiple
nutritional deprivations and little autonomy
More girls suffer from co-existence of
shortness and thinness than boys in both

3The CNNS Thematic Reports, Issue 1, 2019
early (10 to 14 years) and late (15 to 19 years)
adolescence. Co-existence of anemia and
thinness among girls is twice more than boys
in early adolescence (10 to 14 years) and four
times higher in late adolescence (15 to 19
years). Their situation is exacerbated by the
fact that girls have little say in their own life
choices around What to buy? Whom to marry?
When to marry? There are states like Goa and
Mizoram that do exceptionally well on girls'
autonomy but they are heavily outnumbered
by those which perform poorly.
Malnutrition in several forms is higher and/
or peaks in early adolescence
While there are more than 1 in 5 short
adolescents at all ages from 10 to 19 years,
prevalence of thinness and obesity peaks in
early adolescence (10 to 14 years) for both
girls and boys. Thus, reaching adolescents with
nutrition services early is imperative. Vitamin A,
vitamin D and zinc defi ciencies peak in early
adolescence (10 to 14 years). Also, risks for
non-communicable diseases are established
in childhood and adolescence. Thus, within
the second decade of life (10 to 19 years),
most opportune time to intervene is in early
adolescence.
Almost all adolescents have “unhealthy”
diets
Only 2 out of 5 adolescents (~45%) take milk
in their daily diet. Only 1 out of 5 adolescents
(~20%) take pulses and green leafy
vegetables. Less than 1 out of 5 adolescents
(<10%) consume fruits daily. Six out of 10
adolescents reported zero consumption
of fruits even once a week. Every fourth
adolescent reported zero consumption of
green leafy vegetables even once a week.
At the same time, at least once a week
consumption of fried foods was reported
by 30% adolescents and sweets by 15%.
Consumption of fried foods was reported by
5% adolescents, sweets and aerated drinks
by 2% adolescents. Two percent adolescents
reported at least thrice a week consumption
of junk foods. Adolescent girls and boys who
are short, thin, or anemic most often do not
eat fruits, egg, fi sh/chicken, dark green leafy
vegetables and pulses. Pulses and dark green
leafy vegetable consumption increases around
ages 12 to 14 years but these gains are lost in
later years. Intake of all avoidable foods peaks
at 17 years among boys. States of Delhi and
Goa have lowest compliance of fried foods,
junk foods, aerated drinks and sweets. Punjab
emerges as a state with lowest compliance
of adolescents consuming recommended
frequencies of nutritive foods (pulses, dark
green leafy vegetables, eggs, chicken/fi sh)
and highest levels of micronutrient defi ciencies
(iron, vitamin B1 2
, vitamin D, vitamin A, zinc).
Almost all adolescents fail to meet the daily
requirements of physical activity for their age
All girls and boys are unable to meet the 60
minutes per day recommended outdoor sports
and exercise time. On an average, girls in late
adolescence spend only 10 minutes per day
on such activities. Boys do relatively better,
with exercise time of 40 to 50 minutes per day.
Decision making on matters that shape a
girl’s life course
Girls aged 15 to 19 years are least involved in
decisions that determine when they will marry
(25%) and whom they will marry (36%).
More than half have little say on what will be
purchased for them or for the family, including
foods of choice. Odisha emerges as a state
where girls have least autonomy with minimum
say in decisions on market purchases, when to
marry and whom to marry and Mizoram with
the highest.
School-based services (noon meal, IFA
supplementation, deworming and biannual
health checkups) co-coverage is low and
variable across states
About 20 to 25% of girls and boys do not
receive any of the four school based services.
Weekly IFA supplementation has the least
4 ADOLESCENTS, DIETS AND NUTRITION
penetration with 10% or lower proportion
of school going adolescents covered. State
with best coverage (Sikkim, Manipur) and
worst coverage (Nagaland) for weekly IFA
supplementation belong to the same north-
eastern region of the country. While receipt
of MDM is 67%, WIFS provided on the same
platform is low at 11%.
The analysis presented in this report is critical
evidence to inform POSHAN Abhiyaan for
holistic programming for improving nutritional
status of adolescent girls and boys, especially
through schools. Campaigns on healthy food
choices should be centered around promotion
of a variety of items in appropriate proportions
in the food plate. As the POSHAN Abhiyaan,
enters its third year, the timing is right to review
how the “would be mothers and fathers” be
provided the right nutrition to prevent the
intergeneration cycle of malnutrition.
5The CNNS Thematic Reports, Issue 1, 2019
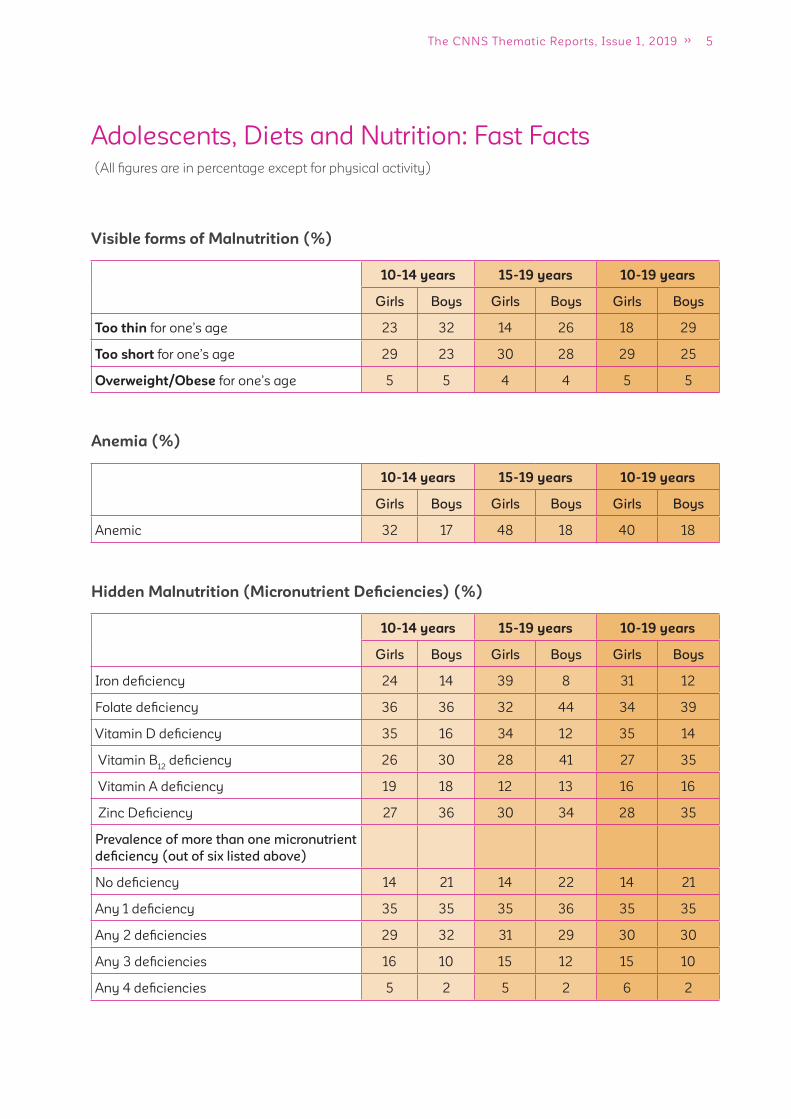
Adolescents, Diets and Nutrition: Fast Facts
(All fi gures are in percentage except for physical activity)
Visible forms of Malnutrition (%)
10-14 years 15-19 years 10-19 years
Girls Boys Girls Boys Girls Boys
Too thin for one’s age 23 32 14 26 18 29
Too short for one’s age 29 23 30 28 29 25
Overweight/Obese for one’s age 5 5 4 4 5 5
Anemia (%)
10-14 years 15-19 years 10-19 years
Girls Boys Girls Boys Girls Boys
Anemic 32 17 48 18 40 18
Hidden Malnutrition (Micronutrient Defi ciencies) (%)
10-14 years 15-19 years 10-19 years
Girls Boys Girls Boys Girls Boys
Iron defi ciency 24 14 39 8 31 12
Folate defi ciency 36 36 32 44 34 39
Vitamin D defi ciency 35 16 34 12 35 14
Vitamin B12
defi ciency 26 30 28 41 27 35
Vitamin A defi ciency 19 18 12 13 16 16
Zinc Defi ciency 27 36 30 34 28 35
Prevalence of more than one micronutrient
defi ciency (out of six listed above)
No defi ciency 14 21 14 22 14 21
Any 1 defi ciency 35 35 35 36 35 35
Any 2 defi ciencies 29 32 31 29 30 30
Any 3 defi ciencies 16 10 15 12 15 10
Any 4 defi ciencies 5 2 5 2 6 2
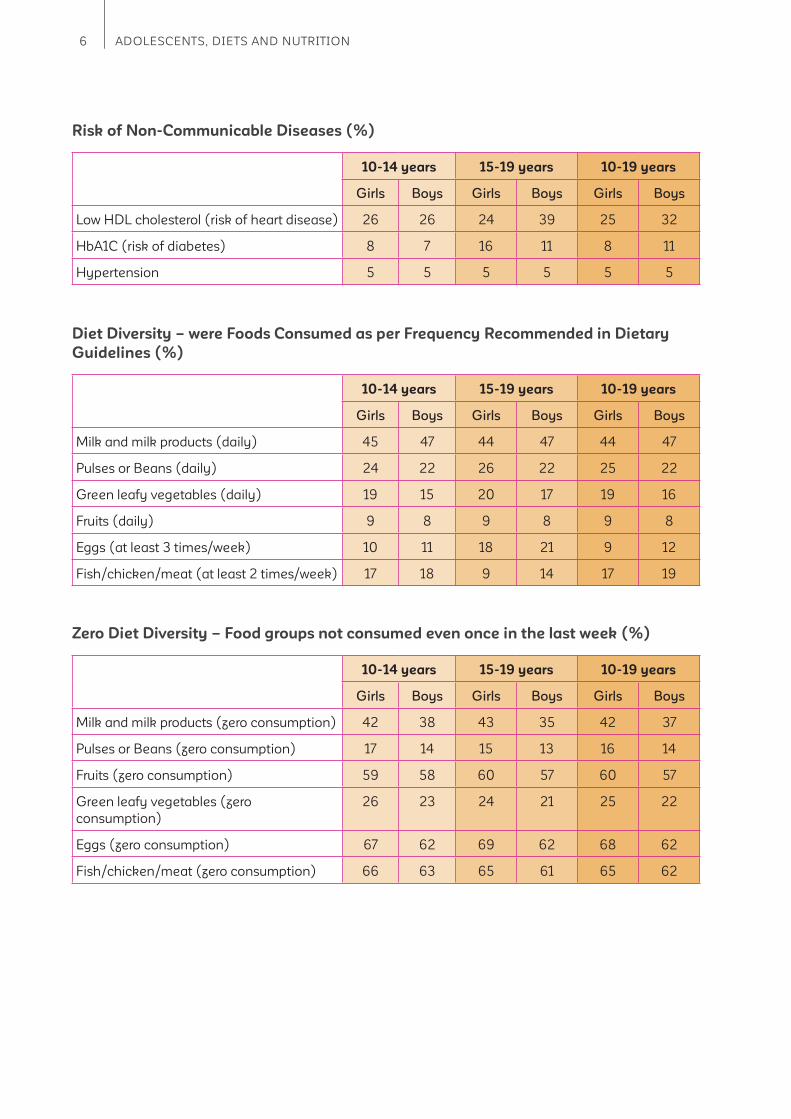
6 ADOLESCENTS, DIETS AND NUTRITION
Risk of Non-Communicable Diseases (%)
10-14 years 15-19 years 10-19 years
Girls Boys Girls Boys Girls Boys
Low HDL cholesterol (risk of heart disease) 26 26 24 39 25 32
HbA1C (risk of diabetes) 8 7 16 11 8 11
Hypertension 5 5 5 5 5 5
Diet Diversity – were Foods Consumed as per Frequency Recommended in Dietary
Guidelines (%)
10-14 years 15-19 years 10-19 years
Girls Boys Girls Boys Girls Boys
Milk and milk products (daily) 45 47 44 47 44 47
Pulses or Beans (daily) 24 22 26 22 25 22
Green leafy vegetables (daily) 19 15 20 17 19 16
Fruits (daily) 9 8 9 8 9 8
Eggs (at least 3 times/week) 10 11 18 21 9 12
Fish/chicken/meat (at least 2 times/week) 17 18 9 14 17 19
Zero Diet Diversity – Food groups not consumed even once in the last week (%)
10-14 years 15-19 years 10-19 years
Girls Boys Girls Boys Girls Boys
Milk and milk products (zero consumption) 42 38 43 35 42 37
Pulses or Beans (zero consumption) 17 14 15 13 16 14
Fruits (zero consumption) 59 58 60 57 60 57
Green leafy vegetables (zero
consumption)
26 23 24 21 25 22
Eggs (zero consumption) 67 62 69 62 68 62
Fish/chicken/meat (zero consumption) 66 63 65 61 65 62
7The CNNS Thematic Reports, Issue 1, 2019
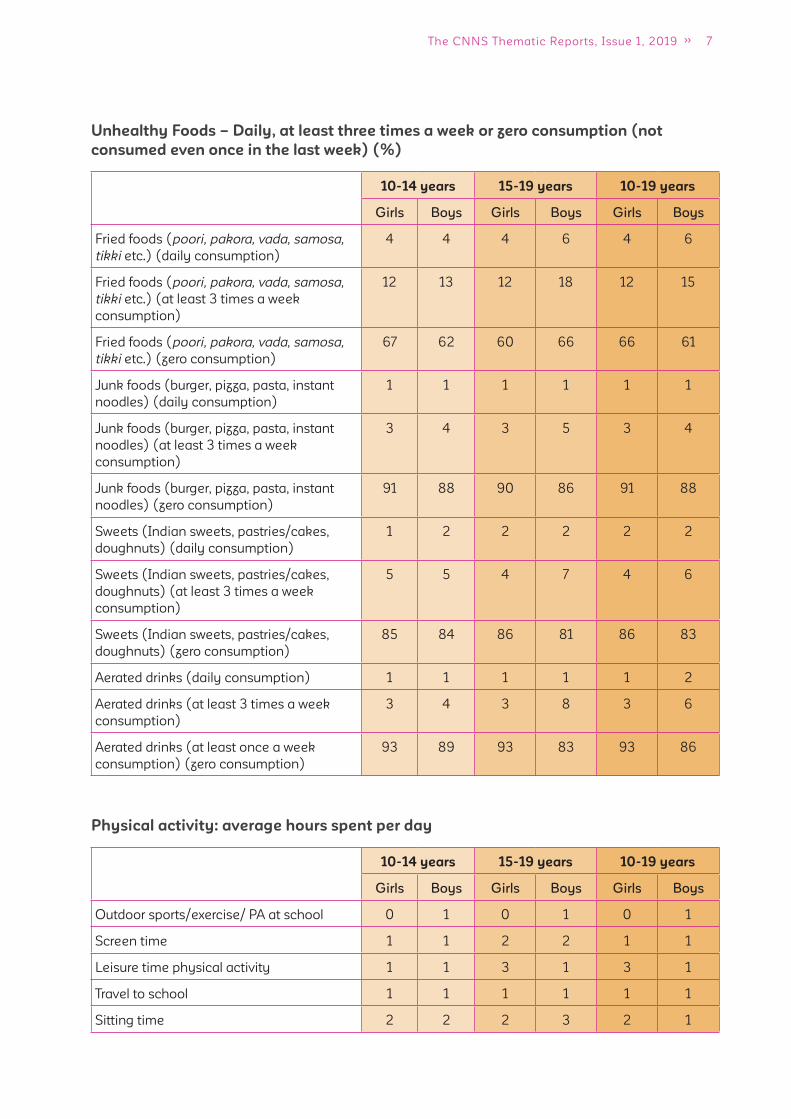
Unhealthy Foods – Daily, at least three times a week or zero consumption (not
consumed even once in the last week) (%)
10-14 years 15-19 years 10-19 years
Girls Boys Girls Boys Girls Boys
Fried foods (poori, pakora, vada, samosa,
tikki etc.) (daily consumption)
4 4 4 6 4 6
Fried foods (poori, pakora, vada, samosa,
tikki etc.) (at least 3 times a week
consumption)
12 13 12 18 12 15
Fried foods (poori, pakora, vada, samosa,
tikki etc.) (zero consumption)
67 62 60 66 66 61
Junk foods (burger, pizza, pasta, instant
noodles) (daily consumption)
1 1 1 1 1 1
Junk foods (burger, pizza, pasta, instant
noodles) (at least 3 times a week
consumption)
3 4 3 5 3 4
Junk foods (burger, pizza, pasta, instant
noodles) (zero consumption)
91 88 90 86 91 88
Sweets (Indian sweets, pastries/cakes,
doughnuts) (daily consumption)
1 2 2 2 2 2
Sweets (Indian sweets, pastries/cakes,
doughnuts) (at least 3 times a week
consumption)
5 5 4 7 4 6
Sweets (Indian sweets, pastries/cakes,
doughnuts) (zero consumption)
85 84 86 81 86 83
Aerated drinks (daily consumption) 1 1 1 1 1 2
Aerated drinks (at least 3 times a week
consumption)
3 4 3 8 3 6
Aerated drinks (at least once a week
consumption) (zero consumption)
93 89 93 83 93 86
Physical activity: average hours spent per day
10-14 years 15-19 years 10-19 years
Girls Boys Girls Boys Girls Boys
Outdoor sports/exercise/ PA at school 0 1 0 1 0 1
Screen time 1 1 2 2 1 1
Leisure time physical activity 1 1 3 1 3 1
Travel to school 1 1 1 1 1 1
Sitting time 2 2 2 3 2 1
8 ADOLESCENTS, DIETS AND NUTRITION
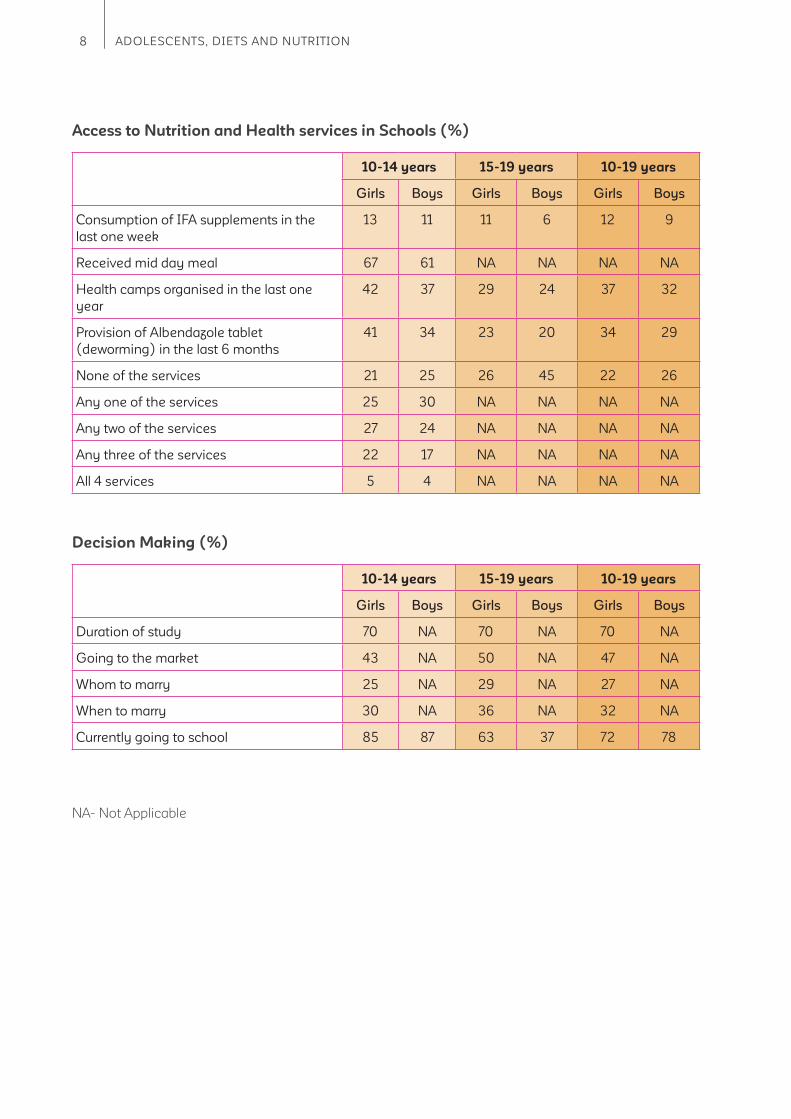
Access to Nutrition and Health services in Schools (%)
10-14 years 15-19 years 10-19 years
Girls Boys Girls Boys Girls Boys
Consumption of IFA supplements in the
last one week
13 11 11 6 12 9
Received mid day meal 67 61 NA NA NA NA
Health camps organised in the last one
year
42 37 29 24 37 32
Provision of Albendazole tablet
(deworming) in the last 6 months
41 34 23 20 34 29
None of the services 21 25 26 45 22 26
Any one of the services 25 30 NA NA NA NA
Any two of the services 27 24 NA NA NA NA
Any three of the services 22 17 NA NA NA NA
All 4 services 5 4 NA NA NA NA
Decision Making (%)
10-14 years 15-19 years 10-19 years
Girls Boys Girls Boys Girls Boys
Duration of study 70 NA 70 NA 70 NA
Going to the market 43 NA 50 NA 47 NA
Whom to marry 25 NA 29 NA 27 NA
When to marry 30 NA 36 NA 32 NA
Currently going to school 85 87 63 37 72 78
NA- Not Applicable
9The CNNS Thematic Reports, Issue 1, 2019
1 Introduction
India is home to 253 million adolescents - 120
million girls and 133 million boys1. These are the
largest numbers of adolescents in any country,
globally2. India’s economic growth is dependent
on its adolescents who are its demographic
advantage and hence, it's important that they are
nourished and growing well.
The age of adolescence is divided into early
and late phases, from 10 to 14 years and 15
to 19 years. Ten to 14 years are critical years
for both girls and boys as they achieve their
maximum growth spurt. Annual height and
weight gains may be as high as 9 cm and 8 to
10 kg, respectively3,4. Early adolescence is also
an opportune time to catch-up on height and
weight defi cits suffered in childhood5. Girls have
added physiological stress due to the onset of
menstruation and increased risk of anemia and
micronutrient defi ciencies. The growth spurt
continues into late adolescence (15 to 19 years),
especially for boys. In the late adolescence
phase, some girls in India do enter pregnancy
and with low height, weight and hemoglobin
levels, and will not be able to properly support
healthy fetal growth or themselves. In a vicious
cycle, babies born to adolescent girls are at an
increased risk of being born too early or with
a low birthweight. Those who conceive later
with compromised nutritional status will face
similar birth outcomes. Children of malnourished
adolescent mothers are more at risk to suffer
growth failure during the fi rst 1,000 days (from
conception to age two). Without correct nutrition,
these children are at risk of growing up physically
and cognitively stunted and are at risk of carrying
this burden into adolescence and adulthood
which fuels the intergenerational cycle of
malnutrition.
Many of these individual behaviours are
associated with poor nutritional status and
increased risk of non-communicable diseases
in adulthood, such as lack of physical activity
and eating disorders. While national estimates
for physical activity were unavailable, global
estimates suggest 8 in 10 adolescents were not
physically active enough with girls being less
active than boys6. Similar fi ndings were noted in
smaller scale studies from north, north-east and
south India7,8,9.
Body changes are accompanied by rapid
increase in cognitive and emotional development
and increased inclination to assert own choices
and identity formation. The CNNS data-set also
provides important insights into self-worth and
decision-making choices of adolescents for
strengthening this component of adolescent
friendly health services.
Schools are a cross-sectoral platform to address
good nutrition – diets, services and behaviours.
CNNS gives important programme insights on
strengthening nutrition in schools, adolescents
are entitled to several health and nutrition
services through schools such as biannual
health check-ups, biannual deworming, weekly
iron folic acid supplementation (WIFS), referral
for counselling and treatment for reproductive
health conditions and hygiene services for girls.
Education is free and compulsory till age of 14
years; longer duration of schooling being critical
for preventing early marriage and adolescent
pregnancy. School-going adolescents are also
entitled to a mid-day meal providing almost a
third of energy and protein requirements for 200
days a year in all government schools. These
services are being provided through government
of India’s national programs implemented by

10 ADOLESCENTS, DIETS AND NUTRITION
Ministry of Health (Anemia Mukt Bharat, Rashtriya Bal Swasthya Karyakram and Rashtriya Kishore Swasthya Karyakram) and Ministry of Human
Resource Development (mid-day meal scheme
and menstrual hygiene and water sanitation and
hygiene services)
On 8 October 2019, the Ministry of Health and
Family Welfare, Government of India, released
the national report of the Comprehensive
National Nutrition Survey (CNNS) 2016-18
– birth to adolescence. The CNNS data-set
provides unparalleled new insights into all types
of macronutrient and micronutrient malnutrition,
dietary habits, life skill behaviours, access to
services (school, health and nutrition) and
physical activity throughout adolescence
10-19 years and for both boys and girls.
The CNNS survey data comes at an opportune
time, two years after the launch of the National
Nutrition Mission (POSHAN Abhiyaan) which
can provide valuable insights to support healthy
growth throughout childhood and adolescence.
Additionally, focusing on adolescent girls, before
they become mothers, is critical to break India’s
intergenerational cycle of malnutrition. The
potential of schools as a cross-sectoral platform
to address good nutrition – diets, services and
behaviours – remains largely untapped even in
POSHAN Abhiyaan’s fi rst two years. CNNS gives
important programme insights on strengthening
school-based services.
Adolescents, Diets and Nutrition: Growing well
in a changing world, is the fi rst CNNS thematic
report of the unit level analysis of the CNNS. It
deep-dives in the CNNS unit level data-set into
lives of adolescents in India in the 21st century.
We analyze and provide national and state
estimates on adolescents 10-19 years, levels of
malnutrition both its visible and hidden forms,
risks for non-communicable diseases, diets,
physical activity patterns, life style and beliefs
and access to services (health, social safety net
and nutrition) for early adolescents (10 to 14
years) and late adolescents (15 to 19 years). The
analytical sample included 35,856 adolescents
10-19 years (and a sub-set of 16,181 for biological
samples).
The thematic report answers the following
questions for girls and boys aged 10 to 14 years
and 15 to 19 years, separately. How these answers
vary across all states of India is also presented.
1. How many adolescents suffer from visible
forms of malnutrition?
2. How many adolescents suffer from anemia
and micronutrient defi ciencies?
3. How many adolescents are at risks for non-
communicable diseases?
4. How many adolescents eat as per
recommendation?
5. What foods are most commonly missed in
diets of malnourished adolescents?
6. What are the physical activity patterns among
adolescents?
7. What are the decision making patterns in
adolescents?
8. What is the co-coverage of school-based
nutrition services?
This report provides critical evidence to inform
POSHAN Abhiyaan for holistic programming for
improving nutritional status of adolescent girls
and boys, especially through schools. As the
POSHAN Abhiyaan enters its third year, the timing
is right to review how the “would be mothers
and fathers” be provided the right nutrition to
prevent the intergeneration cycle of malnutrition
and stregthen the human capital responsible for
India’s future growth and development.
11The CNNS Thematic Reports, Issue 1, 2019
2 Methods
Adolescents, Diets and Nutrition: Growing
well in a changing world is based on unit level
analysis of the 10-19 years age-group sub-set of
the CNNS data-set which contains information
on 0-19 years. Briefl y, the CNNS used a multi-
stage sampling design to select a representative
sample of households and individuals aged 0-19
years across 28 states and 2 union territories.
In the CNNS, the total sample for 10 to 14 years
aged adolescents was 18,388 with 8,845 girls
and 9,543 boys. The total sample for 15 to
19 years aged adolescents was 17,442 with
8,560 girls and 8,882 boys. The sample for
biochemical testing was 8,662 in the 10 to 14
years age-group (4,147 girls and 4,515 boys) and
7,520 in the 15 to 19 years age-group (3,818 girls
and 3,702 boys). This sample size formed the
analytical sample for this report.
Analysis For Malnutrition
First, we present the CNNS estimates on
prevalence of different visible and hidden forms
of malnutrition. Second, we extrapolate these
estimates on the Census, 2011, fi nal population
estimates for 10 to 14 years and 15 to 19 years
aged girls and boys to determine the burden of
different forms of malnutrition. Third, we provide
the co-existence of different forms of malnutrition
to estimate double and triple burden. Fourth,
estimates for each completed age from 10 to 18
years are also presented. Finally, we present the
variation in different forms of malnutrition across
states of India against public health signifi cance
or threshold prevalence at which the prevalence
becomes a population-level problem. WHO
thresholds of public health issues are used where
available. Where thresholds are unavailable 10%
or 20% intervals have been considered as per
distribution of prevalence.
Visible forms of malnutrition
Measuring lower in height for age (short),
weighing less for height (thin) and weighing
more for height (overweight/obese) constitute
the visible and commonly measurable forms
of malnourishment. The weight for height
measurement is also referred to as Body Mass
Index (BMI). That an adolescent is short, thin or
overweight/obese is determined by comparing
her/his height and BMI with standards developed
for a normal girl or boy of the same age; the
standards being the WHO Growth Reference
for 5-19 years10. How far a girl or boy is from
this reference is used to classify short, thin or
overweight/obese adolescent.
Hidden forms of malnutrition
Defi ciency of vitamins and other essential
micronutrients result in malnutrition where in the
manifestations are not as obvious with mild or
moderate defi cits. Thus, these are collectively
referred to as hidden forms of malnutrition. In this
report we include anemia and six micronutrient
defi ciencies (iron, vitamin B12
, folate, vitamin A,
vitamin D and zinc) to present the spectrum of
hidden malnutrition. Blood and urine tests are
undertaken to determine existence of these
forms of malnutrition, comparing an adolescent’s
whole blood or blood serum or urine levels with
WHO standard threshold values. We also present
analyses of how many adolescents are facing
at least one to all six micronutrient defi ciencies
to provide data on prevalence of multiple
micronutrient defi ciencies in an adolescent
population.
12 ADOLESCENTS, DIETS AND NUTRITION
Analysis for risks of non-
communicable diseases
First, we present the CNNS estimates
on prevalence of different risks of non-
communicable diseases. Three risks are
included in our analysis- risk for diabetes, risk
for cardiovascular diseases and hypertension.
Second, we provide the co-existence of different
risks among adolescent girls and boys. Third,
estimates for risks for non-communicable
diseases for each completed age from 10 to
18 years are presented. Finally, we present the
state-wide variations against globally endorsed
thresholds for increased risks.
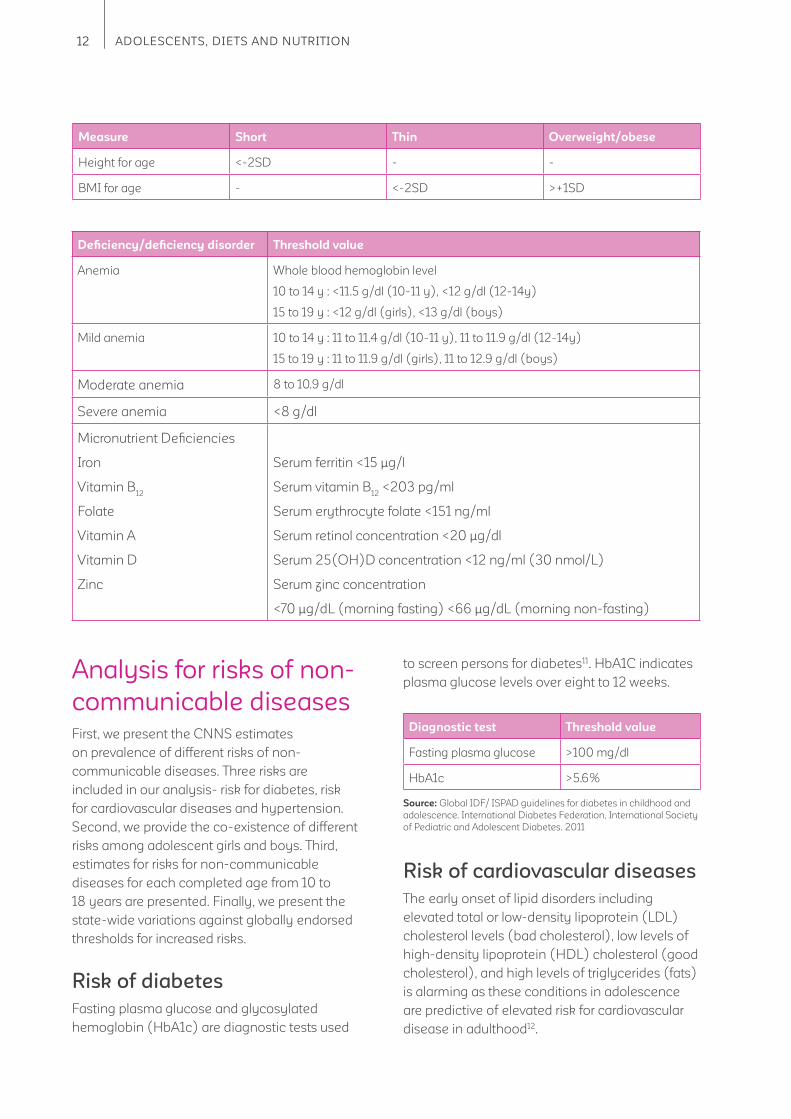
Risk of diabetes
Fasting plasma glucose and glycosylated
hemoglobin (HbA1c) are diagnostic tests used
Defi ciency/defi ciency disorder Threshold value
Anemia Whole blood hemoglobin level
10 to 14 y : <11.5 g/dl (10-11 y), <12 g/dl (12-14y)
15 to 19 y : <12 g/dl (girls), <13 g/dl (boys)
Mild anemia 10 to 14 y : 11 to 11.4 g/dl (10-11 y), 11 to 11.9 g/dl (12-14y)
15 to 19 y : 11 to 11.9 g/dl (girls), 11 to 12.9 g/dl (boys)
Moderate anemia 8 to 10.9 g/dl
Severe anemia <8 g/dl
Micronutrient Defi ciencies
Iron
Vitamin B12
Folate
Vitamin A
Vitamin D
Zinc
Serum ferritin <15 μg/l
Serum vitamin B12
<203 pg/ml
Serum erythrocyte folate <151 ng/ml
Serum retinol concentration <20 μg/dl
Serum 25(OH)D concentration <12 ng/ml (30 nmol/L)
Serum zinc concentration
<70 μg/dL (morning fasting) <66 μg/dL (morning non-fasting)
to screen persons for diabetes11. HbA1C indicates
plasma glucose levels over eight to 12 weeks.
Diagnostic test Threshold value
Fasting plasma glucose >100 mg/dl
HbA1c >5.6%
Source: Global IDF/ ISPAD guidelines for diabetes in childhood and
adolescence. International Diabetes Federation, International Society
of Pediatric and Adolescent Diabetes. 2011
Measure Short Thin Overweight/obese
Height for age <-2SD - -
BMI for age - <-2SD >+1SD
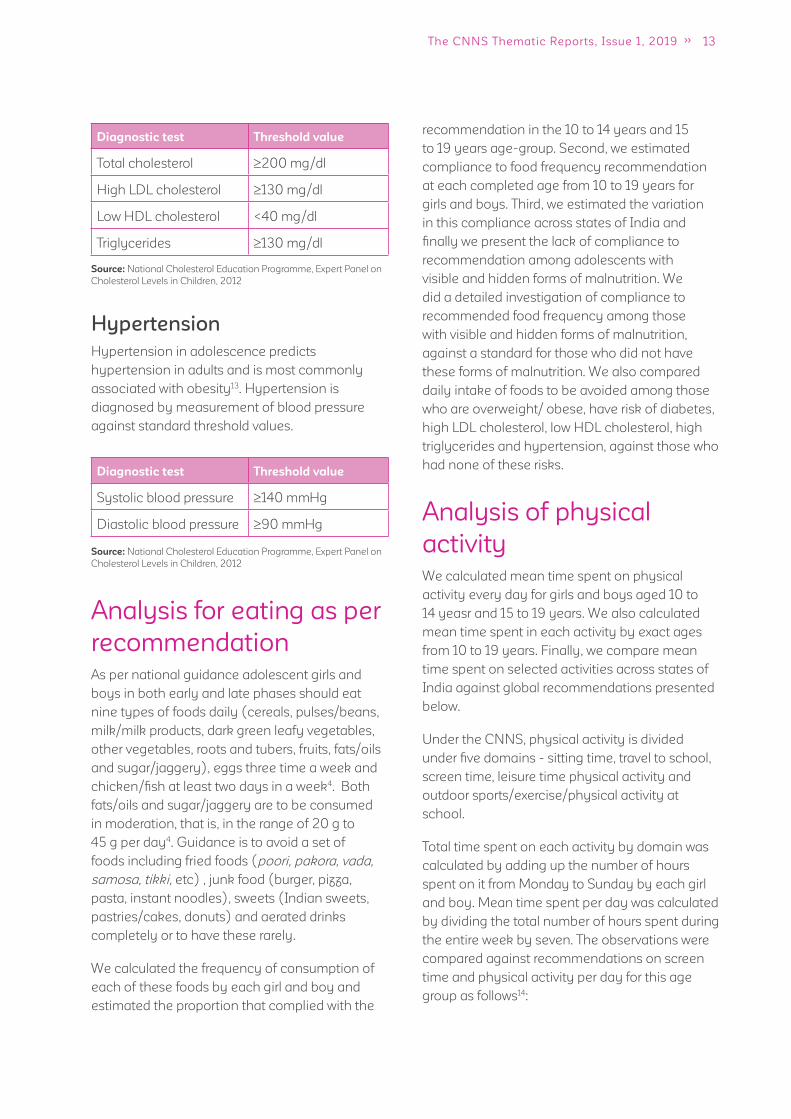
Risk of cardiovascular diseases
The early onset of lipid disorders including
elevated total or low-density lipoprotein (LDL)
cholesterol levels (bad cholesterol), low levels of
high-density lipoprotein (HDL) cholesterol (good
cholesterol), and high levels of triglycerides (fats)
is alarming as these conditions in adolescence
are predictive of elevated risk for cardiovascular
disease in adulthood12.
13The CNNS Thematic Reports, Issue 1, 2019
recommendation in the 10 to 14 years and 15
to 19 years age-group. Second, we estimated
compliance to food frequency recommendation
at each completed age from 10 to 19 years for
girls and boys. Third, we estimated the variation
in this compliance across states of India and
fi nally we present the lack of compliance to
recommendation among adolescents with
visible and hidden forms of malnutrition. We
did a detailed investigation of compliance to
recommended food frequency among those
with visible and hidden forms of malnutrition,
against a standard for those who did not have
these forms of malnutrition. We also compared
daily intake of foods to be avoided among those
who are overweight/ obese, have risk of diabetes,
high LDL cholesterol, low HDL cholesterol, high
triglycerides and hypertension, against those who
had none of these risks.
Analysis of physical
activity
We calculated mean time spent on physical
activity every day for girls and boys aged 10 to
14 yeasr and 15 to 19 years. We also calculated
mean time spent in each activity by exact ages
from 10 to 19 years. Finally, we compare mean
time spent on selected activities across states of
India against global recommendations presented
below.
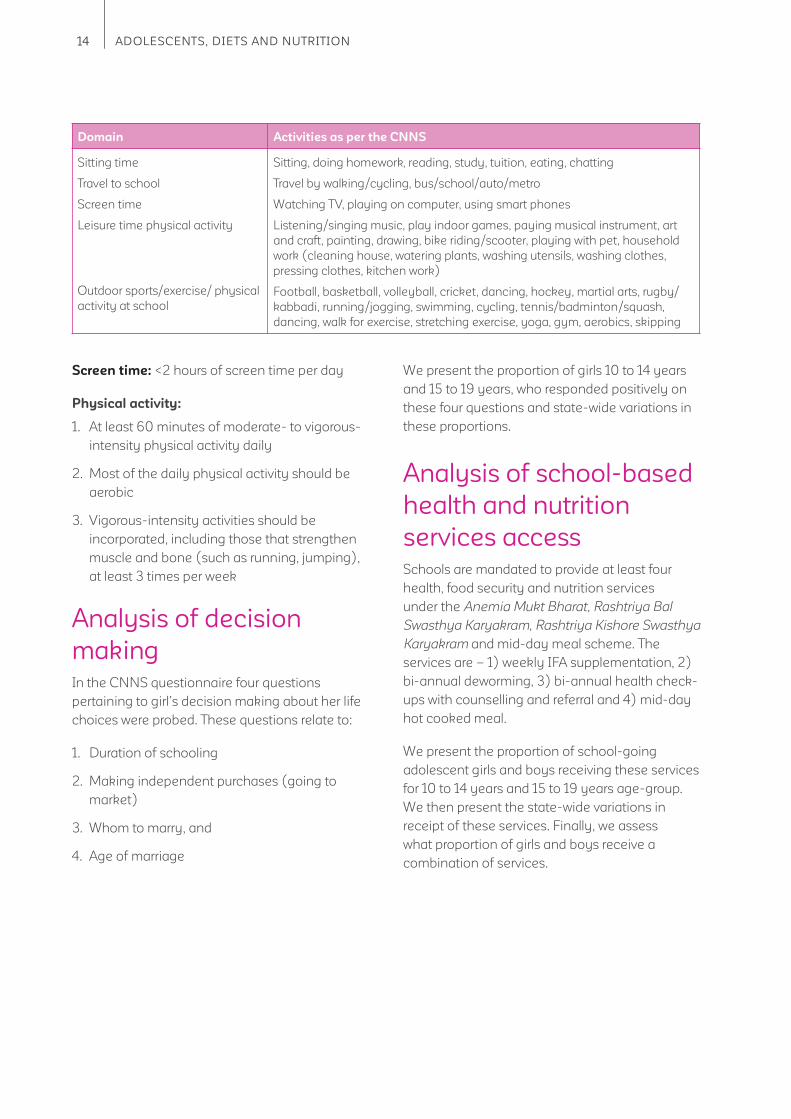
Under the CNNS, physical activity is divided
under fi ve domains - sitting time, travel to school,
screen time, leisure time physical activity and
outdoor sports/exercise/physical activity at
school.
Total time spent on each activity by domain was
calculated by adding up the number of hours
spent on it from Monday to Sunday by each girl
and boy. Mean time spent per day was calculated
by dividing the total number of hours spent during
the entire week by seven. The observations were
compared against recommendations on screen
time and physical activity per day for this age
group as follows14:
Diagnostic test Threshold value
Total cholesterol 200 mg/dl
High LDL cholesterol 130 mg/dl
Low HDL cholesterol <40 mg/dl
Triglycerides 130 mg/dl
Source: National Cholesterol Education Programme, Expert Panel on
Cholesterol Levels in Children, 2012
Diagnostic test Threshold value
Systolic blood pressure 140 mmHg
Diastolic blood pressure 90 mmHg
Source: National Cholesterol Education Programme, Expert Panel on
Cholesterol Levels in Children, 2012
Hypertension
Hypertension in adolescence predicts
hypertension in adults and is most commonly
associated with obesity13. Hypertension is
diagnosed by measurement of blood pressure
against standard threshold values.
Analysis for eating as per
recommendation
As per national guidance adolescent girls and
boys in both early and late phases should eat
nine types of foods daily (cereals, pulses/beans,
milk/milk products, dark green leafy vegetables,
other vegetables, roots and tubers, fruits, fats/oils
and sugar/jaggery), eggs three time a week and
chicken/fi sh at least two days in a week4. Both
fats/oils and sugar/jaggery are to be consumed
in moderation, that is, in the range of 20 g to
45 g per day4. Guidance is to avoid a set of
foods including fried foods (poori, pakora, vada,
samosa, tikki, etc) , junk food (burger, pizza,
pasta, instant noodles), sweets (Indian sweets,
pastries/cakes, donuts) and aerated drinks
completely or to have these rarely.
We calculated the frequency of consumption of
each of these foods by each girl and boy and
estimated the proportion that complied with the
14 ADOLESCENTS, DIETS AND NUTRITION
Screen time: <2 hours of screen time per day
Physical activity:
1. At least 60 minutes of moderate- to vigorous-
intensity physical activity daily
2. Most of the daily physical activity should be
aerobic
3. Vigorous-intensity activities should be
incorporated, including those that strengthen
muscle and bone (such as running, jumping),
at least 3 times per week
Analysis of decision
making
In the CNNS questionnaire four questions
pertaining to girl’s decision making about her life
choices were probed. These questions relate to:
1. Duration of schooling
2. Making independent purchases (going to
market)
3. Whom to marry, and
4. Age of marriage
We present the proportion of girls 10 to 14 years
and 15 to 19 years, who responded positively on
these four questions and state-wide variations in
these proportions.
Analysis of school-based
health and nutrition
services access
Schools are mandated to provide at least four
health, food security and nutrition services
under the Anemia Mukt Bharat, Rashtriya Bal
Swasthya Karyakram, Rashtriya Kishore Swasthya
Karyakram and mid-day meal scheme. The
services are – 1) weekly IFA supplementation, 2)
bi-annual deworming, 3) bi-annual health check-
ups with counselling and referral and 4) mid-day
hot cooked meal.
We present the proportion of school-going
adolescent girls and boys receiving these services
for 10 to 14 years and 15 to 19 years age-group.
We then present the state-wide variations in
receipt of these services. Finally, we assess
what proportion of girls and boys receive a
combination of services.
Domain Activities as per the CNNS
Sitting time
Travel to school
Screen time
Leisure time physical activity
Outdoor sports/exercise/ physical
activity at school
Sitting, doing homework, reading, study, tuition, eating, chatting
Travel by walking/cycling, bus/school/auto/metro
Watching TV, playing on computer, using smart phones
Listening/singing music, play indoor games, paying musical instrument, art
and craft, painting, drawing, bike riding/scooter, playing with pet, household
work (cleaning house, watering plants, washing utensils, washing clothes,
pressing clothes, kitchen work)
Football, basketball, volleyball, cricket, dancing, hockey, martial arts, rugby/
kabbadi, running/jogging, swimming, cycling, tennis/badminton/squash,
dancing, walk for exercise, stretching exercise, yoga, gym, aerobics, skipping
15The CNNS Thematic Reports, Issue 1, 2019
3 Findings
3.1 How many adolescents suffer from visible forms of
malnutrition?
Key messages
Every third adolescent girl and every fourth adolescent boy 10-19 years is too short for their
age.
More boys than girls are thin for their age in both 10-14 years age-group (32% boys, 23%
girls) and 15-19 years age-group (26% boys, 14% girls). Highest prevalence of thinness is
seen between 10-12 years for both boys and girls.
In 10-14 years age-group, one in two short girls and one in three short boys, are also thin.
5% adolescents 10-14 years and 4% adolescents 15-19 years are overweight.
In most states of India at least 1 in 5 girls and boys are too short for their age. Thinness in
adolescence is a problem of public health concern in most Indian states. Twelve states have
overweight/obesity prevalence over 10% in 10-14 years age-group itself. Within states, there
is variation in prevalence of malnutrition between 10-14-year olds and 15-19 year olds. For
example, in Bihar 18% girls are short in 15-19-years age-group, this increases to 36% in
10-14 years age-group. In Telangana, this trend is reverse with fewer short girls 10-14 years
(17%) compared to 44% shorter girls 15-19 years.
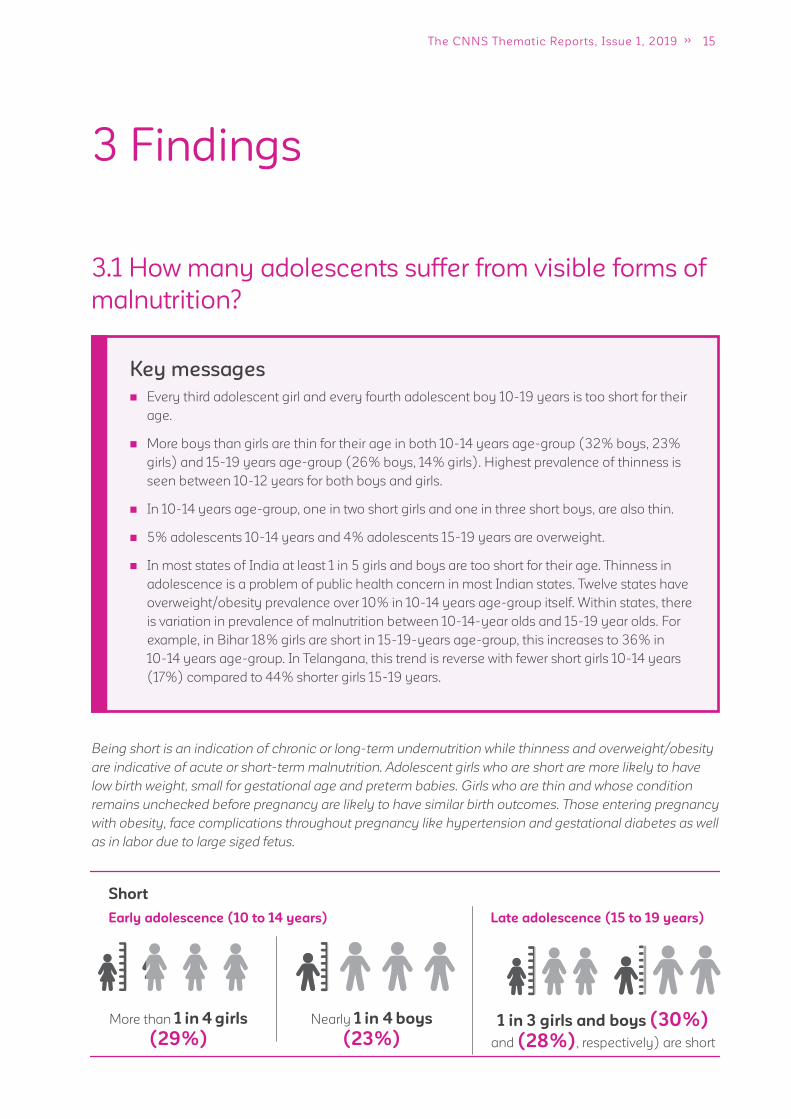
Being short is an indication of chronic or long-term undernutrition while thinness and overweight/obesity
are indicative of acute or short-term malnutrition. Adolescent girls who are short are more likely to have
low birth weight, small for gestational age and preterm babies. Girls who are thin and whose condition
remains unchecked before pregnancy are likely to have similar birth outcomes. Those entering pregnancy
with obesity, face complications throughout pregnancy like hypertension and gestational diabetes as well
as in labor due to large sized fetus.
1 in 3 girls and boys (30%)
and (28%), respectively) are short
Short
Early adolescence (10 to 14 years)
More than 1 in 4 girls
(29%)
Nearly 1 in 4 boys
(23%)
Late adolescence (15 to 19 years)
16 ADOLESCENTS, DIETS AND NUTRITION
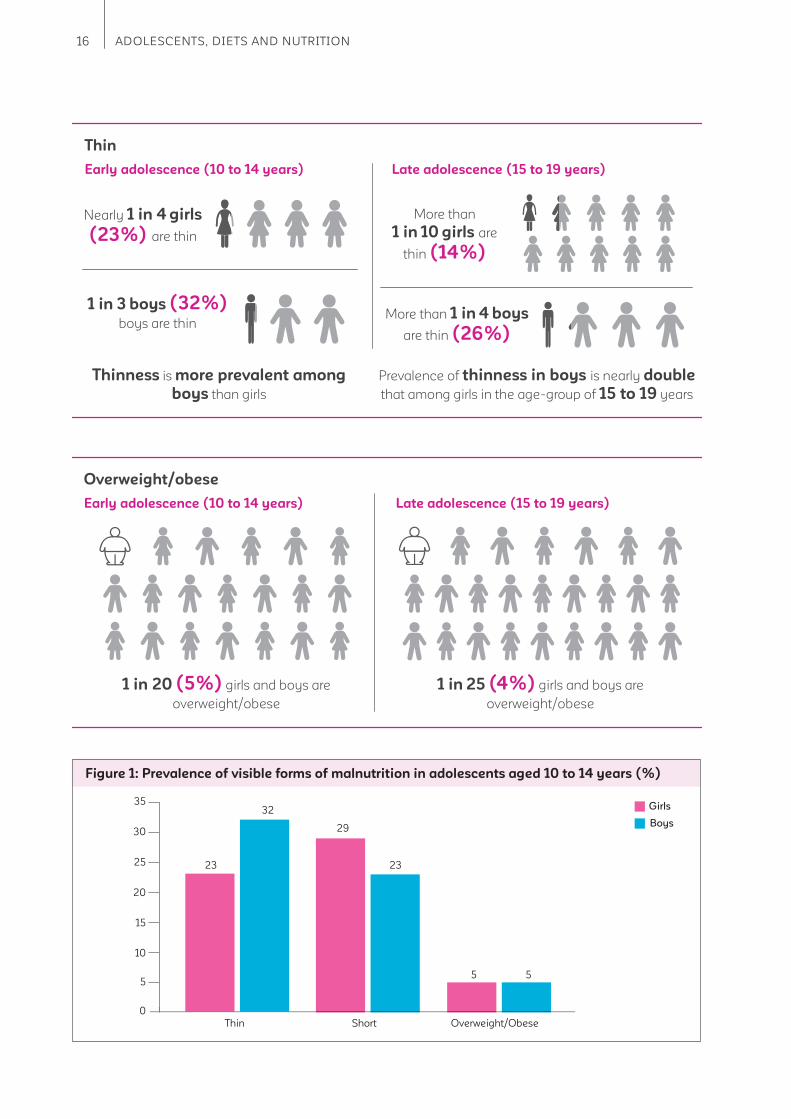
Thin
Early adolescence (10 to 14 years)
Overweight/obese
Early adolescence (10 to 14 years)
Nearly 1 in 4 girls
(23%) are thin
More than
1 in 10 girls are
thin (14%)
1 in 3 boys (32%) boys are thin
More than 1 in 4 boys
are thin (26%)
Late adolescence (15 to 19 years)
Thinness is more prevalent among
boys than girls
Prevalence of thinness in boys is nearly double
that among girls in the age-group of 15 to 19 years
1 in 20 (5%) girls and boys are
overweight/obese
1 in 25 (4%) girls and boys are
overweight/obese
Late adolescence (15 to 19 years)
Figure 1: Prevalence of visible forms of malnutrition in adolescents aged 10 to 14 years (%)
35
23 23
32
2930
25
20
15
10
55 5
0
Girls
Boys
Thin Short Overweight/Obese
17The CNNS Thematic Reports, Issue 1, 2019
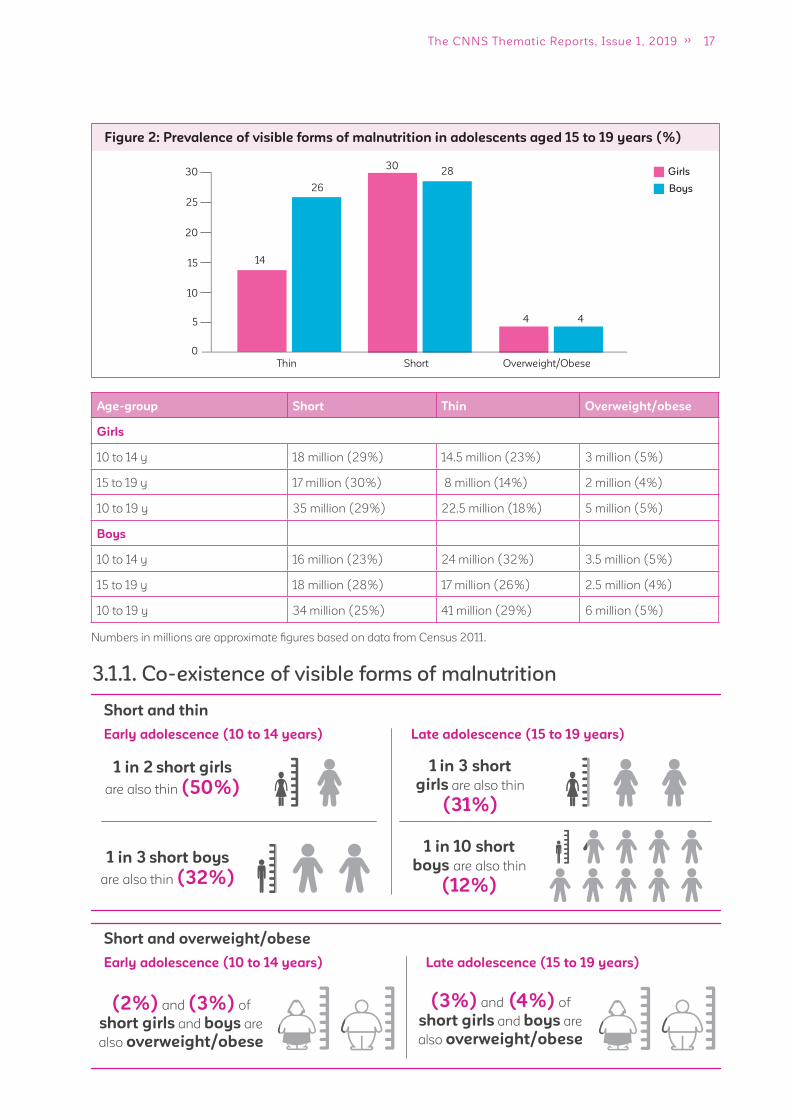
3.1.1. Co-existence of visible forms of malnutrition
Age-group Short Thin Overweight/obese
Girls
10 to 14 y 18 million (29%) 14.5 million (23%) 3 million (5%)
15 to 19 y 17 million (30%) 8 million (14%) 2 million (4%)
10 to 19 y 35 million (29%) 22.5 million (18%) 5 million (5%)
Boys
10 to 14 y 16 million (23%) 24 million (32%) 3.5 million (5%)
15 to 19 y 18 million (28%) 17 million (26%) 2.5 million (4%)
10 to 19 y 34 million (25%) 41 million (29%) 6 million (5%)
Figure 2: Prevalence of visible forms of malnutrition in adolescents aged 15 to 19 years (%)
Girls
Boys
14
28
26
3030
25
20
15
10
5 4 4
0
Thin Short Overweight/Obese
Short and thin
Early adolescence (10 to 14 years)
1 in 2 short girls
are also thin (50%)
1 in 3 short
girls are also thin
(31%)
1 in 3 short boys
are also thin (32%)
1 in 10 short
boys are also thin
(12%)
Late adolescence (15 to 19 years)
Short and overweight/obese
Early adolescence (10 to 14 years)
(2%) and (3%) of
short girls and boys are
also overweight/obese
(3%) and (4%) of
short girls and boys are
also overweight/obese
Late adolescence (15 to 19 years)
Numbers in millions are approximate fi gures based on data from Census 2011.
18 ADOLESCENTS, DIETS AND NUTRITION
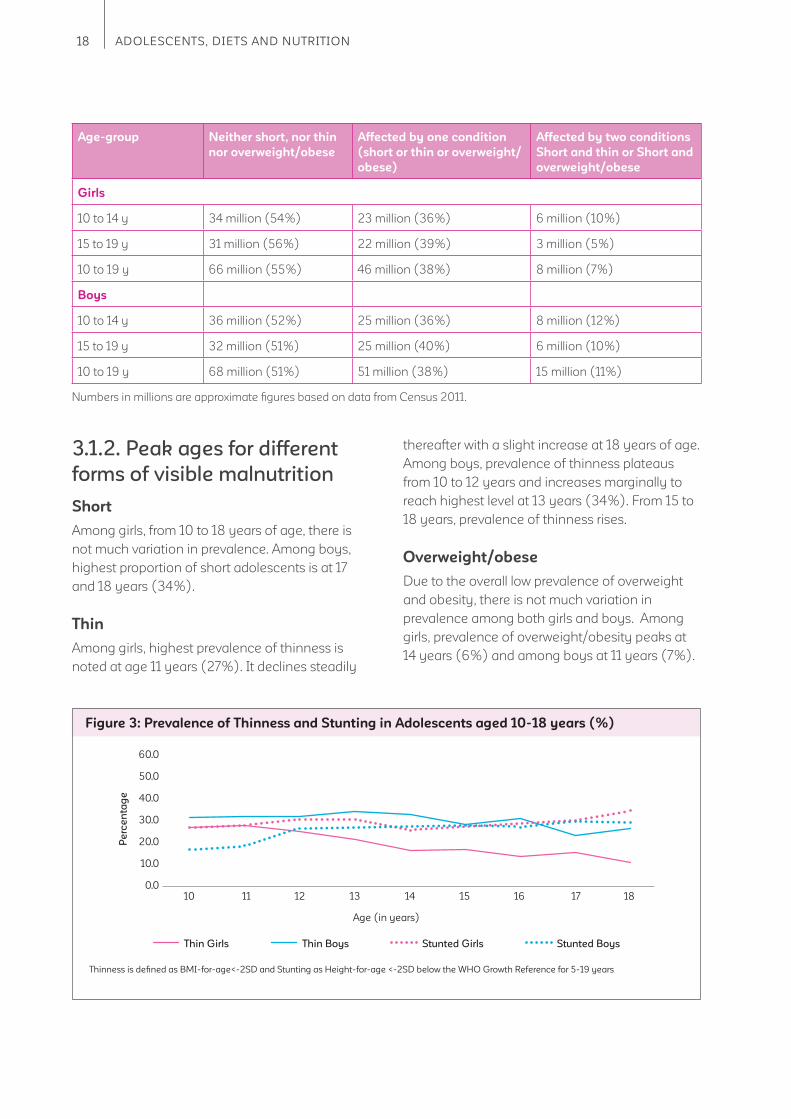
3.1.2. Peak ages for different
forms of visible malnutrition
Short
Among girls, from 10 to 18 years of age, there is
not much variation in prevalence. Among boys,
highest proportion of short adolescents is at 17
and 18 years (34%).
Thin
Among girls, highest prevalence of thinness is
noted at age 11 years (27%). It declines steadily
thereafter with a slight increase at 18 years of age.
Among boys, prevalence of thinness plateaus
from 10 to 12 years and increases marginally to
reach highest level at 13 years (34%). From 15 to
18 years, prevalence of thinness rises.
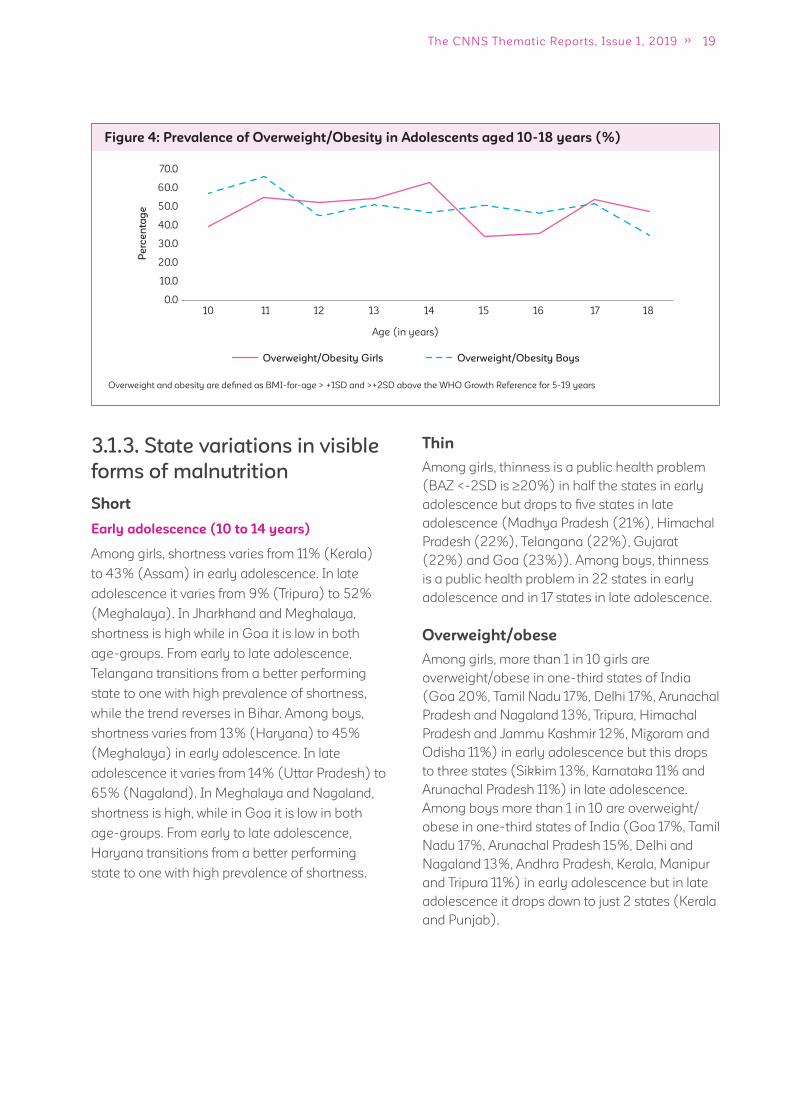
Overweight/obese
Due to the overall low prevalence of overweight
and obesity, there is not much variation in
prevalence among both girls and boys. Among
girls, prevalence of overweight/obesity peaks at
14 years (6%) and among boys at 11 years (7%).
Figure 3: Prevalence of Thinness and Stunting in Adolescents aged 10-18 years (%)
Thin Girls Thin Boys Stunted Girls Stunted Boys
Age (in years)
60.0
50.0
40.0
30.0
20.0
10.0
0.010 11 12 13 14 15 16 17 18
Pe
rce
nta
ge
Thinness is defi ned as BMI-for-age<-2SD and Stunting as Height-for-age <-2SD below the WHO Growth Reference for 5-19 years
Age-group Neither short, nor thin
nor overweight/obese
Affected by one condition
(short or thin or overweight/
obese)
Affected by two conditions
Short and thin or Short and
overweight/obese
Girls
10 to 14 y 34 million (54%) 23 million (36%) 6 million (10%)
15 to 19 y 31 million (56%) 22 million (39%) 3 million (5%)
10 to 19 y 66 million (55%) 46 million (38%) 8 million (7%)
Boys
10 to 14 y 36 million (52%) 25 million (36%) 8 million (12%)
15 to 19 y 32 million (51%) 25 million (40%) 6 million (10%)
10 to 19 y 68 million (51%) 51 million (38%) 15 million (11%)
Numbers in millions are approximate fi gures based on data from Census 2011.
19The CNNS Thematic Reports, Issue 1, 2019
3.1.3. State variations in visible
forms of malnutrition
Short
Early adolescence (10 to 14 years)
Among girls, shortness varies from 11% (Kerala)
to 43% (Assam) in early adolescence. In late
adolescence it varies from 9% (Tripura) to 52%
(Meghalaya). In Jharkhand and Meghalaya,
shortness is high while in Goa it is low in both
age-groups. From early to late adolescence,
Telangana transitions from a better performing
state to one with high prevalence of shortness,
while the trend reverses in Bihar. Among boys,
shortness varies from 13% (Haryana) to 45%
(Meghalaya) in early adolescence. In late
adolescence it varies from 14% (Uttar Pradesh) to
65% (Nagaland). In Meghalaya and Nagaland,
shortness is high, while in Goa it is low in both
age-groups. From early to late adolescence,
Haryana transitions from a better performing
state to one with high prevalence of shortness.
Thin
Among girls, thinness is a public health problem
(BAZ <-2SD is 20%) in half the states in early
adolescence but drops to fi ve states in late
adolescence (Madhya Pradesh (21%), Himachal
Pradesh (22%), Telangana (22%), Gujarat
(22%) and Goa (23%)). Among boys, thinness
is a public health problem in 22 states in early
adolescence and in 17 states in late adolescence.
Overweight/obese
Among girls, more than 1 in 10 girls are
overweight/obese in one-third states of India
(Goa 20%, Tamil Nadu 17%, Delhi 17%, Arunachal
Pradesh and Nagaland 13%, Tripura, Himachal
Pradesh and Jammu Kashmir 12%, Mizoram and
Odisha 11%) in early adolescence but this drops
to three states (Sikkim 13%, Karnataka 11% and
Arunachal Pradesh 11%) in late adolescence.
Among boys more than 1 in 10 are overweight/
obese in one-third states of India (Goa 17%, Tamil
Nadu 17%, Arunachal Pradesh 15%, Delhi and
Nagaland 13%, Andhra Pradesh, Kerala, Manipur
and Tripura 11%) in early adolescence but in late
adolescence it drops down to just 2 states (Kerala
and Punjab).
Figure 4: Prevalence of Overweight/Obesity in Adolescents aged 10-18 years (%)
Overweight/Obesity Girls Overweight/Obesity Boys
Age (in years)
Overweight and obesity are defi ned as BMI-for-age > +1SD and >+2SD above the WHO Growth Reference for 5-19 years
70.0
60.0
50.0
40.0
30.0
20.0
10.0
0.010 11 12 13 14 15 16 17 18
Pe
rce
nta
ge
20 ADOLESCENTS, DIETS AND NUTRITION
States Adolescent Girls Adolescent Boys
Thin Short Overweight/
Obese
Thin Short Overweight/
Obese
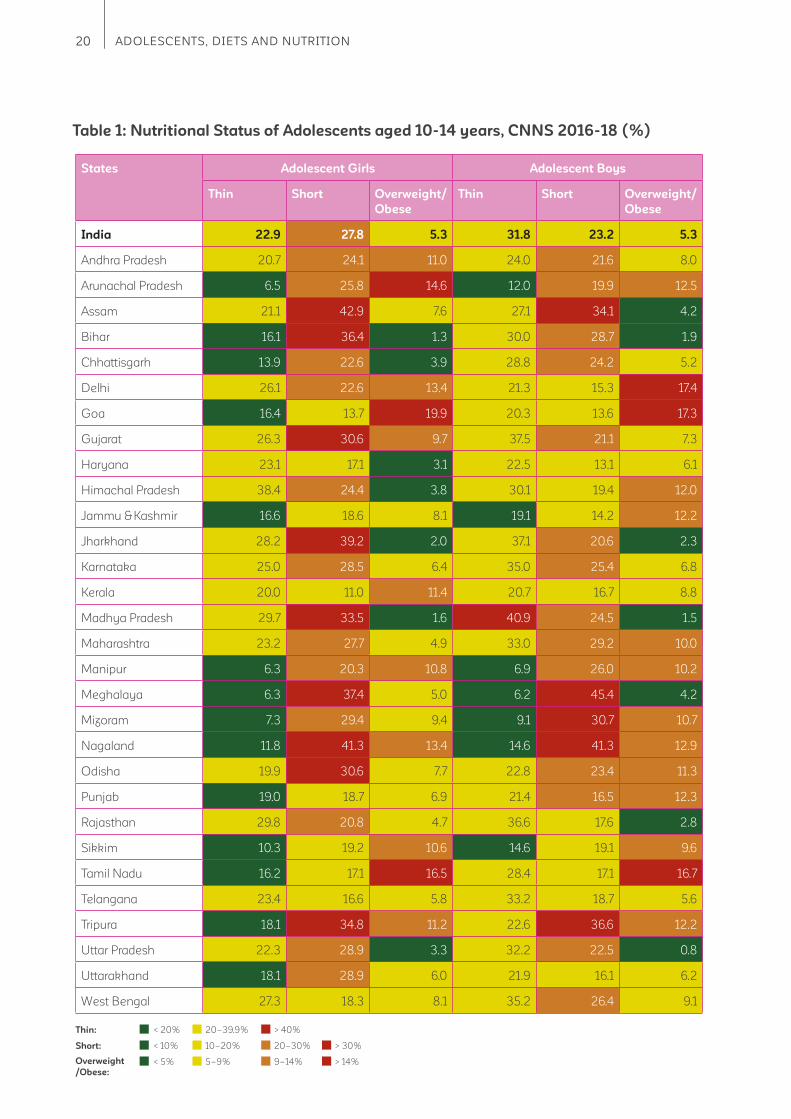
India 22.9 27.8 5.3 31.8 23.2 5.3
Andhra Pradesh 20.7 24.1 11.0 24.0 21.6 8.0
Arunachal Pradesh 6.5 25.8 14.6 12.0 19.9 12.5
Assam 21.1 42.9 7.6 27.1 34.1 4.2
Bihar 16.1 36.4 1.3 30.0 28.7 1.9
Chhattisgarh 13.9 22.6 3.9 28.8 24.2 5.2
Delhi 26.1 22.6 13.4 21.3 15.3 17.4
Goa 16.4 13.7 19.9 20.3 13.6 17.3
Gujarat 26.3 30.6 9.7 37.5 21.1 7.3
Haryana 23.1 17.1 3.1 22.5 13.1 6.1
Himachal Pradesh 38.4 24.4 3.8 30.1 19.4 12.0
Jammu & Kashmir 16.6 18.6 8.1 19.1 14.2 12.2
Jharkhand 28.2 39.2 2.0 37.1 20.6 2.3
Karnataka 25.0 28.5 6.4 35.0 25.4 6.8
Kerala 20.0 11.0 11.4 20.7 16.7 8.8
Madhya Pradesh 29.7 33.5 1.6 40.9 24.5 1.5
Maharashtra 23.2 27.7 4.9 33.0 29.2 10.0
Manipur 6.3 20.3 10.8 6.9 26.0 10.2
Meghalaya 6.3 37.4 5.0 6.2 45.4 4.2
Mizoram 7.3 29.4 9.4 9.1 30.7 10.7
Nagaland 11.8 41.3 13.4 14.6 41.3 12.9
Odisha 19.9 30.6 7.7 22.8 23.4 11.3
Punjab 19.0 18.7 6.9 21.4 16.5 12.3
Rajasthan 29.8 20.8 4.7 36.6 17.6 2.8
Sikkim 10.3 19.2 10.6 14.6 19.1 9.6
Tamil Nadu 16.2 17.1 16.5 28.4 17.1 16.7
Telangana 23.4 16.6 5.8 33.2 18.7 5.6
Tripura 18.1 34.8 11.2 22.6 36.6 12.2
Uttar Pradesh 22.3 28.9 3.3 32.2 22.5 0.8
Uttarakhand 18.1 28.9 6.0 21.9 16.1 6.2
West Bengal 27.3 18.3 8.1 35.2 26.4 9.1
Table 1: Nutritional Status of Adolescents aged 10-14 years, CNNS 2016-18 (%)
< 20%
< 10%
< 5%
20–39.9%
10–20%
5–9%
20–30%
9–14%
> 40%
> 30%
> 14%
Thin:
Short:
Overweight
/Obese:
21The CNNS Thematic Reports, Issue 1, 2019
States Adolescent Girls Adolescent Boys
Thin Short Overweight/
Obese
Thin Short Overweight/
Obese
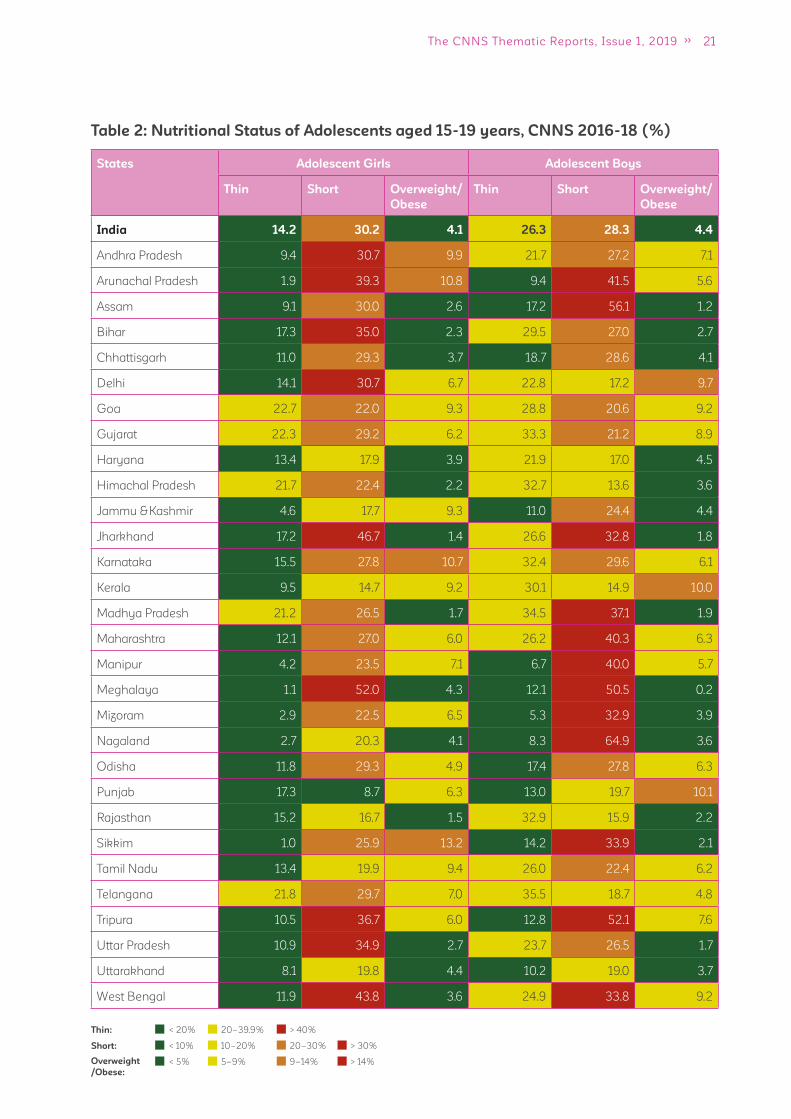
India 14.2 30.2 4.1 26.3 28.3 4.4
Andhra Pradesh 9.4 30.7 9.9 21.7 27.2 7.1
Arunachal Pradesh 1.9 39.3 10.8 9.4 41.5 5.6
Assam 9.1 30.0 2.6 17.2 56.1 1.2
Bihar 17.3 35.0 2.3 29.5 27.0 2.7
Chhattisgarh 11.0 29.3 3.7 18.7 28.6 4.1
Delhi 14.1 30.7 6.7 22.8 17.2 9.7
Goa 22.7 22.0 9.3 28.8 20.6 9.2
Gujarat 22.3 29.2 6.2 33.3 21.2 8.9
Haryana 13.4 17.9 3.9 21.9 17.0 4.5
Himachal Pradesh 21.7 22.4 2.2 32.7 13.6 3.6
Jammu & Kashmir 4.6 17.7 9.3 11.0 24.4 4.4
Jharkhand 17.2 46.7 1.4 26.6 32.8 1.8
Karnataka 15.5 27.8 10.7 32.4 29.6 6.1
Kerala 9.5 14.7 9.2 30.1 14.9 10.0
Madhya Pradesh 21.2 26.5 1.7 34.5 37.1 1.9
Maharashtra 12.1 27.0 6.0 26.2 40.3 6.3
Manipur 4.2 23.5 7.1 6.7 40.0 5.7
Meghalaya 1.1 52.0 4.3 12.1 50.5 0.2
Mizoram 2.9 22.5 6.5 5.3 32.9 3.9
Nagaland 2.7 20.3 4.1 8.3 64.9 3.6
Odisha 11.8 29.3 4.9 17.4 27.8 6.3
Punjab 17.3 8.7 6.3 13.0 19.7 10.1
Rajasthan 15.2 16.7 1.5 32.9 15.9 2.2
Sikkim 1.0 25.9 13.2 14.2 33.9 2.1
Tamil Nadu 13.4 19.9 9.4 26.0 22.4 6.2
Telangana 21.8 29.7 7.0 35.5 18.7 4.8
Tripura 10.5 36.7 6.0 12.8 52.1 7.6
Uttar Pradesh 10.9 34.9 2.7 23.7 26.5 1.7
Uttarakhand 8.1 19.8 4.4 10.2 19.0 3.7
West Bengal 11.9 43.8 3.6 24.9 33.8 9.2
Table 2: Nutritional Status of Adolescents aged 15-19 years, CNNS 2016-18 (%)
< 20%
< 10%
< 5%
20–39.9%
10–20%
5–9%
20–30%
9–14%
> 40%
> 30%
> 14%
Thin:
Short:
Overweight
/Obese:
22 ADOLESCENTS, DIETS AND NUTRITION
Key messages
Anemia and iron defi ciency is one-fold higher in girls compared to boys.
Anemia affects 32% girls 10-14 years and 48% girls 15-19 years. Among boys 10-19
years, ~20% are anemic.
Iron defi ciency affects 24% girls 10-14 years and 39% girls 15-19 years. ~10% boys 10-19
years are iron defi cient.
Every third adolescent girl is B12
or folate defi cient. More boys 15-19 years compared to girls
15-19 years are defi cient in B12
, (41% boys, 28% girls) and folate (44% boys, 32% girls).
Every fi fth adolescent 10-14-years and every tenth adolescent 15-19 years is Vitamin A
defi cient.
There is three-fold higher vitamin D defi ciency in girls compared to boys (every third girl
and every tenth boy affected). Vitamin D defi ciency is higher in early adolescence (10 to 14
years) among both girls and boys.
At least one in three adolescents are defi cient in zinc.
Out of the six micronutrient defi ciencies studied, the most common form of hidden
malnutrition among adolescent girls is vitamin D defi ciency, followed by folate and iron
defi ciency. Among adolescent boys, the highest burden is of folate defi ciency, followed
by vitamin B12
and zinc defi ciency. Double burden of anemia and thinness among girls is
twice more than boys in early adolescence (10 to 14 years) and four times higher in late
adolescence (15 to 19 years).
Punjab is the only state to have high proportions of adolescents affected by fi ve different
micronutrient defi ciencies (iron, vitamin B12
, vitamin D, vitamin A and zinc).
Of the six micronutrient defi ciencies studied, only 14% girls and 21% boys had no
micronutrient defi ciency and over 50% of them suffered from at least two defi ciencies.
3.2 How many adolescents suffer from anemia and
micronutrient defi ciencies?
Anemia
Anemia is caused by inadequate bioavailability of micronutrients (iron, folate, and vitamin B12
); parasitic
infections such as malaria and helminthic infestation of hookworms and other parasitic worms and
fl ukes; genetic hemoglobinopathies such as thalassemia and sickle cell disease; chronic infection and
infl ammation; and chronic disease conditions such as renal failure15,16,17. Anemia results in fatigue, poor
productivity and predisposition to infections. Girls who enter pregnancy with anemia are at increased
risk of hemorrhaging during labor; babies may be low birth weight or premature. A prevalence of 40% is
considered a severe public health problem, 20 to 39.9% a moderate public health problem, 5 to 19.9% a
mild public health problem and less than 5% as not a public health problem18.
23The CNNS Thematic Reports, Issue 1, 2019
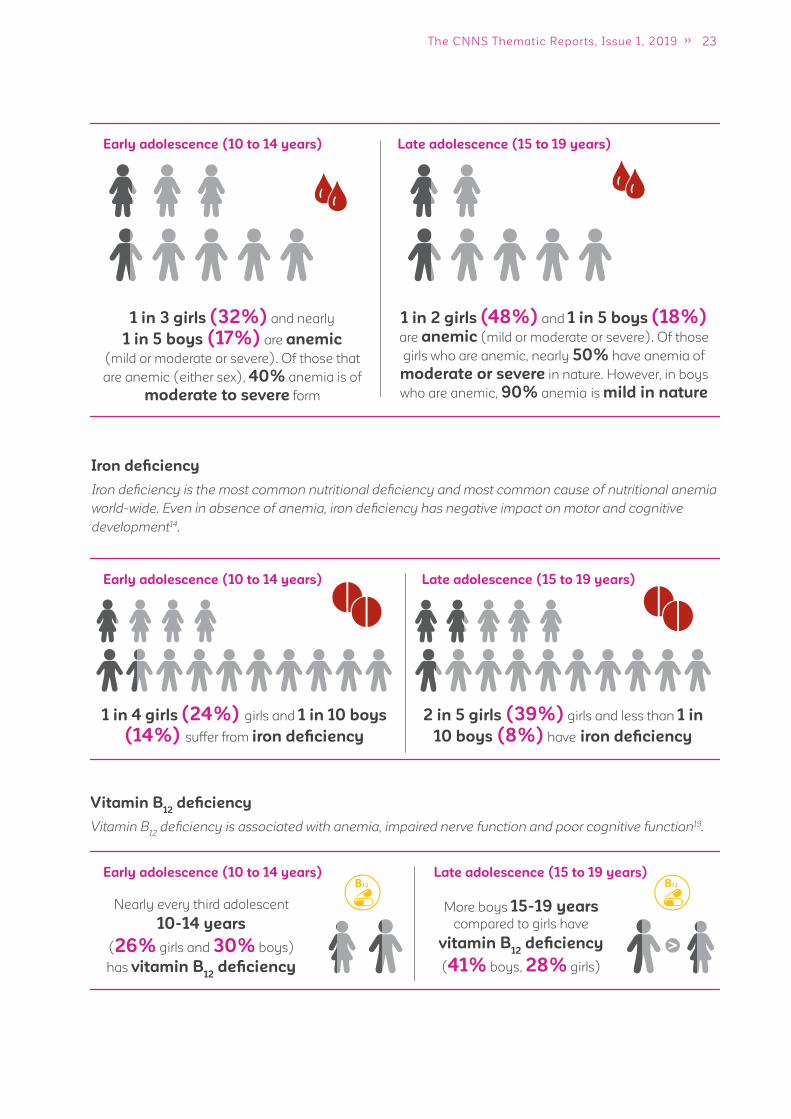
Early adolescence (10 to 14 years) Late adolescence (15 to 19 years)
1 in 3 girls (32%) and nearly
1 in 5 boys (17%) are anemic
(mild or moderate or severe). Of those that
are anemic (either sex), 40% anemia is of
moderate to severe form
1 in 2 girls (48%) and 1 in 5 boys (18%)
are anemic (mild or moderate or severe). Of those
girls who are anemic, nearly 50% have anemia of
moderate or severe in nature. However, in boys
who are anemic, 90% anemia is mild in nature
Iron defi ciency
Iron defi ciency is the most common nutritional defi ciency and most common cause of nutritional anemia
world-wide. Even in absence of anemia, iron defi ciency has negative impact on motor and cognitive
development14.
Early adolescence (10 to 14 years)
Early adolescence (10 to 14 years)
Late adolescence (15 to 19 years)
Late adolescence (15 to 19 years)
1 in 4 girls (24%) girls and 1 in 10 boys
(14%) suffer from iron defi ciency
Nearly every third adolescent
10-14 years
(26% girls and 30% boys)
has vitamin B12
defi ciency
More boys 15-19 years
compared to girls have
vitamin B12
defi ciency
(41% boys, 28% girls)
2 in 5 girls (39%) girls and less than 1 in
10 boys (8%) have iron defi ciency
Vitamin B12
defi ciency
Vitamin B12
defi ciency is associated with anemia, impaired nerve function and poor cognitive function19.
24 ADOLESCENTS, DIETS AND NUTRITION
Early adolescence (10 to 14 years) Late adolescence (15 to 19 years)
Every third girl and boy
10-14 years has
folate defi ciency
1 in 3 girls (32%) girls and
2 in 5 boys (44%) boys
have folate defi ciency
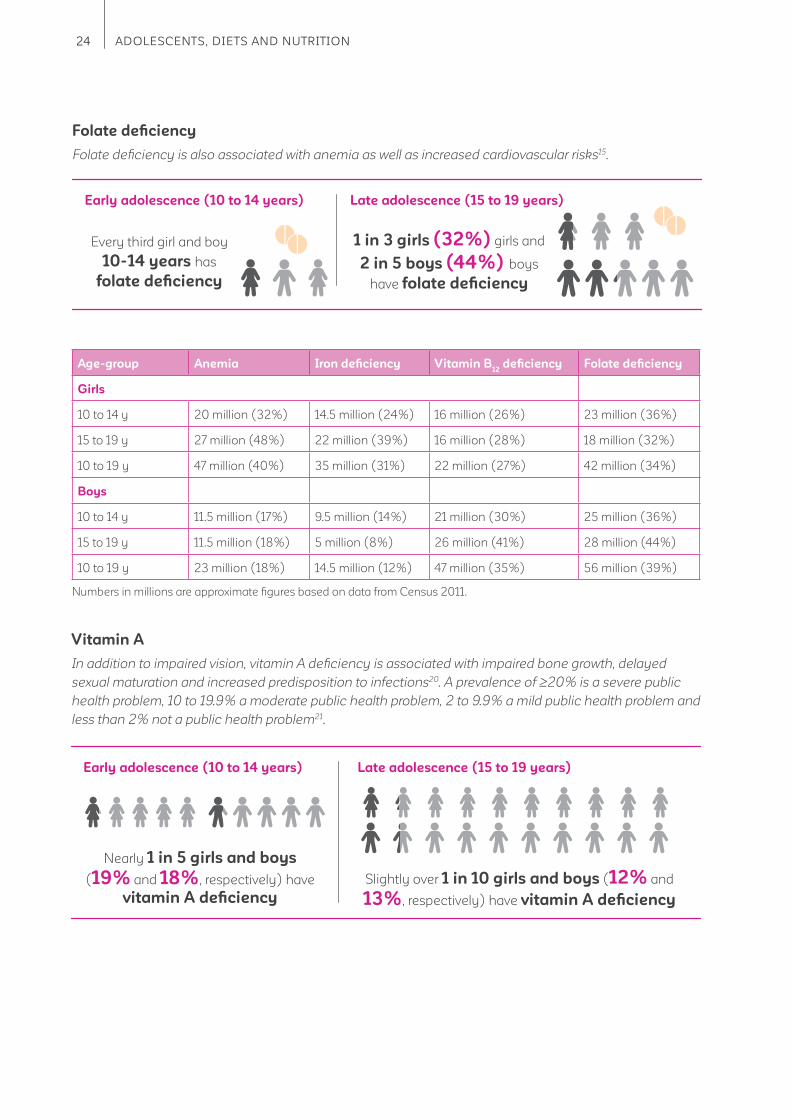
Folate defi ciency
Folate defi ciency is also associated with anemia as well as increased cardiovascular risks15.
Age-group Anemia Iron defi ciency Vitamin B12
defi ciency Folate defi ciency
Girls
10 to 14 y 20 million (32%) 14.5 million (24%) 16 million (26%) 23 million (36%)
15 to 19 y 27 million (48%) 22 million (39%) 16 million (28%) 18 million (32%)
10 to 19 y 47 million (40%) 35 million (31%) 22 million (27%) 42 million (34%)
Boys
10 to 14 y 11.5 million (17%) 9.5 million (14%) 21 million (30%) 25 million (36%)
15 to 19 y 11.5 million (18%) 5 million (8%) 26 million (41%) 28 million (44%)
10 to 19 y 23 million (18%) 14.5 million (12%) 47 million (35%) 56 million (39%)
Vitamin A
In addition to impaired vision, vitamin A defi ciency is associated with impaired bone growth, delayed
sexual maturation and increased predisposition to infections20. A prevalence of 20% is a severe public
health problem, 10 to 19.9% a moderate public health problem, 2 to 9.9% a mild public health problem and
less than 2% not a public health problem21.
Early adolescence (10 to 14 years) Late adolescence (15 to 19 years)
Nearly 1 in 5 girls and boys
(19% and 18%, respectively) have
vitamin A defi ciency
Slightly over 1 in 10 girls and boys (12% and
13%, respectively) have vitamin A defi ciency
Numbers in millions are approximate fi gures based on data from Census 2011.
25The CNNS Thematic Reports, Issue 1, 2019
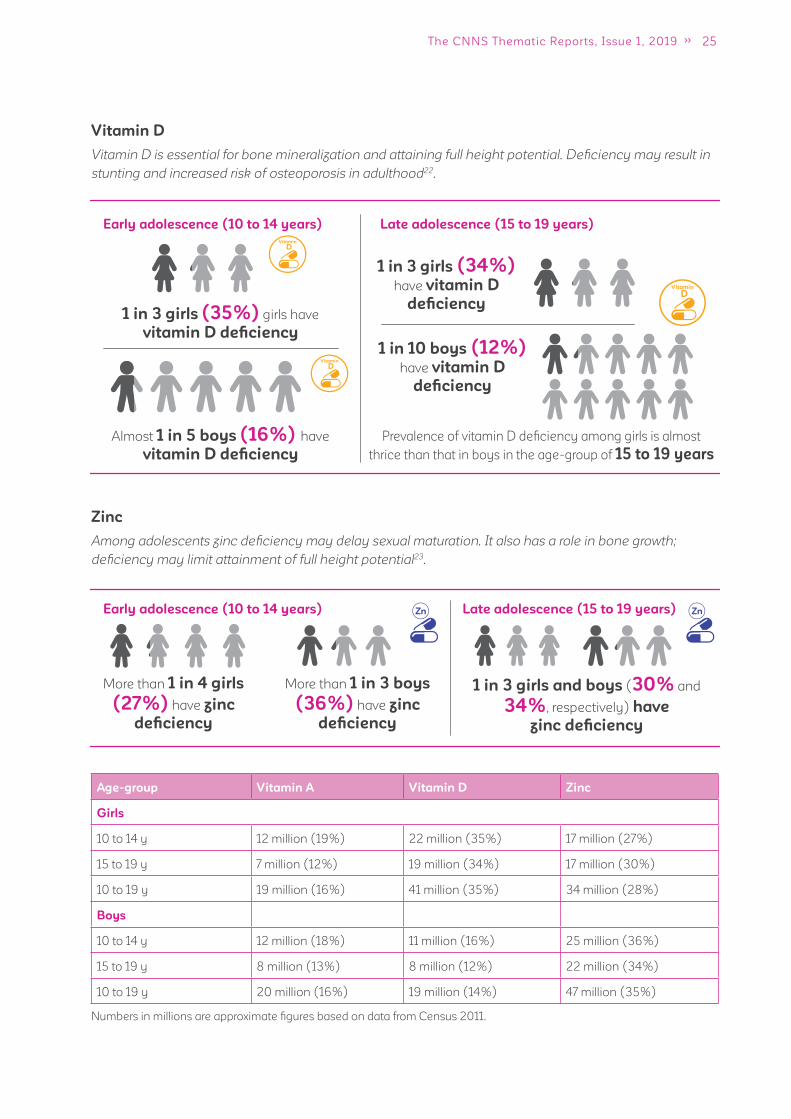
Vitamin D
Vitamin D is essential for bone mineralization and attaining full height potential. Defi ciency may result in
stunting and increased risk of osteoporosis in adulthood22.
Early adolescence (10 to 14 years)
Early adolescence (10 to 14 years)
1 in 3 girls (35%) girls have
vitamin D defi ciency
More than 1 in 4 girls
(27%) have zinc
defi ciency
More than 1 in 3 boys
(36%) have zinc
defi ciency
1 in 3 girls and boys (30% and
34%, respectively) have
zinc defi ciency
1 in 3 girls (34%)
have vitamin D
defi ciency
Almost 1 in 5 boys (16%) have
vitamin D defi ciency
1 in 10 boys (12%) have vitamin D
defi ciency
Late adolescence (15 to 19 years)
Late adolescence (15 to 19 years)
Prevalence of vitamin D defi ciency among girls is almost
thrice than that in boys in the age-group of 15 to 19 years
Zinc
Among adolescents zinc defi ciency may delay sexual maturation. It also has a role in bone growth;
defi ciency may limit attainment of full height potential23.
Age-group Vitamin A Vitamin D Zinc
Girls
10 to 14 y 12 million (19%) 22 million (35%) 17 million (27%)
15 to 19 y 7 million (12%) 19 million (34%) 17 million (30%)
10 to 19 y 19 million (16%) 41 million (35%) 34 million (28%)
Boys
10 to 14 y 12 million (18%) 11 million (16%) 25 million (36%)
15 to 19 y 8 million (13%) 8 million (12%) 22 million (34%)
10 to 19 y 20 million (16%) 19 million (14%) 47 million (35%)
Numbers in millions are approximate fi gures based on data from Census 2011.
26 ADOLESCENTS, DIETS AND NUTRITION
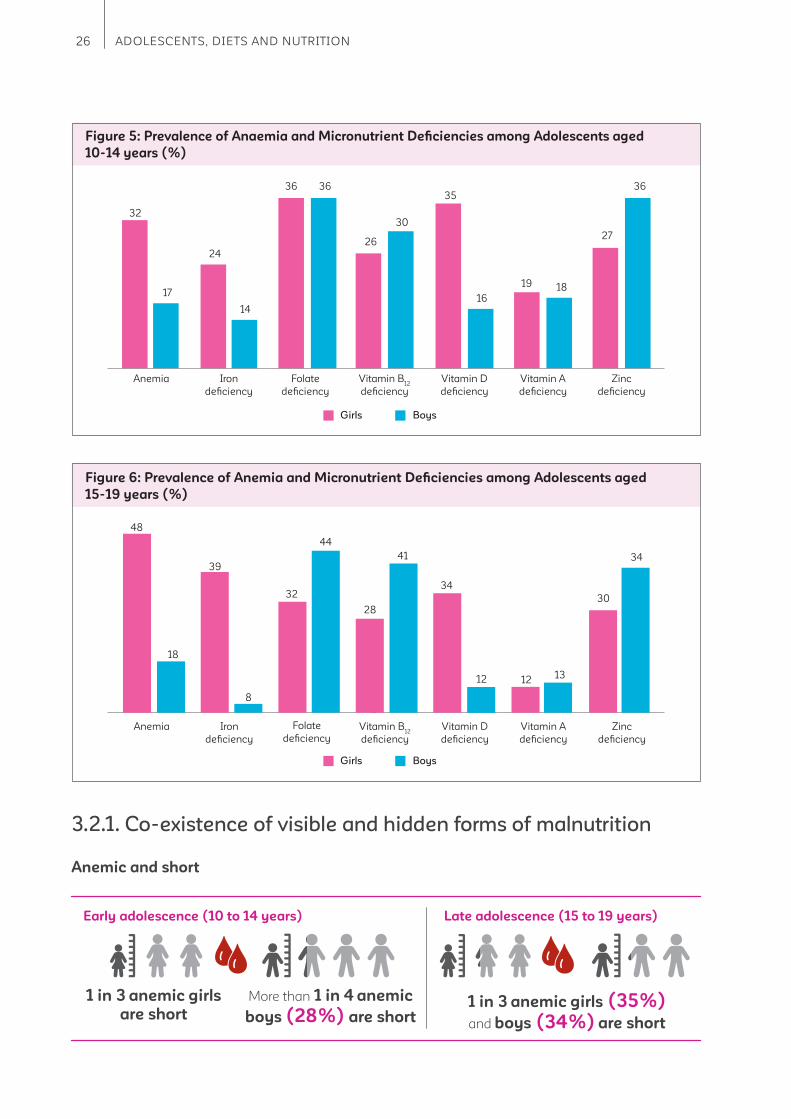
Figure 5: Prevalence of Anaemia and Micronutrient Defi ciencies among Adolescents aged
10-14 years (%)
Girls Boys
32
17
24
27
36
26
36 36
30
35
16
19 18
14
Anemia Iron
defi ciency
Folate
defi ciency
Vitamin B12
defi ciency
Vitamin D
defi ciency
Vitamin A
defi ciency
Zinc
defi ciency
Figure 6: Prevalence of Anemia and Micronutrient Defi ciencies among Adolescents aged
15-19 years (%)
Girls Boys
48
44
41
34
12 1213
30
34
8
18
39
32
28
Anemia Iron
defi ciency
Folate
defi ciency
Vitamin B12
defi ciency
Vitamin D
defi ciency
Vitamin A
defi ciency
Zinc
defi ciency
3.2.1. Co-existence of visible and hidden forms of malnutrition
Early adolescence (10 to 14 years)
1 in 3 anemic girls
are short
More than 1 in 4 anemic
boys (28%) are short1 in 3 anemic girls (35%)
and boys (34%) are short
Late adolescence (15 to 19 years)
Anemic and short
27The CNNS Thematic Reports, Issue 1, 2019
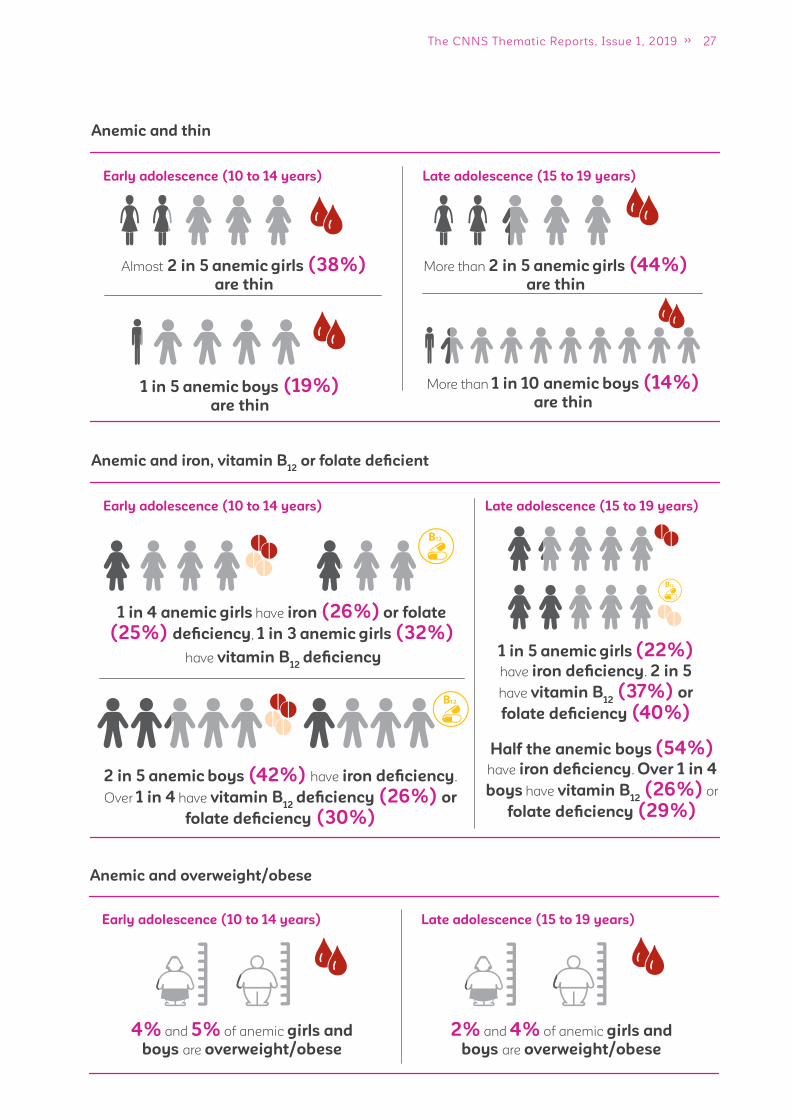
Anemic and thin
Anemic and iron, vitamin B12
or folate defi cient
Early adolescence (10 to 14 years)
Almost 2 in 5 anemic girls (38%)
are thin
More than 2 in 5 anemic girls (44%)
are thin
1 in 5 anemic boys (19%)
are thin
More than 1 in 10 anemic boys (14%)
are thin
Late adolescence (15 to 19 years)
Early adolescence (10 to 14 years)
1 in 4 anemic girls have iron (26%) or folate
(25%) defi ciency, 1 in 3 anemic girls (32%)
have vitamin B12
defi ciency 1 in 5 anemic girls (22%)
have iron defi ciency. 2 in 5
have vitamin B12
(37%) or
folate defi ciency (40%)
2 in 5 anemic boys (42%) have iron defi ciency.
Over 1 in 4 have vitamin B12
defi ciency (26%) or
folate defi ciency (30%)
Late adolescence (15 to 19 years)
Half the anemic boys (54%)
have iron defi ciency. Over 1 in 4
boys have vitamin B12
(26%) or
folate defi ciency (29%)
Anemic and overweight/obese
Early adolescence (10 to 14 years)
4% and 5% of anemic girls and
boys are overweight/obese
2% and 4% of anemic girls and
boys are overweight/obese
Late adolescence (15 to 19 years)
28 ADOLESCENTS, DIETS AND NUTRITION
Micronutrient
defi ciencies (N)
0 1 2 3 4 5 6
Girls
10 to 14 y 14% 86% 51% 22% 6% 1% 0%
15 to 19 y 14% 86% 51% 21% 6% 1% 0%
10 to 19 y 14% 86% 51% 21% 6% 1% 0%
Boys
10 to 14 y 21% 79% 44% 12% 2% 0% 0%
15 to 19 y 22% 78% 42% 14% 2% 0% 0%
10 to 19 y 21% 79% 43% 13% 2% 0% 0%
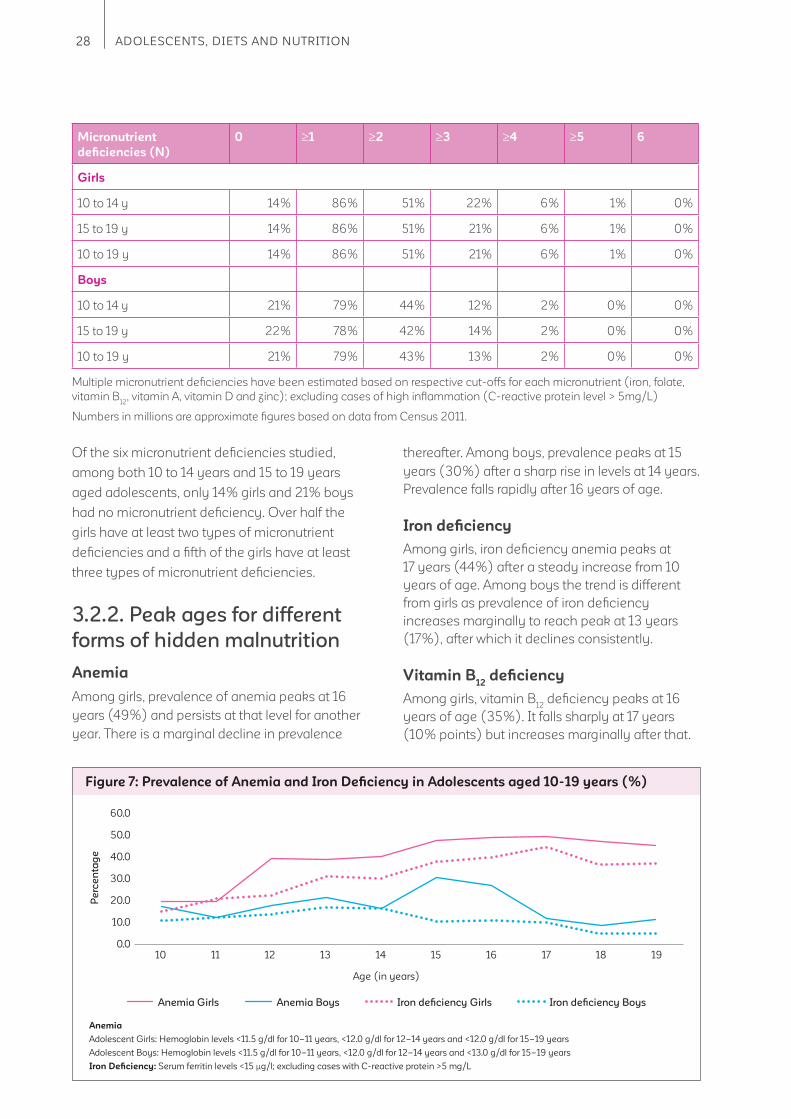
Of the six micronutrient defi ciencies studied,
among both 10 to 14 years and 15 to 19 years
aged adolescents, only 14% girls and 21% boys
had no micronutrient defi ciency. Over half the
girls have at least two types of micronutrient
defi ciencies and a fi fth of the girls have at least
three types of micronutrient defi ciencies.
3.2.2. Peak ages for different
forms of hidden malnutrition
Anemia
Among girls, prevalence of anemia peaks at 16
years (49%) and persists at that level for another
year. There is a marginal decline in prevalence
thereafter. Among boys, prevalence peaks at 15
years (30%) after a sharp rise in levels at 14 years.
Prevalence falls rapidly after 16 years of age.
Iron defi ciency
Among girls, iron defi ciency anemia peaks at
17 years (44%) after a steady increase from 10
years of age. Among boys the trend is different
from girls as prevalence of iron defi ciency
increases marginally to reach peak at 13 years
(17%), after which it declines consistently.
Vitamin B12
defi ciency
Among girls, vitamin B12
defi ciency peaks at 16
years of age (35%). It falls sharply at 17 years
(10% points) but increases marginally after that.
Figure 7: Prevalence of Anemia and Iron Defi ciency in Adolescents aged 10-19 years (%)
Anemia Girls Anemia Boys Iron defi ciency Girls Iron defi ciency Boys
Age (in years)
Anemia
Adolescent Girls: Hemoglobin levels <11.5 g/dl for 10–11 years, <12.0 g/dl for 12–14 years and <12.0 g/dl for 15–19 years
Adolescent Boys: Hemoglobin levels <11.5 g/dl for 10–11 years, <12.0 g/dl for 12–14 years and <13.0 g/dl for 15–19 years
Iron Defi ciency: Serum ferritin levels <15 μg/l; excluding cases with C-reactive protein >5 mg/L
60.0
50.0
40.0
30.0
20.0
10.0
0.010 11 12 13 14 15 16 17 18 19
Pe
rce
nta
ge
Multiple micronutrient defi ciencies have been estimated based on respective cut-offs for each micronutrient (iron, folate,
vitamin B12
, vitamin A, vitamin D and zinc); excluding cases of high infl ammation (C-reactive protein level > 5mg/L)
Numbers in millions are approximate fi gures based on data from Census 2011.

29The CNNS Thematic Reports, Issue 1, 2019
Among boys, prevalence peaks at 15 years (44%)
after increasing steadily from 10 years of age.
Folate defi ciency
Among girls, folate defi ciency peaks at 13 years
(43%) but declines consistently thereafter.
Among boys, it peaks later at 17 years (50%).
Vitamin A defi ciency
Among girls, vitamin A defi ciency peaks at
12 years (22%). In boys, it peaks earlier at
11 years (22%).
Vitamin D defi ciency
Among girls, vitamin D defi ciency peaks at 13
years (41%) and remains around this level for
two consecutive years. Among boys, vitamin D
defi ciency is highest at age of 10 years (19%)
after which it declines almost consistently.
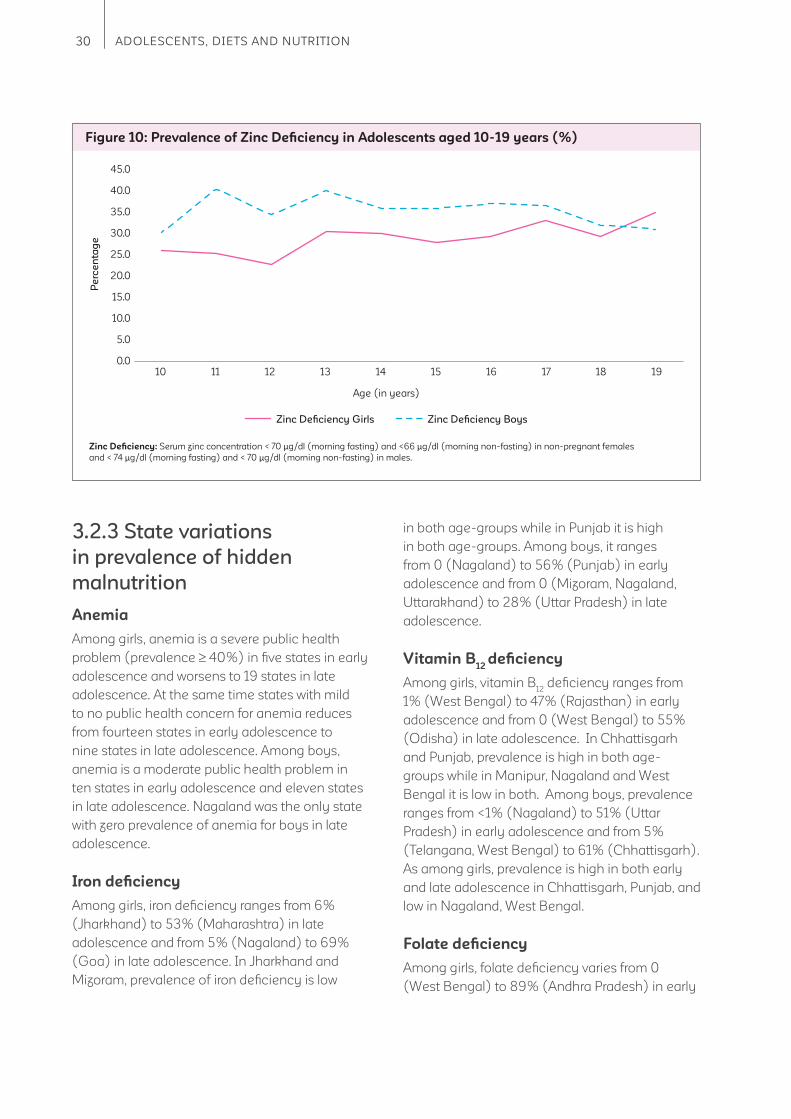
Zinc defi ciency
Among girls, zinc defi ciency is highest at 19 years
(34%), following a steady increase since age of
10 years. Among boys, zinc defi ciency peaks at
11 years (40%).
Figure 8: Prevalence of Folate and Vitamin B12
Defi ciency in Adolescents aged 10-19 years (%)
Folate defi ciency Girls Folate defi ciency Boys Vitamin B12
defi ciency Girls Vitamin B12
defi ciency Boys
Age (in years)
Folate defi ciency: Serum erythrocyte folate < 151 ng/ml Vitamin B12
defi ciency: Serum vitamin B12
< 203 pg/ml
60.0
50.0
40.0
30.0
20.0
10.0
0.0
Pe
rce
nta
ge
10 11 12 13 14 15 16 17 18 19
Figure 9: Prevalence of Vitamin A and Vitamin D Defi ciency in Adolescents aged 10-19 years (%)
Vitamin A defi ciency Girls Vitamin A defi ciency Boys Vitamin D defi ciency Girls Vitamin D defi ciency Boys
Age (in years)
Vitamin A defi ciency: Serum retinol concentration <20 μg/dL; excluding cases with C-reactive protein >5mg/L
Vitamin D defi ciency: Serum 25(OH)D concentration <12ng/mL (30 nmol/L)
45.0
40.0
35.0
30.0
25.0
20.0
15.0
10.0
5.0
0.0
Pe
rce
nta
ge
10 11 12 13 14 15 16 17 18 19
30 ADOLESCENTS, DIETS AND NUTRITION
3.2.3 State variations
in prevalence of hidden
malnutrition
Anemia
Among girls, anemia is a severe public health
problem (prevalence 40%) in fi ve states in early
adolescence and worsens to 19 states in late
adolescence. At the same time states with mild
to no public health concern for anemia reduces
from fourteen states in early adolescence to
nine states in late adolescence. Among boys,
anemia is a moderate public health problem in
ten states in early adolescence and eleven states
in late adolescence. Nagaland was the only state
with zero prevalence of anemia for boys in late
adolescence.
Iron defi ciency
Among girls, iron defi ciency ranges from 6%
(Jharkhand) to 53% (Maharashtra) in late
adolescence and from 5% (Nagaland) to 69%
(Goa) in late adolescence. In Jharkhand and
Mizoram, prevalence of iron defi ciency is low
in both age-groups while in Punjab it is high
in both age-groups. Among boys, it ranges
from 0 (Nagaland) to 56% (Punjab) in early
adolescence and from 0 (Mizoram, Nagaland,
Uttarakhand) to 28% (Uttar Pradesh) in late
adolescence.
Vitamin B12
defi ciency
Among girls, vitamin B12
defi ciency ranges from
1% (West Bengal) to 47% (Rajasthan) in early
adolescence and from 0 (West Bengal) to 55%
(Odisha) in late adolescence. In Chhattisgarh
and Punjab, prevalence is high in both age-
groups while in Manipur, Nagaland and West
Bengal it is low in both. Among boys, prevalence
ranges from <1% (Nagaland) to 51% (Uttar
Pradesh) in early adolescence and from 5%
(Telangana, West Bengal) to 61% (Chhattisgarh).
As among girls, prevalence is high in both early
and late adolescence in Chhattisgarh, Punjab, and
low in Nagaland, West Bengal.
Folate defi ciency
Among girls, folate defi ciency varies from 0
(West Bengal) to 89% (Andhra Pradesh) in early
Figure 10: Prevalence of Zinc Defi ciency in Adolescents aged 10-19 years (%)
Zinc Defi ciency Girls Zinc Defi ciency Boys
Age (in years)
Zinc Defi ciency: Serum zinc concentration < 70 μg/dl (morning fasting) and <66 μg/dl (morning non-fasting) in non-pregnant females
and < 74 μg/dl (morning fasting) and < 70 μg/dl (morning non-fasting) in males.
45.0
40.0
35.0
30.0
25.0
20.0
15.0
10.0
5.0
0.0
Pe
rce
nta
ge
10 11 12 13 14 15 16 17 18 19

31The CNNS Thematic Reports, Issue 1, 2019
Table 3: Prevalence of Anaemia in Adolescents, CNNS 2016-19 (%)
< 5% 5–19.9% 20–39.9% 40%
States 10-14 years 15-19 years
Girls Boys Girls Boys
India 32.1 17.1 47.5 18.1
Andhra Pradesh 28.0 9.8 39.4 13.3
Arunachal Pradesh 22.3 20.5 48.2 17.8
Assam 35.2 24.9 53.4 39.1
Bihar 23.0 20.4 46.0 16.4
Chhattisgarh 42.1 21.0 41.4 21.0
Delhi 32.0 12.5 56.5 18.8
Goa 14.2 5.8 32.1 6.2
Gujarat 44.2 21.6 47.8 20.6
Haryana 29.6 23.2 54.2 20.5
Himachal Pradesh 12.1 4.4 28.0 21.1
Jammu & Kashmir 15.6 6.7 31.9 5.6
Jharkhand 50.2 17.6 53.7 15.0
Karnataka 16.5 4.8 34.9 12.7
Kerala 6.4 2.9 21.4 5.2
Madhya Pradesh 23.3 12.1 34.1 19.8
Maharashtra 27.6 21.2 47.5 20.3
Manipur 8.1 7.3 14.9 12.5
Meghalaya 32.1 23.8 60.1 20.5
Mizoram 16.0 13.0 35.7 9.0
Nagaland 9.0 15.5 6.0 0.0
Odisha 31.1 18.2 50.2 17.5
Punjab 24.1 16.5 46.9 13.7
Rajasthan 31.1 6.0 50.3 17.1
Sikkim 30.7 17.8 45.5 10.5
Tamil Nadu 11.4 9.2 40.2 5.3
Telangana 37.8 16.7 55.2 20.3
Tripura 41.3 25.7 67.1 33.0
Uttar Pradesh 39.9 17.9 49.2 16.9
Uttarakhand 17.0 7.0 23.7 15.9
West Bengal 56.0 31.2 67.6 28.0

32 ADOLESCENTS, DIETS AND NUTRITION
Ta
ble
4:
Mic
ron
utr
ien
t D
efi
cie
nc
ies
in
Ad
ole
sc
en
ts a
ge
d 1
0-14
ye
ars
, C
NN
S 2
015
-16
(%
)
(C
on
tin
ue
d)
< 1
0%
< 2
0%
< 1
0%
< 2
%
10–
20
%
20
–4
0%
10–
30
%
2–
9.9
%
40
–6
0%
20
–3
0%
30
–4
0%
10–
19.9
%
> 6
0%
> 3
0%
> 4
0%
> 2
0%
Iro
n,
Zin
c,
Vit
am
in B
12:
Fo
late
:
Vit
am
in D
:
Vit
am
in A
:
Sta
tes
Gir
ls (
10
-14
ye
ars
)B
oy
s (
10
-14
ye
ars
)
Iro
n
de
fi c
ien
cy
Vit
am
in B
12
De
fi c
ien
cy
Fo
late
de
fi c
ien
cy
Vit
am
in A
de
fi c
ien
cy
Vit
am
in D
De
fi c
ien
cy
Zin
c
De
fi c
ien
cy
Iro
n
de
fi c
ien
cy
Vit
am
in B
12
De
fi c
ien
cy
Fo
late
de
fi c
ien
cy
Vit
am
in A
de
fi c
ien
cy
Vit
am
in D
De
fi c
ien
cy
Zin
c
De
fi c
ien
cy
Ind
ia2
4.1
25
.63
6.1
18
.73
5.0
26
.614
.03
0.4
35
.61
7.8
15
.63
6.0
An
dh
ra
Pra
de
sh
15.9
20
.18
9.3
12.4
22
.02
2.2
5.7
15.4
1.9
17.0
11.2
18.2
Aru
na
ch
al
Pra
de
sh
23
.27.
05
0.0
13.0
35
.22
3.6
3.7
10.2
37.
015
.216
.53
5.1
As
sa
m10
.510
.273
.99
.915
.13
4.0
2.5
5.0
6.5
5.1
2.5
33
.0
Bih
ar
9.8
16.9
14.4
25
.75
5.4
15.3
9.8
27.
317
.27.
119
.82
9.5
Ch
ha
ttis
ga
rh3
5.3
40
.97
1.1
42
.13
7.0
19.6
22
.04
1.6
18.6
10.8
10.9
37.
0
De
lhi
21.
02
1.9
0.6
15.1
60
.04
2.8
8.7
25
.35
5.7
0.0
28
.34
3.1
Go
a17
.611
.74
4.5
1.8
26
.02
4.9
5.2
14.2
4.2
24
.218
.63
3.5
Gu
jara
t4
2.9
40
.05
8.3
7.7
46
.73
7.7
31.
43
7.7
62
.82
3.5
33
.26
6.0
Ha
rya
na
34
.72
2.3
37.
27.
46
4.2
22
.82
4.7
33
.17
7.4
9.0
42
.32
5.4
Him
ac
ha
l
Pra
de
sh
10.7
22
.59
.22
.63
3.4
51.
07.
33
1.6
4.1
23
.49
.86
3.9
Jam
mu
&
Ka
sh
mir
30
.714
.59
.56
.06
9.4
33
.02
5.7
32
.98
.82
6.6
23
.94
5.3
Jha
rkh
an
d5
.718
.919
.54
3.5
32
.63
8.7
6.8
20
.82
3.4
22
.32
2.5
67.
0
Ka
rna
tak
a3
6.6
32
.872
.215
.42
6.8
35
.02
6.3
32
.66
4.6
21.
84
.34
6.3
Ke
rala
27.
43
.34
8.5
14.9
42
.018
.813
.61.
60
.09
.115
.413
.8
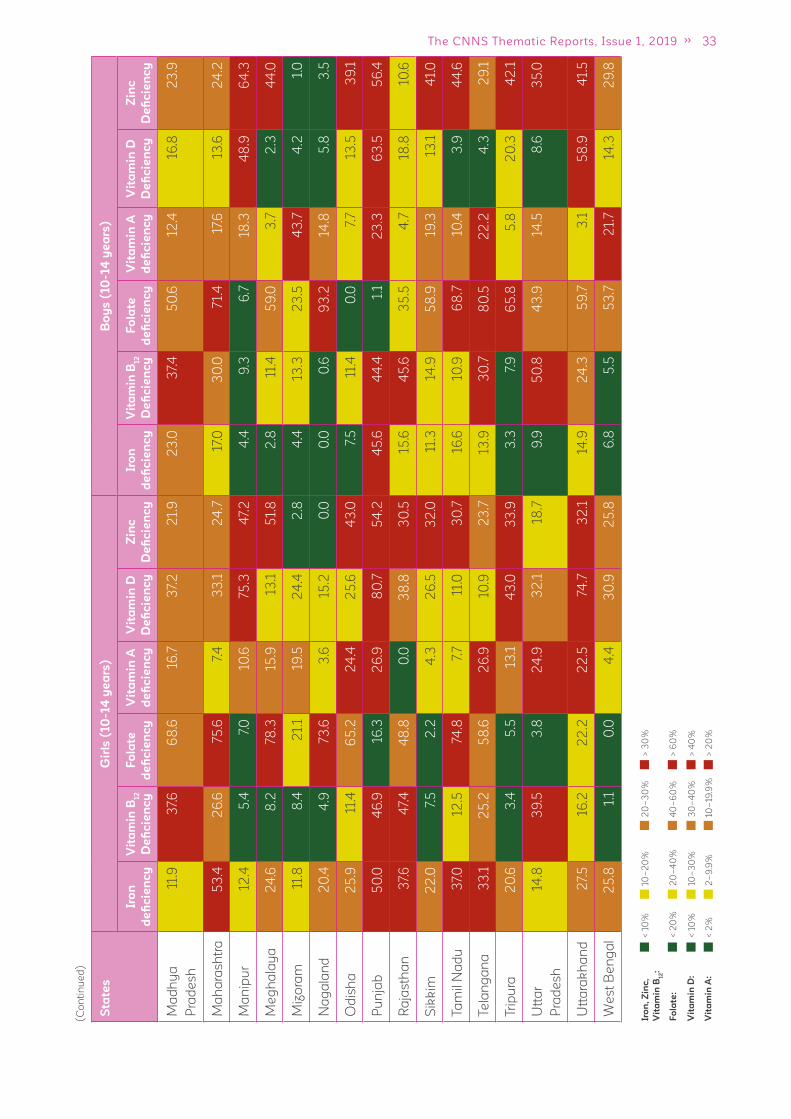
33The CNNS Thematic Reports, Issue 1, 2019
(C
on
tin
ue
d)
< 1
0%
< 2
0%
< 1
0%
< 2
%
10–
20
%
20
–4
0%
10–
30
%
2–
9.9
%
40
–6
0%
20
–3
0%
30
–4
0%
10–
19.9
%
> 6
0%
> 3
0%
> 4
0%
> 2
0%
Iro
n,
Zin
c,
Vit
am
in B
12:
Fo
late
:
Vit
am
in D
:
Vit
am
in A
:
Sta
tes
Gir
ls (
10
-14
ye
ars
)B
oy
s (
10
-14
ye
ars
)
Iro
n
de
fi c
ien
cy
Vit
am
in B
12
De
fi c
ien
cy
Fo
late
de
fi c
ien
cy
Vit
am
in A
de
fi c
ien
cy
Vit
am
in D
De
fi c
ien
cy
Zin
c
De
fi c
ien
cy
Iro
n
de
fi c
ien
cy
Vit
am
in B
12
De
fi c
ien
cy
Fo
late
de
fi c
ien
cy
Vit
am
in A
de
fi c
ien
cy
Vit
am
in D
De
fi c
ien
cy
Zin
c
De
fi c
ien
cy
Ma
dh
ya
Pra
de
sh
11.9
37.
66
8.6
16.7
37.
22
1.9
23
.03
7.4
50
.612
.416
.82
3.9
Ma
ha
ras
htr
a5
3.4
26
.675
.67.
43
3.1
24
.717
.03
0.0
71.
417
.613
.62
4.2
Ma
nip
ur
12.4
5.4
7.0
10.6
75.3
47.
24
.49
.36
.718
.34
8.9
64
.3
Me
gh
ala
ya
24
.68
.278
.315
.913
.15
1.8
2.8
11.4
59
.03
.72
.34
4.0
Miz
ora
m11
.88
.42
1.1
19.5
24
.42
.84
.413
.32
3.5
43
.74
.21.
0
Na
ga
lan
d2
0.4
4.9
73.6
3.6
15.2
0.0
0.0
0.6
93
.214
.85
.83
.5
Od
ish
a2
5.9
11.4
65
.22
4.4
25
.64
3.0
7.5
11.4
0.0
7.7
13.5
39
.1
Pu
nja
b5
0.0
46
.916
.32
6.9
80
.75
4.2
45
.64
4.4
1.1
23
.36
3.5
56
.4
Ra
jas
tha
n3
7.6
47.
44
8.8
0.0
38
.83
0.5
15.6
45
.63
5.5
4.7
18.8
10.6
Sik
kim
22
.07.
52
.24
.32
6.5
32
.011
.314
.95
8.9
19.3
13.1
41.
0
Ta
mil
Na
du
37.
012
.574
.87.
711
.03
0.7
16.6
10.9
68
.710
.43
.94
4.6
Te
lan
ga
na
33
.12
5.2
58
.62
6.9
10.9
23
.713
.93
0.7
80
.52
2.2
4.3
29
.1
Trip
ura
20
.63
.45
.513
.14
3.0
33
.93
.37.
96
5.8
5.8
20
.34
2.1
Utt
ar
Pra
de
sh
14.8
39
.53
.82
4.9
32
.118
.79
.95
0.8
43
.914
.58
.63
5.0
Utt
ara
kh
an
d2
7.5
16.2
22
.22
2.5
74.7
32
.114
.92
4.3
59
.73
.15
8.9
41.
5
We
st
Be
ng
al
25
.81.
10
.04
.43
0.9
25
.86
.85
.55
3.7
21.
714
.32
9.8
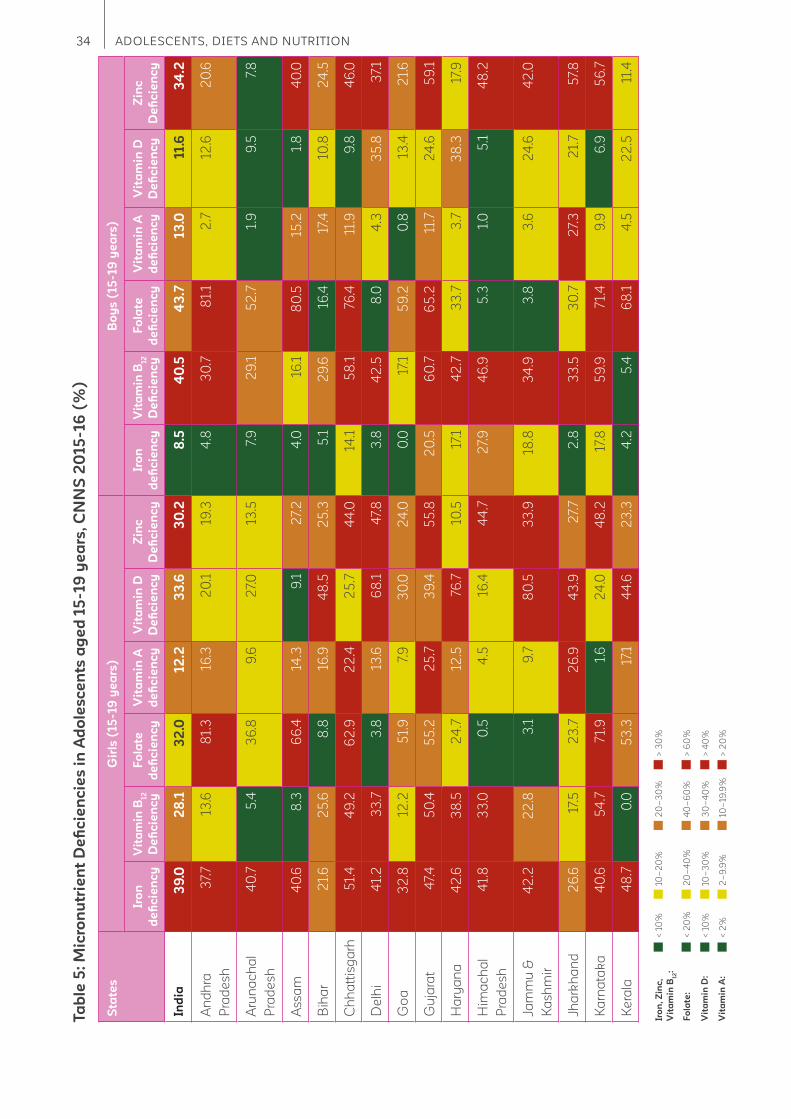
34 ADOLESCENTS, DIETS AND NUTRITION
Ta
ble
5:
Mic
ron
utr
ien
t D
efi
cie
nc
ies
in
Ad
ole
sc
en
ts a
ge
d 1
5-19
ye
ars
, C
NN
S 2
015
-16
(%
)
(C
on
tin
ue
d)
< 1
0%
< 2
0%
< 1
0%
< 2
%
10–
20
%
20
–4
0%
10–
30
%
2–
9.9
%
40
–6
0%
20
–3
0%
30
–4
0%
10–
19.9
%
> 6
0%
> 3
0%
> 4
0%
> 2
0%
Iro
n,
Zin
c,
Vit
am
in B
12:
Fo
late
:
Vit
am
in D
:
Vit
am
in A
:
Sta
tes
Gir
ls (
15
-19
ye
ars
)B
oy
s (
15
-19
ye
ars
)
Iro
n
de
fi c
ien
cy
Vit
am
in B
12
De
fi c
ien
cy
Fo
late
de
fi c
ien
cy
Vit
am
in A
de
fi c
ien
cy
Vit
am
in D
De
fi c
ien
cy
Zin
c
De
fi c
ien
cy
Iro
n
de
fi c
ien
cy
Vit
am
in B
12
De
fi c
ien
cy
Fo
late
de
fi c
ien
cy
Vit
am
in A
de
fi c
ien
cy
Vit
am
in D
De
fi c
ien
cy
Zin
c
De
fi c
ien
cy
Ind
ia3
9.0
28
.13
2.0
12
.23
3.6
30
.28
.54
0.5
43
.713
.011.6
34
.2
An
dh
ra
Pra
de
sh
37.
713
.68
1.3
16.3
20
.119
.34
.83
0.7
81.
12
.712
.62
0.6
Aru
na
ch
al
Pra
de
sh
40
.75
.43
6.8
9.6
27.
013
.57.
92
9.1
52
.71.
99
.57.
8
As
sa
m4
0.6
8.3
66
.414
.39
.12
7.2
4.0
16.1
80
.515
.21.
84
0.0
Bih
ar
21.
62
5.6
8.8
16.9
48
.52
5.3
5.1
29
.616
.417
.410
.82
4.5
Ch
ha
ttis
ga
rh5
1.4
49
.26
2.9
22
.42
5.7
44
.014
.15
8.1
76.4
11.9
9.8
46
.0
De
lhi
41.
23
3.7
3.8
13.6
68
.14
7.8
3.8
42
.58
.04
.33
5.8
37.
1
Go
a3
2.8
12.2
51.
97.
93
0.0
24
.00
.017
.15
9.2
0.8
13.4
21.
6
Gu
jara
t4
7.4
50
.45
5.2
25
.73
9.4
55
.82
0.5
60
.76
5.2
11.7
24
.65
9.1
Ha
rya
na
42
.63
8.5
24
.712
.576
.710
.517
.14
2.7
33
.73
.73
8.3
17.9
Him
ac
ha
l
Pra
de
sh
41.
83
3.0
0.5
4.5
16.4
44
.72
7.9
46
.95
.31.
05
.14
8.2
Jam
mu
&
Ka
sh
mir
42
.22
2.8
3.1
9.7
80
.53
3.9
18.8
34
.93
.83
.62
4.6
42
.0
Jha
rkh
an
d2
6.6
17.5
23
.72
6.9
43
.92
7.7
2.8
33
.53
0.7
27.
32
1.7
57.
8
Ka
rna
tak
a4
0.6
54
.77
1.9
1.6
24
.04
8.2
17.8
59
.97
1.4
9.9
6.9
56
.7
Ke
rala
48
.70
.05
3.3
17.1
44
.62
3.3
4.2
5.4
68
.14
.52
2.5
11.4

35The CNNS Thematic Reports, Issue 1, 2019
(C
on
tin
ue
d)
< 1
0%
< 2
0%
< 1
0%
< 2
%
10–
20
%
20
–4
0%
10–
30
%
2–
9.9
%
40
–6
0%
20
–3
0%
30
–4
0%
10–
19.9
%
> 6
0%
> 3
0%
> 4
0%
> 2
0%
Iro
n,
Zin
c,
Vit
am
in B
12:
Fo
late
:
Vit
am
in D
:
Vit
am
in A
:
Sta
tes
Gir
ls (
15
-19
ye
ars
)B
oy
s (
15
-19
ye
ars
)
Iro
n
de
fi c
ien
cy
Vit
am
in B
12
De
fi c
ien
cy
Fo
late
de
fi c
ien
cy
Vit
am
in A
de
fi c
ien
cy
Vit
am
in D
De
fi c
ien
cy
Zin
c
De
fi c
ien
cy
Iro
n
de
fi c
ien
cy
Vit
am
in B
12
De
fi c
ien
cy
Fo
late
de
fi c
ien
cy
Vit
am
in A
de
fi c
ien
cy
Vit
am
in D
De
fi c
ien
cy
Zin
c
De
fi c
ien
cy
Ma
dh
ya
Pra
de
sh
48
.93
6.7
64
.519
.52
9.1
9.5
6.2
56
.88
4.8
6.2
13.3
23
.3
Ma
ha
ras
htr
a5
1.5
30
.06
0.9
10.4
30
.52
4.5
13.7
58
.379
.74
.615
.92
7.6
Ma
nip
ur
27.
611
.13
.511
.472
.34
9.7
4.2
20
.010
.19
.84
0.3
49
.2
Me
gh
ala
ya
31.
13
.55
2.5
1.3
7.0
30
.92
.914
.35
3.2
2.0
6.4
63
.4
Miz
ora
m2
3.4
3.5
25
.87.
92
1.4
15.4
0.0
16.3
19.2
16.4
3.9
10.9
Na
ga
lan
d5
.52
.28
8.4
5.6
7.7
9.9
0.0
5.6
96
.40
.07.
41.
9
Od
ish
a3
9.8
20
.573
.413
.02
5.6
43
.45
.818
.672
.017
.16
.14
4.8
Pu
nja
b6
5.0
45
.92
3.9
9.4
75.6
41.
816
.54
9.1
15.7
6.1
52
.55
5.8
Ra
jas
tha
n6
9.2
45
.44
6.3
6.3
29
.418
.42
0.0
50
.96
0.6
0.0
15.2
33
.5
Sik
kim
39
.615
.60
.06
.52
3.2
39
.110
.02
7.1
0.7
0.0
11.3
33
.9
Ta
mil
Na
du
44
.118
.26
7.9
6.2
11.0
58
.34
.43
3.3
80
.03
8.6
0.7
33
.0
Te
lan
ga
na
40
.02
3.2
72
.517
.417
.43
0.1
16.7
37.
67
1.1
12.9
2.9
29
.4
Trip
ura
19.1
10.4
3.4
20
.33
9.6
43
.03
.916
.65
.519
.415
.43
7.9
Utt
ar
Pra
de
sh
35
.33
0.8
4.9
11.9
31.
22
1.5
4.1
49
.78
.813
.82
.83
2.3
Utt
ara
kh
an
d3
4.9
24
.62
1.0
12.3
77.
12
6.6
6.5
43
.02
8.9
6.8
46
.317
.8
We
st
Be
ng
al
32
.92
.50
.11.
52
8.9
29
.72
.75
.40
.04
.44
.419
.9
36 ADOLESCENTS, DIETS AND NUTRITION
adolescence and from 0 (Gujarat, Telangana,
Uttar Pradesh) to 88% (Nagaland) in later years.
In Delhi from almost no cases of folate defi ciency
in early adolescent, almost every girl (81%) is
affected in late adolescence. Among boys, the
prevalence ranges from 0 (Kerala, Odisha) to
93% (Nagaland) in early adolescence and from 0
(Telangana) to 96% (Nagaland).
Vitamin A defi ciency
Among girls, prevalence ranges from 0
(Rajasthan) to 43% (Jharkhand) in early
adolescence and from 1% (Meghalaya,
Telangana) to 27% (Jharkhand) in late
adolescence. It is a public health problem
(prevalence 20%) in nine states in early and
four states in late adolescence. Among boys
it ranges from 0 (Delhi) to 44% (Mizoram) in
early adolescence and from 0 (Goa, Gujarat,
Nagaland) and 39% (Maharashtra) in later years.
It is a severe public health problem in 10 states
which drops to two states (Jharkhand and Tamil
Nadu) in late adolescence.
Vitamin D defi ciency
Among girls vitamin D defi ciency varies from
11% (Telangana) to 81% (Punjab) in early
adolescence and from 7% (Meghalaya) to
80% (Bihar) in late adolescence. In Manipur,
prevalence of vitamin D defi ciency is high in
both age groups. Among boys, it varies from
2% (Meghalaya) to 64% (Punjab) in early
adolescence and from 1% (Maharashtra) to 53%
(Tripura) in late adolescence. As among girls,
vitamin D defi ciency prevalence is high in both
age-groups among boys.
Zinc defi ciency
Among girls, zinc defi ciency varies from
0 (Nagaland) to 54% (Punjab) in early
adolescence, and from 9% (Arunachal Pradesh)
to 58% (Maharashtra) in late adolescence.
Prevalence is high in both age groups in the states
of Manipur and Odisha. Among boys, prevalence
ranges from 1% (Mizoram) to 67% (Jharkhand) in
early and 2% (Nagaland) to 63% (Meghalaya)
in late adolescence. Prevalence is high in both
age-groups in the state of Jharkhand.
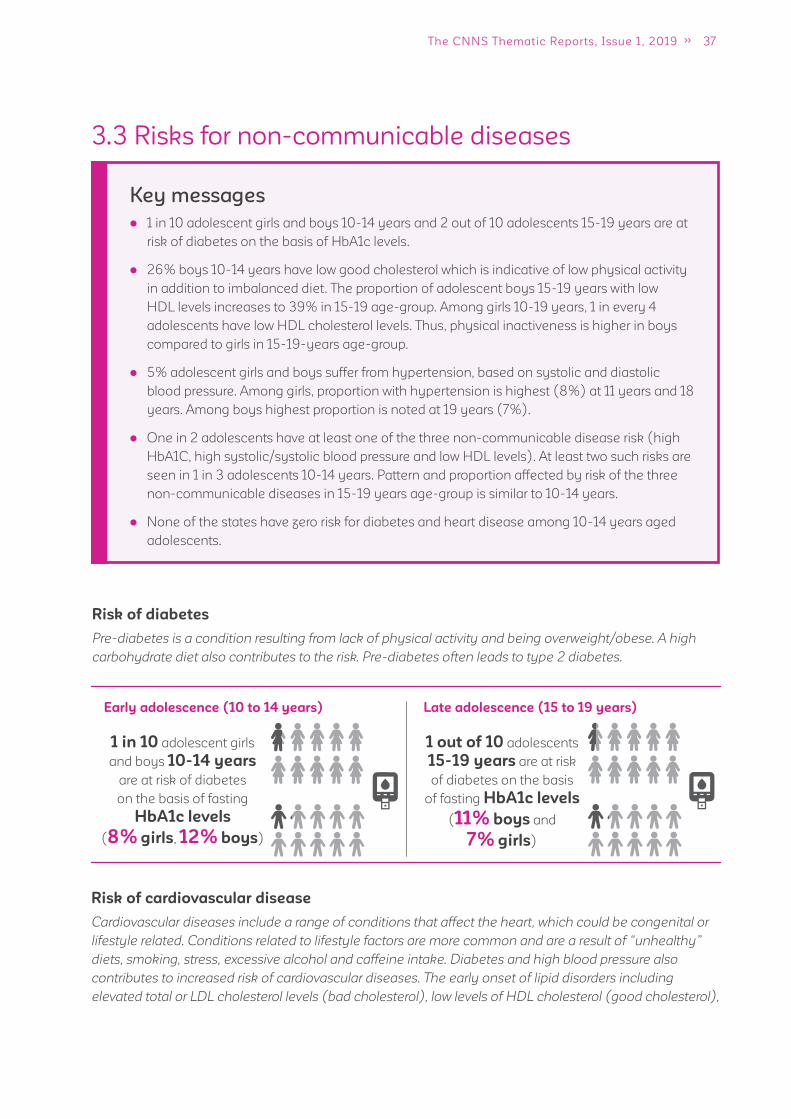
37The CNNS Thematic Reports, Issue 1, 2019
Key messages
1 in 10 adolescent girls and boys 10-14 years and 2 out of 10 adolescents 15-19 years are at
risk of diabetes on the basis of HbA1c levels.
26% boys 10-14 years have low good cholesterol which is indicative of low physical activity
in addition to imbalanced diet. The proportion of adolescent boys 15-19 years with low
HDL levels increases to 39% in 15-19 age-group. Among girls 10-19 years, 1 in every 4
adolescents have low HDL cholesterol levels. Thus, physical inactiveness is higher in boys
compared to girls in 15-19-years age-group.
5% adolescent girls and boys suffer from hypertension, based on systolic and diastolic
blood pressure. Among girls, proportion with hypertension is highest (8%) at 11 years and 18
years. Among boys highest proportion is noted at 19 years (7%).
One in 2 adolescents have at least one of the three non-communicable disease risk (high
HbA1C, high systolic/systolic blood pressure and low HDL levels). At least two such risks are
seen in 1 in 3 adolescents 10-14 years. Pattern and proportion affected by risk of the three
non-communicable diseases in 15-19 years age-group is similar to 10-14 years.
None of the states have zero risk for diabetes and heart disease among 10-14 years aged
adolescents.
3.3 Risks for non-communicable diseases
Risk of cardiovascular disease
Cardiovascular diseases include a range of conditions that affect the heart, which could be congenital or
lifestyle related. Conditions related to lifestyle factors are more common and are a result of “unhealthy”
diets, smoking, stress, excessive alcohol and caffeine intake. Diabetes and high blood pressure also
contributes to increased risk of cardiovascular diseases. The early onset of lipid disorders including
elevated total or LDL cholesterol levels (bad cholesterol), low levels of HDL cholesterol (good cholesterol),
Risk of diabetes
Pre-diabetes is a condition resulting from lack of physical activity and being overweight/obese. A high
carbohydrate diet also contributes to the risk. Pre-diabetes often leads to type 2 diabetes.
Early adolescence (10 to 14 years) Late adolescence (15 to 19 years)
1 in 10 adolescent girls
and boys 10-14 years
are at risk of diabetes
on the basis of fasting
HbA1c levels
(8% girls, 12% boys)
1 out of 10 adolescents
15-19 years are at risk
of diabetes on the basis
of fasting HbA1c levels
(11% boys and
7% girls)
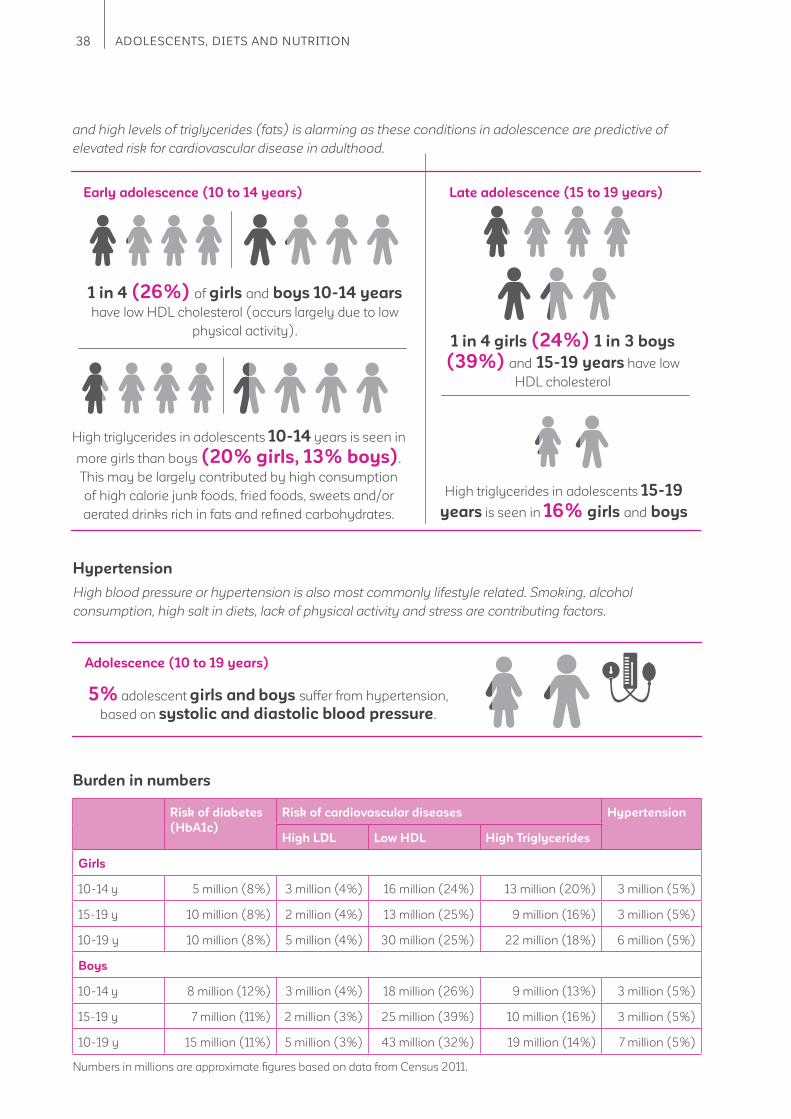
38 ADOLESCENTS, DIETS AND NUTRITION
Adolescence (10 to 19 years)
5% adolescent girls and boys suffer from hypertension,
based on systolic and diastolic blood pressure.
Hypertension
High blood pressure or hypertension is also most commonly lifestyle related. Smoking, alcohol
consumption, high salt in diets, lack of physical activity and stress are contributing factors.
Risk of diabetes
(HbA1c)
Risk of cardiovascular diseases Hypertension
High LDL Low HDL High Triglycerides
Girls
10-14 y 5 million (8%) 3 million (4%) 16 million (24%) 13 million (20%) 3 million (5%)
15-19 y 10 million (8%) 2 million (4%) 13 million (25%) 9 million (16%) 3 million (5%)
10-19 y 10 million (8%) 5 million (4%) 30 million (25%) 22 million (18%) 6 million (5%)
Boys
10-14 y 8 million (12%) 3 million (4%) 18 million (26%) 9 million (13%) 3 million (5%)
15-19 y 7 million (11%) 2 million (3%) 25 million (39%) 10 million (16%) 3 million (5%)
10-19 y 15 million (11%) 5 million (3%) 43 million (32%) 19 million (14%) 7 million (5%)
Burden in numbers
Early adolescence (10 to 14 years) Late adolescence (15 to 19 years)
and high levels of triglycerides (fats) is alarming as these conditions in adolescence are predictive of
elevated risk for cardiovascular disease in adulthood.
1 in 4 (26%) of girls and boys 10-14 years
have low HDL cholesterol (occurs largely due to low
physical activity). 1 in 4 girls (24%) 1 in 3 boys
(39%) and 15-19 years have low
HDL cholesterol
High triglycerides in adolescents 10-14 years is seen in
more girls than boys (20% girls, 13% boys).
This may be largely contributed by high consumption
of high calorie junk foods, fried foods, sweets and/or
aerated drinks rich in fats and refi ned carbohydrates.
High triglycerides in adolescents 15-19
years is seen in 16% girls and boys
Numbers in millions are approximate fi gures based on data from Census 2011.
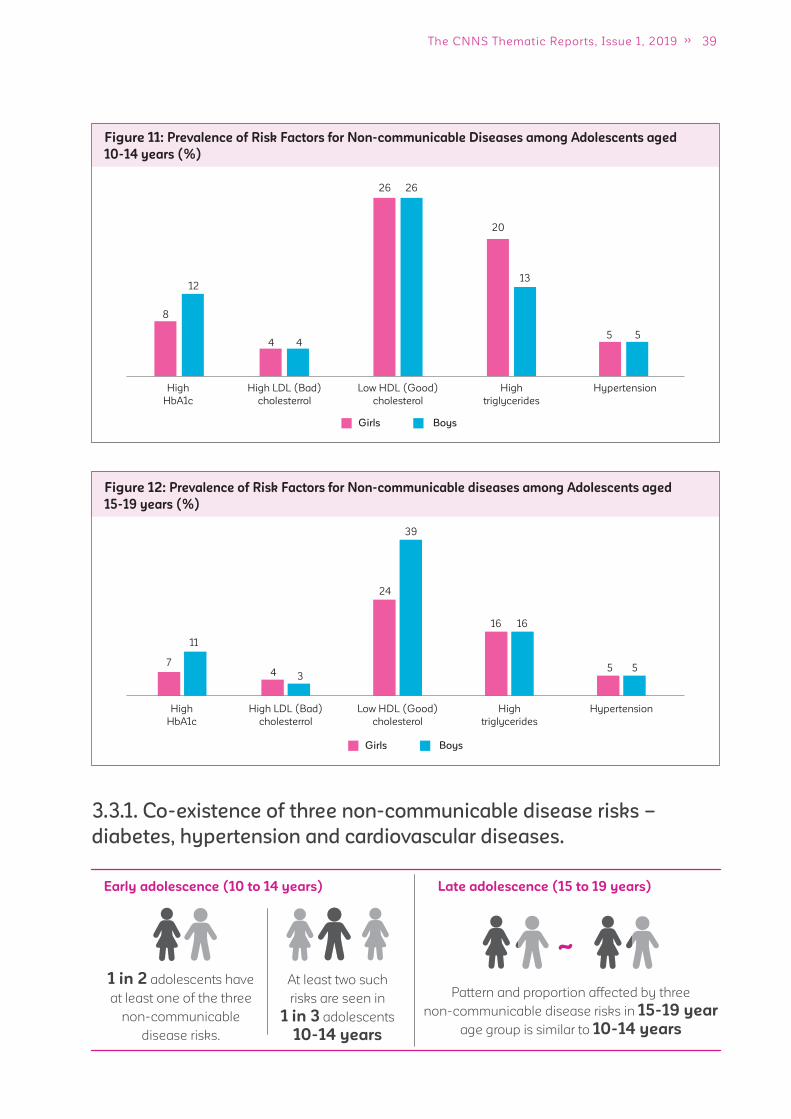
39The CNNS Thematic Reports, Issue 1, 2019
Figure 11: Prevalence of Risk Factors for Non-communicable Diseases among Adolescents aged
10-14 years (%)
Girls Boys
5 5
HypertensionHigh
triglycerides
20
13
26 26
Low HDL (Good)
cholesterol
44
High LDL (Bad)
cholesterrol
12
8
High
HbA1c
Figure 12: Prevalence of Risk Factors for Non-communicable diseases among Adolescents aged
15-19 years (%)
Hypertension
5 5
High
HbA1c
7
11
Low HDL (Good)
cholesterol
24
39
High LDL (Bad)
cholesterrol
4 3
16 16
High
triglycerides
Girls Boys
3.3.1. Co-existence of three non-communicable disease risks –
diabetes, hypertension and cardiovascular diseases.
Early adolescence (10 to 14 years) Late adolescence (15 to 19 years)
Pattern and proportion affected by three
non-communicable disease risks in 15-19 year
age group is similar to 10-14 years
~1 in 2 adolescents have
at least one of the three
non-communicable
disease risks.
At least two such
risks are seen in
1 in 3 adolescents
10-14 years
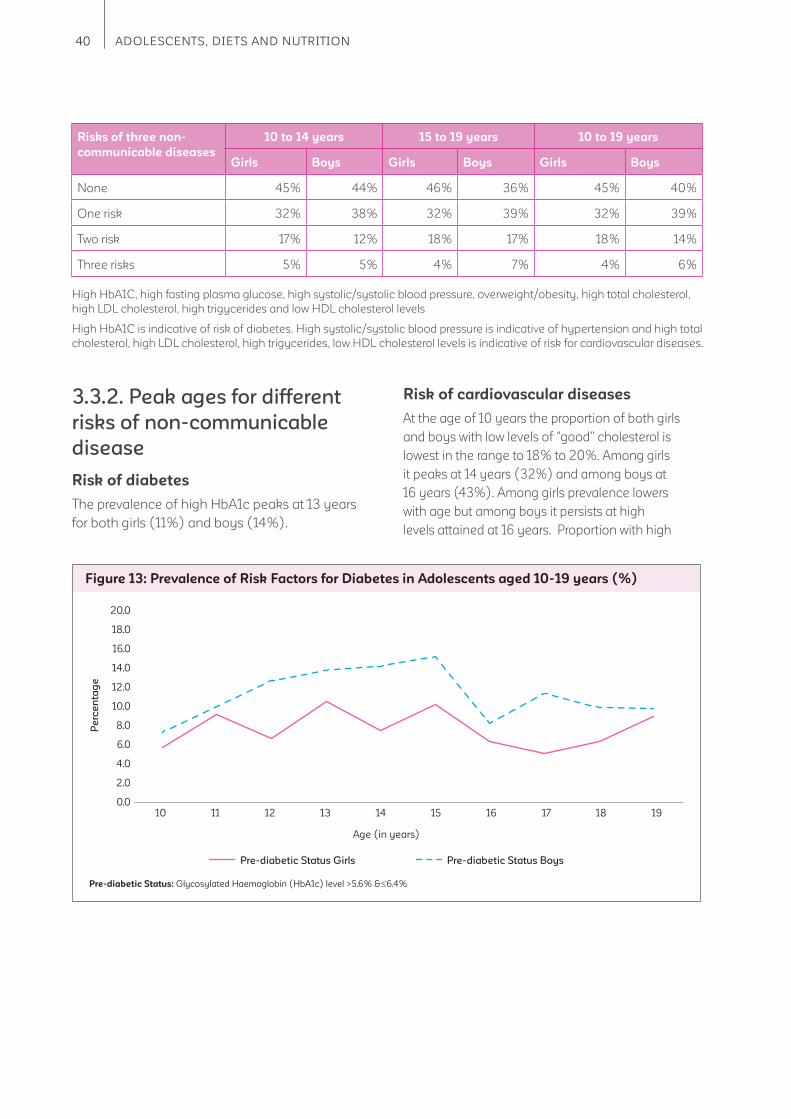
40 ADOLESCENTS, DIETS AND NUTRITION
Risks of three non-
communicable diseases
10 to 14 years 15 to 19 years 10 to 19 years
Girls Boys Girls Boys Girls Boys
None 45% 44% 46% 36% 45% 40%
One risk 32% 38% 32% 39% 32% 39%
Two risk 17% 12% 18% 17% 18% 14%
Three risks 5% 5% 4% 7% 4% 6%
High HbA1C, high fasting plasma glucose, high systolic/systolic blood pressure, overweight/obesity, high total cholesterol,
high LDL cholesterol, high trigycerides and low HDL cholesterol levels
High HbA1C is indicative of risk of diabetes. High systolic/systolic blood pressure is indicative of hypertension and high total
cholesterol, high LDL cholesterol, high trigycerides, low HDL cholesterol levels is indicative of risk for cardiovascular diseases.
3.3.2. Peak ages for different
risks of non-communicable
disease
Risk of diabetes
The prevalence of high HbA1c peaks at 13 years
for both girls (11%) and boys (14%).
Risk of cardiovascular diseases
At the age of 10 years the proportion of both girls
and boys with low levels of “good” cholesterol is
lowest in the range to 18% to 20%. Among girls
it peaks at 14 years (32%) and among boys at
16 years (43%). Among girls prevalence lowers
with age but among boys it persists at high
levels attained at 16 years. Proportion with high
Figure 13: Prevalence of Risk Factors for Diabetes in Adolescents aged 10-19 years (%)
Pre-diabetic Status Girls Pre-diabetic Status Boys
Age (in years)
Pre-diabetic Status: Glycosylated Haemoglobin (HbA1c) level >5.6% & 6.4%
20.0
18.0
16.0
14.0
12.0
10.0
8.0
6.0
4.0
2.0
0.0
Pe
rce
nta
ge
10 11 12 13 14 15 16 17 18 19
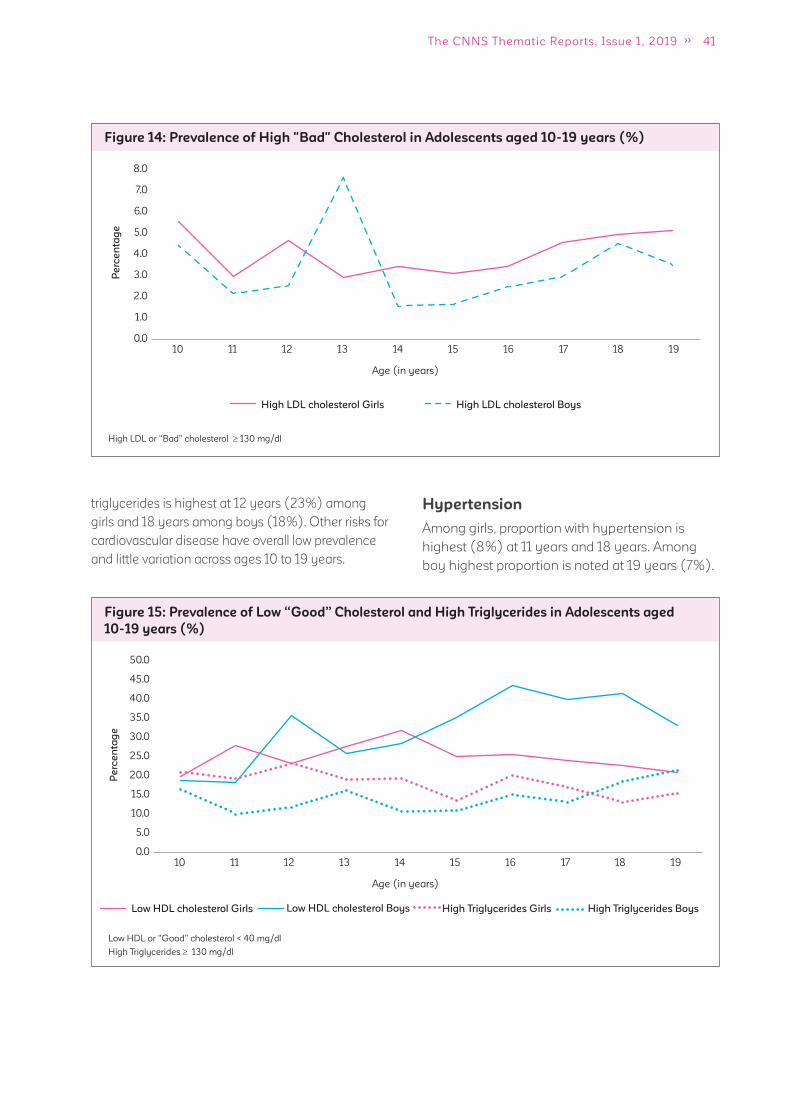
41The CNNS Thematic Reports, Issue 1, 2019
Figure 14: Prevalence of High "Bad" Cholesterol in Adolescents aged 10-19 years (%)
High LDL cholesterol Girls High LDL cholesterol Boys
Age (in years)
High LDL or “Bad” cholesterol 130 mg/dl
8.0
7.0
6.0
5.0
4.0
3.0
2.0
1.0
0.0
Pe
rce
nta
ge
10 11 12 13 14 15 16 17 18 19
triglycerides is highest at 12 years (23%) among
girls and 18 years among boys (18%). Other risks for
cardiovascular disease have overall low prevalence
and little variation across ages 10 to 19 years.
Hypertension
Among girls, proportion with hypertension is
highest (8%) at 11 years and 18 years. Among
boy highest proportion is noted at 19 years (7%).
Figure 15: Prevalence of Low “Good” Cholesterol and High Triglycerides in Adolescents aged
10-19 years (%)
Low HDL cholesterol Girls Low HDL cholesterol Boys High Triglycerides Girls High Triglycerides Boys
Age (in years)
Low HDL or “Good” cholesterol < 40 mg/dl
High Triglycerides 130 mg/dl
50.0
45.0
40.0
35.0
30.0
25.0
20.0
15.0
10.0
5.0
0.0
Pe
rce
nta
ge
10 11 12 13 14 15 16 17 18 19
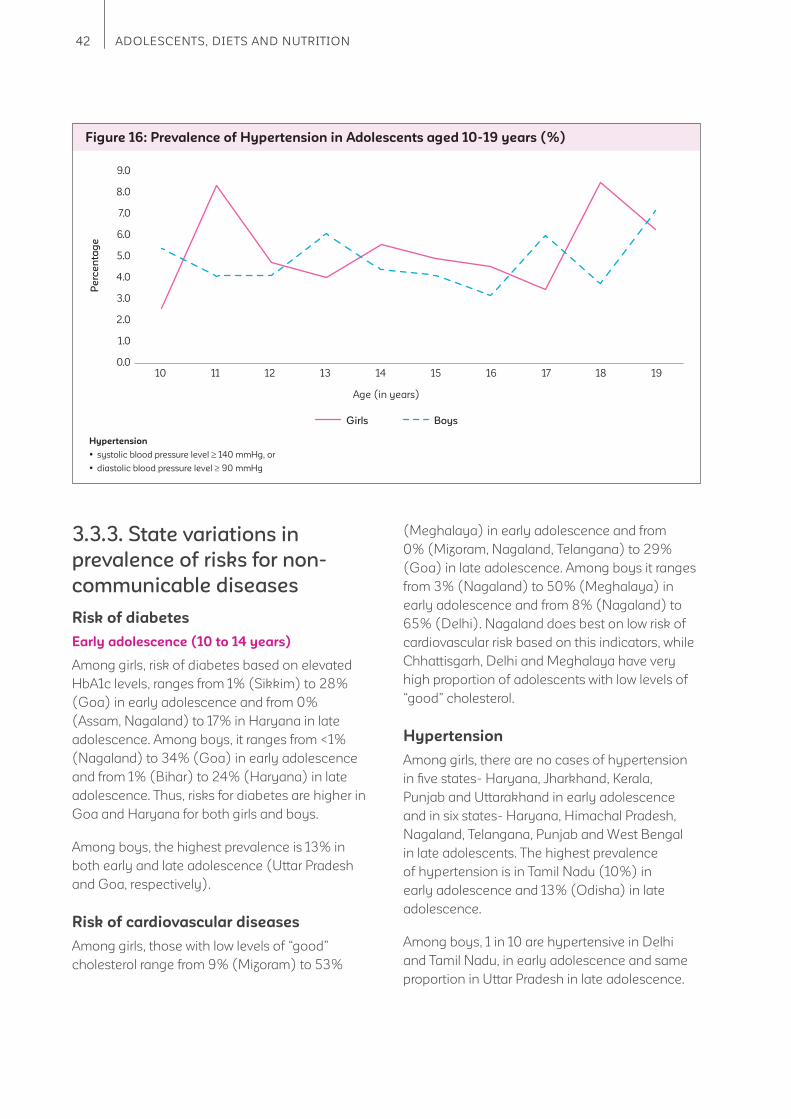
42 ADOLESCENTS, DIETS AND NUTRITION
Figure 16: Prevalence of Hypertension in Adolescents aged 10-19 years (%)
Girls Boys
Age (in years)
Hypertension
systolic blood pressure level 140 mmHg, or
diastolic blood pressure level 90 mmHg
9.0
8.0
7.0
6.0
5.0
4.0
3.0
2.0
1.0
0.0
Pe
rce
nta
ge
10 11 12 13 14 15 16 17 18 19
3.3.3. State variations in
prevalence of risks for non-
communicable diseases
Risk of diabetes
Early adolescence (10 to 14 years)
Among girls, risk of diabetes based on elevated
HbA1c levels, ranges from 1% (Sikkim) to 28%
(Goa) in early adolescence and from 0%
(Assam, Nagaland) to 17% in Haryana in late
adolescence. Among boys, it ranges from <1%
(Nagaland) to 34% (Goa) in early adolescence
and from 1% (Bihar) to 24% (Haryana) in late
adolescence. Thus, risks for diabetes are higher in
Goa and Haryana for both girls and boys.
Among boys, the highest prevalence is 13% in
both early and late adolescence (Uttar Pradesh
and Goa, respectively).
Risk of cardiovascular diseases
Among girls, those with low levels of “good”
cholesterol range from 9% (Mizoram) to 53%
(Meghalaya) in early adolescence and from
0% (Mizoram, Nagaland, Telangana) to 29%
(Goa) in late adolescence. Among boys it ranges
from 3% (Nagaland) to 50% (Meghalaya) in
early adolescence and from 8% (Nagaland) to
65% (Delhi). Nagaland does best on low risk of
cardiovascular risk based on this indicators, while
Chhattisgarh, Delhi and Meghalaya have very
high proportion of adolescents with low levels of
“good” cholesterol.
Hypertension
Among girls, there are no cases of hypertension
in fi ve states- Haryana, Jharkhand, Kerala,
Punjab and Uttarakhand in early adolescence
and in six states- Haryana, Himachal Pradesh,
Nagaland, Telangana, Punjab and West Bengal
in late adolescents. The highest prevalence
of hypertension is in Tamil Nadu (10%) in
early adolescence and 13% (Odisha) in late
adolescence.
Among boys, 1 in 10 are hypertensive in Delhi
and Tamil Nadu, in early adolescence and same
proportion in Uttar Pradesh in late adolescence.
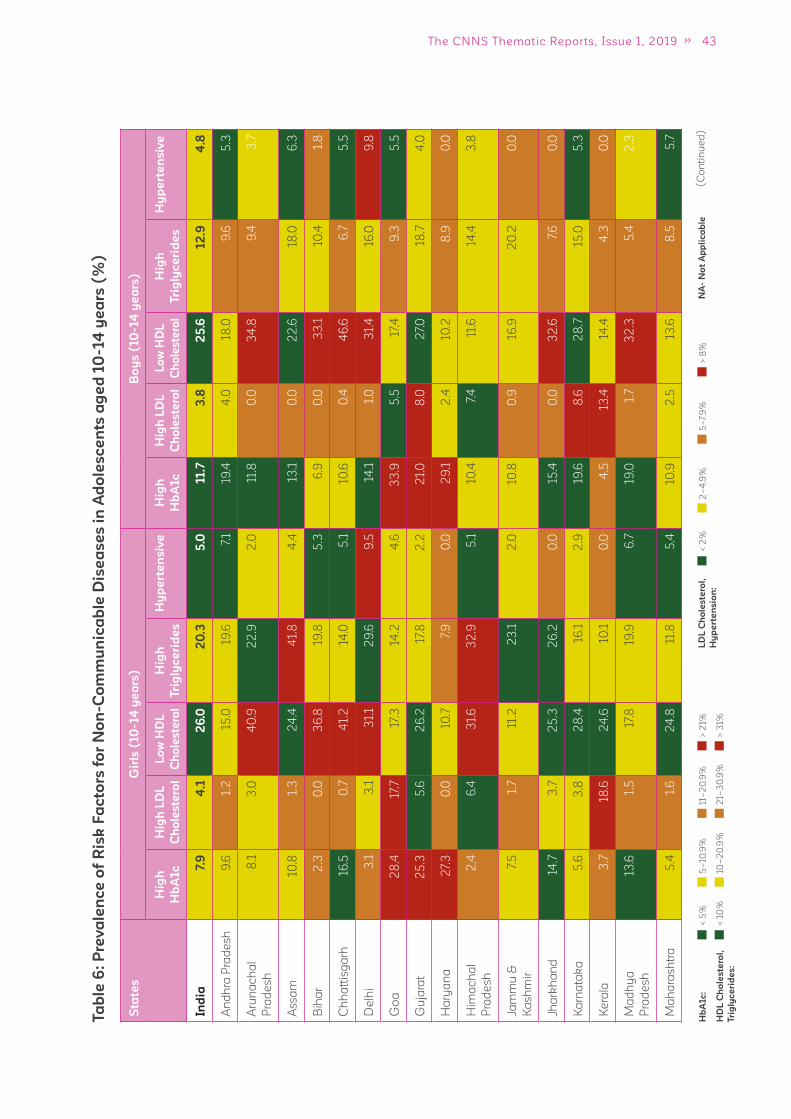
43The CNNS Thematic Reports, Issue 1, 2019
Ta
ble
6:
Pre
va
len
ce
of
Ris
k F
ac
tors
fo
r N
on
-Co
mm
un
ica
ble
Dis
ea
se
s i
n A
do
les
ce
nts
ag
ed
10
-14
ye
ars
(%
)
(C
on
tin
ue
d)
< 5
%
< 1
0%
5–
10.9
%
10–
20
.9%
21–
30
.9%
11–
20
.9%
> 3
1%
> 2
1%H
bA
1c
:
HD
L C
ho
les
tero
l,
Tri
gly
ce
rid
es
:
< 2
%2
–4
.9%
5–
7.9
%>
8%
LD
L C
ho
les
tero
l,
Hy
pe
rte
ns
ion
:
NA
- N
ot
Ap
pli
ca
ble
Sta
tes
Gir
ls (
10
-14
ye
ars
)B
oy
s (
10
-14
ye
ars
)
Hig
h
Hb
A1c
Hig
h L
DL
Ch
ole
ste
rol
Lo
w H
DL
Ch
ole
ste
rol
Hig
h
Tri
gly
ce
rid
es
Hy
pe
rte
ns
ive
Hig
h
Hb
A1c
Hig
h L
DL
Ch
ole
ste
rol
Lo
w H
DL
Ch
ole
ste
rol
Hig
h
Tri
gly
ce
rid
es
Hy
pe
rte
ns
ive
Ind
ia7.
94
.12
6.0
20
.35
.011.7
3.8
25
.612
.94
.8
An
dh
ra P
rad
es
h9
.61.
215
.019
.67.
119
.44
.018
.09
.65
.3
Aru
na
ch
al
Pra
de
sh
8.1
3.0
40
.92
2.9
2.0
11.8
0.0
34
.89
.43
.7
As
sa
m10
.81.
32
4.4
41.
84
.413
.10
.02
2.6
18.0
6.3
Bih
ar
2.3
0.0
36
.819
.85
.36
.90
.03
3.1
10.4
1.8
Ch
ha
ttis
ga
rh16
.50
.74
1.2
14.0
5.1
10.6
0.4
46
.66
.75
.5
De
lhi
3.1
3.1
31.
12
9.6
9.5
14.1
1.0
31.
416
.09
.8
Go
a2
8.4
17.7
17.3
14.2
4.6
33
.95
.517
.49
.35
.5
Gu
jara
t2
5.3
5.6
26
.217
.82
.22
1.0
8.0
27.
018
.74
.0
Ha
rya
na
27.
30
.010
.77.
90
.02
9.1
2.4
10.2
8.9
0.0
Him
ac
ha
l
Pra
de
sh
2.4
6.4
31.
63
2.9
5.1
10.4
7.4
11.6
14.4
3.8
Jam
mu
&
Ka
sh
mir
7.5
1.7
11.2
23
.12
.010
.80
.916
.92
0.2
0.0
Jha
rkh
an
d14
.73
.72
5.3
26
.20
.015
.40
.03
2.6
7.6
0.0
Ka
rna
tak
a5
.63
.82
8.4
16.1
2.9
19.6
8.6
28
.715
.05
.3
Ke
rala
3.7
18.6
24
.610
.10
.04
.513
.414
.44
.30
.0
Ma
dh
ya
Pra
de
sh
13.6
1.5
17.8
19.9
6.7
19.0
1.7
32
.35
.42
.3
Ma
ha
ras
htr
a5
.41.
62
4.8
11.8
5.4
10.9
2.5
13.6
8.5
5.7
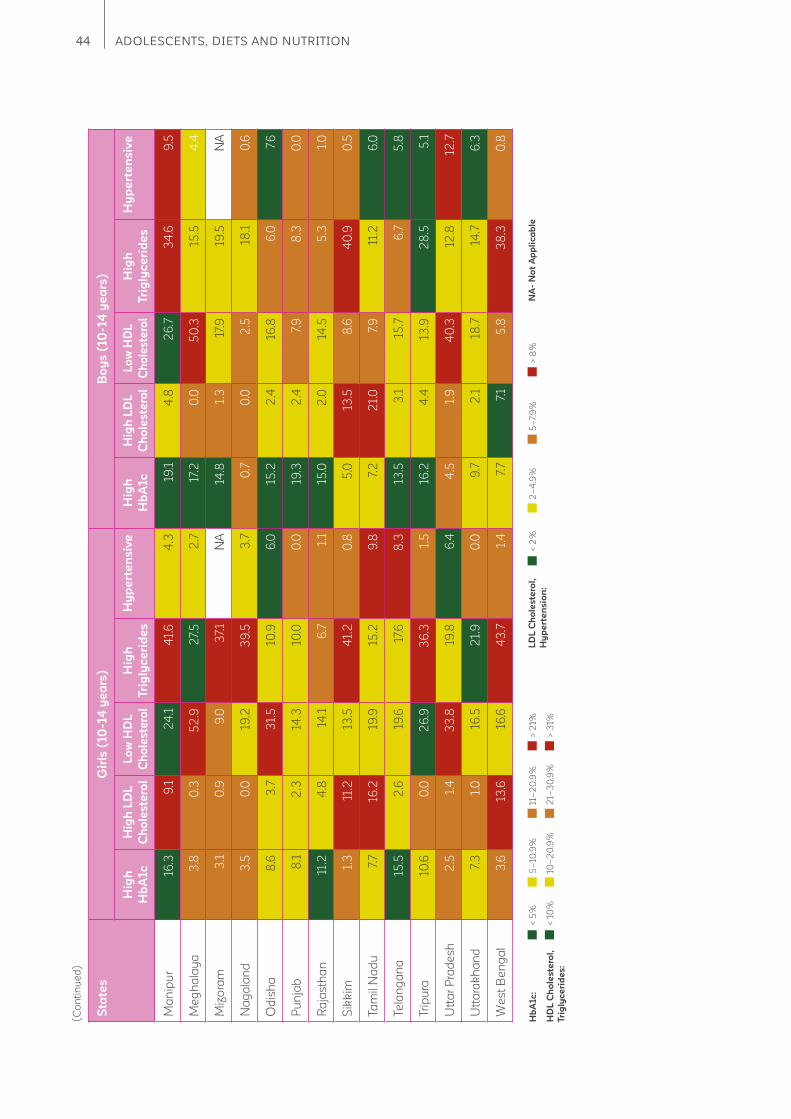
44 ADOLESCENTS, DIETS AND NUTRITION
(C
on
tin
ue
d)
Sta
tes
Gir
ls (
10
-14
ye
ars
)B
oy
s (
10
-14
ye
ars
)
Hig
h
Hb
A1c
Hig
h L
DL
Ch
ole
ste
rol
Lo
w H
DL
Ch
ole
ste
rol
Hig
h
Tri
gly
ce
rid
es
Hy
pe
rte
ns
ive
Hig
h
Hb
A1c
Hig
h L
DL
Ch
ole
ste
rol
Lo
w H
DL
Ch
ole
ste
rol
Hig
h
Tri
gly
ce
rid
es
Hy
pe
rte
ns
ive
Ma
nip
ur
16.3
9.1
24
.14
1.6
4.3
19.1
4.8
26
.73
4.6
9.5
Me
gh
ala
ya
3.8
0.3
52
.92
7.5
2.7
17.2
0.0
50
.315
.54
.4
Miz
ora
m3
.10
.99
.03
7.1
NA
14.8
1.3
17.9
19.5
NA
Na
ga
lan
d3
.50
.019
.23
9.5
3.7
0.7
0.0
2.5
18.1
0.6
Od
ish
a8
.63
.73
1.5
10.9
6.0
15.2
2.4
16.8
6.0
7.6
Pu
nja
b8
.12
.314
.310
.00
.019
.32
.47.
98
.30
.0
Ra
jas
tha
n11
.24
.814
.16
.71.
115
.02
.014
.55
.31.
0
Sik
kim
1.3
11.2
13.5
41.
20
.85
.013
.58
.64
0.9
0.5
Ta
mil
Na
du
7.7
16.2
19.9
15.2
9.8
7.2
21.
07.
911
.26
.0
Te
lan
ga
na
15.5
2.6
19.6
17.6
8.3
13.5
3.1
15.7
6.7
5.8
Trip
ura
10.6
0.0
26
.93
6.3
1.5
16.2
4.4
13.9
28
.55
.1
Utt
ar
Pra
de
sh
2.5
1.4
33
.819
.86
.44
.51.
94
0.3
12.8
12.7
Utt
ara
kh
an
d7.
31.
016
.52
1.9
0.0
9.7
2.1
18.7
14.7
6.3
We
st
Be
ng
al
3.6
13.6
16.6
43
.71.
47.
77.
15
.83
8.3
0.8
< 5
%
< 1
0%
5–
10.9
%
10–
20
.9%
21–
30
.9%
11–
20
.9%
> 3
1%
> 2
1%H
bA
1c
:
HD
L C
ho
les
tero
l,
Tri
gly
ce
rid
es
:
< 2
%2
–4
.9%
5–
7.9
%>
8%
LD
L C
ho
les
tero
l,
Hy
pe
rte
ns
ion
:
NA
- N
ot
Ap
pli
ca
ble

45The CNNS Thematic Reports, Issue 1, 2019
Ta
ble
6:
Pre
va
len
ce
of
Ris
k F
ac
tors
fo
r N
on
-Co
mm
un
ica
ble
Dis
ea
se
s i
n A
do
les
ce
nts
ag
ed
15
-19
ye
ars
(%
)
(C
on
tin
ue
d)
Sta
tes
Gir
ls (
15
-19
ye
ars
)B
oy
s (
15
-19
ye
ars
)
Hig
h
Hb
A1c
Hig
h L
DL
Ch
ole
ste
rol
Lo
w H
DL
Ch
ole
ste
rol
Hig
h
Tri
gly
ce
rid
es
Hy
pe
rte
ns
ive
Hig
h
Hb
A1c
Hig
h L
DL
Ch
ole
ste
rol
Lo
w H
DL
Ch
ole
ste
rol
Hig
h
Tri
gly
ce
rid
es
Hy
pe
rte
ns
ive
Ind
ia7.
44
.32
3.8
15
.85
.010
.93
.03
8.6
15
.54
.6
An
dh
ra P
rad
es
h12
.44
.17.
110
.92
.311
.53
.22
4.7
20
.54
.9
Aru
na
ch
al
Pra
de
sh
4.5
1.4
37.
719
.66
.06
.01.
04
7.6
15.8
2.7
As
sa
m0
.01.
515
.02
3.6
0.2
23
.60
.33
5.7
44
.77.
4
Bih
ar
2.6
0.7
30
.315
.18
.31.
41.
14
8.4
11.9
6.7
Ch
ha
ttis
ga
rh12
.41.
74
3.1
9.7
1.9
13.9
1.8
56
.52
.44
.9
De
lhi
3.2
2.1
30
.611
.29
.47.
51.
26
4.5
8.5
11.3
Go
a16
.42
8.6
5.2
13.0
1.3
19.7
10.3
27.
015
.012
.8
Gu
jara
t11
.61.
818
.112
.55
.119
.18
.73
0.2
19.6
7.8
Ha
rya
na
17.0
4.6
10.9
5.4
0.0
24
.03
.518
.22
3.9
0.0
Him
ac
ha
l
Pra
de
sh
2.0
6.6
29
.914
.80
.06
.03
.23
5.5
18.9
2.2
Jam
mu
&
Ka
sh
mir
9.2
2.1
12.3
13.1
3.7
5.2
4.1
26
.42
5.0
2.6
Jha
rkh
an
d8
.81.
814
.82
7.2
3.2
10.1
0.0
16.3
14.6
0.0
Ka
rna
tak
a16
.62
.64
1.1
9.3
1.9
22
.31.
95
5.4
9.5
2.2
Ke
rala
13.5
19.7
11.3
5.0
1.8
6.6
5.1
36
.413
.10
.8
Ma
dh
ya
Pra
de
sh
1.8
2.9
15.0
13.8
10.4
15.8
0.6
38
.54
.212
.7
Ma
ha
ras
htr
a10
.16
.22
3.0
2.1
3.2
8.0
1.3
36
.13
.61.
7
< 5
%
< 1
0%
5–
10.9
%
10–
20
.9%
21–
30
.9%
11–
20
.9%
> 3
1%
> 2
1%H
bA
1c
:
HD
L C
ho
les
tero
l,
Tri
gly
ce
rid
es
:
< 2
%2
–4
.9%
5–
7.9
%>
8%
LD
L C
ho
les
tero
l,
Hy
pe
rte
ns
ion
:
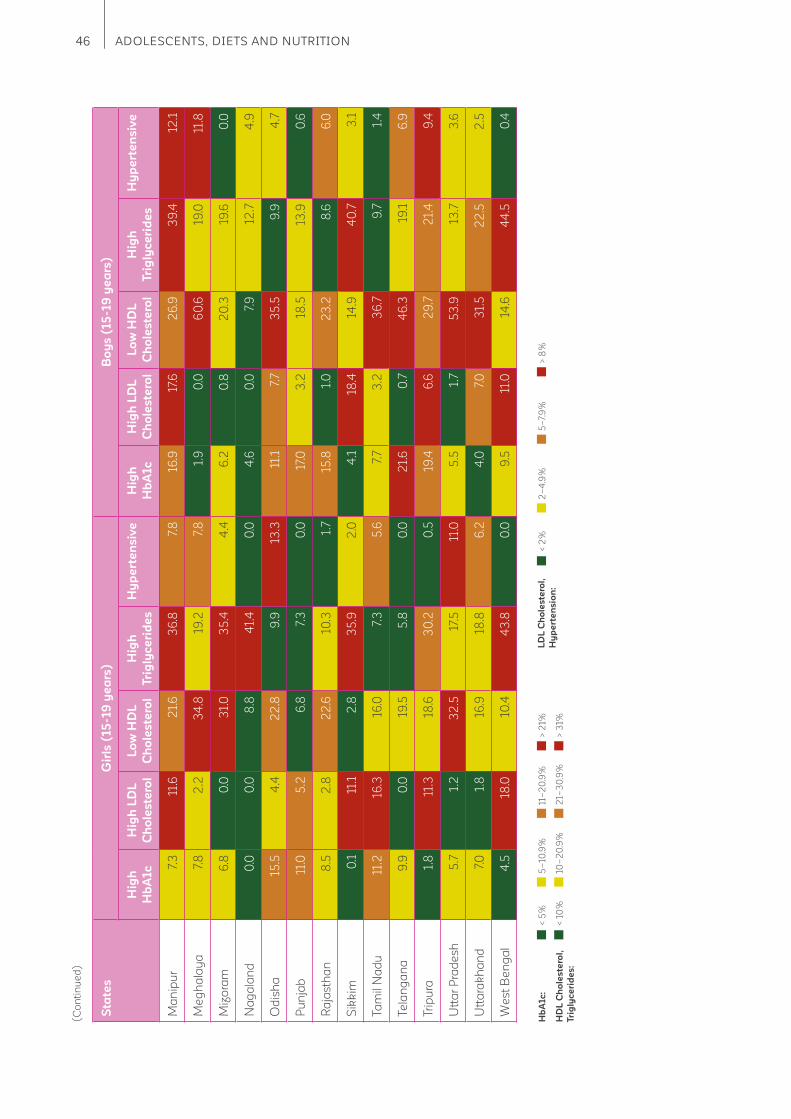
46 ADOLESCENTS, DIETS AND NUTRITION
(C
on
tin
ue
d)
Sta
tes
Gir
ls (
15
-19
ye
ars
)B
oy
s (
15
-19
ye
ars
)
Hig
h
Hb
A1c
Hig
h L
DL
Ch
ole
ste
rol
Lo
w H
DL
Ch
ole
ste
rol
Hig
h
Tri
gly
ce
rid
es
Hy
pe
rte
ns
ive
Hig
h
Hb
A1c
Hig
h L
DL
Ch
ole
ste
rol
Lo
w H
DL
Ch
ole
ste
rol
Hig
h
Tri
gly
ce
rid
es
Hy
pe
rte
ns
ive
Ma
nip
ur
7.3
11.6
21.
63
6.8
7.8
16.9
17.6
26
.93
9.4
12.1
Me
gh
ala
ya
7.8
2.2
34
.819
.27.
81.
90
.06
0.6
19.0
11.8
Miz
ora
m6
.80
.03
1.0
35
.44
.46
.20
.82
0.3
19.6
0.0
Na
ga
lan
d0
.00
.08
.84
1.4
0.0
4.6
0.0
7.9
12.7
4.9
Od
ish
a15
.54
.42
2.8
9.9
13.3
11.1
7.7
35
.59
.94
.7
Pu
nja
b11
.05
.26
.87.
30
.017
.03
.218
.513
.90
.6
Ra
jas
tha
n8
.52
.82
2.6
10.3
1.7
15.8
1.0
23
.28
.66
.0
Sik
kim
0.1
11.1
2.8
35
.92
.04
.118
.414
.94
0.7
3.1
Ta
mil
Na
du
11.2
16.3
16.0
7.3
5.6
7.7
3.2
36
.79
.71.
4
Te
lan
ga
na
9.9
0.0
19.5
5.8
0.0
21.
60
.74
6.3
19.1
6.9
Trip
ura
1.8
11.3
18.6
30
.20
.519
.46
.62
9.7
21.
49
.4
Utt
ar
Pra
de
sh
5.7
1.2
32
.517
.511
.05
.51.
75
3.9
13.7
3.6
Utt
ara
kh
an
d7.
01.
816
.918
.86
.24
.07.
03
1.5
22
.52
.5
We
st
Be
ng
al
4.5
18.0
10.4
43
.80
.09
.511
.014
.64
4.5
0.4
< 5
%
< 1
0%
5–
10.9
%
10–
20
.9%
21–
30
.9%
11–
20
.9%
> 3
1%
> 2
1%H
bA
1c
:
HD
L C
ho
les
tero
l,
Tri
gly
ce
rid
es
:
< 2
%2
–4
.9%
5–
7.9
%>
8%
LD
L C
ho
les
tero
l,
Hy
pe
rte
ns
ion
:
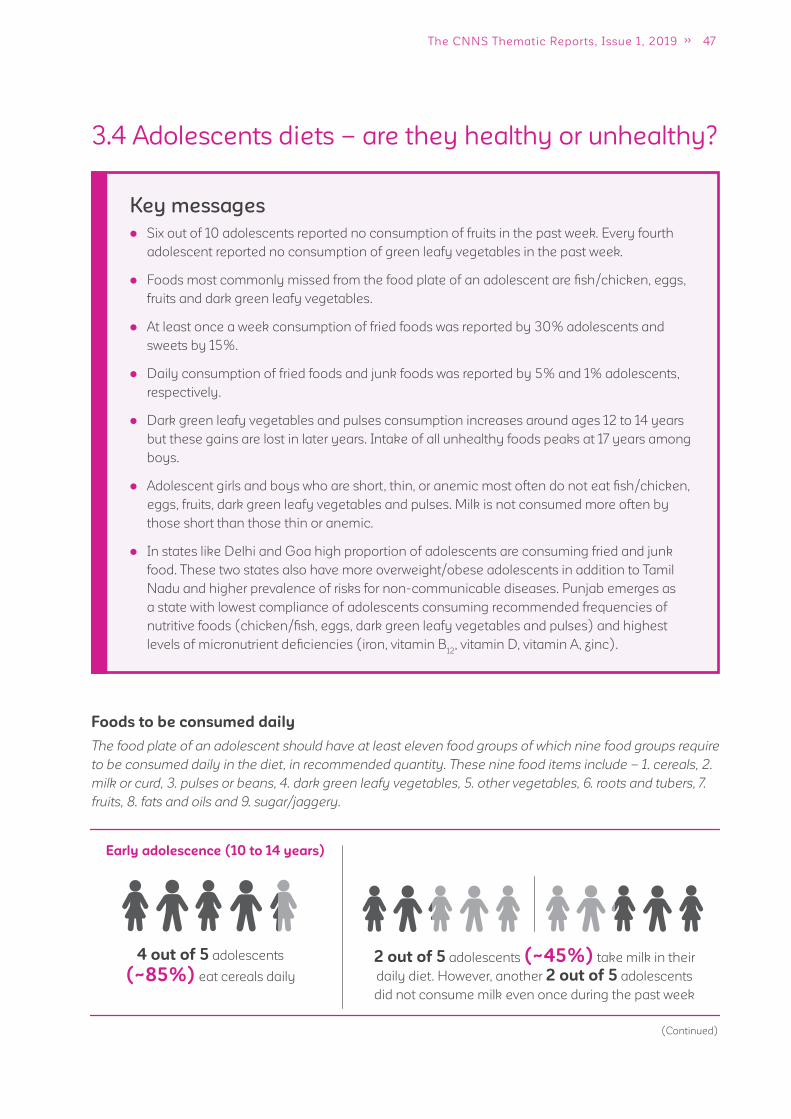
47The CNNS Thematic Reports, Issue 1, 2019
3.4 Adolescents diets – are they healthy or unhealthy?
Key messages
Six out of 10 adolescents reported no consumption of fruits in the past week. Every fourth
adolescent reported no consumption of green leafy vegetables in the past week.
Foods most commonly missed from the food plate of an adolescent are fi sh/chicken, eggs,
fruits and dark green leafy vegetables.
At least once a week consumption of fried foods was reported by 30% adolescents and
sweets by 15%.
Daily consumption of fried foods and junk foods was reported by 5% and 1% adolescents,
respectively.
Dark green leafy vegetables and pulses consumption increases around ages 12 to 14 years
but these gains are lost in later years. Intake of all unhealthy foods peaks at 17 years among
boys.
Adolescent girls and boys who are short, thin, or anemic most often do not eat fi sh/chicken,
eggs, fruits, dark green leafy vegetables and pulses. Milk is not consumed more often by
those short than those thin or anemic.
In states like Delhi and Goa high proportion of adolescents are consuming fried and junk
food. These two states also have more overweight/obese adolescents in addition to Tamil
Nadu and higher prevalence of risks for non-communicable diseases. Punjab emerges as
a state with lowest compliance of adolescents consuming recommended frequencies of
nutritive foods (chicken/fi sh, eggs, dark green leafy vegetables and pulses) and highest
levels of micronutrient defi ciencies (iron, vitamin B12
, vitamin D, vitamin A, zinc).
Foods to be consumed daily
The food plate of an adolescent should have at least eleven food groups of which nine food groups require
to be consumed daily in the diet, in recommended quantity. These nine food items include – 1. cereals, 2.
milk or curd, 3. pulses or beans, 4. dark green leafy vegetables, 5. other vegetables, 6. roots and tubers, 7.
fruits, 8. fats and oils and 9. sugar/jaggery.
(Continued)
Early adolescence (10 to 14 years)
4 out of 5 adolescents
(~85%) eat cereals daily
2 out of 5 adolescents (~45%) take milk in their
daily diet. However, another 2 out of 5 adolescents
did not consume milk even once during the past week
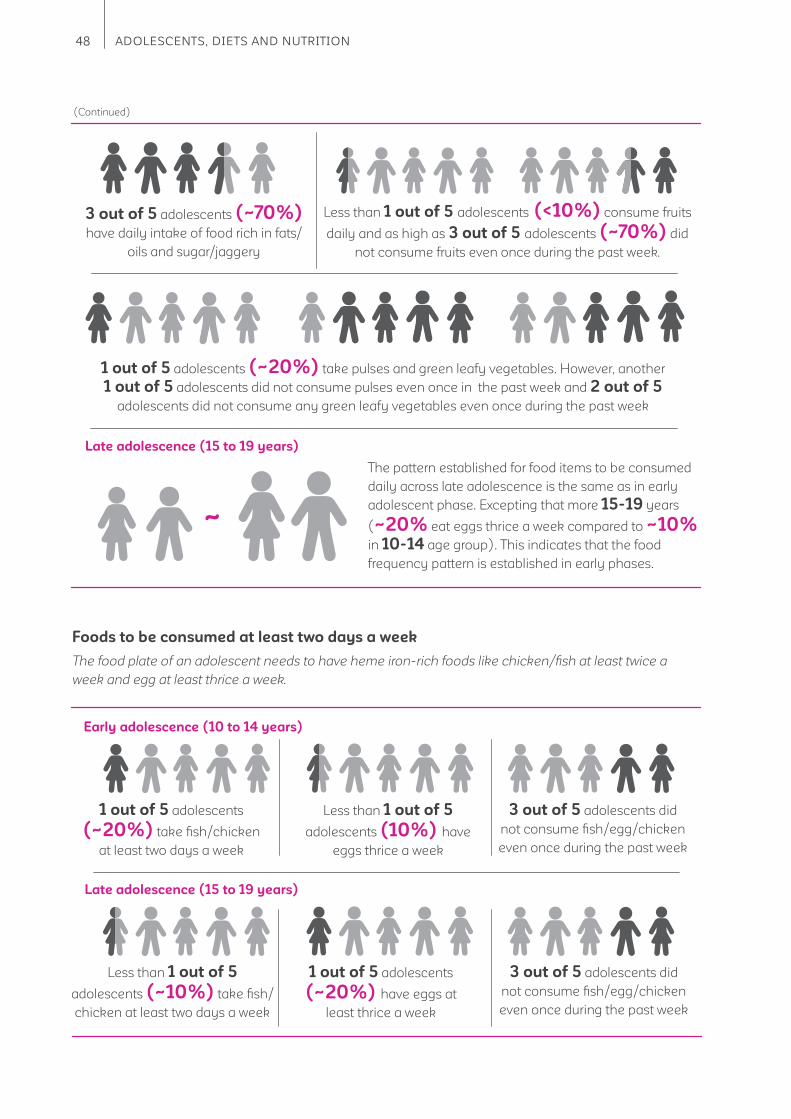
48 ADOLESCENTS, DIETS AND NUTRITION
Foods to be consumed at least two days a week
The food plate of an adolescent needs to have heme iron-rich foods like chicken/fi sh at least twice a
week and egg at least thrice a week.
(Continued)
3 out of 5 adolescents (~70%)
have daily intake of food rich in fats/
oils and sugar/jaggery
Less than 1 out of 5 adolescents (<10%) consume fruits
daily and as high as 3 out of 5 adolescents (~70%) did
not consume fruits even once during the past week.
1 out of 5 adolescents (~20%) take pulses and green leafy vegetables. However, another
1 out of 5 adolescents did not consume pulses even once in the past week and 2 out of 5
adolescents did not consume any green leafy vegetables even once during the past week
Late adolescence (15 to 19 years)
The pattern established for food items to be consumed
daily across late adolescence is the same as in early
adolescent phase. Excepting that more 15-19 years
(~20% eat eggs thrice a week compared to ~10% in 10-14 age group). This indicates that the food
frequency pattern is established in early phases.
~
Late adolescence (15 to 19 years)
Early adolescence (10 to 14 years)
1 out of 5 adolescents
(~20%) take fi sh/chicken
at least two days a week
Less than 1 out of 5
adolescents (~10%) take fi sh/
chicken at least two days a week
Less than 1 out of 5
adolescents (10%) have
eggs thrice a week
1 out of 5 adolescents
(~20%) have eggs at
least thrice a week
3 out of 5 adolescents did
not consume fi sh/egg/chicken
even once during the past week
3 out of 5 adolescents did
not consume fi sh/egg/chicken
even once during the past week

49The CNNS Thematic Reports, Issue 1, 2019
Foods to be avoided
The food plate of an adolescent should not include or include rarely – junk foods, fried foods, sweets and
aerated drinks.
Early adolescence (10 to 14 years)
1%
adolescents
ate junk food
daily
1%
consumed
aerated drinks
daily
2%
adolescents
ate sweets
daily
2%
adolescents ate
junk food 3 times
a week
Junk foods Sweets Aerated drinks
2%
consumed
aerated drinks
3 times a week
2%
adolescents ate
sweets 3 times a
week
Consumption of food groups by 10-14 year old girls and boys, by percentage, CNNS
2016-18 (India)
1
2
3
4
5
6 7
8
9
10
11
1
2
3
4
5
6 7 8
9
10
11
<25% 25–50% 51–75% >75%
1 – Cereals
2 – Milk or curd
3 – Pulses or beans
4 – Dark green leafy vegetables
5 – Other vegetables
6 – Roots and tubers
7 – Fruits
8 – Fats and oils
9 – Sugar and jaggery
10 – Fish/chicken
11 – Eggs
The India donut graph for 15-19 year old adolescents as well, in the same manner as above.
Consumption of food groups by 15-19 year old girls and boys, by percentage, CNNS
2016-18 (India)
<25% 25–50% 51–75% >75%
1 – Cereals
2 – Milk or curd
3 – Pulses or beans
4 – Dark green leafy vegetables
5 – Other vegetables
6 – Roots and tubers
7 – Fruits
8 – Fats and oils
9 – Sugar and jaggery
10 – Fish/chicken
11 – Eggs
The India donut graph for 15-19 year old adolescents as well, in the same manner as above.
1
2
3
4
5
6 7
8
9
10
11
1
2
3
4
5 6 7 8
9
10
11
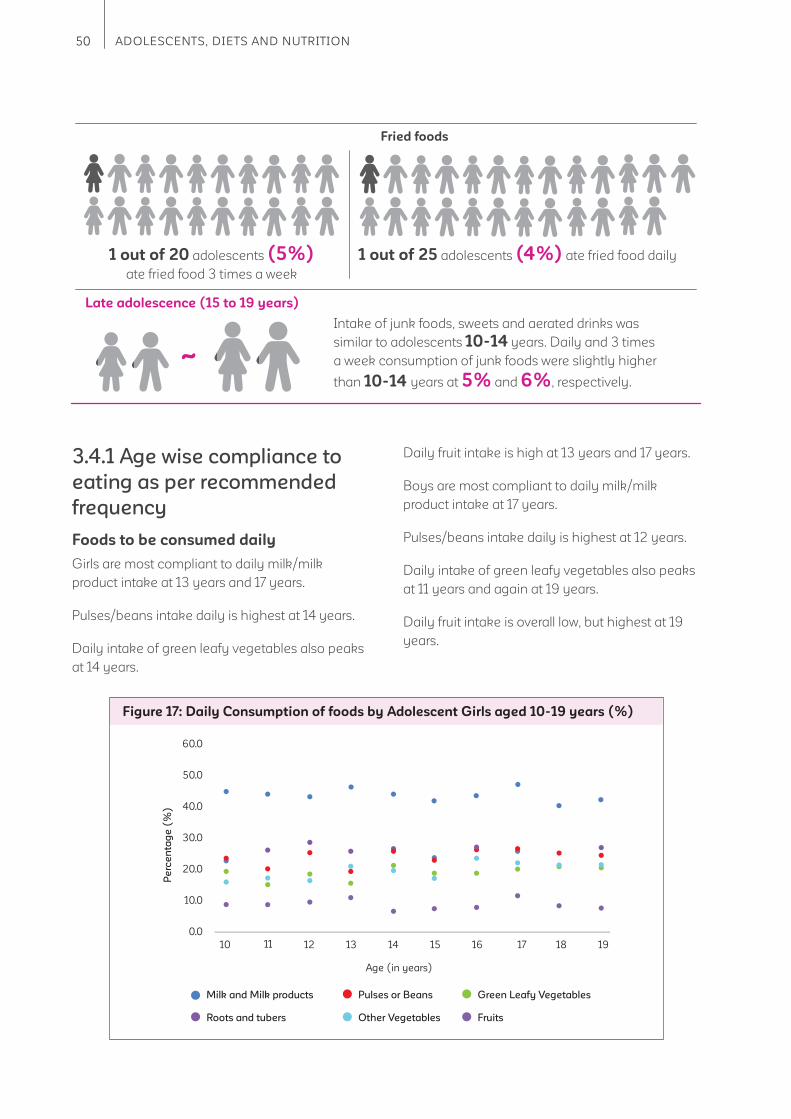
50 ADOLESCENTS, DIETS AND NUTRITION
3.4.1 Age wise compliance to
eating as per recommended
frequency
Foods to be consumed daily
Girls are most compliant to daily milk/milk
product intake at 13 years and 17 years.
Pulses/beans intake daily is highest at 14 years.
Daily intake of green leafy vegetables also peaks
at 14 years.
Daily fruit intake is high at 13 years and 17 years.
Boys are most compliant to daily milk/milk
product intake at 17 years.
Pulses/beans intake daily is highest at 12 years.
Daily intake of green leafy vegetables also peaks
at 11 years and again at 19 years.
Daily fruit intake is overall low, but highest at 19
years.
Figure 17: Daily Consumption of foods by Adolescent Girls aged 10-19 years (%)
Milk and Milk products
Roots and tubers
Green Leafy Vegetables
Fruits
Pulses or Beans
Other Vegetables
60.0
50.0
40.0
30.0
20.0
10.0
0.0
10 11 12 13 14 15 16 17 18 19
Pe
rce
nta
ge
(%
)
Age (in years)
Late adolescence (15 to 19 years)
Intake of junk foods, sweets and aerated drinks was
similar to adolescents 10-14 years. Daily and 3 times
a week consumption of junk foods were slightly higher
than 10-14 years at 5% and 6%, respectively.
Fried foods
1 out of 20 adolescents (5%)
ate fried food 3 times a week
1 out of 25 adolescents (4%) ate fried food daily
~
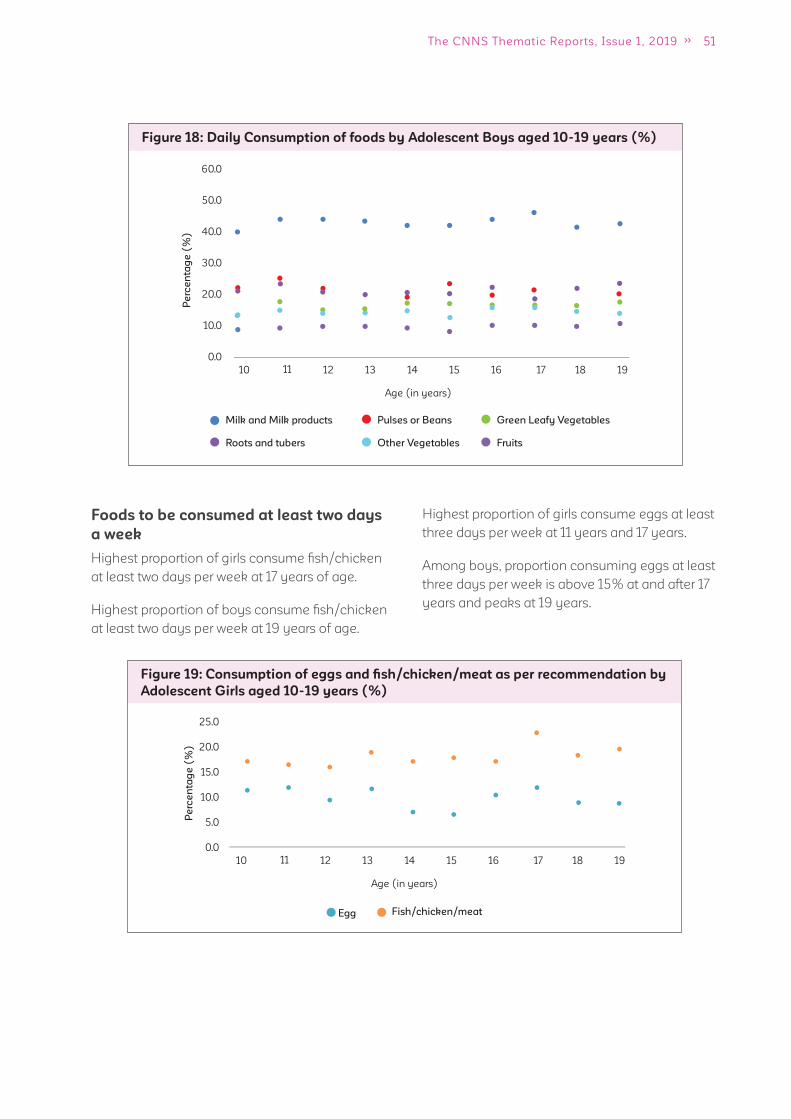
51The CNNS Thematic Reports, Issue 1, 2019
Figure 19: Consumption of eggs and fi sh/chicken/meat as per recommendation by
Adolescent Girls aged 10-19 years (%)
Egg Fish/chicken/meat
25.0
20.0
15.0
10.0
5.0
0.0
10 11 12 13 14 15 16 17 18 19
Pe
rce
nta
ge
(%
)
Age (in years)
Figure 18: Daily Consumption of foods by Adolescent Boys aged 10-19 years (%)
Milk and Milk products
Roots and tubers
Green Leafy Vegetables
Fruits
Pulses or Beans
Other Vegetables
60.0
50.0
40.0
30.0
20.0
10.0
0.0
10 11 12 13 14 15 16 17 18 19
Pe
rce
nta
ge
(%
)
Age (in years)
Foods to be consumed at least two days
a week
Highest proportion of girls consume fi sh/chicken
at least two days per week at 17 years of age.
Highest proportion of boys consume fi sh/chicken
at least two days per week at 19 years of age.
Highest proportion of girls consume eggs at least
three days per week at 11 years and 17 years.
Among boys, proportion consuming eggs at least
three days per week is above 15% at and after 17
years and peaks at 19 years.

52 ADOLESCENTS, DIETS AND NUTRITION
Foods to be avoided
Among girls, consumption of all avoidable food
fl uctuates throughout adolescence with different
peak consumption ages for the four foods we
investigated. Fried food intake three times per
week peaks at 15 years while daily at 17 years
though it is close to peak value at 15 years too.
Junk food intake three times a week is marginally
higher at 17 years of age compared with other
ages. Daily sweet intake increase steadily among
girls with increasing age and peaks at 16 years
and daily intake of aerated drinks peaks at 19
years of age.
Among boys, there is a very distinct pattern of
increasing consumption in late adolescence
compared with early adolescence for all avoidable
foods. When daily intake is considered fried foods
intake peaks at 15 years, junk foods at 17 years,
sweets at 16 years and aerated drinks at 18 years.
6
5
4
3
2
1
0
10 11 12 13 14 15 16 17 18 19
Fried foods Junk foods Sweets Aerated drinks
Pe
rce
nta
ge
(%
)
Age (in years)
Figure 21: Foods to be Avoided: Daily Consumption by Adolescent Girls aged
10-19 years (%)
Figure 20: Consumption of eggs and fi sh/chicken/meat as per recommendation by
Adolescent Boys aged 10-19 years (%)
Egg Fish/chicken/meat
30.0
25.0
20.0
15.0
10.0
5.0
0.0
10 11 12 13 14 15 16 17 18 19
Pe
rce
nta
ge
(%
)
Age (in years)
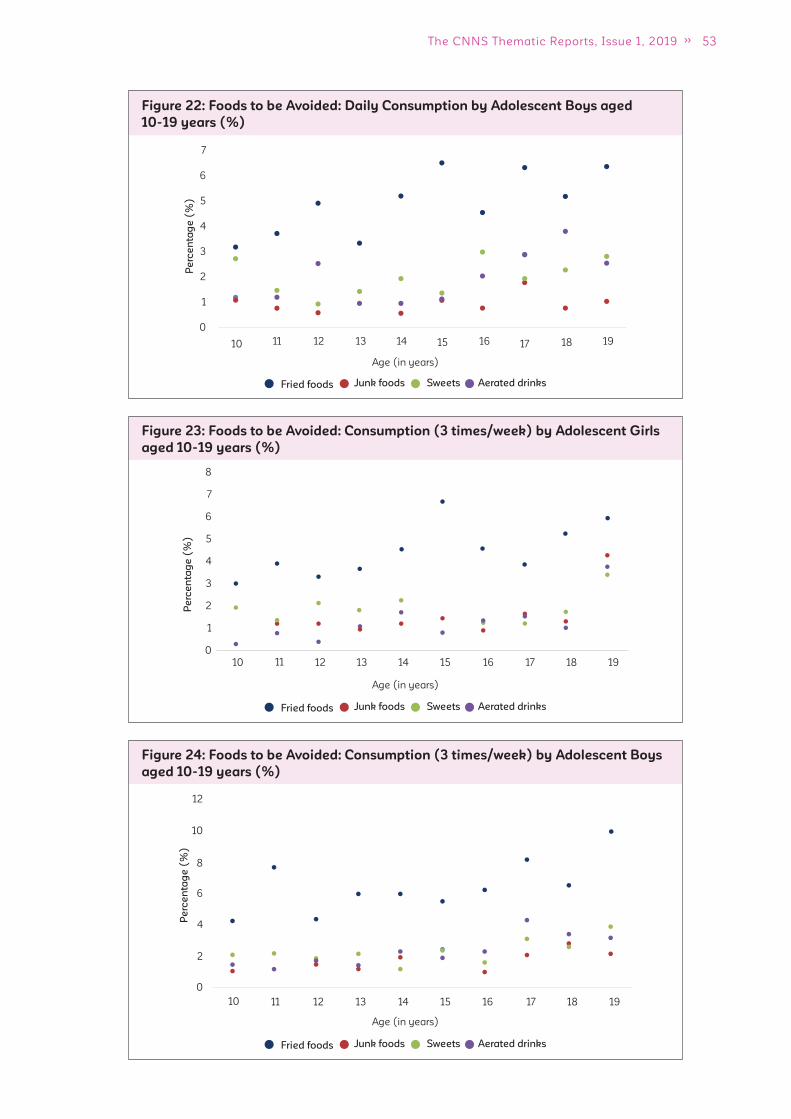
53The CNNS Thematic Reports, Issue 1, 2019
Figure 24: Foods to be Avoided: Consumption (3 times/week) by Adolescent Boys
aged 10-19 years (%)
Fried foods Junk foods Sweets Aerated drinks
12
10
10
8
6
4
2
0
11 12 13 14 15 16 17 18 19
Pe
rce
nta
ge
(%
)
Age (in years)
Figure 23: Foods to be Avoided: Consumption (3 times/week) by Adolescent Girls
aged 10-19 years (%)
Fried foods Junk foods Sweets Aerated drinks
Age (in years)
Pe
rce
nta
ge
(%
)
10
8
0
1
2
3
4
5
6
7
11 12 13 14 15 16 17 18 19
Figure 22: Foods to be Avoided: Daily Consumption by Adolescent Boys aged
10-19 years (%)
6
7
5
4
3
2
1
0
10 11 12 13 14 15 16 17 18 19
Fried foods Junk foods Sweets Aerated drinks
Age (in years)
Pe
rce
nta
ge
(%
)
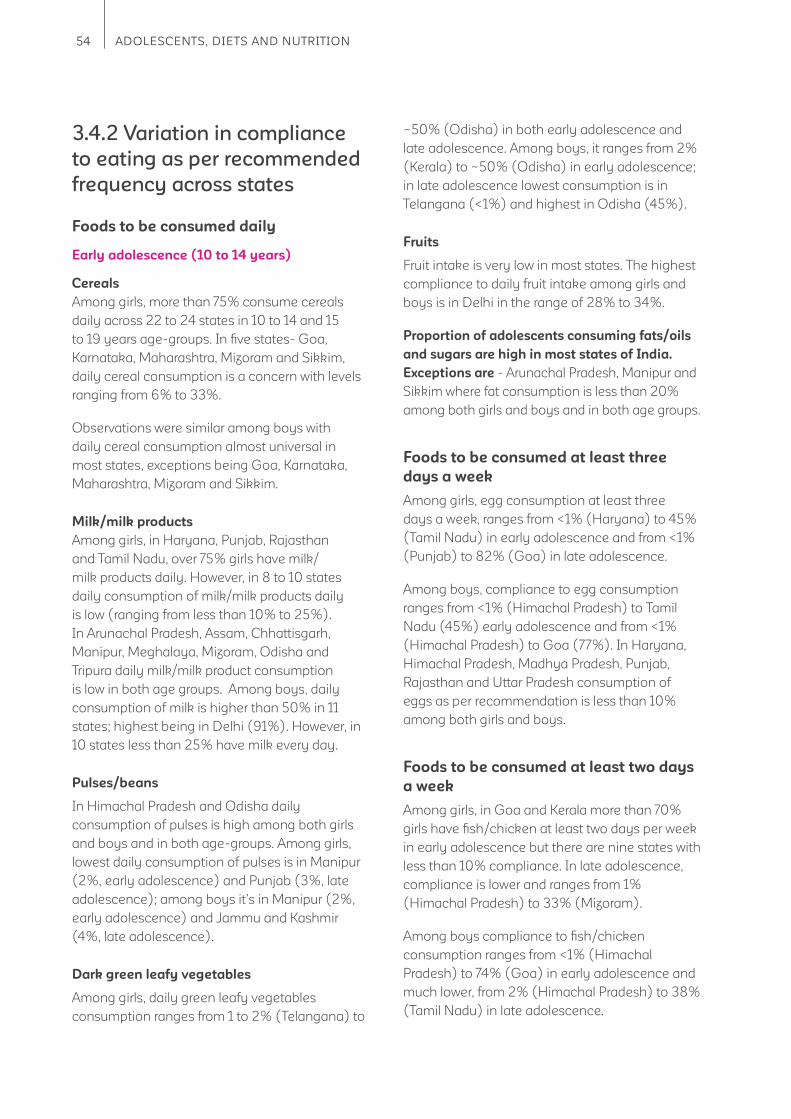
54 ADOLESCENTS, DIETS AND NUTRITION
3.4.2 Variation in compliance
to eating as per recommended
frequency across states
Foods to be consumed daily
Early adolescence (10 to 14 years)
Cereals
Among girls, more than 75% consume cereals
daily across 22 to 24 states in 10 to 14 and 15
to 19 years age-groups. In fi ve states- Goa,
Karnataka, Maharashtra, Mizoram and Sikkim,
daily cereal consumption is a concern with levels
ranging from 6% to 33%.
Observations were similar among boys with
daily cereal consumption almost universal in
most states, exceptions being Goa, Karnataka,
Maharashtra, Mizoram and Sikkim.
Milk/milk products
Among girls, in Haryana, Punjab, Rajasthan
and Tamil Nadu, over 75% girls have milk/
milk products daily. However, in 8 to 10 states
daily consumption of milk/milk products daily
is low (ranging from less than 10% to 25%).
In Arunachal Pradesh, Assam, Chhattisgarh,
Manipur, Meghalaya, Mizoram, Odisha and
Tripura daily milk/milk product consumption
is low in both age groups. Among boys, daily
consumption of milk is higher than 50% in 11
states; highest being in Delhi (91%). However, in
10 states less than 25% have milk every day.
Pulses/beans
In Himachal Pradesh and Odisha daily
consumption of pulses is high among both girls
and boys and in both age-groups. Among girls,
lowest daily consumption of pulses is in Manipur
(2%, early adolescence) and Punjab (3%, late
adolescence); among boys it’s in Manipur (2%,
early adolescence) and Jammu and Kashmir
(4%, late adolescence).
Dark green leafy vegetables
Among girls, daily green leafy vegetables
consumption ranges from 1 to 2% (Telangana) to
~50% (Odisha) in both early adolescence and
late adolescence. Among boys, it ranges from 2%
(Kerala) to ~50% (Odisha) in early adolescence;
in late adolescence lowest consumption is in
Telangana (<1%) and highest in Odisha (45%).
Fruits
Fruit intake is very low in most states. The highest
compliance to daily fruit intake among girls and
boys is in Delhi in the range of 28% to 34%.
Proportion of adolescents consuming fats/oils
and sugars are high in most states of India.
Exceptions are - Arunachal Pradesh, Manipur and
Sikkim where fat consumption is less than 20%
among both girls and boys and in both age groups.
Foods to be consumed at least three
days a week
Among girls, egg consumption at least three
days a week, ranges from <1% (Haryana) to 45%
(Tamil Nadu) in early adolescence and from <1%
(Punjab) to 82% (Goa) in late adolescence.
Among boys, compliance to egg consumption
ranges from <1% (Himachal Pradesh) to Tamil
Nadu (45%) early adolescence and from <1%
(Himachal Pradesh) to Goa (77%). In Haryana,
Himachal Pradesh, Madhya Pradesh, Punjab,
Rajasthan and Uttar Pradesh consumption of
eggs as per recommendation is less than 10%
among both girls and boys.
Foods to be consumed at least two days
a week
Among girls, in Goa and Kerala more than 70%
girls have fi sh/chicken at least two days per week
in early adolescence but there are nine states with
less than 10% compliance. In late adolescence,
compliance is lower and ranges from 1%
(Himachal Pradesh) to 33% (Mizoram).
Among boys compliance to fi sh/chicken
consumption ranges from <1% (Himachal
Pradesh) to 74% (Goa) in early adolescence and
much lower, from 2% (Himachal Pradesh) to 38%
(Tamil Nadu) in late adolescence.
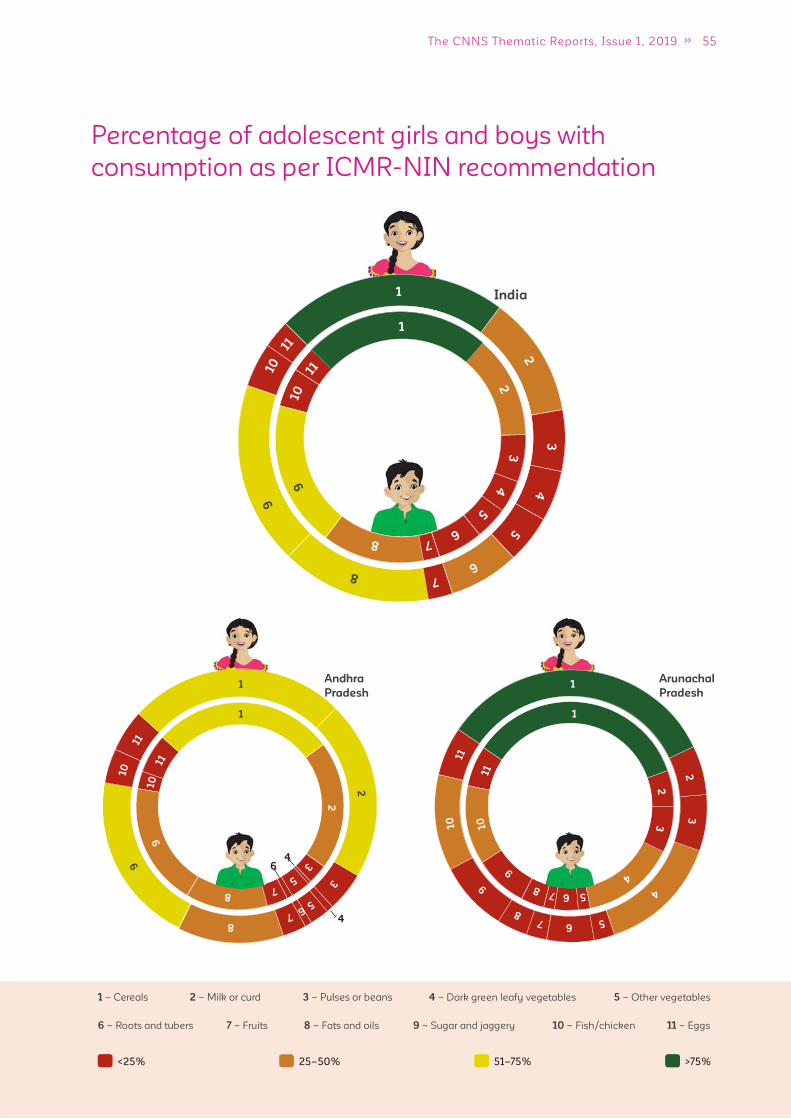
55The CNNS Thematic Reports, Issue 1, 2019
Percentage of adolescent girls and boys with
consumption as per ICMR-NIN recommendation
1 – Cereals 2 – Milk or curd 3 – Pulses or beans 4 – Dark green leafy vegetables 5 – Other vegetables
6 – Roots and tubers 7 – Fruits 8 – Fats and oils 9 – Sugar and jaggery 10 – Fish/chicken 11 – Eggs
<25% 25–50% 51–75% >75%
India 1
2
3
4
5
6 7
8
9
10
11
1
2
3
4
5
6 7 8
9
10
11
Andhra
Pradesh
4
64
Arunachal
Pradesh 1
2
3
4
5 6 7 8
9
10
11
1
2
3
4
5 6 7 8
9
10
11
1
2
3
5 6 7
8
9 10
11
1
2
3
5
7 8
9
10
11
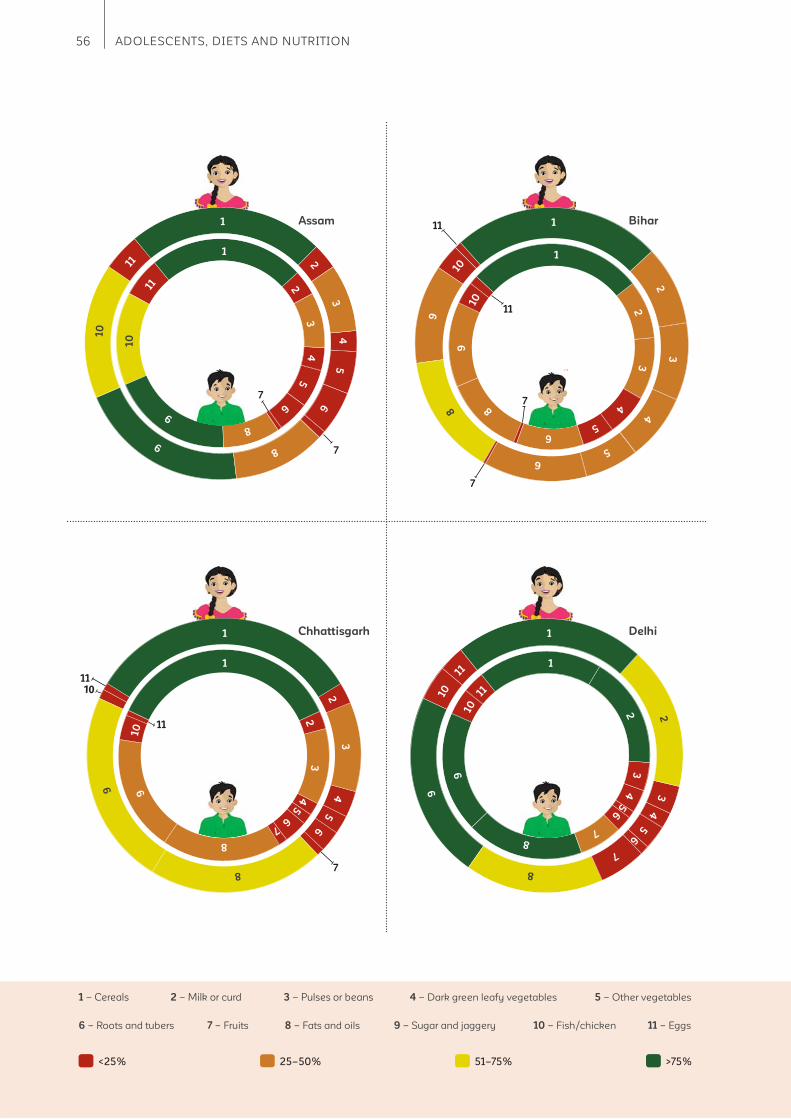
56 ADOLESCENTS, DIETS AND NUTRITION
1 – Cereals 2 – Milk or curd 3 – Pulses or beans 4 – Dark green leafy vegetables 5 – Other vegetables
6 – Roots and tubers 7 – Fruits 8 – Fats and oils 9 – Sugar and jaggery 10 – Fish/chicken 11 – Eggs
<25% 25–50% 51–75% >75%
Assam
7
1
2
3
4
5
6
8
9
10
11
1
2
3
4
5
6
8
9
10
11
7
Chhattisgarh
11
1110
7
Delhi 1
2
3
4
5
6
7
8
9
10
11 1
2
3
4
5 6
7
8
9
10
11
Bihar
6 5
4
3
1
2
3
4
5
6
8 9
10
1
2
3
4
5
6
8
9
10
11
11
7
7
1
2
3
4
5
6
8
9
1
2
3
4 5
6
7
8
9
10
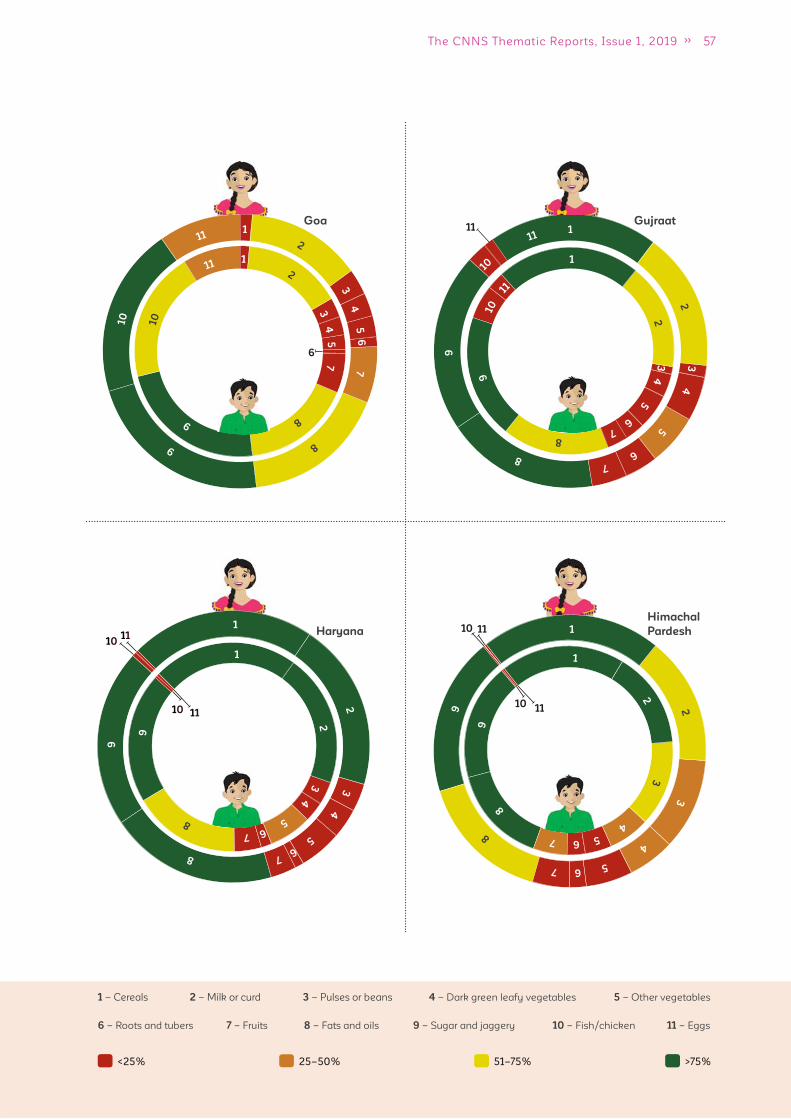
57The CNNS Thematic Reports, Issue 1, 2019
1 – Cereals 2 – Milk or curd 3 – Pulses or beans 4 – Dark green leafy vegetables 5 – Other vegetables
6 – Roots and tubers 7 – Fruits 8 – Fats and oils 9 – Sugar and jaggery 10 – Fish/chicken 11 – Eggs
<25% 25–50% 51–75% >75%
6
Goa11
Gujraat
1011
10 11
Haryana
Himachal
Pardesh 1
2
3
4
5 6 7
8 9
1
2 3
4 5 6 7
8 9
11
11
10
10
1
2
3
4
5 6
7
8
9
1
2
3
4
5 6 7
8
9
1
2
3
4
5
6
7
8
9
10
11
1
2
3
4
5
7
8
9
10
11
1
2
3
4
5
6 7
8
9
10
11
1
2
3
4
5
6 7
8
9
10
11
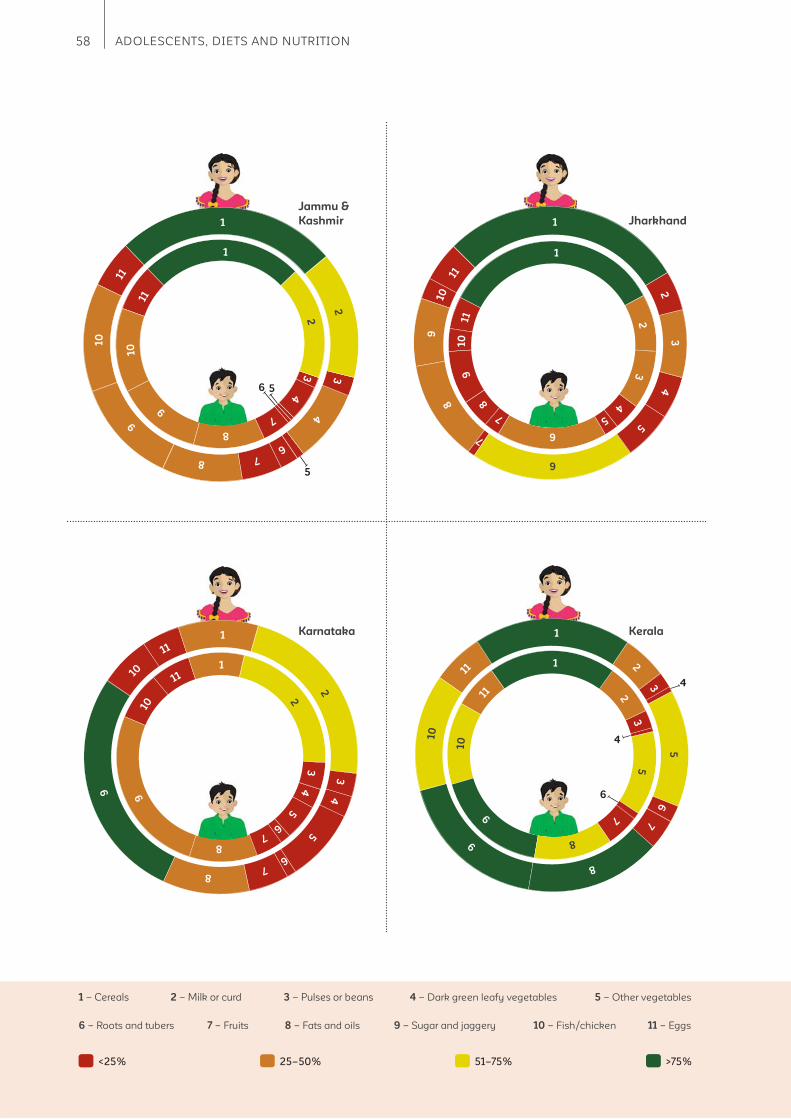
58 ADOLESCENTS, DIETS AND NUTRITION
1 – Cereals 2 – Milk or curd 3 – Pulses or beans 4 – Dark green leafy vegetables 5 – Other vegetables
6 – Roots and tubers 7 – Fruits 8 – Fats and oils 9 – Sugar and jaggery 10 – Fish/chicken 11 – Eggs
<25% 25–50% 51–75% >75%
Jammu &
Kashmir
5
56
1
2
3
4
6 7 8
9
10
11
1
2
3
4
7
8
9
10
11
6
4
4
KeralaKarnataka 1
2 3
4
5
6 7 8
9
10
11
Jharkhand 1
2
3
4
5
6
7
8 9
10
11
1
2
3
4
5
6
7
8
9
10
11
1
2 3
4
5
6 7
8
9
10
11
1
2
3
5
6
7
8
9
10
11 1
2
3
5
7
8
9
10
11

59The CNNS Thematic Reports, Issue 1, 2019
1 – Cereals 2 – Milk or curd 3 – Pulses or beans 4 – Dark green leafy vegetables 5 – Other vegetables
6 – Roots and tubers 7 – Fruits 8 – Fats and oils 9 – Sugar and jaggery 10 – Fish/chicken 11 – Eggs
<25% 25–50% 51–75% >75%
1 2
9
10
11
11
10
7
7
10
11
5
Madhya
Pradesh Maharastra
Manipur Meghalaya 1
2
3
4
5
6
7
8
9 10
11
1
2
3
4
5
6
7
8
9
10
11
1
2
3
4
5
6
7 8
9
10
11
1
2
3
4
5
6
7 8
9 10
11
1
2
3
4
5
6
8
9
1
2
3
4
6
8
9
1
2
3
4
5
6
7
8
9
10
11
1
2
3
4
5 6
7
8
9
10
11
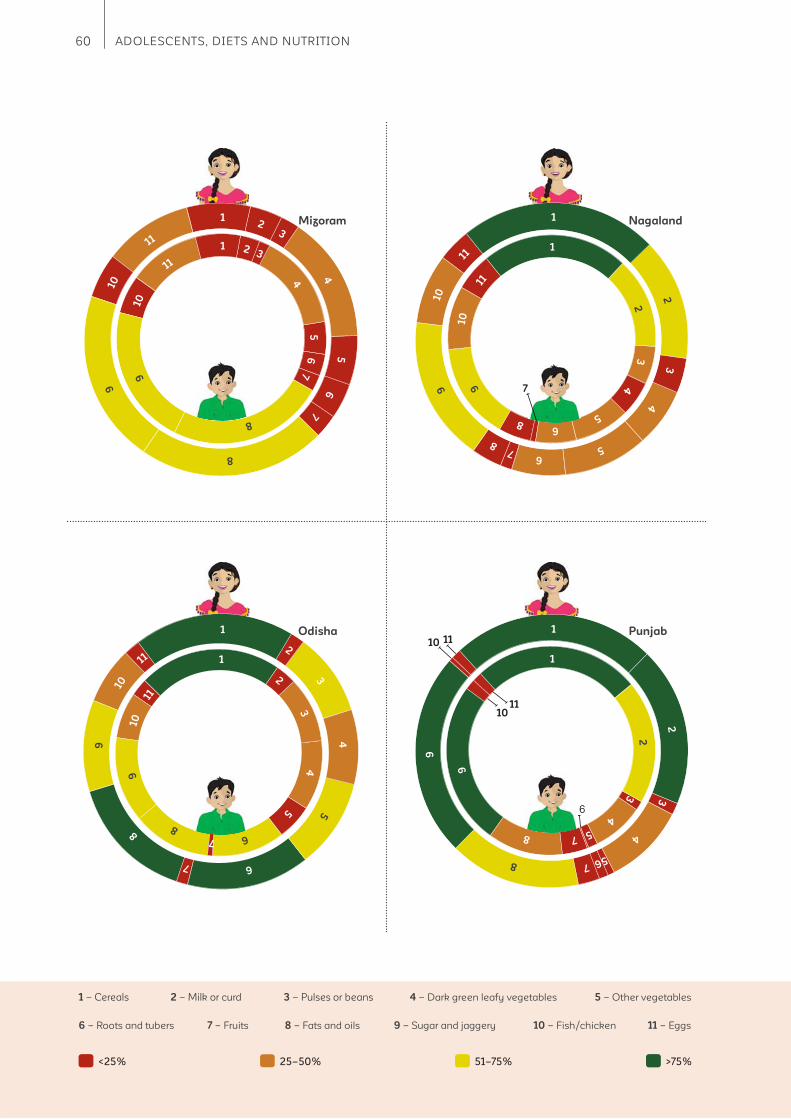
60 ADOLESCENTS, DIETS AND NUTRITION
1 – Cereals 2 – Milk or curd 3 – Pulses or beans 4 – Dark green leafy vegetables 5 – Other vegetables
6 – Roots and tubers 7 – Fruits 8 – Fats and oils 9 – Sugar and jaggery 10 – Fish/chicken 11 – Eggs
<25% 25–50% 51–75% >75%
Mizoram 1 2
3
4 5
6
7
8
9
10
11
7
Nagaland 1
2
3
4
5
6 7
8
9
10
11
Odisha 1
2
3
4
5
6
7
8
9
10
11
Punjab
6
1
2
3
4
5 6 7
8
9
11
11
10
10
1 2 3
4
5
6
7
8
9
10
11
1
2
3
4
5
6 8
9 10
11
1
2
3
4
5
6 7
8
9
10
11
1
2
3
4
5 7 8
9
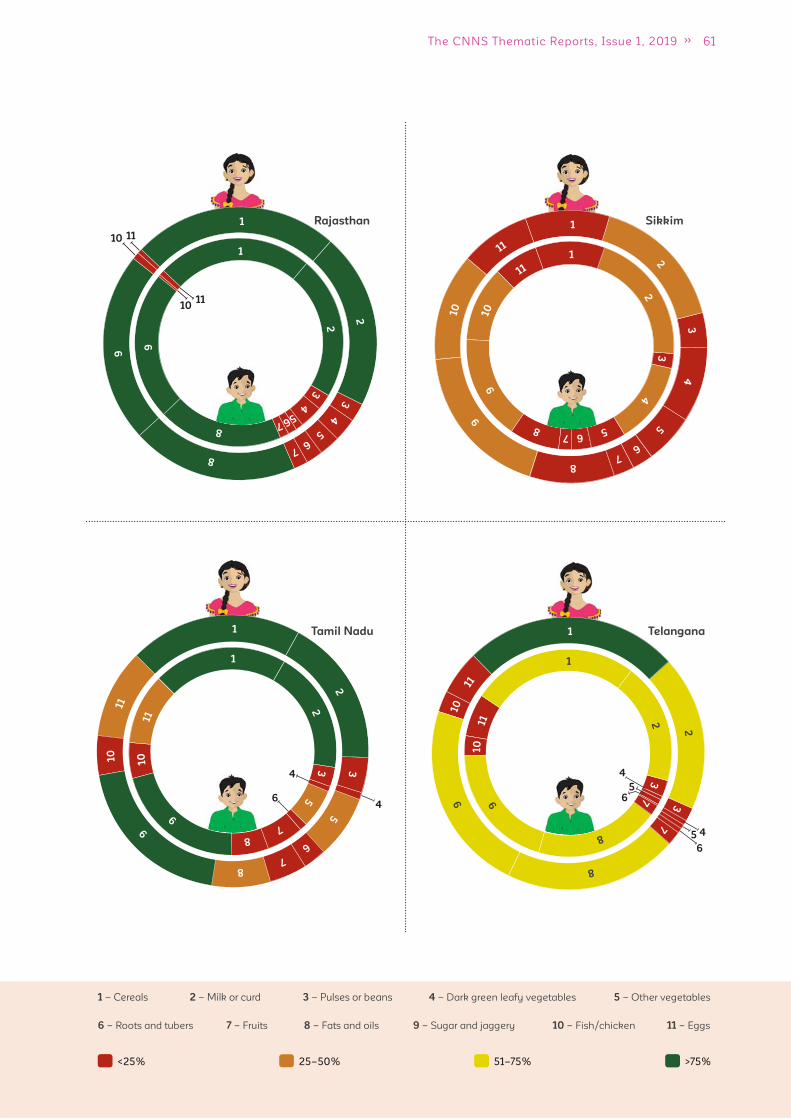
61The CNNS Thematic Reports, Issue 1, 2019
1 – Cereals 2 – Milk or curd 3 – Pulses or beans 4 – Dark green leafy vegetables 5 – Other vegetables
6 – Roots and tubers 7 – Fruits 8 – Fats and oils 9 – Sugar and jaggery 10 – Fish/chicken 11 – Eggs
<25% 25–50% 51–75% >75%
1
2 3
4
5 6 7 8
9
10
11
Rajasthan
11
11
10
10
1
2
3
4
5 6 7
8
9
Tamil Nadu 1
2 3
5
6 7
8
9
10
11
1
2
3
5
7 8
9
10
11
4
4
6
Telangana
4
4
5
5
6
6
1
2
3
7
8
9
10
11
1
2
3
7
8
9 10
11
Sikkim 1
2
3
4
5
6 7
8
9 10
11 1
2
3
4
5 6 7 8
9
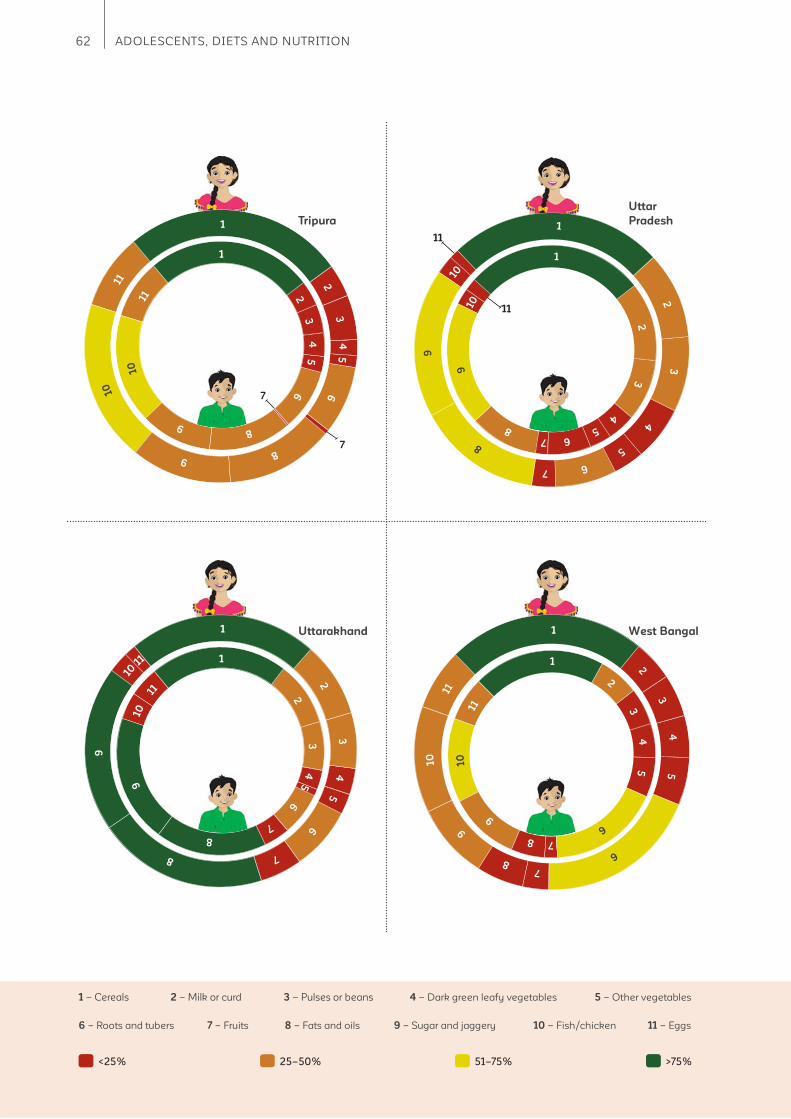
62 ADOLESCENTS, DIETS AND NUTRITION
1 – Cereals 2 – Milk or curd 3 – Pulses or beans 4 – Dark green leafy vegetables 5 – Other vegetables
6 – Roots and tubers 7 – Fruits 8 – Fats and oils 9 – Sugar and jaggery 10 – Fish/chicken 11 – Eggs
<25% 25–50% 51–75% >75%
Tripura
7
7
1
2
3
4
5
6
8 9
10
11
1
2
3
4
5
6
8
9
10
11
Uttarakhand 1
2
3
4
5
6
7
8
9
10 1
1 1
2
3
4
5
6
7
8
9
10
11
West Bangal 1
2
3
4
5
6
7 8
9
10
11
11
11
Uttar
Pradesh
1
2
3
4
5
6
7 8
9
10
11
1
2
3
4
5
6 7
8
9
10
1
2
3
4
5 6 7
8
9
10

63The CNNS Thematic Reports, Issue 1, 2019
1 – Cereals 2 – Milk or curd 3 – Pulses or beans 4 – Dark green leafy vegetables 5 – Other vegetables
6 – Roots and tubers 7 – Fruits 8 – Fats and oils 9 – Sugar and jaggery 10 – Fish/chicken 11 – Eggs
<25% 25–50% 51–75% >75%
Percentage of adolescent girls and boys with
consumption as per ICMR-NIN recommendation
Andhra
Pradesh
India 1
2
3
4
5
6 7
8
9
10
11
1
2
3
4
5
6 7 8
9
10
11
4
64
Arunachal
Pradesh 1
2
3
4
5 6 7 8
9
10
11
1
2
3
4
5 6 7 8
9
10
11
1
2
3
5 6 7
8
9 10
11
1
2
3
5
7 8
9
10
11

64 ADOLESCENTS, DIETS AND NUTRITION
1 – Cereals 2 – Milk or curd 3 – Pulses or beans 4 – Dark green leafy vegetables 5 – Other vegetables
6 – Roots and tubers 7 – Fruits 8 – Fats and oils 9 – Sugar and jaggery 10 – Fish/chicken 11 – Eggs
<25% 25–50% 51–75% >75%
Assam 1
2
3
4
5
6
7
8
9
10
11
Chhattisgarh
5
10
Delhi 1
2 3
4
5
6
7
8
9
10
11
1
2 3
4
5
6
7
8
9
10
11
Bihar 1
2
3
4
5
6 7
8
9
11
10
10
1
2
3
4
5
6
7 8
9
10
11
1
2
3
4 5 6
7
8
9
11
7
7
1
2
3
4
5
6
8
9 11
1
2
3
4
6
8
9
10
11
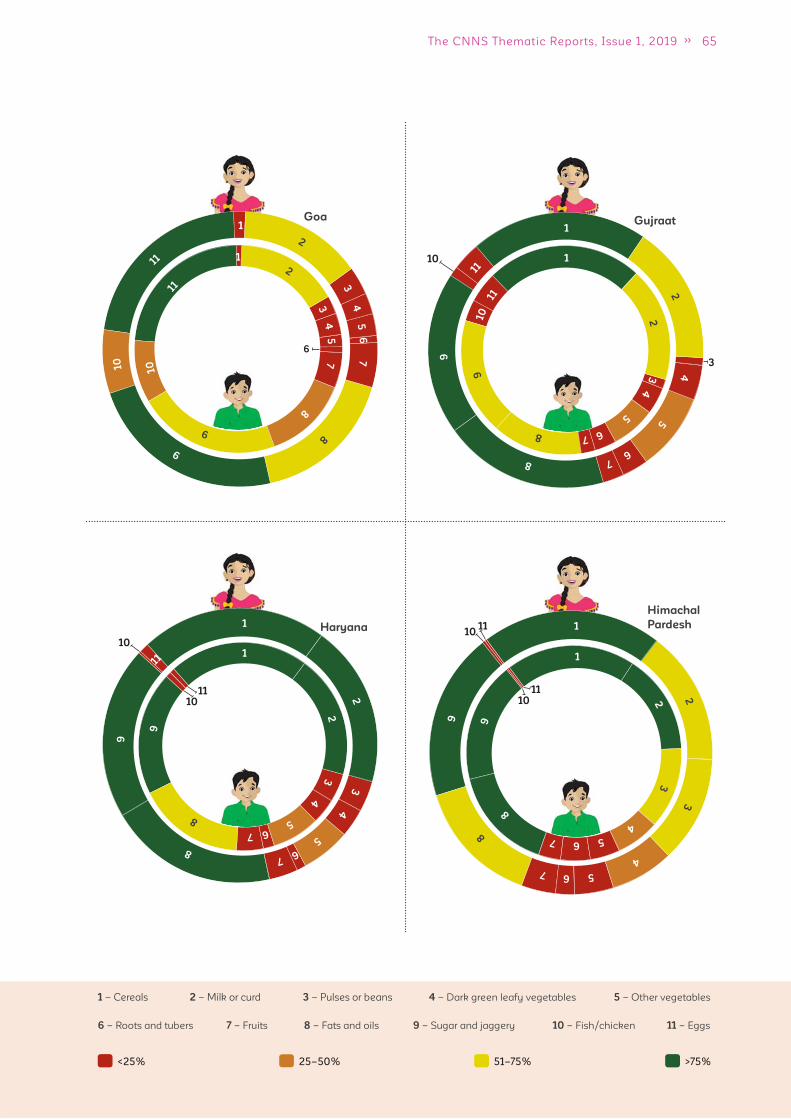
65The CNNS Thematic Reports, Issue 1, 2019
1 – Cereals 2 – Milk or curd 3 – Pulses or beans 4 – Dark green leafy vegetables 5 – Other vegetables
6 – Roots and tubers 7 – Fruits 8 – Fats and oils 9 – Sugar and jaggery 10 – Fish/chicken 11 – Eggs
<25% 25–50% 51–75% >75%
Goa
6
Himachal
Pardesh 1
2
3
4
5 6 7
8
9
1
2 3
4 5 6 7
8 9
10
10
11
11
Gujraat
10
3
Haryana
10
1011
1
2
3
4
5 6 7
8
9
11 1
2
3
4
5 6 7
8
9
1
2
3
4
5
6
7
8
9
10
11
1
2
3
4
5
7
8
9
10
11
1
2
4
5
6 7 8
9
11
1
2
3
4
5
6 7 8
9
10
11
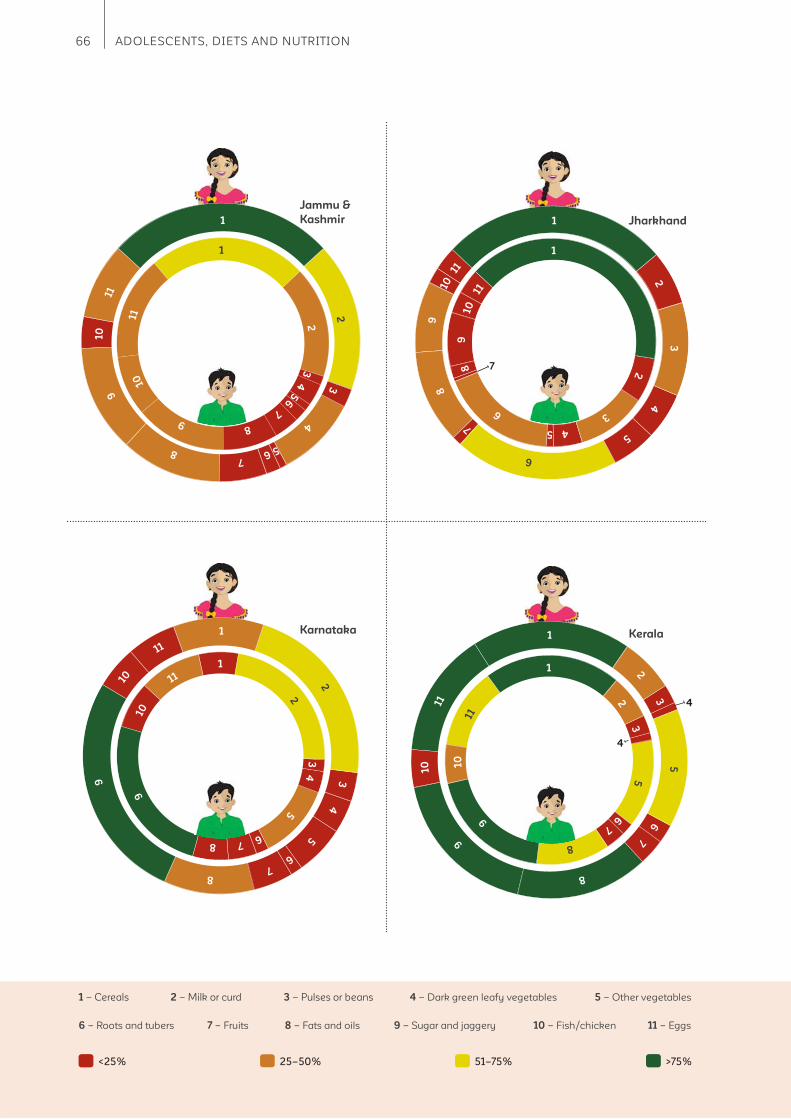
66 ADOLESCENTS, DIETS AND NUTRITION
1 – Cereals 2 – Milk or curd 3 – Pulses or beans 4 – Dark green leafy vegetables 5 – Other vegetables
6 – Roots and tubers 7 – Fruits 8 – Fats and oils 9 – Sugar and jaggery 10 – Fish/chicken 11 – Eggs
<25% 25–50% 51–75% >75%
Jammu &
Kashmir 1
2
3
4
5 6 7
8
9
10
11
1
2
3
4 5
6
7
8
9
10
11
Karnataka Kerala
4
4
Jharkhand 1
2
3
4
5
6
7
8
9
10
11
1
2
3
4 5
6
8
9
10
11
7
1
2 3
4
5
6 7
8
9
10
11
1
2 3
4
5
6 7 8
9
10
11
1
2
3
5
6
7
8
9
10
11
1
2
3
5
6
7
8
9
10
11
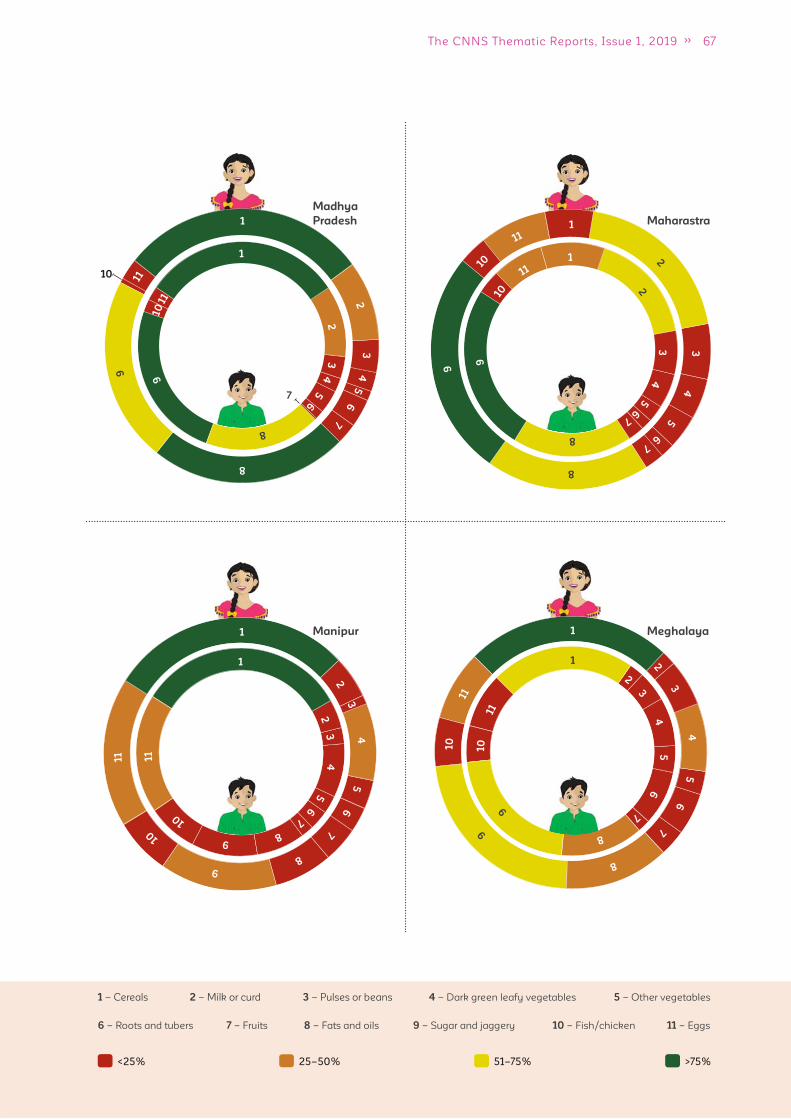
67The CNNS Thematic Reports, Issue 1, 2019
1 – Cereals 2 – Milk or curd 3 – Pulses or beans 4 – Dark green leafy vegetables 5 – Other vegetables
6 – Roots and tubers 7 – Fruits 8 – Fats and oils 9 – Sugar and jaggery 10 – Fish/chicken 11 – Eggs
<25% 25–50% 51–75% >75%
Madhya
Pradesh
10
7
Manipur 1
2
3
4
5
6
7
8
9
10
11
1
2
3
4
5
6
7 8
9
10
11
Meghalaya 1
2
3
4
5
6
7
8
9
10
11
1
2
3
4
5
6
7
8
9
10
11
Maharastra 1
2
3
4
5
6
7
8
9
11
1
2
3
4
5
6
8
9
10 1
1
1
2
3
4
5
6
7
8
9
10
11
1
2
3
4
5
6
7
8
9
10
11
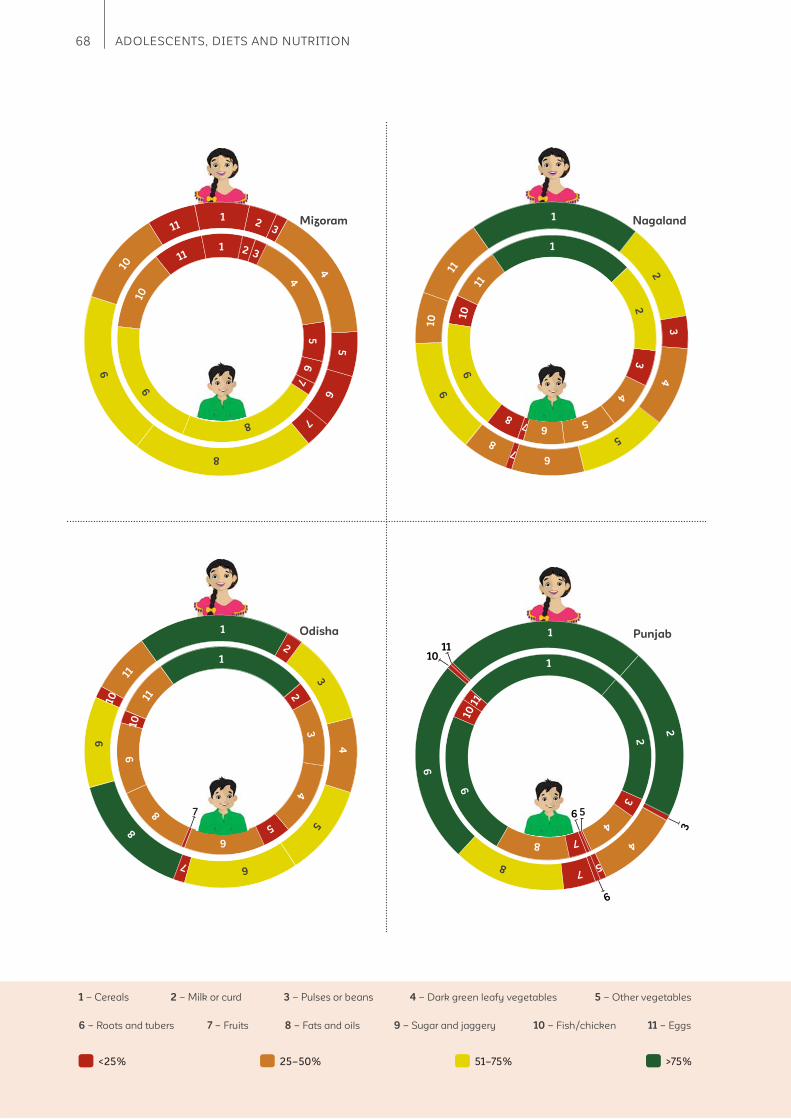
68 ADOLESCENTS, DIETS AND NUTRITION
1 – Cereals 2 – Milk or curd 3 – Pulses or beans 4 – Dark green leafy vegetables 5 – Other vegetables
6 – Roots and tubers 7 – Fruits 8 – Fats and oils 9 – Sugar and jaggery 10 – Fish/chicken 11 – Eggs
<25% 25–50% 51–75% >75%
Mizoram 1 2 3
4 5
6
7
8
9
10
11
1 2 3
4
5
6
7
8
9 10
11
Nagaland 1
2
3
4
5
6 7
8
9
10
11
1
2
3
4
5 6 7 8
9
10
11
Odisha 1
2
3
4
5
6
7
8
9
10
11
1
2
3
4
5
6
8
9
10
11
7
3
6
1011
Punjab
6 5
1
2
4
5 7
8
9
1
2
3
4
7 8
9
10 1
1
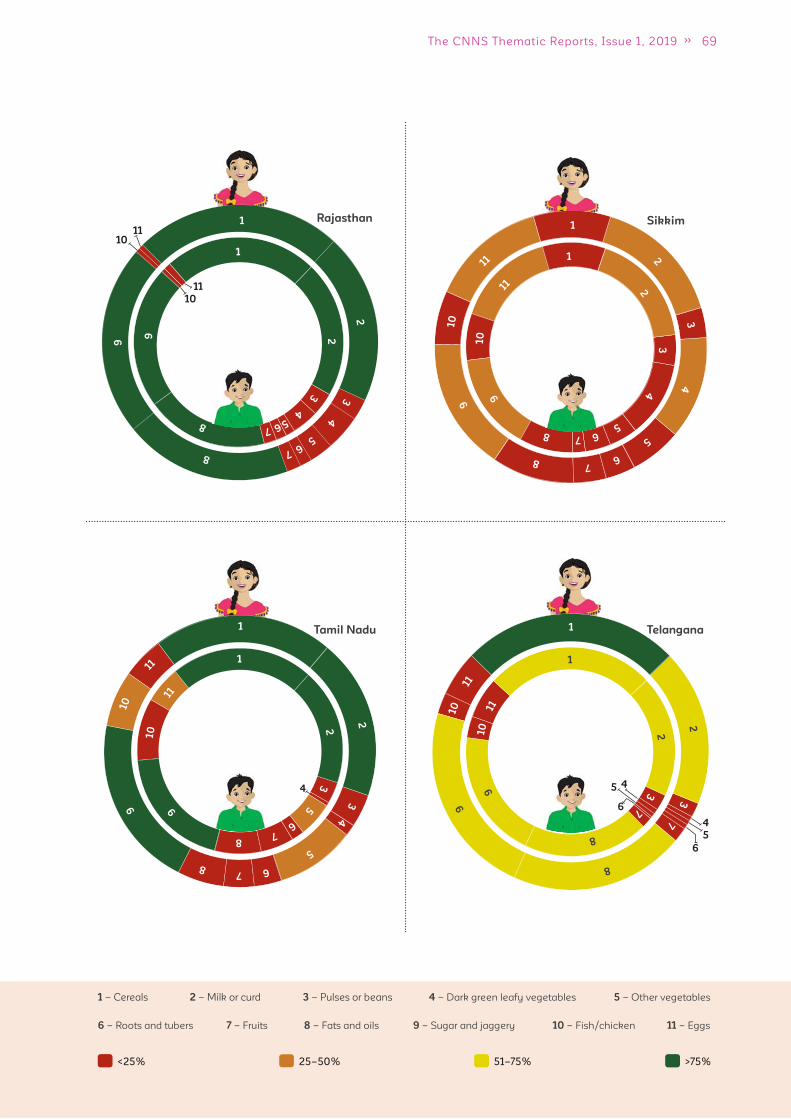
69The CNNS Thematic Reports, Issue 1, 2019
1 – Cereals 2 – Milk or curd 3 – Pulses or beans 4 – Dark green leafy vegetables 5 – Other vegetables
6 – Roots and tubers 7 – Fruits 8 – Fats and oils 9 – Sugar and jaggery 10 – Fish/chicken 11 – Eggs
<25% 25–50% 51–75% >75%
Rajasthan
10
10
11
11
1
2
3
4
5 6 7
8
9
1
2
3
4 5 6 7
8
9
Tamil Nadu
4
Telangana
4
4
5
5
6
6
Sikkim 1
2
3
4
5
6 7
8
9 10
11 1
2
3
4
5 6 7 8
9 10
11
1
2
3
4
5
6 7 8
9 10
11
1
2
3
5
6
7 8
9
10
11
1
2
3
7
8
9 10
11
1
2
3
7
8
9
10
11

70 ADOLESCENTS, DIETS AND NUTRITION
1 – Cereals 2 – Milk or curd 3 – Pulses or beans 4 – Dark green leafy vegetables 5 – Other vegetables
6 – Roots and tubers 7 – Fruits 8 – Fats and oils 9 – Sugar and jaggery 10 – Fish/chicken 11 – Eggs
<25% 25–50% 51–75% >75%
Tripura 1
2
3
4
5
6
7
8
9
10
11
7
Uttarakhand 1
2
3
4
5
6
7
8
9
10
11
1
2
3
4
5
6
7
8
9
10
11
West Bangal 1
2
3
4
5
6
7 8
9
10
11
1
2
3
4
5
6
7 8
9
10
11
Uttar
Pradesh
10 1
2
3
4
5
6
8
9
10
11
1
2 3
4
5
6 7
8
9
11
1
2
3
4
5 6 7
8
9
10
11
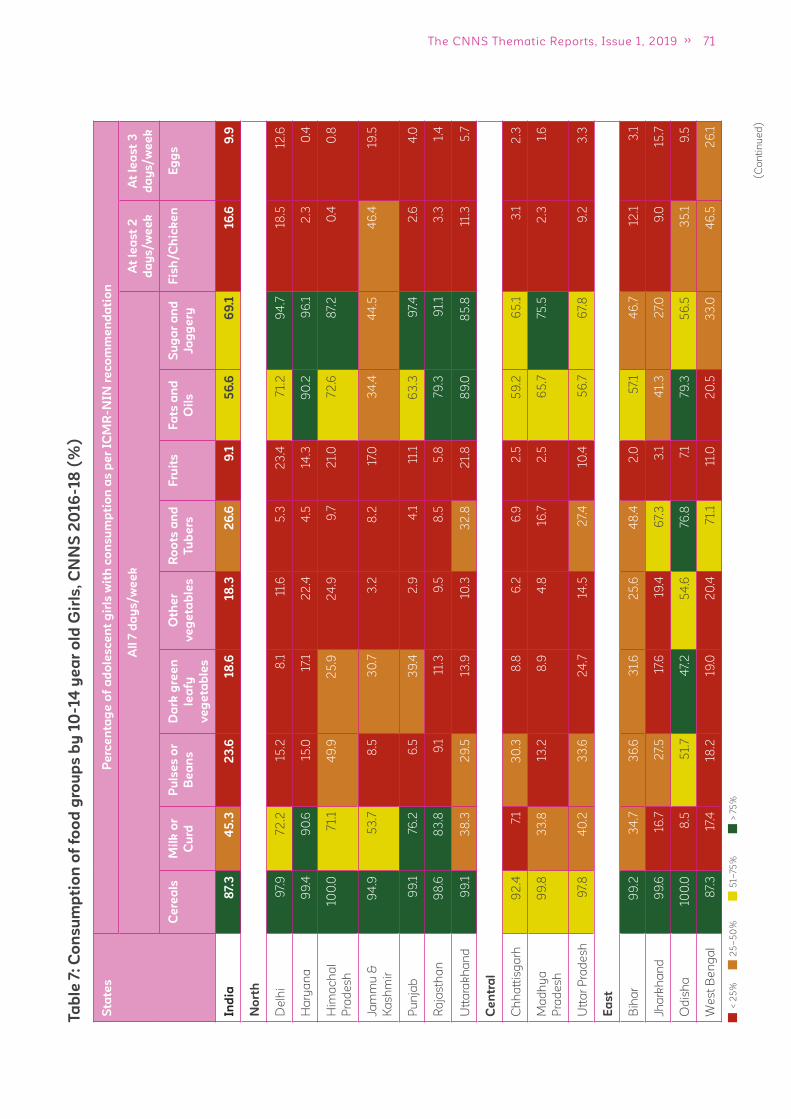
71The CNNS Thematic Reports, Issue 1, 2019
Ta
ble
7:
Co
ns
um
pti
on
of
foo
d g
rou
ps
by
10
-14
ye
ar
old
Gir
ls,
CN
NS
20
16
-18
(%
)
(C
on
tin
ue
d)
Sta
tes
Pe
rce
nta
ge
of
ad
ole
sc
en
t g
irls
wit
h c
on
su
mp
tio
n a
s p
er
ICM
R-N
IN r
ec
om
me
nd
ati
on
All
7 d
ay
s/w
ee
kA
t le
as
t 2
da
ys
/w
ee
k
At
lea
st
3
da
ys
/w
ee
k
Ce
rea
lsM
ilk
or
Cu
rd
Pu
lse
s o
r
Be
an
s
Da
rk g
ree
n
lea
fy
ve
ge
tab
les
Oth
er
ve
ge
tab
les
Ro
ots
an
d
Tu
be
rs
Fru
its
Fa
ts a
nd
Oil
s
Su
ga
r a
nd
Ja
gg
ery
Fis
h/C
hic
ke
nE
gg
s
Ind
ia8
7.3
45
.32
3.6
18
.618
.32
6.6
9.1
56
.66
9.1
16
.69
.9
No
rth
De
lhi
97.
972
.215
.28
.111
.65
.32
3.4
71.
29
4.7
18.5
12.6
Ha
rya
na
99
.49
0.6
15.0
17.1
22
.44
.514
.39
0.2
96
.12
.30
.4
Him
ac
ha
l
Pra
de
sh
100
.07
1.1
49
.92
5.9
24
.99
.72
1.0
72
.68
7.2
0.4
0.8
Jam
mu
&
Ka
sh
mir
94
.95
3.7
8.5
30
.73
.28
.217
.03
4.4
44
.54
6.4
19.5
Pu
nja
b9
9.1
76.2
6.5
39
.42
.94
.111
.16
3.3
97.
42
.64
.0
Ra
jas
tha
n9
8.6
83
.89
.111
.39
.58
.55
.879
.39
1.1
3.3
1.4
Utt
ara
kh
an
d9
9.1
38
.32
9.5
13.9
10.3
32
.82
1.8
89
.08
5.8
11.3
5.7
Ce
ntr
al
Ch
ha
ttis
ga
rh9
2.4
7.1
30
.38
.86
.26
.92
.55
9.2
65
.13
.12
.3
Ma
dh
ya
Pra
de
sh
99
.83
3.8
13.2
8.9
4.8
16.7
2.5
65
.775
.52
.31.
6
Utt
ar
Pra
de
sh
97.
84
0.2
33
.62
4.7
14.5
27.
410
.45
6.7
67.
89
.23
.3
Ea
st
Bih
ar
99
.23
4.7
36
.63
1.6
25
.64
8.4
2.0
57.
14
6.7
12.1
3.1
Jha
rkh
an
d9
9.6
16.7
27.
517
.619
.46
7.3
3.1
41.
32
7.0
9.0
15.7
Od
ish
a10
0.0
8.5
51.
74
7.2
54
.676
.87.
179
.35
6.5
35
.19
.5
We
st
Be
ng
al
87.
317
.418
.219
.02
0.4
71.
111
.02
0.5
33
.04
6.5
26
.1
< 2
5%
25
–5
0%
51–
75%
> 7
5%
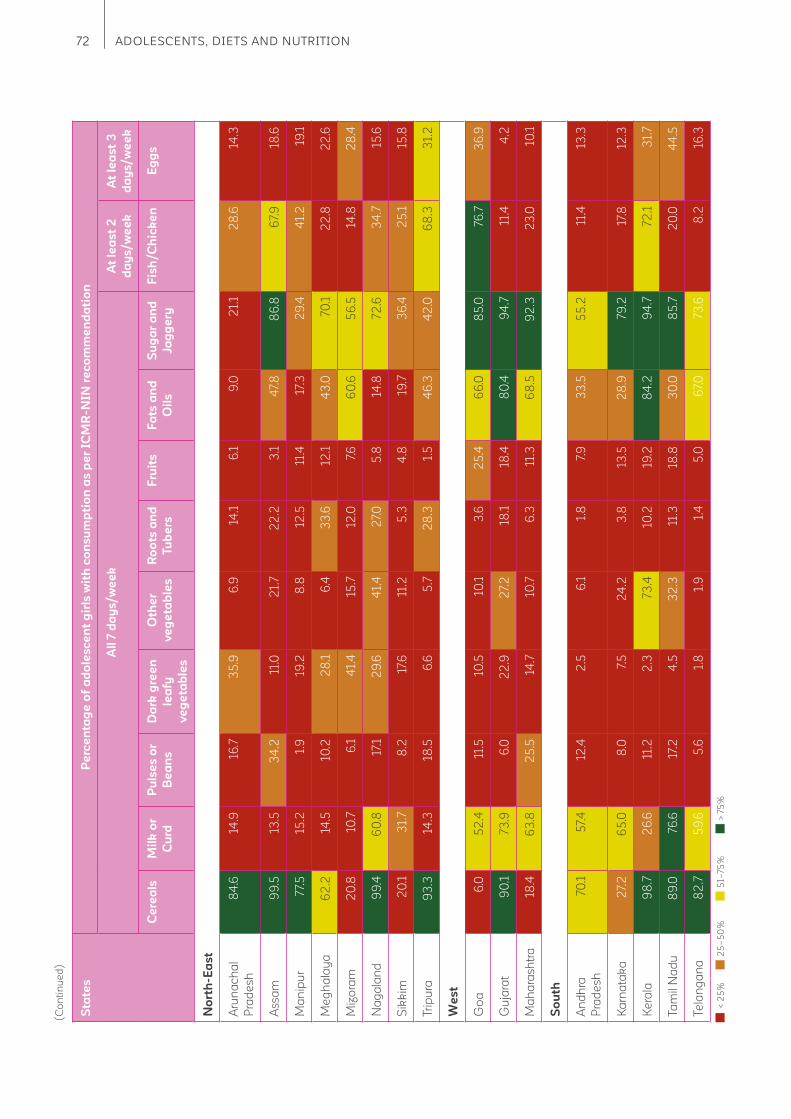
72 ADOLESCENTS, DIETS AND NUTRITION
(C
on
tin
ue
d)
Sta
tes
Pe
rce
nta
ge
of
ad
ole
sc
en
t g
irls
wit
h c
on
su
mp
tio
n a
s p
er
ICM
R-N
IN r
ec
om
me
nd
ati
on
All
7 d
ay
s/w
ee
kA
t le
as
t 2
da
ys
/w
ee
k
At
lea
st
3
da
ys
/w
ee
k
Ce
rea
lsM
ilk
or
Cu
rd
Pu
lse
s o
r
Be
an
s
Da
rk g
ree
n
lea
fy
ve
ge
tab
les
Oth
er
ve
ge
tab
les
Ro
ots
an
d
Tu
be
rs
Fru
its
Fa
ts a
nd
Oil
s
Su
ga
r a
nd
Ja
gg
ery
Fis
h/C
hic
ke
nE
gg
s
No
rth
-Ea
st
Aru
na
ch
al
Pra
de
sh
84
.614
.916
.73
5.9
6.9
14.1
6.1
9.0
21.
12
8.6
14.3
As
sa
m9
9.5
13.5
34
.211
.02
1.7
22
.23
.14
7.8
86
.86
7.9
18.6
Ma
nip
ur
77.
515
.21.
919
.28
.812
.511
.417
.32
9.4
41.
219
.1
Me
gh
ala
ya
62
.214
.510
.22
8.1
6.4
33
.612
.14
3.0
70.1
22
.82
2.6
Miz
ora
m2
0.8
10.7
6.1
41.
415
.712
.07.
66
0.6
56
.514
.82
8.4
Na
ga
lan
d9
9.4
60
.817
.12
9.6
41.
42
7.0
5.8
14.8
72
.63
4.7
15.6
Sik
kim
20
.13
1.7
8.2
17.6
11.2
5.3
4.8
19.7
36
.42
5.1
15.8
Trip
ura
93
.314
.318
.56
.65
.72
8.3
1.5
46
.34
2.0
68
.33
1.2
We
st
Go
a6
.05
2.4
11.5
10.5
10.1
3.6
25
.46
6.0
85
.076
.73
6.9
Gu
jara
t9
0.1
73.9
6.0
22
.92
7.2
18.1
18.4
80
.49
4.7
11.4
4.2
Ma
ha
ras
htr
a18
.46
3.8
25
.514
.710
.76
.311
.36
8.5
92
.32
3.0
10.1
So
uth
An
dh
ra
Pra
de
sh
70.1
57.
412
.42
.56
.11.
87.
93
3.5
55
.211
.413
.3
Ka
rna
tak
a2
7.2
65
.08
.07.
52
4.2
3.8
13.5
28
.979
.217
.812
.3
Ke
rala
98
.72
6.6
11.2
2.3
73.4
10.2
19.2
84
.29
4.7
72
.13
1.7
Ta
mil
Na
du
89
.076
.617
.24
.53
2.3
11.3
18.8
30
.08
5.7
20
.04
4.5
Te
lan
ga
na
82
.75
9.6
5.6
1.8
1.9
1.4
5.0
67.
073
.68
.216
.3
< 2
5%
25
–5
0%
51–
75%
> 7
5%
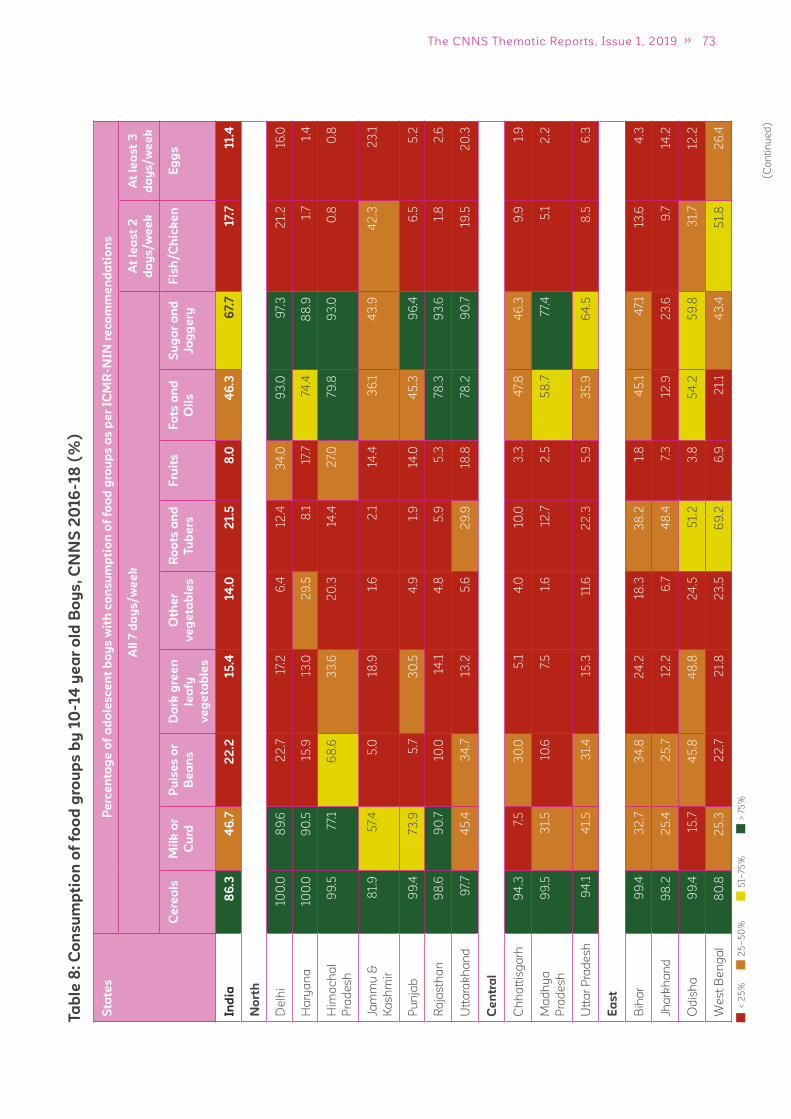
73The CNNS Thematic Reports, Issue 1, 2019
Ta
ble
8:
Co
ns
um
pti
on
of
foo
d g
rou
ps
by
10
-14
ye
ar
old
Bo
ys
, C
NN
S 2
016
-18
(%
)
(C
on
tin
ue
d)
Sta
tes
Pe
rce
nta
ge
of
ad
ole
sc
en
t b
oy
s w
ith
co
ns
um
pti
on
of
foo
d g
rou
ps
as
pe
r IC
MR
-NIN
re
co
mm
en
da
tio
ns
All
7 d
ay
s/w
ee
kA
t le
as
t 2
da
ys
/w
ee
k
At
lea
st
3
da
ys
/w
ee
k
Ce
rea
lsM
ilk
or
Cu
rd
Pu
lse
s o
r
Be
an
s
Da
rk g
ree
n
lea
fy
ve
ge
tab
les
Oth
er
ve
ge
tab
les
Ro
ots
an
d
Tu
be
rs
Fru
its
Fa
ts a
nd
Oil
s
Su
ga
r a
nd
Ja
gg
ery
Fis
h/C
hic
ke
nE
gg
s
Ind
ia8
6.3
46
.72
2.2
15
.414
.02
1.5
8.0
46
.36
7.7
17.
711.4
No
rth
De
lhi
100
.08
9.6
22
.717
.26
.412
.43
4.0
93
.09
7.3
21.
216
.0
Ha
rya
na
100
.09
0.5
15.9
13.0
29
.58
.117
.774
.48
8.9
1.7
1.4
Him
ac
ha
l
Pra
de
sh
99
.57
7.1
68
.63
3.6
20
.314
.42
7.0
79.8
93
.00
.80
.8
Jam
mu
&
Ka
sh
mir
81.
95
7.4
5.0
18.9
1.6
2.1
14.4
36
.14
3.9
42
.32
3.1
Pu
nja
b9
9.4
73.9
5.7
30
.54
.91.
914
.04
5.3
96
.46
.55
.2
Ra
jas
tha
n9
8.6
90
.710
.014
.14
.85
.95
.378
.39
3.6
1.8
2.6
Utt
ara
kh
an
d9
7.7
45
.43
4.7
13.2
5.6
29
.918
.878
.29
0.7
19.5
20
.3
Ce
ntr
al
Ch
ha
ttis
ga
rh9
4.3
7.5
30
.05
.14
.010
.03
.34
7.8
46
.39
.91.
9
Ma
dh
ya
Pra
de
sh
99
.53
1.5
10.6
7.5
1.6
12.7
2.5
58
.77
7.4
5.1
2.2
Utt
ar
Pra
de
sh
94
.14
1.5
31.
415
.311
.62
2.3
5.9
35
.96
4.5
8.5
6.3
Ea
st
Bih
ar
99
.43
2.7
34
.82
4.2
18.3
38
.21.
84
5.1
47.
113
.64
.3
Jha
rkh
an
d9
8.2
25
.42
5.7
12.2
6.7
48
.47.
312
.92
3.6
9.7
14.2
Od
ish
a9
9.4
15.7
45
.84
8.8
24
.55
1.2
3.8
54
.25
9.8
31.
712
.2
We
st
Be
ng
al
80
.82
5.3
22
.72
1.8
23
.56
9.2
6.9
21.
14
3.4
51.
82
6.4
< 2
5%
25
–5
0%
51–
75%
> 7
5%

74 ADOLESCENTS, DIETS AND NUTRITION
(C
on
tin
ue
d)
Sta
tes
Pe
rce
nta
ge
of
ad
ole
sc
en
t b
oy
s w
ith
co
ns
um
pti
on
of
foo
d g
rou
ps
as
pe
r IC
MR
-NIN
re
co
mm
en
da
tio
ns
All
7 d
ay
s/w
ee
kA
t le
as
t 2
da
ys
/w
ee
k
At
lea
st
3
da
ys
/w
ee
k
Ce
rea
lsM
ilk
or
Cu
rd
Pu
lse
s o
r
Be
an
s
Da
rk g
ree
n
lea
fy
ve
ge
tab
les
Oth
er
ve
ge
tab
les
Ro
ots
an
d
Tu
be
rs
Fru
its
Fa
ts a
nd
Oil
s
Su
ga
r a
nd
Ja
gg
ery
Fis
h/C
hic
ke
nE
gg
s
No
rth
-Ea
st
Aru
na
ch
al
Pra
de
sh
89
.014
.218
.83
6.3
5.0
9.2
4.1
9.0
21.
23
1.6
15.6
As
sa
m9
7.9
15.6
35
.414
.52
3.0
20
.32
.43
5.7
77.
45
8.1
23
.9
Ma
nip
ur
81.
014
.42
.12
2.9
8.4
11.5
11.5
16.0
31.
44
7.0
19.4
Me
gh
ala
ya
86
.15
.318
.69
.78
.62
4.0
6.7
32
.06
9.2
26
.819
.6
Miz
ora
m18
.68
.43
.73
9.4
12.8
9.0
6.7
63
.55
6.5
15.7
28
.8
Na
ga
lan
d9
9.8
61.
72
5.3
24
.03
7.4
28
.23
.82
1.1
66
.14
2.9
24
.9
Sik
kim
24
.94
7.3
5.3
29
.412
.37.
14
.517
.33
7.7
26
.515
.5
Trip
ura
94
.113
.416
.812
.79
.43
3.4
1.0
46
.93
9.6
61.
83
2.4
We
st
Go
a5
.45
6.9
10.9
10.9
7.9
2.0
22
.96
1.6
84
.674
.03
2.3
Gu
jara
t9
3.8
70.0
4.1
14.5
24
.113
.313
.36
8.2
81.
22
2.6
10.4
Ma
ha
ras
htr
a2
5.5
58
.62
0.6
15.8
8.6
5.0
8.3
62
.28
9.1
24
.99
.5
So
uth
An
dh
ra
Pra
de
sh
68
.84
7.9
7.1
1.8
7.4
1.9
8.0
30
.94
5.8
6.8
14.5
Ka
rna
tak
a2
6.5
67.
413
.08
.817
.14
.813
.13
1.9
80
.52
2.5
18.3
Ke
rala
97.
73
9.8
14.5
1.6
65
.25
.82
4.2
59
.98
7.8
63
.23
3.8
Ta
mil
Na
du
87.
78
0.1
13.0
2.6
26
.04
.92
4.3
24
.08
5.9
23
.94
5.3
Te
lan
ga
na
74.4
53
.97.
02
.22
.00
.94
.85
5.3
56
.59
.318
.0
< 2
5%
25
–5
0%
51–
75%
> 7
5%
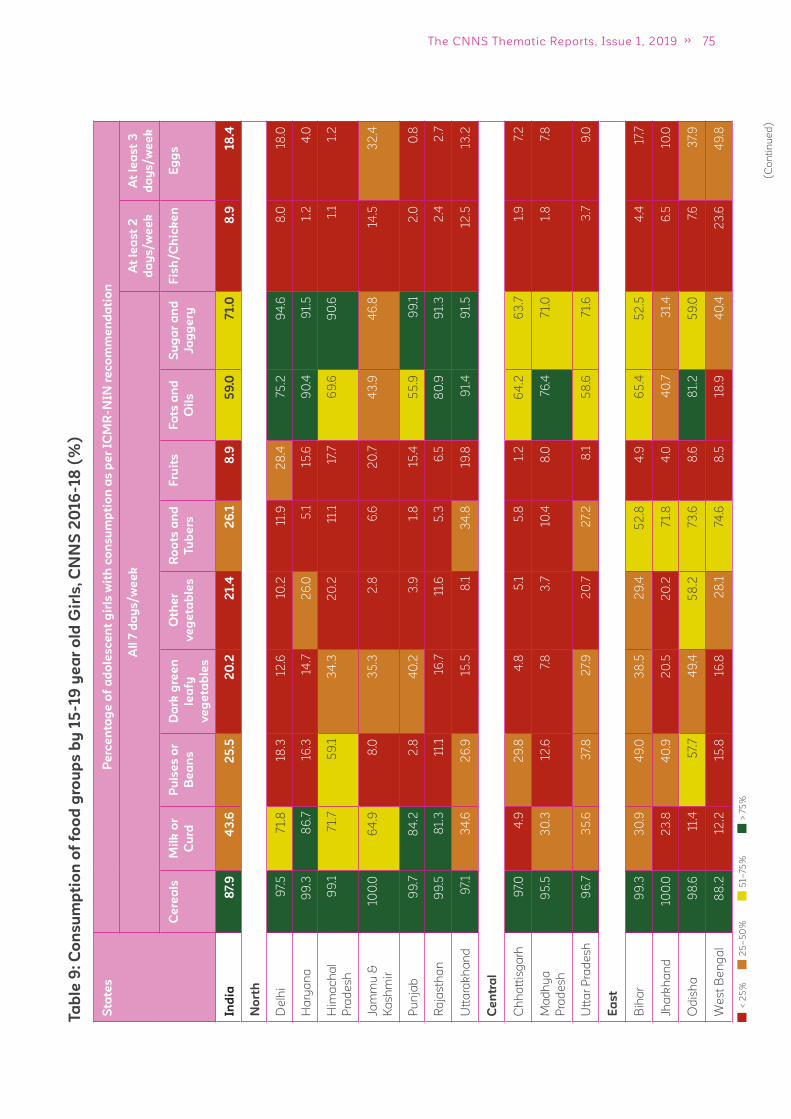
75The CNNS Thematic Reports, Issue 1, 2019
Ta
ble
9:
Co
ns
um
pti
on
of
foo
d g
rou
ps
by
15
-19
ye
ar
old
Gir
ls,
CN
NS
20
16
-18
(%
)
(C
on
tin
ue
d)
Sta
tes
Pe
rce
nta
ge
of
ad
ole
sc
en
t g
irls
wit
h c
on
su
mp
tio
n a
s p
er
ICM
R-N
IN r
ec
om
me
nd
ati
on
All
7 d
ay
s/w
ee
kA
t le
as
t 2
da
ys
/w
ee
k
At
lea
st
3
da
ys
/w
ee
k
Ce
rea
lsM
ilk
or
Cu
rd
Pu
lse
s o
r
Be
an
s
Da
rk g
ree
n
lea
fy
ve
ge
tab
les
Oth
er
ve
ge
tab
les
Ro
ots
an
d
Tu
be
rs
Fru
its
Fa
ts a
nd
Oil
s
Su
ga
r a
nd
Ja
gg
ery
Fis
h/C
hic
ke
nE
gg
s
Ind
ia8
7.9
43
.62
5.5
20
.22
1.4
26
.18
.95
9.0
71.0
8.9
18
.4
No
rth
De
lhi
97.
57
1.8
18.3
12.6
10.2
11.9
28
.475
.29
4.6
8.0
18.0
Ha
rya
na
99
.38
6.7
16.3
14.7
26
.05
.115
.69
0.4
91.
51.
24
.0
Him
ac
ha
l
Pra
de
sh
99
.17
1.7
59
.13
4.3
20
.211
.117
.76
9.6
90
.61.
11.
2
Jam
mu
&
Ka
sh
mir
100
.06
4.9
8.0
35
.32
.86
.62
0.7
43
.94
6.8
14.5
32
.4
Pu
nja
b9
9.7
84
.22
.84
0.2
3.9
1.8
15.4
55
.99
9.1
2.0
0.8
Ra
jas
tha
n9
9.5
81.
311
.116
.711
.65
.36
.58
0.9
91.
32
.42
.7
Utt
ara
kh
an
d9
7.1
34
.62
6.9
15.5
8.1
34
.819
.89
1.4
91.
512
.513
.2
Ce
ntr
al
Ch
ha
ttis
ga
rh9
7.0
4.9
29
.84
.85
.15
.81.
26
4.2
63
.71.
97.
2
Ma
dh
ya
Pra
de
sh
95
.53
0.3
12.6
7.8
3.7
10.4
8.0
76.4
71.
01.
87.
8
Utt
ar
Pra
de
sh
96
.73
5.6
37.
82
7.9
20
.72
7.2
8.1
58
.67
1.6
3.7
9.0
Ea
st
Bih
ar
99
.33
0.9
49
.03
8.5
29
.45
2.8
4.9
65
.45
2.5
4.4
17.7
Jha
rkh
an
d10
0.0
23
.84
0.9
20
.52
0.2
71.
84
.04
0.7
31.
46
.510
.0
Od
ish
a9
8.6
11.4
57.
74
9.4
58
.273
.68
.68
1.2
59
.07.
63
7.9
We
st
Be
ng
al
88
.212
.215
.816
.82
8.1
74.6
8.5
18.9
40
.42
3.6
49
.8
< 2
5%
25
–5
0%
51–
75%
> 7
5%

76 ADOLESCENTS, DIETS AND NUTRITION
(C
on
tin
ue
d)
Sta
tes
Pe
rce
nta
ge
of
ad
ole
sc
en
t g
irls
wit
h c
on
su
mp
tio
n a
s p
er
ICM
R-N
IN r
ec
om
me
nd
ati
on
All
7 d
ay
s/w
ee
kA
t le
as
t 2
da
ys
/w
ee
k
At
lea
st
3
da
ys
/w
ee
k
Ce
rea
lsM
ilk
or
Cu
rd
Pu
lse
s o
r
Be
an
s
Da
rk g
ree
n
lea
fy
ve
ge
tab
les
Oth
er
ve
ge
tab
les
Ro
ots
an
d
Tu
be
rs
Fru
its
Fa
ts a
nd
Oil
s
Su
ga
r a
nd
Ja
gg
ery
Fis
h/C
hic
ke
nE
gg
s
No
rth
-Ea
st
Aru
na
ch
al
Pra
de
sh
80
.813
.818
.04
1.5
8.6
14.1
3.1
8.4
20
.714
.03
0.7
As
sa
m9
9.0
15.6
38
.78
.42
2.6
18.5
3.6
40
.08
5.2
27.
86
8.7
Ma
nip
ur
80
.013
.83
.02
5.2
8.8
8.2
12.0
18.7
38
.318
.54
8.3
Me
gh
ala
ya
76.8
5.7
17.0
25
.38
.615
.99
.23
9.8
70.9
19.0
25
.3
Miz
ora
m19
.99
.54
.94
8.3
16.2
18.8
9.1
65
.55
9.0
32
.917
.5
Na
ga
lan
d10
0.0
56
.218
.84
7.0
51.
44
2.2
3.6
26
.16
6.8
28
.74
7.4
Sik
kim
20
.53
3.3
8.2
26
.413
.17.
98
.42
1.2
34
.614
.02
9.6
Trip
ura
95
.413
.52
0.5
16.1
11.6
38
.02
.64
9.7
46
.33
1.8
69
.5
We
st
Go
a6
.15
3.2
12.6
9.7
9.2
2.6
20
.36
3.0
87.
32
7.7
81.
5
Gu
jara
t9
4.5
73.2
3.9
19.3
41.
413
.811
.28
6.9
86
.15
.015
.0
Ma
ha
ras
htr
a19
.76
9.3
22
.216
.813
.16
.38
.26
5.8
92
.711
.22
7.3
So
uth
An
dh
ra
Pra
de
sh
64
.35
3.8
6.4
3.0
7.6
1.1
5.2
35
.75
5.8
13.6
15.5
Ka
rna
tak
a3
3.2
69
.610
.012
.118
.74
.214
.43
3.1
84
.615
.618
.2
Ke
rala
100
.03
3.5
13.0
3.6
74.4
11.8
16.0
83
.49
6.4
23
.67
7.1
Ta
mil
Na
du
86
.87
7.4
15.1
5.4
38
.613
.214
.72
2.1
82
.72
7.4
19.3
Te
lan
ga
na
80
.05
2.1
6.3
0.9
3.2
1.5
6.0
66
.772
.415
.98
.1
< 2
5%
25
–5
0%
51–
75%
> 7
5%

77The CNNS Thematic Reports, Issue 1, 2019
Ta
ble
10
: C
on
su
mp
tio
n o
f fo
od
gro
up
s b
y 1
5-19
ye
ar
old
Bo
ys
, C
NN
S 2
016
-18
(%
)
(C
on
tin
ue
d)
Sta
tes
Pe
rce
nta
ge
of
ad
ole
sc
en
t b
oy
s w
ith
co
ns
um
pti
on
of
foo
d g
rou
ps
as
pe
r IC
MR
-NIN
re
co
mm
en
da
tio
ns
All
7 d
ay
s/w
ee
kA
t le
as
t 2
da
ys
/w
ee
k
At
lea
st
3
da
ys
/w
ee
k
Ce
rea
lsM
ilk
or
Cu
rd
Pu
lse
s o
r
Be
an
s
Da
rk g
ree
n
lea
fy
ve
ge
tab
les
Oth
er
ve
ge
tab
les
Ro
ots
an
d
Tu
be
rs
Fru
its
Fa
ts a
nd
Oil
s
Su
ga
r a
nd
Ja
gg
ery
Fis
h/C
hic
ke
nE
gg
s
Ind
ia8
2.6
47.
32
2.1
16
.814
.22
1.8
8.5
41.9
63
.113
.72
0.8
No
rth
De
lhi
99
.89
1.1
20
.319
.310
.615
.93
4.6
95
.69
6.3
25
.43
0.5
Ha
rya
na
96
.58
5.5
19.0
17.1
33
.58
.018
.173
.88
5.5
2.6
3.6
Him
ac
ha
l
Pra
de
sh
99
.876
.56
2.6
34
.72
2.4
22
.817
.48
0.5
92
.32
.10
.7
Jam
mu
&
Ka
sh
mir
68
.24
7.3
4.0
9.3
3.0
5.2
10.6
23
.53
9.2
25
.14
4.0
Pu
nja
b9
8.4
79.6
12.3
32
.41.
12
.511
.04
4.8
90
.712
.07.
2
Ra
jas
tha
n9
9.4
87.
216
.116
.76
.27.
17.
478
.69
1.9
2.5
3.9
Utt
ara
kh
an
d9
9.7
44
.73
0.7
15.2
4.1
30
.515
.56
9.9
83
.219
.72
0.8
Ce
ntr
al
Ch
ha
ttis
ga
rh8
7.8
12.4
22
.75
.52
.49
.72
.14
1.1
46
.712
.016
.1
Ma
dh
ya
Pra
de
sh
100
.03
5.5
10.7
7.0
0.7
11.6
4.2
58
.679
.56
.36
.4
Utt
ar
Pra
de
sh
86
.14
3.0
27.
52
0.0
13.5
23
.38
.92
8.5
57.
08
.113
.7
Ea
st
Bih
ar
99
.83
6.6
39
.72
6.7
10.3
53
.12
.93
9.7
40
.74
.811
.8
Jha
rkh
an
d9
8.9
16.2
26
.510
.72
.94
4.0
1.2
4.8
19.8
8.2
9.1
Od
ish
a9
5.5
11.9
42
.64
5.7
18.3
49
.91.
64
8.4
44
.77.
93
4.8
We
st
Be
ng
al
81.
92
2.4
31.
02
5.6
22
.76
7.8
7.5
19.5
31.
23
4.2
55
.9
< 2
5%
25
–5
0%
51–
75%
> 7
5%
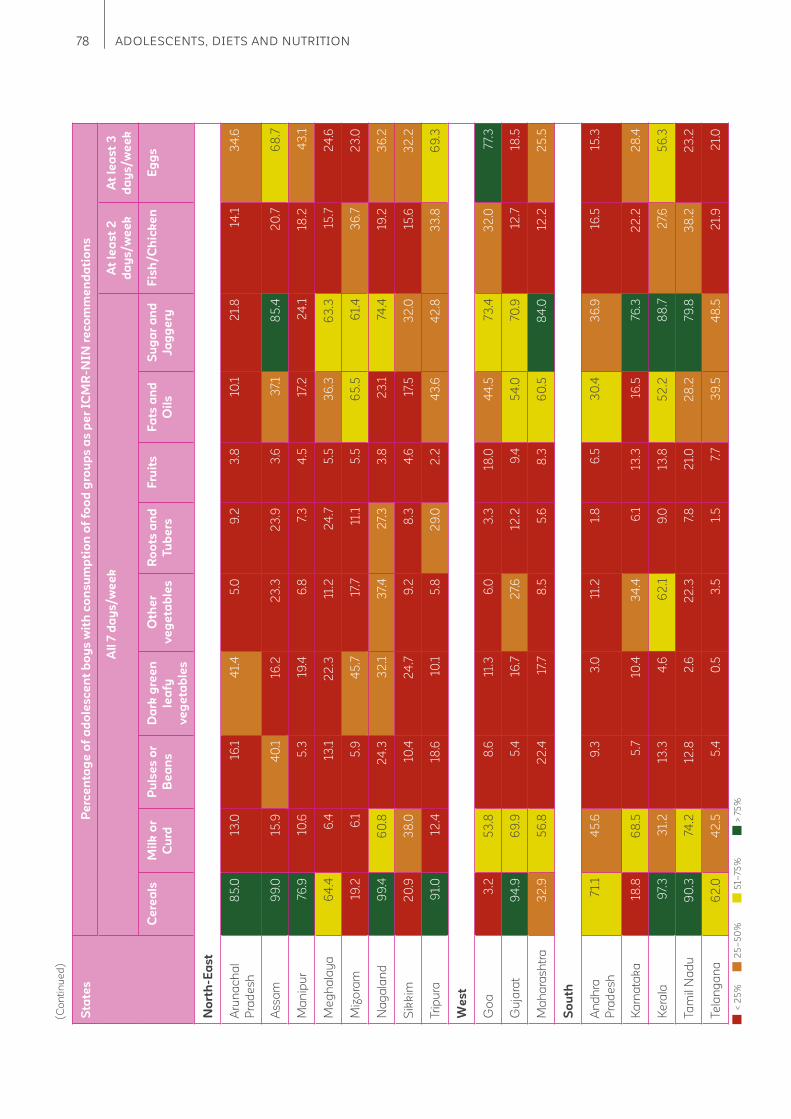
78 ADOLESCENTS, DIETS AND NUTRITION
(C
on
tin
ue
d)
Sta
tes
Pe
rce
nta
ge
of
ad
ole
sc
en
t b
oy
s w
ith
co
ns
um
pti
on
of
foo
d g
rou
ps
as
pe
r IC
MR
-NIN
re
co
mm
en
da
tio
ns
All
7 d
ay
s/w
ee
kA
t le
as
t 2
da
ys
/w
ee
k
At
lea
st
3
da
ys
/w
ee
k
Ce
rea
lsM
ilk
or
Cu
rd
Pu
lse
s o
r
Be
an
s
Da
rk g
ree
n
lea
fy
ve
ge
tab
les
Oth
er
ve
ge
tab
les
Ro
ots
an
d
Tu
be
rs
Fru
its
Fa
ts a
nd
Oil
s
Su
ga
r a
nd
Ja
gg
ery
Fis
h/C
hic
ke
nE
gg
s
No
rth
-Ea
st
Aru
na
ch
al
Pra
de
sh
85
.013
.016
.14
1.4
5.0
9.2
3.8
10.1
21.
814
.13
4.6
As
sa
m9
9.0
15.9
40
.116
.22
3.3
23
.93
.63
7.1
85
.42
0.7
68
.7
Ma
nip
ur
76.9
10.6
5.3
19.4
6.8
7.3
4.5
17.2
24
.118
.24
3.1
Me
gh
ala
ya
64
.46
.413
.12
2.3
11.2
24
.75
.53
6.3
63
.315
.72
4.6
Miz
ora
m19
.26
.15
.94
5.7
17.7
11.1
5.5
65
.56
1.4
36
.72
3.0
Na
ga
lan
d9
9.4
60
.82
4.3
32
.13
7.4
27.
33
.82
3.1
74.4
19.2
36
.2
Sik
kim
20
.93
8.0
10.4
24
.79
.28
.34
.617
.53
2.0
15.6
32
.2
Trip
ura
91.
012
.418
.610
.15
.82
9.0
2.2
43
.64
2.8
33
.86
9.3
We
st
Go
a3
.25
3.8
8.6
11.3
6.0
3.3
18.0
44
.573
.43
2.0
77.
3
Gu
jara
t9
4.9
69
.95
.416
.72
7.6
12.2
9.4
54
.070
.912
.718
.5
Ma
ha
ras
htr
a3
2.9
56
.82
2.4
17.7
8.5
5.6
8.3
60
.58
4.0
12.2
25
.5
So
uth
An
dh
ra
Pra
de
sh
71.
14
5.6
9.3
3.0
11.2
1.8
6.5
30
.43
6.9
16.5
15.3
Ka
rna
tak
a18
.86
8.5
5.7
10.4
34
.46
.113
.316
.576
.32
2.2
28
.4
Ke
rala
97.
33
1.2
13.3
4.6
62
.19
.013
.85
2.2
88
.72
7.6
56
.3
Ta
mil
Na
du
90
.374
.212
.82
.62
2.3
7.8
21.
02
8.2
79.8
38
.22
3.2
Te
lan
ga
na
62
.04
2.5
5.4
0.5
3.5
1.5
7.7
39
.54
8.5
21.
92
1.0
< 2
5%
25
–5
0%
51–
75%
> 7
5%
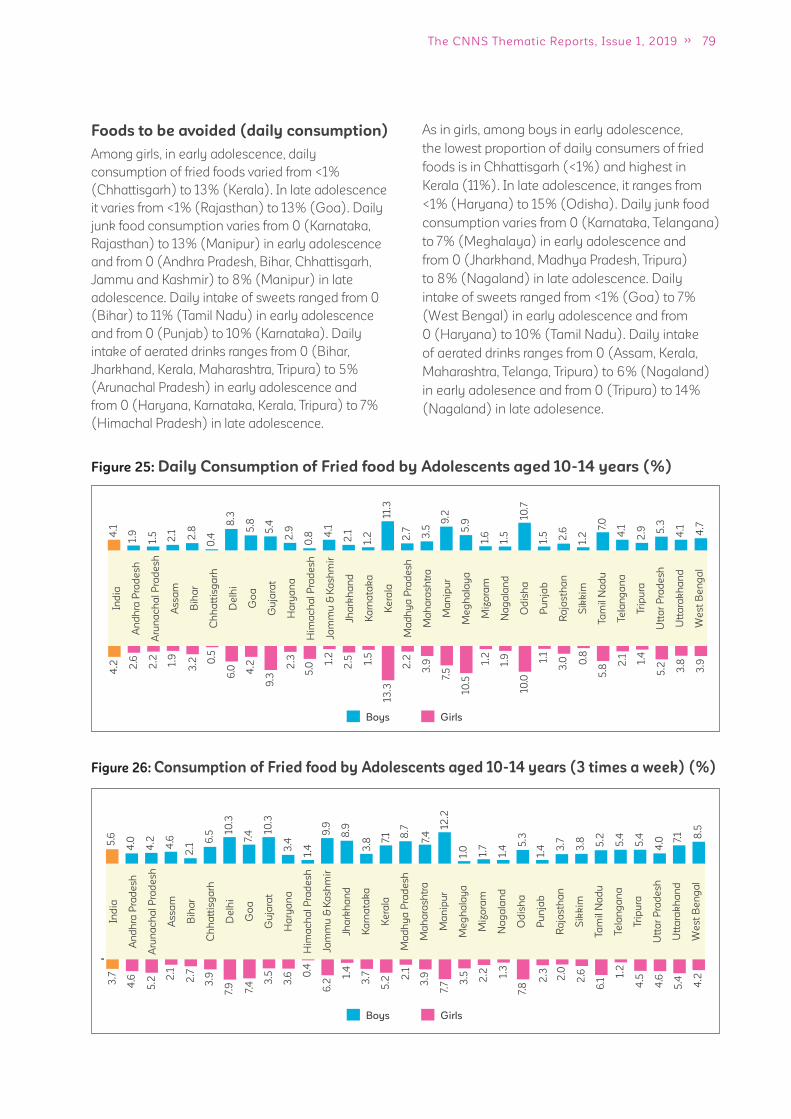
79The CNNS Thematic Reports, Issue 1, 2019
Foods to be avoided (daily consumption)
Among girls, in early adolescence, daily
consumption of fried foods varied from <1%
(Chhattisgarh) to 13% (Kerala). In late adolescence
it varies from <1% (Rajasthan) to 13% (Goa). Daily
junk food consumption varies from 0 (Karnataka,
Rajasthan) to 13% (Manipur) in early adolescence
and from 0 (Andhra Pradesh, Bihar, Chhattisgarh,
Jammu and Kashmir) to 8% (Manipur) in late
adolescence. Daily intake of sweets ranged from 0
(Bihar) to 11% (Tamil Nadu) in early adolescence
and from 0 (Punjab) to 10% (Karnataka). Daily
intake of aerated drinks ranges from 0 (Bihar,
Jharkhand, Kerala, Maharashtra, Tripura) to 5%
(Arunachal Pradesh) in early adolescence and
from 0 (Haryana, Karnataka, Kerala, Tripura) to 7%
(Himachal Pradesh) in late adolescence.
As in girls, among boys in early adolescence,
the lowest proportion of daily consumers of fried
foods is in Chhattisgarh (<1%) and highest in
Kerala (11%). In late adolescence, it ranges from
<1% (Haryana) to 15% (Odisha). Daily junk food
consumption varies from 0 (Karnataka, Telangana)
to 7% (Meghalaya) in early adolescence and
from 0 (Jharkhand, Madhya Pradesh, Tripura)
to 8% (Nagaland) in late adolescence. Daily
intake of sweets ranged from <1% (Goa) to 7%
(West Bengal) in early adolescence and from
0 (Haryana) to 10% (Tamil Nadu). Daily intake
of aerated drinks ranges from 0 (Assam, Kerala,
Maharashtra, Telanga, Tripura) to 6% (Nagaland)
in early adolesence and from 0 (Tripura) to 14%
(Nagaland) in late adolesence.
Figure 26: Consumption of Fried food by Adolescents aged 10-14 years (3 times a week) (%)
Ind
ia
An
dh
ra P
rad
esh
Aru
na
ch
al
Pra
de
sh
Ass
am
Bih
ar
Ch
ha
ttis
ga
rh
De
lhi
Go
a
Gu
jara
t
Ha
rya
na
Him
ac
ha
l P
rad
esh
Jam
mu
& K
ash
mir
Jha
rkh
an
d
Ka
rna
tak
a
Ke
rala
Ma
dh
ya
Pra
de
sh
Ma
ha
rash
tra
Ma
nip
ur
Me
gh
ala
ya
Miz
ora
m
Na
ga
lan
d
Od
ish
a
Pu
nja
b
Ra
jasth
an
Sik
kim
Ta
mil
Na
du
Te
lan
ga
na
Tri
pu
ra
Utt
ar
Pra
de
sh
Utt
ara
kh
an
d
We
st
Be
ng
al
5.6
4.0
4.2
4.6
2.1
6.5 10
.3
7.4 10
.3
3.4
1.4
9.9
8.9
3.8 7.
1 8.7
7.4
12.2
1.0
1.7
1.4 5
.3
5.2
1.4 3
.7
3.8 5.4
5.4
4.0 7.
1 8.5
3.7
4.6
5.2 2
.1
2.7
3.9
7.9 7.4 3
.5
3.6 0
.4
6.2
1.4
3.7
5.2 2
.1
3.9
7.7 3
.5 2.2 1.
3
2.3 2.0
2.6
7.8 6.1
1.2
4.5
4.6
5.4 4.2
Boys Girls
Ind
ia
An
dh
ra P
rad
esh
Aru
na
ch
al
Pra
de
sh
Ass
am
Bih
ar
Ch
ha
ttis
ga
rh
De
lhi
Go
a
Gu
jara
t
Ha
rya
na
Him
ac
ha
l P
rad
esh
Jam
mu
& K
ash
mir
Jha
rkh
an
d
Ka
rna
tak
a
Ke
rala
Ma
dh
ya
Pra
de
sh
Ma
ha
rash
tra
Ma
nip
ur
Me
gh
ala
ya
Miz
ora
m
Na
ga
lan
d
Od
ish
a
Pu
nja
b
Ra
jasth
an
Sik
kim
Ta
mil
Na
du
Te
lan
ga
na
Tri
pu
ra
Utt
ar
Pra
de
sh
Utt
ara
kh
an
d
We
st
Be
ng
al
4.1
1.9
1.5
2.1 2.8
0.4
8.3
5.8
5.4
2.9
0.8 4
.1
2.1
1.2
11.3
2.7 3.5
9.2
5.9
1.6
1.5
10.7
7.0
1.5 2.6
1.2 4
.1
2.9 5
.3
4.1 4.7
4.2 2
.6
2.2 1.9
3.2 0
.5
6.0 4.2
9.3
2.3
5.0
1.2
2.5 1.5
13.3
2.2
3.9
7.5
10.5
1.2
1.9 1.1
3.0 0
.8
10.0
5.8
2.1 1.4
5.2 3.8
3.9
Boys Girls
Figure 25: Daily Consumption of Fried food by Adolescents aged 10-14 years (%)
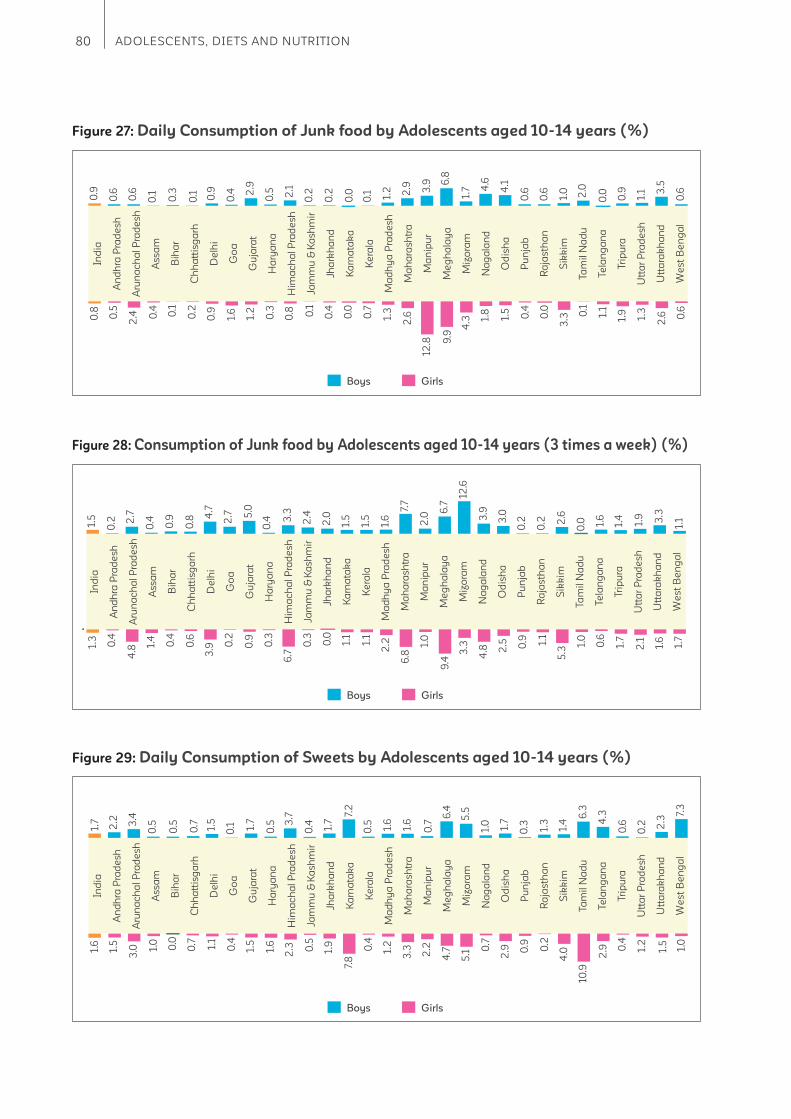
80 ADOLESCENTS, DIETS AND NUTRITION
Boys Girls
Figure 28: Consumption of Junk food by Adolescents aged 10-14 years (3 times a week) (%)
Ind
ia
An
dh
ra P
rad
esh
Aru
na
ch
al
Pra
de
sh
Ass
am
Bih
ar
Ch
ha
ttis
ga
rh
De
lhi
Go
a
Gu
jara
t
Ha
rya
na
Him
ac
ha
l P
rad
esh
Jam
mu
& K
ash
mir
Jha
rkh
an
d
Ka
rna
tak
a
Ke
rala
Ma
dh
ya
Pra
de
sh
Ma
ha
rash
tra
Ma
nip
ur
Me
gh
ala
ya
Miz
ora
m
Na
ga
lan
d
Od
ish
a
Pu
nja
b
Ra
jasth
an
Sik
kim
Ta
mil
Na
du
Te
lan
ga
na
Tri
pu
ra
Utt
ar
Pra
de
sh
Utt
ara
kh
an
d
We
st
Be
ng
al
1.5
0.2 2
.7
0.4
0.9
0.8 4
.7
2.7 5
.0
0.4 3
.3
2.4
2.0
1.5
1.5
1.6
7.7
2.0
6.7
12.6
3.9
3.0
0.0
0.2
0.2 2
.6
1.6
1.4
1.9 3.3
1.1
1.3
0.4
4.8
1.4
0.4
0.6
3.9 0
.2
0.9
0.3
6.7
0.3
0.0
1.1
1.1
2.2
6.8
1.0
9.4
3.3
4.8 0
.9 1.1
5.32
.5 1.0
0.6
1.7
2.1
1.6
1.7
Boys Girls
Figure 27: Daily Consumption of Junk food by Adolescents aged 10-14 years (%)
Ind
ia
An
dh
ra P
rad
esh
Aru
na
ch
al
Pra
de
sh
Ass
am
Bih
ar
Ch
ha
ttis
ga
rh
De
lhi
Go
a
Gu
jara
t
Ha
rya
na
Him
ac
ha
l P
rad
esh
Jam
mu
& K
ash
mir
Jha
rkh
an
d
Ka
rna
tak
a
Ke
rala
Ma
dh
ya
Pra
de
sh
Ma
ha
rash
tra
Ma
nip
ur
Me
gh
ala
ya
Miz
ora
m
Na
ga
lan
d
Od
ish
a
Pu
nja
b
Ra
jas
tha
n
Sik
kim
Ta
mil
Na
du
Te
lan
ga
na
Tri
pu
ra
Utt
ar
Pra
de
sh
Utt
ara
kh
an
d
We
st
Be
ng
al
0.9
0.6
0.6
0.1
0.3
0.1 0.9
0.4 2
.9
0.5 2.1
0.2
0.2
0.0
0.1 1.2 2.9 3.9 6
.8
1.7 4
.6
4.1
2.0
0.6
0.6
1.0
0.0 0.9
1.1 3
.5
0.6
0.8
0.5
2.4 0
.4 0.1
0.2
0.9
1.6
1.2
0.3
0.8 0.1
0.4
0.0
0.7
1.3
2.6
12.8 9
.9
4.3 1.
8 0.4
0.0
3.31.
5 0.1
1.1
1.9
1.3
2.6 0
.6
Boys Girls
Figure 29: Daily Consumption of Sweets by Adolescents aged 10-14 years (%)
Ind
ia
An
dh
ra P
rad
esh
Aru
na
ch
al
Pra
de
sh
Ass
am
Bih
ar
Ch
ha
ttis
ga
rh
De
lhi
Go
a
Gu
jara
t
Ha
rya
na
Him
ac
ha
l P
rad
esh
Jam
mu
& K
ash
mir
Jha
rkh
an
d
Ka
rna
tak
a
Ke
rala
Ma
dh
ya
Pra
de
sh
Ma
ha
rash
tra
Ma
nip
ur
Me
gh
ala
ya
Miz
ora
m
Na
ga
lan
d
Od
ish
a
Pu
nja
b
Ra
jasth
an
Sik
kim
Ta
mil
Na
du
Te
lan
ga
na
Tri
pu
ra
Utt
ar
Pra
de
sh
Utt
ara
kh
an
d
We
st
Be
ng
al
1.7
2.2 3.4
0.5
0.5
0.7 1.5
0.1 1.
7
0.5 3
.7
0.4 1.7
7.2
0.5 1.6
1.6
0.7
6.4
5.5
1.0 1.7 6
.3
0.3 1.3
1.4 4
.3
0.6
0.2 2
.3
7.3
1.6
1.5
3.0 1.
0
0.0
0.7 1.1
0.4
1.5
1.6
2.3 0.5
1.9
7.8
0.4
1.2
3.3 2.2
4.7
5.1 0
.7
0.9 0.2
4.02.9
10.9
2.9 0
.4
1.2
1.5
1.0
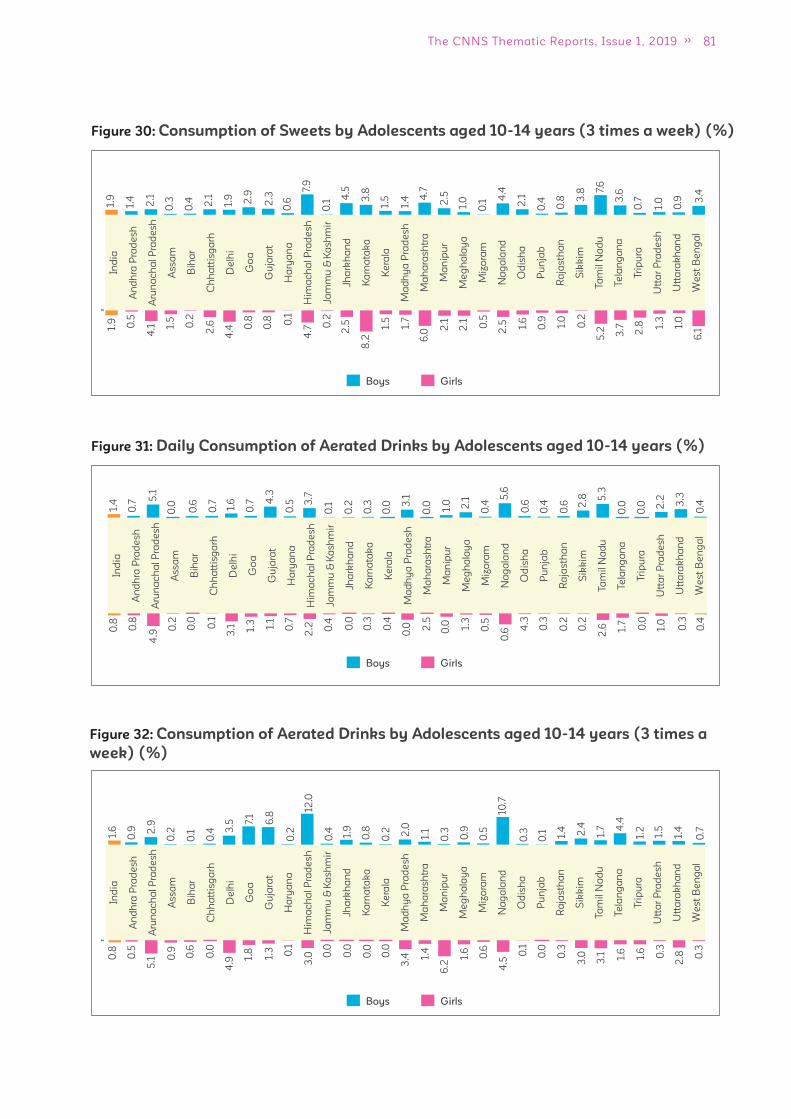
81The CNNS Thematic Reports, Issue 1, 2019
Boys Girls
Figure 30: Consumption of Sweets by Adolescents aged 10-14 years (3 times a week) (%)
Ind
ia
An
dh
ra P
rad
esh
Aru
na
ch
al
Pra
de
sh
Ass
am
Bih
ar
Ch
ha
ttis
ga
rh
De
lhi
Go
a
Gu
jara
t
Ha
rya
na
Him
ac
ha
l P
rad
esh
Jam
mu
& K
ash
mir
Jha
rkh
an
d
Ka
rna
tak
a
Ke
rala
Ma
dh
ya
Pra
de
sh
Ma
ha
rash
tra
Ma
nip
ur
Me
gh
ala
ya
Miz
ora
m
Na
ga
lan
d
Od
ish
a
Pu
nja
b
Ra
jas
tha
n
Sik
kim
Ta
mil
Na
du
Te
lan
ga
na
Tri
pu
ra
Utt
ar
Pra
de
sh
Utt
ara
kh
an
d
We
st
Be
ng
al
1.9
1.4
2.1
0.3
0.4 2.1
1.9 2.9
2.3
0.6
7.9
0.1
4.5
3.8
1.5
1.4 4
.7
2.5
1.0
0.1
4.4
2.1
7.6
0.4
0.8 3
.8
3.6
0.7
1.0
0.9 3
.4
1.9 0.5
4.1 1.
5
0.2
2.6
4.4 0
.8
0.8 0.1
4.7 0
.2
2.5
8.2
1.5
1.7
6.0
2.1
2.1 0.5
2.5 0.9 1.0
0.2
1.6
5.2 3.7 2.8 1.
3
1.0
6.1
Boys Girls
Figure 32: Consumption of Aerated Drinks by Adolescents aged 10-14 years (3 times a
week) (%)
Ind
ia
An
dh
ra P
rad
esh
Aru
na
ch
al
Pra
de
sh
Ass
am
Bih
ar
Ch
ha
ttis
ga
rh
De
lhi
Go
a
Gu
jara
t
Ha
rya
na
Him
ac
ha
l P
rad
esh
Jam
mu
& K
ash
mir
Jha
rkh
an
d
Ka
rna
tak
a
Ke
rala
Ma
dh
ya
Pra
de
sh
Ma
ha
rash
tra
Ma
nip
ur
Me
gh
ala
ya
Miz
ora
m
Na
ga
lan
d
Od
ish
a
Pu
nja
b
Ra
jasth
an
Sik
kim
Ta
mil
Na
du
Te
lan
ga
na
Tri
pu
ra
Utt
ar
Pra
de
sh
Utt
ara
kh
an
d
We
st
Be
ng
al
1.6
0.9 2
.9
0.2
0.1
0.4 3
.5 7.1
6.8
0.2
12.0
0.4 1.9
0.8
0.2 2.0
1.1
0.3 0.9
0.5
10.7
0.3 1.
7
0.1 1.4 2.4 4
.4
1.2
1.5
1.4
0.7
0.8
0.5
5.1 0
.9 0.6
0.0
4.9 1.
8
1.3 0.1
3.0 0
.0
0.0
0.0
0.0
3.4 1.
4
6.2
1.6
0.6
4.5
0.0
0.3
3.00
.1
3.1 1.6
1.6
0.3
2.8 0
.3
Boys Girls
Figure 31: Daily Consumption of Aerated Drinks by Adolescents aged 10-14 years (%)
Ind
ia
An
dh
ra P
rad
esh
Aru
na
ch
al
Pra
de
sh
Ass
am
Bih
ar
Ch
ha
ttis
ga
rh
De
lhi
Go
a
Gu
jara
t
Ha
rya
na
Him
ac
ha
l P
rad
esh
Jam
mu
& K
ash
mir
Jha
rkh
an
d
Ka
rna
tak
a
Ke
rala
Ma
dh
ya
Pra
de
sh
Ma
ha
rash
tra
Ma
nip
ur
Me
gh
ala
ya
Miz
ora
m
Na
ga
lan
d
Od
ish
a
Pu
nja
b
Ra
jasth
an
Sik
kim
Ta
mil
Na
du
Te
lan
ga
na
Tri
pu
ra
Utt
ar
Pra
de
sh
Utt
ara
kh
an
d
We
st
Be
ng
al
1.4
0.7
5.1
0.0
0.6
0.7 1.6
0.7 4
.3
0.5 3
.7
0.1
0.2
0.3
0.0 3
.1
0.0 1.0 2.1
0.4
5.6
0.6
5.3
0.4
0.6 2
.8
0.0
0.0 2
.2 3.3
0.4
0.8
0.8
4.9
0.2
0.0
0.1
3.1 1.
3 1.1
0.7
2.2 0.4
0.0
0.3
0.4
0.0 2
.5
0.0 1.3
0.5
0.6 0
.3
0.2
0.2
4.3
2.6 1.
7
0.0
1.0
0.3
0.4
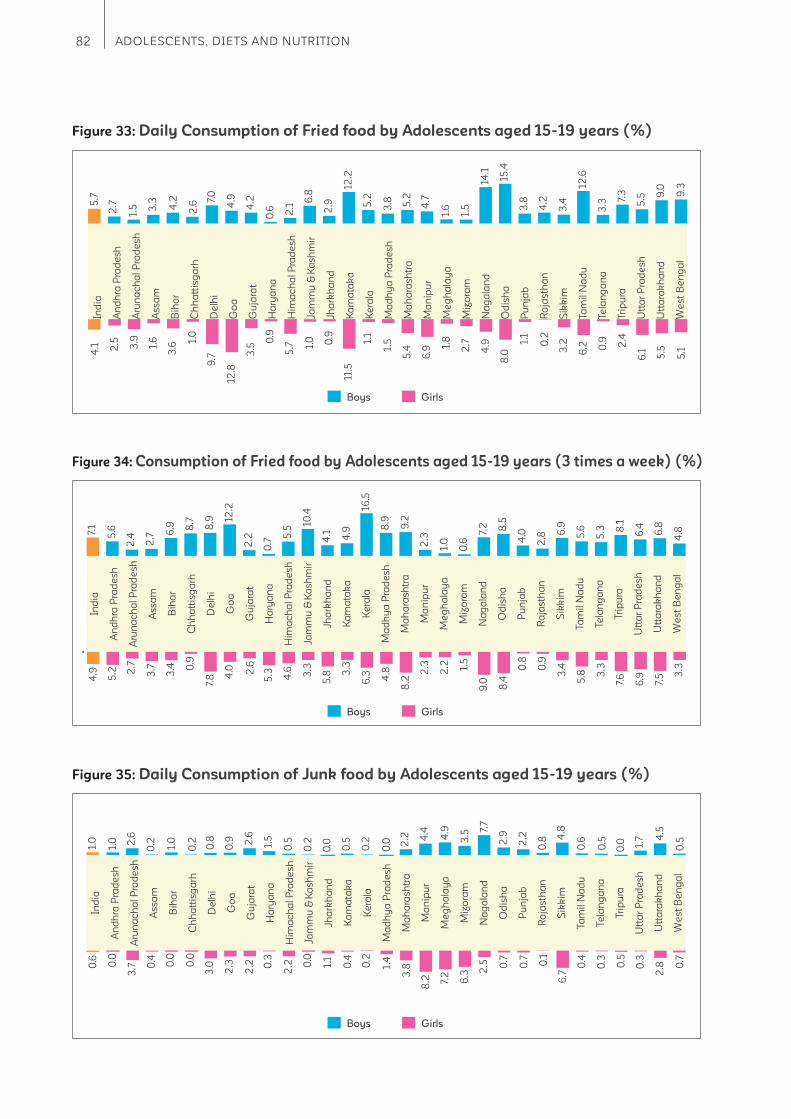
82 ADOLESCENTS, DIETS AND NUTRITION
Boys Girls
Figure 35: Daily Consumption of Junk food by Adolescents aged 15-19 years (%)
Ind
ia
An
dh
ra P
rad
esh
Aru
na
ch
al
Pra
de
sh
Ass
am
Bih
ar
Ch
ha
ttis
ga
rh
De
lhi
Go
a
Gu
jara
t
Ha
rya
na
Him
ac
ha
l P
rad
esh
Jam
mu
& K
ash
mir
Jha
rkh
an
d
Ka
rna
tak
a
Ke
rala
Ma
dh
ya
Pra
de
sh
Ma
ha
rash
tra
Ma
nip
ur
Me
gh
ala
ya
Miz
ora
m
Na
ga
lan
d
Od
ish
a
Pu
nja
b
Ra
jasth
an
Sik
kim
Ta
mil
Na
du
Te
lan
ga
na
Tri
pu
ra
Utt
ar
Pra
de
sh
Utt
ara
kh
an
d
We
st
Be
ng
al
1.0
1.0 2.6
0.2 1.0
0.2 0.8
0.9 2
.6
1.5
0.5
0.2
0.0
0.5
0.2
0.0 2
.2 4.4
4.9
3.5
7.7
2.9
0.62.2
0.8
4.8
0.5
0.0 1.
7 4.5
0.5
0.6
0.0
3.7 0
.4
0.0
0.0
3.0
2.3
2.2 0
.3
2.2 0
.0
1.1
0.4
0.2
1.4
3.8
8.2 7.
2
6.3
2.5 0.7 0.1
6.7
0.7
0.4
0.3
0.5
0.3
2.8 0
.7
Boys Girls
Figure 34: Consumption of Fried food by Adolescents aged 15-19 years (3 times a week) (%)
Ind
ia
An
dh
ra P
rad
esh
Aru
na
ch
al
Pra
de
sh
Ass
am
Bih
ar
Ch
ha
ttis
ga
rh
De
lhi
Go
a
Gu
jara
t
Ha
rya
na
Him
ac
ha
l P
rad
esh
Jam
mu
& K
ash
mir
Jha
rkh
an
d
Ka
rna
tak
a
Ke
rala
Ma
dh
ya
Pra
de
sh
Ma
ha
rash
tra
Ma
nip
ur
Me
gh
ala
ya
Miz
ora
m
Na
ga
lan
d
Od
ish
a
Pu
nja
b
Ra
jasth
an
Sik
kim
Ta
mil
Na
du
Te
lan
ga
na
Tri
pu
ra
Utt
ar
Pra
de
sh
Utt
ara
kh
an
d
We
st
Be
ng
al
7.1
5.6
2.4
2.7 6
.9 8.7
8.9 12
.2
2.2
0.7
5.5
10.4
4.1 4.9
16.5
8.9
9.2
2.3
1.0
0.6
7.2 8.5
5.6
4.0
2.8 6
.9
5.3 8
.1
6.4
6.8
4.8
4.9
5.2 2
.7
3.7
3.4 0
.9
7.8 4
.0 2.6
5.3 4.6 3.3
3.3
6.3 4.8
8.2
2.3
2.2 1.5
9.0
0.8
0.9
3.4
8.4 5
.8 3.3
7.6
6.9
7.5 3
.3
5.8
Boys Girls
Figure 33: Daily Consumption of Fried food by Adolescents aged 15-19 years (%)
Ind
ia
An
dh
ra P
rad
esh
Aru
na
ch
al
Pra
de
sh
Ass
am
Bih
ar
Ch
ha
ttis
ga
rh
De
lhi
Go
a
Gu
jara
t
Ha
rya
na
Him
ac
ha
l P
rad
esh
Jam
mu
& K
ash
mir
Jha
rkh
an
d
Ka
rna
tak
a
Ke
rala
Ma
dh
ya
Pra
de
sh
Ma
ha
rash
tra
Ma
nip
ur
Me
gh
ala
ya
Miz
ora
m
Na
ga
lan
d
Od
ish
a
Pu
nja
b
Ra
jas
tha
n
Sik
kim
Ta
mil
Na
du
Te
lan
ga
na
Tri
pu
ra
Utt
ar
Pra
de
sh
Utt
ara
kh
an
d
We
st
Be
ng
al
5.7
2.7
1.5 3.3 4.2
2.6
7.0
4.9
4.2
0.6 2.1
6.8
2.9
12.2
5.2
3.8 5.2
4.7
1.6
1.5
14.1
15.4
12.6
3.8
4.2
3.4
3.3
7.3
5.5 9
.0
9.3
4.1 2.5 3.9
1.6
3.6
1.0
9.7
12.8
3.5
0.9
5.7 1.
0 0.9
11.5
1.1
1.5
5.4
6.9 1.
8
2.7
4.9 1.
1
0.2
3.2
8.0 6
.2 0.9 2.4
6.1 5.5
5.1
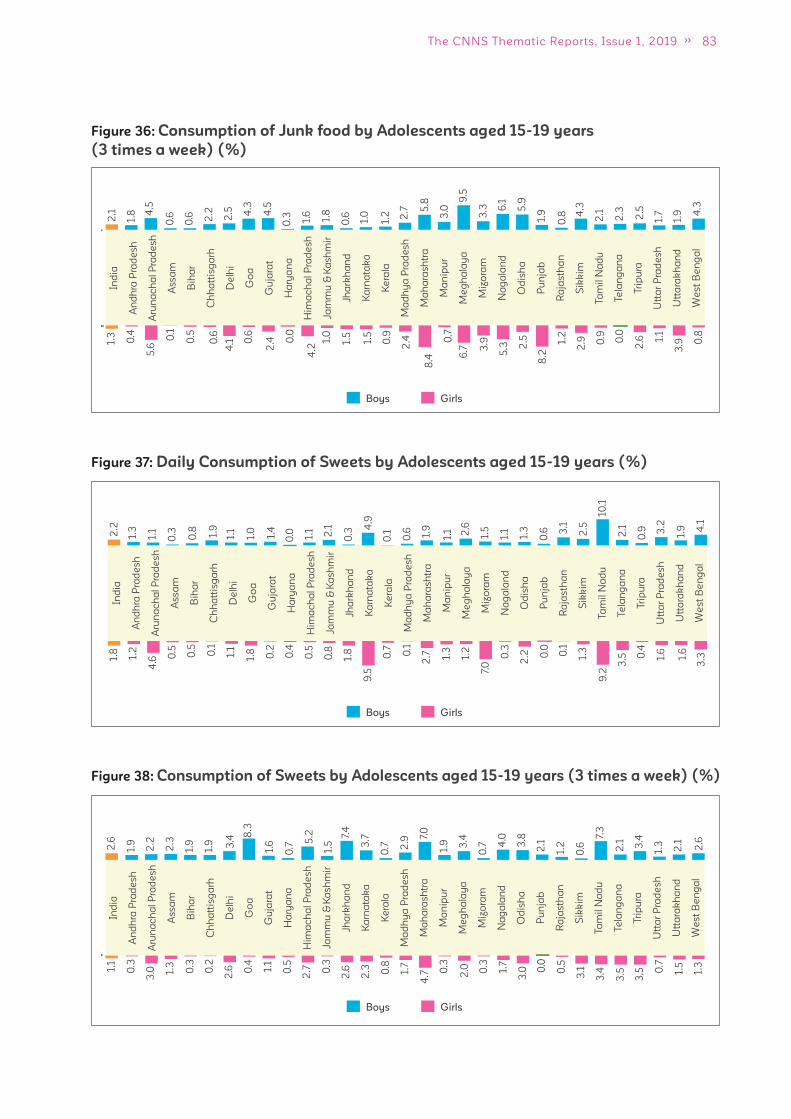
83The CNNS Thematic Reports, Issue 1, 2019
Boys Girls
Figure 36: Consumption of Junk food by Adolescents aged 15-19 years
(3 times a week) (%)
Ind
ia
An
dh
ra P
rad
esh
Aru
na
ch
al
Pra
de
sh
Ass
am
Bih
ar
Ch
ha
ttis
ga
rh
De
lhi
Go
a
Gu
jara
t
Ha
rya
na
Him
ac
ha
l P
rad
esh
Jam
mu
& K
ash
mir
Jha
rkh
an
d
Ka
rna
tak
a
Ke
rala
Ma
dh
ya
Pra
de
sh
Ma
ha
rash
tra
Ma
nip
ur
Me
gh
ala
ya
Miz
ora
m
Na
ga
lan
d
Od
ish
a
Pu
nja
b
Ra
jas
tha
n
Sik
kim
Ta
mil
Na
du
Te
lan
ga
na
Tri
pu
ra
Utt
ar
Pra
de
sh
Utt
ara
kh
an
d
We
st
Be
ng
al
2.1
1.8 4
.5
0.6
0.6 2.2
2.5 4.3
4.5
0.3 1.6
1.8
0.6 1.0
1.2 2.7 5
.8
3.0
9.5
3.3 6
.1
5.9
2.1
1.9
0.8 4
.3
2.3
2.5
1.7
1.9 4
.3
1.3
0.4
5.6
0.1
0.5
0.6
4.1 0
.6
2.4 0
.0
4.2
1.0
1.5
1.5
0.9
2.4
8.4
0.7
6.7 3
.9
5.3
8.2
1.2
2.9
2.5 0.9 0.0
2.6 1.
1
3.9 0
.8
Boys Girls
Figure 38: Consumption of Sweets by Adolescents aged 15-19 years (3 times a week) (%)
Ind
ia
An
dh
ra P
rad
esh
Aru
na
ch
al
Pra
de
sh
Ass
am
Bih
ar
Ch
ha
ttis
ga
rh
De
lhi
Go
a
Gu
jara
t
Ha
rya
na
Him
ac
ha
l P
rad
esh
Jam
mu
& K
ash
mir
Jha
rkh
an
d
Ka
rna
tak
a
Ke
rala
Ma
dh
ya
Pra
de
sh
Ma
ha
rash
tra
Ma
nip
ur
Me
gh
ala
ya
Miz
ora
m
Na
ga
lan
d
Od
ish
a
Pu
nja
b
Ra
jasth
an
Sik
kim
Ta
mil
Na
du
Te
lan
ga
na
Tri
pu
ra
Utt
ar
Pra
de
sh
Utt
ara
kh
an
d
We
st
Be
ng
al
2.6
1.9
2.2
2.3
1.9
1.9 3.4
8.3
1.6
0.7
5.2
1.5
7.4
3.7
0.7 2
.9
7.0
1.9 3.4
0.7 4
.0
3.8 7.
3
2.1
1.2
0.6 2.1 3.4
1.3
2.1
2.6
1.1
0.3
3.0 1.
3
0.3
0.2
2.6 0
.4
1.1
0.5
2.7 0
.3
2.6
2.3 0.8
1.7
4.7 0
.3
2.0 0.3
1.7
0.0
0.5
3.1
3.0
3.4
3.5
3.5 0
.7
1.5
1.3
Boys Girls
Figure 37: Daily Consumption of Sweets by Adolescents aged 15-19 years (%)
Ind
ia
An
dh
ra P
rad
esh
Aru
na
ch
al
Pra
de
sh
Ass
am
Bih
ar
Ch
ha
ttis
ga
rh
De
lhi
Go
a
Gu
jara
t
Ha
rya
na
Him
ac
ha
l P
rad
esh
Jam
mu
& K
ash
mir
Jha
rkh
an
d
Ka
rna
tak
a
Ke
rala
Ma
dh
ya
Pra
de
sh
Ma
ha
rash
tra
Ma
nip
ur
Me
gh
ala
ya
Miz
ora
m
Na
ga
lan
d
Od
ish
a
Pu
nja
b
Ra
jasth
an
Sik
kim
Ta
mil
Na
du
Te
lan
ga
na
Tri
pu
ra
Utt
ar
Pra
de
sh
Utt
ara
kh
an
d
We
st
Be
ng
al
2.2
1.3
1.1
0.3
0.8 1.9
1.1
1.0
1.4
0.0 1.1 2.1
0.3
4.9
0.1
0.6 1.9
1.1 2.6
1.5
1.1
1.3
10.1
0.6 3
.1
2.5
2.1
0.9 3
.2
1.9 4
.1
1.8
1.2
4.6 0
.5
0.5
0.1
1.1
1.8 0.2
0.4
0.5
0.8
1.8
9.5
0.7 0.1
2.7 1.
3
1.2
7.0
0.3
0.0 0.1
1.3
2.2
9.2
3.5 0
.4
1.6
1.6
3.3
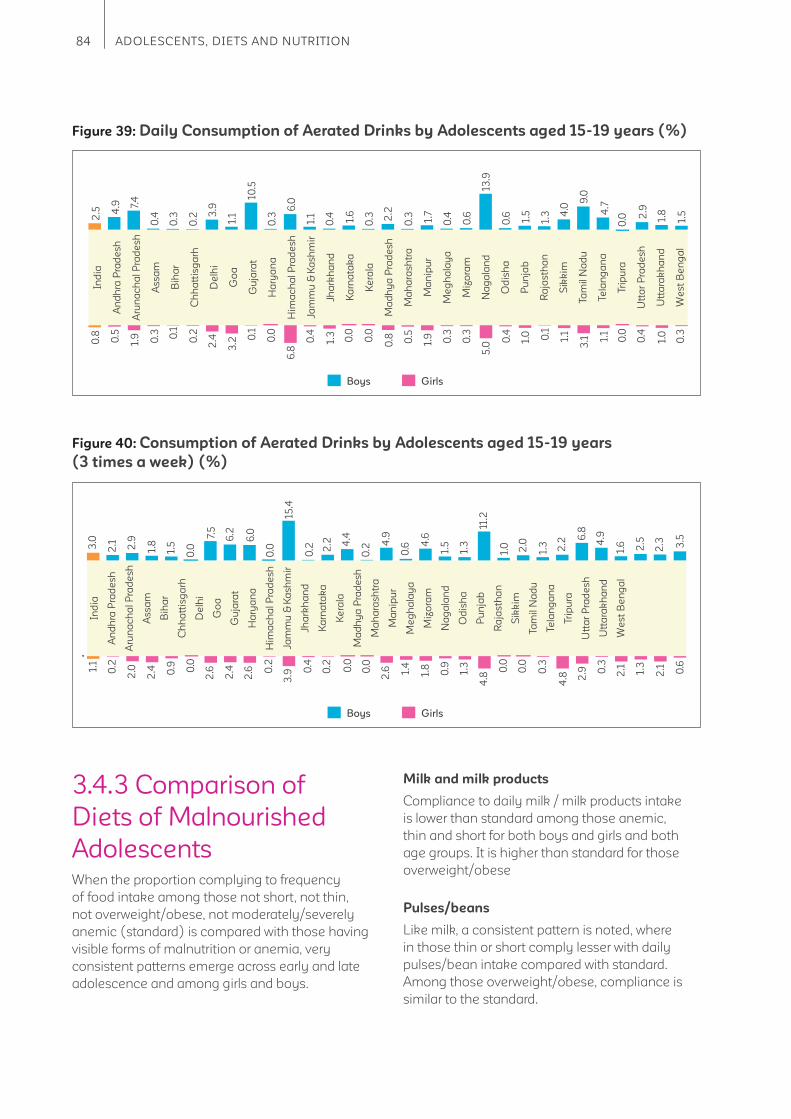
84 ADOLESCENTS, DIETS AND NUTRITION
Boys Girls
Figure 40: Consumption of Aerated Drinks by Adolescents aged 15-19 years
(3 times a week) (%)
Ind
ia
An
dh
ra P
rad
esh
Aru
na
ch
al
Pra
de
sh
Ass
am
Bih
ar
Ch
ha
ttis
ga
rh
De
lhi
Go
a
Gu
jara
t
Ha
rya
na
Him
ac
ha
l P
rad
esh
Jam
mu
& K
ash
mir
Jha
rkh
an
d
Ka
rna
tak
a
Ke
rala
Ma
dh
ya
Pra
de
sh
Ma
ha
rash
tra
Ma
nip
ur
Me
gh
ala
ya
Miz
ora
m
Na
ga
lan
d
Od
ish
a
Pu
nja
b
Ra
jasth
an
Sik
kim
Ta
mil
Na
du
Te
lan
ga
na
Tri
pu
ra
Utt
ar
Pra
de
sh
Utt
ara
kh
an
d
We
st
Be
ng
al
3.0
2.1 2.9
1.8
1.5
0.0
7.5
6.2
6.0
0.0
15.4
0.2 2
.2 4.4
0.2
4.9
0.6 4
.6
1.5
1.3
11.2
1.0
6.8
2.0
1.3 2.2 4
.9
1.6 2.5
2.3 3.5
1.1
0.2
2.0
2.4 0.9 0.0
2.6
2.4
2.6 0
.2
3.9 0
.4
0.2
0.0
0.0
2.6 1.
4
1.8
0.9
1.3
4.8
0.0
0.3
4.8
0.0
2.9 0
.3
2.1 1.3
2.1 0.6
Boys Girls
Figure 39: Daily Consumption of Aerated Drinks by Adolescents aged 15-19 years (%)
Ind
ia
An
dh
ra P
rad
esh
Aru
na
ch
al
Pra
de
sh
Ass
am
Bih
ar
Ch
ha
ttis
ga
rh
De
lhi
Go
a
Gu
jara
t
Ha
rya
na
Him
ac
ha
l P
rad
esh
Jam
mu
& K
ash
mir
Jha
rkh
an
d
Ka
rna
tak
a
Ke
rala
Ma
dh
ya
Pra
de
sh
Ma
ha
rash
tra
Ma
nip
ur
Me
gh
ala
ya
Miz
ora
m
Na
ga
lan
d
Od
ish
a
Pu
nja
b
Ra
jas
tha
n
Sik
kim
Ta
mil
Na
du
Te
lan
ga
na
Tri
pu
ra
Utt
ar
Pra
de
sh
Utt
ara
kh
an
d
We
st
Be
ng
al
2.5 4
.9 7.4
0.4
0.3
0.2 3
.9
1.1
10.5
0.3
6.0
1.1
0.4 1.6
0.3 2
.2
0.3 1.7
0.4
0.6
13.9
0.6
9.0
1.5
1.3 4
.0 4.7
0.0 2
.9
1.8
1.5
0.8
0.5
1.9 0.3 0.1
0.2
2.4
3.2 0
.1
0.0
6.8
0.4
1.3
0.0
0.0
0.8 0.5
1.9 0.3
0.3
5.0
1.0 0.1
1.1
0.4
3.1 1.
1
0.0
0.4
1.0
0.3
3.4.3 Comparison of
Diets of Malnourished
AdolescentsWhen the proportion complying to frequency
of food intake among those not short, not thin,
not overweight/obese, not moderately/severely
anemic (standard) is compared with those having
visible forms of malnutrition or anemia, very
consistent patterns emerge across early and late
adolescence and among girls and boys.
Milk and milk products
Compliance to daily milk / milk products intake
is lower than standard among those anemic,
thin and short for both boys and girls and both
age groups. It is higher than standard for those
overweight/obese
Pulses/beans
Like milk, a consistent pattern is noted, where
in those thin or short comply lesser with daily
pulses/bean intake compared with standard.
Among those overweight/obese, compliance is
similar to the standard.
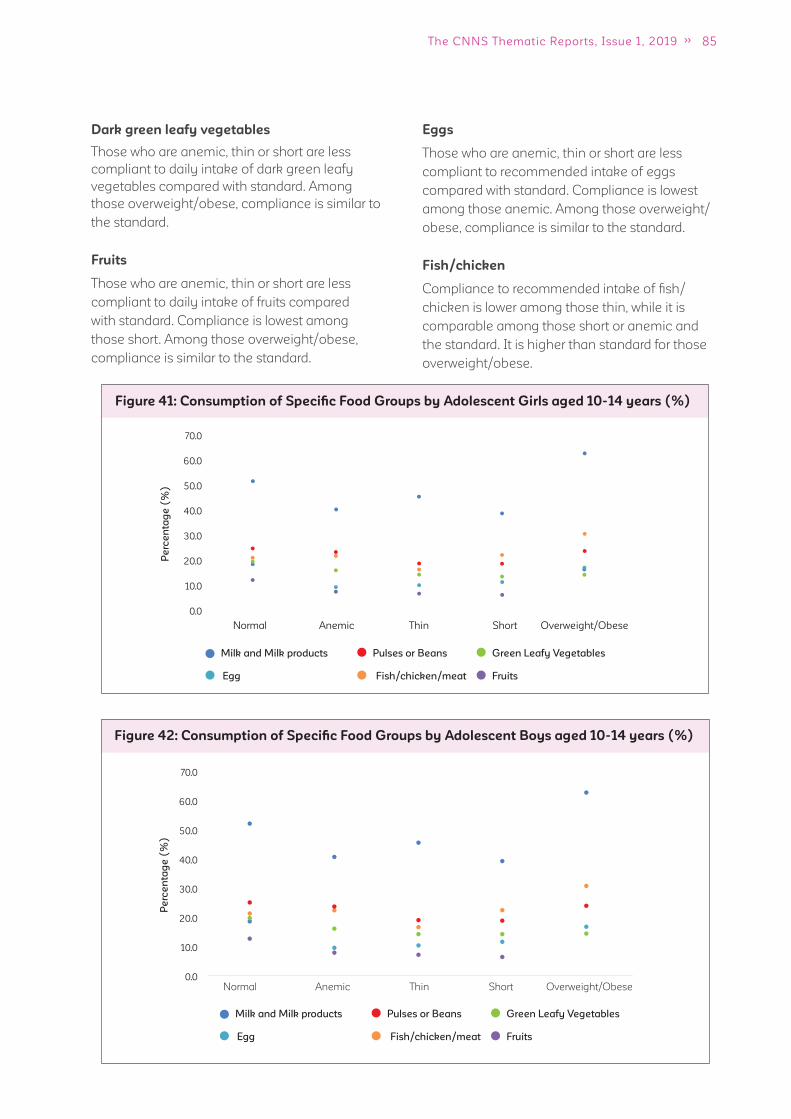
85The CNNS Thematic Reports, Issue 1, 2019
Dark green leafy vegetables
Those who are anemic, thin or short are less
compliant to daily intake of dark green leafy
vegetables compared with standard. Among
those overweight/obese, compliance is similar to
the standard.
Fruits
Those who are anemic, thin or short are less
compliant to daily intake of fruits compared
with standard. Compliance is lowest among
those short. Among those overweight/obese,
compliance is similar to the standard.
Eggs
Those who are anemic, thin or short are less
compliant to recommended intake of eggs
compared with standard. Compliance is lowest
among those anemic. Among those overweight/
obese, compliance is similar to the standard.
Fish/chicken
Compliance to recommended intake of fi sh/
chicken is lower among those thin, while it is
comparable among those short or anemic and
the standard. It is higher than standard for those
overweight/obese.
Figure 41: Consumption of Specifi c Food Groups by Adolescent Girls aged 10-14 years (%)
70.0
60.0
50.0
40.0
30.0
20.0
10.0
0.0
Normal Anemic Thin Short Overweight/Obese
Milk and Milk products
Egg
Green Leafy Vegetables
Fruits
Pulses or Beans
Fish/chicken/meat
Pe
rce
nta
ge
(%
)
Figure 42: Consumption of Specifi c Food Groups by Adolescent Boys aged 10-14 years (%)
70.0
60.0
50.0
40.0
30.0
20.0
10.0
0.0Normal Anemic Thin Short Overweight/Obese
Milk and Milk products
Egg
Green Leafy Vegetables
Fruits
Pulses or Beans
Fish/chicken/meat
Pe
rce
nta
ge
(%
)
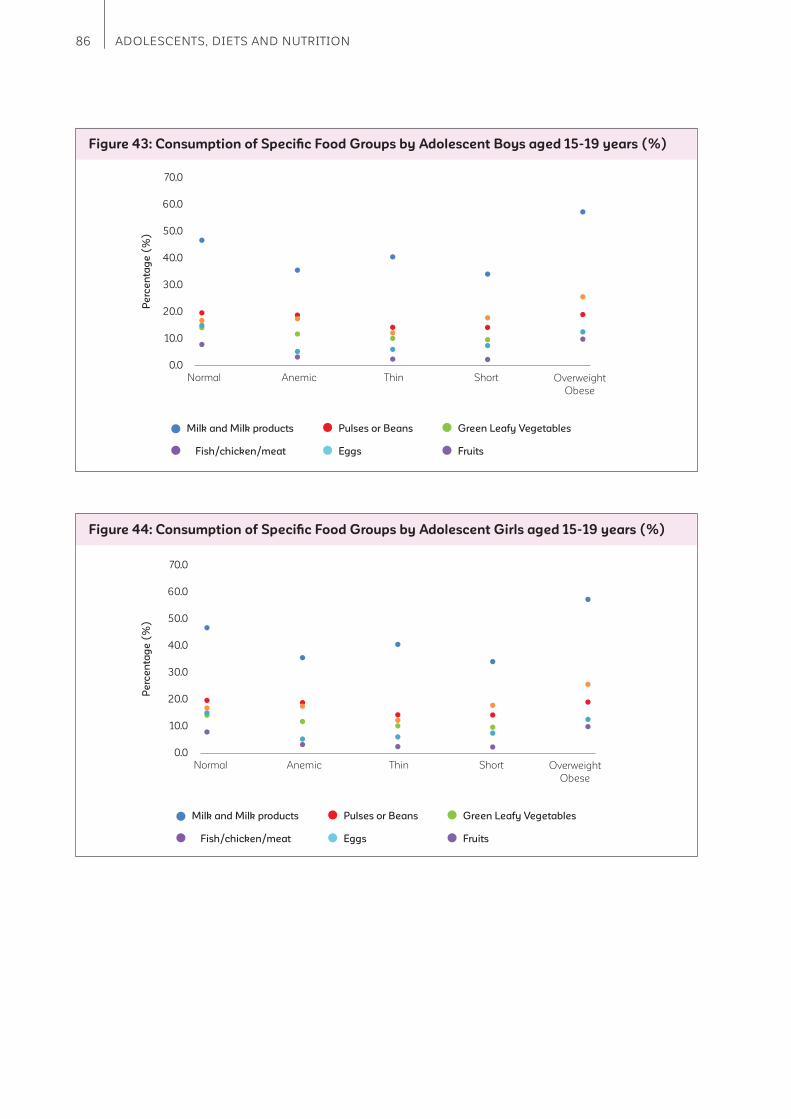
86 ADOLESCENTS, DIETS AND NUTRITION
Figure 44: Consumption of Specifi c Food Groups by Adolescent Girls aged 15-19 years (%)
Milk and Milk products
Normal Anemic Thin Short Overweight
Obese
Fish/chicken/meat
Green Leafy Vegetables
Fruits
Pulses or Beans
Eggs
70.0
60.0
50.0
40.0
30.0
20.0
10.0
0.0
Figure 43: Consumption of Specifi c Food Groups by Adolescent Boys aged 15-19 years (%)
Milk and Milk products
Normal Anemic Thin Short Overweight
Obese
Fish/chicken/meat
Green Leafy Vegetables
Fruits
Pulses or Beans
Eggs
70.0
60.0
50.0
40.0
30.0
20.0
10.0
0.0
Pe
rce
nta
ge
(%
)P
erc
en
tag
e (
%)
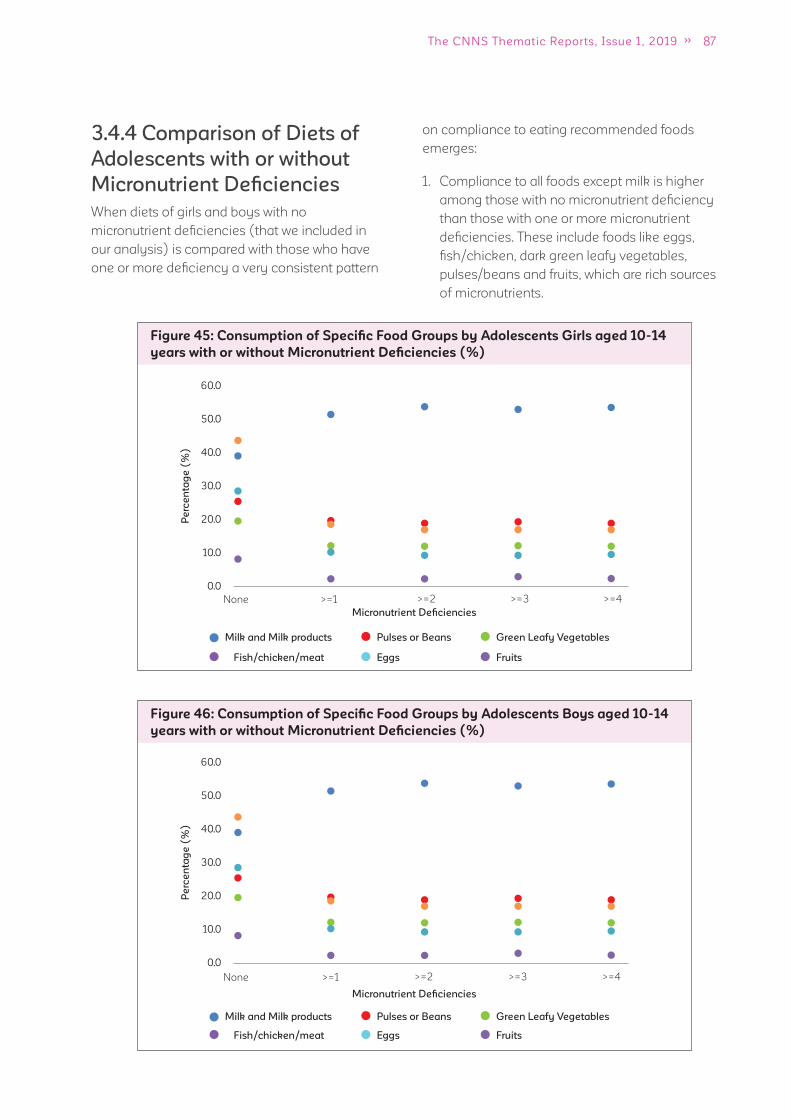
87The CNNS Thematic Reports, Issue 1, 2019
Figure 45: Consumption of Specifi c Food Groups by Adolescents Girls aged 10-14
years with or without Micronutrient Defi ciencies (%)
Milk and Milk products
None >=1 >=2 >=3 >=4
Fish/chicken/meat
Green Leafy Vegetables
Fruits
Pulses or Beans
Eggs
60.0
50.0
40.0
30.0
20.0
10.0
0.0
Figure 46: Consumption of Specifi c Food Groups by Adolescents Boys aged 10-14
years with or without Micronutrient Defi ciencies (%)
Milk and Milk products
None >=1 >=2 >=3 >=4
Fish/chicken/meat
Green Leafy Vegetables
Fruits
Pulses or Beans
Eggs
60.0
50.0
40.0
30.0
20.0
10.0
0.0
3.4.4 Comparison of Diets of
Adolescents with or without
Micronutrient Defi ciencies
When diets of girls and boys with no
micronutrient defi ciencies (that we included in
our analysis) is compared with those who have
one or more defi ciency a very consistent pattern
on compliance to eating recommended foods
emerges:
1. Compliance to all foods except milk is higher
among those with no micronutrient defi ciency
than those with one or more micronutrient
defi ciencies. These include foods like eggs,
fi sh/chicken, dark green leafy vegetables,
pulses/beans and fruits, which are rich sources
of micronutrients.
Pe
rce
nta
ge
(%
)P
erc
en
tag
e (
%)
Micronutrient Defi ciencies
Micronutrient Defi ciencies

88 ADOLESCENTS, DIETS AND NUTRITION
2. Compliance to consumption of foods as per
recommended frequency among those with
one, two, three, four or more micronutrient
defi ciencies does not fl uctuate much. Those
who are defi cient in one or more micronutrients
have similar foods missing from the food
plate as those with four or more micronutrient
defi ciencies.
Figure 47: Consumption of Specifi c Food Groups by Adolescents Girls aged
15-19 years with or without Micronutrient Defi ciencies (%)
Milk and Milk products
None >=1 >=2 >=3 >=4
Fish/chicken/meat
Green Leafy Vegetables
Fruits
Pulses or Beans
Eggs
60.0
50.0
40.0
30.0
20.0
10.0
0.0
Figure 48: Consumption of Specifi c Food Groups by Adolescents Girls aged
15-19 years with or without Micronutrient Defi ciencies (%)
Milk and Milk products
None >=1 >=2 >=3 >=4
Fish/chicken/meat
Green Leafy Vegetables
Fruits
Pulses or Beans
Eggs
60.0
50.0
40.0
30.0
20.0
10.0
0.0
Micronutrient Defi ciencies
Micronutrient Defi ciencies
Pe
rce
nta
ge
(%
)P
erc
en
tag
e (
%)
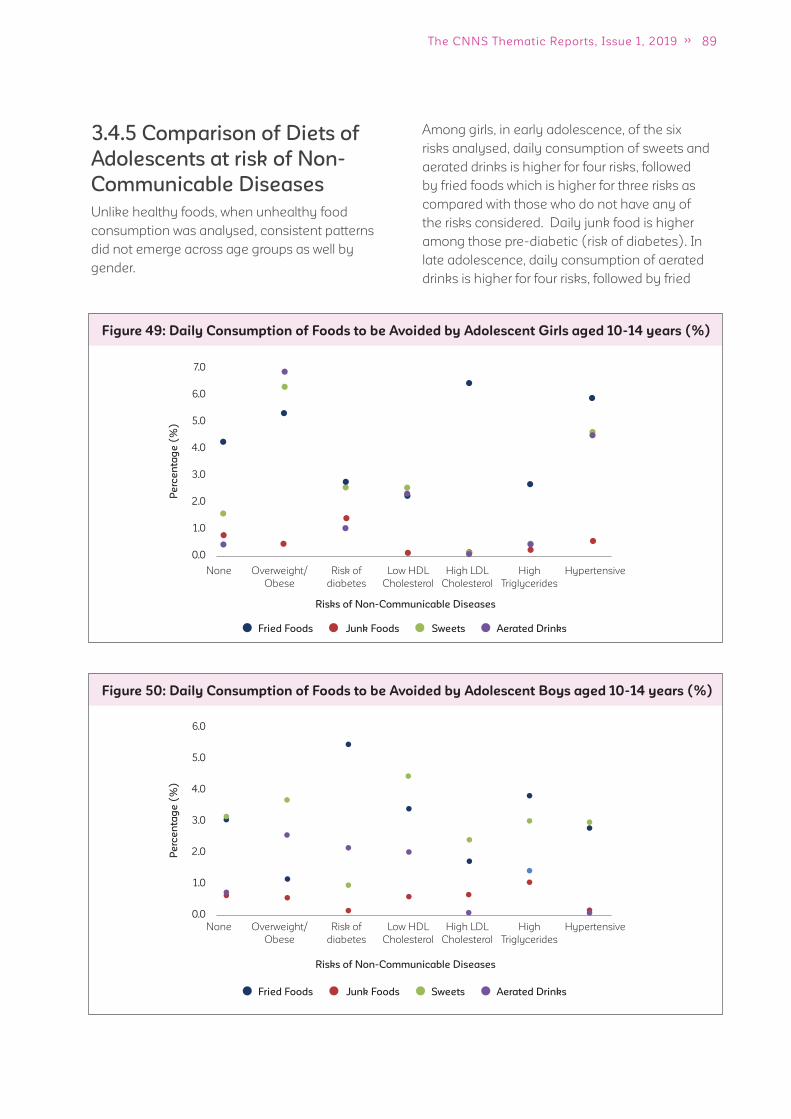
89The CNNS Thematic Reports, Issue 1, 2019
3.4.5 Comparison of Diets of
Adolescents at risk of Non-
Communicable Diseases
Unlike healthy foods, when unhealthy food
consumption was analysed, consistent patterns
did not emerge across age groups as well by
gender.
Figure 49: Daily Consumption of Foods to be Avoided by Adolescent Girls aged 10-14 years (%)
None
None
Overweight/
Obese
Overweight/
Obese
Risk of
diabetes
Risk of
diabetes
Low HDL
Cholesterol
Low HDL
Cholesterol
High LDL
Cholesterol
High LDL
Cholesterol
High
Triglycerides
High
Triglycerides
Hypertensive
Hypertensive
Fried Foods Junk Foods Sweets Aerated Drinks
7.0
6.0
5.0
4.0
3.0
2.0
1.0
0.0
Figure 50: Daily Consumption of Foods to be Avoided by Adolescent Boys aged 10-14 years (%)
Fried Foods Junk Foods Sweets Aerated Drinks
6.0
5.0
4.0
3.0
2.0
1.0
0.0
Among girls, in early adolescence, of the six
risks analysed, daily consumption of sweets and
aerated drinks is higher for four risks, followed
by fried foods which is higher for three risks as
compared with those who do not have any of
the risks considered. Daily junk food is higher
among those pre-diabetic (risk of diabetes). In
late adolescence, daily consumption of aerated
drinks is higher for four risks, followed by fried
Pe
rce
nta
ge
(%
)P
erc
en
tag
e (
%)
Risks of Non-Communicable Diseases
Risks of Non-Communicable Diseases
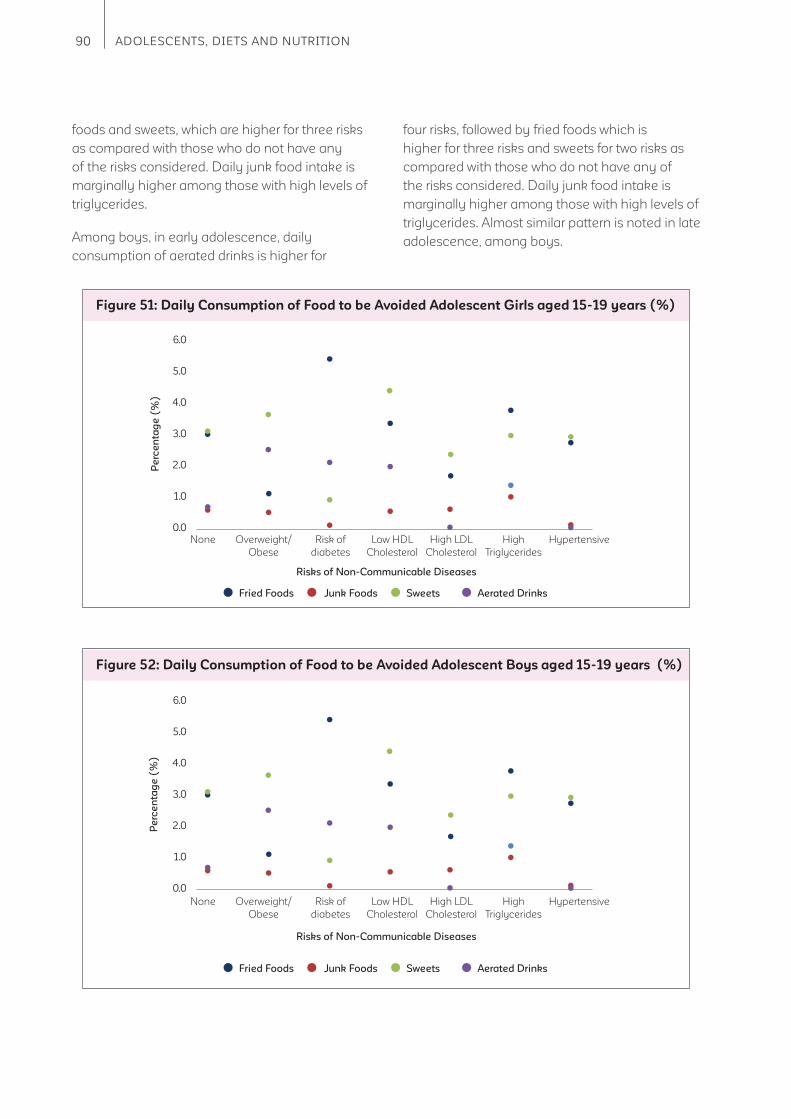
90 ADOLESCENTS, DIETS AND NUTRITION
Figure 51: Daily Consumption of Food to be Avoided Adolescent Girls aged 15-19 years (%)
Fried Foods Junk Foods Sweets Aerated Drinks
6.0
5.0
4.0
3.0
2.0
1.0
0.0
Figure 52: Daily Consumption of Food to be Avoided Adolescent Boys aged 15-19 years (%)
Fried Foods Junk Foods Sweets Aerated Drinks
6.0
5.0
4.0
3.0
2.0
1.0
0.0
foods and sweets, which are higher for three risks
as compared with those who do not have any
of the risks considered. Daily junk food intake is
marginally higher among those with high levels of
triglycerides.
Among boys, in early adolescence, daily
consumption of aerated drinks is higher for
four risks, followed by fried foods which is
higher for three risks and sweets for two risks as
compared with those who do not have any of
the risks considered. Daily junk food intake is
marginally higher among those with high levels of
triglycerides. Almost similar pattern is noted in late
adolescence, among boys.
Pe
rce
nta
ge
(%
)P
erc
en
tag
e (
%)
None
None
Overweight/
Obese
Overweight/
Obese
Risk of
diabetes
Risk of
diabetes
Low HDL
Cholesterol
Low HDL
Cholesterol
High LDL
Cholesterol
High LDL
Cholesterol
High
Triglycerides
High
Triglycerides
Hypertensive
Hypertensive
Risks of Non-Communicable Diseases
Risks of Non-Communicable Diseases

91The CNNS Thematic Reports, Issue 1, 2019
3.5 What are the physical activity patterns among
adolescents?
Key messages
1. Both girls and boys comply with recommendations on <120 minutes (<2 hours) screen time
per day but fail to meet requirements of 60 minutes (1 hour) vigorous physical activity.
2. Among girls, vigorous activity time is lower than boys and reduces from early to late
adolescence.
Physical activity among adolescents has
immediate and long-term benefi ts. Regular 60
minutes of outdoor sports or exercise helps in
building strong bones and muscles, controlling
weight, improving cardiovascular fi tness and
reducing symptoms of anxiety and depression.
In the long term, it protects from chronic diseases
like heart diseases, type 2 diabetes and some
cancers. Adolescents who follow recommended
physical activity pattern are less likely to be
overweight/obese.
Early adolescence (10 to 14 years)
On an average, girls spend 3 hours sitting and
travelling to school. Their average screen time is
about 1 hour 20 minutes and they spend same
Recommended time per day (minutes) Actual average time spent (minutes)
10 to 14 years 15 to 19 years
Girls Boys Girls Boys
Screen time (<120) 80 70 90 90
Vigorous exercise (60) 25 40 10 50
0
1
1
1
1
1
1
1
2
2
Outdoor sports/exercise/physical
activity at school
Screen time
Leisure time physical activity
Travel to school
Sitting time
Girls Boys
Figure 53: Average time (in hours) spent per day in specifi c domains of physical activity by
adolescents aged 10-14 years (%)
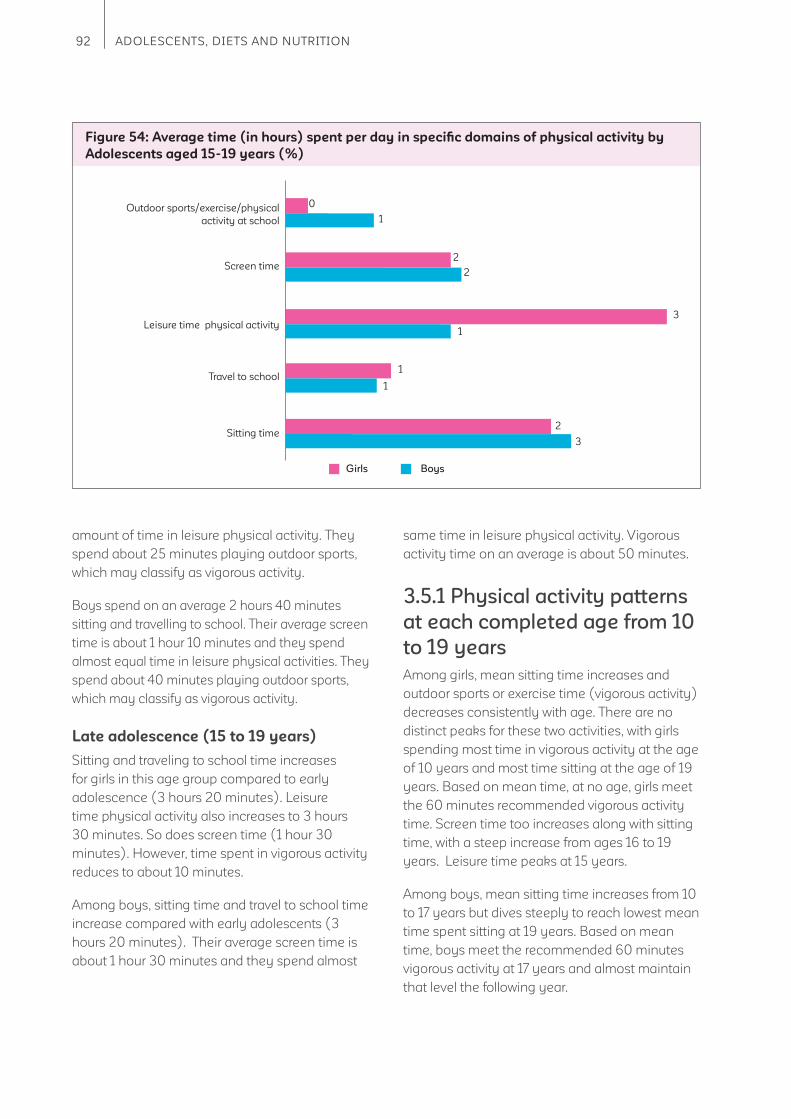
92 ADOLESCENTS, DIETS AND NUTRITION
amount of time in leisure physical activity. They
spend about 25 minutes playing outdoor sports,
which may classify as vigorous activity.
Boys spend on an average 2 hours 40 minutes
sitting and travelling to school. Their average screen
time is about 1 hour 10 minutes and they spend
almost equal time in leisure physical activities. They
spend about 40 minutes playing outdoor sports,
which may classify as vigorous activity.
Late adolescence (15 to 19 years)
Sitting and traveling to school time increases
for girls in this age group compared to early
adolescence (3 hours 20 minutes). Leisure
time physical activity also increases to 3 hours
30 minutes. So does screen time (1 hour 30
minutes). However, time spent in vigorous activity
reduces to about 10 minutes.
Among boys, sitting time and travel to school time
increase compared with early adolescents (3
hours 20 minutes). Their average screen time is
about 1 hour 30 minutes and they spend almost
same time in leisure physical activity. Vigorous
activity time on an average is about 50 minutes.
3.5.1 Physical activity patterns
at each completed age from 10
to 19 years
Among girls, mean sitting time increases and
outdoor sports or exercise time (vigorous activity)
decreases consistently with age. There are no
distinct peaks for these two activities, with girls
spending most time in vigorous activity at the age
of 10 years and most time sitting at the age of 19
years. Based on mean time, at no age, girls meet
the 60 minutes recommended vigorous activity
time. Screen time too increases along with sitting
time, with a steep increase from ages 16 to 19
years. Leisure time peaks at 15 years.
Among boys, mean sitting time increases from 10
to 17 years but dives steeply to reach lowest mean
time spent sitting at 19 years. Based on mean
time, boys meet the recommended 60 minutes
vigorous activity at 17 years and almost maintain
that level the following year.
Girls Boys
Figure 54: Average time (in hours) spent per day in specifi c domains of physical activity by
Adolescents aged 15-19 years (%)
0
2
2
1
1
3
1
1
2
3
Outdoor sports/exercise/physical
activity at school
Screen time
Leisure time physical activity
Travel to school
Sitting time
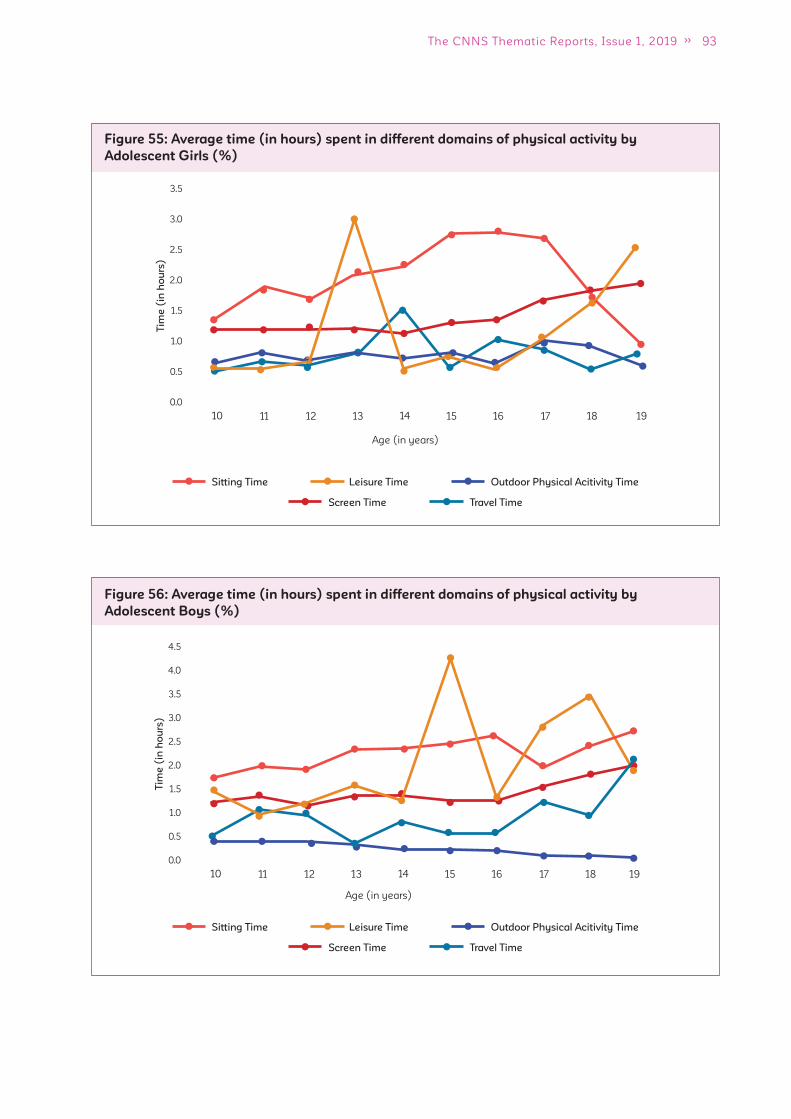
93The CNNS Thematic Reports, Issue 1, 2019
Figure 55: Average time (in hours) spent in different domains of physical activity by
Adolescent Girls (%)
Travel TimeScreen Time
Sitting Time Leisure Time Outdoor Physical Acitivity Time
Figure 56: Average time (in hours) spent in different domains of physical activity by
Adolescent Boys (%)
Travel TimeScreen Time
Sitting Time Leisure Time Outdoor Physical Acitivity Time
3.5
3.0
2.5
2.0
1.5
1.0
0.5
0.0
10 11 12 13 14 15 16 17 18 19
Tim
e (
in h
ou
rs)
4.5
4.0
3.5
3.0
2.5
2.0
1.5
1.0
0.5
0.0
10 11 12 13 14 15 16 17 18 19
Tim
e (
in h
ou
rs)
Age (in years)
Age (in years)
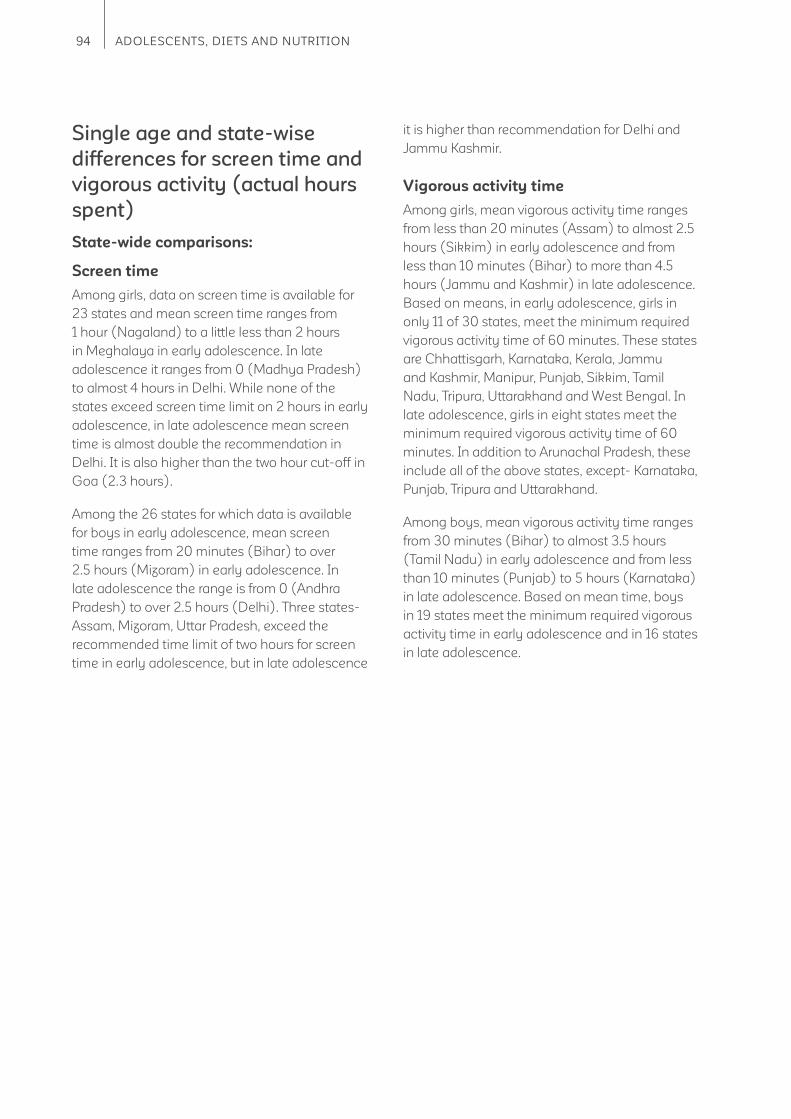
94 ADOLESCENTS, DIETS AND NUTRITION
Single age and state-wise
differences for screen time and
vigorous activity (actual hours
spent)
State-wide comparisons:
Screen time
Among girls, data on screen time is available for
23 states and mean screen time ranges from
1 hour (Nagaland) to a little less than 2 hours
in Meghalaya in early adolescence. In late
adolescence it ranges from 0 (Madhya Pradesh)
to almost 4 hours in Delhi. While none of the
states exceed screen time limit on 2 hours in early
adolescence, in late adolescence mean screen
time is almost double the recommendation in
Delhi. It is also higher than the two hour cut-off in
Goa (2.3 hours).
Among the 26 states for which data is available
for boys in early adolescence, mean screen
time ranges from 20 minutes (Bihar) to over
2.5 hours (Mizoram) in early adolescence. In
late adolescence the range is from 0 (Andhra
Pradesh) to over 2.5 hours (Delhi). Three states-
Assam, Mizoram, Uttar Pradesh, exceed the
recommended time limit of two hours for screen
time in early adolescence, but in late adolescence
it is higher than recommendation for Delhi and
Jammu Kashmir.
Vigorous activity time
Among girls, mean vigorous activity time ranges
from less than 20 minutes (Assam) to almost 2.5
hours (Sikkim) in early adolescence and from
less than 10 minutes (Bihar) to more than 4.5
hours (Jammu and Kashmir) in late adolescence.
Based on means, in early adolescence, girls in
only 11 of 30 states, meet the minimum required
vigorous activity time of 60 minutes. These states
are Chhattisgarh, Karnataka, Kerala, Jammu
and Kashmir, Manipur, Punjab, Sikkim, Tamil
Nadu, Tripura, Uttarakhand and West Bengal. In
late adolescence, girls in eight states meet the
minimum required vigorous activity time of 60
minutes. In addition to Arunachal Pradesh, these
include all of the above states, except- Karnataka,
Punjab, Tripura and Uttarakhand.
Among boys, mean vigorous activity time ranges
from 30 minutes (Bihar) to almost 3.5 hours
(Tamil Nadu) in early adolescence and from less
than 10 minutes (Punjab) to 5 hours (Karnataka)
in late adolescence. Based on mean time, boys
in 19 states meet the minimum required vigorous
activity time in early adolescence and in 16 states
in late adolescence.
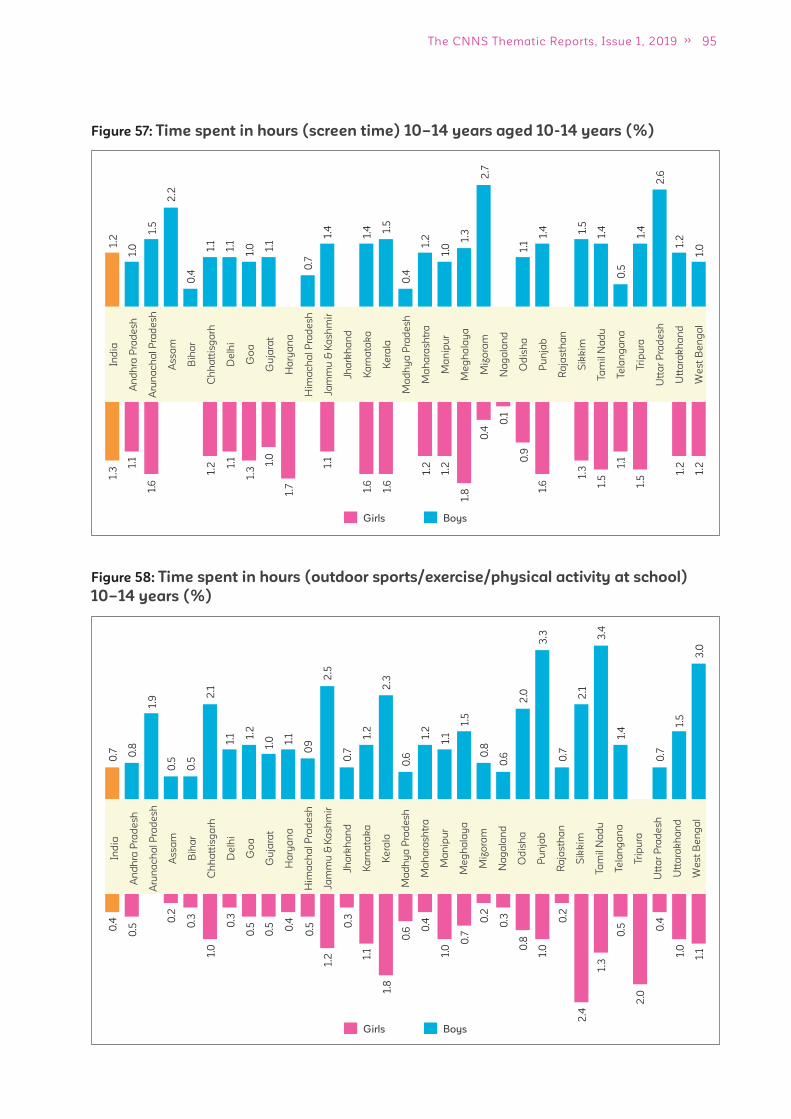
95The CNNS Thematic Reports, Issue 1, 2019
Figure 57: Time spent in hours (screen time) 10–14 years aged 10-14 years (%)
Ind
ia
An
dh
ra P
rad
esh
Aru
na
ch
al
Pra
de
sh
Ass
am
Bih
ar
Ch
ha
ttis
ga
rh
De
lhi
Go
a
Gu
jara
t
Ha
rya
na
Him
ac
ha
l P
rad
esh
Jam
mu
& K
ash
mir
Jha
rkh
an
d
Ka
rna
tak
a
Ke
rala
Ma
dh
ya
Pra
de
sh
Ma
ha
rash
tra
Ma
nip
ur
Me
gh
ala
ya
Miz
ora
m
Na
ga
lan
d
Od
ish
a
Pu
nja
b
Ra
jas
tha
n
Sik
kim
Ta
mil
Na
du
Te
lan
ga
na
Tri
pu
ra
Utt
ar
Pra
de
sh
Utt
ara
kh
an
d
We
st
Be
ng
al
1.2
1.3 1.
1
1.6
1.2 1.
1
1.3
1.0
1.7
1.1
1.6
1.6
1.2
1.2
1.8
0.4
0.1
0.9
1.6
1.3
1.5
1.1
1.5
1.2
1.2
1.0
1.5
2.2
0.4
1.1
1.1
1.0 1.
1
0.7
1.4
1.4 1.
5
0.4
1.2
1.0
1.3
2.7
1.1
1.4 1.5
1.4
0.5
1.4
2.6
1.2
1.0
BoysGirls
0.7
0.4
0.5
0.2
0.3
1.0
0.3
0.5
0.5 0.4
0.5
1.2
0.3
1.1
1.8
0.6 0
.4
1.0
0.7
0.2
0.3
0.8
1.0
0.2
2.4
1.3
0.5
2.0
0.4
1.0
1.1
0.8
1.9
0.5
0.5
2.1
1.1 1.
2
1.0 1.
1
09
2.5
0.7
1.2
2.3
0.6
1.2
1.1
1.5
0.8
0.6
2.0
3.3
0.7
2.1
3.4
1.4
0.7
1.5
3.0
Figure 58: Time spent in hours (outdoor sports/exercise/physical activity at school)
10–14 years (%)
Ind
ia
An
dh
ra P
rad
esh
Aru
na
ch
al
Pra
de
sh
Ass
am
Bih
ar
Ch
ha
ttis
ga
rh
De
lhi
Go
a
Gu
jara
t
Ha
rya
na
Him
ac
ha
l P
rad
esh
Jam
mu
& K
ash
mir
Jha
rkh
an
d
Ka
rna
tak
a
Ke
rala
Ma
dh
ya
Pra
de
sh
Ma
ha
rash
tra
Ma
nip
ur
Me
gh
ala
ya
Miz
ora
m
Na
ga
lan
d
Od
ish
a
Pu
nja
b
Ra
jasth
an
Sik
kim
Ta
mil
Na
du
Te
lan
ga
na
Tri
pu
ra
Utt
ar
Pra
de
sh
Utt
ara
kh
an
d
We
st
Be
ng
al
BoysGirls
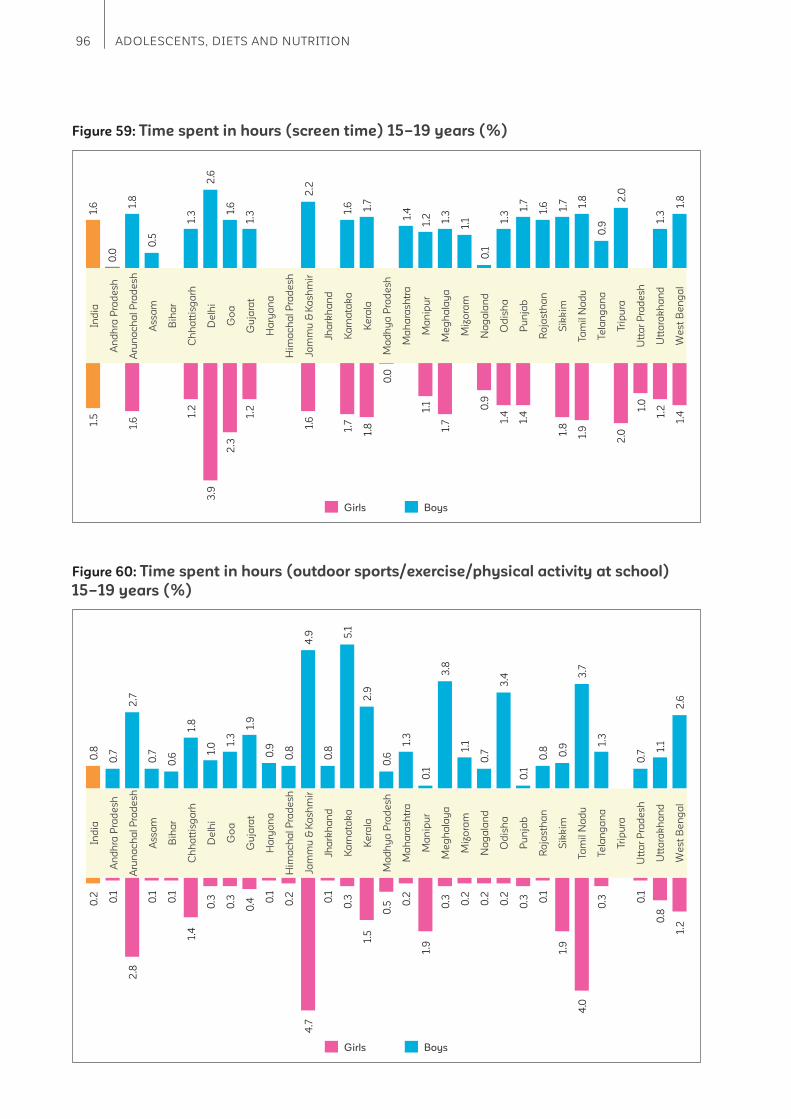
96 ADOLESCENTS, DIETS AND NUTRITION
Figure 59: Time spent in hours (screen time) 15–19 years (%)
Ind
ia
An
dh
ra P
rad
esh
Aru
na
ch
al
Pra
de
sh
Ass
am
Bih
ar
Ch
ha
ttis
ga
rh
De
lhi
Go
a
Gu
jara
t
Ha
rya
na
Him
ac
ha
l P
rad
esh
Jam
mu
& K
ash
mir
Jha
rkh
an
d
Ka
rna
tak
a
Ke
rala
Ma
dh
ya
Pra
de
sh
Ma
ha
rash
tra
Ma
nip
ur
Me
gh
ala
ya
Miz
ora
m
Na
ga
lan
d
Od
ish
a
Pu
nja
b
Ra
jas
tha
n
Sik
kim
Ta
mil
Na
du
Te
lan
ga
na
Tri
pu
ra
Utt
ar
Pra
de
sh
Utt
ara
kh
an
d
We
st
Be
ng
al
1.6
0.0
1.8
0.5
1.3
2.6
1.6
1.3
2.2
1.6 1.7
1.4
1.2 1.3
1.1
0.1
1.3
1.7
1.6 1.7 1.8
0.9
2.0
1.3
1.8
1.5
1.6
1.2
3.9
2.3
1.2
1.6
1.7
1.8
0.0
1.1
1.7
0.9
1.4
1.4
1.8
1.9
2.0
1.0
1.2
1.4
Ind
ia
An
dh
ra P
rad
esh
Aru
na
ch
al
Pra
de
sh
Ass
am
Bih
ar
Ch
ha
ttis
ga
rh
De
lhi
Go
a
Gu
jara
t
Ha
rya
na
Him
ac
ha
l P
rad
esh
Jam
mu
& K
ash
mir
Jha
rkh
an
d
Ka
rna
tak
a
Ke
rala
Ma
dh
ya
Pra
de
sh
Ma
ha
rash
tra
Ma
nip
ur
Me
gh
ala
ya
Miz
ora
m
Na
ga
lan
d
Od
ish
a
Pu
nja
b
Ra
jas
tha
n
Sik
kim
Ta
mil
Na
du
Te
lan
ga
na
Tri
pu
ra
Utt
ar
Pra
de
sh
Utt
ara
kh
an
d
We
st
Be
ng
al
Figure 60: Time spent in hours (outdoor sports/exercise/physical activity at school)
15–19 years (%)
0.8
0.7
2.7
0.7
0.6
1.8
1.0 1.
3
1.9
0.9
0.8
4.9
0.8
5.1
2.9
0.6
1.3
0.1
3.8
1.1
0.7
3.4
0.1
0.8 0.9
3.7
1.3
0.7
1.1
2.6
0.2 0.1
2.8
0.1
0.1
1.4
0.3
0.3
0.4 0
.1
0.2
4.7
0.1
0.3
1.5
0.5 0
.2
1.9
0.3 0.2
0.2
0.2
0.3 0
.1
1.9
4.0
0.3 0
.1
0.8
1.2
Ind
ia
An
dh
ra P
rad
esh
Aru
na
ch
al
Pra
de
sh
Ass
am
Bih
ar
Ch
ha
ttis
ga
rh
De
lhi
Go
a
Gu
jara
t
Ha
rya
na
Him
ac
ha
l P
rad
esh
Jam
mu
& K
ash
mir
Jha
rkh
an
d
Ka
rna
tak
a
Ke
rala
Ma
dh
ya
Pra
de
sh
Ma
ha
rash
tra
Ma
nip
ur
Me
gh
ala
ya
Miz
ora
m
Na
ga
lan
d
Od
ish
a
Pu
nja
b
Ra
jasth
an
Sik
kim
Ta
mil
Na
du
Te
lan
ga
na
Tri
pu
ra
Utt
ar
Pra
de
sh
Utt
ara
kh
an
d
We
st
Be
ng
al
BoysGirls
BoysGirls
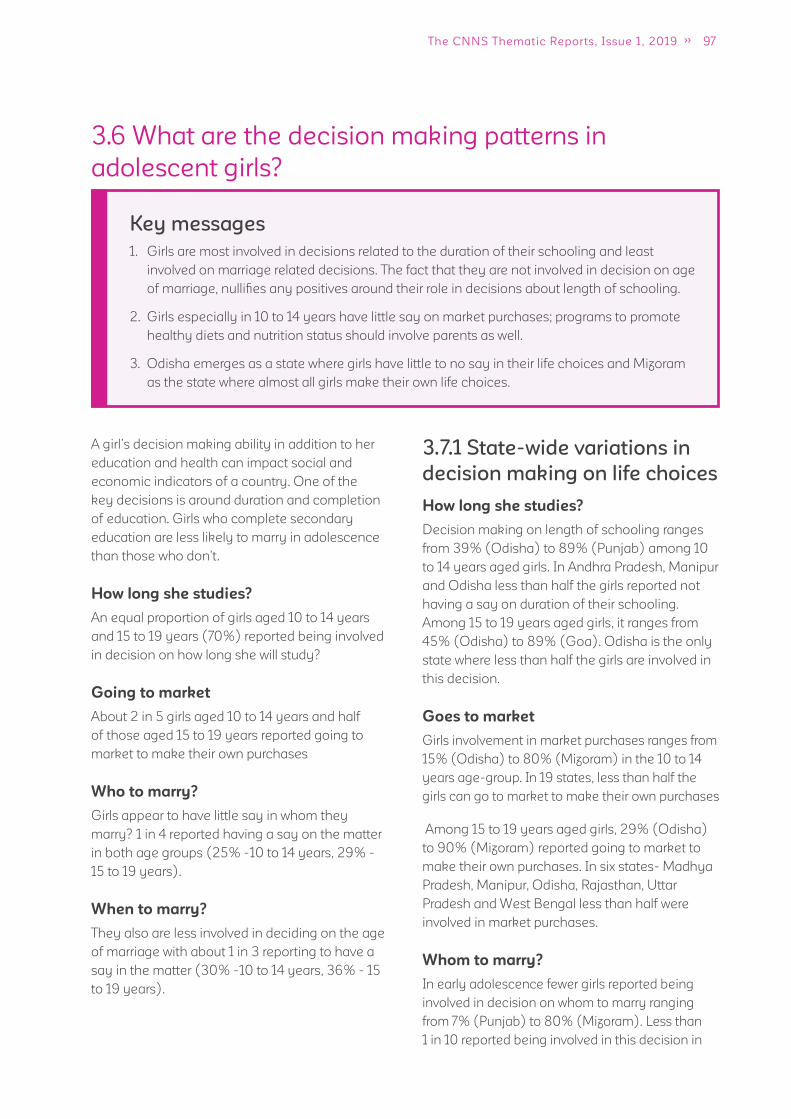
97The CNNS Thematic Reports, Issue 1, 2019
3.6 What are the decision making patterns in
adolescent girls?
3.7.1 State-wide variations in
decision making on life choices
How long she studies?
Decision making on length of schooling ranges
from 39% (Odisha) to 89% (Punjab) among 10
to 14 years aged girls. In Andhra Pradesh, Manipur
and Odisha less than half the girls reported not
having a say on duration of their schooling.
Among 15 to 19 years aged girls, it ranges from
45% (Odisha) to 89% (Goa). Odisha is the only
state where less than half the girls are involved in
this decision.
Goes to market
Girls involvement in market purchases ranges from
15% (Odisha) to 80% (Mizoram) in the 10 to 14
years age-group. In 19 states, less than half the
girls can go to market to make their own purchases
Among 15 to 19 years aged girls, 29% (Odisha)
to 90% (Mizoram) reported going to market to
make their own purchases. In six states- Madhya
Pradesh, Manipur, Odisha, Rajasthan, Uttar
Pradesh and West Bengal less than half were
involved in market purchases.
Whom to marry?
In early adolescence fewer girls reported being
involved in decision on whom to marry ranging
from 7% (Punjab) to 80% (Mizoram). Less than
1 in 10 reported being involved in this decision in
Key messages
1. Girls are most involved in decisions related to the duration of their schooling and least
involved on marriage related decisions. The fact that they are not involved in decision on age
of marriage, nullifi es any positives around their role in decisions about length of schooling.
2. Girls especially in 10 to 14 years have little say on market purchases; programs to promote
healthy diets and nutrition status should involve parents as well.
3. Odisha emerges as a state where girls have little to no say in their life choices and Mizoram
as the state where almost all girls make their own life choices.
A girl’s decision making ability in addition to her
education and health can impact social and
economic indicators of a country. One of the
key decisions is around duration and completion
of education. Girls who complete secondary
education are less likely to marry in adolescence
than those who don’t.
How long she studies?
An equal proportion of girls aged 10 to 14 years
and 15 to 19 years (70%) reported being involved
in decision on how long she will study?
Going to market
About 2 in 5 girls aged 10 to 14 years and half
of those aged 15 to 19 years reported going to
market to make their own purchases
Who to marry?
Girls appear to have little say in whom they
marry? 1 in 4 reported having a say on the matter
in both age groups (25% -10 to 14 years, 29% -
15 to 19 years).
When to marry?
They also are less involved in deciding on the age
of marriage with about 1 in 3 reporting to have a
say in the matter (30% -10 to 14 years, 36% - 15
to 19 years).
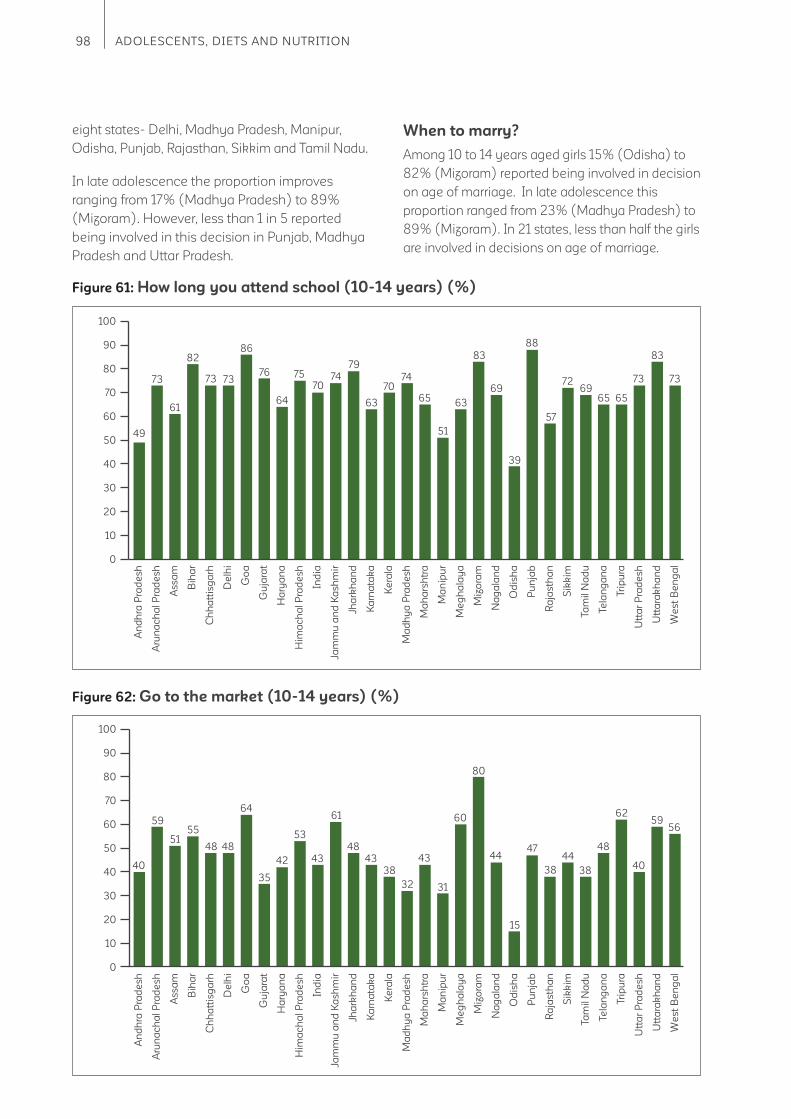
98 ADOLESCENTS, DIETS AND NUTRITION
eight states- Delhi, Madhya Pradesh, Manipur,
Odisha, Punjab, Rajasthan, Sikkim and Tamil Nadu.
In late adolescence the proportion improves
ranging from 17% (Madhya Pradesh) to 89%
(Mizoram). However, less than 1 in 5 reported
being involved in this decision in Punjab, Madhya
Pradesh and Uttar Pradesh.
When to marry?
Among 10 to 14 years aged girls 15% (Odisha) to
82% (Mizoram) reported being involved in decision
on age of marriage. In late adolescence this
proportion ranged from 23% (Madhya Pradesh) to
89% (Mizoram). In 21 states, less than half the girls
are involved in decisions on age of marriage.
An
dh
ra P
rad
esh
Aru
na
ch
al
Pra
de
sh
Ass
am
Bih
ar
Ch
ha
ttis
ga
rh
De
lhi
Go
a
Gu
jara
t
Ha
rya
na
Him
ac
ha
l P
rad
esh
Ind
ia
Jam
mu
an
d K
ash
mir
Jha
rkh
an
d
Ka
rna
tak
a
Ke
rala
Ma
dh
ya
Pra
de
sh
Ma
ha
rsh
tra
Ma
nip
ur
Me
gh
ala
ya
Miz
ora
m
Na
ga
lan
d
Od
ish
a
Pu
nja
b
Ra
jasth
an
Sik
kim
Ta
mil
Na
du
Te
lan
ga
na
Tri
pu
ra
Utt
ar
Pra
de
sh
Utt
ara
kh
an
d
We
st
Be
ng
al
100
90
80
70
60
50
40
30
20
10
0
49
73
61
82
73 73
86
76
64
75
7074
79
63
7074
65
51
63
83
69
39
57
88
7269
65 65
73
83
73
Figure 61: How long you attend school (10-14 years) (%)
Figure 62: Go to the market (10-14 years) (%)
An
dh
ra P
rad
esh
Aru
na
ch
al
Pra
de
sh
Ass
am
Bih
ar
Ch
ha
ttis
ga
rh
De
lhi
Go
a
Gu
jara
t
Ha
rya
na
Him
ac
ha
l P
rad
esh
Ind
ia
Jam
mu
an
d K
ash
mir
Jha
rkh
an
d
Ka
rna
tak
a
Ke
rala
Ma
dh
ya
Pra
de
sh
Ma
ha
rsh
tra
Ma
nip
ur
Me
gh
ala
ya
Miz
ora
m
Na
ga
lan
d
Od
ish
a
Pu
nja
b
Ra
jasth
an
Sik
kim
Ta
mil
Na
du
Te
lan
ga
na
Tri
pu
ra
Utt
ar
Pra
de
sh
Utt
ara
kh
an
d
We
st
Be
ng
al
100
90
80
70
60
50
40
30
20
10
0
40
59
5155
48 48
64
42
35
53
43
61
48
43
38
32
43
31
60
80
44
15
38
4744
38
48
62
40
5956
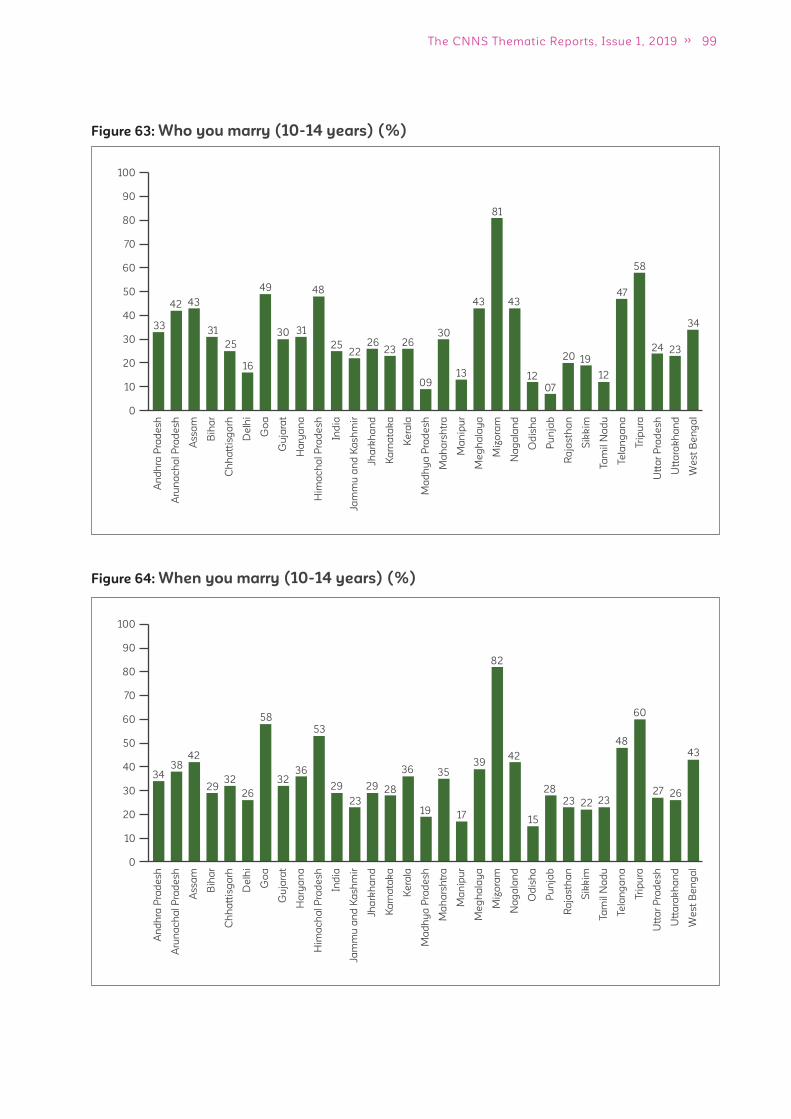
99The CNNS Thematic Reports, Issue 1, 2019
Figure 63: Who you marry (10-14 years) (%)
An
dh
ra P
rad
esh
Aru
na
ch
al
Pra
de
sh
Ass
am
Bih
ar
Ch
ha
ttis
ga
rh
De
lhi
Go
a
Gu
jara
t
Ha
rya
na
Him
ac
ha
l P
rad
esh
Ind
ia
Jam
mu
an
d K
ash
mir
Jha
rkh
an
d
Ka
rna
tak
a
Ke
rala
Ma
dh
ya
Pra
de
sh
Ma
ha
rsh
tra
Ma
nip
ur
Me
gh
ala
ya
Miz
ora
m
Na
ga
lan
d
Od
ish
a
Pu
nja
b
Ra
jasth
an
Sik
kim
Ta
mil
Na
du
Te
lan
ga
na
Tri
pu
ra
Utt
ar
Pra
de
sh
Utt
ara
kh
an
d
We
st
Be
ng
al
100
90
80
70
60
50
40
30
20
10
0
33
42 43
31
25
16
49
30 31
48
2522
2623
26
09
30
13
43
81
43
12
07
20 19
12
47
58
24 23
34
Figure 64: When you marry (10-14 years) (%)
An
dh
ra P
rad
esh
Aru
na
ch
al
Pra
de
sh
Ass
am
Bih
ar
Ch
ha
ttis
ga
rh
De
lhi
Go
a
Gu
jara
t
Ha
rya
na
Him
ac
ha
l P
rad
esh
Ind
ia
Jam
mu
an
d K
ash
mir
Jha
rkh
an
d
Ka
rna
tak
a
Ke
rala
Ma
dh
ya
Pra
de
sh
Ma
ha
rsh
tra
Ma
nip
ur
Me
gh
ala
ya
Miz
ora
m
Na
ga
lan
d
Od
ish
a
Pu
nja
b
Ra
jasth
an
Sik
kim
Ta
mil
Na
du
Te
lan
ga
na
Tri
pu
ra
Utt
ar
Pra
de
sh
Utt
ara
kh
an
d
We
st
Be
ng
al
100
90
80
70
60
50
40
30
20
10
0
3438
42
3229
26
58
3236
53
29
23
29 28
36
19
35
17
3942
82
15
28
23 22 23
48
60
27 26
43
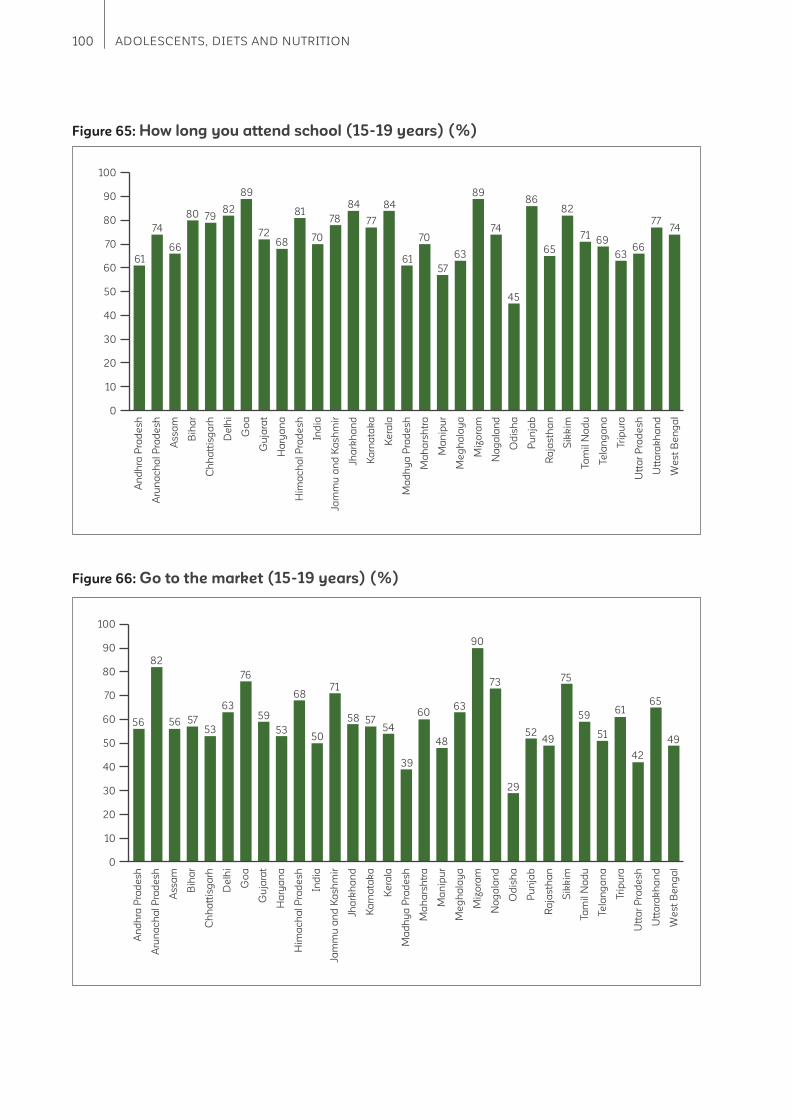
100 ADOLESCENTS, DIETS AND NUTRITION
Figure 65: How long you attend school (15-19 years) (%)
Figure 66: Go to the market (15-19 years) (%)
An
dh
ra P
rad
esh
Aru
na
ch
al
Pra
de
sh
Ass
am
Bih
ar
Ch
ha
ttis
ga
rh
De
lhi
Go
a
Gu
jara
t
Ha
rya
na
Him
ac
ha
l P
rad
esh
Ind
ia
Jam
mu
an
d K
ash
mir
Jha
rkh
an
d
Ka
rna
tak
a
Ke
rala
Ma
dh
ya
Pra
de
sh
Ma
ha
rsh
tra
Ma
nip
ur
Me
gh
ala
ya
Miz
ora
m
Na
ga
lan
d
Od
ish
a
Pu
nja
b
Ra
jasth
an
Sik
kim
Ta
mil
Na
du
Te
lan
ga
na
Tri
pu
ra
Utt
ar
Pra
de
sh
Utt
ara
kh
an
d
We
st
Be
ng
al
100
90
80
70
60
50
40
30
20
10
0
61
74
66
80 7982
89
7268
81
70
78
84
77
84
61
70
57
63
89
74
45
65
8682
7169
6366
7774
An
dh
ra P
rad
esh
Aru
na
ch
al
Pra
de
sh
Ass
am
Bih
ar
Ch
ha
ttis
ga
rh
De
lhi
Go
a
Gu
jara
t
Ha
rya
na
Him
ac
ha
l P
rad
esh
Ind
ia
Jam
mu
an
d K
ash
mir
Jha
rkh
an
d
Ka
rna
tak
a
Ke
rala
Ma
dh
ya
Pra
de
sh
Ma
ha
rsh
tra
Ma
nip
ur
Me
gh
ala
ya
Miz
ora
m
Na
ga
lan
d
Od
ish
a
Pu
nja
b
Ra
jasth
an
Sik
kim
Ta
mil
Na
du
Te
lan
ga
na
Tri
pu
ra
Utt
ar
Pra
de
sh
Utt
ara
kh
an
d
We
st
Be
ng
al
100
90
80
70
60
50
40
30
20
10
0
56
82
56 5753
63
76
53
59
68
50
71
58 5754
39
60
48
63
90
73
29
4952
75
59
51
61
42
65
49
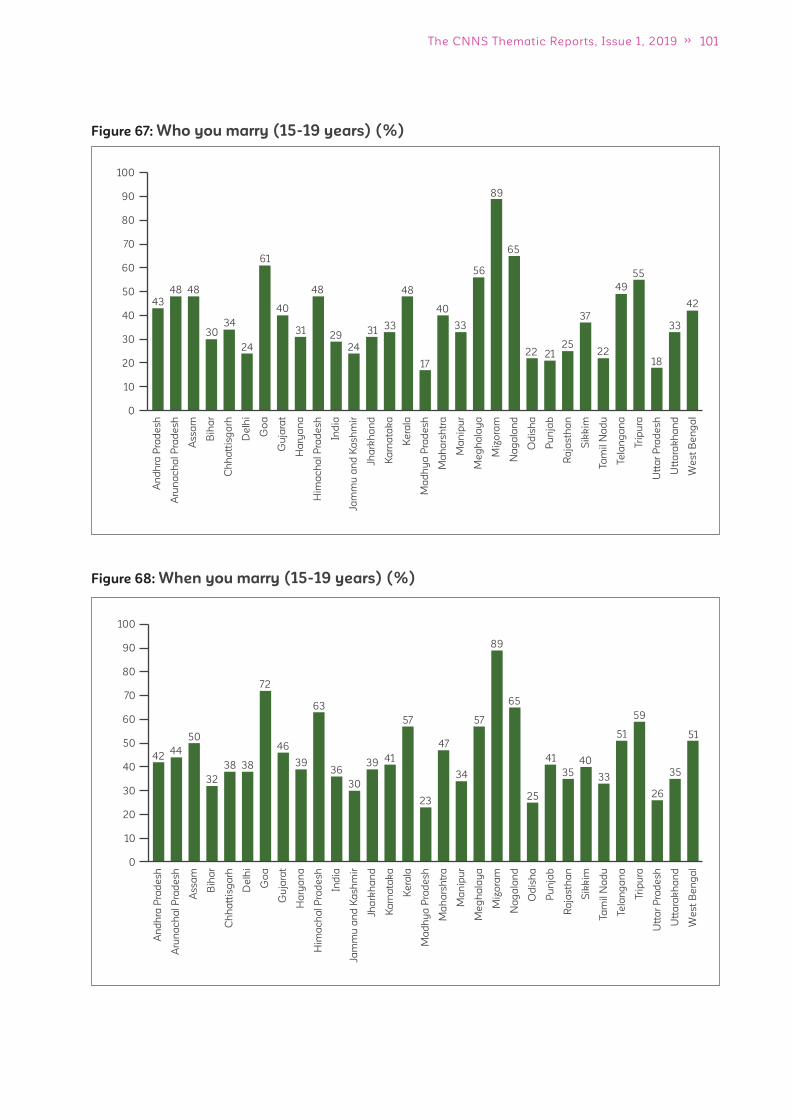
101The CNNS Thematic Reports, Issue 1, 2019
Figure 67: Who you marry (15-19 years) (%)
Figure 68: When you marry (15-19 years) (%)
An
dh
ra P
rad
esh
Aru
na
ch
al
Pra
de
sh
Ass
am
Bih
ar
Ch
ha
ttis
ga
rh
De
lhi
Go
a
Gu
jara
t
Ha
rya
na
Him
ac
ha
l P
rad
esh
Ind
ia
Jam
mu
an
d K
ash
mir
Jha
rkh
an
d
Ka
rna
tak
a
Ke
rala
Ma
dh
ya
Pra
de
sh
Ma
ha
rsh
tra
Ma
nip
ur
Me
gh
ala
ya
Miz
ora
m
Na
ga
lan
d
Od
ish
a
Pu
nja
b
Ra
jasth
an
Sik
kim
Ta
mil
Na
du
Te
lan
ga
na
Tri
pu
ra
Utt
ar
Pra
de
sh
Utt
ara
kh
an
d
We
st
Be
ng
al
100
90
80
70
60
50
40
30
20
10
0
43
48 48
3034
24
61
40
31
48
29
24
3133
48
17
40
33
56
89
65
22 2125
37
22
49
55
18
33
42
An
dh
ra P
rad
esh
Aru
na
ch
al
Pra
de
sh
Ass
am
Bih
ar
Ch
ha
ttis
ga
rh
De
lhi
Go
a
Gu
jara
t
Ha
rya
na
Him
ac
ha
l P
rad
esh
Ind
ia
Jam
mu
an
d K
ash
mir
Jha
rkh
an
d
Ka
rna
tak
a
Ke
rala
Ma
dh
ya
Pra
de
sh
Ma
ha
rsh
tra
Ma
nip
ur
Me
gh
ala
ya
Miz
ora
m
Na
ga
lan
d
Od
ish
a
Pu
nja
b
Ra
jasth
an
Sik
kim
Ta
mil
Na
du
Te
lan
ga
na
Tri
pu
ra
Utt
ar
Pra
de
sh
Utt
ara
kh
an
d
We
st
Be
ng
al
100
90
80
70
60
50
40
30
20
10
0
4244
50
38
32
38
72
46
39
63
36
30
39 41
57
23
47
34
57
65
89
25
41
35
40
33
51
59
26
35
51
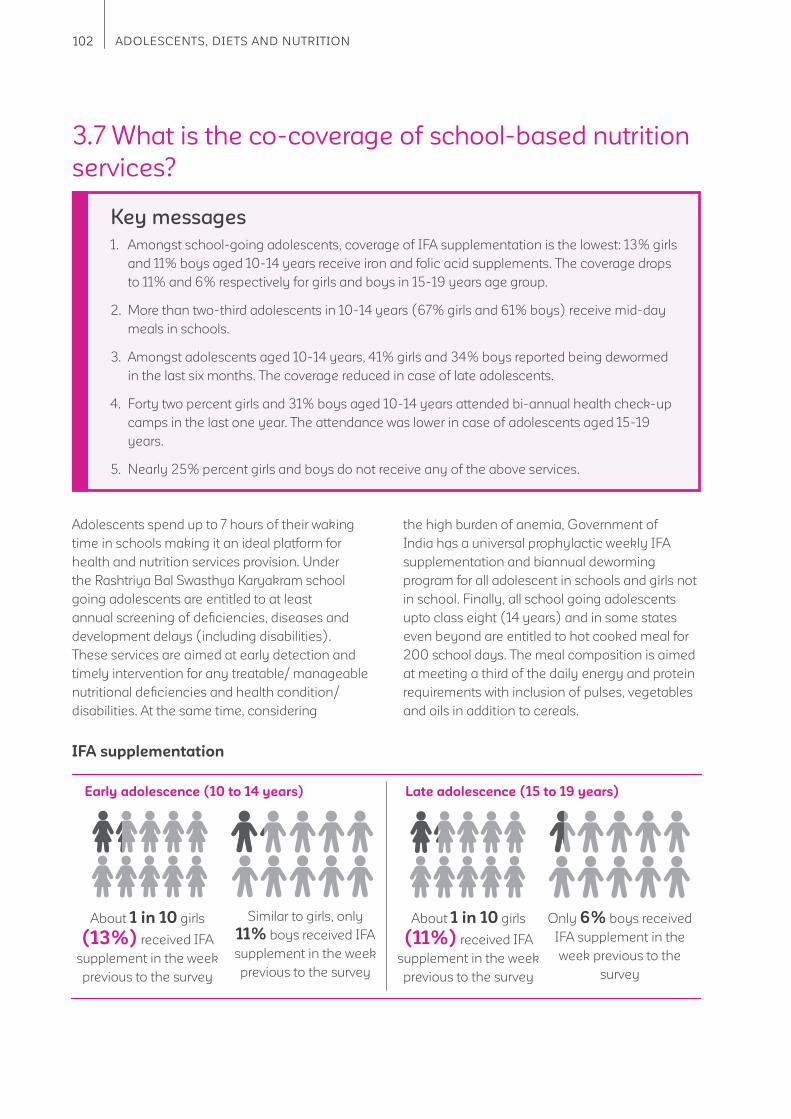
102 ADOLESCENTS, DIETS AND NUTRITION
3.7 What is the co-coverage of school-based nutrition
services?
Adolescents spend up to 7 hours of their waking
time in schools making it an ideal platform for
health and nutrition services provision. Under
the Rashtriya Bal Swasthya Karyakram school
going adolescents are entitled to at least
annual screening of defi ciencies, diseases and
development delays (including disabilities).
These services are aimed at early detection and
timely intervention for any treatable/ manageable
nutritional defi ciencies and health condition/
disabilities. At the same time, considering
Key messages
1. Amongst school-going adolescents, coverage of IFA supplementation is the lowest: 13% girls
and 11% boys aged 10-14 years receive iron and folic acid supplements. The coverage drops
to 11% and 6% respectively for girls and boys in 15-19 years age group.
2. More than two-third adolescents in 10-14 years (67% girls and 61% boys) receive mid-day
meals in schools.
3. Amongst adolescents aged 10-14 years, 41% girls and 34% boys reported being dewormed
in the last six months. The coverage reduced in case of late adolescents.
4. Forty two percent girls and 31% boys aged 10-14 years attended bi-annual health check-up
camps in the last one year. The attendance was lower in case of adolescents aged 15-19
years.
5. Nearly 25% percent girls and boys do not receive any of the above services.
the high burden of anemia, Government of
India has a universal prophylactic weekly IFA
supplementation and biannual deworming
program for all adolescent in schools and girls not
in school. Finally, all school going adolescents
upto class eight (14 years) and in some states
even beyond are entitled to hot cooked meal for
200 school days. The meal composition is aimed
at meeting a third of the daily energy and protein
requirements with inclusion of pulses, vegetables
and oils in addition to cereals.
IFA supplementation
Late adolescence (15 to 19 years)Early adolescence (10 to 14 years)
About 1 in 10 girls
(13%) received IFA
supplement in the week
previous to the survey
About 1 in 10 girls
(11%) received IFA
supplement in the week
previous to the survey
Similar to girls, only
11% boys received IFA
supplement in the week
previous to the survey
Only 6% boys received
IFA supplement in the
week previous to the
survey
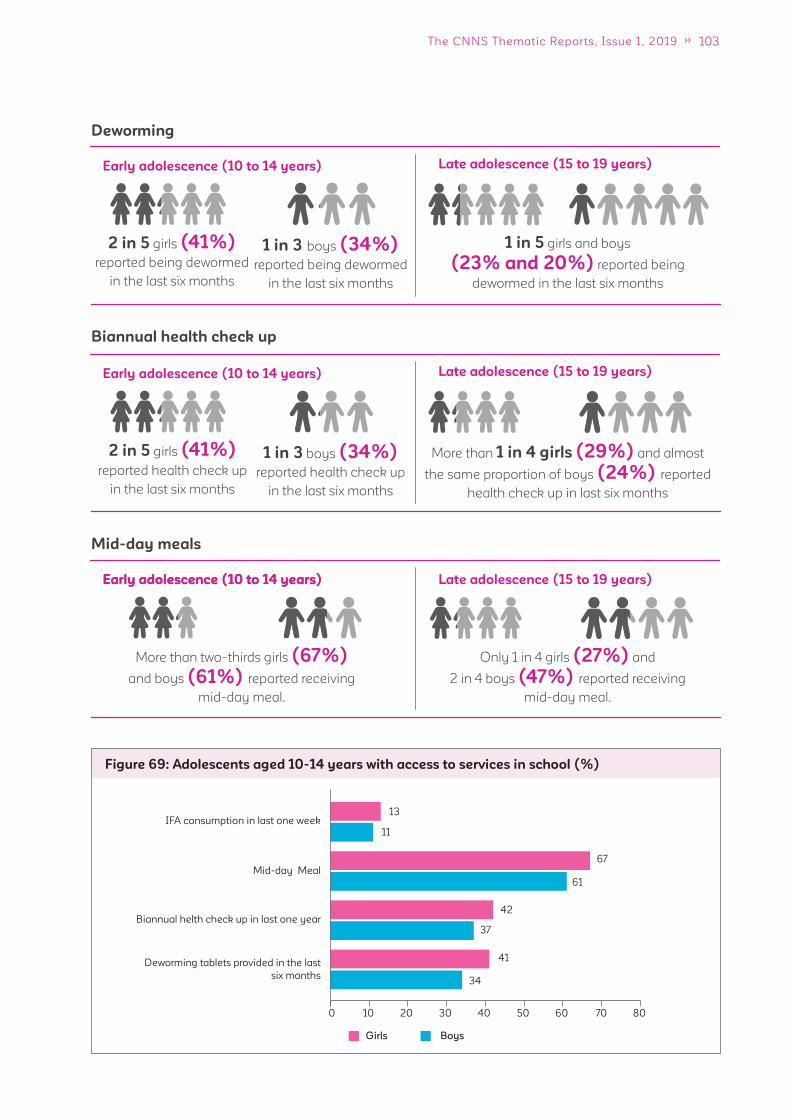
103The CNNS Thematic Reports, Issue 1, 2019
Girls Boys
Figure 69: Adolescents aged 10-14 years with access to services in school (%)
0 10 20 30 40 50 60 70 80
42
37
41
34
67
61
Mid-day Meal
13
11
IFA consumption in last one week
Biannual helth check up in last one year
Deworming tablets provided in the last
six months
Deworming
Biannual health check up
Mid-day meals
Late adolescence (15 to 19 years)Early adolescence (10 to 14 years)
2 in 5 girls (41%) reported being dewormed
in the last six months
1 in 5 girls and boys
(23% and 20%) reported being
dewormed in the last six months
1 in 3 boys (34%) reported being dewormed
in the last six months
Late adolescence (15 to 19 years)Early adolescence (10 to 14 years)
2 in 5 girls (41%)
reported health check up
in the last six months
More than 1 in 4 girls (29%) and almost
the same proportion of boys (24%) reported
health check up in last six months
1 in 3 boys (34%)
reported health check up
in the last six months
Early adolescence (10 to 14 years)Early adolescence (10 to 14 years) Late adolescence (15 to 19 years)
More than two-thirds girls (67%)
and boys (61%) reported receiving
mid-day meal.
Only 1 in 4 girls (27%) and
2 in 4 boys (47%) reported receiving
mid-day meal.

104 ADOLESCENTS, DIETS AND NUTRITION
Girls Boys
Figure 70: Adolescents aged 15-19 years with access to services in school (%)
0 10 20 30 40 50
11
6IFA consumption in last one week
29
24Biannual helth check up in last one year
23
20
Deworming tablets provided in the last
six months
3.7.1 School going students
receiving none, 1, 2, or 3
services
Early adolescence (10 to 14 years)
1 in 5 girls and 1 in 4 boys receive none of the four
services
Among girls, 25% received one service, 27% two
services and 22% three services
Among boys a higher proportion than girls
receive one service (30%), but lower proportion
receive two and three services (24% and 17%,
respectively)
Late adolescence (15 to 19 years)
1 in 4 girls received no service; almost half the
boys (45%) received no service
Among girls, 22% received one service, 36% two
services and 13% three services
Among boys an equal proportion to girls receive
one service (22%), but lower proportion receive
two and three services (26% and 5%, respectively)
Girls Boys
Figure 71: Adolescents aged 10-14 years with access to services in school (%)
0 5
22
17
27
24
25
30
21
25
10 15 20 25 30
Any 3 Services
Any 2 Services
Any 1 Services
No Services
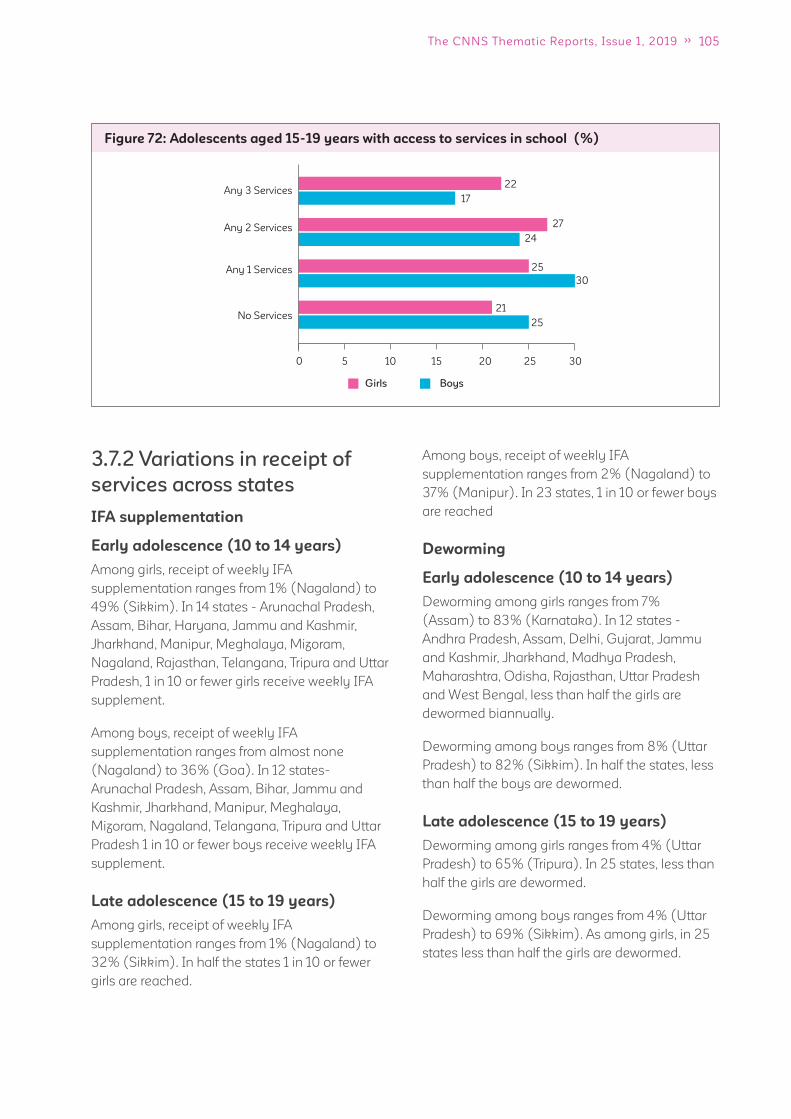
105The CNNS Thematic Reports, Issue 1, 2019
Girls Boys
Figure 72: Adolescents aged 15-19 years with access to services in school (%)
0 5 10 15 20 25 30
22
17Any 3 Services
27
24Any 2 Services
25
30Any 1 Services
21
25No Services
3.7.2 Variations in receipt of
services across states
IFA supplementation
Early adolescence (10 to 14 years)
Among girls, receipt of weekly IFA
supplementation ranges from 1% (Nagaland) to
49% (Sikkim). In 14 states - Arunachal Pradesh,
Assam, Bihar, Haryana, Jammu and Kashmir,
Jharkhand, Manipur, Meghalaya, Mizoram,
Nagaland, Rajasthan, Telangana, Tripura and Uttar
Pradesh, 1 in 10 or fewer girls receive weekly IFA
supplement.
Among boys, receipt of weekly IFA
supplementation ranges from almost none
(Nagaland) to 36% (Goa). In 12 states-
Arunachal Pradesh, Assam, Bihar, Jammu and
Kashmir, Jharkhand, Manipur, Meghalaya,
Mizoram, Nagaland, Telangana, Tripura and Uttar
Pradesh 1 in 10 or fewer boys receive weekly IFA
supplement.
Late adolescence (15 to 19 years)
Among girls, receipt of weekly IFA
supplementation ranges from 1% (Nagaland) to
32% (Sikkim). In half the states 1 in 10 or fewer
girls are reached.
Among boys, receipt of weekly IFA
supplementation ranges from 2% (Nagaland) to
37% (Manipur). In 23 states, 1 in 10 or fewer boys
are reached
Deworming
Early adolescence (10 to 14 years)
Deworming among girls ranges from 7%
(Assam) to 83% (Karnataka). In 12 states -
Andhra Pradesh, Assam, Delhi, Gujarat, Jammu
and Kashmir, Jharkhand, Madhya Pradesh,
Maharashtra, Odisha, Rajasthan, Uttar Pradesh
and West Bengal, less than half the girls are
dewormed biannually.
Deworming among boys ranges from 8% (Uttar
Pradesh) to 82% (Sikkim). In half the states, less
than half the boys are dewormed.
Late adolescence (15 to 19 years)
Deworming among girls ranges from 4% (Uttar
Pradesh) to 65% (Tripura). In 25 states, less than
half the girls are dewormed.
Deworming among boys ranges from 4% (Uttar
Pradesh) to 69% (Sikkim). As among girls, in 25
states less than half the girls are dewormed.
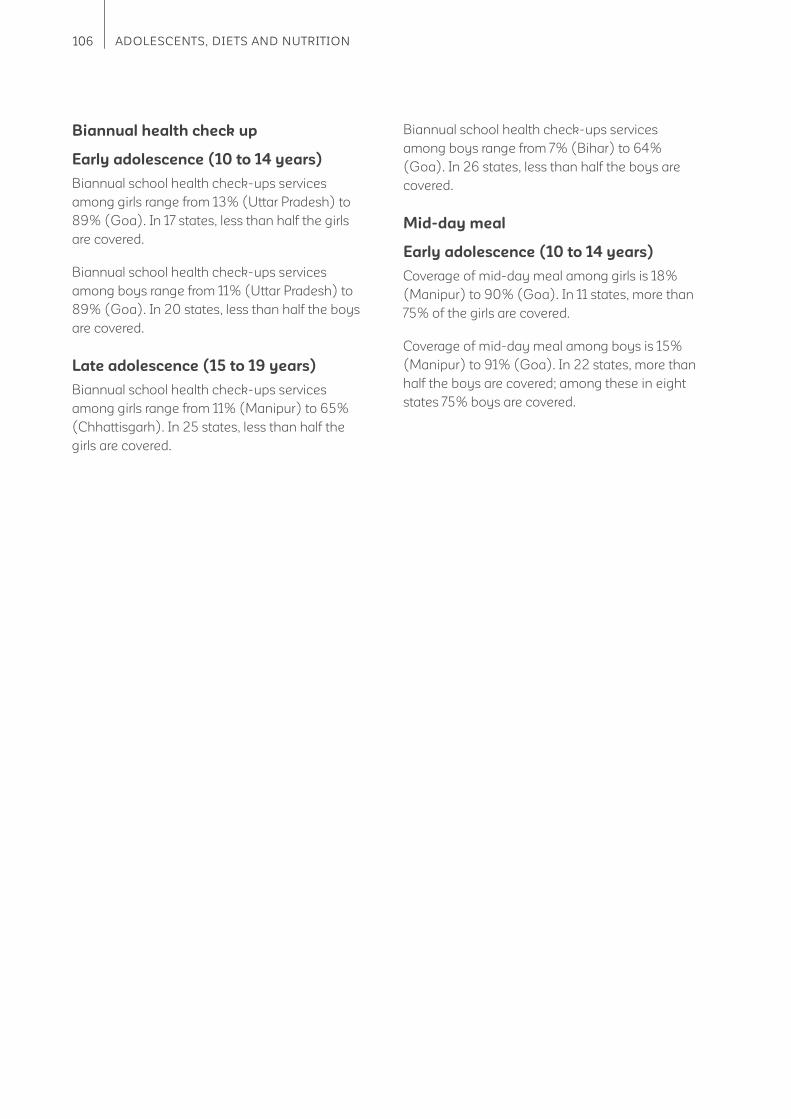
106 ADOLESCENTS, DIETS AND NUTRITION
Biannual health check up
Early adolescence (10 to 14 years)
Biannual school health check-ups services
among girls range from 13% (Uttar Pradesh) to
89% (Goa). In 17 states, less than half the girls
are covered.
Biannual school health check-ups services
among boys range from 11% (Uttar Pradesh) to
89% (Goa). In 20 states, less than half the boys
are covered.
Late adolescence (15 to 19 years)
Biannual school health check-ups services
among girls range from 11% (Manipur) to 65%
(Chhattisgarh). In 25 states, less than half the
girls are covered.
Biannual school health check-ups services
among boys range from 7% (Bihar) to 64%
(Goa). In 26 states, less than half the boys are
covered.
Mid-day meal
Early adolescence (10 to 14 years)
Coverage of mid-day meal among girls is 18%
(Manipur) to 90% (Goa). In 11 states, more than
75% of the girls are covered.
Coverage of mid-day meal among boys is 15%
(Manipur) to 91% (Goa). In 22 states, more than
half the boys are covered; among these in eight
states 75% boys are covered.
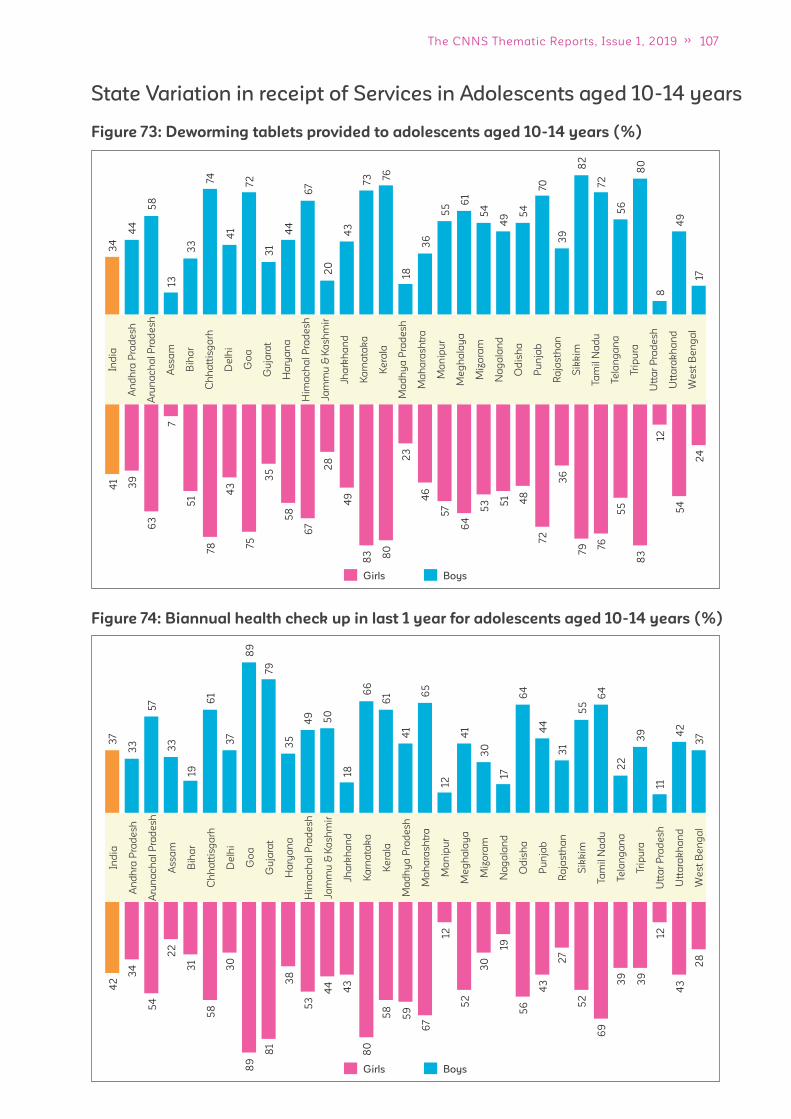
107The CNNS Thematic Reports, Issue 1, 2019
Figure 73: Deworming tablets provided to adolescents aged 10-14 years (%)
State Variation in receipt of Services in Adolescents aged 10-14 years
Figure 74: Biannual health check up in last 1 year for adolescents aged 10-14 years (%)
Ind
ia
An
dh
ra P
rad
esh
Aru
na
ch
al
Pra
de
sh
Ass
am
Bih
ar
Ch
ha
ttis
ga
rh
De
lhi
Go
a
Gu
jara
t
Ha
rya
na
Him
ac
ha
l P
rad
esh
Jam
mu
& K
ash
mir
Jha
rkh
an
d
Ka
rna
tak
a
Ke
rala
Ma
dh
ya
Pra
de
sh
Ma
ha
rash
tra
Ma
nip
ur
Me
gh
ala
ya
Miz
ora
m
Na
ga
lan
d
Od
ish
a
Pu
nja
b
Ra
jas
tha
n
Sik
kim
Ta
mil
Na
du
Te
lan
ga
na
Tri
pu
ra
Utt
ar
Pra
de
sh
Utt
ara
kh
an
d
We
st
Be
ng
al
34
44
58
33
13
74
41
72
44
31
67
20
43
73 76
36
18
55 6
1
54
49 5
4
70
39
82
72
56
80
49
17
8
41
39
63
7
51
43
78
75
35
58
67
49
28
83 80
23
46
57
64
53 5
1 48
72
36
79 76
55
83
54
24
12
BoysGirls
Ind
ia
An
dh
ra P
rad
esh
Aru
na
ch
al
Pra
de
sh
Ass
am
Bih
ar
Ch
ha
ttis
ga
rh
De
lhi
Go
a
Gu
jara
t
Ha
rya
na
Him
ac
ha
l P
rad
esh
Jam
mu
& K
ash
mir
Jha
rkh
an
d
Ka
rna
tak
a
Ke
rala
Ma
dh
ya
Pra
de
sh
Ma
ha
rash
tra
Ma
nip
ur
Me
gh
ala
ya
Miz
ora
m
Na
ga
lan
d
Od
ish
a
Pu
nja
b
Ra
jasth
an
Sik
kim
Ta
mil
Na
du
Te
lan
ga
na
Tri
pu
ra
Utt
ar
Pra
de
sh
Utt
ara
kh
an
d
We
st
Be
ng
al
37
33
57
33
19
61
37
89
79
35
49
50
18
12
66
61 6
5
17
31
64
55
30
22
64
39 4
2
37
11
44
41
41
42
34
54
22
31
58
30
89
81
38
53
44
43
80
58
67
12
52
30
19
56
43
27
52
69
39
39
12
43
28
59
BoysGirls
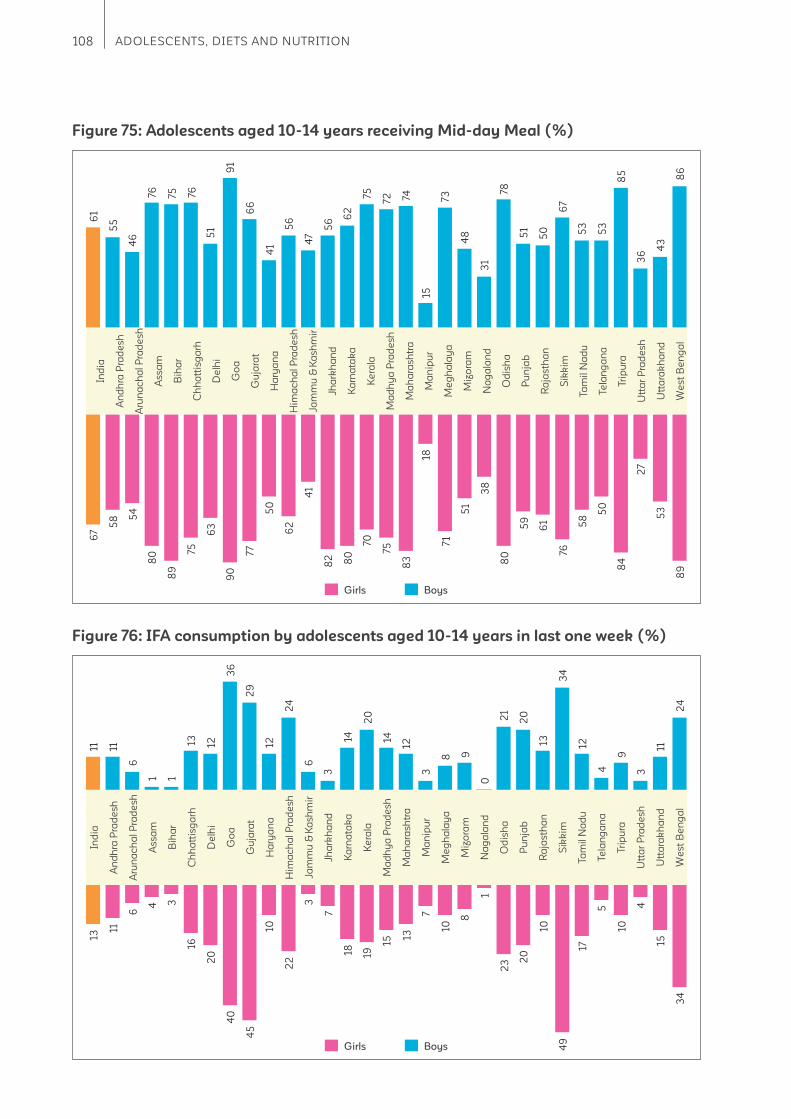
108 ADOLESCENTS, DIETS AND NUTRITION
Figure 75: Adolescents aged 10-14 years receiving Mid-day Meal (%)
Figure 76: IFA consumption by adolescents aged 10-14 years in last one week (%)
Ind
ia
An
dh
ra P
rad
esh
Aru
na
ch
al P
rad
esh
Ass
am
Bih
ar
Ch
ha
ttis
ga
rh
De
lhi
Go
a
Gu
jara
t
Ha
rya
na
Him
ac
ha
l P
rad
esh
Jam
mu
& K
ash
mir
Jha
rkh
an
d
Ka
rna
tak
a
Ke
rala
Ma
dh
ya
Pra
de
sh
Ma
ha
rash
tra
Ma
nip
ur
Me
gh
ala
ya
Miz
ora
m
Na
ga
lan
d
Od
ish
a
Pu
nja
b
Ra
jas
tha
n
Sik
kim
Ta
mil
Na
du
Te
lan
ga
na
Tri
pu
ra
Utt
ar
Pra
de
sh
Utt
ara
kh
an
d
We
st
Be
ng
al
46
61
67
58 5
4
80
89
75
63
90
77
50
62
41
82 80
70
75
83
71
51
38
80
59
61
76
58
50
84
27
53
89
18
55
76 75 76
51
91
66
56
47
56
62
75
72 74
15
31
51
50
67
53
53
85
36
43
86
73
48
78
41
BoysGirls
Ind
ia
An
dh
ra P
rad
esh
Aru
na
ch
al
Pra
de
sh
Ass
am
Bih
ar
Ch
ha
ttis
ga
rh
De
lhi
Go
a
Gu
jara
t
Ha
rya
na
Him
ac
ha
l P
rad
esh
Jam
mu
& K
ash
mir
Jha
rkh
an
d
Ka
rna
tak
a
Ke
rala
Ma
dh
ya
Pra
de
sh
Ma
ha
rash
tra
Ma
nip
ur
Me
gh
ala
ya
Miz
ora
m
Na
ga
lan
d
Od
ish
a
Pu
nja
b
Ra
jasth
an
Sik
kim
Ta
mil
Na
du
Te
lan
ga
na
Tri
pu
ra
Utt
ar
Pra
de
sh
Utt
ara
kh
an
d
We
st
Be
ng
al
11 11
6
1 1
13 12
36
29
12
24
6
3
14
20
14
12
3
8 9
0
21
20
13
34
12
4
9
3
11
24
13
11
6
4 3
16
20
40
45
22
3
7
18 19
15
13
7
1010
8
1
23 2
0
10
49
17
5
10
4
15
34
BoysGirls
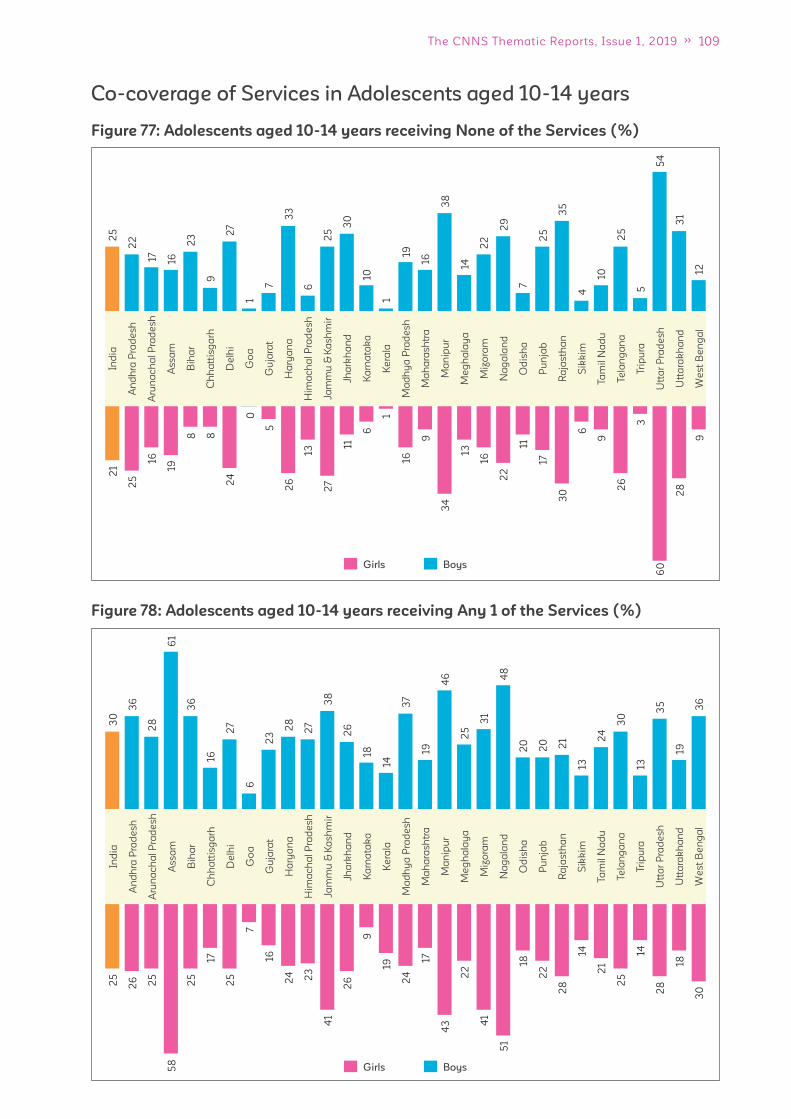
109The CNNS Thematic Reports, Issue 1, 2019
Figure 77: Adolescents aged 10-14 years receiving None of the Services (%)
Figure 78: Adolescents aged 10-14 years receiving Any 1 of the Services (%)
Co-coverage of Services in Adolescents aged 10-14 yearsIn
dia
An
dh
ra P
rad
esh
Aru
na
ch
al
Pra
de
sh
Ass
am
Bih
ar
Ch
ha
ttis
ga
rh
De
lhi
Go
a
Gu
jara
t
Ha
rya
na
Him
ac
ha
l P
rad
esh
Jam
mu
& K
ash
mir
Jha
rkh
an
d
Ka
rna
tak
a
Ke
rala
Ma
dh
ya
Pra
de
sh
Ma
ha
rash
tra
Ma
nip
ur
Me
gh
ala
ya
Miz
ora
m
Na
ga
lan
d
Od
ish
a
Pu
nja
b
Ra
jas
tha
n
Sik
kim
Ta
mil
Na
du
Te
lan
ga
na
Tri
pu
ra
Utt
ar
Pra
de
sh
Utt
ara
kh
an
d
We
st
Be
ng
al
25
22
17
16
23
9
27
1
7
33
6
25
30
10
1
19
16
38
14
22
29
7
25
35
4
10
25
5
54
31
12
21
25
16
19
8 8
24
0
5
26
13
27
11
6
1
16
9
34
13
16
22
11
17
30
6
9
26
3
28
60
9
BoysGirls
Ind
ia
An
dh
ra P
rad
esh
Aru
na
ch
al
Pra
de
sh
Ass
am
Bih
ar
Ch
ha
ttis
ga
rh
De
lhi
Go
a
Gu
jara
t
Ha
rya
na
Him
ac
ha
l P
rad
esh
Jam
mu
& K
ash
mir
Jha
rkh
an
d
Ka
rna
tak
a
Ke
rala
Ma
dh
ya
Pra
de
sh
Ma
ha
rash
tra
Ma
nip
ur
Me
gh
ala
ya
Miz
ora
m
Na
ga
lan
d
Od
ish
a
Pu
nja
b
Ra
jasth
an
Sik
kim
Ta
mil
Na
du
Te
lan
ga
na
Tri
pu
ra
Utt
ar
Pra
de
sh
Utt
ara
kh
an
d
We
st
Be
ng
al
30
25
36
26
28
25
61
58
36
25
1617
27
25
67
23
16
28
24
27
23
38
41
26
26
189
1419
37
24
1917
46
43
25
22
31
41
48
51
20
18
20
22
21
28
1314
24
21
30
25
1314
35
28
1918
36
30
BoysGirls
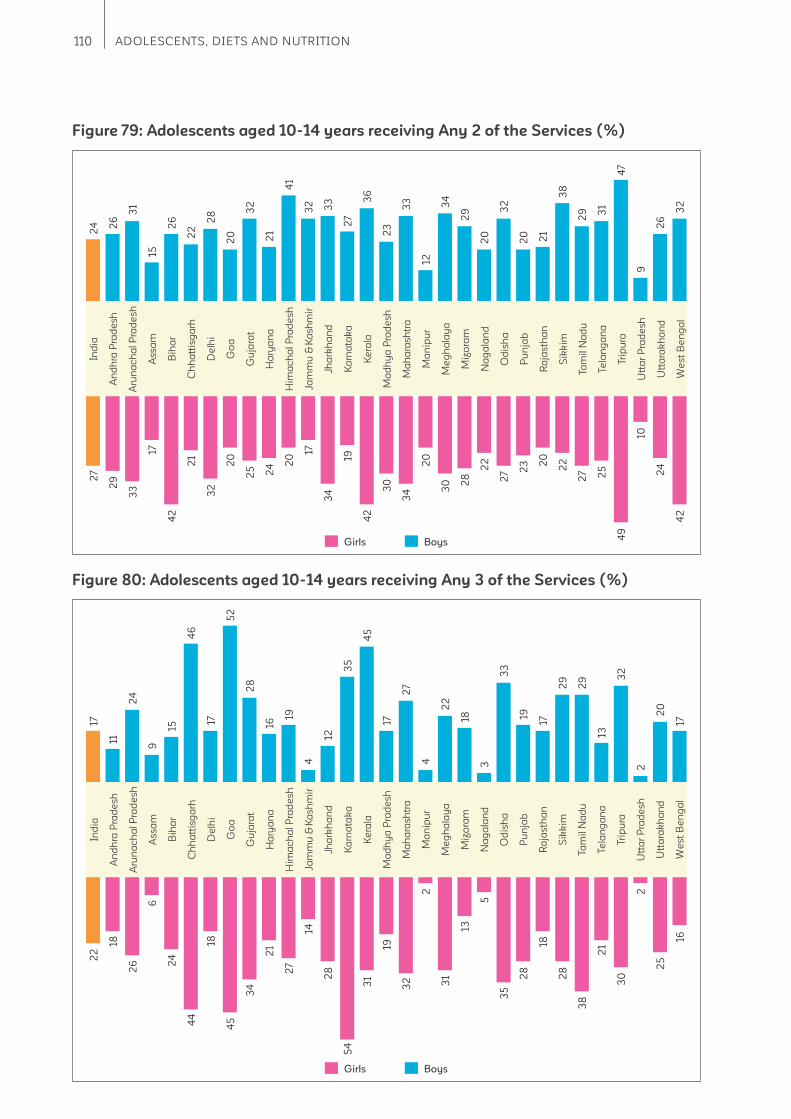
110 ADOLESCENTS, DIETS AND NUTRITION
Figure 79: Adolescents aged 10-14 years receiving Any 2 of the Services (%)
Figure 80: Adolescents aged 10-14 years receiving Any 3 of the Services (%)
Ind
ia
An
dh
ra P
rad
esh
Aru
na
ch
al
Pra
de
sh
Ass
am
Bih
ar
Ch
ha
ttis
ga
rh
De
lhi
Go
a
Gu
jara
t
Ha
rya
na
Him
ac
ha
l P
rad
esh
Jam
mu
& K
ash
mir
Jha
rkh
an
d
Ka
rna
tak
a
Ke
rala
Ma
dh
ya
Pra
de
sh
Ma
ha
rash
tra
Ma
nip
ur
Me
gh
ala
ya
Miz
ora
m
Na
ga
lan
d
Od
ish
a
Pu
nja
b
Ra
jas
tha
n
Sik
kim
Ta
mil
Na
du
Te
lan
ga
na
Tri
pu
ra
Utt
ar
Pra
de
sh
Utt
ara
kh
an
d
We
st
Be
ng
al
24 2
6
31
15
26
22
28
20
32
21
41
32 33
27
36
23
33
12
34
29
20
32
20 21
38
29 3
1
47
9
26
32
27
29
33
17
42
21
32
20
25 24 2
0
17
34
19
42
30
34
20
30 2
8
22
27 2
3 20
22
27 25
49
10
24
42
BoysGirls
Ind
ia
An
dh
ra P
rad
esh
Aru
na
ch
al
Pra
de
sh
Ass
am
Bih
ar
Ch
ha
ttis
ga
rh
De
lhi
Go
a
Gu
jara
t
Ha
rya
na
Him
ac
ha
l P
rad
esh
Jam
mu
& K
ash
mir
Jha
rkh
an
d
Ka
rna
tak
a
Ke
rala
Ma
dh
ya
Pra
de
sh
Ma
ha
rash
tra
Ma
nip
ur
Me
gh
ala
ya
Miz
ora
m
Na
ga
lan
d
Od
ish
a
Pu
nja
b
Ra
jasth
an
Sik
kim
Ta
mil
Na
du
Te
lan
ga
na
Tri
pu
ra
Utt
ar
Pra
de
sh
Utt
ara
kh
an
d
We
st
Be
ng
al
17
11
24
9
15
46
17
52
28
16
19
4
12
35
45
17
27
4
22
18
3
33
19
17
29
29
13
32
2
20
17
22
18
26
6
24
44
18
45
34
21
27
14
28
54
31
19
32
2
31
13
5
35
28
18
28
38
21
30
2
25
16
BoysGirls
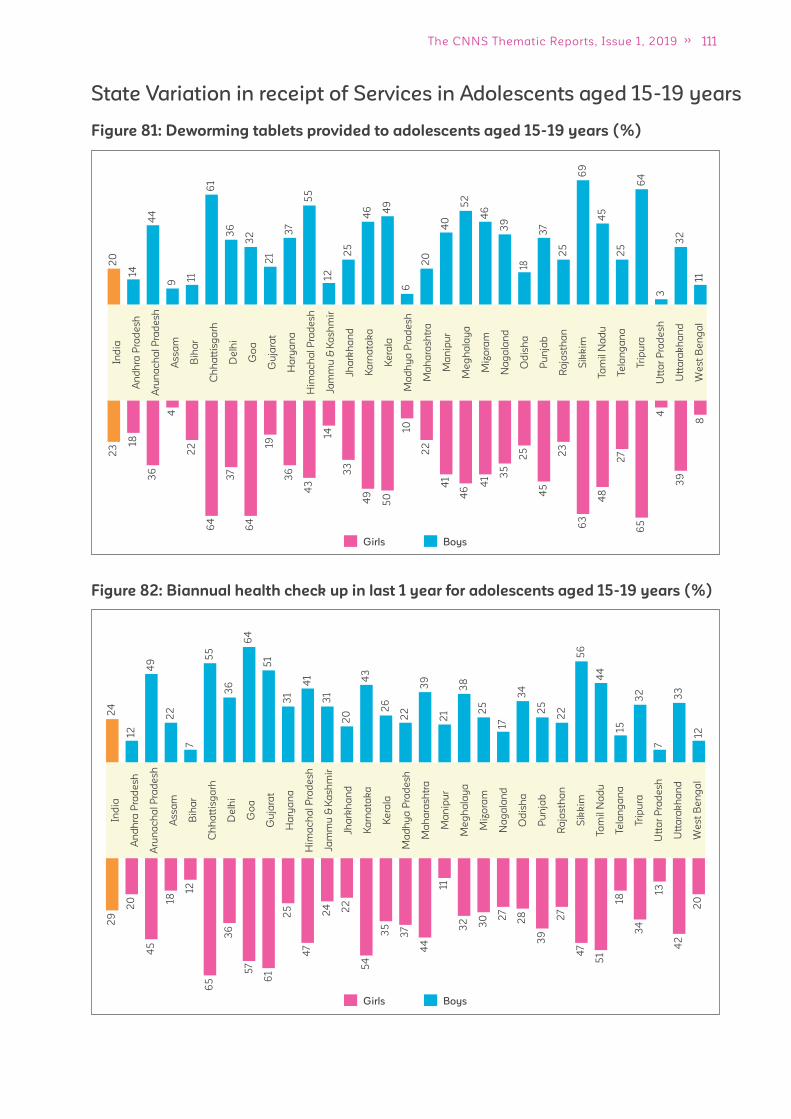
111The CNNS Thematic Reports, Issue 1, 2019
Figure 81: Deworming tablets provided to adolescents aged 15-19 years (%)
Figure 82: Biannual health check up in last 1 year for adolescents aged 15-19 years (%)
Ind
ia
An
dh
ra P
rad
esh
Aru
na
ch
al
Pra
de
sh
Ass
am
Bih
ar
Ch
ha
ttis
ga
rh
De
lhi
Go
a
Gu
jara
t
Ha
rya
na
Him
ac
ha
l P
rad
esh
Jam
mu
& K
ash
mir
Jha
rkh
an
d
Ka
rna
tak
a
Ke
rala
Ma
dh
ya
Pra
de
sh
Ma
ha
rash
tra
Ma
nip
ur
Me
gh
ala
ya
Miz
ora
m
Na
ga
lan
d
Od
ish
a
Pu
nja
b
Ra
jas
tha
n
Sik
kim
Ta
mil
Na
du
Te
lan
ga
na
Tri
pu
ra
Utt
ar
Pra
de
sh
Utt
ara
kh
an
d
We
st
Be
ng
al
20
23 18
36
4
22
64
37
64
19
36
43
33
49
50
14
10
22
41
46
35
41
45
23
63
48
27
4
65
39
8
25
14
44
9 11
61
36
32
21
37
12
25
46 4
9
6
20
40
18
52
46
39
37
25
69
25
3
64
32
11
45
55
Ind
ia
An
dh
ra P
rad
esh
Aru
na
ch
al
Pra
de
sh
Ass
am
Bih
ar
Ch
ha
ttis
ga
rh
De
lhi
Go
a
Gu
jara
t
Ha
rya
na
Him
ac
ha
l P
rad
esh
Jam
mu
& K
ash
mir
Jha
rkh
an
d
Ka
rna
tak
a
Ke
rala
Ma
dh
ya
Pra
de
sh
Ma
ha
rash
tra
Ma
nip
ur
Me
gh
ala
ya
Miz
ora
m
Na
ga
lan
d
Od
ish
a
Pu
nja
b
Ra
jasth
an
Sik
kim
Ta
mil
Na
du
Te
lan
ga
na
Tri
pu
ra
Utt
ar
Pra
de
sh
Utt
ara
kh
an
d
We
st
Be
ng
al
29
20
45
36
18
12
65
57
61
25 24 22
47
54
35
37
44
11
32 30 2
7
28
39
27
47
51
34
18
13
42
20
12
24
49
22
7
55
36
64
51
31
41
31
20
43
26
22
39
21
38
25
17
34
25
22
56
44
15
32
7
33
12
State Variation in receipt of Services in Adolescents aged 15-19 years
BoysGirls
BoysGirls

112 ADOLESCENTS, DIETS AND NUTRITION
Figure 84: Adolescents aged 15-19 years receiving none of the Services (%)
Figure 83: IFA consumption by adolescents aged 15-19 years in last one week (%)
Co-coverage of Services in Adolescents aged 15-19 years
Ind
ia
An
dh
ra P
rad
esh
Aru
na
ch
al
Pra
de
sh
Ass
am
Bih
ar
Ch
ha
ttis
ga
rh
De
lhi
Go
a
Gu
jara
t
Ha
rya
na
Him
ac
ha
l P
rad
esh
Jam
mu
& K
ash
mir
Jha
rkh
an
d
Ka
rna
tak
a
Ke
rala
Ma
dh
ya
Pra
de
sh
Ma
ha
rash
tra
Ma
nip
ur
Me
gh
ala
ya
Miz
ora
m
Na
ga
lan
d
Od
ish
a
Pu
nja
b
Ra
jas
tha
n
Sik
kim
Ta
mil
Na
du
Te
lan
ga
na
Tri
pu
ra
Utt
ar
Pra
de
sh
Utt
ara
kh
an
d
We
st
Be
ng
al
7611
3 5 3
6
13
17
29
21
10
6
24
4
14
5
19
9
4
8
14
2
12 14
9
32
13
5
8
5
16
26
3
9
4 4
13 15
22
11
8
24
5 3 3
9 8 6
2
5
8
2
5 6 4
37
7
3 2
6
21
BoysGirls
9.3
Ind
ia
An
dh
ra P
rad
esh
Aru
na
ch
al
Pra
de
sh
Ass
am
Bih
ar
Ch
ha
ttis
ga
rh
De
lhi
Go
a
Gu
jara
t
Ha
rya
na
Him
ac
ha
l P
rad
esh
Jam
mu
& K
ash
mir
Jha
rkh
an
d
Ka
rna
tak
a
Ke
rala
Ma
dh
ya
Pra
de
sh
Ma
ha
rash
tra
Ma
nip
ur
Me
gh
ala
ya
Miz
ora
m
Na
ga
lan
d
Od
ish
a
Pu
nja
b
Ra
jasth
an
Sik
kim
Ta
mil
Na
du
Te
lan
ga
na
Tri
pu
ra
Utt
ar
Pra
de
sh
Utt
ara
kh
an
d
We
st
Be
ng
al
45
34
.4
35
.6
19.1
17.
6
27
28
.9
51.
3
54
.6 41
27.
3
15.7
33
.2
22
.3
51.
2
38
40
41
40
.4
16.5
14.9
14.9
16.1
20
.9
22
.3
54
.2
25
.1
24
.8
33
.6
50
.8
31.
9
48
38
50
32
19
0
4
0 0
22
.2 28
.8
48
.7
47.
1
43
56
.6
52
.2
35
60
.2
16.7
6.4
16.3
19.2
26
.1
22
.8
36
.4
31.
3
36
.2
36
.3
33
.5
52
.3
14.7
BoysGirls

113The CNNS Thematic Reports, Issue 1, 2019
Figure 85: Adolescents aged 15-19 years receiving Any 1 of the Services (%)
Figure 86: Adolescents aged 15-19 years receiving Any 2 of the Services (%)
0
2.6
4.5
12 5.5 8
12
0
Ind
ia
An
dh
ra P
rad
esh
Aru
na
ch
al
Pra
de
sh
Ass
am
Bih
ar
Ch
ha
ttis
ga
rh
De
lhi
Go
a
Gu
jara
t
Ha
rya
na
Him
ac
ha
l P
rad
esh
Jam
mu
& K
ash
mir
Jha
rkh
an
d
Ka
rna
tak
a
Ke
rala
Ma
dh
ya
Pra
de
sh
Ma
ha
rash
tra
Ma
nip
ur
Me
gh
ala
ya
Miz
ora
m
Na
ga
lan
d
Od
ish
a
Pu
nja
b
Ra
jas
tha
n
Sik
kim
Ta
mil
Na
du
Te
lan
ga
na
Tri
pu
ra
Utt
ar
Pra
de
sh
Utt
ara
kh
an
d
We
st
Be
ng
al
22
9.4 20
0
55
32
43
0
100
0
16
302
5
- 0
45 3
9
45
46
61
0
18
0
68
13
0
33
28
7
52
35
30
25
0
50
31
61
16
12
0 - 0
49
50
26
55
22
29
0
44
21
1 0
8
42
21
91
BoysGirls
0
3.6
Ind
ia
An
dh
ra P
rad
esh
Aru
na
ch
al
Pra
de
sh
Ass
am
Bih
ar
Ch
ha
ttis
ga
rh
De
lhi
Go
a
Gu
jara
t
Ha
rya
na
Him
ac
ha
l P
rad
esh
Jam
mu
& K
ash
mir
Jha
rkh
an
d
Ka
rna
tak
a
Ke
rala
Ma
dh
ya
Pra
de
sh
Ma
ha
rash
tra
Ma
nip
ur
Me
gh
ala
ya
Miz
ora
m
Na
ga
lan
d
Od
ish
a
Pu
nja
b
Ra
jasth
an
Sik
kim
Ta
mil
Na
du
Te
lan
ga
na
Tri
pu
ra
Utt
ar
Pra
de
sh
Utt
ara
kh
an
d
We
st
Be
ng
al
232
63
6 33
14 12
31
0
16
0 0
65
6
61
-
26
88
28
16
23 20
34 3
0
11
20
39
41
0
32
14 16
30
19 17
16
37
70 68
100
0
21
32
26
14
42
-
79
30
16
38
30
50
18 18
32
7
43
0
13
4
25
BoysGirls
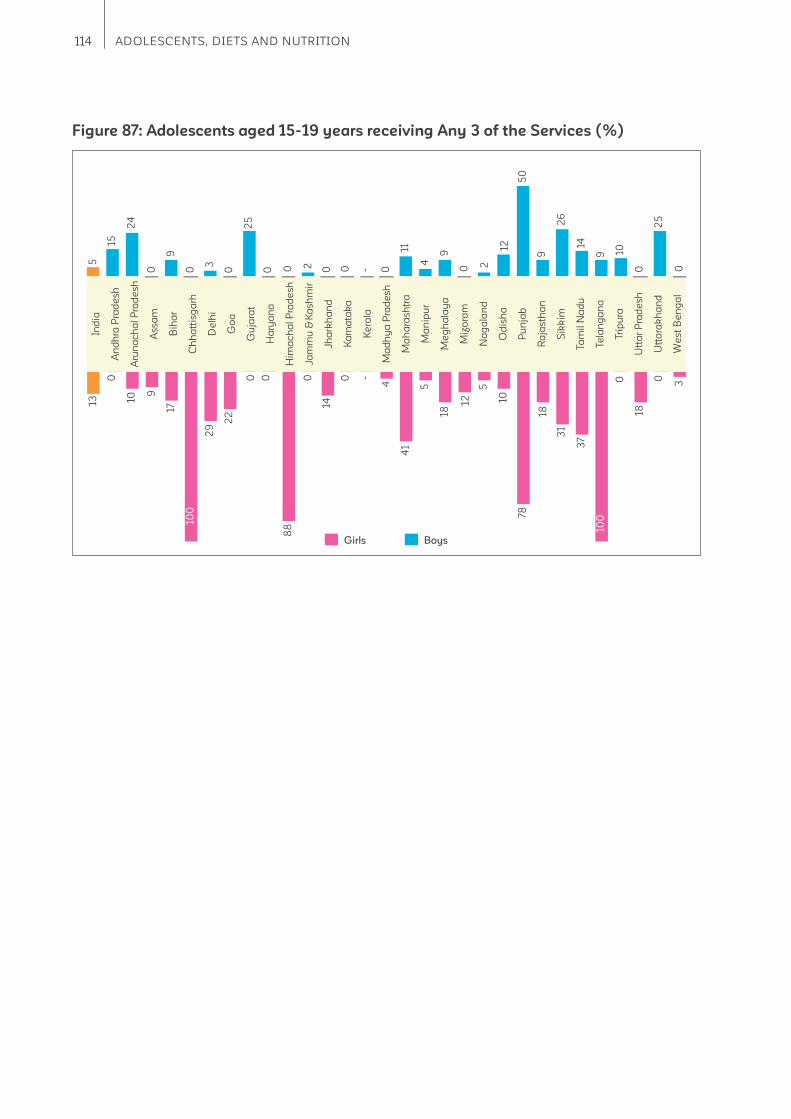
114 ADOLESCENTS, DIETS AND NUTRITION
Figure 87: Adolescents aged 15-19 years receiving Any 3 of the Services (%) 10
22
0 0
12.7
31
37 18
.2
Ind
ia
An
dh
ra P
rad
esh
Aru
na
ch
al
Pra
de
sh
Ass
am
Bih
ar
Ch
ha
ttis
ga
rh
De
lhi
Go
a
Gu
jara
t
Ha
rya
na
Him
ac
ha
l P
rad
esh
Jam
mu
& K
ash
mir
Jha
rkh
an
d
Ka
rna
tak
a
Ke
rala
Ma
dh
ya
Pra
de
sh
Ma
ha
rash
tra
Ma
nip
ur
Me
gh
ala
ya
Miz
ora
m
Na
ga
lan
d
Od
ish
a
Pu
nja
b
Ra
jas
tha
n
Sik
kim
Ta
mil
Na
du
Te
lan
ga
na
Tri
pu
ra
Utt
ar
Pra
de
sh
Utt
ara
kh
an
d
We
st
Be
ng
al
29
17
9
88
0 0
14
5
15
1
3
24
0
25
3
0
9
0 0 0 0 -
11 9
0 2
12
50
4
0
26
9
14
9 10
0 0
25
20
0 -
4
41
5
18
12
5
10
78
18 18
0 0
3
10010
0
BoysGirls
115The CNNS Thematic Reports, Issue 1, 2019
4 Opportunities
The second decade of life is the second
opportunity to make up for missed chances on
better nutrition earlier in life. It is a much wider
window than available in the fi rst 1000 days
from conception till child is two years. Another
advantage is that adolescents are capable of
making informed choices or infl uencing decisions
about their own health and nutrition if equipped
with correct and easily understood information.
Their decision-making being dependent on the
level of autonomy they have in the household.
Our analysis reveals what can be and should be
done to maximize long term health and nutrition
benefi ts in this bigger and infl uential second
window of opportunity in the life-course. There are
implications for policy in the ongoing POSHAN
Abhiyaan, bolstering ongoing programs for
adolescent health and nutrition and new research
to better the design of programs for adolescents.
Four opportunities emerge. First, there is a need
for a dedicated policy on adolescent health
and nutrition under the Poshan Abhiyan for
planning and managing services spread across
departments of education, health and woman
and child development. This has been attempted
earlier under the weekly IFA supplementation
program through joint commitment letters
from the three departments to ensure fund
allocation, supply and logistics, capacity building
of teachers, behaviour change promotion and
other actions from the department of health
go hand in hand with service delivery at point
of use (class room, village anganwadi)24. Our
analysis reveals huge gaps in compliance to both
diets and physical activity recommendations
among adolescents both of which have not been
addressed in any earlier program on adolescent
health and nutrition program. An adolescent
health and nutrition policy for the country must
include guidance on this.
Second, the Poshan Abhiyan targets for
undernutrition and anemia have resulted in
fast pacing actions to meet these targets for
women, girls and children albeit progress varies
across states25. The problem of overweight/
obesity and related non-communicable
diseases risks has been missed in design. The
problem is growing and still ignored in policy
and programs. Considering the very early onset
of these conditions in the Indian population,
policy on assessment and management of these
conditions in early adolescence is needed. There
are 12 states in India where over 10% of the
adolescents are overweight/obese; states of Goa,
Gujarat, Haryana and most states in north-east
have high burden of diabetes and cardiovascular
risks. State-specifi c action plans need to follow a
national policy on managing overweight/obesity
among adolescents. State with diets skewed to
carbohydrates, animal fats, avoidable foods (fried
foods, junk foods, sweets and aerated drinks)
need policies on restricting sale of such food
within and in vicinity of the schools.
Thirdly, with the CNNS data, new dimensions on
adolescent nutritional status especially related
to the high burden of multiple micronutrient
defi ciencies have emerged. India does not
have a policy to address vitamin B12
, vitamin D
and zinc defi ciency which have high burden
among adolescents in addition to iron and folic
acid defi ciency. An expert review of evidence is
needed to inform policy gap here.
116 ADOLESCENTS, DIETS AND NUTRITION
The analysis of current receipt of public health
service use by adolescents has implications
for reviewing the ongoing adolescent health
and nutrition programs. A bottleneck analysis
to understand root causes of challenges in
implementation of Anemia Mukt Bharat and
Rashtriya Bal Swasthya Karyakram is much
needed considering that a captive set of girls
and boys in schools is missed out from these
services. Both iron and folic acid defi ciency
continue to be highly prevalent in most states of
India. This review should include fi nancing, supply
and logistics, human resource availability and
capacity and support system to deliver services
related to weekly IFA supplementation.
Secondly, each state should have an adolescent
score card for girls and boys that captures the
progress on service use every six months. Anemia
Mukt Bharat portal provides monitoring data on
IFA and deworming for this age-group which
needs to be part of state level health and nutrition
program reviews26. Similarly, data on biannual
health check-ups and quarterly adolescent health
days needs to be made available in the public
domain.
Thirdly, there is a need to build on the ongoing
efforts in schools for promoting healthy habits
and diets like those under Food Safety and
Standards Authority of India and Anemia Mukt
Bharat. Special nutrition and diet promotion
campaign focusing on problem foods (fruits,
eggs, fi sh/chicken, dark green leafy vegetables,
pulses and milk) and adolescent health and
nutrition services need to be designed, tested and
popularised.
Research on adolescent health and nutrition in
India is limited. Current efforts while still weak are
focussed on schools. But the food plate is mostly
decided at home and not much is known about
translation of health and nutrition promotion in
schools to food plate at home. Mothers and/
or fathers remain key decision makers on what
is purchased from the market and campaigns
to reach them with correct information on food
choices for adolescents and understanding their
health needs have not been tested. Finally, in a
food system where avoidable foods are much
cheaper than healthier options more research and
development on nutritious products that appeal to
adolescents is needed.

117The CNNS Thematic Reports, Issue 1, 2019
Uttar Pradesh
22.3
Punjab
19.0
Arunachal Pradesh
6.5
Sikkim
10.3
Bihar
16.1
Jharkhand
28.2
Odisha
19.9
Assam
21.1
Telangana
23.4
Andhra
Pradesh
20.7
Kerala
20.0
Karnataka
25.0
Maharashtra
23.2
Gujarat
26.3 Madhya Pradesh
29.7
Rajasthan
29.8
NCT of Delhi
26.1
Haryana
23.1Uttarakhand
18.1
Himachal Pradesh
38.4
Jammu and
Kashmir
16.6
Puducherry
Manipur
6.3
Nagaland
11.8
Mizoram
7.3Tripura
18.1
Meghalaya
6.3
Chhattisgarh
13.9
Lakshadweep
Andaman and
Nicobar Islands
Dadra and
Nagar Haveli
Goa
16.4
West Bengal
27.3
Tamil Nadu
16.2
Better Performing States
Manipur (6.3%)
Meghalaya (6.3%)
Arunachal Pradesh (6.5%)
Mizoram (7.3%)
Sikkim (10.3%)
States with most challenges
Himachal Pradesh (38.4%)
Rajasthan (29.8%)
Madhya Pradesh (29.7%)
Jharkhand (28.2%)
West Bengal (27.3%)
India (22.9%)
10-14 years (Girls)
(BMI-for-age z-score<-2SD)
<20% : Low public health
signifi cance
20–39.9% : High public
health signifi cance
>40% : Very high public
health signifi cance
No Data
THIN
Uttar Pradesh
10.9
Punjab
17.3
Sikkim
1.0
Bihar
17.3
Jharkhand
17.2
Odisha
11.8
Assam
9.1
West
Bengal
11.9
Telangana
22.8
Andhra
Pradesh
9.4
Tamil
Nadu
13.4Kerala
9.5
Karnataka
15.5
Maharashtra
12.1
Gujarat
22.3 Madhya Pradesh
21.2
Rajasthan
15.2
NCT of Delhi
14.1
Haryana
13.4
Uttarakhand
8.1
Himachal Pradesh
21.7
Jammu and
Kashmir
4.6
Puducherry
Manipur
4.2
Nagaland
2.7
Mizoram
2.9Tripura
10.5
Meghalaya
1.1
Ch
ha
ttis
ga
rh11
.0
Lakshadweep
Andaman and Nicobar
Islands
Dadra and
Nagar
Haveli
Goa
22.7
Arunachal Pradesh
1.9
Better Performing States
Sikkim (1.0%)
Meghalaya (1.1%)
Arunachal Pradesh (1.9%)
Nagaland (2.7%)
Mizoram (2.9%)
States with most challenges
Telangana (22.8%)
Goa (22.7%)
Gujarat (22.3%)
Himachal Pradesh (21.7%)
Madhya Pradesh (21.2%)
India (14.2%)
15-19 years (Girls)
Prevalence of Visible Forms of Malnutrition in Adolescent Girls, CNNS 2016-18
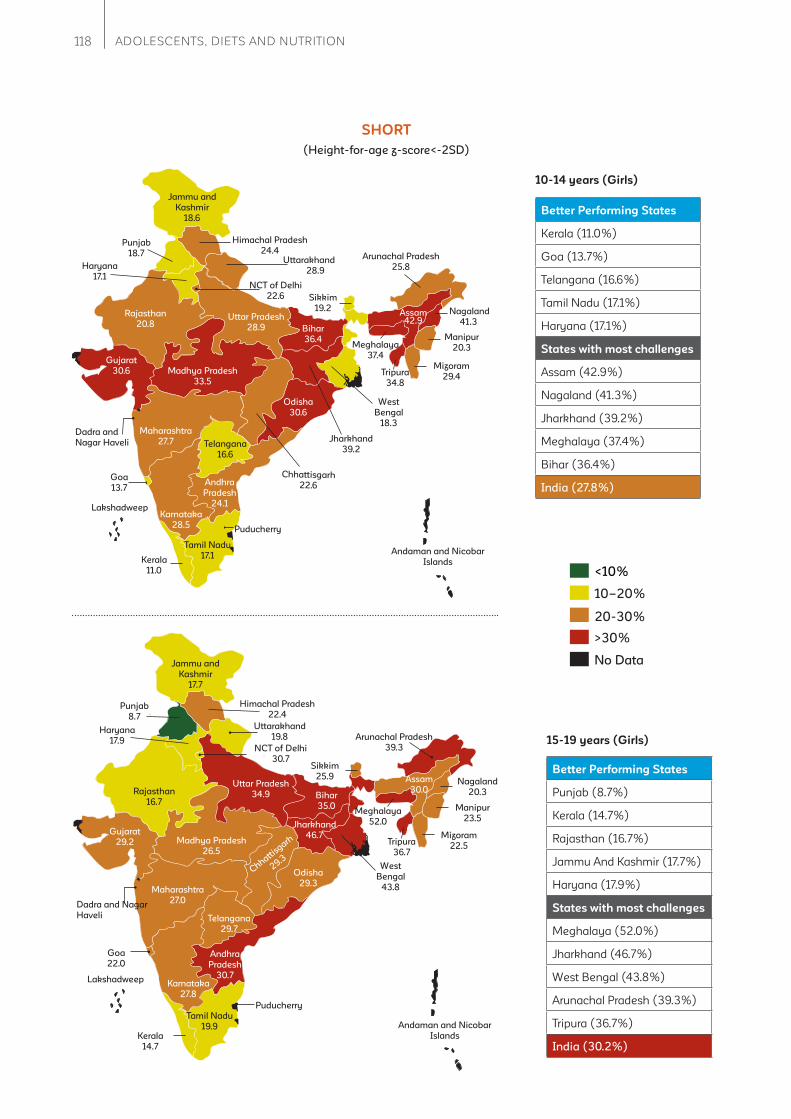
118 ADOLESCENTS, DIETS AND NUTRITION
Uttar Pradesh
28.9
Punjab
18.7 Arunachal Pradesh
25.8
Sikkim
19.2
Bihar
36.4
Jharkhand
39.2
Odisha
30.6
Assam42.9
Telangana
16.6
Andhra
Pradesh
24.1
Tamil Nadu
17.1Kerala
11.0
Karnataka
28.5
Maharashtra
27.7
Gujarat
30.6 Madhya Pradesh
33.5
Rajasthan
20.8
NCT of Delhi
22.6
Haryana
17.1
Uttarakhand
28.9
Himachal Pradesh
24.4
Jammu and
Kashmir
18.6
Puducherry
Manipur
20.3
Nagaland
41.3
Mizoram
29.4Tripura
34.8
Meghalaya
37.4
Chhattisgarh
22.6
Lakshadweep
Andaman and Nicobar
Islands
Dadra and
Nagar Haveli
Goa
13.7
West
Bengal
18.3
Better Performing States
Kerala (11.0%)
Goa (13.7%)
Telangana (16.6%)
Tamil Nadu (17.1%)
Haryana (17.1%)
States with most challenges
Assam (42.9%)
Nagaland (41.3%)
Jharkhand (39.2%)
Meghalaya (37.4%)
Bihar (36.4%)
India (27.8%)
10-14 years (Girls)
20-30%
<10%
10–20%
>30%
No Data
SHORT
Uttar Pradesh
34.9
Punjab
8.7
Sikkim
25.9
Bihar
35.0
Jharkhand
46.7
Odisha
29.3
Assam
30.0
West
Bengal
43.8
Telangana
29.7
Andhra
Pradesh
30.7
Tamil Nadu
19.9Kerala
14.7
Karnataka
27.8
Maharashtra
27.0
Gujarat
29.2 Madhya Pradesh
26.5
Rajasthan
16.7
NCT of Delhi
30.7
Haryana
17.9
Uttarakhand
19.8
Himachal Pradesh
22.4
Jammu and
Kashmir
17.7
Puducherry
Manipur
23.5
Nagaland
20.3
Mizoram
22.5Tripura
36.7
Meghalaya
52.0
Chhattisgarh
29.3
Lakshadweep
Andaman and Nicobar
Islands
Dadra and Nagar
Haveli
Goa
22.0
Arunachal Pradesh
39.3
Better Performing States
Punjab (8.7%)
Kerala (14.7%)
Rajasthan (16.7%)
Jammu And Kashmir (17.7%)
Haryana (17.9%)
States with most challenges
Meghalaya (52.0%)
Jharkhand (46.7%)
West Bengal (43.8%)
Arunachal Pradesh (39.3%)
Tripura (36.7%)
India (30.2%)
15-19 years (Girls)
(Height-for-age z-score<-2SD)
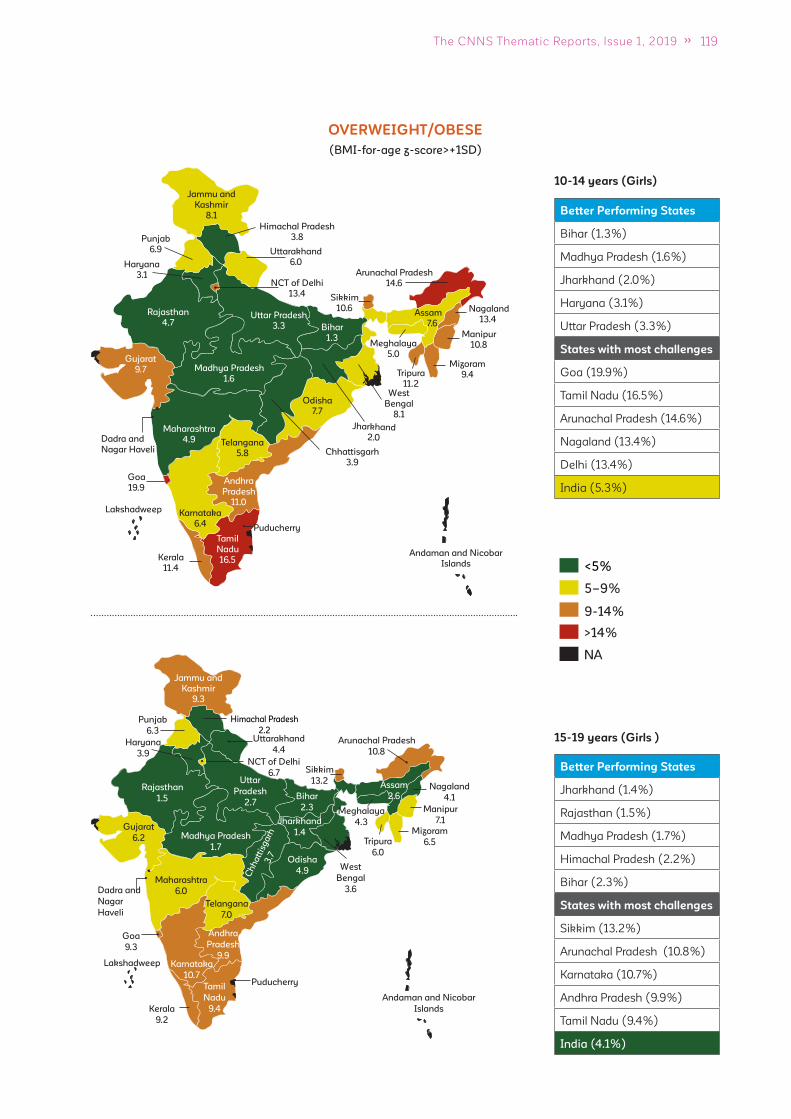
119The CNNS Thematic Reports, Issue 1, 2019
Uttar Pradesh
3.3
Punjab
6.9
Arunachal Pradesh
14.6
Sikkim
10.6
Bihar
1.3
Jharkhand
2.0
Odisha
7.7
Assam
7.6
Telangana
5.8
Andhra
Pradesh
11.0
Tamil
Nadu
16.5Kerala
11.4
Karnataka
6.4
Maharashtra
4.9
Gujarat
9.7 Madhya Pradesh
1.6
Rajasthan
4.7
NCT of Delhi
13.4
Haryana
3.1
Uttarakhand
6.0
Himachal Pradesh
3.8
Jammu and
Kashmir
8.1
Puducherry
Manipur
10.8
Nagaland
13.4
Mizoram
9.4Tripura
11.2
Meghalaya
5.0
Chhattisgarh
3.9
Lakshadweep
Andaman and Nicobar
Islands
Dadra and
Nagar Haveli
Goa
19.9
West
Bengal
8.1
Better Performing States
Bihar (1.3%)
Madhya Pradesh (1.6%)
Jharkhand (2.0%)
Haryana (3.1%)
Uttar Pradesh (3.3%)
States with most challenges
Goa (19.9%)
Tamil Nadu (16.5%)
Arunachal Pradesh (14.6%)
Nagaland (13.4%)
Delhi (13.4%)
India (5.3%)
10-14 years (Girls)
9-14%
<5%
5–9%
>14%
NA
OVERWEIGHT/OBESE
15-19 years (Girls )
Uttar
Pradesh
2.7
Sikkim
13.2
Bihar
2.3
Jharkhand
1.4
Odisha
4.9
Telangana
7.0
Andhra
Pradesh
9.9
Tamil
Nadu
9.4
Karnataka
10.7
Maharashtra
6.0
Madhya Pradesh
1.7
NCT of Delhi
6.7
Uttarakhand
4.4
Himachal Pradesh
2.2
Puducherry
Ch
ha
ttis
ga
rh3
.7
Punjab
6.3
Assam
2.6
West
Bengal
3.6
Kerala
9.2
Gujarat
6.2
Rajasthan
1.5
Haryana
3.9
Jammu and
Kashmir
9.3
Manipur
7.1
Nagaland
4.1
Mizoram
6.5Tripura
6.0
Meghalaya
4.3
Lakshadweep
Andaman and Nicobar
Islands
Dadra and
Nagar
Haveli
Goa
9.3
Arunachal Pradesh
10.8
Better Performing States
Jharkhand (1.4%)
Rajasthan (1.5%)
Madhya Pradesh (1.7%)
Himachal Pradesh (2.2%)
Bihar (2.3%)
States with most challenges
Sikkim (13.2%)
Arunachal Pradesh (10.8%)
Karnataka (10.7%)
Andhra Pradesh (9.9%)
Tamil Nadu (9.4%)
India (4.1%)
(BMI-for-age z-score>+1SD)
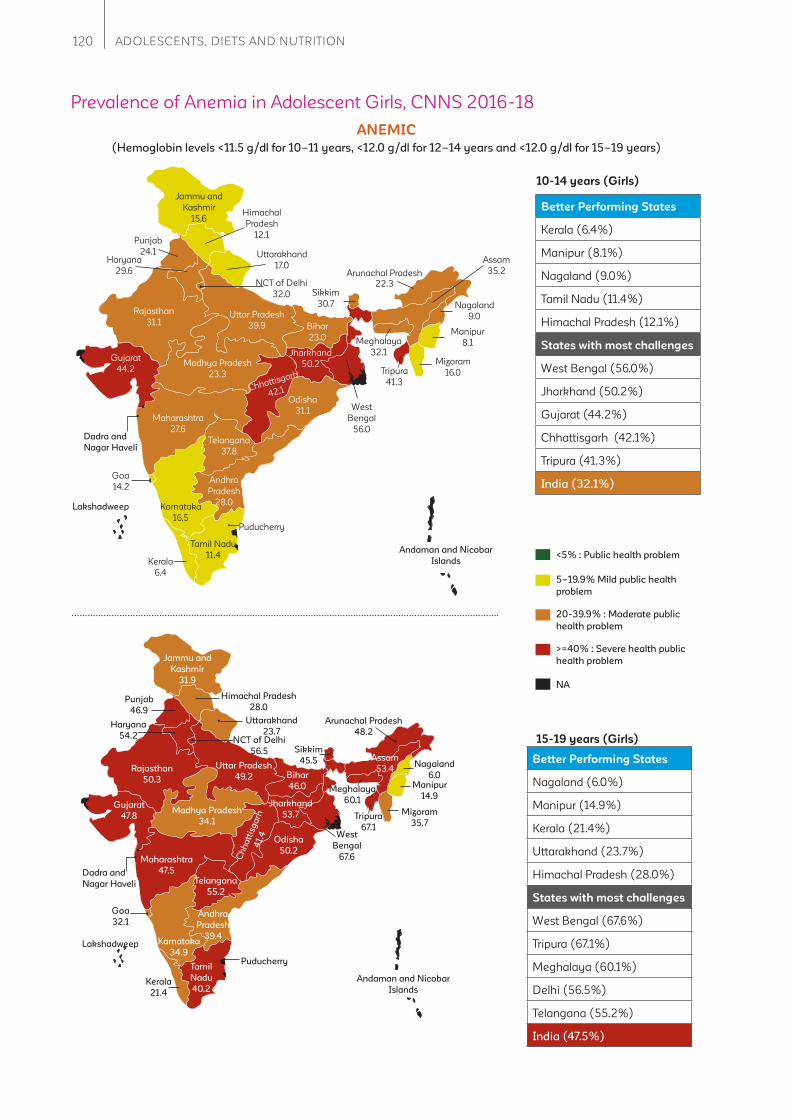
120 ADOLESCENTS, DIETS AND NUTRITION
Better Performing States
Kerala (6.4%)
Manipur (8.1%)
Nagaland (9.0%)
Tamil Nadu (11.4%)
Himachal Pradesh (12.1%)
States with most challenges
West Bengal (56.0%)
Jharkhand (50.2%)
Gujarat (44.2%)
Chhattisgarh (42.1%)
Tripura (41.3%)
India (32.1%)
20-39.9% : Moderate public
health problem
<5% : Public health problem
5–19.9% Mild public health
problem
>=40% : Severe health public
health problem
NA
Uttar Pradesh
39.9
Punjab
24.1
Arunachal Pradesh
22.3Sikkim
30.7
Bihar
23.0
Jharkhand
50.2
Odisha
31.1
Assam
35.2
Telangana
37.8
Andhra
Pradesh
28.0
Tamil Nadu
11.4Kerala
6.4
Karnataka
16.5
Maharashtra
27.6
Gujarat
44.2Madhya Pradesh
23.3
Rajasthan
31.1
NCT of Delhi
32.0
Haryana
29.6
Uttarakhand
17.0
Himachal
Pradesh
12.1
Jammu and
Kashmir
15.6
Puducherry
Manipur
8.1
Nagaland
9.0
Mizoram
16.0Tripura
41.3
Meghalaya
32.1
Chhattisgarh
42.1
Lakshadweep
Andaman and Nicobar
Islands
Dadra and
Nagar Haveli
Goa
14.2
West
Bengal
56.0
10-14 years (Girls)
15-19 years (Girls)
ANEMIC
Uttar Pradesh
49.2
Punjab
46.9
Sikkim
45.5
Bihar
46.0
Jharkhand
53.7
Odisha
50.2
Assam
53.4
West
Bengal
67.6
Telangana
55.2
Andhra
Pradesh
39.4
Tamil
Nadu
40.2Kerala
21.4
Karnataka
34.9
Maharashtra
47.5
Gujarat
47.8Madhya Pradesh
34.1
Rajasthan
50.3
NCT of Delhi
56.5
Haryana
54.2
Uttarakhand
23.7
Himachal Pradesh
28.0
Jammu and
Kashmir
31.9
Puducherry
Manipur
14.9
Nagaland
6.0
Mizoram
35.7Tripura
67.1
Meghalaya
60.1
Ch
ha
ttis
ga
rh4
1.4
Lakshadweep
Andaman and Nicobar
Islands
Dadra and
Nagar Haveli
Goa
32.1
Arunachal Pradesh
48.2
Better Performing States
Nagaland (6.0%)
Manipur (14.9%)
Kerala (21.4%)
Uttarakhand (23.7%)
Himachal Pradesh (28.0%)
States with most challenges
West Bengal (67.6%)
Tripura (67.1%)
Meghalaya (60.1%)
Delhi (56.5%)
Telangana (55.2%)
India (47.5%)
Prevalence of Anemia in Adolescent Girls, CNNS 2016-18
(Hemoglobin levels <11.5 g/dl for 10–11 years, <12.0 g/dl for 12–14 years and <12.0 g/dl for 15–19 years)
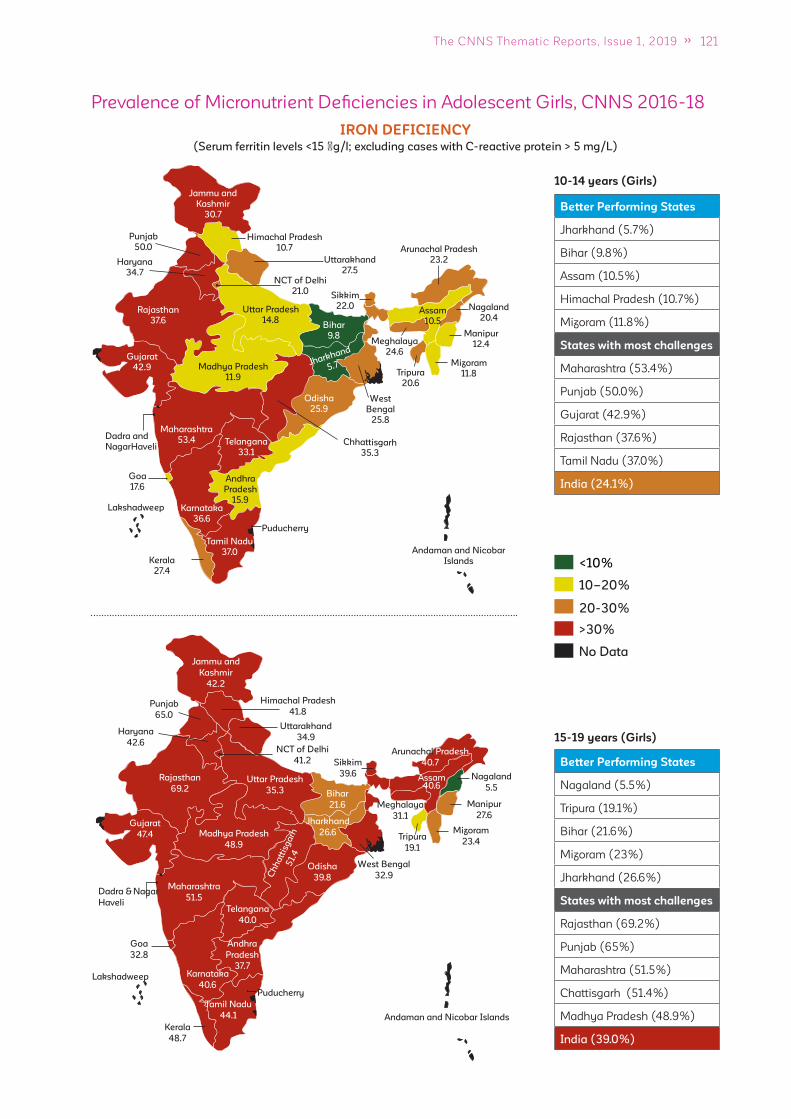
121The CNNS Thematic Reports, Issue 1, 2019
Uttar Pradesh
14.8
Punjab
50.0 Arunachal Pradesh
23.2
Sikkim
22.0
Bihar
9.8
Jharkhand
5.7
Odisha
25.9
Assam
10.5
Telangana
33.1
Andhra
Pradesh
15.9
Kerala
27.4
Karnataka
36.6
Maharashtra
53.4
Gujarat
42.9 Madhya Pradesh
11.9
Rajasthan
37.6
NCT of Delhi
21.0
Haryana
34.7
Uttarakhand
27.5
Himachal Pradesh
10.7
Jammu and
Kashmir
30.7
Puducherry
Manipur
12.4
Nagaland
20.4
Mizoram
11.8Tripura
20.6
Meghalaya
24.6
Chhattisgarh
35.3
Lakshadweep
Andaman and Nicobar
Islands
Dadra and
NagarHaveli
Goa
17.6
West
Bengal
25.8
Tamil Nadu
37.0
Better Performing States
Jharkhand (5.7%)
Bihar (9.8%)
Assam (10.5%)
Himachal Pradesh (10.7%)
Mizoram (11.8%)
States with most challenges
Maharashtra (53.4%)
Punjab (50.0%)
Gujarat (42.9%)
Rajasthan (37.6%)
Tamil Nadu (37.0%)
India (24.1%)
10-14 years (Girls)
20-30%
<10%
10–20%
>30%
No Data
IRON DEFICIENCY
Uttar Pradesh
35.3
Punjab
65.0
Arunachal Pradesh
40.7Sikkim
39.6
Bihar
21.6
Jharkhand
26.6
Odisha
39.8
Assam40.6
Telangana
40.0
Andhra
Pradesh
37.7
Tamil Nadu
44.1
Kerala
48.7
Karnataka
40.6
Maharashtra
51.5
Gujarat
47.4 Madhya Pradesh
48.9
Rajasthan
69.2
NCT of Delhi
41.2
Haryana
42.6
Uttarakhand
34.9
Himachal Pradesh
41.8
Jammu and
Kashmir
42.2
Puducherry
Manipur
27.6
Nagaland
5.5
Mizoram
23.4Tripura
19.1
Meghalaya
31.1
Ch
ha
ttis
ga
rh5
1.4
Lakshadweep
Andaman and Nicobar Islands
Dadra & Nagar
Haveli
Goa
32.8
West Bengal
32.9
15-19 years (Girls)
Better Performing States
Nagaland (5.5%)
Tripura (19.1%)
Bihar (21.6%)
Mizoram (23%)
Jharkhand (26.6%)
States with most challenges
Rajasthan (69.2%)
Punjab (65%)
Maharashtra (51.5%)
Chattisgarh (51.4%)
Madhya Pradesh (48.9%)
India (39.0%)
Prevalence of Micronutrient Defi ciencies in Adolescent Girls, CNNS 2016-18
(Serum ferritin levels <15 �g/l; excluding cases with C-reactive protein > 5 mg/L)
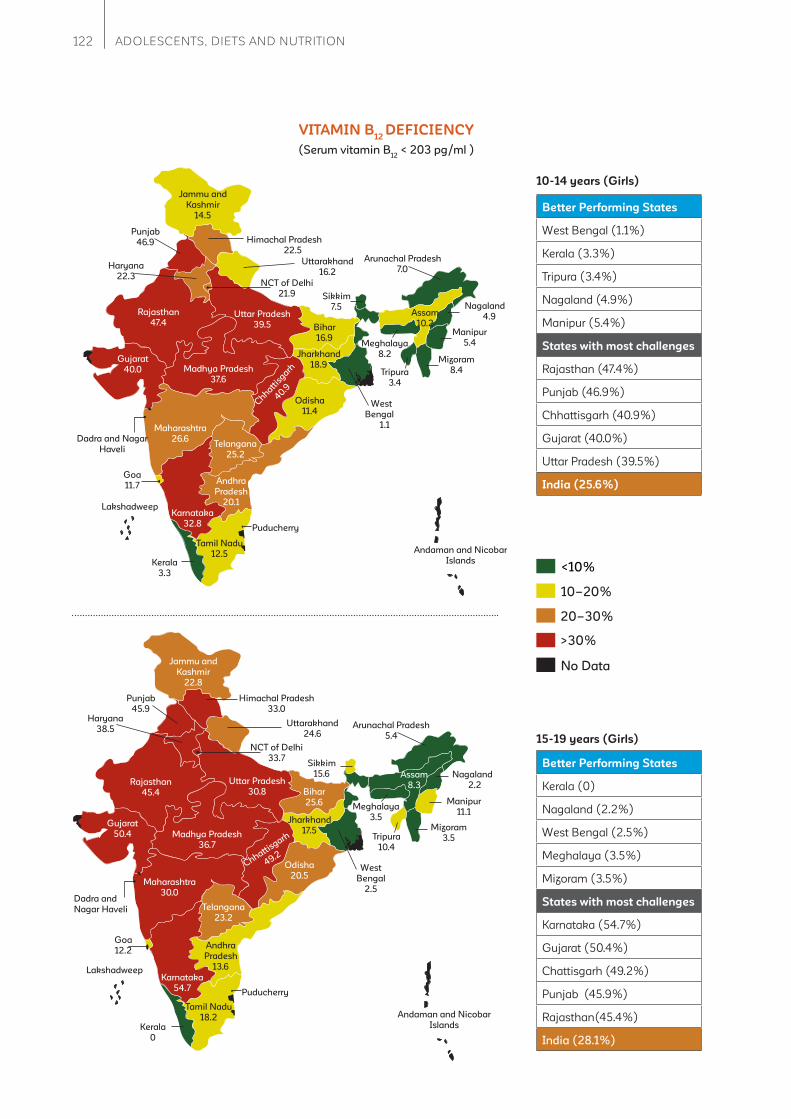
122 ADOLESCENTS, DIETS AND NUTRITION
Uttar Pradesh
39.5
Punjab
46.9
Arunachal Pradesh
7.0
Sikkim
7.5
Bihar
16.9
Jharkhand
18.9
Odisha
11.4
Assam
10.2
Telangana
25.2
Andhra
Pradesh
20.1
Tamil Nadu
12.5Kerala
3.3
Karnataka
32.8
Maharashtra
26.6
Gujarat
40.0 Madhya Pradesh
37.6
Rajasthan
47.4
NCT of Delhi
21.9
Haryana
22.3
Uttarakhand
16.2
Himachal Pradesh
22.5
Jammu and
Kashmir
14.5
Puducherry
Manipur
5.4
Nagaland
4.9
Mizoram
8.4Tripura
3.4
Meghalaya
8.2
Chhatt
isgarh
40.9
Lakshadweep
Andaman and Nicobar
Islands
Dadra and Nagar
Haveli
Goa
11.7
West
Bengal
1.1
10-14 years (Girls)
Better Performing States
West Bengal (1.1%)
Kerala (3.3%)
Tripura (3.4%)
Nagaland (4.9%)
Manipur (5.4%)
States with most challenges
Rajasthan (47.4%)
Punjab (46.9%)
Chhattisgarh (40.9%)
Gujarat (40.0%)
Uttar Pradesh (39.5%)
India (25.6%)
<10%
10–20%
>30%
20–30%
No Data
VITAMIN B12
DEFICIENCY
Uttar Pradesh
30.8
Punjab
45.9
Arunachal Pradesh
5.4
Sikkim
15.6
Bihar
25.6
Jharkhand
17.5
Odisha
20.5
Assam
8.3
Telangana
23.2
Andhra
Pradesh
13.6
Tamil Nadu
18.2Kerala
0
Karnataka
54.7
Maharashtra
30.0
Gujarat
50.4 Madhya Pradesh
36.7
Rajasthan
45.4
NCT of Delhi
33.7
Haryana
38.5Uttarakhand
24.6
Himachal Pradesh
33.0
Jammu and
Kashmir
22.8
Puducherry
Manipur
11.1
Nagaland
2.2
Mizoram
3.5Tripura
10.4
Meghalaya
3.5
Chhattisgarh
49.2
Lakshadweep
Andaman and Nicobar
Islands
Dadra and
Nagar Haveli
Goa
12.2
West
Bengal
2.5
Better Performing States
Kerala (0)
Nagaland (2.2%)
West Bengal (2.5%)
Meghalaya (3.5%)
Mizoram (3.5%)
States with most challenges
Karnataka (54.7%)
Gujarat (50.4%)
Chattisgarh (49.2%)
Punjab (45.9%)
Rajasthan(45.4%)
India (28.1%)
15-19 years (Girls)
(Serum vitamin B12
< 203 pg/ml )
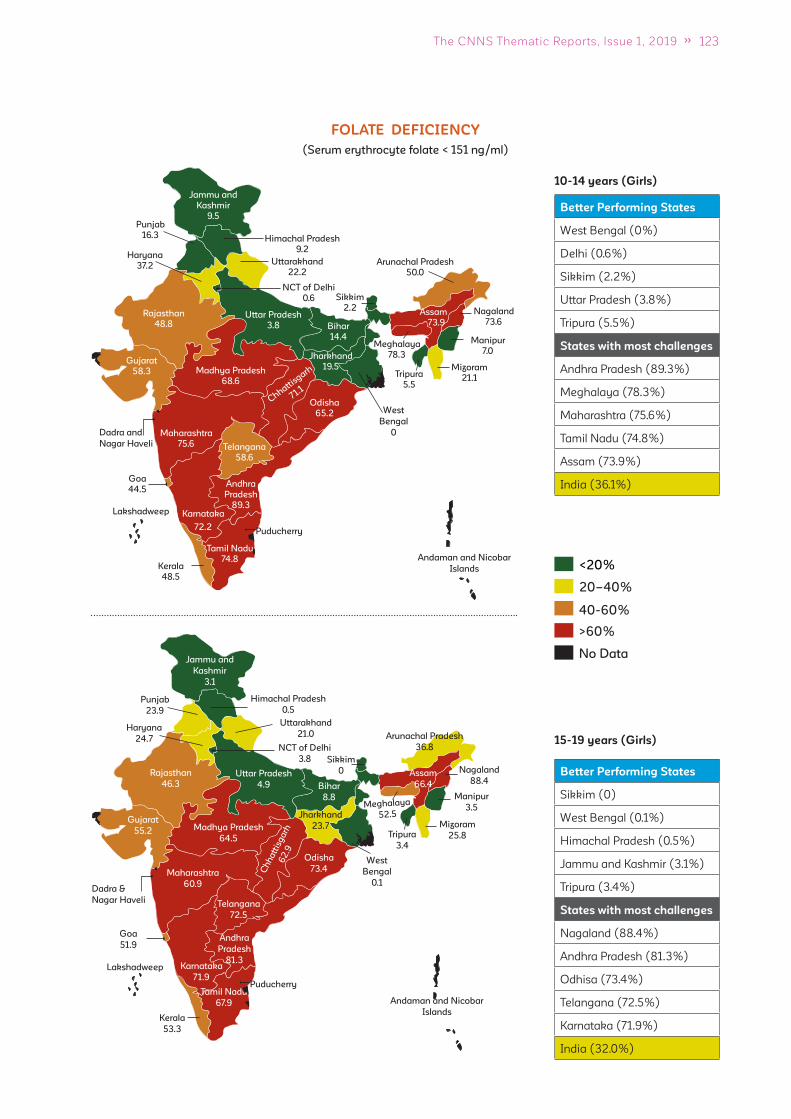
123The CNNS Thematic Reports, Issue 1, 2019
Uttar Pradesh
3.8
Punjab
16.3
Arunachal Pradesh
50.0
Sikkim
2.2
Bihar
14.4
Jharkhand
19.5
Odisha
65.2
Assam
73.9
Telangana
58.6
Andhra
Pradesh
89.3
Kerala
48.5
Karnataka
72.2
Maharashtra
75.6
Gujarat
58.3 Madhya Pradesh
68.6
Rajasthan
48.8
NCT of Delhi
0.6
Haryana
37.2Uttarakhand
22.2
Himachal Pradesh
9.2
Jammu and
Kashmir
9.5
Puducherry
Manipur
7.0
Nagaland
73.6
Mizoram
21.1Tripura
5.5
Meghalaya
78.3
Chhattisgarh
71.1
Lakshadweep
Andaman and Nicobar
Islands
Dadra and
Nagar Haveli
Goa
44.5
West
Bengal
0
Tamil Nadu
74.8
10-14 years (Girls)
Better Performing States
West Bengal (0%)
Delhi (0.6%)
Sikkim (2.2%)
Uttar Pradesh (3.8%)
Tripura (5.5%)
States with most challenges
Andhra Pradesh (89.3%)
Meghalaya (78.3%)
Maharashtra (75.6%)
Tamil Nadu (74.8%)
Assam (73.9%)
India (36.1%)
40-60%
<20%
20–40%
>60%
No Data
FOLATE DEFICIENCY
15-19 years (Girls)
Uttar Pradesh
4.9
Punjab
23.9
Arunachal Pradesh
36.8
Sikkim
0
Bihar
8.8
Jharkhand
23.7
Odisha
73.4
Assam
66.4
Telangana
72.5
Andhra
Pradesh
81.3
Tamil Nadu
67.9
Kerala
53.3
Karnataka
71.9
Maharashtra
60.9
Gujarat
55.2 Madhya Pradesh
64.5
Rajasthan
46.3
NCT of Delhi
3.8
Haryana
24.7
Uttarakhand
21.0
Himachal Pradesh
0.5
Jammu and
Kashmir
3.1
Puducherry
Manipur
3.5
Nagaland
88.4
Mizoram
25.8Tripura
3.4
Meghalaya
52.5
Ch
ha
ttis
ga
rh6
2.9
Lakshadweep
Andaman and Nicobar
Islands
Dadra &
Nagar Haveli
Goa
51.9
West
Bengal
0.1
Better Performing States
Sikkim (0)
West Bengal (0.1%)
Himachal Pradesh (0.5%)
Jammu and Kashmir (3.1%)
Tripura (3.4%)
States with most challenges
Nagaland (88.4%)
Andhra Pradesh (81.3%)
Odhisa (73.4%)
Telangana (72.5%)
Karnataka (71.9%)
India (32.0%)
(Serum erythrocyte folate < 151 ng/ml)
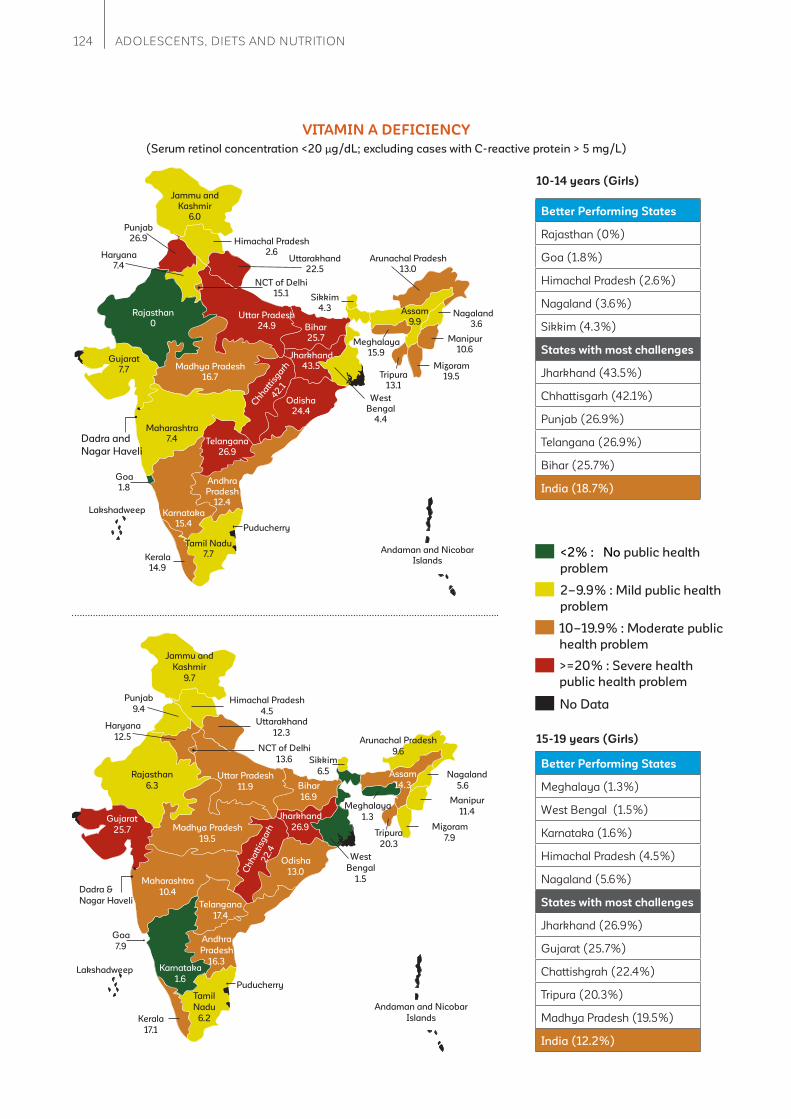
124 ADOLESCENTS, DIETS AND NUTRITION
Uttar Pradesh
24.9
Punjab
26.9
Arunachal Pradesh
13.0
Sikkim
4.3
Bihar
25.7
Jharkhand
43.5
Odisha
24.4
Assam
9.9
Telangana
26.9
Andhra
Pradesh
12.4
Tamil Nadu
7.7Kerala
14.9
Karnataka
15.4
Maharashtra
7.4
Gujarat
7.7 Madhya Pradesh
16.7
Rajasthan
0
NCT of Delhi
15.1
Haryana
7.4Uttarakhand
22.5
Himachal Pradesh
2.6
Jammu and
Kashmir
6.0
Puducherry
Manipur
10.6
Nagaland
3.6
Mizoram
19.5Tripura
13.1
Meghalaya
15.9
Chhatt
isgarh
42.1
Lakshadweep
Andaman and Nicobar
Islands
Dadra and
Nagar Haveli
Goa
1.8
West
Bengal
4.4
10-14 years (Girls)
VITAMIN A DEFICIENCY
<2% : No public health
problem
2–9.9% : Mild public health
problem
>=20% : Severe health
public health problem
10–19.9% : Moderate public
health problem
No Data
Better Performing States
Rajasthan (0%)
Goa (1.8%)
Himachal Pradesh (2.6%)
Nagaland (3.6%)
Sikkim (4.3%)
States with most challenges
Jharkhand (43.5%)
Chhattisgarh (42.1%)
Punjab (26.9%)
Telangana (26.9%)
Bihar (25.7%)
India (18.7%)
Uttar Pradesh
11.9
Punjab
9.4
Arunachal Pradesh
9.6Sikkim
6.5
Bihar
16.9
Jharkhand
26.9
Odisha
13.0
Assam
14.3
Telangana
17.4
Andhra
Pradesh
16.3
Tamil
Nadu
6.2Kerala
17.1
Karnataka
1.6
Maharashtra
10.4
Gujarat
25.7 Madhya Pradesh
19.5
Rajasthan
6.3
NCT of Delhi
13.6
Haryana
12.5
Uttarakhand
12.3
Himachal Pradesh
4.5
Jammu and
Kashmir
9.7
Puducherry
Manipur
11.4
Nagaland
5.6
Mizoram
7.9Tripura
20.3
Meghalaya
1.3
Ch
ha
ttis
ga
rh2
2.4
Lakshadweep
Andaman and Nicobar
Islands
Dadra &
Nagar Haveli
Goa
7.9
West
Bengal
1.5
Better Performing States
Meghalaya (1.3%)
West Bengal (1.5%)
Karnataka (1.6%)
Himachal Pradesh (4.5%)
Nagaland (5.6%)
States with most challenges
Jharkhand (26.9%)
Gujarat (25.7%)
Chattishgrah (22.4%)
Tripura (20.3%)
Madhya Pradesh (19.5%)
India (12.2%)
15-19 years (Girls)
(Serum retinol concentration <20 μg/dL; excluding cases with C-reactive protein > 5 mg/L)
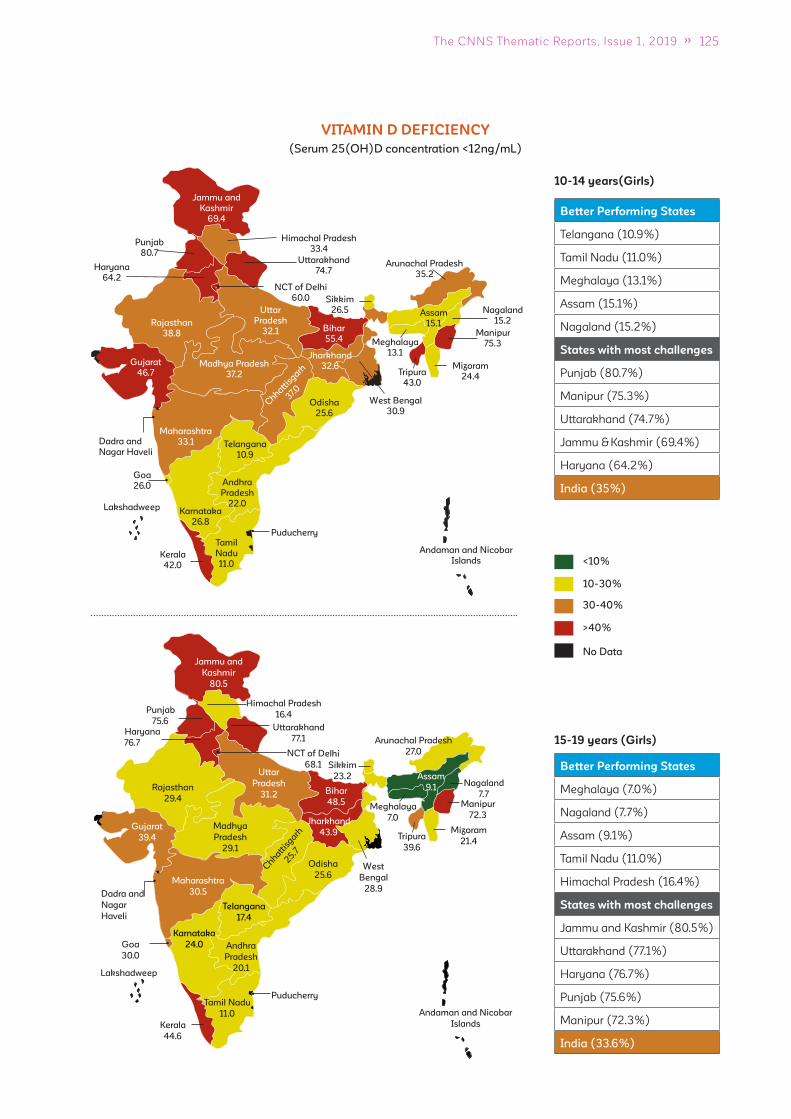
125The CNNS Thematic Reports, Issue 1, 2019
10-14 years(Girls)
VITAMIN D DEFICIENCY
Uttar
Pradesh
32.1
Punjab
80.7
Arunachal Pradesh
35.2
Sikkim
26.5
Bihar
55.4
Jharkhand
32.6
Odisha
25.6
Assam
15.1
Telangana
10.9
Andhra
Pradesh
22.0
Tamil
Nadu
11.0Kerala
42.0
Karnataka
26.8
Maharashtra
33.1
Gujarat
46.7Madhya Pradesh
37.2
Rajasthan
38.8
NCT of Delhi
60.0
Haryana
64.2
Uttarakhand
74.7
Himachal Pradesh
33.4
Jammu and
Kashmir
69.4
Puducherry
Manipur
75.3
Nagaland
15.2
Mizoram
24.4Tripura
43.0
Meghalaya
13.1
Chhatt
isgarh
37.0
Lakshadweep
Andaman and Nicobar
Islands
Dadra and
Nagar Haveli
Goa
26.0
West Bengal
30.9
Better Performing States
Telangana (10.9%)
Tamil Nadu (11.0%)
Meghalaya (13.1%)
Assam (15.1%)
Nagaland (15.2%)
States with most challenges
Punjab (80.7%)
Manipur (75.3%)
Uttarakhand (74.7%)
Jammu & Kashmir (69.4%)
Haryana (64.2%)
India (35%)
<10%
10-30%
30-40%
>40%
No Data
15-19 years (Girls)
Uttar
Pradesh
31.2
Punjab
75.6
Arunachal Pradesh
27.0
Sikkim
23.2
Bihar
48.5
Jharkhand
43.9
Odisha
25.6
Assam
9.1
West
Bengal
28.9
Telangana
17.4
Andhra
Pradesh
20.1
Tamil Nadu
11.0
Kerala
44.6
Karnataka
24.0
Maharashtra
30.5
Gujarat
39.4
Madhya
Pradesh
29.1
Rajasthan
29.4
NCT of Delhi
68.1
Haryana
76.7
Uttarakhand
77.1
Himachal Pradesh
16.4
Jammu and
Kashmir
80.5
Puducherry
Manipur
72.3
Nagaland
7.7
Mizoram
21.4Tripura
39.6
Meghalaya
7.0
Chhatt
isgarh
25.7
Lakshadweep
Andaman and Nicobar
Islands
Dadra and
Nagar
Haveli
Goa
30.0
Better Performing States
Meghalaya (7.0%)
Nagaland (7.7%)
Assam (9.1%)
Tamil Nadu (11.0%)
Himachal Pradesh (16.4%)
States with most challenges
Jammu and Kashmir (80.5%)
Uttarakhand (77.1%)
Haryana (76.7%)
Punjab (75.6%)
Manipur (72.3%)
India (33.6%)
(Serum 25(OH)D concentration <12ng/mL)

126 ADOLESCENTS, DIETS AND NUTRITION
Uttar
Pradesh
18.7
Punjab
54.2
Arunachal Pradesh
23.6
Sikkim
32.0
Bihar
15.3
Jharkhand
38.7
Odisha
43.0
Assam
34.0
Telangana
23.7
Andhra
Pradesh
22.2
Tamil
Nadu
30.7Kerala
18.8
Karnataka
35.0
Maharashtra
24.7
Gujarat
37.7 Madhya Pradesh
21.9
Rajasthan
30.5
NCT of Delhi
42.8
Haryana
22.8Uttarakhand
32.1
Himachal Pradesh
51.0
Jammu and
Kashmir
33.0
Puducherry
Manipur
47.2
Nagaland
0
Mizoram
2.8Tripura
33.9
Meghalaya
51.8
Chhattisgarh
19.6
Lakshadweep
Andaman and Nicobar
Islands
Dadra and
Nagar Haveli
Goa
24.9
West
Bengal
25.8
Better Performing States
Nagaland (0%)
Mizoram (2.8%)
Bihar (15.3%)
Uttar Pradesh (18.7%)
Kerala (18.8%)
States with most challenges
Punjab (54.2%)
Meghalaya (51.8%)
Himachal Pradesh (51.0%)
Manipur (47.2%)
Odisha (43.0%)
India (26.6%)
10-14 years(Girls)
ZINC DEFICIENCY
<10%
10-20%
20-30%
>30%
No Data
Uttar
Pradesh
21.5
Punjab
41.8
Arunachal Pradesh
13.5
Sikkim
39.1
Bihar
25.3
Jharkhand
27.7
Odisha
43.4
Assam
27.2
West
Bengal
29.7
Telangana
30.1
Andhra
Pradesh
19.3
Tamil Nadu
58.3Kerala
23.3
Karnataka
48.2
Maharashtra
24.5
Gujarat
55.8Madhya Pradesh
9.5
Rajasthan
18.4
NCT of Delhi
47.8
Haryana
10.5
Uttarakhand
26.6
Himachal Pradesh
44.7
Jammu and
Kashmir
33.9
Puducherry
Manipur
49.7
Nagaland
9.9
Mizoram
15.4Tripura
43.0
Meghalaya
30.9
Chhatt
isgarh
44.0
Lakshadweep
Andaman and Nicobar
Islands
Dadra and
Nagar
Haveli
Goa
24.0
Better Performing States
Madhya Pradesh (9.5%)
Nagaland (9.9%)
Haryana (10.5%)
Arunachal Pradesh (13.5%)
Mizoram (15.4%)
States with most challenges
Tamil Nadu (58.3%)
Gujarat (55.8%)
Manipur (49.7%)
Karnataka (48.2%)
Delhi (47.8%)
India (30.2%)
15-19 years15-19 years(Girls)
(Serum Zinc concentration < 70 μg/dl (morning fasting) and < 66 μg/dl (morning non-fasting) in non-pregnant females)
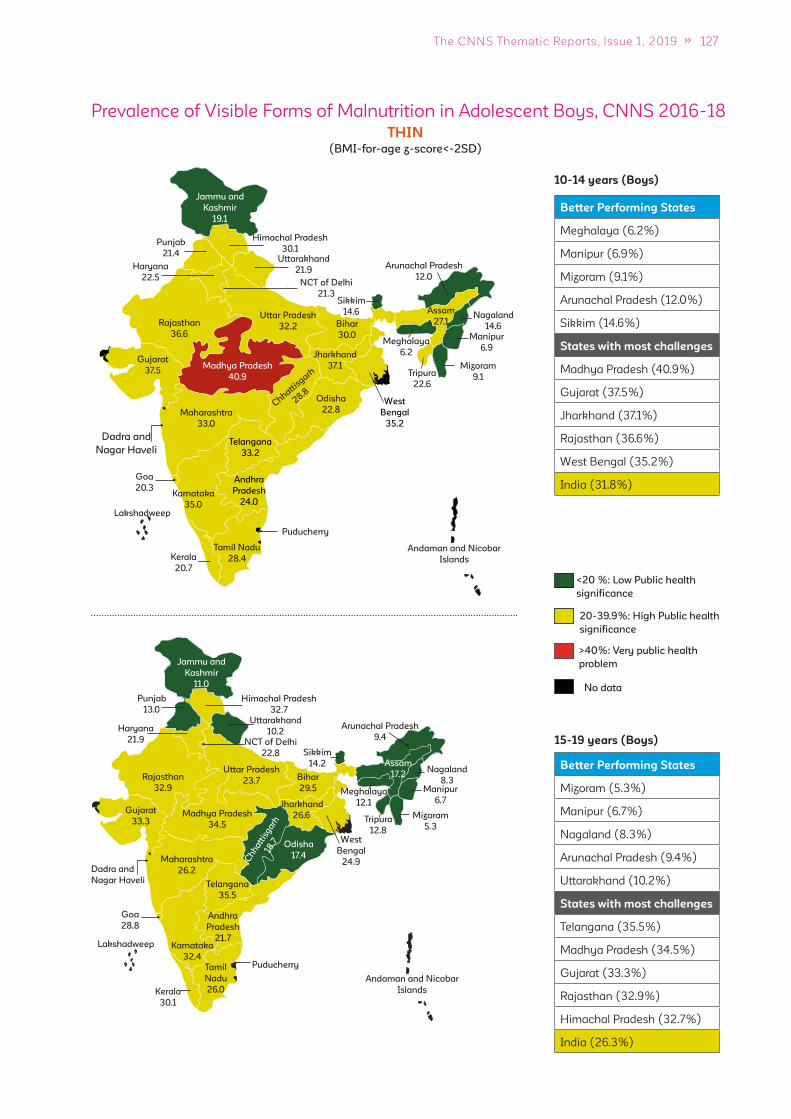
127The CNNS Thematic Reports, Issue 1, 2019
10-14 years (Boys)
15-19 years (Boys)
Uttar Pradesh
32.2
Punjab
21.4
Arunachal Pradesh
12.0
Sikkim
14.6
Bihar
30.0
Jharkhand
37.1
Odisha
22.8
Assam
27.1
West
Bengal
35.2
Telangana
33.2
Andhra
Pradesh
24.0
Tamil Nadu
28.4Kerala
20.7
Karnataka
35.0
Maharashtra
33.0
Gujarat
37.5Madhya Pradesh
40.9
Rajasthan
36.6
NCT of Delhi
21.3
Haryana
22.5
Uttarakhand
21.9
Himachal Pradesh
30.1
Jammu and
Kashmir
19.1
Puducherry
Manipur
6.9
Nagaland
14.6
Mizoram
9.1Tripura
22.6
Meghalaya
6.2
Chhatt
isgarh
28.8
Lakshadweep
Andaman and Nicobar
Islands
Dadra and
Nagar Haveli
Goa
20.3
<20 %: Low Public health
signif icance
20-39.9%: High Public health
signif icance
>40%: Very public health
problem
No data
Better Performing States
Meghalaya (6.2%)
Manipur (6.9%)
Mizoram (9.1%)
Arunachal Pradesh (12.0%)
Sikkim (14.6%)
States with most challenges
Madhya Pradesh (40.9%)
Gujarat (37.5%)
Jharkhand (37.1%)
Rajasthan (36.6%)
West Bengal (35.2%)
India (31.8%)
THIN
Uttar Pradesh
23.7
Punjab
13.0
Sikkim
14.2
Bihar
29.5
Jharkhand
26.6
Odisha
17.4
Assam
17.2
West
Bengal
24.9
Telangana
35.5
Andhra
Pradesh
21.7
Tamil
Nadu
26.0Kerala
30.1
Karnataka
32.4
Maharashtra
26.2
Gujarat
33.3Madhya Pradesh
34.5
Rajasthan
32.9
NCT of Delhi
22.8
Haryana
21.9
Uttarakhand
10.2
Jammu and
Kashmir
11.0
Puducherry
Manipur
6.7
Nagaland
8.3
Mizoram
5.3Tripura
12.8
Meghalaya
12.1
Ch
hatt
isg
arh
18.7
Lakshadweep
Andaman and Nicobar
Islands
Dadra and
Nagar Haveli
Goa
28.8
Arunachal Pradesh
9.4
Better Performing States
Mizoram (5.3%)
Manipur (6.7%)
Nagaland (8.3%)
Arunachal Pradesh (9.4%)
Uttarakhand (10.2%)
States with most challenges
Telangana (35.5%)
Madhya Pradesh (34.5%)
Gujarat (33.3%)
Rajasthan (32.9%)
Himachal Pradesh (32.7%)
India (26.3%)
Himachal Pradesh
32.7
Prevalence of Visible Forms of Malnutrition in Adolescent Boys, CNNS 2016-18
(BMI-for-age z-score<-2SD)
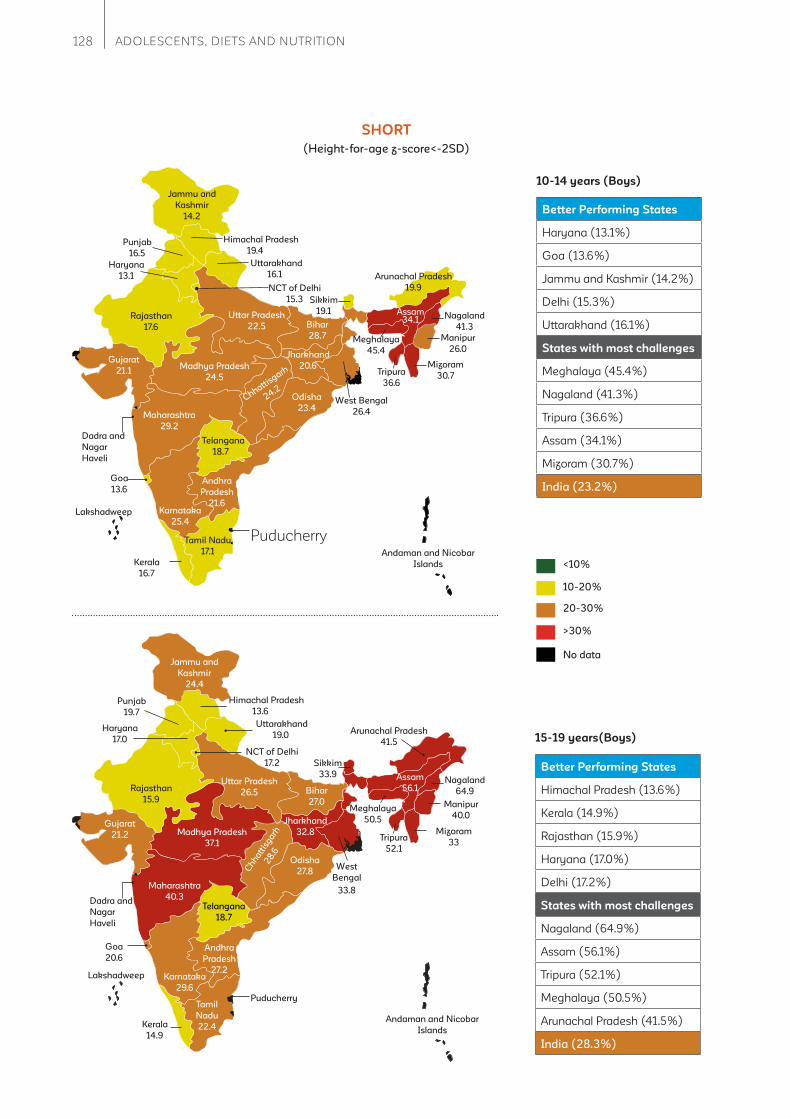
128 ADOLESCENTS, DIETS AND NUTRITION
10-14 years (Boys)
SHORT
Uttar Pradesh
22.5
Punjab
16.5
Arunachal Pradesh
19.9
Sikkim
19.1
Bihar
28.7
Jharkhand
20.6
Odisha
23.4
Assam34.1
West Bengal
26.4
Telangana
18.7
Andhra
Pradesh
21.6
Tamil Nadu
17.1
Kerala
16.7
Karnataka
25.4
Maharashtra
29.2
Gujarat
21.1Madhya Pradesh
24.5
Rajasthan
17.6
NCT of Delhi
15.3
Haryana
13.1
Uttarakhand
16.1
Himachal Pradesh
19.4
Jammu and
Kashmir
14.2
Puducherry
Manipur
26.0
Nagaland
41.3
Mizoram
30.7Tripura
36.6
Meghalaya
45.4
Chhattisgarh
24.2
Lakshadweep
Andaman and Nicobar
Islands
Dadra and
Nagar
Haveli
Goa
13.6
Better Performing States
Haryana (13.1%)
Goa (13.6%)
Jammu and Kashmir (14.2%)
Delhi (15.3%)
Uttarakhand (16.1%)
States with most challenges
Meghalaya (45.4%)
Nagaland (41.3%)
Tripura (36.6%)
Assam (34.1%)
Mizoram (30.7%)
India (23.2%)
<10%
10-20%
20-30%
>30%
No data
15-19 years(Boys)
Uttar Pradesh
26.5
Punjab
19.7
Sikkim
33.9
Bihar
27.0
Jharkhand
32.8
Odisha
27.8
Assam
56.1
West
Bengal
33.8
Telangana
18.7
Andhra
Pradesh
27.2
Tamil
Nadu
22.4Kerala
14.9
Karnataka
29.6
Maharashtra
40.3
Gujarat
21.2 Madhya Pradesh
37.1
Rajasthan
15.9
NCT of Delhi
17.2
Haryana
17.0
Jammu and
Kashmir
24.4
Puducherry
Manipur
40.0
Nagaland
64.9
Mizoram
33Tripura
52.1
Meghalaya
50.5
Ch
hatt
isgarh
28
.6
Lakshadweep
Andaman and Nicobar
Islands
Dadra and
Nagar
Haveli
Goa
20.6
Arunachal Pradesh
41.5
Better Performing States
Himachal Pradesh (13.6%)
Kerala (14.9%)
Rajasthan (15.9%)
Haryana (17.0%)
Delhi (17.2%)
States with most challenges
Nagaland (64.9%)
Assam (56.1%)
Tripura (52.1%)
Meghalaya (50.5%)
Arunachal Pradesh (41.5%)
India (28.3%)
Uttarakhand
19.0
Himachal Pradesh
13.6
(Height-for-age z-score<-2SD)
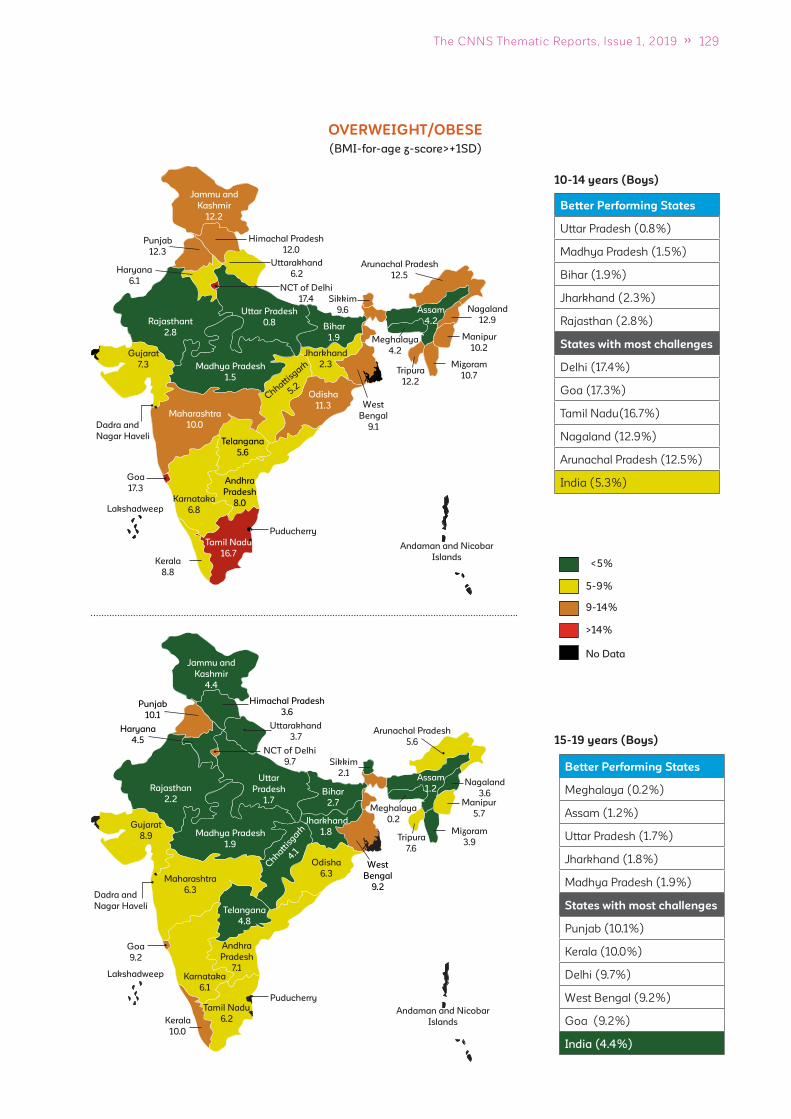
129The CNNS Thematic Reports, Issue 1, 2019
10-14 years (Boys)
OVERWEIGHT/OBESE
Uttar Pradesh
0.8
Punjab
12.3
Arunachal Pradesh
12.5
Sikkim
9.6
Bihar
1.9
Jharkhand
2.3
Odisha
11.3
Assam
4.2
West
Bengal
9.1
Telangana
5.6
Andhra
Pradesh
8.0
Tamil Nadu
16.7Kerala
8.8
Karnataka
6.8
Maharashtra
10.0
Gujarat
7.3 Madhya Pradesh
1.5
Rajasthant
2.8
NCT of Delhi
17.4
Haryana
6.1
Uttarakhand
6.2
Himachal Pradesh
12.0
Jammu and
Kashmir
12.2
Puducherry
Manipur
10.2
Nagaland
12.9
Mizoram
10.7Tripura
12.2
Meghalaya
4.2
Chhatti
sgarh
5.2
Lakshadweep
Andaman and Nicobar
Islands
Dadra and
Nagar Haveli
Goa
17.3
Better Performing States
Uttar Pradesh (0.8%)
Madhya Pradesh (1.5%)
Bihar (1.9%)
Jharkhand (2.3%)
Rajasthan (2.8%)
States with most challenges
Delhi (17.4%)
Goa (17.3%)
Tamil Nadu(16.7%)
Nagaland (12.9%)
Arunachal Pradesh (12.5%)
India (5.3%)
<5%
5-9%
9-14%
>14%
No Data
15-19 years (Boys)
Uttar
Pradesh
1.7
Punjab
10.1
Sikkim
2.1
Bihar
2.7
Jharkhand
1.8
Odisha
6.3
Assam
1.2
West
Bengal
9.2
Telangana
4.8
Andhra
Pradesh
7.1
Tamil Nadu
6.2Kerala
10.0
Karnataka
6.1
Maharashtra
6.3
Gujarat
8.9 Madhya Pradesh
1.9
Rajasthan
2.2
NCT of Delhi
9.7
Haryana
4.5
Uttarakhand
3.7
Himachal Pradesh
3.6
Jammu and
Kashmir
4.4
Puducherry
Manipur
5.7
Nagaland
3.6
Mizoram
3.9Tripura
7.6
Meghalaya
0.2
Chhatt
isgarh
4.1
Lakshadweep
Andaman and Nicobar
Islands
Dadra and
Nagar Haveli
Goa
9.2
Arunachal Pradesh
5.6
Better Performing States
Meghalaya (0.2%)
Assam (1.2%)
Uttar Pradesh (1.7%)
Jharkhand (1.8%)
Madhya Pradesh (1.9%)
States with most challenges
Punjab (10.1%)
Kerala (10.0%)
Delhi (9.7%)
West Bengal (9.2%)
Goa (9.2%)
India (4.4%)
(BMI-for-age z-score>+1SD)

130 ADOLESCENTS, DIETS AND NUTRITION
10-14 years (Boys)
ANEMIC
Uttar Pradesh
17.9
Punjab
16.5
Arunachal Pradesh
20.5Sikkim
17.8
Bihar
20.4
Jharkhand
17.6
Odisha
18.2
Assam24.9
Telangana
16.7
Andhra
Pradesh
9.8
Tamil Nadu9.2
Kerala
2.9
Karnataka
4.8
Maharashtra
21.2
Gujarat
21.6 Madhya Pradesh
12.1
Rajasthan
6.0
NCT of Delhi
12.5
Haryana
23.2
Uttarakhand
7.0
Himachal Pradesh
4.4
Jammu and
Kashmir
6.7
Puducherry
Manipur
7.3
Nagaland
15.5
Mizoram
13.0Tripura
25.7
Meghalaya
23.8
Chhattisgarh
21.0
Lakshadweep
Andaman and Nicobar
Islands
Dadra and
Nagar Haveli
Goa
5.8
West
Bengal
31.2
Better Performing States
Kerala (2.9%)
Himachal Pradesh (4.4%)
Karnataka (4.8%)
Goa (5.8%)
Jammu And Kashmir (6.7%)
States with most challenges
West Bengal (31.2%)
Meghalaya (23.8%)
Tripura (25.7%)
Assam (24.9%)
Haryana (23.2%)
India (17.1%)
<5%: No public health
problem
5-19.9%: Mild public
health problem
20-39.9%:Moderate public
health problem
>40%:Severe public
health problem
N/A
15-19 years (Boys)
Uttar Pradesh
16.9
Punjab
13.7
Sikkim
10.5
Bihar
16.4
Jharkhand
15.0
Odisha
17.5
Assam
39.1
West
Bengal
28.0
Telangana
20.3
Andhra Pradesh
13.3
Tamil Nadu
5.3Kerala
5.2
Karnataka
12.7
Maharashtra
20.3
Gujarat
21.6Madhya Pradesh
19.8
Rajasthan
17.1
NCT of Delhi
18.8
Haryana
20.5
Uttarakhand
15.9
Himachal Pradesh
21.1
Jammu and
Kashmir
5.6
Puducherry
Manipur
12.5
Nagaland
0
Mizoram
9.0Tripura
33.0
Meghalaya
20.5
Chhatt
isgarh
21.0
Lakshadweep
Andaman and Nicobar
Islands
Dadra and
Nagar Haveli
Goa
6.2
Arunachal Pradesh
17.8
Better Performing States
Nagaland (0.0)
Kerala (5.2%)
Tamil Nadu (5.3%)
Jammu & Kashmir (5.6%)
Goa (6.2%)
States with most challenges
Assam (39.1%)
Tripura (33.0%)
West Bengal (28.0%)
Himachal Pradesh (21.1%)
Chhattisgarh (21.0%)
India (18.1%)
Prevalence of Anemia in Adolescent Boys, CNNS 2016-18
(Hemoglobin levels <11.5 g/dl for 10–11 years, <12.0 g/dl for 12–14 years and <13.0 g/dl for 15–19 years)

131The CNNS Thematic Reports, Issue 1, 2019
10-14 years (Boys)
IRON DEFICIENCY
Uttar Pradesh
9.9
Punjab
45.6
Arunachal Pradesh
3.7
Sikkim
11.3
Bihar
9.8
Jharkhand
6.8
Odisha
7.5
Assam
2.5
West
Bengal
6.8
Telangana
13.9
Andhra
Pradesh
5.7
Tamil Nadu
16.6Kerala
13.6
Karnataka
26.3
Maharashtra
17.0
Gujarat
31.4 Madhya Pradesh
23.0
Rajasthan
15.6
NCT of Delhi
8.7
Haryana
24.7Uttarakhand
14.9
Himachal Pradesh 7.3
Jammu and
Kashmir
25.7
Puducherry
Manipur
4.4
Nagaland
0
Mizoram
4.4Tripura
3.3
Meghalaya
2.8
Chhattisgarh
22.0
Lakshadweep
Andaman and Nicobar
Islands
Dadra and
Nagar Haveli
Goa
5.2
Better Performing States
Nagaland (0.0%)
Assam (2.5%)
Meghalaya (2.8%)
Tripura (3.3%)
Arunachal Pradesh (3.7%)
States with most challenges
Punjab (45.6%)
Gujarat (31.4%)
Karnataka (26.3%)
Jammu and Kashmir (25.7%)
Haryana (24.7%)
India (14.0%)
<10%
10-20%
20-30%
>30%
No data
15-19 years (Boys)
Uttar Pradesh
4.1
Punjab
16.5
Sikkim
10.0
Bihar
5.1
Jharkhand
2.8
Odisha
5.8
Assam
4.0
West
Bengal
2.7
Telangana
16.7
Andhra
Pradesh
4.8
Tamil
Nadu
4.4Kerala
4.2
Karnataka
17.8
Maharashtra
13.7
Gujarat
20.5Madhya Pradesh
6.2
Rajasthan
20.0
NCT of Delhi
3.8
Haryana
17.1
Uttarakhand
6.5
Himachal Pradesh
27.9
Jammu and
Kashmir
18.8
Puducherry
Manipur
4.2
Nagaland
0
Mizoram
0Tripura
3.9
Meghalaya
2.9
Ch
ha
ttis
ga
rh14
.1
Lakshadweep
Andaman and Nicobar
Islands
Dadra and
Nagar Haveli
Goa
0
Arunachal Pradesh
7.9
Better Performing States
Goa (0.0%)
Mizoram (0.0%)
Nagaland (0.0%)
West Bengal (2.7%)
Jharkhand (2.8%)
States with most challenges
Himachal Pradesh (27.9%)
Gujarat (20.5%)
Rajasthan (20.0%)
Jammu And Kashmir (18.8%)
Karnataka (17.8%)
India (8.5%)
Prevalence of Micronutrient Defi ciencies in Adolescent Boys, CNNS 2016-18
(Serum ferritin levels <15 μg/l; excluding cases with C-reactive protein > 5 mg/L)
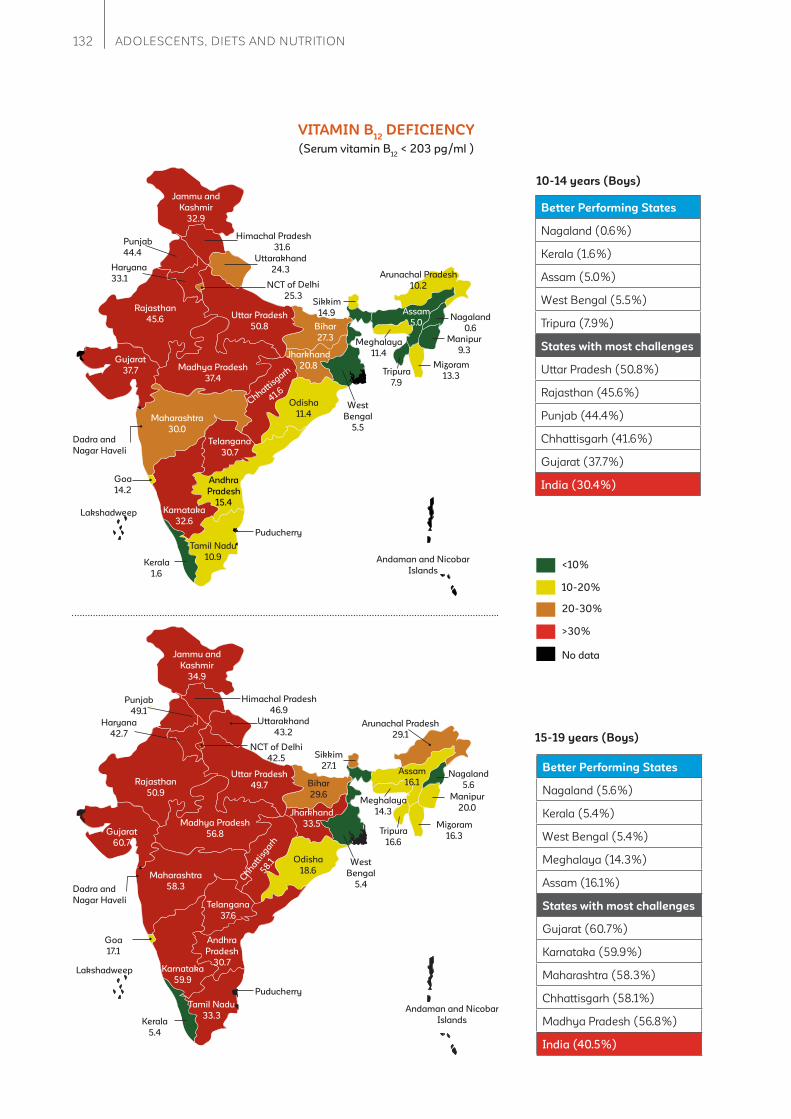
132 ADOLESCENTS, DIETS AND NUTRITION
10-14 years (Boys)
VITAMIN B12
DEFICIENCY
Uttar Pradesh
50.8
Punjab
44.4
Arunachal Pradesh
10.2
Sikkim
14.9
Bihar
27.3
Jharkhand
20.8
Odisha
11.4
Assam
5.0
West
Bengal
5.5
Telangana
30.7
Andhra
Pradesh
15.4
Tamil Nadu
10.9Kerala
1.6
Karnataka
32.6
Maharashtra
30.0
Gujarat
37.7 Madhya Pradesh
37.4
Rajasthan
45.6
NCT of Delhi
25.3
Haryana
33.1
Uttarakhand
24.3
Himachal Pradesh
31.6
Jammu and
Kashmir
32.9
Puducherry
Manipur
9.3
Nagaland
0.6
Mizoram
13.3Tripura
7.9
Meghalaya
11.4
Chhattisgarh
41.6
Lakshadweep
Andaman and Nicobar
Islands
Dadra and
Nagar Haveli
Goa
14.2
Better Performing States
Nagaland (0.6%)
Kerala (1.6%)
Assam (5.0%)
West Bengal (5.5%)
Tripura (7.9%)
States with most challenges
Uttar Pradesh (50.8%)
Rajasthan (45.6%)
Punjab (44.4%)
Chhattisgarh (41.6%)
Gujarat (37.7%)
India (30.4%)
<10%
10-20%
20-30%
>30%
No data
15-19 years (Boys)
Uttar Pradesh
49.7
Punjab
49.1
Sikkim
27.1
Bihar
29.6
Jharkhand
33.5
Odisha
18.6
Assam
16.1
West
Bengal
5.4
Telangana
37.6
Andhra
Pradesh
30.7
Tamil Nadu
33.3Kerala
5.4
Karnataka
59.9
Maharashtra
58.3
Gujarat
60.7
Madhya Pradesh
56.8
Rajasthan
50.9
NCT of Delhi
42.5
Haryana
42.7
Uttarakhand
43.2
Himachal Pradesh
46.9
Jammu and
Kashmir
34.9
Puducherry
Manipur
20.0
Nagaland
5.6
Mizoram
16.3Tripura
16.6
Meghalaya
14.3
Chhatt
isgarh
58.1
Lakshadweep
Andaman and Nicobar
Islands
Dadra and
Nagar Haveli
Goa
17.1
Arunachal Pradesh
29.1
Better Performing States
Nagaland (5.6%)
Kerala (5.4%)
West Bengal (5.4%)
Meghalaya (14.3%)
Assam (16.1%)
States with most challenges
Gujarat (60.7%)
Karnataka (59.9%)
Maharashtra (58.3%)
Chhattisgarh (58.1%)
Madhya Pradesh (56.8%)
India (40.5%)
(Serum vitamin B12
< 203 pg/ml )

133The CNNS Thematic Reports, Issue 1, 2019
10-14 years (Boys)
FOLATE DEFICIENCY
Uttar Pradesh
43.9
Punjab
1.1
Arunachal Pradesh
37.0
Sikkim
58.9
Bihar
17.2
Jharkhand
23.4
Odisha
0
Assam
6.5
West
Bengal
53.7
Telangana
80.5
Andhra
Pradesh
1.9
Tamil Nadu
68.7Kerala
0
Karnataka
64.6
Maharashtra
71.4
Gujarat
62.8 Madhya Pradesh
50.6
Rajasthan
35.5
NCT of Delhi
55.7
Haryana
77.4
Uttarakhand
59.7
Himachal Pradesh
4.1
Jammu and
Kashmir
8.8
Puducherry
Manipur
6.7
Nagaland
93.2
Mizoram
23.5 Tripura
65.8
Meghalaya
59.0
Chhattisgarh
18.6
Lakshadweep
Andaman and Nicobar
Islands
Dadra and
Nagar Haveli
Goa
4.2
Better Performing States
Kerala (0.0%)
Odisha (0.0%)
Punjab (1.1%)
Andhra Pradesh (1.9%)
Himachal Pradesh (4.1%)
States with most challenges
Nagaland (93.2%)
Telangana (80.5%)
Haryana (77.4%)
Maharashtra (71.4%)
Tamil Nadu (68.7%)
India (35.6%)
<20%
20-40%
40-60%
>60%
No data
15-19 years (Boys)
Uttar Pradesh
8.8
Punjab
15.7
Sikkim
0.7
Bihar
16.4
Jharkhand
30.7
Odisha
72.0
Assam
80.5
Telangana
71.1
Andhra
Pradesh
81.1
Tamil
Nadu
80.0Kerala
68.1
Karnataka
71.4
Maharashtra
79.7
Gujarat
65.2Madhya Pradesh
84.8
Rajasthan
60.6
NCT of Delhi
8.0
Haryana
33.7
Uttarakhand
28.9
Himachal Pradesh
5.3
Jammu and
Kashmir
3.8
Puducherry
Manipur
10.1
Nagaland
96.4
Mizoram
19.2Tripura
5.5
Meghalaya
53.2
Ch
hatt
isgarh
76.4
Lakshadweep
Andaman and Nicobar
Islands
Dadra and
Nagar Haveli
Goa
59.2
West
Bengal
0
Arunachal Pradesh
52.7
Better Performing States
West Bengal (0.0%)
Sikkim (0.7%)
Jammu and Kashmir (3.8%)
Himachal Pradesh (5.3%)
Tripura (5.5%
States with most challenges
Nagaland (96.4%)
Madhya Pradesh (84.8%)
Andhra Pradesh (81.1%)
Assam (80.5%)
Tamil nadu (80.0%)
India (43.7%)
(Serum erythrocyte folate < 151 ng/ml)

134 ADOLESCENTS, DIETS AND NUTRITION
10-14 years (Boys)
VITAMIN A DEFICIENCY
Uttar Pradesh
14.5
Punjab
23.3
Arunachal Pradesh
15.2
Sikkim
19.3
Bihar
7.1
Jharkhand
22.3
Odisha
7.7
Assam
5.1
West
Bengal
21.7
Telangana
22.2
Andhra
Pradesh
17.0
Tamil Nadu
10.4Kerala
9.1
Karnataka
21.8
Maharashtra
17.6
Gujarat
23.5 Madhya Pradesh
12.4
Rajasthan
4.7
NCT of Delhi
0
Haryana
9.0
Uttarakhand
3.1
Himachal Pradesh
23.4
Jammu and
Kashmir
26.6
Puducherry
Manipur
18.3
Nagaland
14.8
Mizoram
43.7Tripura
5.8
Meghalaya
3.7
Chhattisgarh
10.8
Lakshadweep
Andaman and Nicobar
Islands
Dadra and
Nagar Haveli
Goa
24.2
Better Performing States
Delhi (0.0%)
Uttarakhand (3.1%)
Meghalaya (3.7%)
Rajasthan (4.7%)
Assam (5.1%)
States with most challenges
Mizoram (43.7%)
Jammu and Kashmir (26.6%)
Goa (24.2%)
Gujarat (23.5%)
Himachal Pradesh (23.4%)
India (17.8%)
<2%: No public health
problem
2-9.9%: Mild public health
problem
10-19.9%:Moderate public
health problem
>=20%:Severe public health
problem
No data
15-19 years (Boys)
Uttar Pradesh
13.8
Punjab
6.1
Sikkim
0
Bihar
17.4
Jharkhand
27.3
Odisha
17.1
Assam
15.2
West
Bengal
4.4
Telangana
12.9
Andhra
Pradesh
2.7
Tamil Nadu
38.6Kerala
4.5
Karnataka
9.9
Maharashtra
4.6
Gujarat
11.7Madhya Pradesh
6.2
Rajasthan
0
NCT of Delhi
4.3
Haryana
3.7
Uttarakhand
6.8
Himachal Pradesh
1.0
Jammu and
Kashmir
3.6
Puducherry
Manipur
9.8
Nagaland
0
Mizoram
16.4Tripura
19.4
Meghalaya
2.0
Chhatt
isgarh
11.9
Lakshadweep
Andaman and Nicobar
Islands
Dadra and
Nagar Haveli
Goa
0.8
Arunachal Pradesh
1.9
Better Performing States
Nagaland (0.0%)
Rajasthan (0.0%)
Sikkim (0.0%)
Goa (0.8%)
Himachal Pradesh (1.0%)
States with most challenges
Tamil Nadu (38.6%)
Jharkhand (27.3%)
Tripura (19.4%)
Bihar (17.4%)
Odisha (17.1%)
India (13.0%)
(Serum retinol concentration <20 μg/dL; excluding cases with C-reactive protein > 5 mg/L)

135The CNNS Thematic Reports, Issue 1, 2019
10-14 years (Boys)
VITAMIN D DEFICIENCY
Uttar Pradesh
8.6
Punjab
63.5
Arunachal Pradesh
16.5
Sikkim
13.1
Bihar
19.8
Jharkhand
22.5
Odisha
13.5
Assam
2.5
West Bengal
14.3
Telangana
4.3
Andhra
Pradesh
11.2
Tamil Nadu
3.9
Kerala
15.4
Karnataka
4.3
Maharashtra
13.6
Gujarat
33.2Madhya Pradesh
16.8
Rajasthan
18.8
NCT of Delhi
28.3
Haryana
42.3
Uttarakhand
58.9
Himachal Pradesh
9.8
Jammu and
Kashmir
23.9
Puducherry
Manipur
48.9
Nagaland
5.8
Mizoram
4.2Tripura
20.3
Meghalaya
2.3
Chhattisgarh
10.9
Lakshadweep
Andaman and Nicobar
Islands
Dadra and
Nagar
Haveli
Goa
18.6
Better Performing States
Meghalaya (2.3%)
Assam (2.5%)
Tamil Nadu (3.9%)
Mizoram (4.2%)
Karnataka (4.3%)
States with most challenges
Punjab (63.5%)
Uttarakhand (58.9%)
Manipur (48.9%)
Haryana (42.3%)
Gujarat (33.2%)
India (15.6%)
<10%
10-30%
30-40%
>40%
No data
15-19 years (Boys)
Uttar Pradesh
2.8
Punjab
52.5
Sikkim
11.3
Bihar
10.8
Jharkhand
21.7
Odisha
6.1
Assam
1.8
Telangana
2.9
Andhra
Pradesh
12.6
Tamil
Nadu
0.7Kerala
22.5
Karnataka
6.9
Maharashtra
15.9
Gujarat
24.6
Madhya Pradesh
13.3
Rajasthan
15.2
NCT of Delhi
35.8
Haryana
38.3
Uttarakhand
46.3
Himachal Pradesh
5.1
Jammu and
Kashmir
24.6
Puducherry
Manipur
40.3
Nagaland
7.4
Mizoram
3.9Tripura
15.4
Meghalaya
6.4
Ch
hatt
isgarh
9.8
Lakshadweep
Andaman and Nicobar
Islands
Dadra and
Nagar Haveli
Goa
13.4
West
Bengal
4.4
Arunachal Pradesh
9.5
Better Performing States
Tamil Nadu (0.7%)
Assam (1.8%)
Uttar Pradesh (2.8%)
Telangana (2.9%)
Mizoram (3.9%)
States with most challenges
Punjab (52.5%)
Uttarakhand (46.3%)
Manipur (40.3%)
Haryana (38.3%)
Delhi (35.8%)
India (11.6%)
(Serum 25(OH)D concentration <12ng/mL)ȁ
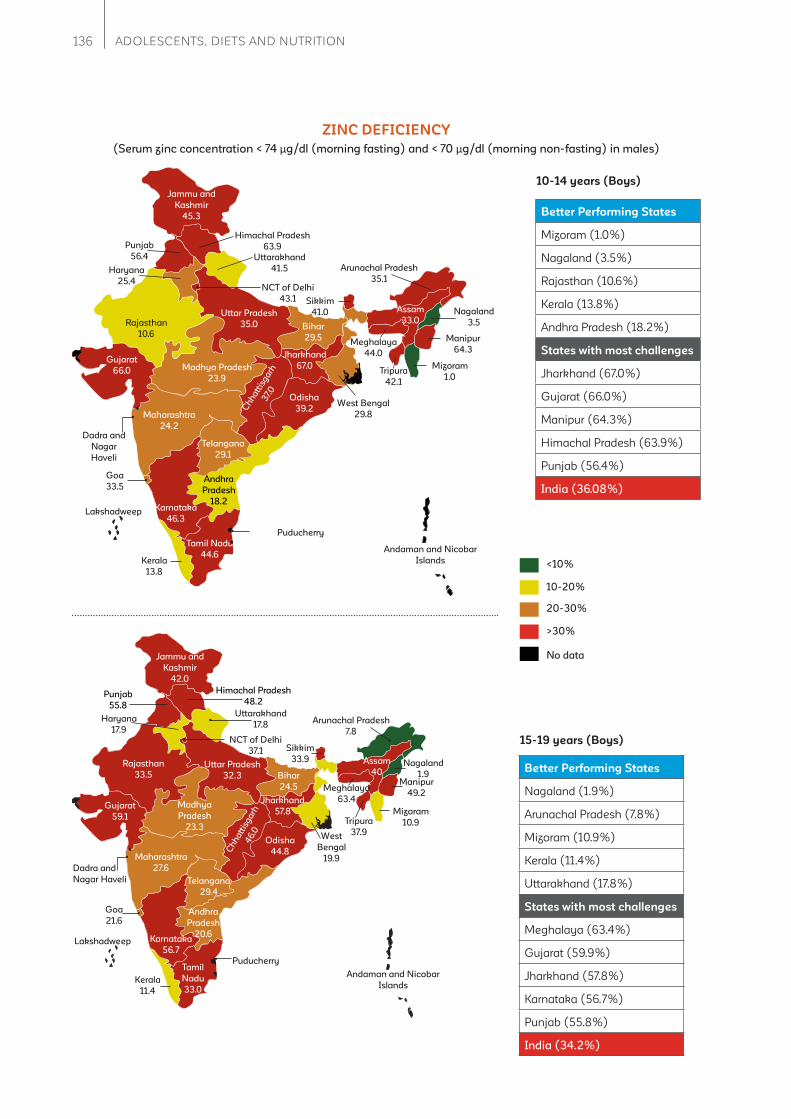
136 ADOLESCENTS, DIETS AND NUTRITION
10-14 years (Boys)
ZINC DEFICIENCY
Uttar Pradesh
35.0
Punjab
56.4
Arunachal Pradesh
35.1
Sikkim
41.0
Bihar
29.5
Jharkhand
67.0
Odisha
39.2
Assam
33.0
West Bengal
29.8
Telangana
29.1
Andhra
Pradesh
18.2
Tamil Nadu
44.6Kerala
13.8
Karnataka
46.3
Maharashtra
24.2
Gujarat
66.0 Madhya Pradesh
23.9
Rajasthan
10.6
NCT of Delhi
43.1
Haryana
25.4
Uttarakhand
41.5
Himachal Pradesh
63.9
Jammu and
Kashmir
45.3
Puducherry
Manipur
64.3
Nagaland
3.5
Mizoram
1.0Tripura
42.1
Meghalaya
44.0
Ch
hatt
isg
arh
37.0
Lakshadweep
Andaman and Nicobar
Islands
Dadra and
Nagar
Haveli
Goa
33.5
Better Performing States
Mizoram (1.0%)
Nagaland (3.5%)
Rajasthan (10.6%)
Kerala (13.8%)
Andhra Pradesh (18.2%)
States with most challenges
Jharkhand (67.0%)
Gujarat (66.0%)
Manipur (64.3%)
Himachal Pradesh (63.9%)
Punjab (56.4%)
India (36.08%)
<10%
10-20%
20-30%
>30%
No data
15-19 years (Boys)
Uttar Pradesh
32.3
Punjab
55.8
Sikkim
33.9
Bihar
24.5
Jharkhand
57.8
Odisha
44.8
Assam
40
West
Bengal
19.9
Telangana
29.4
Andhra
Pradesh
20.6
Tamil
Nadu
33.0Kerala
11.4
Karnataka
56.7
Maharashtra
27.6
Gujarat
59.1
Madhya
Pradesh
23.3
Rajasthan
33.5
NCT of Delhi
37.1
Haryana
17.9
Uttarakhand
17.8
Himachal Pradesh
48.2
Jammu and
Kashmir
42.0
Puducherry
Manipur
49.2
Nagaland
1.9
Mizoram
10.9Tripura
37.9
Meghalaya
63.4
Ch
ha
ttis
ga
rh4
6.0
Lakshadweep
Andaman and Nicobar
Islands
Dadra and
Nagar Haveli
Goa
21.6
Arunachal Pradesh
7.8
Better Performing States
Nagaland (1.9%)
Arunachal Pradesh (7.8%)
Mizoram (10.9%)
Kerala (11.4%)
Uttarakhand (17.8%)
States with most challenges
Meghalaya (63.4%)
Gujarat (59.9%)
Jharkhand (57.8%)
Karnataka (56.7%)
Punjab (55.8%)
India (34.2%)
(Serum zinc concentration < 74 μg/dl (morning fasting) and < 70 μg/dl (morning non-fasting) in males)

137The CNNS Thematic Reports, Issue 1, 2019
10-14 years (Girls )
RISK OF DIABETES
Uttar Pradesh
2.5
Punjab
8.1
Arunachal Pradesh
8.1
Sikkim
1.3
Bihar
2.3
Jharkhand
14.7
Odisha
8.6
Assam
10.8
Telangana
15.5
Andhra
Pradesh
9.6
Tamil Nadu
7.7Kerala
3.7
Karnataka
5.6
Maharashtra
5.4
Gujarat
25.3 Madhya Pradesh
13.6
Rajasthan
11.2
NCT of Delhi
3.1
Haryana
27.3Uttarakhand
7.3
Himachal Pradesh
2.4
Jammu and
Kashmir
7.5
Puducherry
Manipur
16.3
Nagaland
3.5
Mizoram
3.1Tripura
10.6
Meghalaya
3.8
Chhatt
isgarh
16.5
Lakshadweep
Andaman and Nicobar
Islands
Dadra and
Nagar Haveli
Goa
28.4
West
Bengal
3.6
Better Performing States
Sikkim (1.3%)
Bihar (2.3%)
Himachal Pradesh (2.4%)
Uttar Pradesh (2.5%)
Delhi (3.1%)
States with most challenges
Goa (28.4%)
Haryana (27.3%)
Gujarat (25.3%)
Chhattisgarh (16.5%)
Manipur(16.3%)
India (7.9%)
<5%
5–10.9%
>21%
11–20.9%
No Data
Better Performing States
Assam (0.0%)
Nagaland (0.0%)
Sikkim (0.1%)
Madhya Pradesh (1.8%)
Tripura (1.8%)
States with most challenges
Haryana (17.0%)
Karnataka (16.6%)
Goa (16.4%)
Odisha (15.5%)
Kerala (13.5%)
India (7.4%)
Uttar Pradesh
5.7
Punjab
11.0
Sikkim
0.1
Bihar
2.6
Jharkhand
8.8
Odisha
15.5
Assam
0.0
West
Bengal
4.5
Telangana
9.9
Andhra
Pradesh
12.4
Tamil
Nadu
11.2Kerala
13.5
Karnataka
16.6
Maharashtra
10.1
Gujarat
11.6Madhya Pradesh
1.8
Rajasthan
8.5
NCT of Delhi
3.2
Haryana
17.0
Uttarakhand
7.0
Himachal Pradesh
2.0
Jammu and
Kashmir
9.2
Puducherry
Manipur
7.3
Nagaland
0.0
Mizoram
6.8Tripura
1.8
Meghalaya
7.8
Ch
ha
ttis
ga
rh12
.4
Lakshadweep
Andaman and Nicobar
Islands
Dadra and
Nagar Haveli
Goa
16.4
Arunachal Pradesh
4.515-19 years (Girls)
Prevalence of Risk Factors for Non-Communicable Diseases in Adolescent
Girls, CNNS 2016-18
(Glycosylated Haemoglobin (HbA1c) level >5.6% & 6.4%)
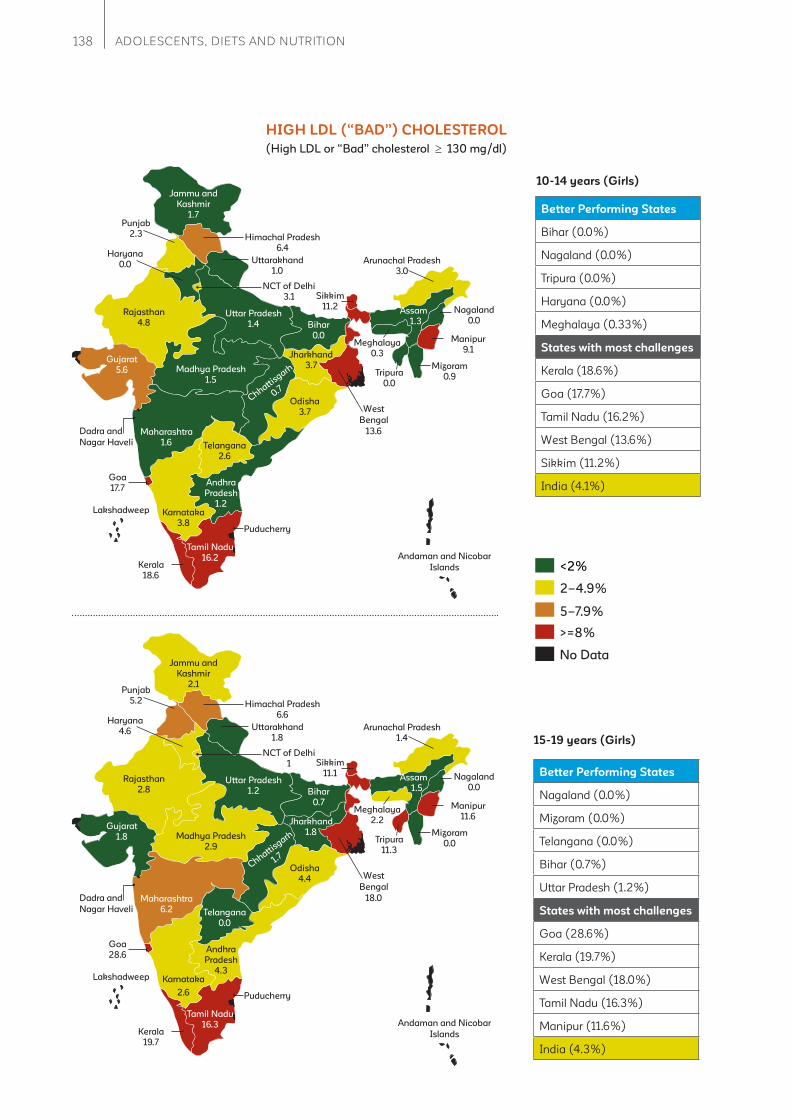
138 ADOLESCENTS, DIETS AND NUTRITION
Uttar Pradesh
1.4
Punjab
2.3
Arunachal Pradesh
3.0
Sikkim
11.2
Bihar
0.0
Jharkhand
3.7
Odisha
3.7
Assam
1.3
Telangana
2.6
Andhra
Pradesh
1.2
Kerala
18.6
Karnataka
3.8
Maharashtra
1.6
Gujarat
5.6 Madhya Pradesh
1.5
Rajasthan
4.8
NCT of Delhi
3.1
Haryana
0.0Uttarakhand
1.0
Himachal Pradesh
6.4
Jammu and
Kashmir
1.7
Puducherry
Manipur
9.1
Nagaland
0.0
Mizoram
0.9Tripura
0.0
Meghalaya
0.3
Chhattisgarh
0.7
Lakshadweep
Andaman and Nicobar
Islands
Dadra and
Nagar Haveli
Goa
17.7
West
Bengal
13.6
Tamil Nadu
16.2
10-14 years (Girls)
HIGH LDL (“BAD”) CHOLESTEROL
Better Performing States
Bihar (0.0%)
Nagaland (0.0%)
Tripura (0.0%)
Haryana (0.0%)
Meghalaya (0.33%)
States with most challenges
Kerala (18.6%)
Goa (17.7%)
Tamil Nadu (16.2%)
West Bengal (13.6%)
Sikkim (11.2%)
India (4.1%)
5–7.9%
<2%
2–4.9%
>=8%
No Data
15-19 years (Girls)
Uttar Pradesh
1.2
Punjab
5.2
Arunachal Pradesh
1.4
Sikkim
11.1
Bihar
0.7
Jharkhand
1.8
Odisha
4.4
Assam
1.5
Telangana
0.0
Andhra
Pradesh
4.3
Kerala
19.7
Karnataka
2.6
Maharashtra
6.2
Gujarat
1.8 Madhya Pradesh
2.9
Rajasthan
2.8
NCT of Delhi
1
Haryana
4.6Uttarakhand
1.8
Himachal Pradesh
6.6
Jammu and
Kashmir
2.1
Puducherry
Manipur
11.6
Nagaland
0.0
Mizoram
0.0Tripura
11.3
Meghalaya
2.2
Chhattisgarh
1.7
Lakshadweep
Andaman and Nicobar
Islands
Dadra and
Nagar Haveli
Goa
28.6
West
Bengal
18.0
Tamil Nadu
16.3
Better Performing States
Nagaland (0.0%)
Mizoram (0.0%)
Telangana (0.0%)
Bihar (0.7%)
Uttar Pradesh (1.2%)
States with most challenges
Goa (28.6%)
Kerala (19.7%)
West Bengal (18.0%)
Tamil Nadu (16.3%)
Manipur (11.6%)
India (4.3%)
(High LDL or “Bad” cholesterol 130 mg/dl)
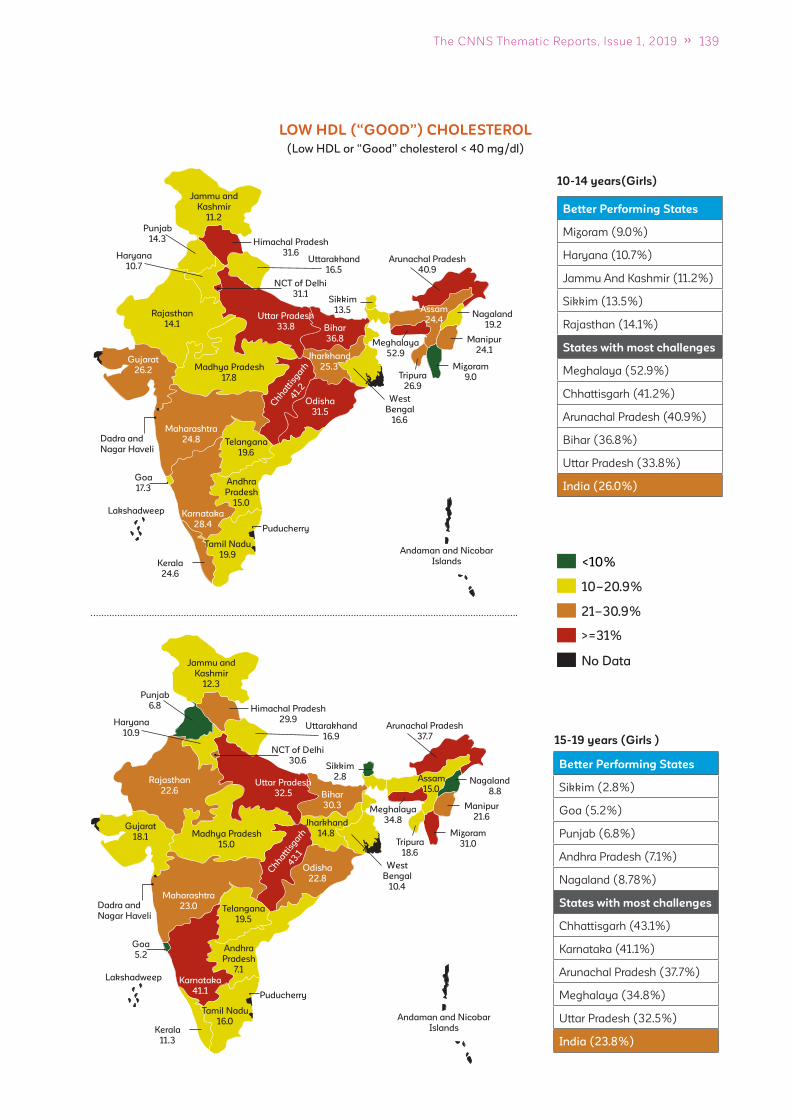
139The CNNS Thematic Reports, Issue 1, 2019
10-14 years(Girls)
LOW HDL (“GOOD”) CHOLESTEROL
Uttar Pradesh
33.8
Punjab
14.3
Arunachal Pradesh
40.9
Sikkim
13.5
Bihar
36.8
Jharkhand
25.3
Odisha
31.5
Assam
24.4
Telangana
19.6
Andhra
Pradesh
15.0
Tamil Nadu
19.9Kerala
24.6
Karnataka
28.4
Maharashtra
24.8
Gujarat
26.2 Madhya Pradesh
17.8
Rajasthan
14.1
NCT of Delhi
31.1
Haryana
10.7Uttarakhand
16.5
Himachal Pradesh
31.6
Jammu and
Kashmir
11.2
Puducherry
Manipur
24.1
Nagaland
19.2
Mizoram
9.0Tripura
26.9
Meghalaya
52.9
Chhatt
isgarh
41.
2
Lakshadweep
Andaman and Nicobar
Islands
Dadra and
Nagar Haveli
Goa
17.3
West
Bengal
16.6
Better Performing States
Mizoram (9.0%)
Haryana (10.7%)
Jammu And Kashmir (11.2%)
Sikkim (13.5%)
Rajasthan (14.1%)
States with most challenges
Meghalaya (52.9%)
Chhattisgarh (41.2%)
Arunachal Pradesh (40.9%)
Bihar (36.8%)
Uttar Pradesh (33.8%)
India (26.0%)
<10%
10–20.9%
>=31%
21–30.9%
No Data
Uttar Pradesh
32.5
Punjab
6.8
Arunachal Pradesh
37.7
Sikkim
2.8
Bihar
30.3
Jharkhand
14.8
Odisha
22.8
Assam
15.0
Telangana
19.5
Andhra
Pradesh
7.1
Tamil Nadu
16.0Kerala
11.3
Karnataka
41.1
Maharashtra
23.0
Gujarat
18.1 Madhya Pradesh
15.0
Rajasthan
22.6
NCT of Delhi
30.6
Haryana
10.9Uttarakhand
16.9
Himachal Pradesh
29.9
Jammu and
Kashmir
12.3
Puducherry
Manipur
21.6
Nagaland
8.8
Mizoram
31.0Tripura
18.6
Meghalaya
34.8
Chhatt
isgarh
43.1
Lakshadweep
Andaman and Nicobar
Islands
Dadra and
Nagar Haveli
Goa
5.2
West
Bengal
10.4
Better Performing States
Sikkim (2.8%)
Goa (5.2%)
Punjab (6.8%)
Andhra Pradesh (7.1%)
Nagaland (8.78%)
States with most challenges
Chhattisgarh (43.1%)
Karnataka (41.1%)
Arunachal Pradesh (37.7%)
Meghalaya (34.8%)
Uttar Pradesh (32.5%)
India (23.8%)
15-19 years (Girls )
(Low HDL or “Good” cholesterol < 40 mg/dl)
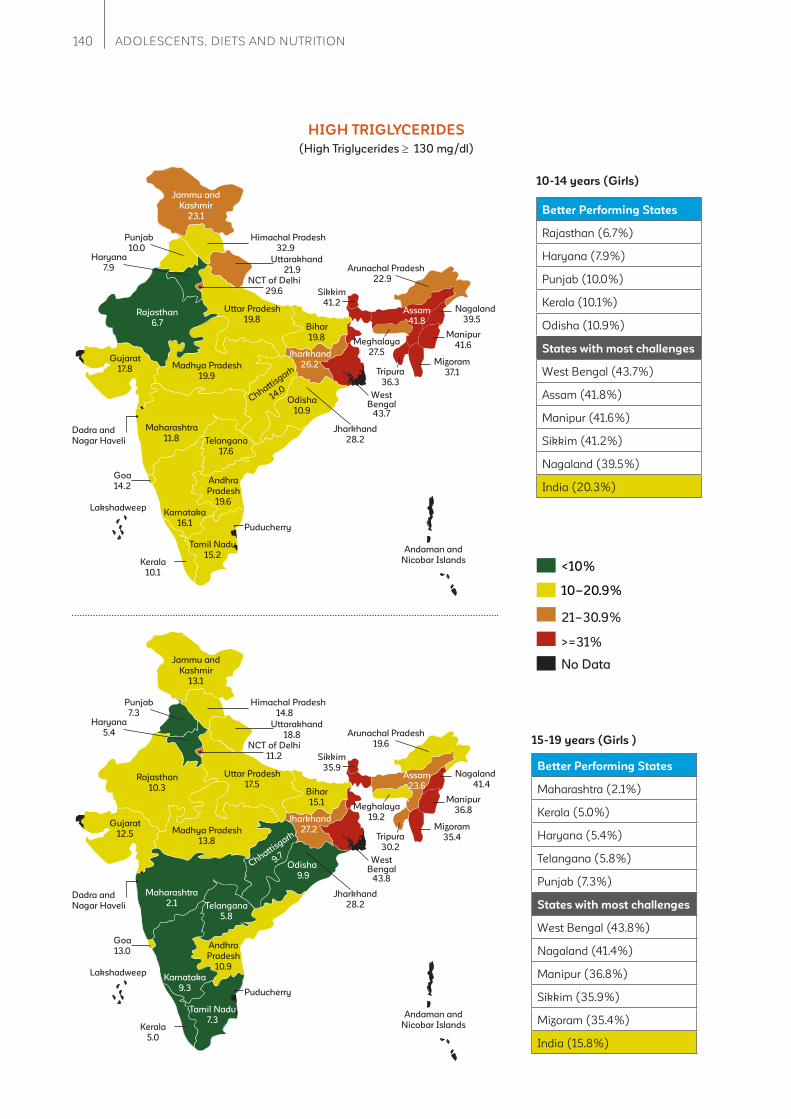
140 ADOLESCENTS, DIETS AND NUTRITION
Uttar Pradesh
19.8
Punjab
10.0
Arunachal Pradesh
22.9
Sikkim
41.2
Bihar
19.8
Jharkhand
28.2
Odisha
10.9
Assam
41.8
Telangana
17.6
Andhra
Pradesh
19.6
Tamil Nadu
15.2Kerala
10.1
Karnataka
16.1
Maharashtra
11.8
Gujarat
17.8 Madhya Pradesh
19.9
Rajasthan
6.7
NCT of Delhi
29.6
Haryana
7.9Uttarakhand
21.9
Himachal Pradesh
32.9
Jammu and
Kashmir
23.1
Puducherry
Manipur
41.6
Nagaland
39.5
Mizoram
37.1Tripura
36.3
Meghalaya
27.5
Chhattisgarh
14.0
Lakshadweep
Andaman and
Nicobar Islands
Dadra and
Nagar Haveli
Goa
14.2
West Bengal
43.7
Jharkhand
26.2
10-14 years (Girls)
HIGH TRIGLYCERIDES
Better Performing States
Rajasthan (6.7%)
Haryana (7.9%)
Punjab (10.0%)
Kerala (10.1%)
Odisha (10.9%)
States with most challenges
West Bengal (43.7%)
Assam (41.8%)
Manipur (41.6%)
Sikkim (41.2%)
Nagaland (39.5%)
India (20.3%)
<10%
10–20.9%
21–30.9%
>=31%
No Data
Better Performing States
Maharashtra (2.1%)
Kerala (5.0%)
Haryana (5.4%)
Telangana (5.8%)
Punjab (7.3%)
States with most challenges
West Bengal (43.8%)
Nagaland (41.4%)
Manipur (36.8%)
Sikkim (35.9%)
Mizoram (35.4%)
India (15.8%)
Uttar Pradesh
17.5
Punjab
7.3
Arunachal Pradesh
19.6
Sikkim
35.9
Bihar
15.1
Jharkhand
28.2
Odisha
9.9
Assam
23.6
Telangana
5.8
Andhra
Pradesh
10.9
Kerala
5.0
Karnataka
9.3
Maharashtra
2.1
Gujarat
12.5 Madhya Pradesh
13.8
Rajasthan
10.3
NCT of Delhi
11.2
Haryana
5.4Uttarakhand
18.8
Himachal Pradesh
14.8
Jammu and
Kashmir
13.1
Puducherry
Manipur
36.8
Nagaland
41.4
Mizoram
35.4Tripura
30.2
Meghalaya
19.2
Chhattisgarh
9.7
Lakshadweep
Andaman and
Nicobar Islands
Dadra and
Nagar Haveli
Goa
13.0
West Bengal
43.8
Jharkhand
27.2
Tamil Nadu
7.3
15-19 years (Girls )
(High Triglycerides 130 mg/dl)

141The CNNS Thematic Reports, Issue 1, 2019
10-14 years (Girls )
HYPERTENSIVE
Uttar Pradesh
6.4
Punjab
0.0
Arunachal Pradesh
2.0Sikkim
0.8
Bihar
5.3
Jharkhand
0.0
Odisha
6.0
Assam
4.4
Telangana
8.3
Andhra
Pradesh
7.1
Tamil Nadu
9.8Kerala
0.0
Karnataka
2.9
Maharashtra
5.4
Gujarat
2.2Madhya Pradesh
6.7
Rajasthan
1.1
NCT of Delhi
9.5
Haryana
0.0
Uttarakhand
0.0
Himachal
Pradesh
5.1
Jammu and
Kashmir
2.0
Puducherry
Manipur
4.3
Nagaland
3.7
Mizoram
NATripura
1.5
Meghalaya
2.7
Chhattisgarh
5.1
Lakshadweep
Andaman and Nicobar
Islands
Dadra and
Nagar Haveli
Goa
4.6
West
Bengal
1.4
Better Performing States
Haryana (0.0%)
Jharkhand (0.0%)
Kerala (0.0%)
Punjab (0.0%)
Uttarakhand (0.0%)
States with most challenges
Tamil Nadu (9.8%)
Delhi (9.5%)
Telangana (8.3%)
Andhra Pradesh (7.1%)
Madhya Pradesh (6.7%)
India (5.0%)
5-7.9%
<2%
2–4.9%
>=8%
No Data
15-19 years (Girls)
Better Performing States
Haryana (0.0%)
Himachal Pradesh (0.0%)
Nagaland (0.0%)
Punjab (0.0%)
Telangana (0.0%)
States with most challenges
Odisha (13.3%)
Uttar Pradesh (11.0%)
Madhya Pradesh (10.4%)
Delhi (9.4%)
Bihar (8.3%)
India (5.0%)
Uttar Pradesh
11.0
Punjab
0.0
Arunachal Pradesh
6.0Sikkim
2.0
Bihar
8.3
Jharkhand
3.2
Odisha
13.3
Assam
4.4
Telangana
0.0
Andhra
Pradesh
2.3
Tamil Nadu
5.6Kerala
0.0
Karnataka
1.9
Maharashtra
3.2
Gujarat
5.1Madhya Pradesh
10.4
Rajasthan
1.7
NCT of Delhi
9.4
Haryana
0.0
Uttarakhand
6.2
Himachal
Pradesh
0.0
Jammu and
Kashmir
3.7
Puducherry
Manipur
7.8
Nagaland
0.0
Mizoram
4.4Tripura
0.5
Meghalaya
7.8
Chhattisgarh
1.9
Lakshadweep
Andaman and Nicobar
Islands
Dadra and
Nagar Haveli
Goa
1.3
West
Bengal
0.0
Assam
15.0
(systolic blood pressure level 140 mmHg, or diastolic blood pressure level 90 mmHg)
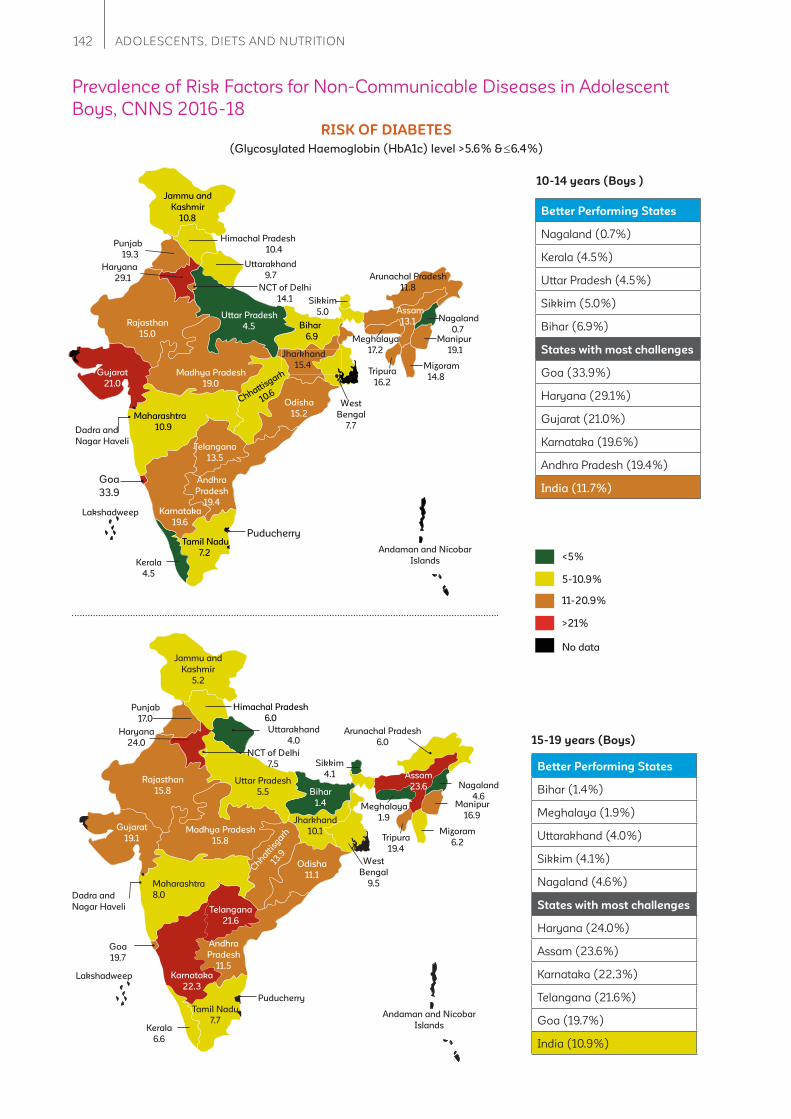
142 ADOLESCENTS, DIETS AND NUTRITION
10-14 years (Boys )
RISK OF DIABETES
Better Performing States
Nagaland (0.7%)
Kerala (4.5%)
Uttar Pradesh (4.5%)
Sikkim (5.0%)
Bihar (6.9%)
States with most challenges
Goa (33.9%)
Haryana (29.1%)
Gujarat (21.0%)
Karnataka (19.6%)
Andhra Pradesh (19.4%)
India (11.7%)
Uttar Pradesh
4.5
Punjab
19.3
Arunachal Pradesh
11.8
Sikkim
5.0
Bihar
6.9
Jharkhand
15.4
Odisha
15.2
Assam
13.1
West
Bengal
7.7
Telangana
13.5
Andhra
Pradesh
19.4
Tamil Nadu
7.2 Kerala
4.5
Karnataka
19.6
Maharashtra
10.9
Gujarat
21.0
Madhya Pradesh
19.0
Rajasthan
15.0
NCT of Delhi
14.1
Haryana
29.1
Uttarakhand
9.7
Himachal Pradesh
10.4
Jammu and
Kashmir
10.8
Puducherry
Manipur
19.1
Nagaland
0.7
Mizoram
14.8 Tripura
16.2
Meghalaya
17.2
Chhattisgarh
10.6
Lakshadweep
Andaman and Nicobar
Islands
Dadra and
Nagar Haveli
Goa
33.9
<5%
5-10.9%
11-20.9%
>21%
No data
Uttar Pradesh
5.5
Punjab
17.0
Sikkim
4.1
Bihar
1.4
Jharkhand
10.1
Odisha
11.1
Assam
23.6
West
Bengal
9.5
Telangana
21.6
Andhra
Pradesh
11.5
Tamil Nadu
7.7Kerala
6.6
Karnataka
22.3
Maharashtra
8.0
Gujarat
19.1Madhya Pradesh
15.8
Rajasthan
15.8
NCT of Delhi
7.5
Haryana
24.0
Uttarakhand
4.0
Himachal Pradesh
6.0
Jammu and
Kashmir
5.2
Puducherry
Manipur
16.9
Nagaland
4.6
Mizoram
6.2Tripura
19.4
Meghalaya
1.9
Chhatt
isgarh
13.9
Lakshadweep
Andaman and Nicobar
Islands
Dadra and
Nagar Haveli
Goa
19.7
Arunachal Pradesh
6.0
Better Performing States
Bihar (1.4%)
Meghalaya (1.9%)
Uttarakhand (4.0%)
Sikkim (4.1%)
Nagaland (4.6%)
States with most challenges
Haryana (24.0%)
Assam (23.6%)
Karnataka (22.3%)
Telangana (21.6%)
Goa (19.7%)
India (10.9%)
15-19 years (Boys)
Prevalence of Risk Factors for Non-Communicable Diseases in Adolescent
Boys, CNNS 2016-18
(Glycosylated Haemoglobin (HbA1c) level >5.6% & 6.4%)

143The CNNS Thematic Reports, Issue 1, 2019
10-14 years (Boys)
HIGH LDL (“BAD”) CHOLESTEROL
Better Performing States
Arunachal Pradesh (0.0%)
Assam (0.0%)
Bihar (0.0%)
Jharkhand (0.0%)
Nagaland (0.0%)
States with most challenges
Tamil Nadu (21.0%)
Sikkim (13.5%)
Kerala (13.4%)
Karnataka (8.6%)
Gujarat (8.0%)
India (3.8%)
Uttar Pradesh
1.9
Punjab
2.4
Arunachal Pradesh
0.0
Sikkim
13.5
Bihar
0.0
Jharkhand
0.0
Odisha
2.4
Assam
0.0
West
Bengal
7.1
Telangana
3.1
Andhra
Pradesh
4.0
Tamil Nadu
21.0Kerala
13.4
Karnataka
8.6
Maharashtra
2.5
Gujarat
8.0
Madhya Pradesh
1.7
Rajasthan
2.0
NCT of Delhi
1.0
Haryana
2.4
Uttarakhand
2.1
Himachal Pradesh
7.4
Jammu and
Kashmir
0.9
Puducherry
Manipur
4.8
Nagaland
0.0
Mizoram
1.3Tripura
4.4
Chhattisgarh
0.4
Lakshadweep
Andaman and Nicobar
Islands
Dadra and
Nagar Haveli
Goa
5.5
<2%
2-4.9%
5-7.9%
>=9%
No data
15-19 years (Boys)
Uttar Pradesh
1.7
Punjab
3.2
Sikkim
18.4
Bihar
1.1
Jharkhand
0.0
Odisha
7.7
Assam
0.3
West
Bengal
11.0
Telangana
0.7
Andhra Pradesh
3.2
Tamil Nadu
3.2Kerala
5.1
Karnataka
1.9
Maharashtra
1.3
Gujarat
8.7Madhya Pradesh
0.6
Rajasthan
1.0
NCT of Delhi
1.2
Haryana
3.5
Uttarakhand
7.0
Himachal Pradesh
3.2
Jammu and
Kashmir
4.1
Puducherry
Manipur
17.6
Nagaland
0.0
Mizoram
0.8Tripura
6.6
Meghalaya
0.0
Chhatt
isgarh
1.8
Lakshadweep
Andaman and Nicobar
Islands
Dadra and
Nagar Haveli
Goa
10.3
Arunachal Pradesh
1.0
Better Performing States
Jharkhand(0.0%)
Meghalaya(0.0%)
Nagaland(0.0%)
Assam(0.3%)
Madhya Pradesh(0.6%)
States with most challenges
Sikkim(18.4%)
Manipur(17.6%)
West Bengal(11.0%)
Goa(10.3%)
Gujarat(8.7%)
India (3.0%)
(High LDL or “Bad” cholesterol 130 mg/dl)

144 ADOLESCENTS, DIETS AND NUTRITION
10-14 years (Boys)
LOW HDL (“GOOD”) CHOLESTEROL
Better Performing States
Nagaland (2.5%)
West Bengal (5.8%)
Punjab (7.9%)
Tamil Nadu (7.9%)
Sikkim (8.6%)
States with most challenges
Meghalaya (50.3%)
Chhattisgarh (46.6%)
Uttar Pradesh (40.3%)
Arunachal Pradesh (34.8%)
Bihar (33.1%)
India (25.6%)
Uttar Pradesh
40.3
Punjab
7.9
Arunachal Pradesh
34.8
Sikkim
8.6
Bihar
33.1
Jharkhand
32.6
Odisha
16.8
Assam
22.6
West
Bengal
5.8
Telangana
15.7
Andhra
Pradesh
18.0
Tamil Nadu
7.9Kerala
14.4
Karnataka
28.7
Maharashtra
13.6
Gujarat
27.0
Madhya Pradesh
32.3
Rajasthan
14.5
NCT of Delhi
31.4
Haryana
10.2
Uttarakhand
18.7
Himachal Pradesh 11.6
Jammu and
Kashmir
16.9
Puducherry
Manipur
26.7
Nagaland
2.5
Mizoram
17.9Tripura
13.9
Meghalaya
50.350.3
Chhattisgarh
46.6
Lakshadweep
Andaman and Nicobar
Islands
Dadra and
Nagar Haveli
Goa
17.4
<10%
10-20.9%
21-30.9%
>=31%
No data
15-19 years (Boys)
Uttar Pradesh
53.9
Punjab
18.5
Sikkim
14.9
Bihar
48.4
Jharkhand
16.3
Odisha
35.5
Assam
35.7
West
Bengal
14.6
Telangana
46.3
Andhra Pradesh
11.5
Tamil Nadu
36.7Kerala
36.4
Karnataka
55.4
Maharashtra
36.1
Gujarat
30.2Madhya Pradesh
38.5
Rajasthan
23.2
NCT of Delhi
64.5
Haryana
18.2
Uttarakhand
31.5
Himachal Pradesh
35.5
Jammu and
Kashmir
26.4
Puducherry
Manipur
26.9
Nagaland
7.9
Mizoram
20.3Tripura
29.7
Meghalaya
60.6
Chhatt
isgarh
56.5
Lakshadweep
Andaman and Nicobar
Islands
Dadra and
Nagar Haveli
Goa
27.0
Arunachal Pradesh
47.6
Better Performing States
Nagaland (7.9%)
West Bengal (14.6%)
Sikkim (14.9%)
Jharkhand (16.3%)
Haryana (18.2%)
States with most challenges
Delhi (64.5%)
Meghalaya (60.6%)
Chhattisgarh (56.5%)
Karnataka (55.4%)
Uttar Pradesh (53.9%)
India (38.6%)
(Low HDL or “Good” cholesterol < 40 mg/dl)
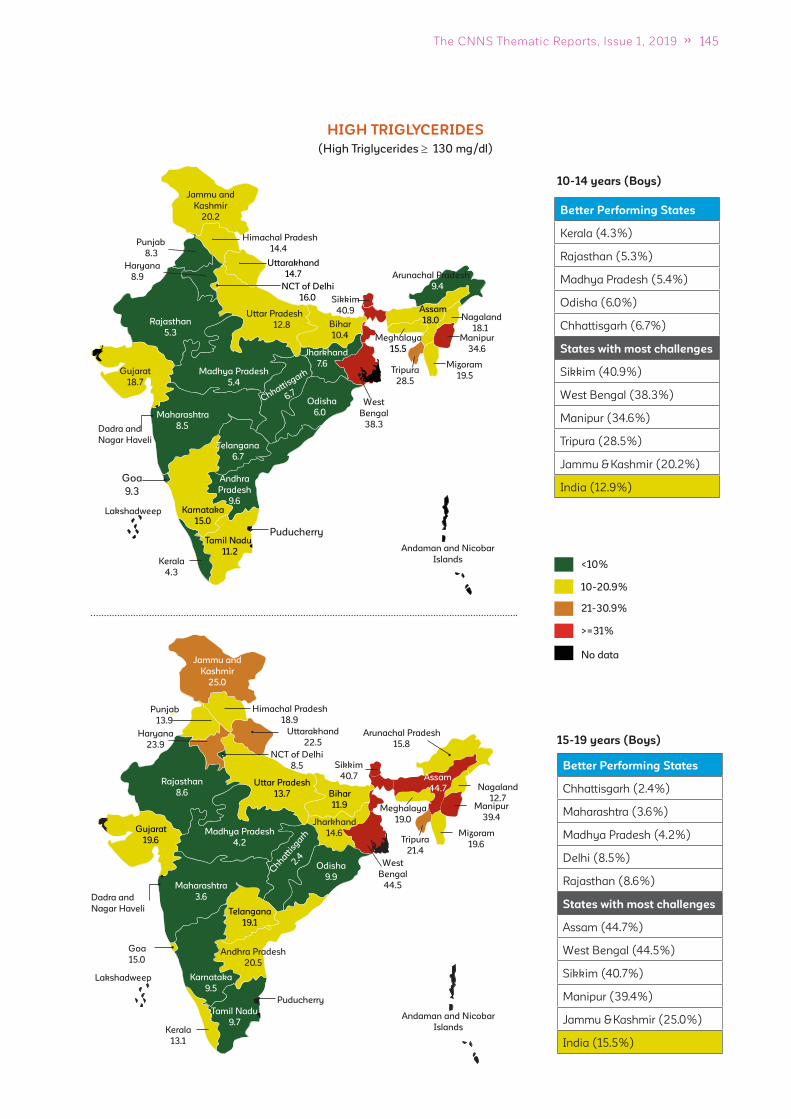
145The CNNS Thematic Reports, Issue 1, 2019
10-14 years (Boys)
HIGH TRIGLYCERIDES
Better Performing States
Kerala (4.3%)
Rajasthan (5.3%)
Madhya Pradesh (5.4%)
Odisha (6.0%)
Chhattisgarh (6.7%)
States with most challenges
Sikkim (40.9%)
West Bengal (38.3%)
Manipur (34.6%)
Tripura (28.5%)
Jammu & Kashmir (20.2%)
India (12.9%)
Uttar Pradesh
12.8
Punjab
8.3
Arunachal Pradesh
9.4
Sikkim
40.9
Bihar
10.4
Jharkhand
7.6
Odisha
6.0
Assam
18.0
West
Bengal
38.3
Telangana
6.7
Andhra
Pradesh
9.6
Tamil Nadu
11.2Kerala
4.3
Karnataka
15.0
Maharashtra
8.5
Gujarat
18.7
Madhya Pradesh
5.4
Rajasthan
5.3
NCT of Delhi
16.0
Haryana
8.9
Uttarakhand
14.7
Himachal Pradesh
14.4
Jammu and
Kashmir
20.2
Puducherry
Manipur
34.6
Nagaland
18.1
Mizoram
19.5Tripura
28.5
Meghalaya
15.515.5
Chhattisgarh
6.7
Lakshadweep
Andaman and Nicobar
Islands
Dadra and
Nagar Haveli
Goa
9.3
<10%
10-20.9%
21-30.9%
>=31%
No data
15-19 years (Boys)
Uttar Pradesh
13.7
Punjab
13.9
Sikkim
40.7
Bihar
11.9
Jharkhand
14.6
Odisha
9.9
Assam
44.7
West
Bengal
44.5
Telangana
19.1
Andhra Pradesh
20.5
Tamil Nadu
9.7Kerala
13.1
Karnataka
9.5
Maharashtra
3.6
Gujarat
19.6Madhya Pradesh
4.2
Rajasthan
8.6
NCT of Delhi
8.5
Haryana
23.9
Uttarakhand
22.5
Himachal Pradesh
18.9
Jammu and
Kashmir
25.0
Puducherry
Manipur
39.4
Nagaland
12.7
Mizoram
19.6Tripura
21.4
Meghalaya
19.0
Chhatt
isgarh
2.4
Lakshadweep
Andaman and Nicobar
Islands
Dadra and
Nagar Haveli
Goa
15.0
Arunachal Pradesh
15.8
Better Performing States
Chhattisgarh (2.4%)
Maharashtra (3.6%)
Madhya Pradesh (4.2%)
Delhi (8.5%)
Rajasthan (8.6%)
States with most challenges
Assam (44.7%)
West Bengal (44.5%)
Sikkim (40.7%)
Manipur (39.4%)
Jammu & Kashmir (25.0%)
India (15.5%)
(High Triglycerides 130 mg/dl)
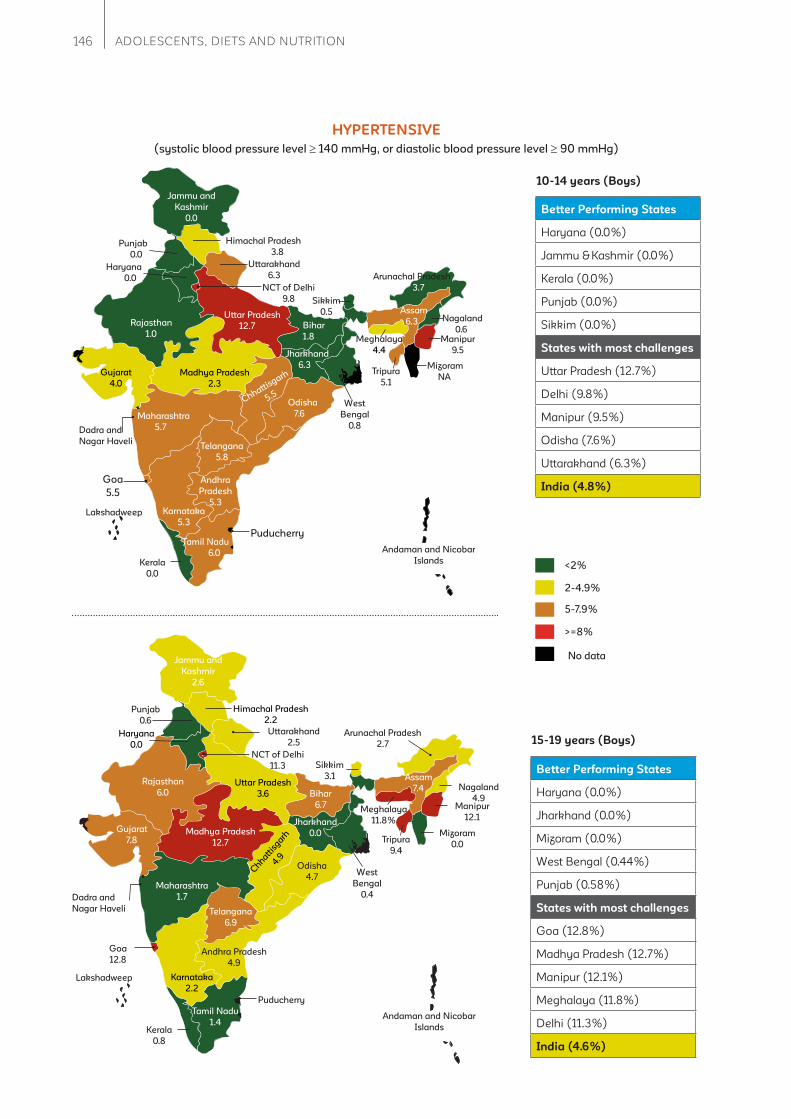
146 ADOLESCENTS, DIETS AND NUTRITION
10-14 years (Boys)
HYPERTENSIVE
Better Performing States
Haryana (0.0%)
Jammu & Kashmir (0.0%)
Kerala (0.0%)
Punjab (0.0%)
Sikkim (0.0%)
States with most challenges
Uttar Pradesh (12.7%)
Delhi (9.8%)
Manipur (9.5%)
Odisha (7.6%)
Uttarakhand (6.3%)
India (4.8%)
Uttar Pradesh
12.7
Punjab
0.0
Arunachal Pradesh
3.7
Sikkim
0.5
Bihar
1.8
Jharkhand
6.3
Odisha
7.6
Assam
6.3
West
Bengal
0.8
Telangana
5.8
Andhra
Pradesh
5.3
Tamil Nadu
6.0Kerala
0.0
Karnataka
5.3
Maharashtra
5.7
Gujarat
4.0
Madhya Pradesh
2.3
Rajasthan
1.0
NCT of Delhi
9.8
Haryana
0.0
Uttarakhand
6.3
Himachal Pradesh
3.8
Jammu and
Kashmir
0.0
Puducherry
Manipur
9.5
Nagaland
0.6
Mizoram
NATripura
5.1
Meghalaya
4.44.4
Chhattisgarh
5.5
Lakshadweep
Andaman and Nicobar
Islands
Dadra and
Nagar Haveli
Goa
5.5
<2%
2-4.9%
5-7.9%
>=8%
No data
Uttar Pradesh
3.6
Punjab
0.6
Sikkim
3.1
Bihar
6.7
Jharkhand
0.0
Odisha
4.7
Assam
7.4
West
Bengal
0.4
Telangana
6.9
Andhra Pradesh
4.9
Tamil Nadu
1.4Kerala
0.8
Karnataka
2.2
Maharashtra
1.7
Gujarat
7.8Madhya Pradesh
12.7
Rajasthan
6.0
NCT of Delhi
11.3
Haryana
0.0
Uttarakhand
2.5
Himachal Pradesh
2.2
Jammu and
Kashmir
2.6
Puducherry
Manipur
12.1
Nagaland
4.9
Mizoram
0.0Tripura
9.4
Chhatt
isgarh
4.9
Lakshadweep
Andaman and Nicobar
Islands
Dadra and
Nagar Haveli
Goa
12.8
Arunachal Pradesh
2.7
Better Performing States
Haryana (0.0%)
Jharkhand (0.0%)
Mizoram (0.0%)
West Bengal (0.44%)
Punjab (0.58%)
States with most challenges
Goa (12.8%)
Madhya Pradesh (12.7%)
Manipur (12.1%)
Meghalaya (11.8%)
Delhi (11.3%)
India (4.6%)
15-19 years (Boys)
Meghalaya
11.8%
(systolic blood pressure level 140 mmHg, or diastolic blood pressure level 90 mmHg)

147The CNNS Thematic Reports, Issue 1, 2019
Annexure 1: Sociodemographic characteristics of
analytical sample based on which fi ndings are
presented in this report
Sociodemographic
characteristics (%)
Age group
10-14 years 15-19 years
Overall Girls Boys Overall Girls Boys
Schooling Status
Currently in School 86 85 87 63 59 67
Not in School 14 15 13 37 41 33
Residence
Urban 24 24 24 26 25 27
Rural 76 76 76 74 75 73
Religion
Hindu 80 79 81 80 79 82
Muslim 15 16 15 15 16 14
Christian 2 2 2 2 2 2
Sikh 1 1 1 1 1 1
Others 1 1 1 1 1 1
Caste/Tribe
Scheduled Caste 22 22 23 23 23 23
Schedulef Tribe 11 10 12 11 12 10
Other Backward Class 41 42 40 42 42 43
Other 26 26 25 24 23 25
Wealth Index
Poorest 22 21 22 18 20 16
Poor 21 21 21 19 19 19
Middle 19 19 19 21 20 21
Rich 19 20 18 21 21 22
Richest 19 18 20 21 20 21
Mother's Education
No schooling 50 51 49 56 58 54
<5 years completed 7 7 7 7 6 7
(Continued)
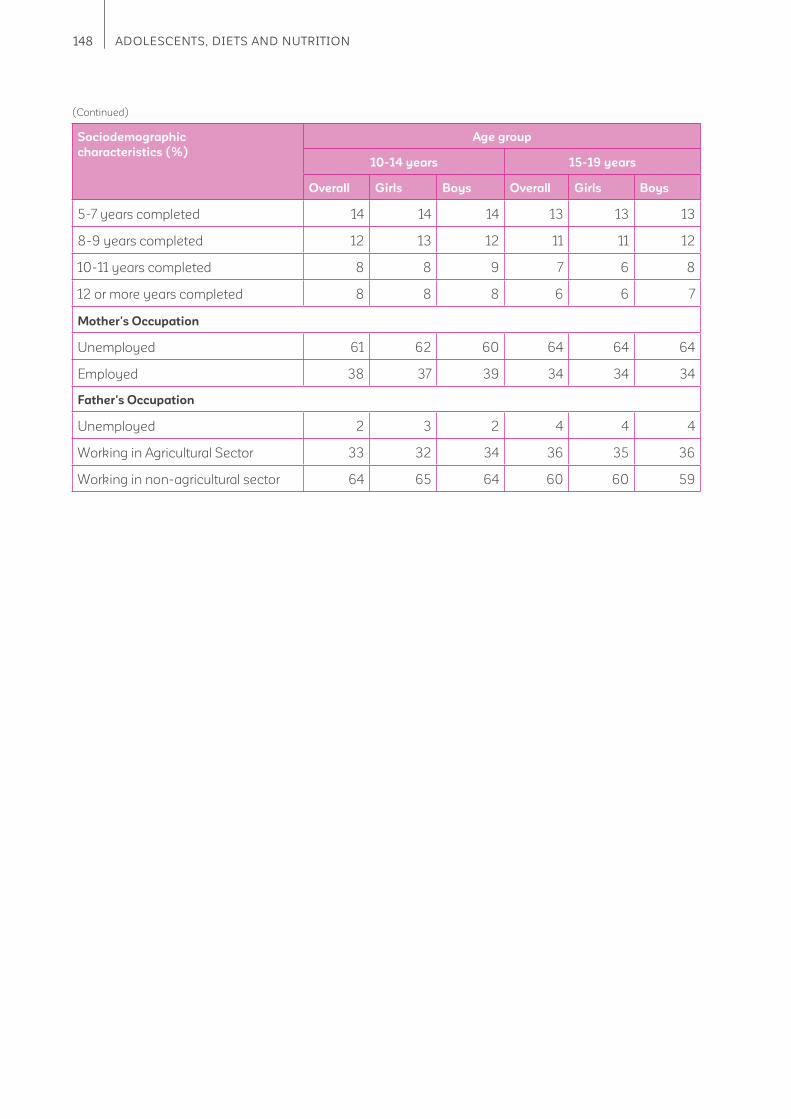
148 ADOLESCENTS, DIETS AND NUTRITION
Sociodemographic
characteristics (%)
Age group
10-14 years 15-19 years
Overall Girls Boys Overall Girls Boys
5-7 years completed 14 14 14 13 13 13
8-9 years completed 12 13 12 11 11 12
10-11 years completed 8 8 9 7 6 8
12 or more years completed 8 8 8 6 6 7
Mother's Occupation
Unemployed 61 62 60 64 64 64
Employed 38 37 39 34 34 34
Father's Occupation
Unemployed 2 3 2 4 4 4
Working in Agricultural Sector 33 32 34 36 35 36
Working in non-agricultural sector 64 65 64 60 60 59
(Continued)
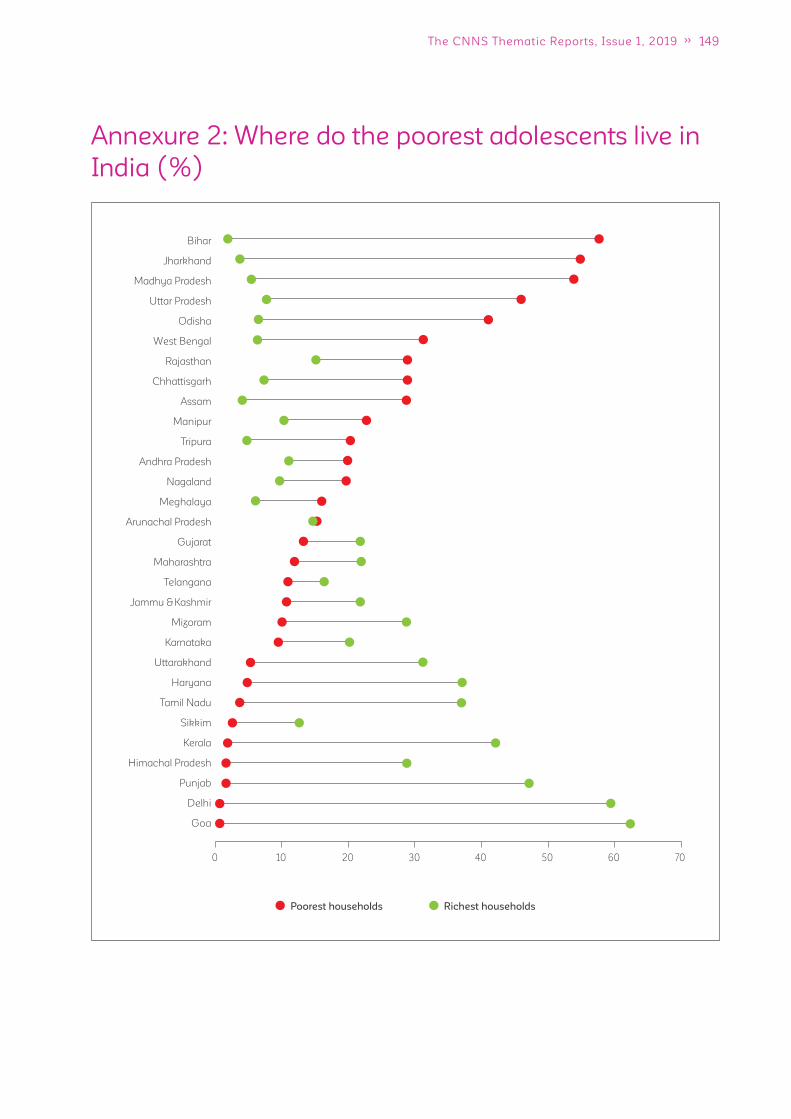
149The CNNS Thematic Reports, Issue 1, 2019
Richest householdsPoorest households
Bihar
Jharkhand
Madhya Pradesh
Uttar Pradesh
Odisha
West Bengal
Rajasthan
Chhattisgarh
Assam
Manipur
Tripura
Andhra Pradesh
Nagaland
Meghalaya
Arunachal Pradesh
Gujarat
Maharashtra
Telangana
Jammu & Kashmir
Mizoram
Karnataka
Uttarakhand
Haryana
Tamil Nadu
Sikkim
Kerala
Himachal Pradesh
Punjab
Delhi
Goa
0 10 20 30 40 50 60 70
Annexure 2: Where do the poorest adolescents live in
India (%)
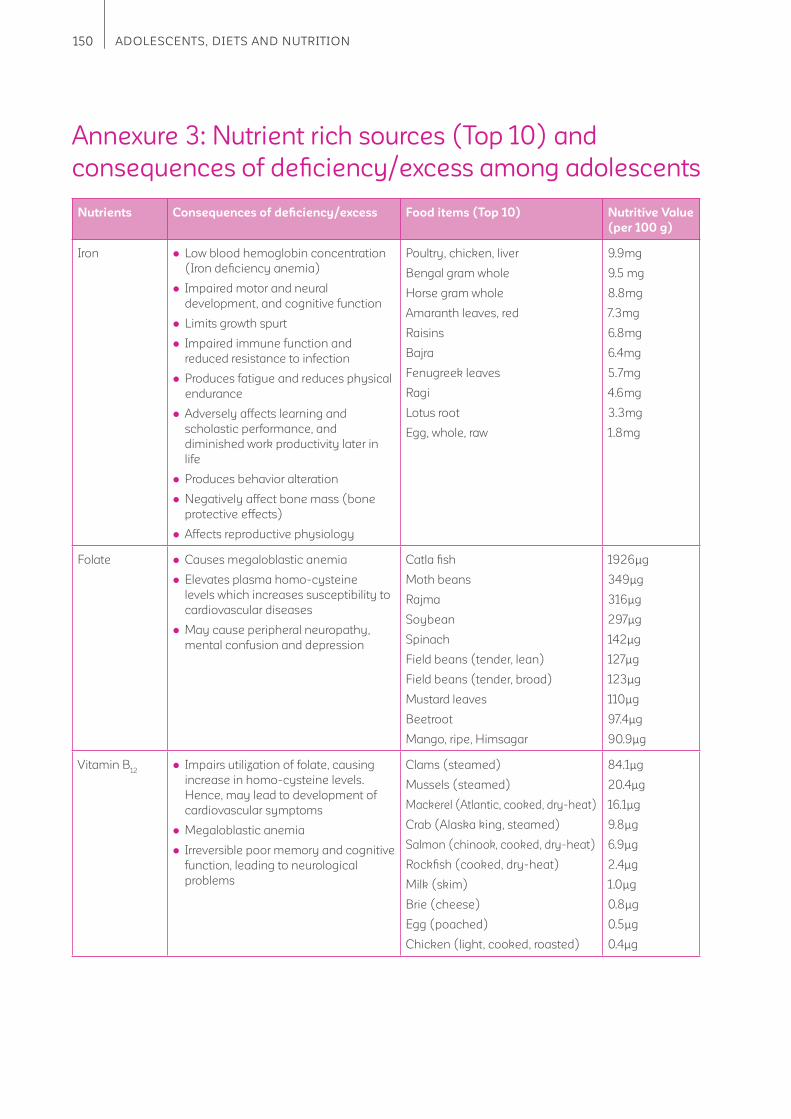
150 ADOLESCENTS, DIETS AND NUTRITION
Annexure 3: Nutrient rich sources (Top 10) and
consequences of defi ciency/excess among adolescents
Nutrients Consequences of defi ciency/excess Food items (Top 10) Nutritive Value
(per 100 g)
Iron Low blood hemoglobin concentration
(Iron defi ciency anemia)
Impaired motor and neural
development, and cognitive function
Limits growth spurt
Impaired immune function and
reduced resistance to infection
Produces fatigue and reduces physical
endurance
Adversely affects learning and
scholastic performance, and
diminished work productivity later in
life
Produces behavior alteration
Negatively affect bone mass (bone
protective effects)
Affects reproductive physiology
Poultry, chicken, liver
Bengal gram whole
Horse gram whole
Amaranth leaves, red
Raisins
Bajra
Fenugreek leaves
Ragi
Lotus root
Egg, whole, raw
9.9mg
9.5 mg
8.8mg
7.3mg
6.8mg
6.4mg
5.7mg
4.6mg
3.3mg
1.8mg
Folate Causes megaloblastic anemia
Elevates plasma homo-cysteine
levels which increases susceptibility to
cardiovascular diseases
May cause peripheral neuropathy,
mental confusion and depression
Catla fi sh
Moth beans
Rajma
Soybean
Spinach
Field beans (tender, lean)
Field beans (tender, broad)
Mustard leaves
Beetroot
Mango, ripe, Himsagar
1926μg
349μg
316μg
297μg
142μg
127μg
123μg
110μg
97.4μg
90.9μg
Vitamin B12
Impairs utilization of folate, causing
increase in homo-cysteine levels.
Hence, may lead to development of
cardiovascular symptoms
Megaloblastic anemia
Irreversible poor memory and cognitive
function, leading to neurological
problems
Clams (steamed)
Mussels (steamed)
Mackerel (Atlantic, cooked, dry-heat)
Crab (Alaska king, steamed)
Salmon (chinook, cooked, dry-heat)
Rockfi sh (cooked, dry-heat)
Milk (skim)
Brie (cheese)
Egg (poached)
Chicken (light, cooked, roasted)
84.1μg
20.4μg
16.1μg
9.8μg
6.9μg
2.4μg
1.0μg
0.8μg
0.5μg
0.4μg
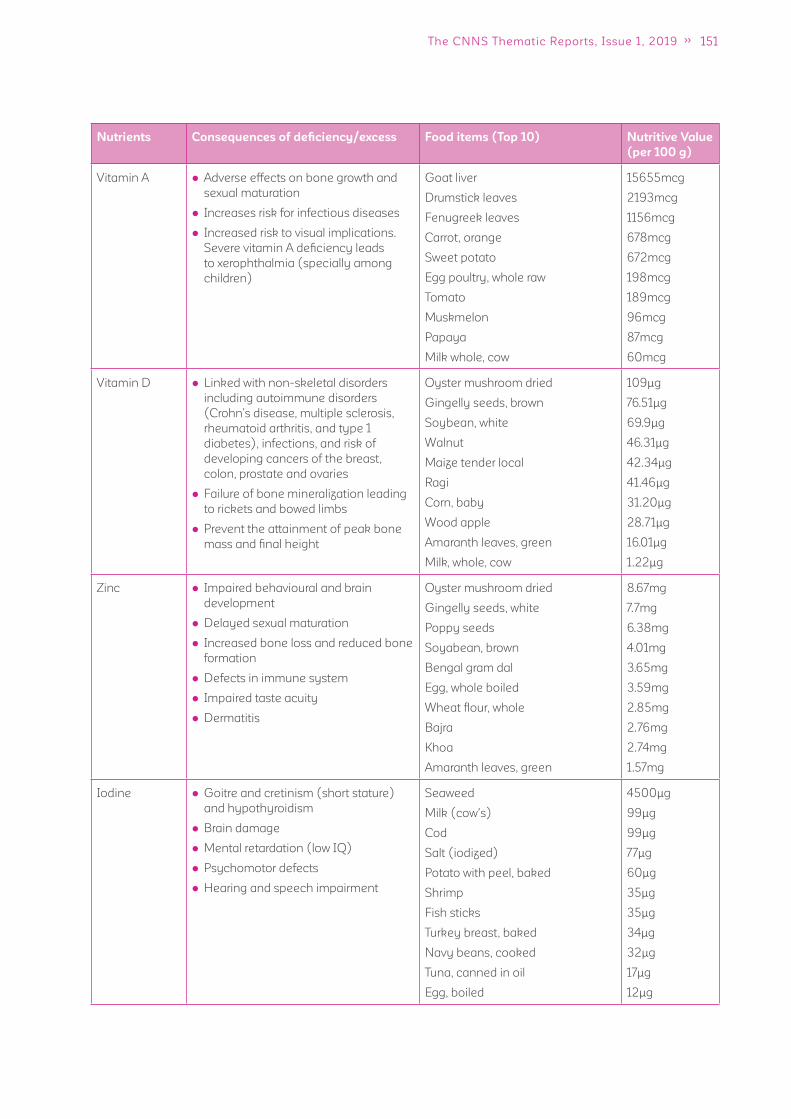
151The CNNS Thematic Reports, Issue 1, 2019
Nutrients Consequences of defi ciency/excess Food items (Top 10) Nutritive Value
(per 100 g)
Vitamin A Adverse effects on bone growth and
sexual maturation
Increases risk for infectious diseases
Increased risk to visual implications.
Severe vitamin A defi ciency leads
to xerophthalmia (specially among
children)
Goat liver
Drumstick leaves
Fenugreek leaves
Carrot, orange
Sweet potato
Egg poultry, whole raw
Tomato
Muskmelon
Papaya
Milk whole, cow
15655mcg
2193mcg
1156mcg
678mcg
672mcg
198mcg
189mcg
96mcg
87mcg
60mcg
Vitamin D Linked with non-skeletal disorders
including autoimmune disorders
(Crohn’s disease, multiple sclerosis,
rheumatoid arthritis, and type 1
diabetes), infections, and risk of
developing cancers of the breast,
colon, prostate and ovaries
Failure of bone mineralization leading
to rickets and bowed limbs
Prevent the attainment of peak bone
mass and fi nal height
Oyster mushroom dried
Gingelly seeds, brown
Soybean, white
Walnut
Maize tender local
Ragi
Corn, baby
Wood apple
Amaranth leaves, green
Milk, whole, cow
109μg
76.51μg
69.9μg
46.31μg
42.34μg
41.46μg
31.20μg
28.71μg
16.01μg
1.22μg
Zinc Impaired behavioural and brain
development
Delayed sexual maturation
Increased bone loss and reduced bone
formation
Defects in immune system
Impaired taste acuity
Dermatitis
Oyster mushroom dried
Gingelly seeds, white
Poppy seeds
Soyabean, brown
Bengal gram dal
Egg, whole boiled
Wheat fl our, whole
Bajra
Khoa
Amaranth leaves, green
8.67mg
7.7mg
6.38mg
4.01mg
3.65mg
3.59mg
2.85mg
2.76mg
2.74mg
1.57mg
Iodine Goitre and cretinism (short stature)
and hypothyroidism
Brain damage
Mental retardation (low IQ)
Psychomotor defects
Hearing and speech impairment
Seaweed
Milk (cow's)
Cod
Salt (iodized)
Potato with peel, baked
Shrimp
Fish sticks
Turkey breast, baked
Navy beans, cooked
Tuna, canned in oil
Egg, boiled
4500μg
99μg
99μg
77μg
60μg
35μg
35μg
34μg
32μg
17μg
12μg
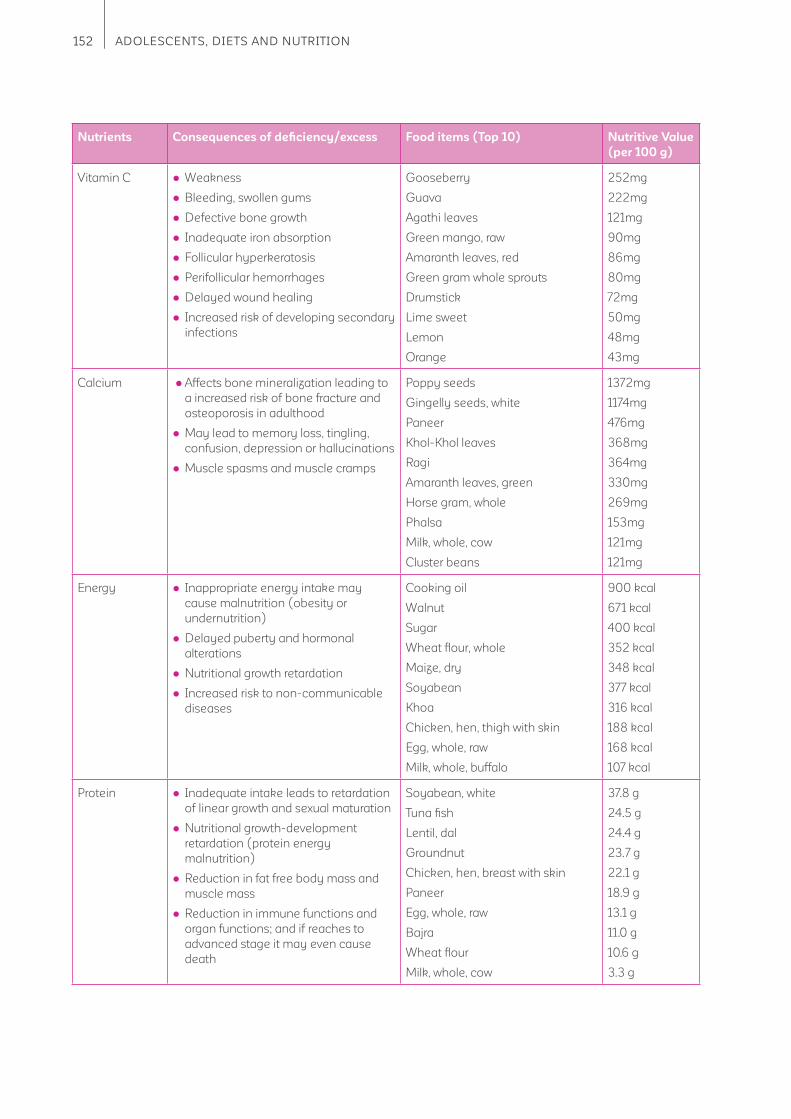
152 ADOLESCENTS, DIETS AND NUTRITION
Nutrients Consequences of defi ciency/excess Food items (Top 10) Nutritive Value
(per 100 g)
Vitamin C Weakness
Bleeding, swollen gums
Defective bone growth
Inadequate iron absorption
Follicular hyperkeratosis
Perifollicular hemorrhages
Delayed wound healing
Increased risk of developing secondary
infections
Gooseberry
Guava
Agathi leaves
Green mango, raw
Amaranth leaves, red
Green gram whole sprouts
Drumstick
Lime sweet
Lemon
Orange
252mg
222mg
121mg
90mg
86mg
80mg
72mg
50mg
48mg
43mg
Calcium Affects bone mineralization leading to
a increased risk of bone fracture and
osteoporosis in adulthood
May lead to memory loss, tingling,
confusion, depression or hallucinations
Muscle spasms and muscle cramps
Poppy seeds
Gingelly seeds, white
Paneer
Khol-Khol leaves
Ragi
Amaranth leaves, green
Horse gram, whole
Phalsa
Milk, whole, cow
Cluster beans
1372mg
1174mg
476mg
368mg
364mg
330mg
269mg
153mg
121mg
121mg
Energy Inappropriate energy intake may
cause malnutrition (obesity or
undernutrition)
Delayed puberty and hormonal
alterations
Nutritional growth retardation
Increased risk to non-communicable
diseases
Cooking oil
Walnut
Sugar
Wheat fl our, whole
Maize, dry
Soyabean
Khoa
Chicken, hen, thigh with skin
Egg, whole, raw
Milk, whole, buffalo
900 kcal
671 kcal
400 kcal
352 kcal
348 kcal
377 kcal
316 kcal
188 kcal
168 kcal
107 kcal
Protein Inadequate intake leads to retardation
of linear growth and sexual maturation
Nutritional growth-development
retardation (protein energy
malnutrition)
Reduction in fat free body mass and
muscle mass
Reduction in immune functions and
organ functions; and if reaches to
advanced stage it may even cause
death
Soyabean, white
Tuna fi sh
Lentil, dal
Groundnut
Chicken, hen, breast with skin
Paneer
Egg, whole, raw
Bajra
Wheat fl our
Milk, whole, cow
37.8 g
24.5 g
24.4 g
23.7 g
22.1 g
18.9 g
13.1 g
11.0 g
10.6 g
3.3 g
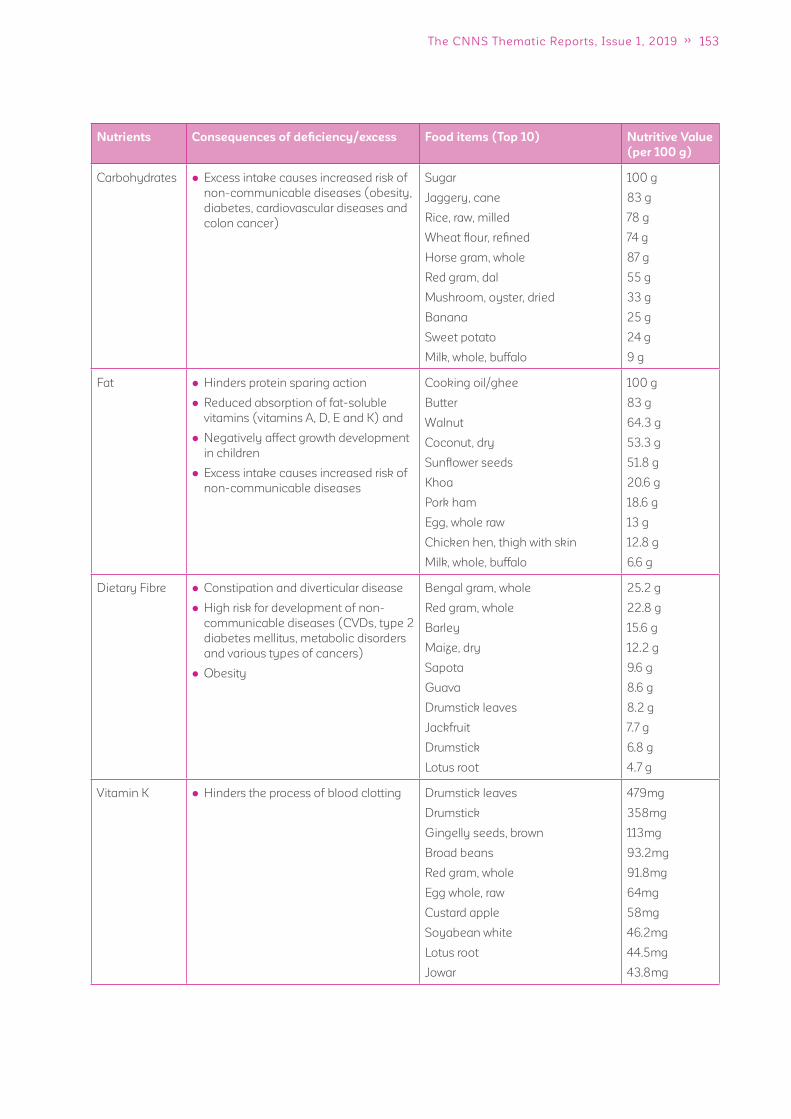
153The CNNS Thematic Reports, Issue 1, 2019
Nutrients Consequences of defi ciency/excess Food items (Top 10) Nutritive Value
(per 100 g)
Carbohydrates Excess intake causes increased risk of
non-communicable diseases (obesity,
diabetes, cardiovascular diseases and
colon cancer)
Sugar
Jaggery, cane
Rice, raw, milled
Wheat fl our, refi ned
Horse gram, whole
Red gram, dal
Mushroom, oyster, dried
Banana
Sweet potato
Milk, whole, buffalo
100 g
83 g
78 g
74 g
87 g
55 g
33 g
25 g
24 g
9 g
Fat Hinders protein sparing action
Reduced absorption of fat-soluble
vitamins (vitamins A, D, E and K) and
Negatively affect growth development
in children
Excess intake causes increased risk of
non-communicable diseases
Cooking oil/ghee
Butter
Walnut
Coconut, dry
Sunfl ower seeds
Khoa
Pork ham
Egg, whole raw
Chicken hen, thigh with skin
Milk, whole, buffalo
100 g
83 g
64.3 g
53.3 g
51.8 g
20.6 g
18.6 g
13 g
12.8 g
6.6 g
Dietary Fibre Constipation and diverticular disease
High risk for development of non-
communicable diseases (CVDs, type 2
diabetes mellitus, metabolic disorders
and various types of cancers)
Obesity
Bengal gram, whole
Red gram, whole
Barley
Maize, dry
Sapota
Guava
Drumstick leaves
Jackfruit
Drumstick
Lotus root
25.2 g
22.8 g
15.6 g
12.2 g
9.6 g
8.6 g
8.2 g
7.7 g
6.8 g
4.7 g
Vitamin K Hinders the process of blood clotting Drumstick leaves
Drumstick
Gingelly seeds, brown
Broad beans
Red gram, whole
Egg whole, raw
Custard apple
Soyabean white
Lotus root
Jowar
479mg
358mg
113mg
93.2mg
91.8mg
64mg
58mg
46.2mg
44.5mg
43.8mg
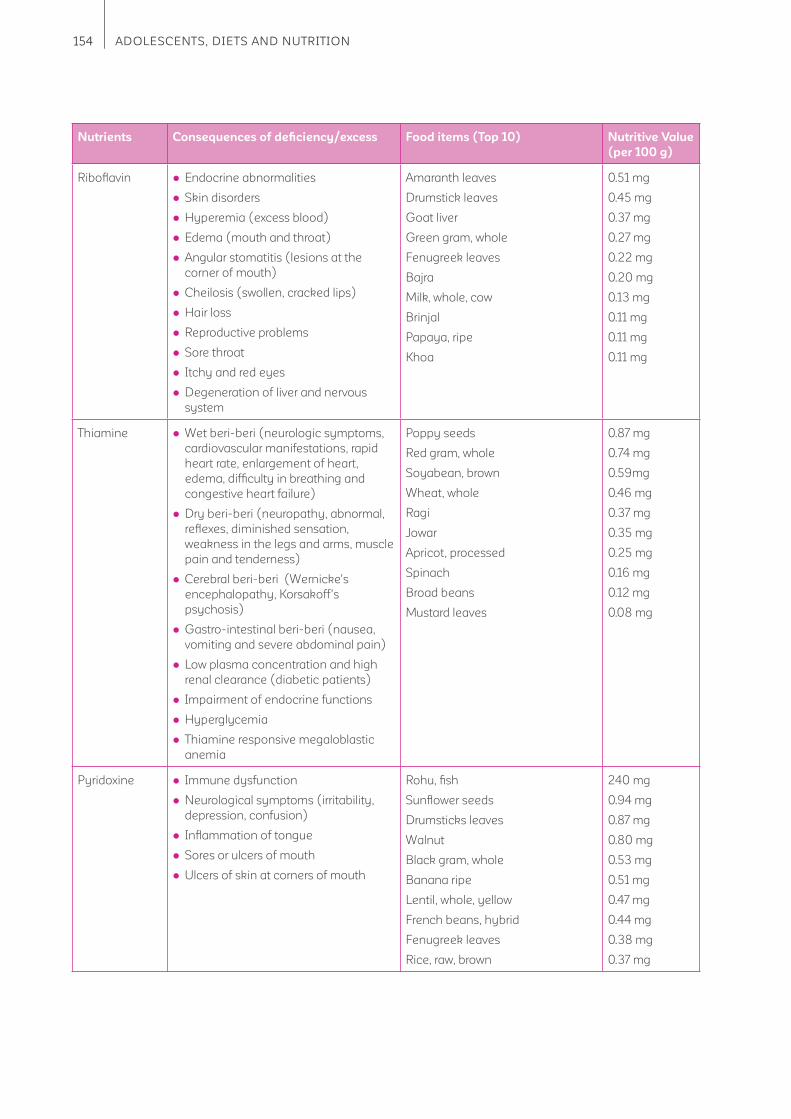
154 ADOLESCENTS, DIETS AND NUTRITION
Nutrients Consequences of defi ciency/excess Food items (Top 10) Nutritive Value
(per 100 g)
Ribofl avin Endocrine abnormalities
Skin disorders
Hyperemia (excess blood)
Edema (mouth and throat)
Angular stomatitis (lesions at the
corner of mouth)
Cheilosis (swollen, cracked lips)
Hair loss
Reproductive problems
Sore throat
Itchy and red eyes
Degeneration of liver and nervous
system
Amaranth leaves
Drumstick leaves
Goat liver
Green gram, whole
Fenugreek leaves
Bajra
Milk, whole, cow
Brinjal
Papaya, ripe
Khoa
0.51 mg
0.45 mg
0.37 mg
0.27 mg
0.22 mg
0.20 mg
0.13 mg
0.11 mg
0.11 mg
0.11 mg
Thiamine Wet beri-beri (neurologic symptoms,
cardiovascular manifestations, rapid
heart rate, enlargement of heart,
edema, diffi culty in breathing and
congestive heart failure)
Dry beri-beri (neuropathy, abnormal,
refl exes, diminished sensation,
weakness in the legs and arms, muscle
pain and tenderness)
Cerebral beri-beri (Wernicke's
encephalopathy, Korsakoff's
psychosis)
Gastro-intestinal beri-beri (nausea,
vomiting and severe abdominal pain)
Low plasma concentration and high
renal clearance (diabetic patients)
Impairment of endocrine functions
Hyperglycemia
Thiamine responsive megaloblastic
anemia
Poppy seeds
Red gram, whole
Soyabean, brown
Wheat, whole
Ragi
Jowar
Apricot, processed
Spinach
Broad beans
Mustard leaves
0.87 mg
0.74 mg
0.59mg
0.46 mg
0.37 mg
0.35 mg
0.25 mg
0.16 mg
0.12 mg
0.08 mg
Pyridoxine Immune dysfunction
Neurological symptoms (irritability,
depression, confusion)
Infl ammation of tongue
Sores or ulcers of mouth
Ulcers of skin at corners of mouth
Rohu, fi sh
Sunfl ower seeds
Drumsticks leaves
Walnut
Black gram, whole
Banana ripe
Lentil, whole, yellow
French beans, hybrid
Fenugreek leaves
Rice, raw, brown
240 mg
0.94 mg
0.87 mg
0.80 mg
0.53 mg
0.51 mg
0.47 mg
0.44 mg
0.38 mg
0.37 mg

155The CNNS Thematic Reports, Issue 1, 2019
Nutrients Consequences of defi ciency/excess Food items (Top 10) Nutritive Value
(per 100 g)
Naicin Pellagra (D's: Dermatitis, Diarrhoea,
Dementia, and Death, if left untreated)
Infl ammation of mouth and tongue
Vomiting
Constipation
Abdominal pain
Gastro-intestinal disorders
Neurological symptoms (headache,
apathy, fatigue, depression,
disorientation, memory loss)
Goat liver
Groundnut
Chicken, poultry, breast
Tuna fi sh
Brown rice
Wheat whole
Peas, dry
Dates, dry, pale brown
Potato, brown skin
Drumstick leaves
12.9 mg
11.4 mg
8.1 mg
5.0 mg
3.4 mg
2.7 mg
2.7 mg
1.5 mg
1.4 mg
1.8 mg
Vitamin E Neurologic symptoms (impaired
balance and coordination)
Injury to the sensory nerves
(peripheral neuropathy)
Muscle weakness (myopathy)
Damage to the retina of the eye
(retinopathy)
Saffl ower seeds
Almonds
Coconut dry
Egg, whole, raw
Catla fi sh
Bengal gram, whole
Spinach
Phalsa
Pumpkin, green
Mustard leaves
35.09 mg
25.86 mg
6.06 mg
2.97 mg
2.35 mg
1.72 mg
1.29 mg
0.93 mg
0.87 mg
0.57 mg
156 ADOLESCENTS, DIETS AND NUTRITION
Acknowledgements
Conceptualization, data analysis and writing
Dr. Vani Sethi UNICEF India Country Offi ce, New Delhi
Anwesha Lahiri Indian Institute of Technology Bombay
Arti Bhanot National Centre of Excellence and Advanced Research on Diets, Lady Irwin
College, New Delhi
Dr. Mansi Chopra National Centre of Excellence and Advanced Research on Diets, Lady Irwin
College, New Delhi
Abhishek Kumar Institute of Economic Growth, New Delhi
Data analysis support
Dr. Rahul Mishra Institute of Economic Growth, New Delhi
Review and advisory support
Arjan de Wagt UNICEF India Country Offi ce, New Delhi
Dr. Ruby Alambusha Institute of Economic Growth, New Delhi
Robert Johnston UNICEF India Country Offi ce, New Delhi
Dr. Praween K Agrawal UNICEF India Country Offi ce, New Delhi
Pavithra Rangan UNICEF India Country Offi ce
Additional technical information support (on Diets)
National Centre of Excellence and Advanced Research on Diets, Lady Irwin College, New Delhi
Tashi Choedon, Naman Kaur, Priyanshu Rastogi, Dr. Anjani Bakshi, Dr. Neha Bakshi and
Akanksha Srivastava
Design, layout and pre-press production
Fountainhead Solutions (Pvt) Limited, New Delhi, Design agency
Funding
Aditya and Megha Mittal

157The CNNS Thematic Reports, Issue 1, 2019
1 Offi ce of the Registrar General & Census Commissioner, Government of India. Population enumeration data (Final population). Single year age
data. 2011.
2 UNFPA. State of the World’s Population. The power of 1.8 billion. 2014.
3 Das JK, Salam RA, Thornburg KL, Prentice AM, Campisis S, Lassi ZS et al. Nutrition in adolescents: physiology, metabolism, and nutritional needs.
Ann. N.Y. Acad. Sci. 2017; 1393: 21-33.
4 National Institute of Nutrition, Indian Council of Medical Research. Dietary guidelines for Indians. 2011
5 Spear BA. Adolescent growth and development. J Am Diet Assoc. 2002; 102(3 Suppl): S23-9.
6 World health Organization, Global Observatory data. https://www.who.int/gho/ncd/risk_factors/physical_activity_text/en/
7 Satija A, Khandpur N, Satija S, Gaiha SM, Dorairaj P, Reddy SK et al. Physical activity among adolescents in India: A qualitative study of barriers
and enablers. 2018. doi.org/10.1177/1090198118778332
8 Lyngdoh M, Akoijam BS, Agui RKS, Singh S. Diet, physical activity, and screen time among school students in Manipur. Indian J Community Med.
2019;44:134-7
9 Balaji SM, Karthik RC, Durga R, Harinie S, Ezhilvanan M. Intensity of physical activity among school going adolescents in Chennai, South India. Int
J Community Med Public Health. 2018;5(5):2094-2098
10 WHO. de Onis M, Onyango AW, Borghi E, Siyam A, Nishida C, Siekmann J. Development of a WHO growth reference for school-aged children and
adolescents. Bulletin of the World Health Organisation. 2007; 85(9):660–67.
11 WHO 2011. Use of Glycated Haemoglobin (HbA1c) in the Diagnosis of Diabetes Mellitus. Abbreviated report of a WHO consultation. 2011.
12 Gooding HC, Ferranti SD. Cardiovascular risk assessment and cholesterol management in adolescents: getting to the heart of the matter. Curr
Opin Pediatr. 2010 Aug; 22(4): 398–404.
13 Anyaegbu E, Dharnidharka V. Hypertension in the teenager. Pediatr Clin North Am. 2014 Feb; 61(1): 131–151.
14 WHO 2010. Global recommendations on physical activity for health. https://www.who.int/dietphysicalactivity/publications/9789241599979/en/
15 Black RE, Victora CG, Walker SP, Bhutta ZA, Christian P, de Onis M, et al. Maternal and child undernutrition and overweight in low-income and
middle-income countries. Lancet. 2013;382:427–51.
16 Balarajan Y, Ramakrishnan U, Ozaltin E, et al. Anaemia in low-income and middle-income countries, Lance. 2011; 378: 2123–35.
17 World Health Organization. Nutritional anaemias (2017): tools for effective prevention and control. Geneva: World Health Organization.
18 WHO 2007. Conclusions and recommendations of the WHO consultation on prevention and control of iron defi ciency in infants and young
children in malaria-endemic areas. Food Nutr Bull 28: S621–S627.
19 Viteri FE, Gonzalez H. Adverse outcomes of poor micronutrient status in childhood and adolescence. Nutrition Reviews. 2002; 60: S77–S83.
https://doi.org/10.1301/00296640260130795
20 Public Health at a Glance- Adolescent Nutrition, The World Bank (2003)
http://web.worldbank.org/archive/website01213/WEB/0__CO-82.HTM#section2
21 WHO 2009. World Health Organization. Vitamin and Mineral Nutrition Information System (VMNIS):
Micronutrients database, 2009. http://www.who.int/vmnis/database/en/ accessed April 18, 2014.
22 Khadilkar AV. Vitamin D defi ciency in Indian adolescents. Indian Pediatrics. 2010. http://medind.nic.in/ibv/t10/i9/ibvt10i9p755.pdf
23 Kawade R. Zinc staus and its association with the health of adolescents: review of studies in India. Glob Health Action. 2012; 5: 7353.
24 https://www.spring-nutrition.org/sites/default/fi les/events/wifs_webinar_dr._dureja_23042016_f.pdf
25 Indian State-level Disease Burden Initiative Malnutrition Collaborators. The burden of child and maternal malnutrition and trends in its indicators
in the states of India: the Global Burden of Disease Study 1990–2017. Lancet Child Adolesc Health 2019. https://doi.org/10.1016/S2352-
4642(19)30295-0
26 https://anemiamuktbharat.info/dashboard/#/
27 https://www.fssai.gov.in/knowledge-hub.php?hubname=Book,Report,Manuals
References

158 ADOLESCENTS, DIETS AND NUTRITION